national minerals information center comparison of u.s ...have advanced, as substitute materials...
TRANSCRIPT
National Minerals Information Center
Comparison of U.S. Net Import Reliance for Nonfuel Mineral Commodities—A 60-Year Retrospective (1954–1984–2014)
The economic vitality and national security of the United States depend on the reliable supply of numerous nonfuel mineral commodities. Over the past six decades, many of these commodities have been sourced increasingly from outside the United States. The mix of commodities for which the United States is import dependent has changed as technologies have advanced, as substitute materials have been developed, and as world economies have changed. Although reliance on imports is only one of the many factors that determine supply risk, a clear, long-term trend has emerged from the data compiled and published by the U.S. Geological Survey, National Minerals Information Center (USGS–NMIC), and its predecessor organi-zations. Because the global distribution of mineral resources and reserves is not uniform, the United States has always been import reliant for some mineral commodities. Essentially, the type of commodities and the countries from which they are sourced determine risk related to import dependence. In light of projections that 2.5 billion to 3 billion people globally could move into the middle class by 2030 (Rohde, 2012), the demand for many types of mineral commodities is likely to continue to increase. Recent concerns regarding so-called “critical minerals” have been driven by market dislocations in the rare-earth-element supply chain in 2010 that resulted from a short-term policy decision by the Government of the People’s Republic of China to limit exports. That policy has since been changed as a result of actions by the World Trade Organization, but the events that followed, such as higher prices and intensive efforts to diversify sources of supply, illustrate the underlying issues of supply risk and the influence that disruptions can have on supply. These factors are often used in the classification of a mineral commodity as “critical” (National Research Council, 2008).
The USGS–NMIC collects, analyzes, and disseminates information on a monthly, quarterly, or annual basis for more than 90 nonfuel mineral commodities from more than 180 countries. These data indicate that from 1954 through 2014 there was (1) a clear increase in the number and type of nonfuel mineral commodities for which the United States was net import reliant, (2) an increase in the percentage of import reliance for individual nonfuel mineral commodities, and (3) a shift in the geographic distribution of the source countries.
Net Import RelianceNonfuel mineral commodities for which imports are
required to satisfy domestic demand are those for which the importing country is net import reliant. The USGS–NMIC calculates a net import reliance (NIR) for nonfuel mineral commodities using prior-year data and publishes this infor-mation annually in the USGS Mineral Commodity Summaries.
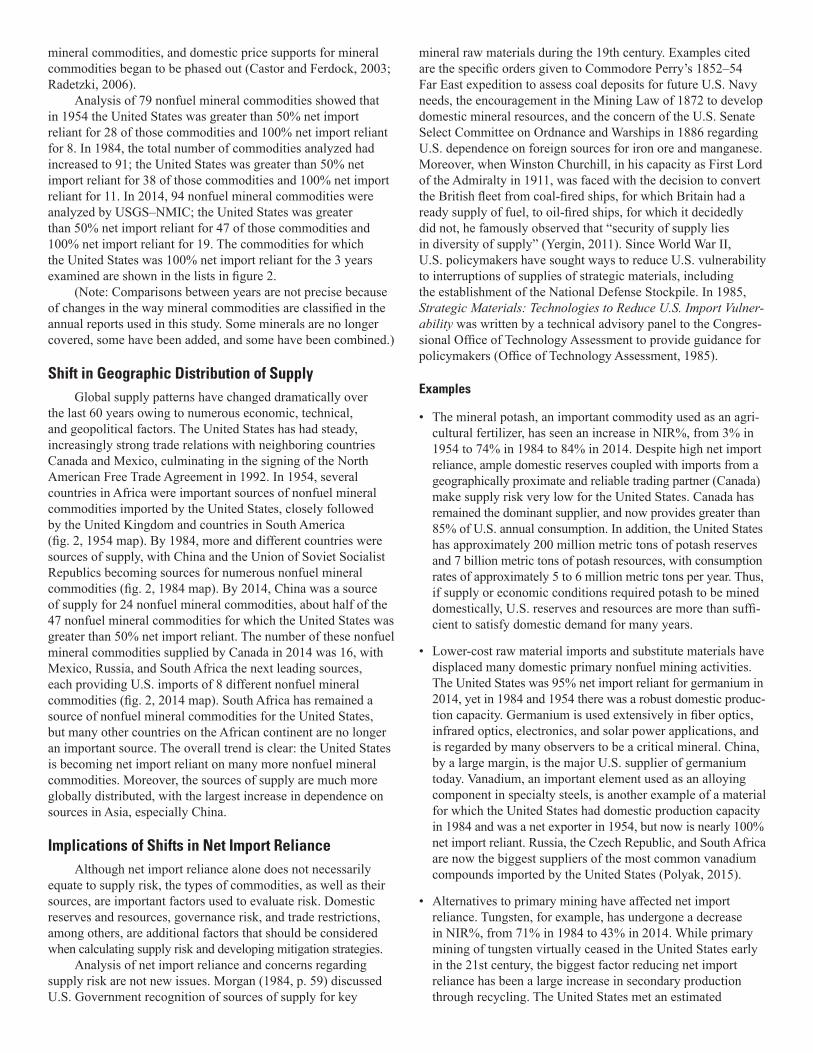
Figure 1. Number of nonfuel mineral commodities for which the United States was at least 25% net import reliant in 1954, 1984, and 2014. Sources: U.S. Bureau of Mines (1957, 1985); U.S. Geological Survey (2015).
Net import reliance is the amount of imported material (including changes in stocks) minus exports and is expressed as a percentage (%) of domestic consumption:
NIR% = imports – exports + adjustments in stocks
× 100
consumption
For example, a nonfuel mineral commodity that is not produced in the United States and for which the United States relies entirely on imports and (or) materials from stocks to satisfy domestic demand has an NIR% of 100.
Changes in Net Import RelianceOver the past six decades, there has been a clear increase
in the number of nonfuel mineral commodities for which the United States is net import reliant as well as an increase in the percentage of reliance (fig. 1). In particular, the number of nonfuel mineral commodities for which the United States was greater than 50% net import reliant increased from 28 in 1954 to 47 in 2014.
The 1950s was a decade of significant changes in the mining and mineral commodity industries. For example, during the early 1950s, concerns regarding the supply of strategic and critical minerals led to the establishment of multiple Federal programs (now terminated) such as the Defense Minerals Administration, Defense Minerals Exploration Administration, and Office of Minerals Exploration, which provided millions of dollars in Federal funds for mineral exploration (Bolm and others, 2000). In addition, following the Korean War, demand for many mineral commodities entered a period of growth, supply concerns triggered multiyear price increases for many nonfuel
0
5
10
15
20
25
30
Num
ber o
f non
fuel
min
eral
com
mod
ities
1954 1984 2014
Percentage of net import relianceEXPLANATION
25 to 50 >50 to <100 100
U.S. Department of the InteriorU.S. Geological Survey
Fact Sheet 2015 –3082December 2015
mineral commodities, and domestic price supports for mineral commodities began to be phased out (Castor and Ferdock, 2003; Radetzki, 2006).
Analysis of 79 nonfuel mineral commodities showed that in 1954 the United States was greater than 50% net import reliant for 28 of those commodities and 100% net import reliant for 8. In 1984, the total number of commodities analyzed had increased to 91; the United States was greater than 50% net import reliant for 38 of those commodities and 100% net import reliant for 11. In 2014, 94 nonfuel mineral commodities were analyzed by USGS–NMIC; the United States was greater than 50% net import reliant for 47 of those commodities and 100% net import reliant for 19. The commodities for which the United States was 100% net import reliant for the 3 years examined are shown in the lists in figure 2.
(Note: Comparisons between years are not precise because of changes in the way mineral commodities are classified in the annual reports used in this study. Some minerals are no longer covered, some have been added, and some have been combined.)
Shift in Geographic Distribution of SupplyGlobal supply patterns have changed dramatically over
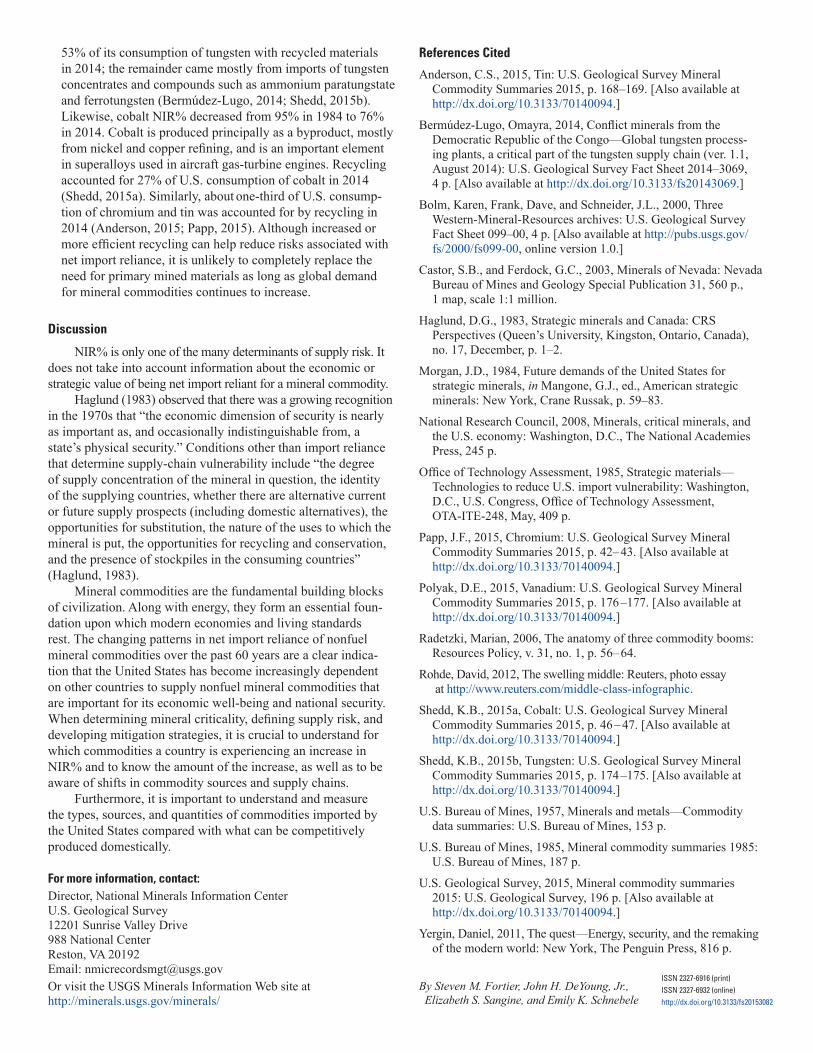
the last 60 years owing to numerous economic, technical, and geopolitical factors. The United States has had steady, increasingly strong trade relations with neighboring countries Canada and Mexico, culminating in the signing of the North American Free Trade Agreement in 1992. In 1954, several countries in Africa were important sources of nonfuel mineral commodities imported by the United States, closely followed by the United Kingdom and countries in South America (fig. 2, 1954 map). By 1984, more and different countries were sources of supply, with China and the Union of Soviet Socialist Republics becoming sources for numerous nonfuel mineral commodities (fig. 2, 1984 map). By 2014, China was a source of supply for 24 nonfuel mineral commodities, about half of the 47 nonfuel mineral commodities for which the United States was greater than 50% net import reliant. The number of these nonfuel mineral commodities supplied by Canada in 2014 was 16, with Mexico, Russia, and South Africa the next leading sources, each providing U.S. imports of 8 different nonfuel mineral commodities (fig. 2, 2014 map). South Africa has remained a source of nonfuel mineral commodities for the United States, but many other countries on the African continent are no longer an important source. The overall trend is clear: the United States is becoming net import reliant on many more nonfuel mineral commodities. Moreover, the sources of supply are much more globally distributed, with the largest increase in dependence on sources in Asia, especially China.
Implications of Shifts in Net Import RelianceAlthough net import reliance alone does not necessarily
equate to supply risk, the types of commodities, as well as their sources, are important factors used to evaluate risk. Domestic reserves and resources, governance risk, and trade restrictions, among others, are additional factors that should be considered when calculating supply risk and developing mitigation strategies.
Analysis of net import reliance and concerns regarding supply risk are not new issues. Morgan (1984, p. 59) discussed U.S. Government recognition of sources of supply for key
mineral raw materials during the 19th century. Examples cited are the specific orders given to Commodore Perry’s 1852–54 Far East expedition to assess coal deposits for future U.S. Navy needs, the encouragement in the Mining Law of 1872 to develop domestic mineral resources, and the concern of the U.S. Senate Select Committee on Ordnance and Warships in 1886 regarding U.S. dependence on foreign sources for iron ore and manganese. Moreover, when Winston Churchill, in his capacity as First Lord of the Admiralty in 1911, was faced with the decision to convert the British fleet from coal-fired ships, for which Britain had a ready supply of fuel, to oil-fired ships, for which it decidedly did not, he famously observed that “security of supply lies in diversity of supply” (Yergin, 2011). Since World War II, U.S. policymakers have sought ways to reduce U.S. vulnerability to interruptions of supplies of strategic materials, including the establishment of the National Defense Stockpile. In 1985, Strategic Materials: Technologies to Reduce U.S. Import Vulner-ability was written by a technical advisory panel to the Congres-sional Office of Technology Assessment to provide guidance for policymakers (Office of Technology Assessment, 1985).
Examples
• The mineral potash, an important commodity used as an agri-cultural fertilizer, has seen an increase in NIR%, from 3% in 1954 to 74% in 1984 to 84% in 2014. Despite high net import reliance, ample domestic reserves coupled with imports from a geographically proximate and reliable trading partner (Canada) make supply risk very low for the United States. Canada has remained the dominant supplier, and now provides greater than 85% of U.S. annual consumption. In addition, the United States has approximately 200 million metric tons of potash reserves and 7 billion metric tons of potash resources, with consumption rates of approximately 5 to 6 million metric tons per year. Thus, if supply or economic conditions required potash to be mined domestically, U.S. reserves and resources are more than suffi-cient to satisfy domestic demand for many years.
• Lower-cost raw material imports and substitute materials have displaced many domestic primary nonfuel mining activities. The United States was 95% net import reliant for germanium in 2014, yet in 1984 and 1954 there was a robust domestic produc-tion capacity. Germanium is used extensively in fiber optics, infrared optics, electronics, and solar power applications, and is regarded by many observers to be a critical mineral. China, by a large margin, is the major U.S. supplier of germanium today. Vanadium, an important element used as an alloying component in specialty steels, is another example of a material for which the United States had domestic production capacity in 1984 and was a net exporter in 1954, but now is nearly 100% net import reliant. Russia, the Czech Republic, and South Africa are now the biggest suppliers of the most common vanadium compounds imported by the United States (Polyak, 2015).
• Alternatives to primary mining have affected net import reliance. Tungsten, for example, has undergone a decrease in NIR%, from 71% in 1984 to 43% in 2014. While primary mining of tungsten virtually ceased in the United States early in the 21st century, the biggest factor reducing net import reliance has been a large increase in secondary production through recycling. The United States met an estimated

Nonfuel mineral commodities for which the United States was 100% net import reliant
1954Corundum (abrasives) Diamond, industrialGemstonesNiobium (Columbium)Nitrogen, natural compoundsQuartz crystal, industrialRadiumStrontium
1984CesiumCorundum (abrasives)Diamond, industrialGemstonesMica, sheetNiobium (Columbium)RubidiumStrontiumThalliumThoriumYttrium
2014ArsenicAsbestosBauxiteCesiumFluorsparGraphite, naturalIndiumIodineManganese Mica, sheetNiobium (Columbium)Quartz crystal, industrialRubidiumScandiumStrontiumTantalumThalliumThoriumVanadium
Import sources of nonfuel mineral commodities for which the United States was greater than 50% net import reliant
1954
EXPLANATIONNumber of commodities, 1954
01 to 34 to 67 to 12
UNITEDSTATES
MEXICO
CANADA UNITEDKINGDOM
SOUTHAFRICA
80°
80°
0°
60°
60°
20°
20°
40°
40°
180° 180°0°60° 60°120° 120°
1984
EXPLANATIONNumber of commodities, 1984
01 to 34 to 67 to 1213 to 18
UNITEDSTATES
MEXICO
CANADA UNITEDKINGDOM
UNION OF SOVIETSOCIALIST REPUBLICS
SOUTHAFRICA
CHINA
2014
EXPLANATIONNumber of commodities, 2014
01 to 34 to 67 to 1213 to 1819 to 24
UNITEDSTATES
UNITEDKINGDOMCZECH
REPUBLIC
RUSSIA
SOUTHAFRICA
MEXICO
CANADA
CHINA
Figure 2. Nonfuel mineral commodities for which the United States was 100% net import reliant (lists) and greater than 50% net import reliant (maps) in 1954, 1984, and 2014. Sources: U.S. Bureau of Mines (1957, 1985); U.S. Geological Survey (2015).
53% of its consumption of tungsten with recycled materials in 2014; the remainder came mostly from imports of tungsten concentrates and compounds such as ammonium paratungstate and ferrotungsten (Bermúdez-Lugo, 2014; Shedd, 2015b). Likewise, cobalt NIR% decreased from 95% in 1984 to 76% in 2014. Cobalt is produced principally as a byproduct, mostly from nickel and copper refining, and is an important element in superalloys used in aircraft gas-turbine engines. Recycling accounted for 27% of U.S. consumption of cobalt in 2014 (Shedd, 2015a). Similarly, about one-third of U.S. consump-tion of chromium and tin was accounted for by recycling in 2014 (Anderson, 2015; Papp, 2015). Although increased or more efficient recycling can help reduce risks associated with net import reliance, it is unlikely to completely replace the need for primary mined materials as long as global demand for mineral commodities continues to increase.
Discussion
NIR% is only one of the many determinants of supply risk. It does not take into account information about the economic or strategic value of being net import reliant for a mineral commodity.
Haglund (1983) observed that there was a growing recognition in the 1970s that “the economic dimension of security is nearly as important as, and occasionally indistinguishable from, a state’s physical security.” Conditions other than import reliance that determine supply-chain vulnerability include “the degree of supply concentration of the mineral in question, the identity of the supplying countries, whether there are alternative current or future supply prospects (including domestic alternatives), the opportunities for substitution, the nature of the uses to which the mineral is put, the opportunities for recycling and conser vation, and the presence of stockpiles in the consuming countries” (Haglund, 1983).
Mineral commodities are the fundamental building blocks of civilization. Along with energy, they form an essential foun-dation upon which modern economies and living standards rest. The changing patterns in net import reliance of nonfuel mineral commodities over the past 60 years are a clear indica-tion that the United States has become increasingly dependent on other countries to supply nonfuel mineral commodities that are important for its economic well-being and national security. When determining mineral criticality, defining supply risk, and developing mitigation strategies, it is crucial to understand for which commodities a country is experiencing an increase in NIR% and to know the amount of the increase, as well as to be aware of shifts in commodity sources and supply chains.
Furthermore, it is important to understand and measure the types, sources, and quantities of commodities imported by the United States compared with what can be competitively produced domestically.
References Cited
Anderson, C.S., 2015, Tin: U.S. Geological Survey Mineral Commodity Summaries 2015, p. 168–169. [Also available at http://dx.doi.org/10.3133/70140094.]
Bermúdez-Lugo, Omayra, 2014, Conflict minerals from the Democratic Republic of the Congo—Global tungsten process-ing plants, a critical part of the tungsten supply chain (ver. 1.1, August 2014): U.S. Geological Survey Fact Sheet 2014‒3069, 4 p. [Also available at http://dx.doi.org/10.3133/fs20143069.]
Bolm, Karen, Frank, Dave, and Schneider, J.L., 2000, Three Western-Mineral-Resources archives: U.S. Geological Survey Fact Sheet 099‒00, 4 p. [Also available at http://pubs.usgs.gov/fs/2000/fs099-00, online version 1.0.]
Castor, S.B., and Ferdock, G.C., 2003, Minerals of Nevada: Nevada Bureau of Mines and Geology Special Publication 31, 560 p., 1 map, scale 1:1 million.
Haglund, D.G., 1983, Strategic minerals and Canada: CRS Perspectives (Queen’s University, Kingston, Ontario, Canada), no. 17, December, p. 1–2.
Morgan, J.D., 1984, Future demands of the United States for strategic minerals, in Mangone, G.J., ed., American strategic minerals: New York, Crane Russak, p. 59–83.
National Research Council, 2008, Minerals, critical minerals, and the U.S. economy: Washington, D.C., The National Academies Press, 245 p.
Office of Technology Assessment, 1985, Strategic materials— Technologies to reduce U.S. import vulnerability: Washington, D.C., U.S. Congress, Office of Technology Assessment, OTA-ITE-248, May, 409 p.
Papp, J.F., 2015, Chromium: U.S. Geological Survey Mineral Commodity Summaries 2015, p. 42‒ 43. [Also available at http://dx.doi.org/10.3133/70140094.]
Polyak, D.E., 2015, Vanadium: U.S. Geological Survey Mineral Commodity Summaries 2015, p. 176 ‒177. [Also available at http://dx.doi.org/10.3133/70140094.]
Radetzki, Marian, 2006, The anatomy of three commodity booms: Resources Policy, v. 31, no. 1, p. 56‒ 64.
Rohde, David, 2012, The swelling middle: Reuters, photo essay at http://www.reuters.com/middle-class-infographic.
Shedd, K.B., 2015a, Cobalt: U.S. Geological Survey Mineral Commodity Summaries 2015, p. 46 ‒ 47. [Also available at http://dx.doi.org/10.3133/70140094.]
Shedd, K.B., 2015b, Tungsten: U.S. Geological Survey Mineral Commodity Summaries 2015, p. 174 ‒175. [Also available at http://dx.doi.org/10.3133/70140094.]
U.S. Bureau of Mines, 1957, Minerals and metals—Commodity data summaries: U.S. Bureau of Mines, 153 p.
U.S. Bureau of Mines, 1985, Mineral commodity summaries 1985: U.S. Bureau of Mines, 187 p.
U.S. Geological Survey, 2015, Mineral commodity summaries 2015: U.S. Geological Survey, 196 p. [Also available at http://dx.doi.org/10.3133/70140094.]
Yergin, Daniel, 2011, The quest—Energy, security, and the remaking of the modern world: New York, The Penguin Press, 816 p.
ISSN 2327-6916 (print)ISSN 2327-6932 (online)http://dx.doi.org/10.3133/fs20153082
By Steven M. Fortier, John H. DeYoung, Jr., Elizabeth S. Sangine, and Emily K. Schnebele
For more information, contact:Director, National Minerals Information CenterU.S. Geological Survey12201 Sunrise Valley Drive988 National CenterReston, VA 20192Email: [email protected] visit the USGS Minerals Information Web site athttp://minerals.usgs.gov/minerals/