national energy and cost savings for new single- and multifamily
TRANSCRIPT

National Energy and Cost Savings for New Single– and Multifamily Homes: A Comparison of the 2006, 2009, and 2012 Editions of the IECC
BUILDING TECHNOLOGIES PROGRAM
2 A COMPARISON OF THE 2006, 2009, AND 2012 EDITIONS OF THE IECC
National Energy and Cost Savings for New Single- and Multifamily Homes: A Comparison of the 2006, 2009, and 2012 Editions of the IECC
The 2009 and 2012 International Energy Conservation Codes (IECC) yield positive benefits for U.S. homeowners and significant energy savings for the nation.
Moving from a baseline of the 2006 IECC to the 2009 IECC reduces average
annual energy costs by 10.8%, while moving from the same baseline to the
2012 IECC reduces them by 32.1%.
1
22
2 33
4
4
55
66
7
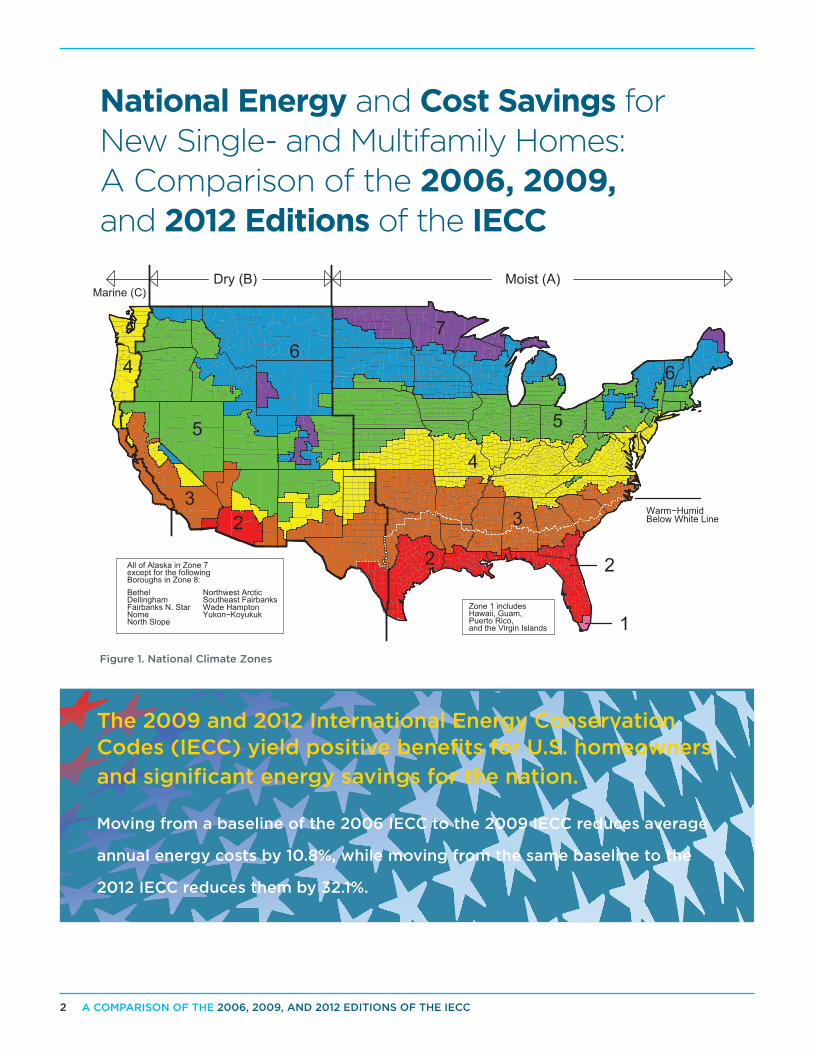
Marine (C)Dry (B) Moist (A)
All of Alaska in Zone 7except for the followingBoroughs in Zone 8:BethelDellinghamFairbanks N. StarNomeNorth Slope
Northwest ArcticSoutheast FairbanksWade HamptonYukon−Koyukuk
Zone 1 includesHawaii, Guam,Puerto Rico,and the Virgin Islands
Warm−HumidBelow White Line
Figure 1. National Climate Zones

3A COMPARISON OF THE 2006, 2009, AND 2012 EDITIONS OF THE IECC
HighlightsNational average energy savings against a 2006 IECC baseline:
• The 2009 IECC saves 10.8% of energy spent for heating, cooling, water heating, and lighting
• The 2012 IECC saves 32.1%
Long-term cost-effectiveness for consumers:
• Life-cycle cost savings over a 30-year period, averaged across all building types and configurations, are significant in all climate zones
• Average consumer savings range from $1,944 in Climate Zone 3, to $9,147 in Climate Zone 8 when comparing the 2009 IECC to the 2006 IECC
• Life-cycle cost savings for the 2012 IECC, as compared with the 2009 IECC average $2,280 in Climate Zone 2 and up to $23,900 in Climate Zone 8
• When comparing the 2012 and 2006 IECC, life-cycle costs savings average $4,763 in Climate Zone 2 and $33,105 in Climate Zone 8
Cost-EffectivenessThe U.S. Department of Energy (DOE) evaluates energy codes based on two measures of cost-effectiveness:
• Life-Cycle Cost: Full accounting over a 30-year period of the cost savings, considering energy savings, the initial investment financed through increased mortgage costs, tax impacts, and residual values of energy efficiency measures
• Cash Flow: Net annual cost outlay (i.e., difference between annual energy cost savings and increased annual costs for mortgage payments, etc.)
Life-cycle cost is the primary measure by which DOE assesses the cost-effectiveness of the IECC. These savings assume that initial costs are mortgaged, that homeowners take advantage of the mortgage interest deductions, and that long-lived efficiency measures retain a residual value after the 30-year analysis period. As shown in Table 1, life-cycle cost savings are substantial in all climate zones.
IECC Climate Zone
30-Year Life-Cycle Savings ($US)
IECC 2009 vs. 2006 IECC 2012 vs. 2009 IECC 2012 vs. 2006
1 $2,877 $5,347 $8,256
2 $2,443 $2,280 $4,763
3 $1,944 $3,613 $5,621
4 $2,259 $5,320 $7,625
5 $2,466 $6,717 $9,189
6 $3,094 $8,183 $11,307
7 $3,622 $9,502 $13,166
8 $9,147 $23,900 $33,105
Table 1. Life-Cycle Cost Savings Compared to the 2006 and 2009 IECC

4 A COMPARISON OF THE 2006, 2009, AND 2012 EDITIONS OF THE IECC
BUILDING TECHNOLOGIES PROGRAM
EERE Information Center1-877-EERE-INFO (1-877-337-3463)www.eere.energy.gov/informationcenter
April 2012 PNNL-21329For information on Building Energy Codes, visit www.energycodes.gov
For more information on how these estimates were developed, visit the DOE Building Energy Codes website: www.energycodes.gov/development/residential
The U.S. Department of Energy (DOE) provides estimates of energy and cost savings from code adoption:
• National: Energy cost savings (only)
• Climate Zone: Energy cost savings, life-cycle cost savings, and consumer cash flows
• State: Energy cost savings, life-cycle cost savings, consumer cash flows, and simple paybacks
Consumer SavingsAnnual consumer cash flows impact the affordability of energy-efficient homes. This analysis has calculated, by climate zone, the net annual cash outlay consumers will experience under the three codes. The net annual cash flow savings, computed as the sum of the energy cost savings and tax benefits minus the sum of incremental
IECC Climate Zone
IECC 2009 vs. 2006 IECC 2012 vs. 2009 IECC 2012 vs. 2006
Net Annual Cash Flow
Savings (Year 1)
Years to Cumulative
Positive Cash Flow
Net Annual Cash Flow
Savings (Year 1)
Years to Cumulative
Positive Cash Flow
Net Annual Cash Flow
Savings (Year 1)
Years to Cumulative
Positive Cash Flow
1 $137 2 $257 1 $393 1
2 $115 2 $102 2 $218 2
3 $91 2 $163 2 $253 2
4 $110 1 $249 1 $359 1
5 $116 1 $320 1 $436 1
6 $146 1 $378 1 $524 1
7 $176 1 $444 1 $620 1
8 $447 1 $1,142 1 $1,588 1
mortgage payments and property taxes, are positive in all cases. Even accounting for the incremental up-front costs of mortgage fees and down payment, consumers’ cumulative cash flows become positive within a year or two in all regions. Table 2 summarizes these results.
Table 2. Impacts to Consumers’ Cash Flow from Compliance with 2009 and 2012 IECC

A.1 April 2012
Technical Appendix A Methodology
An overview of the methodology used to calculate these impacts is provided below. Further information as to how these estimates were developed is available at the U.S. Department of Energy’s (DOE) Building Energy Codes website.1 Cost-Effectiveness Pacific Northwest National Laboratory (PNNL) calculated two cost-effectiveness metrics in comparing the 2006, 2009, and 2012 International Energy Conservation Codes (IECC). These are:
• Life-Cycle Cost (LCC): Full accounting over a 30-year period of the cost savings, considering energy savings, the initial investment financed through increased mortgage costs, tax impacts, and residual values of energy efficiency measures
• Cash Flow: Net annual cost outlay (i.e., difference between annual energy cost savings and increased annual costs for mortgage payments, etc.)
LCC is a robust cost-benefit metric that sums the costs and benefits of a code change over a specified time period. LCC is a well-known approach to assessing cost-effectiveness. DOE uses LCC for determining the cost-effectiveness of code change proposals, and for the code as a whole, because it is the most straightforward approach to achieving the desired balance of short- and long-term perspectives. The financial and economic parameters used for these calculations are as follows:
• New home mortgage parameters: o 5.0% mortgage interest rate (fixed rate) o Loan fees equal to 0.7% of the mortgage amount o 30-year loan term o 10% down payment
• Other rates and economic parameters: o 5% nominal discount rate (equal to mortgage rate) o 1.6% inflation rate o 25% marginal federal income tax and state-specific income tax o 0.9% property tax o Insulation has 60-year life with linear depreciation resulting in a 50% residual value at
the end of the 30-year period o Windows, duct sealing, and envelope sealing have a 30-year life and hence no residual
value at the end of the analysis period o Light bulbs have a 6-year life and are replaced four times during the 30-year analysis
period
1 www.energycodes.gov/development/residential

A.2 April 2012
Energy and Economic Analysis This analysis calculated the energy savings and economic impacts of the 2009 and 2012 IECC compared to the 2006 IECC, as well as the 2012 IECC compared to the 2009 IECC. Energy usage was modeled using the DOE’s EnergyPlus™ software for two residential building types:
1. Single-Family: A two-story home with a 30-ft by 40-ft rectangular shape, 2,400 ft2 of floor area excluding the basement, and windows that cover 15% of the wall area, equally distributed on all sides of the house
2. Multifamily: A three-story building with 18 units (6 units per floor), each having conditioned floor area of 1,200 ft2 and window area equal to approximately 10% of the conditioned floor area, equally distributed on all sides of the building
Each building type, single-family and apartment/condo in a multifamily building, has four unique foundation types:
1. Slab on grade 2. Heated basement 3. Unheated basement 4. Crawlspace
Each building type also has four unique heating system types:
1. Natural gas 2. Heat pump 3. Electric resistance 4. Oil
This results in 32 unique scenarios (2 x 4 x 4) for each of the IECC climate zones depending on construction practice (e.g., basement or slab) and heating system type prevalent in each zone. PNNL incorporated the prescriptive requirements of the 2006, 2009, and 2012 IECC when modeling the impacts of changes to the code. Whenever possible, PNNL uses DOE’s EnergyPlus model software to simulate changes to code requirements. However, in some cases, alternative methods are employed to estimate the effects of a given change. As an example, in order to give full consideration of the impacts of the 2012 IECC requirement for insulating hot water pipes (or shortening the pipe lengths), a separate estimate was developed for hot water pipe insulation requirements in the 2012 IECC, which results in a 10% savings in water heating energy use (Klein 2012). Energy and economic impacts were determined separately for each unique scenario, including the single-family and multifamily building, the four unique foundation types, and the four unique heating system types. The cost-effectiveness results were aggregated to a single average for each climate zone. In addition, energy savings results were aggregated to a national average. In computing these averages, results were first combined across foundation types and heating system types for single-family and multifamily prototypes, based on weights derived from Table A.1, Table A.2, and Table A.3 (single-family and multifamily have the same foundation shares). For example, the primary heating system type in new residential units in the East North Central division is a natural gas furnace. Therefore, the combined average energy usage calculations were proportionally weighted to account for the predominance of natural gas heating. Then single-family and multifamily results were combined to determine climate zone and national averages weighted by building permits from 2010 U.S. Census data shown in

A.3 April 2012
Table A.4. The building permits are available from every county in the United States, which allows the new construction in the county based climate zones shown in Table A.4 to be determined.
Table A.1. Heating Equipment Shares – Single-Family (percent)
Census Division Electric Heat Pump Gas Heating Electric Furnace Oil Heating New England 10.8 57.0 1.1 31.1
Middle Atlantic 24.5 69.2 1.7 4.6 East North Central 22.5 76.2 0.7 0.5 West North Central 39.6 56.7 3.4 0.2
South Atlantic 78.9 19.0 2.0 0.1 East South Central 68.9 28.9 2.1 0.0 West South Central 37.5 48.1 14.5 0.0
Mountain 19.4 77.8 2.6 0.2 Pacific 34.0 62.9 2.9 0.2
Table A.2. Heating Equipment Shares – Multifamily (percent)
Census Division Electric Heat Pump Gas Heating Electric Furnace Oil Heating New England 3.0 66.0 0.7 30.4
Middle Atlantic 39.5 49.6 4.9 6.1 East North Central 3.3 96.5 0.1 0.1 West North Central 24.8 68.0 4.3 3.0
South Atlantic 74.9 24.2 1.1 0.0 East South Central 94.1 1.8 4.1 0.0 West South Central 14.6 21.4 64.1 0.0
Mountain 2.8 97.2 0.0 0.0 Pacific 14.9 84.2 0.8 0.2

A.4 April 2012
Table A.3. Foundation Type Shares (percent)
State Slab on Grade Heated Basement
Unheated Basement Crawlspace
Connecticut, Rhode Island, Vermont, New Hampshire, Maine 16.8 23.8 45.5 13.9
Massachusetts 15.8 21.2 51.9 11.2 New York 20.4 25.9 41.7 12.0
New Jersey 26.9 18.3 30.6 24.2 Pennsylvania 28.9 24.6 32.8 13.7
Illinois 22.5 39.4 14.1 24.1 Ohio and Indiana 27.5 29.9 21.2 21.4
Michigan 15.7 36.2 27.3 20.8 Wisconsin 14.9 45.0 29.7 10.4
Minnesota, Iowa, North Dakota, South Dakota 22.1 46.9 15.5 15.5 Kansas and Nebraska 29.8 32.7 14.9 22.5
Missouri 24.8 36.4 20.8 17.9 Virginia 33.2 24.2 9.8 32.8
Maryland, Delaware, and West Virginia 28.0 30.7 18.3 23.0 Georgia 57.1 6.6 9.7 26.7
North Carolina and South Carolina 38.7 2.3 4.1 54.9 Florida 87.7 0.0 0.4 11.8
Alabama, Mississippi, Kentucky 44.1 8.6 10.6 36.7 Tennessee 35.3 7.2 9.0 48.4
Arkansas, Louisiana, and Oklahoma 66.9 0.6 2.9 29.7 Texas 79.6 0.3 0.4 19.8
Colorado 30.7 28.2 9.9 31.2 Utah, Wyoming, Montana, Idaho 26.7 36.6 11.0 25.6
Arizona 90.7 0.6 3.1 5.6 Nevada and New Mexico 86.1 2.5 0.8 10.7
California 59.0 1.2 4.9 34.9 Washington, Oregon, Alaska, Hawaii 37.0 8.9 3.1 51.0
Table A.4. Construction by Building Type and Climate Zone
Climate Zone Building Permits
Percent of National Total Single-Family Multifamily Total
1 4,248 2,195 6,443 1.2 2 96,420 13,715 110,135 20.5
3 – south of warm-humid line 30,769 5,830 36,599 6.8 3 – north of warm-humid line 83,269 20,276 103,545 19.3
4 100,716 24,048 124,764 23.2 5 93,068 18,842 111,910 20.8 6 30,065 6,872 36,937 6.9 7 5,479 1,280 6,759 1.3 8 65 0 65 0.0

A.5 April 2012
Differences Between the 2006 IECC, the 2009 IECC, and the 2012 IECC All versions of the IECC have requirements that apply uniformly to all climate zones, and other requirements that vary by climate zone. Highlights of the mandatory requirements across all buildings include:
• Building envelope must be caulked and sealed. The 2012 IECC adds a requirement that the building must be tested and a level of leakage that is no more than a maximum limit must be achieved.
• Ducts and air handlers must be sealed. Testing against specified maximum leakage rates is required in the 2009 and 2012 IECC if any ducts pass outside the conditioned space (e.g., in attics, unheated basements). The 2012 IECC leakage requirements are more energy efficient.
• Supply and return ducts in attics and all ducts in crawlspaces, unheated basements, garages, or otherwise outside the building envelope must be insulated.
• For the 2009 and 2012 IECC, a minimum percentage of the lighting bulbs or fixtures in the dwelling must be high-efficacy lighting.
• A certificate listing insulation levels and other energy efficiency measures must be posted on or near the electric service panel.
A comparison of significant IECC requirements that do not vary by climate zone is contained in Table A.5. Of these, the most significant changes in the 2009 and 2012 IECC compared to the 2006 IECC are the requirements for pressure testing of the building envelope and ducts/air handlers, and for insulating service hot water pipes (2012 IECC only). The requirement for high-efficacy lamps, while significant, is somewhat abated by a superseding federal regulation banning the manufacture or import of less efficient lamps at common watt levels that takes effect in 2012 to 2014. Requirements such as insulation levels and fenestration (window, door, and skylight) U-factors vary by the eight climate zones in the United States. Table A.6 shows these requirements.

A.6 April 2012
Table A.5. Comparison of Major Requirements That Do Not Vary by Climate Zone
Requirement 2006 IECC 2009 IECC 2012 IECC
Building envelope sealing
Caulked and sealed verified
by visual inspection
Caulked and sealed verified by visual
inspection against a more detailed checklist
Caulked and sealed verified by visual inspection and a pressure test against a leakage requirement
Ducts and air handlers Sealed verified
by visual inspection
Sealed, verified by visual inspection, and pressure tested or all ducts must
be inside building envelope
Sealed, verified by visual inspection, and pressure tested against a leakage
requirement or all ducts must be inside building envelope
Supply ducts in attics R-8 R-8 R-8 Return ducts in attics and all ducts in crawlspaces, unheated basements, garages, or otherwise outside the
building envelope
R-8 R-6 R-6
Insulation on hot water pipes for service water heating systems None None
R-3 except where pipe run length is below a diameter-
dependent threshold Insulation on hot water pipes for hydronic (boiler) space heating
systems R-3 R-3 R-3
High-efficacy lamps (percent of lighting in the home) None 50% of lamps 75% of lamps or 75% of
fixtures Certificate of insulation levels and other energy efficiency measures Yes Yes Yes
While exemptions or allowances in the code are not included in this analysis, the code does allow for some of these depending on the compliance path. Examples include the following:
• One door and 15 ft2 of window area are exempt • Skylight U-factors are allowed to be higher than window U-factors • Five hundred square feet or 20% of ceiling area of a cathedral ceiling, whichever is less, is
allowed to have R-30 insulation in climate zones where more than R-30 is required for other ceilings
Incremental First Costs Table A.7 shows the national average costs of implementing the prescriptive measures of the new codes. Costs are provided for both the reference home and apartment/condo, and for the cost of moving from the 2006 to the 2009 IECC, as well as from the 2006 IECC and 2009 IECC to the 2012 IECC. The costs derive from estimates assembled by Faithful + Gould (2012) and a number of other sources.2
2 The Faithful + Gould cost data and other cost data for energy efficiency measures are available on the “BC3” website at http://bc3.pnnl.gov/.

A.7 April 2012
Table A.6. Comparison of Major Requirements That Vary by Climate Zone
Components
Climate Zone IECC Ceiling
(R-value) Skylight
(U-factor)
Fenestration (Windows and Doors) Wood
Frame Wall
(R-value)
Mass Wall*
(R-value)
Floor (R-value)
Basement Wall**
(R-value)
Tested Max Air Leakage
Rate (air changes
per hour)
Slab*** (R-value
and depth)
Crawl Space** (R-value) U-factor SHGC
1 2006
30 0.75 NR 0.4
13 3/4 13 NR NR
NR NR 2009 0.3 NR 2012 0.25 5
2 2006 30 0.75 0.75 0.4
13 4/6 13 NR NR
NR NR 2009 30 0.75 0.65 0.3 NR 2012 38 0.65 0.4 0.25 5
3 2006 30 0.65 0.65 0.4 13 5/8
19 0 NR
NR 5/13 2009 30 0.65 0.5 0.3 13 5/8 5/13**** NR 2012 38 0.55 0.35 0.25 20 8/13 5/13**** 3
4 2006 38 0.6 0.4 NR 13 5/13
19 10/13 NR
10, 2 ft 10/13
2009 38 0.6 0.35 13 5/10 10/13 NR 10/13 2012 49 0.55 0.35 0.4 20 8/13 10/13 3 10/13
5 2006 38 0.6 0.35
NR 19 13/19
30 10/13 NR
10, 2 ft 10/13
2009 38 0.6 0.35 20 13/17 10/13 NR 10/13 2012 49 0.55 0.32 20 15/19 15/19 3 15/19
6 2006
49 0.6 0.35
NR 19 10/13
30 10/13 NR
10, 4 ft 10/13
2009 0.6 0.35 20 15/19 15/19 NR 10/13 2012 0.55 0.32 20+5 15/19 15/19 3 15/19
7 and 8 2006
49 0.6 0.35
NR 21
19/21 30 10/13 NR
10, 4 ft 10/13
2009 0.6 0.35 21 38 15/19 NR 10/13 2012 0.55 0.32 20+5 38 15/19 3 15/19
* The second number applies when more than half the insulation is on the interior side of the high mass material in the wall. ** The first number is for continuous insulation (e.g., a board or blanket directly on the foundation wall) and the second number is for cavity insulation
(i.e., if there is a furred-out wall built against the foundation wall). Only one of these two has to be met. *** The first number is R-value. The second value refers to the vertical depth of the insulation around the perimeter. **** Basement wall insulation is not required in the warm-humid region of Zone 3 in the southeastern United States. NR = not required SHGC = solar heat gain coefficient

A.8 April 2012
Table A.7. Total Construction Cost Increase for the 2009 and 2012 IECC Compared to the 2006 IECC and 2009 IECC
2,400 ft2 House 1,200 ft2 Apartment/Condo Unheated
Basement or Crawlspace
Heated Basement Slab
Unheated Basement or Crawlspace
Heated Basement Slab
2006 to 2009 IECC Zone 1 $1,514 $1,514 $1,514 $660 $660 $660 Zone 2 $1,514 $1,514 $1,514 $660 $660 $660
Zone 3 – south of warm-humid line $1,514 $1,514 $1,514 $660 $660 $660
Zone 3 – north of warm-humid line $1,514 $2,014 $1,514 $660 $733 $660
Zone 4 $629 $629 $629 $367 $367 $367 Zone 5 $939 $939 $939 $482 $482 $482 Zone 6 $939 $1,194 $939 $482 $519 $482 Zone 7 $813 $780 $525 $429 $370 $333 Zone 8 $813 $780 $525 $429 $370 $333
2009 to 2012 IECC Zone 1 $1,659 $1,659 $1,659 $867 $867 $867 Zone 2 $1,995 $1,995 $1,995 $979 $979 $979
Zone 3 – south of warm-humid line $2,528 $2,528 $2,528 $1,170 $1,170 $1,170
Zone 3 – north of warm-humid line $2,528 $2,528 $2,528 $1,170 $1,170 $1,170
Zone 4 $2,035 $2,035 $2,035 $1,007 $1,007 $1,007 Zone 5 $1,566 $1,821 $1,566 $837 $874 $837 Zone 6 $2,797 $2,797 $2,797 $1,287 $1,287 $1,287 Zone 7 $2,797 $2,797 $2,797 $1,287 $1,287 $1,287 Zone 8 $2,797 $2,797 $2,797 $1,287 $1,287 $1,287
2006 to 2012 IECC Zone 1 $3,173 $3,173 $3,173 $1,527 $1,527 $1,527 Zone 2 $3,509 $3,509 $3,509 $1,639 $1,639 $1,639
Zone 3 – south of warm-humid line $4,042 $4,042 $4,042 $1,830 $1,830 $1,830
Zone 3 – north of warm-humid line $4,042 $4,542 $4,042 $1,830 $1,903 $1,830
Zone 4 $2,664 $2,664 $2,664 $1,374 $1,374 $1,374 Zone 5 $2,505 $2,760 $2,505 $1,319 $1,356 $1,319 Zone 6 $3,736 $3,991 $3,736 $1,769 $1,806 $1,769 Zone 7 $3,610 $3,577 $3,322 $1,716 $1,657 $1,620 Zone 8 $3,610 $3,577 $3,322 $1,716 $1,657 $1,620

A.9 April 2012
Results Life-Cycle Cost Table A.8 shows the life-cycle cost savings (discounted present value) of the new codes over the 30-year analysis period. These savings assume that initial costs are mortgaged, that homeowners take advantage of the mortgage interest tax deductions, and that efficiency measures retain a residual value at the end of the 30 years. Table A.8. Life-Cycle Cost Savings Compared to the 2006 and 2009 IECC
IECC Climate Zone 30-Year Life-Cycle Savings IECC 2009 vs. 2006 IECC 2012 vs. 2009 IECC 2012 vs. 2006
1 $2,877 $5,347 $8,256 2 $2,443 $2,280 $4,763 3 $1,944 $3,613 $5,621 4 $2,259 $5,320 $7,625 5 $2,466 $6,717 $9,189 6 $3,094 $8,183 $11,307 7 $3,622 $9,502 $13,166 8 $9,147 $23,900 $33,105
Cash Flow Because most houses are financed, consumers will be very interested in the financial impacts of buying a home that complies with the 2009 or 2012 IECC requirements compared to the 2006 or 2009 IECC. Mortgages spread the payment for the cost of a house over a long period of time (the simple payback fails to account for the impacts of mortgages). In this analysis, a 30-year fixed-rate mortgage was assumed. It was also assumed that homebuyers will deduct the interest portion of the payments from their income taxes. Table A.9, Table A.10, and Table A.11 show the impacts to consumers’ cash flow resulting from the improvements in the 2009 and 2012 IECC. Up-front costs include the down payment and loan fees. The annual values shown in the table are for the first year. The savings from income tax deductions for the mortgage interest will slowly decrease over time while energy savings are expected to increase over time because of escalating energy prices. These tables also include increases in annual property taxes because of the higher assessed house values. The net annual cash flow includes energy costs, mortgage payments, mortgage tax deductions, and property taxes but not the up-front costs. The time to positive cash flow includes all costs and benefits, including the down payment and other up-front costs. As shown in Table A.9, there is a net positive cash flow to consumers across all eight climate zones ranging from an average of $91 in Climate Zone 3 to $447 in Climate Zone 8 beginning in year one for the 2009 IECC. Positive cumulative savings, including payment of up-front costs, are achieved in 1 or 2 years. The positive cash flow is more significant with the 2012 IECC ranging from an average of $102 to $1,142 for the 2009 to 2012 IECC improvement, with again only 1 or 2 years to positive cumulative savings after covering up-front costs (see Table A.10). Table A.11 shows the combined impacts of moving from the 2006 all the way to the 2012 IECC.

A.10 April 2012
Table A.9. Impacts to Consumers’ Cash Flow from Compliance with 2009 IECC Compared to the 2006 IECC
Cost/Benefit Zone 1 Zone 2 Zone 3 Zone 4 Zone 5 Zone 6 Zone 7 Zone 8
A Down payment and other up-front costs $140 $130 $134 $59 $93 $98 $72 $101
B Annual energy savings (year one) $213 $186 $164 $143 $166 $199 $215 $502 C Annual mortgage increase $76 $70 $73 $32 $50 $53 $39 $54
D
Net annual cost of mortgage interest deductions, mortgage insurance, and property taxes
(year one)
$0 -$1 $0 -$1 $0 $0 $0 -$1
E =
[B-(C+D)]
Net annual cash flow savings (year one) $137 $115 $91 $110 $116 $146 $176 $447
F =
[A/E]
Years to positive savings including up-front cost impacts 2 2 2 1 1 1 1 1
Table A.10. Impacts to Consumers’ Cash Flow from Compliance with 2012 IECC Compared to the 2009 IECC
Cost/Benefit Zone 1 Zone 2 Zone 3 Zone 4 Zone 5 Zone 6 Zone 7 Zone 8
A Down payment and other up-front costs $159 $172 $224 $187 $162 $264 $272 $400
B Annual energy savings (year one) $344 $197 $285 $351 $409 $523 $592 $1,360 C Annual mortgage increase $86 $93 $121 $102 $88 $143 $147 $217
D
Net annual cost of mortgage interest deductions, mortgage insurance, and property taxes
(year one)
-$1 -$2 -$1 $0 -$1 -$2 -$1 -$1
E =
[B-(C+D)]
Net annual cash flow savings (year one) $257 $102 $163 $249 $320 $378 $444 $1,142
F =
[A/E]
Years to positive savings, including up-front cost impacts 1 2 2 1 1 1 1 1

A.11 April 2012
Table A.11. Impacts to Consumers’ Cash Flow from Compliance with 2012 IECC Compared to the 2006 IECC
Cost/Benefit Zone 1 Zone 2 Zone 3 Zone 4 Zone 5 Zone 6 Zone 7 Zone 8
A Down payment and other up-front costs $299 $302 $359 $246 $255 $362 $344 $500
B Annual energy savings (year one) $557 $383 $449 $494 $575 $722 $807 $1,862 C Annual mortgage increase $162 $164 $194 $134 $138 $196 $186 $271
D
Net annual cost of mortgage interest deductions, mortgage
insurance, and property taxes (year one)
-$2 -$1 -$2 -$1 -$1 -$2 -$1 -$3
E =
[B-(C+D)]
Net annual cash flow savings (year one) $393 $218 $253 $359 $436 $524 $620 $1,588
F =
[A/E]
Years to positive savings, including up-front cost impacts 1 2 2 1 1 1 1 1
Energy Cost Savings All fuel prices were obtained from the DOE Energy Information Administration and are recent residential prices specific to each state (DOE 2012a, 2012b, 2012c). Energy prices are assumed to escalate at the rates published in DOE’s Annual Energy Outlook (DOE 2012d). Table A.12 shows the estimated annual energy costs, including heating, cooling, water heating, and lighting per home that result from meeting the requirements in the 2006, 2009, and 2012 IECC. Table A.13 shows the total energy cost savings as both a net dollar savings and as a percentage of the total energy use3. Results are averaged across home type (single- and multifamily), foundation type, and heating system types.
3 The percent savings is the annual energy cost savings for heating, cooling, water heating, and lighting divided by the total baseline annual energy cost for heating, cooling, water heating, and lighting.

A.12 April 2012
Table A.12. Annual Energy Costs for Different Versions of IECC
2006 IECC 2009 IECC 2012 IECC
Zone Heating Cooling Water Heating Lighting Total Heating Cooling Water
Heating Lighting Total Heating Cooling Water Heating Lighting Total
1 $24 $1,504 $380 $314 $2,222 $21 $1,345 $380 $263 $2,009 $11 $1,087 $342 $225 $1,665 2 $252 $758 $237 $209 $1,456 $228 $630 $237 $175 $1,270 $155 $557 $213 $148 $1,073 3 $427 $432 $259 $206 $1,324 $369 $360 $259 $172 $1,160 $184 $309 $233 $149 $875 4 $710 $311 $298 $192 $1,511 $611 $299 $298 $160 $1,368 $350 $262 $268 $137 $1,017 5 $997 $259 $274 $216 $1,746 $878 $247 $274 $181 $1,580 $535 $235 $247 $154 $1,171 6 $1,289 $197 $293 $215 $1,994 $1,134 $188 $293 $180 $1,795 $674 $181 $264 $153 $1,272 7 $1,546 $106 $300 $196 $2,148 $1,366 $103 $300 $164 $1,933 $827 $104 $269 $141 $1,341 8 $3,911 $115 $500 $340 $4,866 $3,467 $112 $500 $285 $4,364 $2,187 $122 $449 $246 $3,004

A.13 April 2012
As can be seen from Table A.13, energy cost savings per year average from $143 in Zone 4 to $502 in Zone 8 for the 2009 IECC compared to the 2006 IECC. Annual energy cost savings rise significantly with the 2012 IECC compared to the 2009 IECC, ranging from an average $197 per year for Zone 2, up to $1,360 per year in Zone 3. On a percentage basis, energy cost savings range from about 25% to 38% with the 2012 IECC compared to the 2006 IECC depending on climate zone. Table A.13. Total Energy Cost Savings
Climate Zone 2009 IECC vs. 2006 IECC 2012 IECC vs. 2009 IECC 2012 IECC vs. 2006 IECC
Savings ($/yr) Percent Savings Savings ($/yr) Percent Savings Savings ($/yr) Percent Savings
1 $213 9.6 $344 17.1 $557 25.1 2 $186 12.8 $197 15.5 $383 26.3 3 $164 12.4 $285 24.6 $449 33.9 4 $143 9.5 $351 25.7 $494 32.7 5 $166 9.5 $409 25.9 $575 32.9 6 $199 10.0 $523 29.1 $722 36.2 7 $215 10.0 $592 30.6 $807 37.6 8 $502 10.3 $1,360 31.2 $1,862 38.3
References Faithful + Gould. 2012. Residential Energy Efficiency Measures – Prototype Estimate and Cost Data. Portland, Oregon. http://bc3.pnnl.gov/wiki/index.php/Downloads
Faithful + Gould. 2011. Residential Energy Efficiency Measures – Locations Factors. Portland, Oregon. http://bc3.pnnl.gov/wiki/index.php/Downloads
Klein, G. 2012. Cost Estimation for Materials and Installation of Hot Water Piping Insulation. Affiliated International Management, LLC, Newport Beach, California.
U.S. Department of Energy (DOE). 2012a. Electric Power Monthly. DOE/EIA-0226. Washington, D.C. http://www.eia.doe.gov/cneaf/electricity/epm/table5_6_a.html
U.S. Department of Energy (DOE). 2012b. Natural Gas Monthly. DOE/EIA-0130. Washington, D.C. http://www.eia.gov/oil_gas/natural_gas/data_publications/natural_gas_monthly/ngm.html
U.S. Department of Energy (DOE). 2012c. Petroleum Marketing Monthly. DOE/EIA-0380. Washington, D.C. http://www.eia.gov/petroleum/marketing/monthly/
U.S. Department of Energy (DOE). 2012d. Annual Energy Outlook. DOE/EIA-0383. Washington, D.C.