national economic indicators ray owens may 14, 2015
TRANSCRIPT

National Economic Indicators
Ray OwensMay 14, 2015

-9
-8
-7
-6
-5
-4
-3
-2
-1
0
1
2
3
4
5
6
-9
-8
-7
-6
-5
-4
-3
-2
-1
0
1
2
3
4
5
6
2007 2008 2009 2010 2011 2012 2013 2014 2015 2016 2017 2018
2
Q10.2%
Real Gross Domestic Product
Source: Bureau of Economic Analysis via Haver Analytics & Federal Reserve Board
Percent change from previous quarter at annual rate
FOMC Projection
Note: Projection is the central tendency and range from the March 2015 Summary of Economic Projections. Projections of change in real gross domestic product (GDP) are from the fourth quarter of the previous year to the fourth quarter of the year indicated.
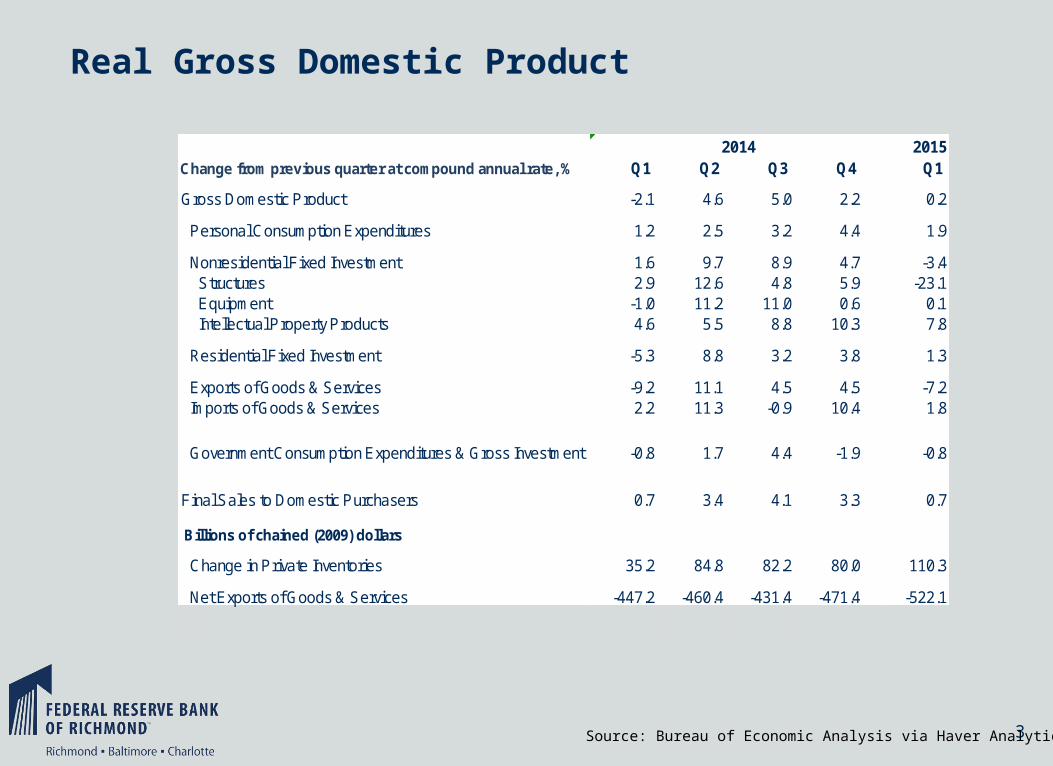
2015Change from previous quarter at compound annual rate, % Q1 Q2 Q3 Q4 Q1
Gross Domestic Product -2.1 4.6 5.0 2.2 0.2
Personal Consumption Expenditures 1.2 2.5 3.2 4.4 1.9
Nonresidential Fixed Investment 1.6 9.7 8.9 4.7 -3.4Structures 2.9 12.6 4.8 5.9 -23.1Equipment -1.0 11.2 11.0 0.6 0.1Intellectual Property Products 4.6 5.5 8.8 10.3 7.8
Residential Fixed Investment -5.3 8.8 3.2 3.8 1.3
Exports of Goods & Services -9.2 11.1 4.5 4.5 -7.2Imports of Goods & Services 2.2 11.3 -0.9 10.4 1.8
Final Sales to Domestic Purchasers 0.7 3.4 4.1 3.3 0.7
Billions of chained (2009) dollars
Change in Private Inventories 35.2 84.8 82.2 80.0 110.3
Net Exports of Goods & Services -447.2 -460.4 -431.4 -471.4 -522.1
2014
-0.8Government Consumption Expenditures & Gross Investment -0.8 1.7 4.4 -1.9
3
Real Gross Domestic Product
Source: Bureau of Economic Analysis via Haver Analytics

-800
-700
-600
-500
-400
-300
-200
-100
0
100
200
300
400
-800
-700
-600
-500
-400
-300
-200
-100
0
100
200
300
400
2007 2008 2009 2010 2011 2012 2013 2014 2015 2016
4
Quarterly average of monthly changes, thousands of persons
Nonfarm Payroll Employment
Apr. 223Mar. 85Feb. 266Jan. 201Dec. 329
Monthly Change
Source: Bureau of Labor Statistics via Haver Analytics
April

5
128
130
132
134
136
138
140
142
128
130
132
134
136
138
140
142
2007 2008 2009 2010 2011 2012 2013 2014 2015 2016
Millions of Persons
April141.4 mil.
Nonfarm Payroll Employment
Source: Bureau of Labor Statistics via Haver Analytics

6
4
4.5
5
5.5
6
6.5
7
7.5
8
8.5
9
9.5
10
10.5
11
4
4.5
5
5.5
6
6.5
7
7.5
8
8.5
9
9.5
10
10.5
11
2007 2008 2009 2010 2011 2012 2013 2014 2015 2016 2017 2018 2019
Percent
April5.4%
Unemployment Rate
Source: Bureau of Labor Statistics & Board of Governors via Haver Analytics
Notes: FOMC projection is the range and central tendency for the Q4 levels, from the March 2015 meeting.
FOMC Projection

3
5
7
9
11
13
15
17
19
3
5
7
9
11
13
15
17
19
1994 1996 1998 2000 2002 2004 2006 2008 2010 2012 2014 2016
7
Percent
April
Measures of Labor Utilization
Source: Bureau of Labor Statistics via Haver Analytics
U6: U5 + Involuntarily Part-Time
U5: U3 + Discouraged + Marginally Attached
U3: Official Unemployment Rate

57
58
59
60
61
62
63
64
65
66
67
68
57
58
59
60
61
62
63
64
65
66
67
68
1948 1952 1956 1960 1964 1968 1972 1976 1980 1984 1988 1992 1996 2000 2004 2008 2012 2016
8
Percent of Population
April
Labor Force Participation
Source: Bureau of Labor Statistics via Haver Analytics

1
1.5
2
2.5
3
3.5
4
4.5
1
1.5
2
2.5
3
3.5
4
4.5
2000 2001 2002 2003 2004 2005 2006 2007 2008 2009 2010 2011 2012 2013 2014 2015 2016
9
Percent
February
Labor Market Flows
Note: *Percent of total employment. **Percent of total employment plus job openings. Source: JOLTS via Haver Analytics
Hires Rate*
Job Openings Rate**
Quits Rate*

450
500
550
600
650
700
450
500
550
600
650
700
1990 1992 1994 1996 1998 2000 2002 2004 2006 2008 2010 2012 2014 2016
10
Q4.
Household Net WorthPercent of disposable personal income
Source: Z.1 Financial Accounts of the United States via Haver Analytics
-4
-3
-2
-1
0
1
2
3
4
5
6
-4
-3
-2
-1
0
1
2
3
4
5
6
2007 2008 2009 2010 2011 2012 2013 2014 2015 2016
11
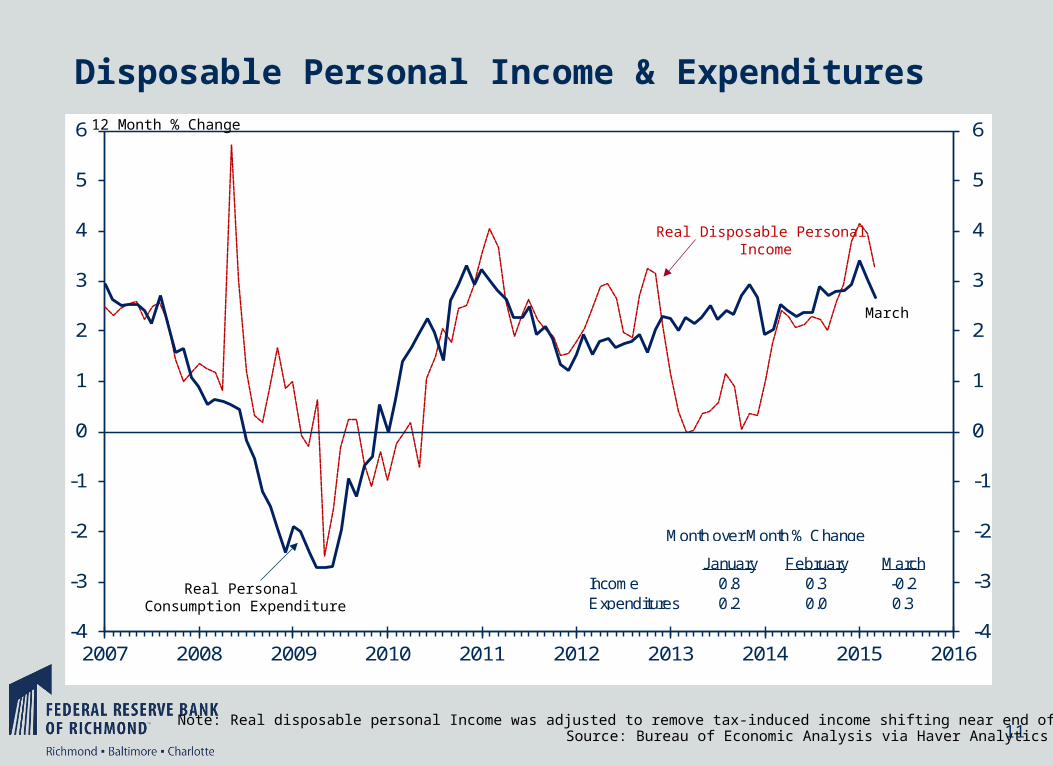
Disposable Personal Income & Expenditures
Source: Bureau of Economic Analysis via Haver Analytics
12 Month % Change
Real Personal Consumption Expenditure
Real Disposable Personal Income
March
Note: Real disposable personal Income was adjusted to remove tax-induced income shifting near end of 2012.
January February MarchIncome 0.8 0.3 -0.2Expenditures 0.2 0.0 0.3
Month over Month % Change

12
0.2
0.3
0.4
0.5
0.6
0.7
0.8
0.9
1.0
1.1
1.2
1.3
1.4
0.2
0.3
0.4
0.5
0.6
0.7
0.8
0.9
1.0
1.1
1.2
1.3
1.4
2000 2001 2002 2003 2004 2005 2006 2007 2008 2009 2010 2011 2012 2013 2014 2015 2016
March0.48 mil.
Average Annual New Home Sales:1990 through 1999
New Single-Family Home Sales
Source: Census Bureau via Haver Analytics
Millions of Homes

13
-40
-30
-20
-10
0
10
20
30
40
-40
-30
-20
-10
0
10
20
30
40
2007 2008 2009 2010 2011 2012 2013 2014 2015 2016
Percent change from previous quarter at annual rate
Q10.1%
Real Investment in Equipment
Source: Bureau of Economic Analysis via Haver Analytics

14
-40
-30
-20
-10
0
10
20
30
40
35
40
45
50
55
60
65
2007 2008 2009 2010 2011 2012 2013 2014 2015 2016
Diffusion Index, percent
April51.5
Indexes of Manufacturing Activity
Source: Institute for Supply Management & Richmond Fed via Haver Analytics
ISM (Left Axis)
Richmond Fed (Right Axis)
75
85
95
105
115
125
135
75
85
95
105
115
125
135
1980 1984 1988 1992 1996 2000 2004 2008 2012 2016
15
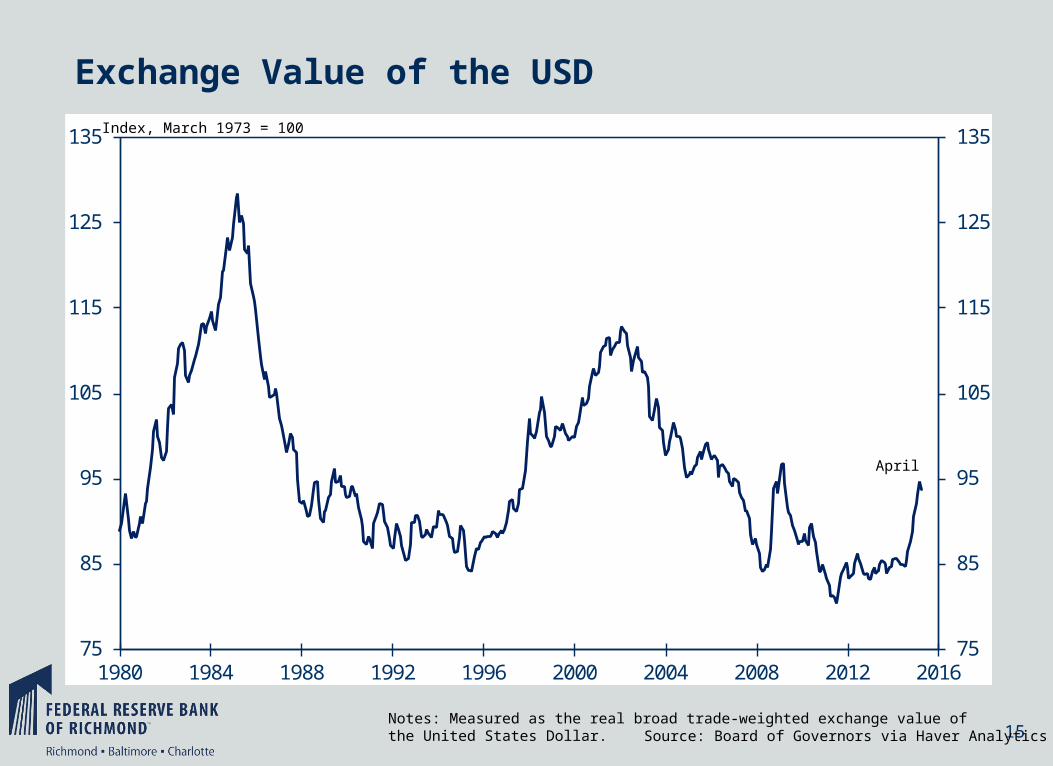
Exchange Value of the USD
Index, March 1973 = 100
Source: Board of Governors via Haver AnalyticsNotes: Measured as the real broad trade-weighted exchange value of the United States Dollar.
April

-80
-70
-60
-50
-40
-30
-20
-10
0
-80
-70
-60
-50
-40
-30
-20
-10
0
2000 2001 2002 2003 2004 2005 2006 2007 2008 2009 2010 2011 2012 2013 2014 2015 2016
16
Current $, Billions
Non-PetroleumBalance
Balance of International Trade
Note: Customs Value of Trade BalanceSource: Census Bureau via Haver Analytics
Petroleum Balance
March-51.4 Bil.
Trade Balance

17
-1.5
-1
-0.5
0
0.5
1
1.5
2
2.5
3
3.5
4
4.5
5
-1.5
-1
-0.5
0
0.5
1
1.5
2
2.5
3
3.5
4
4.5
5
2007 2008 2009 2010 2011 2012 2013 2014 2015 2016 2017 2018
March0.3%
FOMC Projection
Personal Consumption Expenditure Price Index12 Month % Change
Notes: FOMC projection is the range and central tendency for Q4/Q4 percent changes, from the March 2015 meeting. Source: Bureau of Economic Analysis & Board of Governors via Haver Analytics
2% Longer-run Target

18
-6
-5
-4
-3
-2
-1
0
1
2
3
4
5
6
-6
-5
-4
-3
-2
-1
0
1
2
3
4
5
6
2007 2008 2009 2010 2011 2012 2013 2014 2015 2016
Year over Year % Change
Alternate Series
Quarterly Change at
Annual Rate
Unit Labor Cost, Nonfarm Business
Notes: Alternate series is derived from the Employment Cost Index.
Q11.1%
Q1 15 5.0%Q4 14 4.2%Q3 14 -1.0%Q2 14 -3.7%
Source: Bureau of Labor Statistics via Haver Analytics
19
0
10
20
30
40
50
60
70
80
90
100
110
120
130
140
150
0
10
20
30
40
50
60
70
80
90
100
110
120
130
140
150
1994 1996 1998 2000 2002 2004 2006 2008 2010 2012 2014 2016 2018
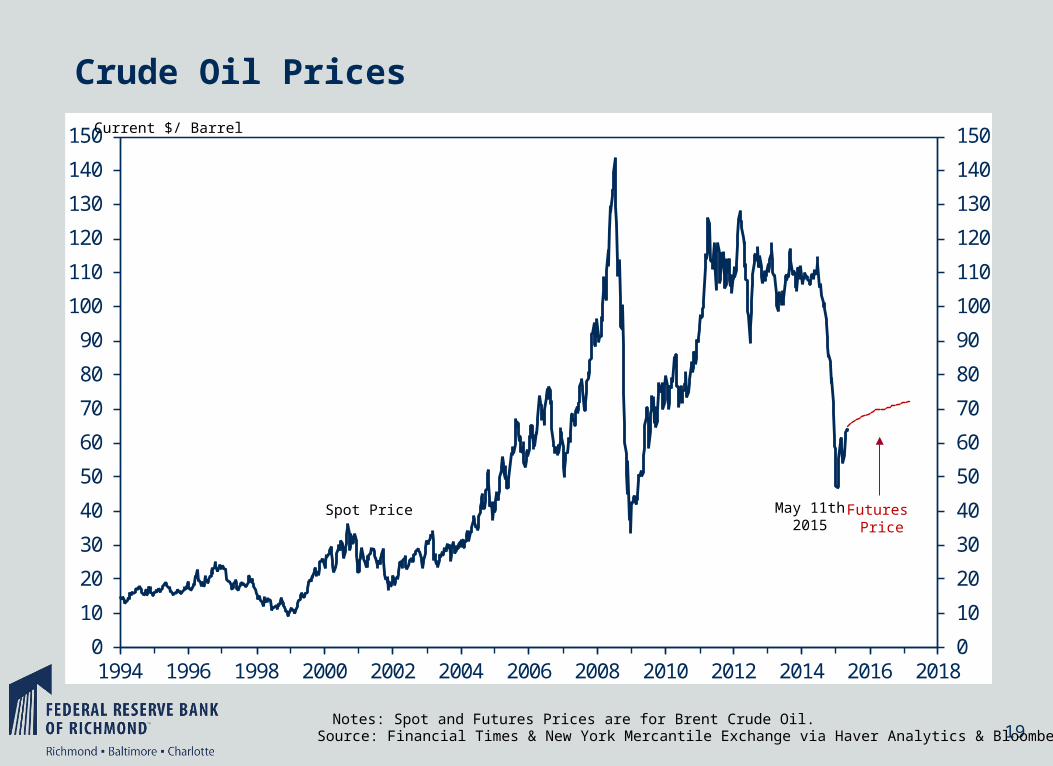
Spot Price May 11th 2015
Crude Oil Prices
Current $/ Barrel
Source: Financial Times & New York Mercantile Exchange via Haver Analytics & Bloomberg
Futures Price
Notes: Spot and Futures Prices are for Brent Crude Oil.

20
0.0
0.5
1.0
1.5
2.0
2.5
3.0
3.5
4.0
4.5
5.0
5.5
6.0
6.5
7.0
0.0
0.5
1.0
1.5
2.0
2.5
3.0
3.5
4.0
4.5
5.0
5.5
6.0
6.5
7.0
2005 2006 2007 2008 2009 2010 2011 2012 2013 2014 2015 2016
Federal Funds Target Rate
May 8thPrimary Credit Rate
Monetary Policy Instruments
Percent
Source: Board of Governors via Haver Analytics
Federal Funds Rate Target Range
Interest Rate Paid on Reserves

21
FOMC Statement
Information received since the Federal Open Market Committee met in March suggests that economic growth slowed during the winter months, in part reflecting transitory factors. The pace of job gains moderated, and the unemployment rate remained steady. A range of labor market indicators suggests that underutilization of labor resources was little changed. Growth in household spending declined; households' real incomes rose strongly, partly reflecting earlier declines in energy prices, and consumer sentiment remains high. Business fixed investment softened, the recovery in the housing sector remained slow, and exports declined. Inflation continued to run below the Committee's longer-run objective, partly reflecting earlier declines in energy prices and decreasing prices of non-energy imports. Market-based measures of inflation compensation remain low; survey-based measures of longer-term inflation expectations have remained stable.
Consistent with its statutory mandate, the Committee seeks to foster maximum employment and price stability. Although growth in output and employment slowed during the first quarter, the Committee continues to expect that, with appropriate policy accommodation, economic activity will expand at a moderate pace, with labor market indicators continuing to move toward levels the Committee judges consistent with its dual mandate. The Committee continues to see the risks to the outlook for economic activity and the labor market as nearly balanced. Inflation is anticipated to remain near its recent low level in the near term, but the Committee expects inflation to rise gradually toward 2 percent over the medium term as the labor market improves further and the transitory effects of declines in energy and import prices dissipate. The Committee continues to monitor inflation developments closely.
To support continued progress toward maximum employment and price stability, the Committee today reaffirmed its view that the current 0 to 1/4 percent target range for the federal funds rate remains appropriate. In determining how long to maintain this target range, the Committee will assess progress--both realized and expected--toward its objectives of maximum employment and 2 percent inflation. This assessment will take into account a wide range of information, including measures of labor market conditions, indicators of inflation pressures and inflation expectations, and readings on financial and international developments. The Committee anticipates that it will be appropriate to raise the target range for the federal funds rate when it has seen further improvement in the labor market and is reasonably confident that inflation will move back to its 2 percent objective over the medium term.
Source: Board of Governors
April 29, 2015
22
Continued… The Committee is maintaining its existing policy of reinvesting principal payments from its holdings of agency debt and agency mortgage-backed securities in agency mortgage-backed securities and of rolling over maturing Treasury securities at auction. This policy, by keeping the Committee's holdings of longer-term securities at sizable levels, should help maintain accommodative financial conditions.
When the Committee decides to begin to remove policy accommodation, it will take a balanced approach consistent with its longer-run goals of maximum employment and inflation of 2 percent. The Committee currently anticipates that, even after employment and inflation are near mandate-consistent levels, economic conditions may, for some time, warrant keeping the target federal funds rate below levels the Committee views as normal in the longer run.
Voting for the FOMC monetary policy action were: Janet L. Yellen, Chair; William C. Dudley, Vice Chairman; Lael Brainard; Charles L. Evans; Stanley Fischer; Jeffrey M. Lacker; Dennis P. Lockhart; Jerome H. Powell; Daniel K. Tarullo; and John C. Williams.
Source: Board of Governors March 18, 2015

2015 2016 2017 Long Run0
0.5
1
1.5
2
2.5
3
3.5
4
4.5
23
Summary of Economic Projections: Federal Funds Rate
Percent
Source: Board of Governors
Note: Each dot in the chart represents the value of an FOMC participant’s judgment of the midpoint of the appropriate target range (or the appropriate target level) for the federal funds rate at the end of the calendar year. Projections made for the March 2015 meeting.