national client email report - dma.org.uk client email report 2013... · the dma’s 2013 national...
TRANSCRIPT

National client email report 2013
Sponsored by

NATIONAL CLIENT EMAIL rEpOrT 2013
COpYrIGHT: THE DIrECT MArKETING ASSOCIATION (UK) LTD 20131
ContentsContents . . . . . . . . . . . . . . . . . . . . . . . . . . . . . . . . . . . . . . . . . . . . . . . . . . . . . . . . . . . . . . . . . . . . . . . . . . . . . . . . . . . . . . . . . . . . . . . . . . . . . . . . . . . . . . . . . . . . . . . . . . . . . . . . . . . . . . . . . . . . . . . .1cont. . . . . . . . . . . . . . . . . . . . . . . . . . . . . . . . . . . . . . . . . . . . . . . . . . . . . . . . . . . . . . . . . . . . . . . . . . . . . . . . . . . . . . . . . . . . . . . . . . . . . . . . . . . . . . . . . . . . . . . . . . . . . . . . . . . . . . . . . . . . . . . . . . . . . .1
1. Introduction . . . . . . . . . . . . . . . . . . . . . . . . . . . . . . . . . . . . . . . . . . . . . . . . . . . . . . . . . . . . . . . . . . . . . . . . . . . . . . . . . . . . . . . . . . . . . . . . . . . . . . . . . . . . . . . . . . . . . . . . . . . . . . . . . . . . . . . .3
Sponsor perspective . . . . . . . . . . . . . . . . . . . . . . . . . . . . . . . . . . . . . . . . . . . . . . . . . . . . . . . . . . . . . . . . . . . . . . . . . . . . . . . . . . . . . . . . . . . . . . . . . . . . . . . . . . . . . . . . . . . . . . . . . . . . . . . .4
Executive results summary . . . . . . . . . . . . . . . . . . . . . . . . . . . . . . . . . . . . . . . . . . . . . . . . . . . . . . . . . . . . . . . . . . . . . . . . . . . . . . . . . . . . . . . . . . . . . . . . . . . . . . . . . . . . . . . . . . . . . . .5
2. Overall results . . . . . . . . . . . . . . . . . . . . . . . . . . . . . . . . . . . . . . . . . . . . . . . . . . . . . . . . . . . . . . . . . . . . . . . . . . . . . . . . . . . . . . . . . . . . . . . . . . . . . . . . . . . . . . . . . . . . . . . . . . . . . . . . . . . . .62.1 Importance of email marketing within organisations . . . . . . . . . . . . . . . . . . . . . . . . . . . . . . . . . . . . . . . . . . . . . . . . . . . . . . . . . . . . . . . . . . . . . . . . . . . . . .62.2 Purpose of email marketing . . . . . . . . . . . . . . . . . . . . . . . . . . . . . . . . . . . . . . . . . . . . . . . . . . . . . . . . . . . . . . . . . . . . . . . . . . . . . . . . . . . . . . . . . . . . . . . . . . . . . . . . . . . . . . . .72.3 Budget allocations . . . . . . . . . . . . . . . . . . . . . . . . . . . . . . . . . . . . . . . . . . . . . . . . . . . . . . . . . . . . . . . . . . . . . . . . . . . . . . . . . . . . . . . . . . . . . . . . . . . . . . . . . . . . . . . . . . . . . . . . . . . .82.4 Budget projections . . . . . . . . . . . . . . . . . . . . . . . . . . . . . . . . . . . . . . . . . . . . . . . . . . . . . . . . . . . . . . . . . . . . . . . . . . . . . . . . . . . . . . . . . . . . . . . . . . . . . . . . . . . . . . . . . . . . . . . . . . . .92.5 Constraints . . . . . . . . . . . . . . . . . . . . . . . . . . . . . . . . . . . . . . . . . . . . . . . . . . . . . . . . . . . . . . . . . . . . . . . . . . . . . . . . . . . . . . . . . . . . . . . . . . . . . . . . . . . . . . . . . . . . . . . . . . . . . . . . . . . . . . .92.6 Email marketing management . . . . . . . . . . . . . . . . . . . . . . . . . . . . . . . . . . . . . . . . . . . . . . . . . . . . . . . . . . . . . . . . . . . . . . . . . . . . . . . . . . . . . . . . . . . . . . . . . . . . . . . . . . . .112.7 Staff hours . . . . . . . . . . . . . . . . . . . . . . . . . . . . . . . . . . . . . . . . . . . . . . . . . . . . . . . . . . . . . . . . . . . . . . . . . . . . . . . . . . . . . . . . . . . . . . . . . . . . . . . . . . . . . . . . . . . . . . . . . . . . . . . . . . . . . . .122.8 Ability to calculate revenue contributions . . . . . . . . . . . . . . . . . . . . . . . . . . . . . . . . . . . . . . . . . . . . . . . . . . . . . . . . . . . . . . . . . . . . . . . . . . . . . . . . . . . . . . . . . . . . .122.9 ROI . . . . . . . . . . . . . . . . . . . . . . . . . . . . . . . . . . . . . . . . . . . . . . . . . . . . . . . . . . . . . . . . . . . . . . . . . . . . . . . . . . . . . . . . . . . . . . . . . . . . . . . . . . . . . . . . . . . . . . . . . . . . . . . . . . . . . . . . . . . . . . . . . .142.10 Digital revenue contribution . . . . . . . . . . . . . . . . . . . . . . . . . . . . . . . . . . . . . . . . . . . . . . . . . . . . . . . . . . . . . . . . . . . . . . . . . . . . . . . . . . . . . . . . . . . . . . . . . . . . . . . . . . . . . .142.11 Overall revenue contribution . . . . . . . . . . . . . . . . . . . . . . . . . . . . . . . . . . . . . . . . . . . . . . . . . . . . . . . . . . . . . . . . . . . . . . . . . . . . . . . . . . . . . . . . . . . . . . . . . . . . . . . . . . . . .152.12 Revenue contributions of different email approaches . . . . . . . . . . . . . . . . . . . . . . . . . . . . . . . . . . . . . . . . . . . . . . . . . . . . . . . . . . . . . . . . . . . . . . . . . .152.13 Performance of different types of email message . . . . . . . . . . . . . . . . . . . . . . . . . . . . . . . . . . . . . . . . . . . . . . . . . . . . . . . . . . . . . . . . . . . . . . . . . . . . . . . .162.14 Metrics - trends . . . . . . . . . . . . . . . . . . . . . . . . . . . . . . . . . . . . . . . . . . . . . . . . . . . . . . . . . . . . . . . . . . . . . . . . . . . . . . . . . . . . . . . . . . . . . . . . . . . . . . . . . . . . . . . . . . . . . . . . . . . . . .172.15 Metrics - predictions. . . . . . . . . . . . . . . . . . . . . . . . . . . . . . . . . . . . . . . . . . . . . . . . . . . . . . . . . . . . . . . . . . . . . . . . . . . . . . . . . . . . . . . . . . . . . . . . . . . . . . . . . . . . . . . . . . . . . . . .192.16 Satisfaction with email programmes . . . . . . . . . . . . . . . . . . . . . . . . . . . . . . . . . . . . . . . . . . . . . . . . . . . . . . . . . . . . . . . . . . . . . . . . . . . . . . . . . . . . . . . . . . . . . . . . . .202.17 Email marketing concerns . . . . . . . . . . . . . . . . . . . . . . . . . . . . . . . . . . . . . . . . . . . . . . . . . . . . . . . . . . . . . . . . . . . . . . . . . . . . . . . . . . . . . . . . . . . . . . . . . . . . . . . . . . . . . . . .212.18 Email marketing competence . . . . . . . . . . . . . . . . . . . . . . . . . . . . . . . . . . . . . . . . . . . . . . . . . . . . . . . . . . . . . . . . . . . . . . . . . . . . . . . . . . . . . . . . . . . . . . . . . . . . . . . . . . .222.19 Email marketing education . . . . . . . . . . . . . . . . . . . . . . . . . . . . . . . . . . . . . . . . . . . . . . . . . . . . . . . . . . . . . . . . . . . . . . . . . . . . . . . . . . . . . . . . . . . . . . . . . . . . . . . . . . . . . . .222.20 Integration approaches - ROI . . . . . . . . . . . . . . . . . . . . . . . . . . . . . . . . . . . . . . . . . . . . . . . . . . . . . . . . . . . . . . . . . . . . . . . . . . . . . . . . . . . . . . . . . . . . . . . . . . . . . . . . . . . .242.21 Integration approaches - relationships . . . . . . . . . . . . . . . . . . . . . . . . . . . . . . . . . . . . . . . . . . . . . . . . . . . . . . . . . . . . . . . . . . . . . . . . . . . . . . . . . . . . . . . . . . . . . . .252.22 Contact strategies . . . . . . . . . . . . . . . . . . . . . . . . . . . . . . . . . . . . . . . . . . . . . . . . . . . . . . . . . . . . . . . . . . . . . . . . . . . . . . . . . . . . . . . . . . . . . . . . . . . . . . . . . . . . . . . . . . . . . . . . . . .262.23 Maximum contact frequencies . . . . . . . . . . . . . . . . . . . . . . . . . . . . . . . . . . . . . . . . . . . . . . . . . . . . . . . . . . . . . . . . . . . . . . . . . . . . . . . . . . . . . . . . . . . . . . . . . . . . . . . . . .262.24 List growth . . . . . . . . . . . . . . . . . . . . . . . . . . . . . . . . . . . . . . . . . . . . . . . . . . . . . . . . . . . . . . . . . . . . . . . . . . . . . . . . . . . . . . . . . . . . . . . . . . . . . . . . . . . . . . . . . . . . . . . . . . . . . . . . . . . . .272.25 Segmentation practices . . . . . . . . . . . . . . . . . . . . . . . . . . . . . . . . . . . . . . . . . . . . . . . . . . . . . . . . . . . . . . . . . . . . . . . . . . . . . . . . . . . . . . . . . . . . . . . . . . . . . . . . . . . . . . . . . . .29
3. B2C and B2B results highlights . . . . . . . . . . . . . . . . . . . . . . . . . . . . . . . . . . . . . . . . . . . . . . . . . . . . . . . . . . . . . . . . . . . . . . . . . . . . . . . . . . . . . . . . . . . . . . . . . . . . . . . . . . . .303.1 Purpose of email marketing . . . . . . . . . . . . . . . . . . . . . . . . . . . . . . . . . . . . . . . . . . . . . . . . . . . . . . . . . . . . . . . . . . . . . . . . . . . . . . . . . . . . . . . . . . . . . . . . . . . . . . . . . . . . . . . .313.2 Budget allocations . . . . . . . . . . . . . . . . . . . . . . . . . . . . . . . . . . . . . . . . . . . . . . . . . . . . . . . . . . . . . . . . . . . . . . . . . . . . . . . . . . . . . . . . . . . . . . . . . . . . . . . . . . . . . . . . . . . . . . . . . . . .323.3 Budget projections . . . . . . . . . . . . . . . . . . . . . . . . . . . . . . . . . . . . . . . . . . . . . . . . . . . . . . . . . . . . . . . . . . . . . . . . . . . . . . . . . . . . . . . . . . . . . . . . . . . . . . . . . . . . . . . . . . . . . . . . . . . .323.4 Staff hours . . . . . . . . . . . . . . . . . . . . . . . . . . . . . . . . . . . . . . . . . . . . . . . . . . . . . . . . . . . . . . . . . . . . . . . . . . . . . . . . . . . . . . . . . . . . . . . . . . . . . . . . . . . . . . . . . . . . . . . . . . . . . . . . . . . . . . .333.5 Ability to calculate revenue contributions . . . . . . . . . . . . . . . . . . . . . . . . . . . . . . . . . . . . . . . . . . . . . . . . . . . . . . . . . . . . . . . . . . . . . . . . . . . . . . . . . . . . . . . . . . . . .333.6 ROI . . . . . . . . . . . . . . . . . . . . . . . . . . . . . . . . . . . . . . . . . . . . . . . . . . . . . . . . . . . . . . . . . . . . . . . . . . . . . . . . . . . . . . . . . . . . . . . . . . . . . . . . . . . . . . . . . . . . . . . . . . . . . . . . . . . . . . . . . . . . . . . . . .333.7 Digital revenue contribution . . . . . . . . . . . . . . . . . . . . . . . . . . . . . . . . . . . . . . . . . . . . . . . . . . . . . . . . . . . . . . . . . . . . . . . . . . . . . . . . . . . . . . . . . . . . . . . . . . . . . . . . . . . . . . . .343.8 Overall revenue contribution . . . . . . . . . . . . . . . . . . . . . . . . . . . . . . . . . . . . . . . . . . . . . . . . . . . . . . . . . . . . . . . . . . . . . . . . . . . . . . . . . . . . . . . . . . . . . . . . . . . . . . . . . . . . . . .343.9 Revenue contributions of different email approaches . . . . . . . . . . . . . . . . . . . . . . . . . . . . . . . . . . . . . . . . . . . . . . . . . . . . . . . . . . . . . . . . . . . . . . . . . . . .343.10 Popularity of different types of email message . . . . . . . . . . . . . . . . . . . . . . . . . . . . . . . . . . . . . . . . . . . . . . . . . . . . . . . . . . . . . . . . . . . . . . . . . . . . . . . . . . . .353.11 Metrics - trends . . . . . . . . . . . . . . . . . . . . . . . . . . . . . . . . . . . . . . . . . . . . . . . . . . . . . . . . . . . . . . . . . . . . . . . . . . . . . . . . . . . . . . . . . . . . . . . . . . . . . . . . . . . . . . . . . . . . . . . . . . . . . .363.12 Metrics - predictions. . . . . . . . . . . . . . . . . . . . . . . . . . . . . . . . . . . . . . . . . . . . . . . . . . . . . . . . . . . . . . . . . . . . . . . . . . . . . . . . . . . . . . . . . . . . . . . . . . . . . . . . . . . . . . . . . . . . . . . .373.13 Email marketing competence . . . . . . . . . . . . . . . . . . . . . . . . . . . . . . . . . . . . . . . . . . . . . . . . . . . . . . . . . . . . . . . . . . . . . . . . . . . . . . . . . . . . . . . . . . . . . . . . . . . . . . . . . . .383.14 Email marketing education . . . . . . . . . . . . . . . . . . . . . . . . . . . . . . . . . . . . . . . . . . . . . . . . . . . . . . . . . . . . . . . . . . . . . . . . . . . . . . . . . . . . . . . . . . . . . . . . . . . . . . . . . . . . . . .383.15 Integration approaches - ROI . . . . . . . . . . . . . . . . . . . . . . . . . . . . . . . . . . . . . . . . . . . . . . . . . . . . . . . . . . . . . . . . . . . . . . . . . . . . . . . . . . . . . . . . . . . . . . . . . . . . . . . . . . . .393.16 Integration approaches - relationships . . . . . . . . . . . . . . . . . . . . . . . . . . . . . . . . . . . . . . . . . . . . . . . . . . . . . . . . . . . . . . . . . . . . . . . . . . . . . . . . . . . . . . . . . . . . . . .39
cont.

COPYRIGHT: THE DIRECT MARKETING ASSOCIATION (UK) LTD 2013
NATIONAL CLIENT EMAIL REPORT 2013
2
3.17 Contact strategies . . . . . . . . . . . . . . . . . . . . . . . . . . . . . . . . . . . . . . . . . . . . . . . . . . . . . . . . . . . . . . . . . . . . . . . . . . . . . . . . . . . . . . . . . . . . . . . . . . . . . . . . . . . . . . . . . . . . . . . . . . .403.18 Maximum contact frequencies . . . . . . . . . . . . . . . . . . . . . . . . . . . . . . . . . . . . . . . . . . . . . . . . . . . . . . . . . . . . . . . . . . . . . . . . . . . . . . . . . . . . . . . . . . . . . . . . . . . . . . . . . .40
4. B2C results – annual comparisons . . . . . . . . . . . . . . . . . . . . . . . . . . . . . . . . . . . . . . . . . . . . . . . . . . . . . . . . . . . . . . . . . . . . . . . . . . . . . . . . . . . . . . . . . . . . . . . . . . . . . . . .414.1 Importance of email marketing within organisations . . . . . . . . . . . . . . . . . . . . . . . . . . . . . . . . . . . . . . . . . . . . . . . . . . . . . . . . . . . . . . . . . . . . . . . . . . . . . .414.2 Constraints . . . . . . . . . . . . . . . . . . . . . . . . . . . . . . . . . . . . . . . . . . . . . . . . . . . . . . . . . . . . . . . . . . . . . . . . . . . . . . . . . . . . . . . . . . . . . . . . . . . . . . . . . . . . . . . . . . . . . . . . . . . . . . . . . . . . . . .424.3 Email marketing management . . . . . . . . . . . . . . . . . . . . . . . . . . . . . . . . . . . . . . . . . . . . . . . . . . . . . . . . . . . . . . . . . . . . . . . . . . . . . . . . . . . . . . . . . . . . . . . . . . . . . . . . . . . .424.4 Satisfaction with email programmes . . . . . . . . . . . . . . . . . . . . . . . . . . . . . . . . . . . . . . . . . . . . . . . . . . . . . . . . . . . . . . . . . . . . . . . . . . . . . . . . . . . . . . . . . . . . . . . . . . . .434.5 Email marketing concerns . . . . . . . . . . . . . . . . . . . . . . . . . . . . . . . . . . . . . . . . . . . . . . . . . . . . . . . . . . . . . . . . . . . . . . . . . . . . . . . . . . . . . . . . . . . . . . . . . . . . . . . . . . . . . . . . . .434.6 List growth . . . . . . . . . . . . . . . . . . . . . . . . . . . . . . . . . . . . . . . . . . . . . . . . . . . . . . . . . . . . . . . . . . . . . . . . . . . . . . . . . . . . . . . . . . . . . . . . . . . . . . . . . . . . . . . . . . . . . . . . . . . . . . . . . . . . . . .444.7 Segmentation practices . . . . . . . . . . . . . . . . . . . . . . . . . . . . . . . . . . . . . . . . . . . . . . . . . . . . . . . . . . . . . . . . . . . . . . . . . . . . . . . . . . . . . . . . . . . . . . . . . . . . . . . . . . . . . . . . . . . . .44
5. B2B results – annual comparisons . . . . . . . . . . . . . . . . . . . . . . . . . . . . . . . . . . . . . . . . . . . . . . . . . . . . . . . . . . . . . . . . . . . . . . . . . . . . . . . . . . . . . . . . . . . . . . . . . . . . . . . .455.1 Importance of email marketing within organisations . . . . . . . . . . . . . . . . . . . . . . . . . . . . . . . . . . . . . . . . . . . . . . . . . . . . . . . . . . . . . . . . . . . . . . . . . . . . . .455.2 Constraints . . . . . . . . . . . . . . . . . . . . . . . . . . . . . . . . . . . . . . . . . . . . . . . . . . . . . . . . . . . . . . . . . . . . . . . . . . . . . . . . . . . . . . . . . . . . . . . . . . . . . . . . . . . . . . . . . . . . . . . . . . . . . . . . . . . . . . .465.3 Email marketing management . . . . . . . . . . . . . . . . . . . . . . . . . . . . . . . . . . . . . . . . . . . . . . . . . . . . . . . . . . . . . . . . . . . . . . . . . . . . . . . . . . . . . . . . . . . . . . . . . . . . . . . . . . . .465.4 Satisfaction with email programmes . . . . . . . . . . . . . . . . . . . . . . . . . . . . . . . . . . . . . . . . . . . . . . . . . . . . . . . . . . . . . . . . . . . . . . . . . . . . . . . . . . . . . . . . . . . . . . . . . . . .475.5 Email marketing concerns . . . . . . . . . . . . . . . . . . . . . . . . . . . . . . . . . . . . . . . . . . . . . . . . . . . . . . . . . . . . . . . . . . . . . . . . . . . . . . . . . . . . . . . . . . . . . . . . . . . . . . . . . . . . . . . . . .475.6 List growth . . . . . . . . . . . . . . . . . . . . . . . . . . . . . . . . . . . . . . . . . . . . . . . . . . . . . . . . . . . . . . . . . . . . . . . . . . . . . . . . . . . . . . . . . . . . . . . . . . . . . . . . . . . . . . . . . . . . . . . . . . . . . . . . . . . . . . .485.7 Segmentation practices . . . . . . . . . . . . . . . . . . . . . . . . . . . . . . . . . . . . . . . . . . . . . . . . . . . . . . . . . . . . . . . . . . . . . . . . . . . . . . . . . . . . . . . . . . . . . . . . . . . . . . . . . . . . . . . . . . . . .48
Methodology . . . . . . . . . . . . . . . . . . . . . . . . . . . . . . . . . . . . . . . . . . . . . . . . . . . . . . . . . . . . . . . . . . . . . . . . . . . . . . . . . . . . . . . . . . . . . . . . . . . . . . . . . . . . . . . . . . . . . . . . . . . . . . . . . . . . . . . . . .49
Glossary of terms . . . . . . . . . . . . . . . . . . . . . . . . . . . . . . . . . . . . . . . . . . . . . . . . . . . . . . . . . . . . . . . . . . . . . . . . . . . . . . . . . . . . . . . . . . . . . . . . . . . . . . . . . . . . . . . . . . . . . . . . . . . . . . . . . . . .50
About the DMA . . . . . . . . . . . . . . . . . . . . . . . . . . . . . . . . . . . . . . . . . . . . . . . . . . . . . . . . . . . . . . . . . . . . . . . . . . . . . . . . . . . . . . . . . . . . . . . . . . . . . . . . . . . . . . . . . . . . . . . . . . . . . . . . . . . . . . .51
About Alchemy Worx . . . . . . . . . . . . . . . . . . . . . . . . . . . . . . . . . . . . . . . . . . . . . . . . . . . . . . . . . . . . . . . . . . . . . . . . . . . . . . . . . . . . . . . . . . . . . . . . . . . . . . . . . . . . . . . . . . . . . . . . . . . . . . . .52
Copyright and disclaimer . . . . . . . . . . . . . . . . . . . . . . . . . . . . . . . . . . . . . . . . . . . . . . . . . . . . . . . . . . . . . . . . . . . . . . . . . . . . . . . . . . . . . . . . . . . . . . . . . . . . . . . . . . . . . . . . . . . . . . . . . .53

NATIONAL CLIENT EMAIL rEpOrT 2013
COpYrIGHT: THE DIrECT MArKETING ASSOCIATION (UK) LTD 20133
2012 was an amazing year to live and work in Britain. We had the Queen’s Diamond Jubilee; the Olympics arrived in London and England crashing out of another major tournament on penalties! For those of us excited by the goings on in our inbox, what would the impact be? How did busy environment actually impact campaign results, email tactics and email marketing’s position within businesses?
Responses to the annual national client email report reveal some interesting answers.
2012 saw maximum contact frequencies rise significantly with the number of organisations never sending more than 1 email a month to subscribers almost halving to 14%. How much of this was driven by fresh content from the external environment can be debated, but recipients responded well to the increased frequency. Just over half of respondents reported, open, click and conversion rates improving in 2012.
This is supported by the feedback on the strength of ROI from the email channel. Respondents estimating an average return of £21.48 for each £1 spent on email in 2012.
It is no surprise then to see that email marketing remains critical to businesses. In fact 89% of respondents declared email as “important” or “very important” to their organisation.
What perhaps is a surprise is that despite these significant returns, there is a huge disconnect between email’s value and position within an organisation. Despite its obvious success for business, respondents cited resources and budget as the top two constraints to success. It is never too late to have a new year’s resolution – and it strikes me that as an industry we need to help better communicate the value of email in 2013.
As chair of the EMC’s Benchmarking Hub, I would like to thank everyone who made this report possible.
First and foremost, I would like to thank all of the client email marketers who participated in the survey as well as those ESPs who, in support of research, encouraged their clients to participate.
Secondly, this report, like the National Email Benchmarking reports, is made possible through generous time given by certain individuals who constitute the Benchmarking Hub, namely: Matt Simons (Haves EHS); Joe Hunter (ExactTarget), Fiona Robson (RocketSeed), Anthony Wilkey (Email Vision); and Lynn Hewitt of (Business Bound). Yashraj Jain also deserves special acknowledgment for his tireless work in project managing the report; collecting and analysing the data; and helping to structure and write the document you are now reading.
Further thanks are due to the report’s author, Mark Brownlow. Final thanks should be saved for the report’s sponsors: Alchemy Worx.
James BuntingManaging Director, Communicator [email protected], Benchmarking Hub, Email Marketing Council, Direct Marketing Association UK Ltd.
1. Introduction

NATIONAL CLIENT EMAIL rEpOrT 2013
COpYrIGHT: THE DIrECT MArKETING ASSOCIATION (UK) LTD 20134
In the last edition of the DMA Email Client Study, we acknowledged that 2011 was as a remarkable year for email and we are delighted to report that this trajectory has continued in 2012. If 2011 was the year that email came of age, then 2012 saw it become the cornerstone of many marketing programmes, with a third of respondents reporting that email accounted for more digital revenue than all other digital revenue channels combined. There were also no signs of fatigue after a successful 2011, with brands sending more email as a proportion of their databases, while continuing to see improvements in key metrics such as clicks and conversions. In fact, an exponential improvement took place in the real number of visitors to websites and revenue on balance sheets.
Of course, as send frequency increases, so must the value of those emails to the subscriber and this is reflected by marketers diversifying their programmes to include a broader range of message types. The report shows increases in every email category from newsletters and surveys, to customer lifecycle touch points, targeted offers and win-back mailings. And, as email marketing programmes become necessarily more sophisticated and diverse to increase the value of each send, the services of dedicated email specialists become increasingly important in achieving that goal.
As the value, frequency and effectiveness of email programs has improved, it is perhaps unsurprising that the report highlights an average ROI of over £20 for every £1 spent on email. That’s a figure that should attract the attention of even the most sceptical budget-owners. And yet, 38% of respondents cited budget as a barrier to achieving their goals. Marketers should be using the impressive ROI and brand engagement figures in this report to increase their share of marketing spend. They should also be implementing effective measures of email’s contribution to sales across all channels, as well as other brand KPIs, so that this influential data is available to them at all times. If the positive trend for email is to continue in 2013, we must see a significant reduction in the 38% figure by the time of the next report. That would represent real progress for our channel.
Dela QuistCEO, Alchemy Worx
Sponsor perspective
NATIONAL CLIENT EMAIL rEpOrT 2013
COpYrIGHT: THE DIrECT MArKETING ASSOCIATION (UK) LTD 20135
Email continues to be highly valued with impressive ROI
• Email marketing remains critical to business, with 89% of respondents declaring email to be “important” or “very important” to their organisation
• Email marketing’s ROI is strong: it returned an estimated average of £21.48 for each £1 spent in 2012
• For roughly a third of respondents, email marketing accounts for 50% or more of all digital business revenue
• Click and conversion rates are the factors that marketers rate most often as important to achieving business goals
More budget and in-house resource set aside for email marketing – but marketers still feel constrained
• Budget allocation to email marketing increased slightly in 2012, with 15% more marketers spending at least 30% of their budget on email than in 2011. Over half expect their budget to increase across 2013
• More organisations are managing email marketing in-house, with staff hours dedicated to email marketing rising accordingly
• Marketers are more comfortable with email marketing basics than in 2011, but there is still a need for more customised, advanced training and education opportunities
• The disconnect between email’s value and email’s position in the organisation continues, with internal resources and budget the top two constraints to success cited by respondents: marketers need to better communicate email’s value internally
Customers respond positively as email tactics mature
• Just over half of respondents reported open, click and conversion rates improved in 2012. Even more expect their numbers to improve in 2013. Only less than 12% reported any decline in these metrics
• Despite relatively low volumes, trigger email campaigns accounted for 21% of email revenue. Over 75% of email revenue is now generated by alternatives to generic one-size-fits-all campaigns
• Marketers are making use of a far wider number of email marketing approaches, but there is still significant room for improvement. For example, just under half still don’t send a welcome email
Marketers finesse their list-building and usage strategies
• Marketers are getting better at using different techniques to build their lists. Organic website traffic and transactions remain the top two acquisition sources
• Marketers are also increasing their use of segmentation: the number segmenting into more than six different audiences rose 28% in 2012
• The growth of diverse email streams has also encouraged marketers to develop strategies for maximum email contact levels. Some 11% more have such a strategy than in 2011
• Maximum contact frequencies have risen significantly, with the number of organisations never sending more than one email a month to subscribers almost halving to 14%
More sophisticated integration of email with other channels
• Marketers are using email for an increasing range of objectives beyond straightforward revenue generation, including retention, engagement, acquisition and brand awareness
• Marketers report that the best other channels to integrate with email are online marketing, social networks, direct mail and mobile marketing – both for ROI and profitable relationship building
Executive results summary
NATIONAL CLIENT EMAIL rEpOrT 2013
COpYrIGHT: THE DIrECT MArKETING ASSOCIATION (UK) LTD 20136
The DMA’s 2013 National client email report reveals a number of impressive evolutionary steps – both reactive and proactive – as the medium becomes increasingly refined
Reactively, economic difficulties have seen email’s role as a cost-effective and reliable source of response gain significant recognition, leading to vastly increased use of the email channel. DMA benchmarks, for example, show strong year-on-year growth in the volume of email sent through ESPs, with 20% more emails sent in June 2012 than in June 20111.
But email marketing has also matured greatly and at pace, beginning with a growing understanding of email’s wider role in the marketing mix. This understanding has translated into a more diverse direct response role for email: in campaigns designed to drive social network activity or offline event registrations, for example. It has also produced an even better appreciation for the channel’s long-term role in building relationships and for its indirect role, with an accumulative effect on brand awareness, search volume, and similar.
The past year in particular has also seen email marketing continue to grow in strength and versatility beyond the reliable ‘old’ standards of a content newsletter or broadcast email promotion. This is most obvious in the growth of behavioural email, where emails are sent out on a one-to-one basis and initiated by some kind of ‘trigger’ event. This might be a subscriber action (like a purchase or browsing a particular website section) or a genuine event (like a birthday or the anniversary of a product purchase). For example, 30% more of the top 1,000 retailers in the USA used cart abandonment emails in 2012 than in 20112.
The ongoing success of social networks also continues to influence email. This influence refers not only to formal tactical and strategic integration of the two channels, but also to the way social network activity has changed consumer expectations of the nature and style of communication between organisations and their customers.
Perhaps the largest change, though, comes from the continuing rapid increase in mobile email, with its consequences for email design, strategy and tactics. A 2012 Google survey3 already puts smartphone penetration at 51% of the UK population, with 62% of these smartphone owners using their device for email at least once a day. YouGov predict4 over 55% of UK mobile phone users will have an email-friendly smartphone by May 2013. And a late 2012 Return Path analysis5 found that “mobile open share has increased 300% since 2010 and shows no sign of slowing, with four out of 10 emails sent being read on a mobile device.”
With all of these trends and transformations, how do marketers feel about email marketing and its role in their organisations? How are they actually using email? And what results are they getting? The DMA’s 2013 National client email report set out to find the answers…
In this report, we first present overall survey results and interpretations. We then compare B2B with B2C findings, before looking at responses from B2C and B2B organisations separately.
2.1 Importance of email marketing within organisations
The strategic importance of email remained high in 2012, with 89% of respondents declaring email as “important” or “very important” to their business.
The continuing strength of email’s status, which is still on a slight upward trend, is a reminder of the channel’s durability and provides further evidence that newer marketing channels have not eroded email’s importance. Instead, they have accentuated this importance, with email’s ubiquity among Internet users making it a useful complement to other online initiatives.
1. DMA (2013) National email benchmarking report H1 20122. Internet Retailer (2013) Cart abandonment e-mails gain more attention from e-retailers3. Google (2012) Our Mobile Planet: United Kingdom4. YouGov (2012) Smartphone growth in the UK?5. Return Path (2012) Return Path Report Reveals Nearly Half of All Emails Received Now Read on Mobile Devices
2. Overall results

COPYRIGHT: THE DIRECT MARKETING ASSOCIATION (UK) LTD 2013
NATIONAL CLIENT EMAIL REPORT 2013
7
How important is email marketing within your business strategically?
2.2 Purpose of email marketing
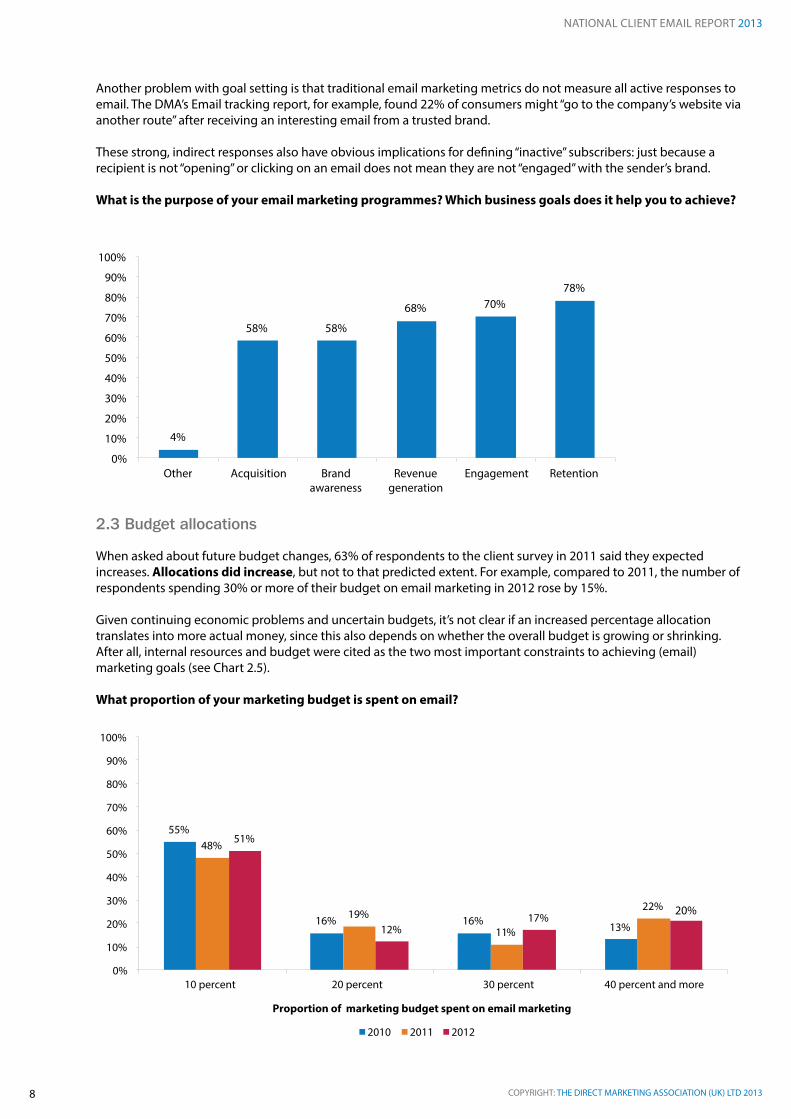
Most traditional media coverage of the sector tackles retail email and email’s role in driving revenue, yet this objective is cited less often by respondents than “retention” (cited by 78%) and engagement (70%).
This reflects the recent transformations in email marketing described in the introduction: marketers are using the channel in a range of roles and recognising the broader impacts beyond immediate sales, particularly in terms of loyalty, branding and long-term effects. The recent DMA Email tracking report6, for example, found 63% of consumers keep emails in their inbox for longer than a day (25% keep them for longer than a week).
The associated ability to generate an ongoing brand presence compares favourably with the visibility and longevity of, for example, Tweets or Facebook posts. It also speaks to email’s nudge effect7, where the sender and subject lines influence purchase decisions, even when the email remains unopened.
The strong showing for engagement also demonstrates the pervasive impact of social marketing needs and goals – where engagement plays a particularly prominent role – on those goals set for other marketing approaches. A challenge, of course, is to define “engagement” and set appropriate objectives. The open rate has known measurement weaknesses (specifically image blocking preventing image-based tracking), but there may be promise in new email intelligence tools that provide information on, for example, “read rates”.
6. DMA (2012) Email tracking report 20127. Alchemy Worx (2009) Dela Quist on the Nudge Effect
48%
41%
8% 2%
1%
55%
36%
5% 4%
0%
57%
32%
9%
1% 1% 0%
10%
20%
30%
40%
50%
60%
70%
80%
90%
100%
Very important Important Neither important or unimportant
Unimportant Very unimportant
2010 2011 2012
COPYRIGHT: THE DIRECT MARKETING ASSOCIATION (UK) LTD 2013
NATIONAL CLIENT EMAIL REPORT 2013
8
1
Another problem with goal setting is that traditional email marketing metrics do not measure all active responses to email. The DMA’s Email tracking report, for example, found 22% of consumers might “go to the company’s website via another route” after receiving an interesting email from a trusted brand.
These strong, indirect responses also have obvious implications for defining “inactive” subscribers: just because a recipient is not “opening” or clicking on an email does not mean they are not “engaged” with the sender’s brand.
What is the purpose of your email marketing programmes? Which business goals does it help you to achieve?
2.3 Budget allocations
When asked about future budget changes, 63% of respondents to the client survey in 2011 said they expected increases. Allocations did increase, but not to that predicted extent. For example, compared to 2011, the number of respondents spending 30% or more of their budget on email marketing in 2012 rose by 15%.
Given continuing economic problems and uncertain budgets, it’s not clear if an increased percentage allocation translates into more actual money, since this also depends on whether the overall budget is growing or shrinking. After all, internal resources and budget were cited as the two most important constraints to achieving (email) marketing goals (see Chart 2.5).
What proportion of your marketing budget is spent on email?
4%
58% 58%
68%
70%
78%
0%
10%
20%
30%
40%
50%
60%
70%
80%
90%
100%
Other Acquisition Brand
awareness Revenue
generation Engagement Retention
Proportion of marketing budget spent on email marketing
55%
16% 16%
13%
48%
19%
11%
22%
51%
12% 17%
0%
10%
20%
30%
40%
50%
60%
70%
80%
90%
100%
10 percent 20 percent 30 percent 40 percent and more
2010
2011
2012
20%

COPYRIGHT: THE DIRECT MARKETING ASSOCIATION (UK) LTD 2013
NATIONAL CLIENT EMAIL REPORT 2013
9
2.4 Budget projections
Over half of respondents (56%) expect their expenditure to increase in 2013. Nevertheless, expectations regarding future budget allocation are not as optimistic as in 2011.
While only one in twenty marketers expects their budget to decline, 39% do expect it to remain unchanged (26% more than said so in 2011).
Looking forward, how would you expect your company’s expenditure on email to change?
2.5 Constraints
Constraints to reaching (email) marketing goals reveal the problems marketers face when looking to get more investment in email and make use of advanced tools or technology to improve results.
Which of the following stop you from achieving your marketing goals?
63%
31%
6%
56%
39%
5%
0%
10%
20%
30%
40%
50%
60%
70%
80%
90%
100%
Increase Stay the same Decrease
2011
2012
38%
26%
22%
19%
22%
54%
38%
30%
28%
27%
0%
10%
20%
30%
40%
50%
60%
70%
80%
90%
100%
Internal resource Budget Internal process In-house technology Lack of data
2011 2012

COPYRIGHT: THE DIRECT MARKETING ASSOCIATION (UK) LTD 2013
NATIONAL CLIENT EMAIL REPORT 2013
10
Compared with 2011, there are across-the-board, often significant, increases in the importance attached to almost every constraint listed.
In absolute terms, the top constraints are internal resources, cited by 54%, and budget, cited by 38%. The 28% citing in-house technology is also notable, as this represents the biggest increase from 2011 (+47%), though this is partially explained by more marketers actually using in-house technology (see Chart 2.6).
There is an apparent and ongoing disconnect between email’s importance, email’s performance and email’s ability to capture budget. As later charts demonstrate, email continues to produce great results in terms of revenue. Respondents also report that process metrics like clicks and conversions are rising. So why the budget and resource constraints?
To some extent, email is a victim of its own success. Senior managers may ask why investment is needed, when results are excellent with current budgets. Marketers may also be failing to internally communicate both email’s benefits and the potential benefits of more investment.
Email marketers and the email marketing media often focus on metrics specific to the email world, notably opens and clicks. Broader appreciation for email marketing within an organisation comes from properly communicating email’s contribution to business units and bottom line success, such as increases to web visitor numbers, order numbers, revenue, registrations or coupon redemptions.
However, senior management support may still not be enough. After all, a lack of such support was only cited by a fifth of respondents. Clearly, then, a general tightening of marketing budgets is (still) a fundamental problem in a weak UK economy.
15% 10%
9%
13%
12%
21%
13% 13% 10%
3%
0%
10%
20%
30%
40%
50%
60%
70%
80%
90%
100%
Senior support ESP technology Lack of concept Lack of interdepartmental/geographical communication
Degradation
2011 2012
COPYRIGHT: THE DIRECT MARKETING ASSOCIATION (UK) LTD 2013
NATIONAL CLIENT EMAIL REPORT 2013
11
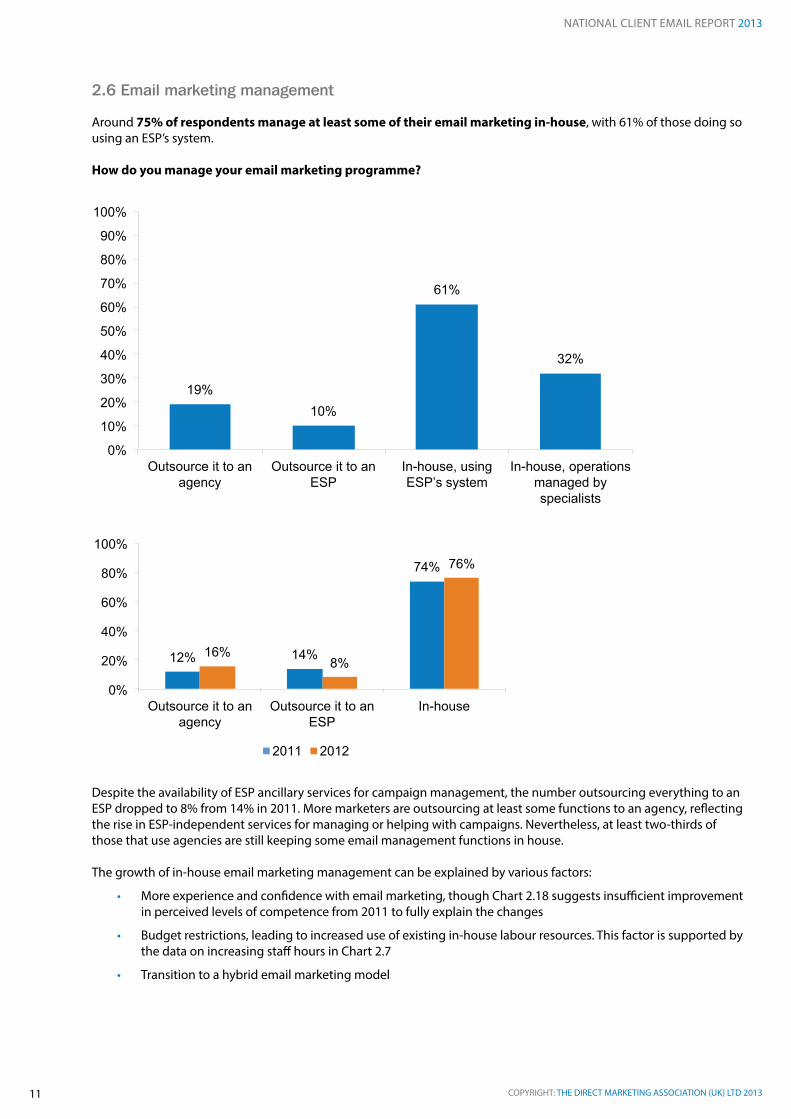
2.6 Email marketing management
Around 75% of respondents manage at least some of their email marketing in-house, with 61% of those doing so using an ESP’s system.
How do you manage your email marketing programme?
Despite the availability of ESP ancillary services for campaign management, the number outsourcing everything to an ESP dropped to 8% from 14% in 2011. More marketers are outsourcing at least some functions to an agency, reflecting the rise in ESP-independent services for managing or helping with campaigns. Nevertheless, at least two-thirds of those that use agencies are still keeping some email management functions in house.
The growth of in-house email marketing management can be explained by various factors:
• More experience and confidence with email marketing, though Chart 2.18 suggests insufficient improvement in perceived levels of competence from 2011 to fully explain the changes
• Budget restrictions, leading to increased use of existing in-house labour resources. This factor is supported by the data on increasing staff hours in Chart 2.7
• Transition to a hybrid email marketing model
19% 10%
61%
32%
0%
10%
20%
30%
40%
50%
60%
70%
80%
90%
100%
Outsource it to an agency
Outsource it to an ESP
In-house, using ESP’s system
In-house, operations managed by specialists
12% 14%
74%
16% 8%
76%
0%
20%
40%
60%
80%
100%
Outsource it to an agency
Outsource it to an ESP
In-house
2011 2012

COPYRIGHT: THE DIRECT MARKETING ASSOCIATION (UK) LTD 2013
NATIONAL CLIENT EMAIL REPORT 2013
12
The last point speaks to the trend commonly identified in other DMA benchmark reports. Marketers are not switching from broadcast mail to one-to-one automated trigger and behavioural email. Instead, many are retaining broadcast email while developing additional automated, data-driven email streams. Those making the transition may need outside help for conception and setup. Those that have completed it may be able to reduce outside agency or ESP use once automation is in place, and rely on internal resources for the always-changing broadcast promotions or content newsletters.
2.7 Staff hours
More evidence for a shift of email management to in-house comes from data on internal staff hours dedicated to email marketing. For example, the number of organisations where staff worked more than 90 hours per month on email rose 36%, from 28% in 2011 to 38% in 2012.
How many staff hours are dedicated to email marketing in an average month?
2.8 Ability to calculate revenue contributions
Many of the constraints to email marketing goals identified in Chart 2.5 would be reduced if marketers could clearly communicate the strong revenue contribution of email to the business. An understanding of email returns is also critical for accurate evaluation and planning of email campaigns.
A first step, of course, is actually being able to calculate that revenue. Some 61% of respondents said they were able to do so, representing barely any change from the 2011 number.
An inability to calculate revenue might be due to one of several reasons. For example:
• The organisation does not understand the importance of tracking email revenue
• The organisation lacks the tools or integrations to measure email response beyond an open or click
• The marketer recognises that email responses are not fully captured by even sophisticated email and web analytics tools
53%
19%
10%
15%
3%
48%
14%
15%
7%
0%
10%
20%
30%
40%
50%
60%
70%
80%
90%
100%
0 - 30 31 - 90 91 - 180 181 - 360 361 +
2011
2012
16%

COPYRIGHT: THE DIRECT MARKETING ASSOCIATION (UK) LTD 2013
NATIONAL CLIENT EMAIL REPORT 2013
13
This last point is perhaps the most problematical. As we saw in Section 2.2, email response often takes place outside the immediate email environment. Here are the full results from the DMA’s Email tracking report 2012 when consumers were asked which three actions they would most likely take when receiving an interesting email:
• 14% might go to a comparison shopping engine
• 22% might go to the sender’s website using their browser (i.e. without clicking on an email link)
• 27% might visit the shop or retail outlet
• 40% might bear the information in mind for later
• 55% might save the email for later use
These numbers make it clear that online tracking tools will struggle to capture all responses to email.
Those organisations with cross-channel customer data often estimate the impact of their emails by comparing average revenue generated by their subscribers with average revenue earned from non-subscribers. Unfortunately, this comparison is misleading, since subscribers tend by definition to be better customers who would likely spend more anyway, even without receiving emails.
Possible alternatives for getting a better handle on email’s net impacts are:
• Compare sales patterns across all channels with email deployment dates to identify matching spikes
• Compare online traffic patterns (e.g. pageviews) with email deployment dates to find matching spikes
• Conduct holdout tests, where a group of subscribers receive no email, to compare customer activity, response, sales etc. between mailed and non-mailed subscribers
Holdout tests require, unfortunately, multichannel customer data. However, they give a far truer picture of email’s impact by including offline sales and other sources of email revenue not measured in conventional email campaign reports. They also account for those sales that would happen anyway, even if you didn’t send an email, so which cannot truly be attributed to the email programme.
Are you able to calculate the revenue generated from your email marketing activities?
61%
33%
6%
60%
34%
6%
0%
10%
20%
30%
40%
50%
60%
70%
80%
90%
100%
Yes No Don't know
2011
2012

COPYRIGHT: THE DIRECT MARKETING ASSOCIATION (UK) LTD 2013
NATIONAL CLIENT EMAIL REPORT 2013
14
2.9 ROI
An ability to measure revenue allows marketers to calculate the profits attributable to email and also the ROI, both of which can be used to gain internal approval for email marketing investment.
How much is the approximate return you get back for every pound spent on email marketing?
Of those able to report figures in the survey, a fifth are producing an astonishing £51 or more in returns for each £1 spent on email marketing.
If we assume the average return for that top category is £55 (it’s likely much higher) then we get an estimated average return across all organisations of £21.48 for each £1 spent on email marketing.
This figure compares with numbers8 from the USA, where a 2012 survey by the USA’s DMA found email produces $28.50 for every dollar spent.
2.10 Digital revenue contribution
Another indicator of the value of email is its share of business revenue. The majority of organisations (62%) produce 30% or more of their digital business revenue through email. For roughly a third of respondents, email marketing even accounts for at least as much digital business revenue as all other channels combined.
The associated value of email marketing to the economy is clear, given the UK’s National Office of Statistics9 estimated website sales at £129.1 billion in 2011 and total ecommerce sales at £482.9 billion.
What does email contribute overall to the business as percentage of DIGITAL business revenue?
8. Ken Magill (2012) Email Response Rates Pathetically Low9. National Office of Statistics (2012) ICT Activity of UK Businesses, 2011
22% 27%
17%
7% 4%%
20%
0%
10%
20%
30%
40%
50%
60%
70%
80%
90%
100%
£1 - £5 £6 - £10 £11 - £20 £21 - £30 £31 - £40 £41 - £50 More than£51
27%
11%
18%
10%
13%
21%
0%
10%
20%
30%
40%
50%
60%
70%
80%
90%
100%
10 percent 20 percent 30 percent 40 percent 50 percent 60 percentand more
Percentage of contribution to digital business revenue
3

COPYRIGHT: THE DIRECT MARKETING ASSOCIATION (UK) LTD 2013
NATIONAL CLIENT EMAIL REPORT 2013
15
2.11 Overall revenue contribution
According to respondents, email also plays an important role in driving total business revenue.
Just over half of organisations (53%) generate 20% or more of this overall revenue through email marketing. It’s interesting here to compare this total revenue contribution with email’s share of the marketing budget. In 2011, there was still an imbalance, with email producing a higher proportion of revenue than its budget share might suggest. This gap narrowed in 2012. For example, email claims at least 30% of the budget share for 38% of respondents (see Chart 2.3) and produces at least 30% of total revenue for 40% of respondents.
What does email contribute overall to the business as percentage of TOTAL business revenue?
2.12 Revenue contributions of different email approaches
Section 1 mentioned how the last year has seen growth in more advanced trigger approaches to email marketing. The importance of this development is clear from the below chart.
What percentage of your email revenue comes from the following types of emails?
42%
14% 15%
29%
46%
13%
25%
0%
10%
20%
30%
40%
50%
60%
70%
80%
90%
100%
10 percent 20 percent 30 percent 40 percent andmore
Percentage of contribution to overall business revenue
2011 2012
23%
25%
30%
13%
0%
10%
20%
30%
40%
50%
60%
70%
80%
90%
100%
Unsegmented email to whole list
Segmented email to whole list
Activity-based triggers
Lifecycle-based triggers
16%
9%

COPYRIGHT: THE DIRECT MARKETING ASSOCIATION (UK) LTD 2013
NATIONAL CLIENT EMAIL REPORT 2013
16
Activity and lifecycle-based triggers produced 21% of total email marketing revenue. This is despite the fact that trigger email volumes are typically very small as a proportion of total email volume. After all, it’s hard to send more than one birthday email a year to customers. One North American review10 of 170 organisations that use email marketing found they sent 6.5 billion emails in Q3 2012, of which 166 million (2.5%) were trigger emails. The revenue generated by trigger emails is far higher than their relative volume would suggest.
Segmented email campaigns accounted for 55%, so 76% of all email marketing revenue came from more advanced practices than generic broadcast email.
2.13 Performance of different types of email message
Chart 2.13 confirms the suggestion that marketers are using a wider number of advanced email approaches.
What type of email message helps you to achieve your business goals?
Regular newsletters are still the most popular, but almost all types of email message showed increases in use to achieve email marketing goals.
The biggest increases were observed for welcome emails (+253% compared with 2011), customer surveys (+164%), thank you messages (+180%), win-back emails (+109%), purchase confirmations (+250%) and abandoned cart reminders (+133%).
However, there still remains enormous potential for further development of email tactics. Welcome messages, for example, are easily created using any professional ESP or email marketing software. Nevertheless, almost half of respondents (47%) still don’t send one.
10. Epsilon (2012) Q3 2012 North America Email Trend Results: More Brands Rely on Triggered Messaging
45%
15%
14%
36%
22%
10%
21%
11%
68%
53%
37%
34%
30%
28%
25%
23%
0%
10%
20%
30%
40%
50%
60%
70%
80%
90%
100%
Regular newsletter
Welcome message
Customer survey
Regular newslettersegmented based
on purchase habits
Thank you message
Alert breaking news
Win-back targeting lapsed
2011
2012
12%
6%
4%
11% 7%
2%
4%
3%
20%
14% 14%
12%
9%
7% 7 % 3%
Abandoned cart
Product replenishment
Warranty renewal
2011
2012
0%
10%
20%
30%
40%
50%
60%
70%
80%
90%
100%
COPYRIGHT: THE DIRECT MARKETING ASSOCIATION (UK) LTD 2013
NATIONAL CLIENT EMAIL REPORT 2013
17
This gap is made all the more frustrating by studies such as the one by Experian CheetahMail back in 201011, which found welcome emails typically produce 4x the opens, 5x the CTR and 8x the revenue per email of standard promotional emails.
Options for welcome message content (which can be spread over several emails) include:
• Thank the subscriber for signing up and confirm the success of the action
• Establish the copy and design elements (sender name, logo etc.) that encourage recognition of future emails
• Remind subscribers of the benefits of the emails
• Provide administrative links or information, such as contact or support information, or a link to a subscriber preference centre
• Encourage readers to provide more information about themselves, for example through a survey or poll
• Encourage subscribers to whitelist the sender
• Offer a reward for signing-up, whether the incentive promised during the sign-up process or as a surprise
• Present the most popular offers or content
• Introduce related themes, such as the sender’s social network presence or information on important website features
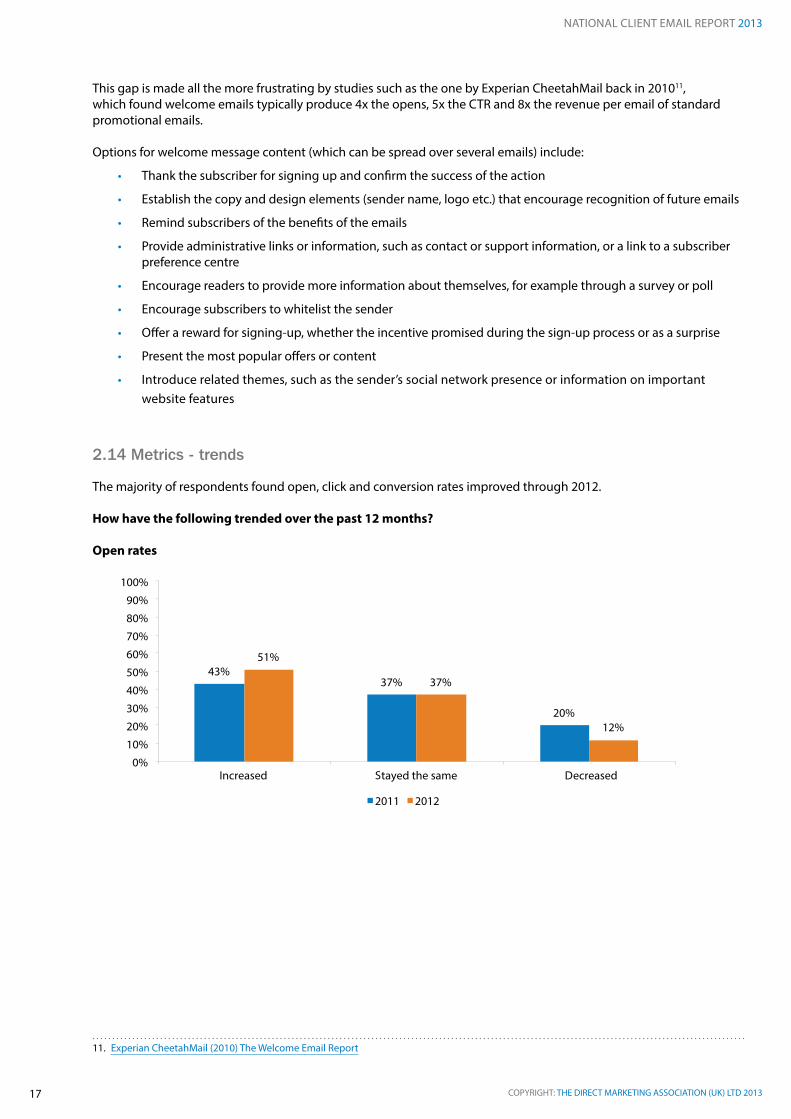
2.14 Metrics - trends
The majority of respondents found open, click and conversion rates improved through 2012.
How have the following trended over the past 12 months?
Open rates
11. Experian CheetahMail (2010) The Welcome Email Report
43%
37%
20%
51%
37%
12%
0%
10%
20%
30%
40%
50%
60%
70%
80%
90%
100%
Increased Stayed the same Decreased
2011 2012
COPYRIGHT: THE DIRECT MARKETING ASSOCIATION (UK) LTD 2013
NATIONAL CLIENT EMAIL REPORT 2013
18
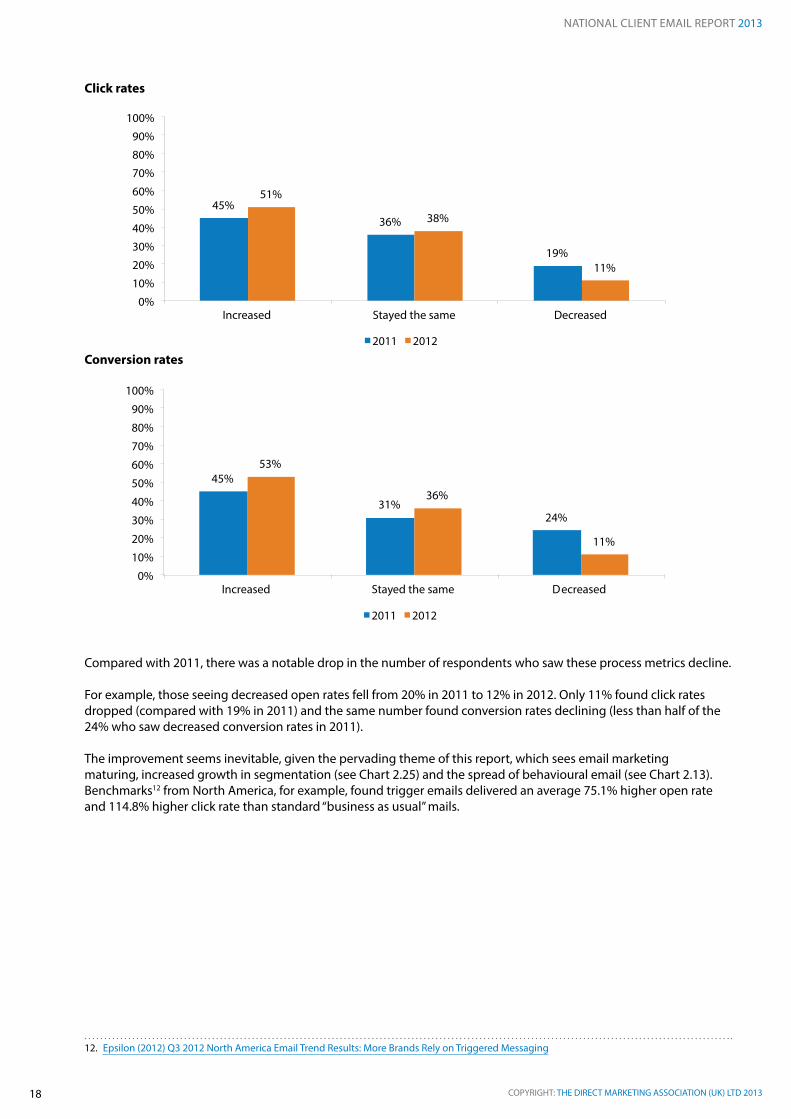
Click rates
Conversion rates
Compared with 2011, there was a notable drop in the number of respondents who saw these process metrics decline.
For example, those seeing decreased open rates fell from 20% in 2011 to 12% in 2012. Only 11% found click rates dropped (compared with 19% in 2011) and the same number found conversion rates declining (less than half of the 24% who saw decreased conversion rates in 2011).
The improvement seems inevitable, given the pervading theme of this report, which sees email marketing maturing, increased growth in segmentation (see Chart 2.25) and the spread of behavioural email (see Chart 2.13). Benchmarks12 from North America, for example, found trigger emails delivered an average 75.1% higher open rate and 114.8% higher click rate than standard “business as usual” mails.
12. Epsilon (2012) Q3 2012 North America Email Trend Results: More Brands Rely on Triggered Messaging
45%
36%
19%
51%
38%
11%
0%
10%
20%
30%
40%
50%
60%
70%
80%
90%
100%
Increased Stayed the same Decreased
2011 2012
45%
31%
24%
53%
36%
11%
0%
10%
20%
30%
40%
50%
60%
70%
80%
90%
100%
Increased Stayed the same Decreased
2011 2012

COPYRIGHT: THE DIRECT MARKETING ASSOCIATION (UK) LTD 2013
NATIONAL CLIENT EMAIL REPORT 2013
19
2.15 Metrics - predictions
Respondents are even more optimistic about their future metrics than they were in the previous National client email report.
Some 59% expect open rates to increase, 68% expect click rates to increase and a mammoth 73% expect conversion rates to increase. This is despite the perceived rise in email marketing constraints (see Chart 2.5).
How do you expect the following to trend in the next 12 months?
Open rates
Click rates
Conversion rates
57%
28%
15%
68%
25%
7%
0%
10%
20%
30%
40%
50%
60%
70%
80%
90%
100%
Increase Stay the same Decrease
2011 2012
56%
30%
14%
73%
20%
7%
0%
10%
20%
30%
40%
50%
60%
70%
80% 90%
100%
Increase Stay the same Decrease
2011 2012
53%
29%
18%
59%
31%
10%
0%
10%
20%
30%
40%
50%
60%
70%
80%
90%
100%
Increase Stay the same Decrease
2011 2012

COPYRIGHT: THE DIRECT MARKETING ASSOCIATION (UK) LTD 2013
NATIONAL CLIENT EMAIL REPORT 2013
20
The greater optimism about conversion rates suggests the focus is shifting towards the more important end of the email conversion chain and away from open rates. This optimism also likely reflects continued growth in trigger/behavioural emails and segmentation, both of which ensure better matching and timing of offers and content to recipient needs. Survey respondents may also be expecting to better adapt to mobile email.
The accelerated spread of mobile email brings changes to reading behaviour. For example, the share of email opens occurring on mobile devices peaks in the evening, late at night and in the early morning13. A key change is also to the range of available email display environments, with smaller screen sizes beginning to dominate. Until recently, many marketers assumed HTML email-friendly smartphones and tablets would deal adequately with emails designed for the desktop. While true, there is now growing realisation that adapting emails to account for mobile email use simply leads to higher responses14.
As such, marketers are beginning to invest in responsive email design, where email layouts adapt on-the-fly to the properties of the screen they are viewed on. In particular, marketers need to make sure their email links account for people using fingers and thumbs on touchscreens. For example:
• Links need to look like links: a mouse cursor changes shape to alert the user to the availability of a link. Fingers don’t change shape when hovering over links, so there are no visual cues other than those built into the email’s design.
• Links need spacing out so clumsy prodding still allows accurate “clicking”. Apple recommends a block of around 44 x 44 points for each link.
Marketers should also consider how email content and offers might exploit the fact that more messages are now carried around by recipients, and are not left behind on desktop computers at home or in the office.
2.16 Satisfaction with email programmes
Respondent satisfaction with their email marketing programmes is largely unchanged from 2011. A majority (61%) are either “satisfied” or “very satisfied” and only 20% are “unsatisfied” or “very unsatisfied”. Given the very strong returns from email marketing and improvements in metrics (both historical and predicted), it’s perhaps surprising that satisfaction levels are not higher than in 2011. There are two explanations:
1. The strong performance is counterbalanced by growing concerns and constraints.
2. As marketers become more competent and educated, their expectations rise and they can better perceive the difficulties, challenges and frustrations preventing them from turning knowledge and potential into bottom line results.
How satisfied are you with your email marketing programme in relation to meeting your marketing goals?
13. Knotice (2012) Mobile Email Opens Report 1st Half of 201214. See, for example, StyleCampaign (2011) Media query trifecta
18%
44%
16%
20%
2%
16%
45%
19% 18%
2% 0%
10%
20%
30%
40%
50%
60%
70%
80%
90%
100%
2011
2012

COPYRIGHT: THE DIRECT MARKETING ASSOCIATION (UK) LTD 2013
NATIONAL CLIENT EMAIL REPORT 2013
21
2.17 Email marketing concerns
The increased focus on click and conversion rates suggested in Section 2.15 is backed up by the factors respondents consider most important to achieving business goals: the same two metrics top the list, both cited by 63% of marketers.
In general, there is far greater focus on all factors in email marketing than in 2011, reinforcing the impression of a more enlightened industry that is aware of the challenges and constraints (but well-placed to meet them, as indicated by performance results and metrics predictions).
The two biggest percentage changes in importance were to content (rated important by 110% more respondents than in 2011) and data (+87%). This is no surprise, given the continuing resurgence in interest in content marketing across 2012 and the growth of trigger/behavioural emails: the latter is only possible given the right data.
Marketers often assume content marketing means authoring new and expensive content. This need not be the case.
Much content can be repurposed from other channels, for example from blog posts, social network photos and event reports, FAQ and support documents, or existing product and marketing literature. Surveys, interviews and social network conversations can also produce content which has the added advantage of coming direct from customers and prospects (and thereby resonating well with the same audience).
Thinking about the following factors, which of them are most important to you in helping you achieve your business goals?
68%
60% 63% 69%
63%
43% 48%
28%
39% 38%
63% 63% 59%
55% 53%
0%
10%
20%
30%
40%
50%
60%
70%
80%
90%
100%
Click rates Conversion rates
Content Deliverability Open rates
2010 2011 2012
61% 66% 63%
51%
36% 31%
23%
34%
18%
6%
50% 43%
36%
23% 17%
0%
10%
20%
30%
40%
50%
60%
70%
80%
90%
100%
Return on investment
Data Reputation Opt out rates Resources
2010 2011 2012

COPYRIGHT: THE DIRECT MARKETING ASSOCIATION (UK) LTD 2013
NATIONAL CLIENT EMAIL REPORT 2013
22
2.18 Email marketing competence
There were no huge shifts in perceived email marketing competence. What we’re beginning to see, however, is some progression up the initial learning curve, with slightly more marketers comfortable with at least the basics.
How would you rate your company’s overall level of competence in email marketing?
We might also expect to see a gradual rise in those with an advanced level of competence, but this is not the case. Why?
Chart 2.19 shows the main sources of email marketing education and most of these are, by definition, unable to deliver detailed insights on complex issues or tackle the unique situations and needs of individual marketers.
While the industry does a solid job of general education, there is a need for more customised, advanced training opportunities.
These might be provided through ESPs, agencies and consultants. Alternatively, ESPs and software manufacturers can continue working to ensure advanced tools and integrations are as user-friendly as possible, reducing the need for advanced knowledge in the first place.
2.19 Email marketing education
One of the themes of this report is the contrast between growing marketer constraints and concerns, and the increased performance and high returns through email marketing. As such, marketers are doing a remarkably good job of improving results while the environment for them to work in remains difficult.
Another reason marketers may be doing more with less is through a better understanding of optimisation and email practices. Certainly the below chart shows marketers draw on far more sources of insight and advice than in 2011, even if their self-reported level of competence hasn’t changed much.
As in 2011, industry email newsletters, blogs and webinars were the top three sources of information in 2012, with each growing significantly in relevance.
40%
30%
24%
2%
39%
33%
20%
6%
2%
0%
10%
20%
30%
40%
50%
60%
70%
80%
90%
100%
Advanced: would be able to take advantage
of modern tools and tactics
Very comfortable with the essentials
Basic, still feeling our way
Only just startedout
None at all
2011
2012
4%

COPYRIGHT: THE DIRECT MARKETING ASSOCIATION (UK) LTD 2013
NATIONAL CLIENT EMAIL REPORT 2013
23
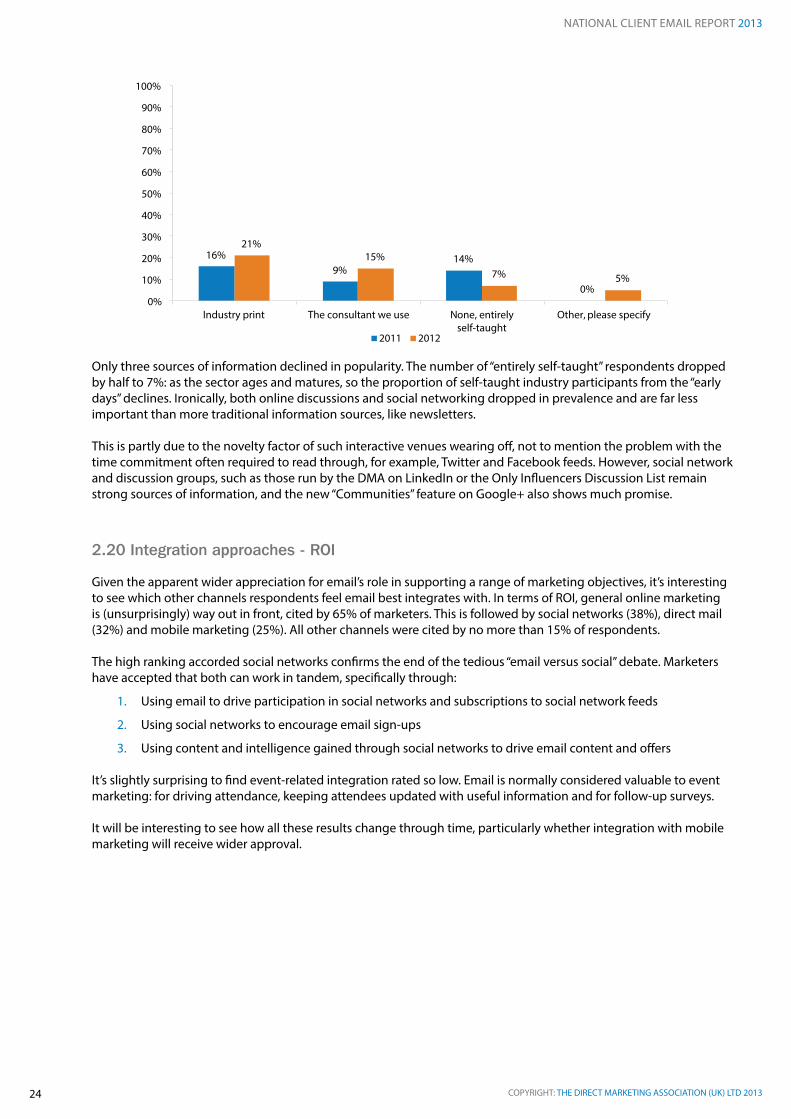
Recognition of tradeshows saw the biggest percentage leap, with over twice as many respondents getting their education from such events in 2011 than in 2012. Is there a lesson there for marketers at ESPs and other organisations serving the email marketing community?
Where do you get your email marketing education from?
61%
54%
37%
35%
26%
80%
61%
48%
46%
44%
0%
10%
20%
30%
40%
50%
60%
70%
80%
90%
100%
Industry email newsletters
Industry blogs Industry webinars and
online presentations The ESP we use Industry vendor
websites and white papers
2011
2012
0%
10%
20%
30%
40%
50%
60%
70%
80%
90%
100%
20%
30%
11%
29%
19%
28%
27%
25%
23% 23%
events (workshops, seminars, conferences)
Industry online discussions
Tradeshows Communication with
other marketers through social
networks
Direct exchange with
other marketers through instant
messaging, phone,face to face
2011
2012
COPYRIGHT: THE DIRECT MARKETING ASSOCIATION (UK) LTD 2013
NATIONAL CLIENT EMAIL REPORT 2013
24
Only three sources of information declined in popularity. The number of “entirely self-taught” respondents dropped by half to 7%: as the sector ages and matures, so the proportion of self-taught industry participants from the “early days” declines. Ironically, both online discussions and social networking dropped in prevalence and are far less important than more traditional information sources, like newsletters.
This is partly due to the novelty factor of such interactive venues wearing off, not to mention the problem with the time commitment often required to read through, for example, Twitter and Facebook feeds. However, social network and discussion groups, such as those run by the DMA on LinkedIn or the Only Influencers Discussion List remain strong sources of information, and the new “Communities” feature on Google+ also shows much promise.
2.20 Integration approaches - ROI
Given the apparent wider appreciation for email’s role in supporting a range of marketing objectives, it’s interesting to see which other channels respondents feel email best integrates with. In terms of ROI, general online marketing is (unsurprisingly) way out in front, cited by 65% of marketers. This is followed by social networks (38%), direct mail (32%) and mobile marketing (25%). All other channels were cited by no more than 15% of respondents.
The high ranking accorded social networks confirms the end of the tedious “email versus social” debate. Marketers have accepted that both can work in tandem, specifically through:
1. Using email to drive participation in social networks and subscriptions to social network feeds
2. Using social networks to encourage email sign-ups
3. Using content and intelligence gained through social networks to drive email content and offers
It’s slightly surprising to find event-related integration rated so low. Email is normally considered valuable to event marketing: for driving attendance, keeping attendees updated with useful information and for follow-up surveys.
It will be interesting to see how all these results change through time, particularly whether integration with mobile marketing will receive wider approval.
16%
9%
14%
0%
21%
15%
7%
5%
0%
10%
20%
30%
40%
50%
60%
70%
80%
90%
100%
Industry print The consultant we use None, entirely self-taught
Other, please specify
2011 2012

COPYRIGHT: THE DIRECT MARKETING ASSOCIATION (UK) LTD 2013
NATIONAL CLIENT EMAIL REPORT 2013
25
Email when integrated with which of the following marketing tactics delivers the best ROI?
2.21 Integration approaches - relationships
Respondent opinions on which channels integrate best with email from a relationship-building perspective differ little from those for ROI. Online marketing and social networks are still the top two, albeit with fewer ‘votes’ than in the ROI chart. The only other big difference is how online fan communities are rated: three times as many respondents claim integration of these with email is good for enduring and profitable relationships than claim the same for fan communities and ROI.
Email when integrated with which of the following marketing tactics delivers creates enduring and profitable customer relationships?
65%
38%
32%
25%
15%
15%
13%
12%
11% 10%
10%
8%
5%
4%
1%
0%
10%
20%
30%
40%
50%
60%
70%
80%
90%
100%
Online m
arketing
Social n
etworking sit
es
Direct
Mobile m
arketing
Print a
ds
Webinars
Telemarketin
g
Public Relatio
ns
Field marketin
g &
experientia
l events
Trade shows
TV ads
Event sponso
rship
Online fa
n communitie
s
Radio
Podcasts
Online m
arketing
Social n
etworking sit
es
Direct
Mobile m
arketing
Print a
ds
Webinars
Telemarketin
g
Public Relatio
ns
Field marketin
g &
experientia
l events
Trade shows
TV ads
Event sponso
rship
Online fa
n communitie
s
Radio
Podcasts
52%
34%
32%
25%
16%
15%
15%
12%
11% 11% 10%
9%
6%
5%
4%
0%
10%
20%
30%
40%
50%
60%
70%
80%
90%
100%

COPYRIGHT: THE DIRECT MARKETING ASSOCIATION (UK) LTD 2013
NATIONAL CLIENT EMAIL REPORT 2013
26
2.22 Contact strategies
The majority of respondents (51%) had a contact strategy in place for the maximum amount of times each address is contacted, up 11% on the 2011 figure.
This development likely reflects growing awareness of the role of frequency in driving response, and its impact on unsubscribes and spam complaints. The need for a contact strategy is also increased by the growth of trigger emails: unlike with broadcast email, different subscribers can get very different amounts of email, depending on their activity and characteristics. If you only send a generic monthly newsletter, a contact strategy is not as critical as when a customer can potentially receive between one and 50 emails a month.
Is there a contact strategy for the maximum amount of times you contact an address (based on time and behaviour)?
2.23 Maximum contact frequencies
Compared with 2011, maximum monthly contact frequencies have risen quite significantly. Only 14% send a maximum of one a month (down from 26% in 2011), while 33% have a maximum of at least six a month (up from just 15% in 2011).
These changes have clearly not affected open, click or conversion rates negatively. DMA benchmark statistics also report unsubscribe rates at long-time lows in 201215.
Of course, these figures refer to maximum, rather than average, frequencies. Those same benchmarks also show actual average contact frequencies (at least for email sent through ESPs) were extremely low in H1 2012, at just under two a month. Nevertheless, higher maximums give senders the flexibility to exploit appropriate opportunities, whether seasonal (such as increased emails during the Christmas shopping season) or behavioural (such as post-purchase email streams).
Recipients, too, benefit from increased frequency, provided the delivered value justifies the increase (as tends to be the case with seasonal and trigger emails).
15. DMA (2013) National email benchmarking report H1 2012
46% 49%
5%
51% 44%
5%
0%
10%
20%
30%
40%
50%
60%
70%
80%
90%
100%
Yes No Don't know
2011
2012

COPYRIGHT: THE DIRECT MARKETING ASSOCIATION (UK) LTD 2013
NATIONAL CLIENT EMAIL REPORT 2013
27
Tolerance for more email may also be higher than typically assumed by marketers, since average consumer inboxes are far less busy than those working in online marketing might think. The DMA’s 2012 Email tracking report16, for example, found around 40% of those who do get brand emails get no more than three such emails a day on average and about 63% get no more than six.
What is the maximum number of times you contact an address on your list in one month?
2.24 List growth
More evidence of growing competence comes from opinion on effective address acquisition sources.
Nearly every potential source was rated higher in 2012 than in 2011, suggesting marketers are getting better at using different techniques to build out their lists.
Organic website traffic was cited most often by respondents (54% - an increase of 64% on the 2011 figure), swapping its 2011 second-place position with transactions (cited by 50%, up 9% on 2011).
Despite this top position, many organisations still do not fully exploit their website as a source of new subscribers. Basic requirements are:
• Ensure subscription forms or links are as prominent and on as many web pages as possible
• Test page positions, multiple positions, formats, colours, button sizes etc. to optimise response
• Ensure opt-in opportunities are built into online transactional processes: not just purchases, but downloads, event registrations etc
• Link to an email policy to reassure those with privacy concerns
• Communicate the benefits of subscribing clearly
• Use subscriber-friendly terminology and test copy, button text and calls to action
16. DMA (2012) Email tracking report 2012
13%
35%
20% 16%
9%
0%
10%
20%
30%
40%
50%
60%
70%
80%
90%
100%
Once 2 – 3 times 4 – 6 times 6 - 8 times More than 8times
Don’t know
7%

COPYRIGHT: THE DIRECT MARKETING ASSOCIATION (UK) LTD 2013
NATIONAL CLIENT EMAIL REPORT 2013
28
Social media remained in third place, despite a small decline from 25% in 2011 to 23% in 2012, one of few techniques that didn’t see increased recognition in 2012. Social media certainly deserves attention as a source of sign-ups, not least because it offers a chance to move consumers from a more conversational channel (social media) to a more conversion-friendly one (email). Opportunities include:
• Telling social network followers about upcoming (exclusive) email offers or newsletter content
• Posting links to the latest email, “best of” emails and email archives
• Posting links to the newsletter sign-up form and copy at the organisation’s website
• Embedding sign-up forms and promotional copy in the organisation’s social network profile pages
• Ensuring subscribers can easily share email offers and content with their own networks, effectively endorsing the email list to their friends, family and colleagues
Which from the following are the most effective methods to acquire new email addresses?
33%
46%
25%
17%
16%
10%
54%
50%
23%
21% 21% 21%
0%
10%
20%
30%
40%
50%
60%
70%
80%
90%
100%
People who transact
Social media
telemarketing Search
2011 2012
14%
8%
12%
0%
7%
17%
10%
18%
16% 16% 16%
15%
14%
0%
0%
10%
20%
30%
40%
50%
60%
70%
80%
90%
100%
Forward to a
friend Banner Website pop-up
or lightbox In-store Email list rental Other
2011 2012

COPYRIGHT: THE DIRECT MARKETING ASSOCIATION (UK) LTD 2013
NATIONAL CLIENT EMAIL REPORT 2013
29
2.25 Segmentation practices
Continuing the “email maturity” theme, one of the more promising developments to emerge from the survey is a clear increase in segmentation. For example, the number of organisations not segmenting at all fell by a quarter from 19% in 2011 to 15% in 2012. In contrast, the number segmenting into more than six different audiences rose 28% from 29% in 2011 to an impressive 37% in 2012.
On average how many different customer segments does your business use to segment your mailings?
11%
38%
15%
7%
19%
34%
18%
29%
0%
15%
27%
20%
37%
1%
0%
10%
20%
30%
40%
50%
60%
70%
80%
90%
100%
Don’t segment our list Don’t Know
2010 2011
2012
29%

NATIONAL CLIENT EMAIL rEpOrT 2013
COpYrIGHT: THE DIrECT MArKETING ASSOCIATION (UK) LTD 201330
The charts in this section compare B2C and B2B results. Charts tracking specific annual changes in B2C and B2B results are given in Sections 4 and 5 respectively.
Most results and interpretations match those in the main section or are self-explanatory given the nature of the differences between B2C and B2B email marketing.
For example, B2C organisations dedicate more staff hours to email marketing than B2B organisations, an expected result given the higher frequencies, bigger lists, more advanced tactics typical of B2C senders. The same argument applies to email budget shares, where, for example, 37% of B2C marketers spent 30% or more of their marketing budget on email (the equivalent figure for B2B is 22%).
Selected highlights are:
B2C emailers put at least as much or more emphasis on engagement and retention than their B2B counterparts. This is perhaps surprising, given the traditional role of the B2B newsletter in strengthening customer relationships.
The strong overall role for retention may, of course, stem from the economic difficulties of recent years, where customer loyalty becomes scarcer and more valuable. B2C organisations do, however, place less-than-average emphasis on building brand awareness. Since they tend to email far more often than their B2B colleagues, brand awareness is more likely to be seen as an inevitable side benefit, rather than a main objective that needs working on.
The return generated on email marketing spend by B2B organisations takes more of a U-form than with their B2C equivalents. The majority (56%) of B2B organisations produce under £11 return per £1 spend. However, 22% create a return on the pound of £51 or more. As with the overall results, if we assume the average return for the top category is £55 (it’s likely much higher) then we get an estimated average return across all B2B respondents of £19.09 for each £1 spent on email marketing.
The more even spread in returns in B2C organisations sees 42% returning under £11, 18% more than £50 and an estimated average return of £23.21.
Email marketing is, perhaps unexpectedly, even more important to online B2B sales than to online B2C revenue, with some 49% of B2B respondents seeing email contribute over 40% of total digital revenue, compared with 38% seeing the same result in B2C. This result is mimicked in contributions to total revenue per se, with 29% of B2B organisations seeing email contribute 40% or more to this revenue (21% in B2C).
B2C organisations have been particularly successful at moving beyond generic, broadcast email, with less than 20% of email revenue coming from unsegmented email to the whole list.
Given many retailers have post-purchase email capabilities, there is, however, considerably more scope for developing product lifecycle campaigns, covering such things as purchase and shipping confirmations, review requests, upsells, cross-sells, how-tos, product feature highlights, or introductions to customer service, customer support or social communities.
In light of the importance of email to B2B revenue, there is also a strong argument for B2B emailers to push for more resources and pursue the kind of advanced tactics previously limited to the consumer sector, such as abandonment emails for white paper downloads, lifecycle campaigns for subscription sales and similar. Since welcome emails have value irrespective of industry sector, it’s a little disappointing that only 43% of B2B organisations put this message type to use.
Compared with their B2B colleagues, B2C organisations are unusually optimistic that open, click and conversion rates will increase in the next 12 months. This likely speaks to the huge potential of simple trigger emails, which are more easily implemented by B2C organisations, given they are more likely to have online transactions and the required data. Studies of cart abandonment emails, for example, commonly report huge increases in metrics when compared to “normal” emails. One such study17 found a cart abandonment campaign generating US$17.90 in revenue per email.
17. SeeWhy (2011) Shopping Cart Abandonment Emails Generate $17.90 per Email
3. B2C and B2B results highlights

COPYRIGHT: THE DIRECT MARKETING ASSOCIATION (UK) LTD 2013
NATIONAL CLIENT EMAIL REPORT 2013
31
B2C marketers feel confident about their abilities: 75% are at least very comfortable with the essentials, highlighting the need for more advanced sources of training and education. B2B marketers are, however, more divided in terms of levels of competence. While a solid 43% consider themselves advanced, there are still 28% near the start of the learning curve.
Since much email marketing education focuses on retail, there is perhaps a need for more introductory-level training specifically for the B2B sector. B2B marketers are also less likely than their B2C counterparts to get their education through online or one-to-one discussions. This suggests there would be value in more formal B2B networking opportunities outside the social networks.
Differences in the value of integration of email with other channels follow the usual patterns expected, given the nature of B2B and B2C business. However, the former perceive far more ROI potential in email/mobile marketing integration. This may simply reflect a head start in the field among B2B organisations, given that business users traditionally showed much stronger take up of mobile devices. With the rise of consumer smartphones, the iPad Mini etc., this difference in perceptions may well change in future studies.
Most B2B organisations are not sending much email. For example, 56% never send more than three a month. Again, this leaves a lot of potential for expanding B2B email programmes by applying some of the behavioural and trigger email techniques more popular in B2C.
3.1 Purpose of email marketing
What is the purpose of your email marketing programmes? Which business goals does it help you to achieve?
B2B B2C
3%
64%
59%
64% 67%
77%
6%
53% 57%
71% 73%
78%
0%
10%
20%
30%
40%
50%
60%
70%
80%
90%
100%
Other Brand awareness Acquisition Revenue generation Engagement Retention
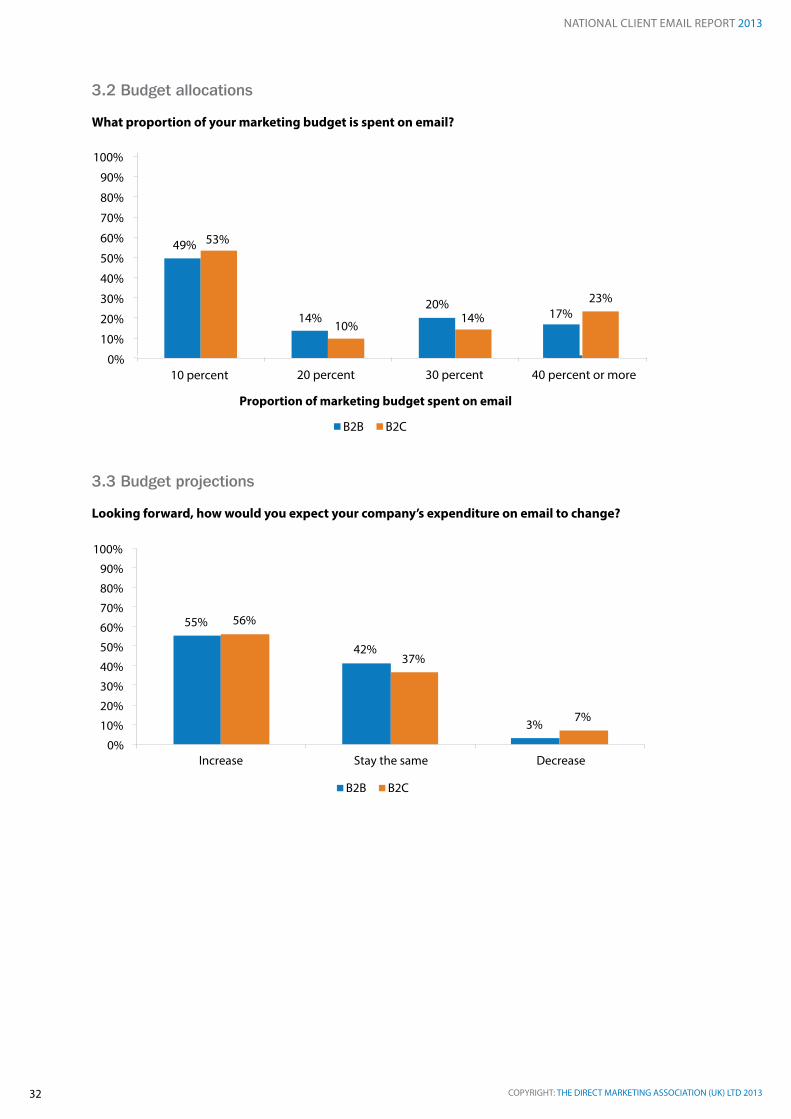
COPYRIGHT: THE DIRECT MARKETING ASSOCIATION (UK) LTD 2013
NATIONAL CLIENT EMAIL REPORT 2013
32
3.2 Budget allocations
What proportion of your marketing budget is spent on email?
3.3 Budget projections
Looking forward, how would you expect your company’s expenditure on email to change?
55%
42%
3%
56%
37%
7%
0%
10%
20%
30%
40%
50% 60% 70%
80%
90%
100%
Increase Stay the same Decrease
B2B B2C
49%
14%
20%
10% 14%
23%
0%
10%
20%
30%
40%
50%
60%
70%
80%
90%
100%
10 percent
Proportion of marketing budget spent on email
B2B B2C
20 percent 30 percent 40 percent or more
53%
17%

COPYRIGHT: THE DIRECT MARKETING ASSOCIATION (UK) LTD 2013
NATIONAL CLIENT EMAIL REPORT 2013
33
3.4 Staff hours
How many staff hours are dedicated to email marketing in an average month?
3.5 Ability to calculate revenue contributions
Are you able to calculate the revenue generated from your email marketing activities?
3.6 ROI
How much is the approximate return you get back for every pound spent on email marketing?
24%
32%
19%
3% 0% 0%
22% 20%
22%
11% 7% 7%
18%
0%
10%
20%
30%
40%
50%
60%
70%
80%
90%
100%
£1 - £5 £6 - £10 £11 - £20 £21 - £30 £31 - £40 £41 - £50 More than £51
B2B B2C
62%
11% 11% 10% 6%
30%
18% 21% 21% 10%
0% 10% 20% 30% 40% 50% 60% 70% 80% 90%
100%
0 - 30 31 - 90 91 - 180 181 - 360 361 +
B2B B2C
59%
38%
3%
61%
9%
0% 10% 20% 30% 40% 50% 60% 70%
80%
90%
100%
Yes No Don't know
B2B B2C
30%
15%

COPYRIGHT: THE DIRECT MARKETING ASSOCIATION (UK) LTD 2013
NATIONAL CLIENT EMAIL REPORT 2013
34
26%
9%
15%
12%
15%
22% 28%
13%
21%
7%
11% 20%
0%
10%
20%
30% 40% 50%
60%
70%
80%
90%
100%
10 percent 20 percent 30 percent 40 percent 50 percent 60 percent or more
Proportion of email revenue to total digital revenue
B2B B2C
48%
11% 12%
29%
45%
15%
18%
21%
0%
10%
20%
30%
40%
50% 60%
70%
80%
90%
100%
10 percent 20 percent 30 percent 40 percent or more
Proportion of email revenue to total revenue
B2B B2C
3.7 Digital revenue contribution
What does email contribute overall to the business as percentage of DIGITAL business revenue?
3.8 Overall revenue contribution
What does email contribute overall to the business as percentage of TOTAL business revenue?
3.9 Revenue contributions of different email approaches
What percentage of your email revenue comes from the following types of emails?
28% 27% 28%
9% 8%
19% 24%
32%
16% 9%
0%
10%
20%
30%
40%
50%
60%
70%
80%
90%
100%
Unsegmented email to whole list
Segmented email to whole list
Activity-based triggers
Lifecycle-based triggers
B2B B2C
27%
16%

COPYRIGHT: THE DIRECT MARKETING ASSOCIATION (UK) LTD 2013
NATIONAL CLIENT EMAIL REPORT 2013
35
3.10 Popularity of different types of email message
What type of email message helps you to achieve your business goals?
25%
31%
37%
21%
43%
75%
30%
36%
37%
38%
62%
63%
0%
10%
20%
30%
40%
50%
60%
70%
80%
90%
100%
Thank you message
Customer survey
Regular newslettersegmented based
on purchase habits
Welcome message
Regular
newsletter
B2B B2C
4%
11% 7%
9%
12%
2%
3%
8%
9%
12%
0%
10%
20%
30%
40%
50%
60%
70%
80%
90%
100%
Warranty renewal
Product replenishment
B2B B2C
11% 9%
31%
12%
17%
16%
19%
20%
27%
28%
0%
10%
20%
30%
40%
50%
60%
70%
80%
90%
100%
Abandonedcart
Alert breaking news
Win-back
targeting lapsed
B2B B2C

COPYRIGHT: THE DIRECT MARKETING ASSOCIATION (UK) LTD 2013
NATIONAL CLIENT EMAIL REPORT 2013
36
3.11 Metrics - trends
How have the following trended over the past 12 months?
Open rates
Click rates
Conversion rates
47%
12%
55%
32%
13%
0%
10%
20%
30%
40%
50%
60%
70%
80%
90%
100%
Increased Stayed the same Decreased
B2B B2C
53%
38%
48%
37%
15%
0%
10%
20%
30%
40%
50%
60%
70% 80%
90%
100%
Increased Stayed the same Decreased
B2B B2C
57%
35%
8%
50%
37%
13%
0%
10%
20%
30%
40% 50%
60%
70%
80%
90%
100%
Increased Stayed the same Decreased
B2B B2C
41%
9%

COPYRIGHT: THE DIRECT MARKETING ASSOCIATION (UK) LTD 2013
NATIONAL CLIENT EMAIL REPORT 2013
37
3.12 Metrics - predictions
How do you expect the following to trend in the next 12 months?
Open rates
Click rates
Conversion rates
67%
25%
8%
79%
16%
5%
0%
10% 20% 30% 40% 50% 60% 70% 80% 90%
100%
Increased Stayed the same Decreased
B2B B2C
52%
38%
10%
66%
24%
10%
0%
10%
20%
30%
40%
50%
60% 70%
80%
90%
100%
Increased Stayed the same Decreased
B2B
B2C
62%
32%
7%
74%
19%
6%
0%
10% 20% 30% 40% 50% 60% 70% 80% 90%
100%
Increased Stayed the same Decreased
B2B B2C

COPYRIGHT: THE DIRECT MARKETING ASSOCIATION (UK) LTD 2013
NATIONAL CLIENT EMAIL REPORT 2013
38
3.13 Email marketing competence
How would you rate your company’s overall level of competence in email marketing?
3.14 Email marketing education
Where do you get your email marketing education from?
28%
22%
25%
45%
38%
52%
62%
77%
21%
32%
31%
44%
53%
45%
60%
82%
0%
10%
20%
30%
40%
50%
60%
70%
80%
90%
100%
Tradeshows Industry onlinediscussions
Industry vendorwebsites and
white papers
The ESP we use Industry webinarsand online
presentations
Industry blogs
Industry emailnewsletters
B2B B2C
2%
7%
13%
23% 23%
17%
8% 8 % 16%
19%
23%
29%
0%
10%
20%
30%
40%
50%
60%
70%
80%
90%
100%
Other, please specify None, entirely
self-taughtThe consultant
we use Industry print Communication with
other marketers through social networks
Direct exchange with other marketers through
instant messaging, phone, face to face
B2B B2C
36%
25%
23%
5%
40%
18%
6%
0%
0%
60%
70%
80%
90%
100%
Advanced: would be able to take advantage of modern
tools and tactics
Very comfortable with the essentials
Basic, still feeling our way
Only just started out
None at all
B2B B2C
43%
10%
20%
30%
40%
50%
4%

COPYRIGHT: THE DIRECT MARKETING ASSOCIATION (UK) LTD 2013
NATIONAL CLIENT EMAIL REPORT 2013
39
3.15 Integration approaches - ROI
Email when integrated with which of the following marketing tactics delivers the best ROI?
3.16 Integration approaches - relationships
Email when integrated with which of the following marketing tactics delivers creates enduring and profitable customer relationships?
8%
13%
21%
14%
25%
19%
37%
51%
15%
16%
10%
18%
25%
45%
31%
52%
0%
10%
20%
30%
40%
50%
60%
70%
80%
90%
100%
Public Relations Online fancommunities
Webinars Print ads Mobile marketing Direct mail Social networkingsites
Online marketing
B2B B2C
11%
5%
13%
29%
40%
24%
57%
12% 15% 16%
21%
37% 39%
72%
0%
10%
20%
30%
40%
50%
60%
70%
80%
90%
100%
Public Relations TV ads Print ads Mobile marketing Social networking sites
Direct mail Online marketing
B2B B2C
2%
19% 24%
3%
11% 5%
24%
13%
0% 1% 3% 4% 4% 6% 7% 9%
0%
10%
20%
30%
40%
50%
60%
70%
80%
90%
100%
Podcasts Trade shows
Telemarketing Radio Event sponsorship
Online fancommunities
Webinars Field marketing &experiential events
B2B B2C
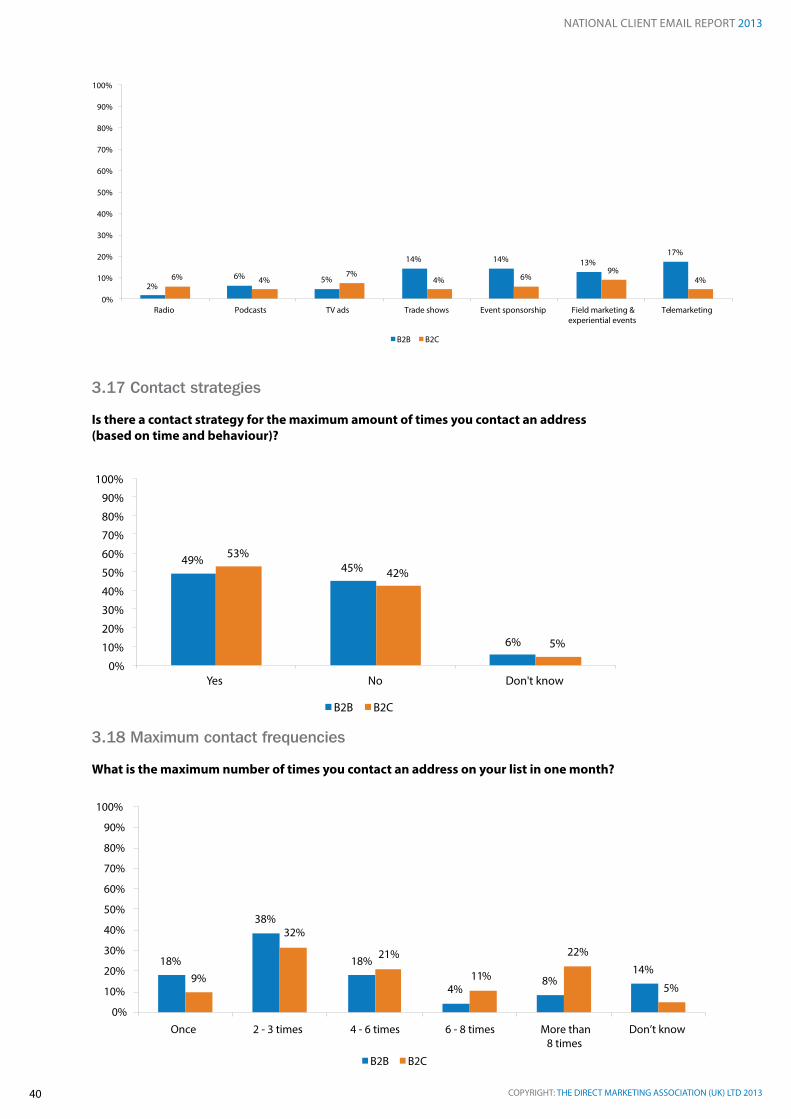
COPYRIGHT: THE DIRECT MARKETING ASSOCIATION (UK) LTD 2013
NATIONAL CLIENT EMAIL REPORT 2013
40
3.17 Contact strategies
Is there a contact strategy for the maximum amount of times you contact an address (based on time and behaviour)?
3.18 Maximum contact frequencies
What is the maximum number of times you contact an address on your list in one month?
2%
6% 5%
14% 14%
13%
17%
6% 4%
7% 4%
6%
9% 4%
0%
10%
20%
30%
40%
50%
60%
70%
80%
90%
100%
Radio Podcasts TV ads Trade shows Event sponsorship Field marketing &experiential events
Telemarketing
B2B B2C
20%
30%
49% 45%
53%
42%
5%
0%
10%
40%
50%
60%
70%
80%
90%
100%
Yes No Don't know
B2B B2C
18%
38%
18%
4% 8%
14%
9%
32%
21%
11%
22%
5%
0%
10%
20%
30%
40%
50%
60%
70%
80%
90%
100%
Once 2 - 3 times 4 - 6 times 6 - 8 times More than8 times
Don’t know
B2B B2C
6%

NATIONAL CLIENT EMAIL rEpOrT 2013
COpYrIGHT: THE DIrECT MArKETING ASSOCIATION (UK) LTD 201341
Charts specifically tracking the 2011-2012 changes in B2C results are presented below.
Selected highlights contrasting with the overall results are:
• Although the number of B2C respondents rating email as “important” or “very important” increased in 2012 (to 86% from 82% in 2011), there was also a negative shift in perceptions, with far more of these respondents choosing the “important” ranking. This likely reflects a change in relative, rather than absolute, importance, given the wider range of channels employed by B2C organisations, who have been particularly proactive in uptake of, for example, social marketing
• As with the overall results, most constraints have increased in importance, though “lack of senior support” is a notable exception. The inevitable budget and resource problems associated with a weak economy are even more important here. The highest increase in importance compared with 2011, however, is a lack of data, with 366% more respondents citing it as a problem. In a way this is a heartening result, since it suggests B2C marketers are aware of the important role of data in driving more advanced applications of email marketing, particularly behavioural and lifecycle email approaches
• B2C organisations have made particularly strong progress in segmentation, with over four in 10 such organisations using more than six segments on an average email campaign
4.1 Importance of email marketing within organisations
How important is email marketing within your business strategically?
4. B2C results – annual comparisons
61%
21%
9% 9% 0%
48%
38%
2%
1%
0% 10% 20% 30% 40% 50% 60% 70% 80% 90%
100%
Very important Important Neither importantor unimportant
Unimportant Very unimportant
2011
2012
11%

COPYRIGHT: THE DIRECT MARKETING ASSOCIATION (UK) LTD 2013
NATIONAL CLIENT EMAIL REPORT 2013
42
4.2 Constraints
Which of the following stop you from achieving your marketing goals?
4.3 Email marketing management
How do you manage your email marketing programme?
Lack of i
nterdepartm
ental/
geographical c
ommunicatio
n
ESP tech
nology
Lack of C
oncept
Senior support
Internal p
roce
ss
In-house
tech
nology
Budget
Internal re
source
s
Lack of D
ata
Degradation
2011
2012
6%
15%
6%
6%
27%
21%
6%
33%
21%
39%
3%
7%
10% 12%
22%
27%
28%
33%
42%
60%
0%
10%
20%
30%
40%
50%
60%
70%
80%
90%
100%
8%
11%
81%
13% 6%
81%
0%
10%
20%
30%
40%
50%
60%
70%
80%
90%
100%
Outsource it to an agency Outsource it to an ESP In-house
2011
2012

COPYRIGHT: THE DIRECT MARKETING ASSOCIATION (UK) LTD 2013
NATIONAL CLIENT EMAIL REPORT 2013
43
4.4 Satisfaction with email programmes
How satisfied are you with your email marketing programme in relation to meeting your marketing goals?
4.5 Email marketing concerns
Thinking about the following factors, which of them are most important to you in helping you achieve your business goals?
Click rates Content Conversionrates
Data Deliverability Open rates Opt out rates
Reputation Resources Return on investment
45%
15%
55%
18%
39%
30%
12%
24%
3%
33%
62%
58%
67%
47%
58%
56%
30%
36%
17%
53%
0%
10%
20%
30%
40%
50%
60%
70%
80%
90%
100%
2011
2012
13%
37%
19% 28%
3%
8%
48%
22% 20%
2%
0%
10% 20% 30% 40% 50% 60% 70% 80% 90%
100%
2011
2012

COPYRIGHT: THE DIRECT MARKETING ASSOCIATION (UK) LTD 2013
NATIONAL CLIENT EMAIL REPORT 2013
44
4.6 List growth
Which from the following are the most effective methods to acquire new email addresses?
4.7 Segmentation practices
On average how many different customer segments does your business use to segment your mailings?
Don’t segment our list
Don’t Know
21%
30%
15%
0%
13%
25%
18%
42%
2%
0%
10%
20%
30%
40%
50%
60%
70%
80%
90%
100%
2011
2012
Website pop-u
p or lightb
ox
People who tr
ansact
6%
1%
2% 2 % 3% 3% 0% 0%
6%
2%
11%
5%
9%
13%
15% 15% 15%
16%
18%
21%
22%
24%
52%
54%
0%
10%
20%
30%
40%
50%
60%
70%
80%
90%
100%
Email list
rental
Forward
to a fri
end
Search
Banner
In-store
Social m
edia
2011 2012
34%

NATIONAL CLIENT EMAIL rEpOrT 2013
COpYrIGHT: THE DIrECT MArKETING ASSOCIATION (UK) LTD 201345
Charts specifically tracking the 2011-2012 changes in B2B results are presented below.
Selected highlights contrasting with the overall results are:
• The importance of email remains high with B2B organisations, with 92% declaring it “important” or “very important”. In contrast to B2C marketers, however, there is a strong positive shift in focus, with 36% more respondents citing email as “very important” than in 2011. This may reflect the relatively low costs of email, when compared with direct mail, display advertising and event marketing in a time of budget constraint. It may also reflect recognition of email’s importance to revenues (see Sections 3.10 and 3.11) and its longer-term role in building relationships, lead nurturing and influencing sales cycles.
• The broad trend to more in-house email operations is particularly strong among B2B organisations, with a full 97% now managing at least some email marketing in-house. The process, driven by the factors outlined in Section 2.6, is made easier than in B2C, since B2B email may often involve a basic content-based newsletter, fewer advanced tactics, less frequent sends and less sophisticated use of data. This may change in the future with growing interest in, for example, automated lead nurturing programmes and import of traditional advanced B2C tactics to the B2B environment.
5.1 Importance of email marketing within organisations
How important is email marketing within your business strategically?
5. B2B results – annual comparisons
50%
3% 3%
68%
24%
8%
0%
0%
10%
20%
30%
40%
50%
60%
70%
80% 90%
100%
Very important Important Neither important or unimportant
2011
2012
Unimportant
44%

COPYRIGHT: THE DIRECT MARKETING ASSOCIATION (UK) LTD 2013
NATIONAL CLIENT EMAIL REPORT 2013
46
5.2 Constraints
Which of the following stop you from achieving your marketing goals?
5.3 Email marketing management
How do you manage your email marketing programme?
Lack of i
nterdepartmental/
geographical co
mmunicatio
n
ESP tech
nology
Lack of C
oncept
Senior support
Internal proce
ss
In-house te
chnology
Budget
Internal reso
urces
Lack of D
ata
Degradation
2011
2012
14%
5%
9% 9% 12%
19%
19%
17%
24%
33%
3%
13%
14%
16%
19%
25%
27%
30% 33%
48%
0%
10%
20%
30%
40%
50%
60%
70%
80%
90%
100%
13% 13%
74%
18% 11%
71%
0%
10%
20%
30%
40%
50%
60%
70%
80%
90% 100%
Outsource it to an agency Outsource it to an ESP In-house
2011 2012

COPYRIGHT: THE DIRECT MARKETING ASSOCIATION (UK) LTD 2013
NATIONAL CLIENT EMAIL REPORT 2013
47
5.4 Satisfaction with email programmes
How satisfied are you with your email marketing programme in relation to meeting your marketing goals?
5.5 Email marketing concerns
Thinking about the following factors, which of them are most important to you in helping you achieve your business goals?
40%
34%
36%
19%
26%
36%
10%
29%
5%
21%
64% 60%
59%
40%
52% 51%
15%
36%
16%
47%
0%
10%
20%
30%
40%
50%
60%
70%
80%
90%
100%
Click rates Content Conversionrates
Data Deliverability Open rates Opt out rates
Reputation Resources Return on investment
2011
2012
23%
39%
21% 17%
0%
25% 16% 16%
1% 0%
10%
20%
30%
40%
50%
60%
70%
80%
90%
100%
2011 2012
42%

COPYRIGHT: THE DIRECT MARKETING ASSOCIATION (UK) LTD 2013
NATIONAL CLIENT EMAIL REPORT 2013
48
5.6 List growth
Which from the following are the most effective methods to acquire new email addresses?
5.7 Segmentation practices
On average how many different customer segments does your business use to segment your mailings?
29%
33%
20%
18%
0%
16%
30%
22%
32%
0%
0%
10%
20%
30%
40%
50%
60%
70%
80%
90%
100%
Don’t segment our list
Don’t Know
2011
2012
0%
2%
4%
2%
8%
7% 7%
13%
2%
10%
20%
12%
11% 13%
16%
17%
19% 19%
22% 22%
27%
29%
48%
54%
Website pop-u
p or lightb
ox
Social m
edia
Search
People who tr
ansact
2011
2012
0%
10%
20%
30%
40%
50%
60%
70%
80%
90%
100%
Email list
rental
Forward
to a fri
end
Banner
In-store
NATIONAL CLIENT EMAIL rEpOrT 2013
COpYrIGHT: THE DIrECT MArKETING ASSOCIATION (UK) LTD 201349
The National client email report is an initiative undertaken by the DMA ’s Email Marketing Council and, more specifically, the Email Benchmarking Hub, to complement the National Email Benchmarking Report which is produced on a half-yearly basis. This was conducted during October, November and December 2012 via a survey that was hosted online. This was promoted on the DMA home page and via various ESPs who supported the companion report. A link to the survey was also added to some, relevant DMA members’ weekly newsletters, social networks and websites. Therefore, both DMA members and non-members were surveyed, and a good cross section of company types and sizes covering a range of geographic locations were reached. The data was collated and analysed by the DMA’s research department and sent to the report writer. The analysis was checked through for any discrepancies and the report proof read by the members of the Benchmarking Hub of the DMA’s Email Marketing Council. The report was designed in-house by the DMA’s design team. The survey consisted of both qualitative and quantitative question types in order to get valuable information that would be useful to both client companies using email marketing and providers of email marketing related products and services. The questions were reviewed in 2012 to ensure they were up-to-date and reflected the current market scenario. There was a good response to the survey with 231 respondents. There was a good mixture of both B2B and B2C respondents surveyed, with slightly higher number of B2B organisations or those that serve both B2B and B2C.
Methodology

NATIONAL CLIENT EMAIL rEpOrT 2013
COpYrIGHT: THE DIrECT MArKETING ASSOCIATION (UK) LTD 201350
Definitions were provided to participants to decrease the risk of different ESPs providing responses based on a differing understanding. For the purposes of this piece of research the following definitions are used throughout.
Acquisition: Any activity where the reason for sending the email is to acquire a new customer. This includes any list rental from cold or prospect lists, and list trades or swaps with partners or affiliates. Does not include emails sent to existing customers where trying to up-sell or cross-sell.
Average: Unless otherwise stated, this refers to the mean.
Hard bounce rate: Where the recipient does not see the email due to invalid email addresses, domain failure, ISP blocked etc.
Average hard bounce rate: The number of hard bounces divided by the number of emails delivered (in %).
Soft bounce: Where the email address is valid but the recipient does not see the email because of a temporary delivery problem, inbox full, server down etc.
Average soft bounce rate: The number of soft bounces divided by the number of emails delivered (in %).
Average total click-through rate: Number of total clicks divided by number of emails delivered (in %).
Average unique click-through rate: Number of individuals who have clicked through divided by number of emails delivered (in %).
Deliverability: Volume of emails sent less the number of bounces received.
Dynamic content: Content that is chosen by the system when the email is being created based on the recipient’s attributes stored in the database.
Error codes rolled up across campaign (transmission): Counts of individual error codes aggregated at the campaign level.
Error codes rolled up across domain: Counts of individual error codes aggregated at the domain level over a period of time or a number of campaigns.
Individual error codes: SMTP codes returned when emails are rejected.
Mean: The total of n figures divided by n. This is typically referred to as the average. For example, if the data is 2, 1, 1, 3, 8; the mean is (2+1+1+3+8)/5 = 3.
Average unique open rate: Unique opens divided by number of emails delivered (in %).
Opt-out: When a recipient unsubscribes or opts-out of further communications.
Response rate: The number of actual responses made as a result of the email campaign, expressed as a percentage of the overall total email volumes and irrespective of take-up.
Glossary of terms

NATIONAL CLIENT EMAIL rEpOrT 2013
COpYrIGHT: THE DIrECT MArKETING ASSOCIATION (UK) LTD 201351
The Direct Marketing Association (DMA) is Europe’s largest professional body representing the direct marketing industry. With a large in-house team of specialists offering everything from free legal advice and government lobbying on direct marketing issues to research papers and best practice, it is always at the forefront of developments in the industry.
The DMA protects the direct marketing industry and consumers. It promotes the highest standards through self-regulation and lobbies against over-regulation. The DM Code of Practice sits at the heart of everything we do – and all members are required to adhere to it. It sets out the industry’s standards of ethical conduct and best practice.
Our 16 DMA Councils cover the whole marketing spectrum – from the digital world of social media and mobile marketing to the ‘real’ world channels of door drops and inserts. The Councils are made up of DMA members and regularly produce best practice and how to guides for our members.
We also have a packed calendar of conferences, workshops and discussions on the latest topics and best practice, and 80% of them are free for members and their staff.
As the industry moves on so do we, which is why we’ve recently launched a number of new services for our members – a VAT helpline, a Social Media Helpdesk and an IP Protection Service.
Visit www.dma.org.uk regularly to keep up to date with all our services.
About the DMA
NATIONAL CLIENT EMAIL rEpOrT 2013
COpYrIGHT: THE DIrECT MArKETING ASSOCIATION (UK) LTD 201352
Established in 2001, Alchemy Worx is the world’s largest email marketing agency. With over 70 employees and offices in London and Atlanta, it uses hyper-specialization techniques to deliver both simple and highly complex life-cycle based email programmes faster and more cost effectively.
Alchemy Worx provides strategy, design, content, testing, inbox placement and detailed post campaign analysis to many big-name Brands; including Sony, Skype, Getty Images and Hilton Hotels.
Learn more about our hyper-specialized team here. You can also find techniques that generate real value for your email marketing programs by subscribing to Email Worx here and following us on Twitter.
About Alchemy Worx

NATIONAL CLIENT EMAIL rEpOrT 2013
COpYrIGHT: THE DIrECT MArKETING ASSOCIATION (UK) LTD 201353
The National client email report 2013 is published by The Direct Marketing Association (UK) Ltd Copyright © Direct Marketing Association. All rights reserved. No part of this publication may be reproduced, copied or transmitted in any form or by any means, or stored in a retrieval system of any nature, without the prior permission of the DMA (UK) Ltd except as permitted by the provisions of the Copyright, Designs and Patents Act 1988 and related legislation. Application for permission to reproduce all or part of the Copyright material shall be made to the DMA (UK) Ltd, DMA House, 70 Margaret Street, London, W1W 8SS.
Although the greatest care has been taken in the preparation and compilation of the National client email report 2013, no liability or responsibility of any kind (to extent permitted by law), including responsibility for negligence is accepted by the DMA, its servants or agents. All information gathered is believed correct at February 2013. All corrections should be sent to the DMA for future editions.
Copyright and disclaimer