national clean energy summit ppt
TRANSCRIPT

Tuesday, August 19th, 2008
Pilot Projects
Replaced 14,000 Light Fixtures in Resort Garages
Installed Variable Frequency Drives In Resort Central Plants
Savings - More Than $5 Million & 50 Million kWh
ENERGY & ENVIRONMENTAL RESOURCE

ENERGY SAVINGS AT CITYCENTER
Energy Savings = Annual Equivalent of 7,700 HomesAverage Energy Performance 27% Beyond CodeCo-Gen Plant Generates Nearly 1/3 CityCenter’s Power50% Improvement in Lighting Energy Consumption

ADVANCING THE MARKETPLACE
90% of All Construction Waste Through Evergreen Recycling

ADVANCING THE MARKETPLACE
Requiring High Design From Low Flow Fixtures

ADVANCING THE MARKETPLACE
Building Trades, Distributors, Craftsmen, Designers Learning Sustainable Methods at CityCenter

ADVANCING THE MARKETPLACE
Applying What We Learned at Our Own Resorts

EXCALIBUR
Implemented Cardboard Recycling Program & Cut Waste Removal Cost in Half

MANDALAY BAY
Convention Center Recycles 74% of All Waste From Trade Shows

MGM GRAND LAS VEGAS
Saved 2.6 Million kWh Over 12 Months From Installing Compact Fluorescent Lighting in The Parking Garage

CIRCUS CIRCUS
Cut Power Consumption 75% on The Iconic Marquee by Installing Cold Cathode Technology

THE MIRAGE
The Central Plant Has Saved 2.3 Million kWh Over a Three Month Period This Year - Enough to Power 200 Homes

Increasing the Energy and Carbon Productivity of the U.S. Economy
Jon Creyts, Principal, McKinsey & Company
August 19, 2008

U.S. GHG emissions increasing at a time when reductions targeted
2005 emissions
Expected growth
Base case
Projected GHG emissions
Gigatons CO2e
2.5
Reductions implied in proposed legislation
1990-level emissions 1990 level
less 27%
2030 emissions
-3.5-5.2
4.5
6.2
9.7
7.2

15
3.0 to 4.5 gigatons of GHG reduction possible with concerted action
-110
1.0 1.2 1.4
-50
1.8 2.00.2 2.2 2.4 2.6 2.8 3.0 3.20.4 0.80
-40
0.6-20-10 1.6
10
4050
7080
100
20
-100
-70-80
30
60
90
-120
-30
-60
-90
-230
Residential electronics
Commercial electronics
Residential buildings - Lighting
Fuel economy packages – Cars
Cellulosicbiofuels
Industry – Combined heat and power
Conservation tillage
Fuel economy packages – Light trucks
Coal mining – Methane mgmt
Nuclear new-build
Natural gas and petroleum systems mgmt
Afforestation of pastureland
Reforestation
Winter cover crops
Coal power plants – CCS new builds with EOR
Biomass power – Cofiring
Industry – CCS new builds on carbon-intensive processes
Coal-to-gas shift – dispatch of existing plants
Car hybridi-zation
Commercial buildings – HVAC equipment efficiency
Residential buildings – HVAC equipment efficiency
Industrial process improve-ments
Manufac-turing – HFCs mgmt
Distributed solar PV
Commercial buildings – New shell improvements
Abatement costs <$50/ton
PotentialGigatons/year
CostReal 2005 dollars per ton CO2e Low-, mid-
penetration onshore wind
Active forest management
MID-RANGE CASE – 2030

Real 2005 $ billions, cumulative through 2030; options <$50/ton CO2e Capital flows due to
energy efficiencyPower
Buildings and appliances
Transportation
Industry – infrastructure
Agriculture and forestry
Avoided investment in powergeneration due to energy efficiency
Incremental net capital above reference case
100
Total investmentabove reference case
Industry – energy efficiency
300
160
370
1,060
1,360
560
90
80
Incremental capital investment required to unlock opportunities MID-RANGE
CASE – 2030

13
8
1911
5161024
19
22
36
600
West
21
32
890
Midwest
32
19
1,130
South
30
25
330
Northeast
Transport
Power
15
2122
Percent, Megatons CO2e/year
Agricultureand forestry
Industryand waste
Buildings and appliances
Geographic differences in abatement potential by sector
100%=
MID-RANGE CASE – 2030

Summary Conclusions (and Challenges)Stimulate action through a portfolio of strong, coordinated
policies to capture GHG reductions efficiently across industry sectors and geographies
Pursue energy efficiency and negative-cost options quickly
Accelerate development and deployment of a low-carbon energy infrastructure
• Encourage research and development of promising technologies and stimulate deployment
• Streamline approval and permitting procedures

Nevada’sEnergy Outlook…
Michael W. Yackira President & CEO, Sierra Pacific Resources
Cleaner

Our Vision
To be the premier provider of energy for Nevada

Nevada No. 1 in Growth
• No. 1 for 20 of 21 years• Las Vegas,
North Las Vegas & Henderson among the fastest growing cities in the U.S.

Growing Energy Demand • Peak Demand to Date for 2008
– Nevada Power: 5,504 MW– Sierra Pacific Power: 1,647 MW
• Record peak demand in 2007 – Nevada Power: 5,866 MW – Sierra Pacific Power: 1,743 MW

Three Part Energy Supply Strategy
• Increasing investment in energy efficiency and conservation
• Expanding renewable energy initiatives, investments
• Adding generation using clean, cutting edge technologies

Energy Efficiency and Conservation • Clinton Initiative
– $135 million investment in energy efficiency• Investments in Energy Efficiency and Customer-
Owned Renewable Energy– 2001 -- $2 million– 2008 -- $60 to $80 million
• Reduced energy usage by 500 million kWh savings in 2007/2008
• Part of portfolio standard

Wide range of programs
• 5 Million CFLs• Lighting and appliances • Hotel/motel retrofits• Refrigerator recycling• Air conditioning• Large commercial retrofits

Customer Installed Renewable Generation• SolarGenerations
– 270 projects installed– 1.5 million watts– $150,000 rebate –
Legislative Counsel Bureau
• Coming Sept. 2008– HydroGenerations– WindGenerations

Renewable Energy• Among most progressive statutory
requirement for renewables in U.S.• Approximately 1,000 MW of renewable
capacity expected to be on-line by 2012• 20% by 2015
– 1% solar– Up to one-quarter
from energy efficiency

Geothermal Partnership• Joint ownership
agreement• Ormat• 30 MW geothermal
plant• 1st such joint effort by
utility and developer• Nevada geothermal
potential high

Waste Heat Recovery• Compression
station waste heat– First in Nevada
• Partners are Ormat, Kern River
• Nevada Power ownership

Nevada Solar One • 64 MW• Largest since 1991• Solar thermal
– Mirrors heat fluid to create steam

Photovoltaic Power• Nellis Air Base• Largest PV in
North America• 14 MW
– PV converts sunlight directly to energy

Wind Energy • Proposed joint
development• RES Americas• China Mountain
in NE Nevada• 200 MW
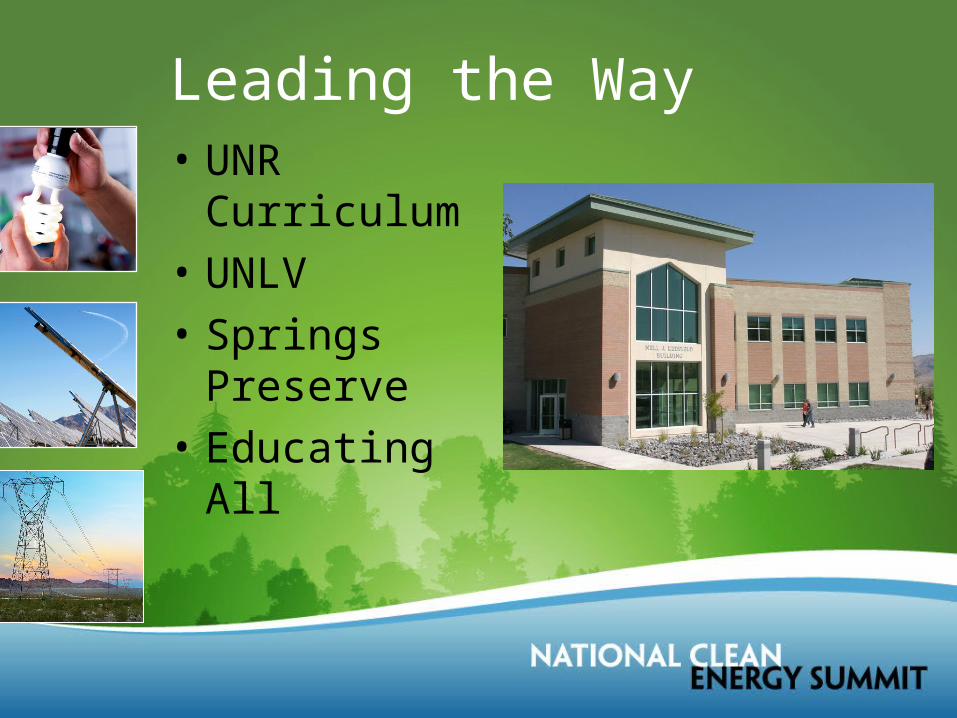
Leading the Way• UNR Curriculum• UNLV• Springs Preserve• Educating All
Putting the Sun to Work for America
Rhone ReschPresident
Solar Energy Industries Association
Introduction to SEIANational trade association for solar companies
•Over 600 member companies•Members include all solar technologies•Represent over 60,000 people employed by
solar•14 state and regional chapters
Strategic Objectives•Expand Markets•Strengthen R&D•Remove Market Barriers•Improve Education and Outreach
We Represent Solar’s Interests in Washington

Electricity Generation in the U.S.
In billion kilowatt hoursSource: EIA, Electric Power Monthly, released September 10, 2007
Solar is 1/6th of 1%

Coal
Natural Gas
Petroleum
Nuclear
Renewables
Federal Support for Energy Sources 1943-1999 $Billions
Source: Renewable Energy Policy Project
400
145
200
150
(11)

Solar Water Heating
• Germany 120,000• China >350,000

Solar Water Heating
430,000 Installations/Yr
2.5 Million Installations/Yr
115,000 Installations/Yr
Displaces 1/3 of LNG imports

Concentrating Solar Power (CSP) Technologies Expanding
Utility scale power plants intermediate and base load power
Trough Linear Fresnel Dishes Tower

Potential Solar Generation Capacity by State
World Class Solar Resources
• Resource base could provide more than 10X current U.S. electricity capacity
• Majority of land controlled by Federal government• Less than 2% of the land dedicated to cropland and grazing
could provide all of our electricity• Need access to transmission, policy certainty
Land AreaSolar
Capacity
Solar Generation
CapacityState (mi2) (MW) GWh
AZ 13,613 1,742,461 4,121,268CA 6,278 803,647 1,900,786CO 6,232 797,758 1,886,858NV 11,090 1,419,480 3,357,355NM 20,356 2,605,585 6,162,729TX 6,374 815,880 1,929,719UT 23,288 2,980,823 7,050,242
Total 87,232 11,165,633 26,408,956
Direct-Normal Solar Resource for the Southwest U.S.
Source: NREL (2007).
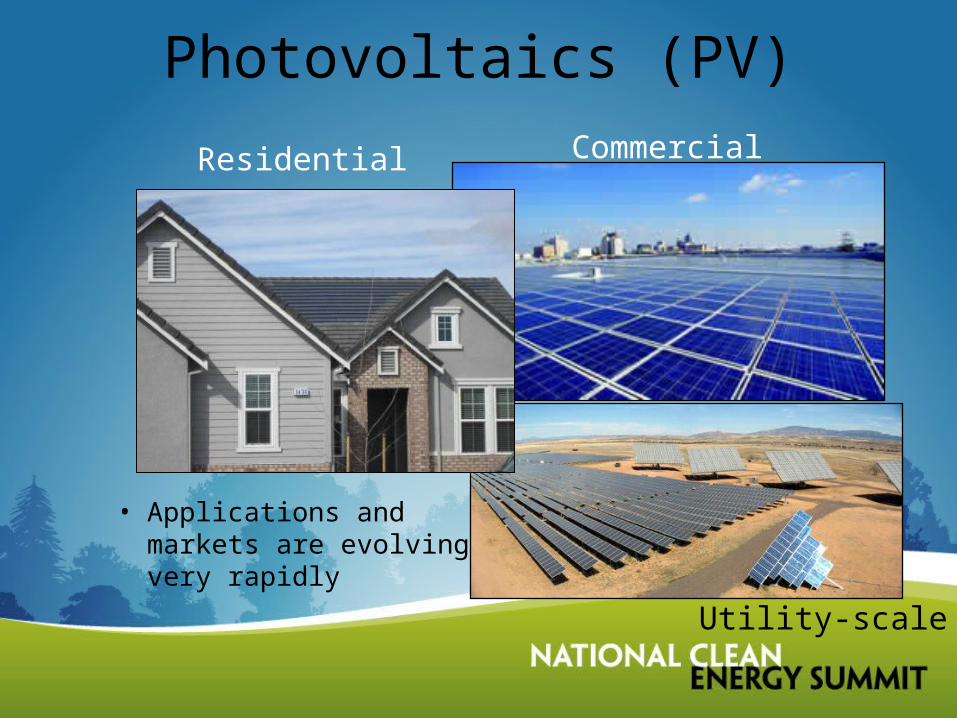
Photovoltaics (PV)
• Applications and markets are evolving very rapidly
Residential Commercial
Utility-scale

Global PV DemandMW
Source: Solar Buzz

The Giant of Solar
Source: SEIA

US Market Demand Forecast
MW
Source: PVNews, SEIA
67% CAGR
Displaces 3 Tcf/Yr
(75% of our offshore production)

Federal Policy Support• Long term extension of the investment tax credits
(ITC) for solar• National renewable electricity standard with solar
carve out• Carbon cap and trade legislation that allows full
access to market mechanisms for renewable energy
• Solar Rights Act (H.R. 2848, S. 1016) • Renewable Energy Development Act (S. 2076)

State Policy Support • Establish consistent interconnection standards• Adopt retail net metering rules • Create time-based rates• Enact a Renewable Portfolio Standard – with a
solar carve-out• Eliminate restrictive covenants• Grant property tax exemption to solar energy
equipment• Approve new transmission lines

Summary• US solar resources are large and inexhaustible• Solar is an economic engine • Solar can eliminate the need for all non-NA
natural gas imports• The robust solar markets of Germany and Spain are
a product of their national policies• Only long-term federal policies will transform the
US market into the largest in the world• Congress must pass a long-term extension and
expansion of the Investment Tax Credits

Nellis Air Force Base – 14 MW
Source: SunPower

Boulder City – 64 MW

The Clean Energy Economy• Moderator: Steve Colwell, Executive Director, Sea
Change Foundation• Congresswoman Hilda Solis, U.S. Representative,
32nd District of California• Dina Titus, Nevada State Senator• Dan Reicher, Director for Climate Change and
Energy Initiatives, Google.org• Edward Mazria, Founder of Architecture 2030

Not for Distribution
RE < CEnhanced Geothermal SystemsAugust 19, 2008


4
8
6
2
10
Levelized Cost
Cents/kW
h
CoalIGCC
Geothermal
Natural Gas
US Pulverised Coal
WindSolar Thermal
14
16
18
20
Nuclear
22
12
CoalIGCC/CCS
China Pulverised Coal
PV
RE<C: The Challenge
Generation Type

RE<C: Response
• Launched December 2007• Overall Goal: to make electricity produced from renewable sources cheaper than electricity produced from coal.
• Specific Objective: Google will develop 1 Gigawatt (1000 megawatts) of renewable generating capacity – enough to power a city the size of San Francisco – that is cheaper than coal. And we will do so in years and not decades.
• Initial Focus:• Concentrating solar power • Advanced wind power• Enhanced geothermal systems (EGS)• Electricity transmission & storage

RE<C: Tools
RE<C
R&D
Investment
Policy
Information
Not for Distribution

EGS Generation Potential (3-10 km)

Geothermal Resource (3-10 km): Nevada

Geothermal Resource (3-10 km): West Virginia

Why EGS?
Not for Distribution
• Clean, renewable, 24/7 energy resource that could meet thousands of times global needs
• Complements intermittent wind and solar• Could be the “killer app” of the energy world
• Ubiquitous global resource•All 50 US States•Europe, Russia, and Japan•India and China
• Systems scalable to > 1,000 MW
• Could be Cheaper than Coal
• Potential for CO2 Sequestration

Today's Announcement
Not for Distribution
$10.7 million in investments and grants to advance EGS
• $6.25 million investment in AltaRock Energy
• $4.0 million investment in Potter Drilling
• $489,521 grant to Southern Methodist University Geothermal Laboratory
Google Information Tools
• Google Earth Layer of US Geothermal Resources by Temp, Depth, MW, and State• SketchUp Animation of Cooper Basin Australia EGS System• YouTube introduction to EGS featuring Dr. Steve Chu and Dr. Jefferson Tester
National Policy Agenda
• Dramatically expanded national R&D program• Reliable long term tax credits• National Renewable Portfolio Standard• Improved siting, leasing, and permitting

Australia: Leading the Commercial EGS Race
Not for Distribution
Strong Policy Leadership
National RPS - 20% by 2020
Aus. $50 million federal deep drilling fund
Tradable REC's up to Aus. $0.065/kWh
Burgeoning EGS Industry 33 EGS exploration and development firms
8 EGS firms drilling as of March 2008 Strong policy support has spurred over Aus. $853 million in private commitments since 2000
Total Australian Grid: ~47,700 MW
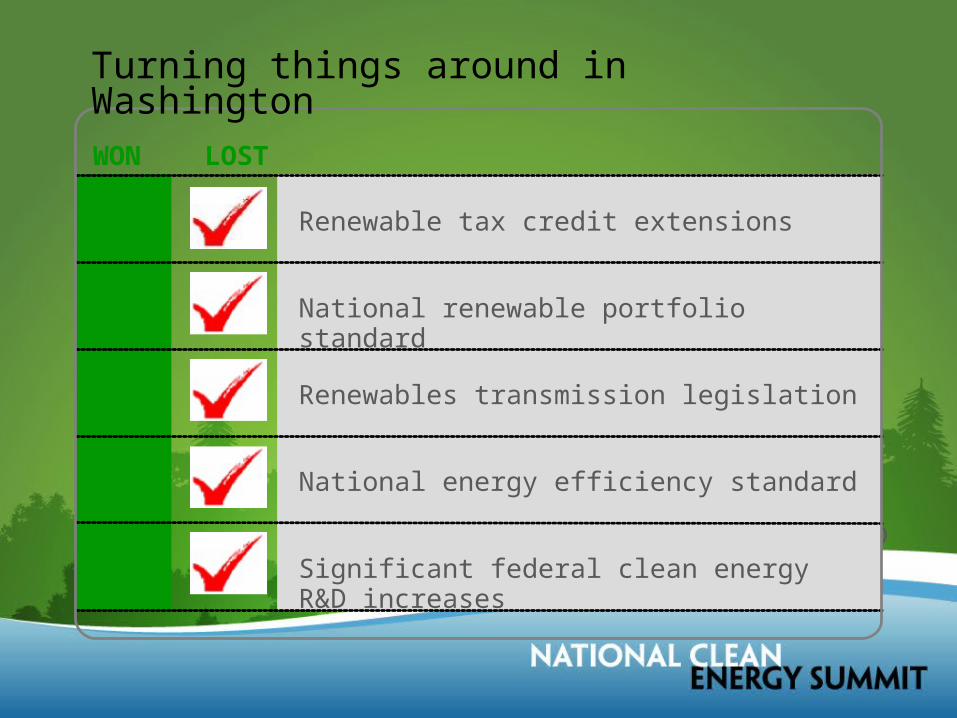
Significant federal clean energy R&D increases
National energy efficiency standard
Renewables transmission legislation
National renewable portfolio standard
Renewable tax credit extensions
WON LOST
Significant federal clean energy R&D increases
National energy efficiency standard
Renewables transmission legislation
National renewable portfolio standard
Renewable tax credit extensions
Turning things around in Washington

Interested in digging deeper?
Go to: www.google.org/egs
EGS - It’s Hot!

Now, it’s personal…
Edward Mazria AIAArchitecture 2030
copyright 2030 inc.

We have a problem:
We’re off the charts.
oC
Global Temperature & CO2(450,000 years) Source: UN IPCC
CO2(ppm)
400 300 200 100 0
400
350
300
250
200
2
-8
0-2-4-6
-10
CO2
temp.
387
copyright 2030 inc.

Sea
Leve
l (m
m)
2007
50
40
30
20
-10
10
1995 1997 1999 2001 2003 20051993
0
SEA LEVEL RISESource: Josh Willis, NASA JPL
Ice Melt
ThermalExpansion
53% of all Americans live in and around coastal cities and towns.
We have a problem:What’s this mean for the US?
copyright 2030 inc.

Point Pleasant, NJPoint Pleasant, NJ
Sea level: Google Earth / USGS
PopulationPoint Pleasant 19,306Bay Head 1.238
copyright 2030 inc.

Point Pleasant, NJPoint Pleasant, NJ1 meter1 meter
Sea level: Google Earth / USGS
copyright 2030 inc.

Hampton, VAHampton, VA
Sea level: Google Earth / USGS
PopulationHampton 146,137Newport News 180,150
copyright 2030 inc.

Hampton, VAHampton, VA1 meter1 meter
Sea level: Google Earth / USGS
copyright 2030 inc.

Charleston, SCCharleston, SC
Sea level: Google Earth / NOAA
copyright 2030 inc.

Charleston, SCCharleston, SC1 meter1 meter
Sea level: Google Earth / NOAA
copyright 2030 inc.

Charleston, SCCharleston, SC1.5 meters1.5 meters
Sea level: Google Earth / NOAA
copyright 2030 inc.

Hollywood, FLHollywood, FL
PopulationHollywood 139,357
Sea level: Google Earth / USG / LIDARScopyright 2030 inc.

Hollywood, FLHollywood, FL1 meter1 meter
Sea level: Google Earth / USG / LIDARScopyright 2030 inc.

Miami BeachMiami Beach PopulationMiami Beach 87,933
Sea level: Google Earth / IHRCS
copyright 2030 inc.

Miami BeachMiami Beach1 meter1 meter
Sea level: Google Earth / IHRCS
copyright 2030 inc.

New OrleansNew Orleans
Sea level: Google Earth / USGS
PopulationNew Orleans Unknown
copyright 2030 inc.

New OrleansNew Orleans1 meter1 meter
Sea level: Google Earth / USGS
copyright 2030 inc.

PopulationFoster City 28,803San Mateo 92,482
Foster City / San MateoFoster City / San Mateo
Sea level: Google Earth / USGS / BCDCcopyright 2030 inc.

Foster City / San MateoFoster City / San Mateo1 meter1 meter
Sea level: Google Earth / USGS / BCDCcopyright 2030 inc.

How much time do we have?Solution?
Too late.(takes 100 years;
animals no longer trust us)
Other options? There’s only one.
Confront the problem.
Climate change is an energy problem:
Supply & DemandSupply
Who’s theCulprit?
copyright 2030 inc.

Pre-industriallevel
350 450 550 650 750 850
FOSSIL FUEL RESOURCES & CO2 EMISSIONS (ppm)Source: Architecture 2030; Adapted from J. Hansen et al: Dangerous human-made interference with climate, 2007
1750 to Present(used)
coal oil gas
387ppm
Today
gas
oil
coal(oil shale/tar sands)
Proven WorldReserves(unused)
Who’s theCulprit?
Supply
copyright 2030 inc.

Who’s theCulprit?
Supply
NO MORE COAL(without ccs)
copyright 2030 inc.
Who’s theCulprit?
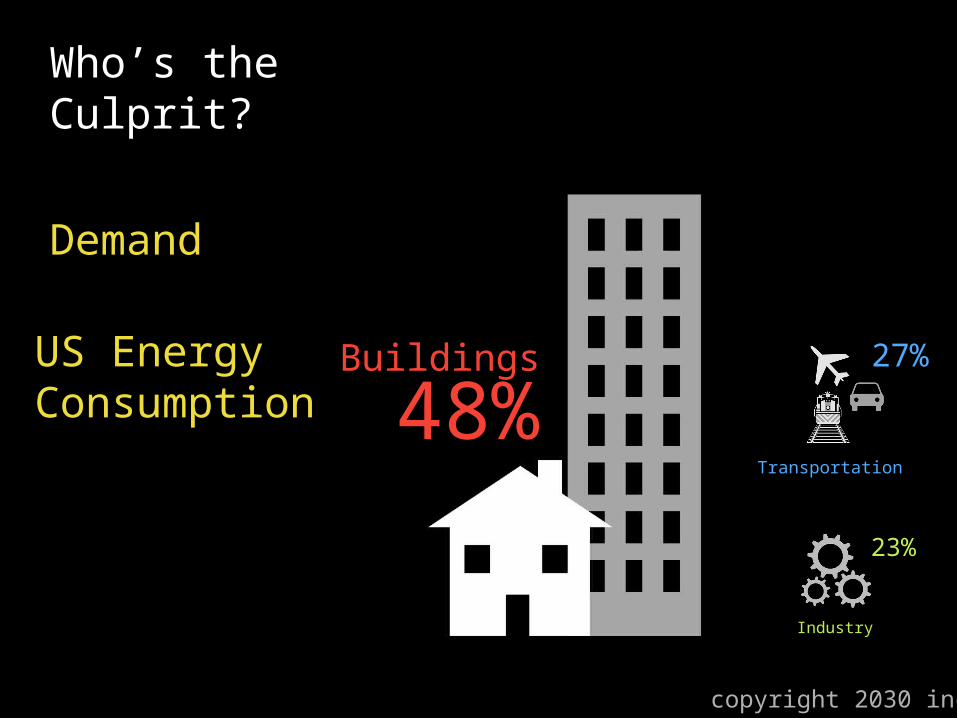
Demand
Buildings
Industry
Transportation
US EnergyConsumption
Buildings
48%Transportation
27%
Industry
23%
copyright 2030 inc.

US ElectricityConsumption
Who’s theCulprit?
Demand
Transportation
1%
Industry
25%
Buildings
76%
copyright 2030 inc.

New Buildings &Major Renovations - 50%2010 - 60%2015 - 70%2020 - 80%
2030 - Carbon Neutral(no fossil fuel energy to operate)
2025 - 90%
52.0 Qbtu(+23% in 2030)
42.2 QBtu
40.1 QBtu
37.6 QBtu
34.4 QBtu
30.6 Qbtu
The 2030 Challenge
copyright 2030 inc.

Support for the 2030 Challenge:
copyright 2030 inc.

copyright 2030 inc.

How do we meet the2030 Challenge?
copyright 2030 inc.

1.1. Design, planning & innovationDesign, planning & innovation
copyright 2030 inc.

2. Add technology2. Add technology
copyright 2030 inc.

3. Purchase renewable energy 3. Purchase renewable energy
copyright 2030 inc.

How much will it cost?
Nothing.It will save consumers money.
copyright 2030 inc.

Estimated Annual Cost Savings2030 Challenge - 50% Reduction Target*
* Estimated cost increase relative to a standard home, Greensburg Kansas: $0.00 - $2.00 per sq. ft. - 50% below the regional average energy consumption (30% below IECC 2003).
First Cost
Annual Amortized Cost(7%, 30 year mortgage)
Annual Utiltiy Bill Savings
Homeowner Savings Each Year
$2,000
$211
$723
$512
How much will it cost?
copyright 2030 inc.

What needs to be done?
Implement the 2030 Blueprint
copyright 2030 inc.

10
30
USElect.Qbtu(Primary)
25
20
15
5
0
2010 2015 2020 2025 2030
1. 2030 Challenge-15.34 QBtu
2. Homeowner Choices-5 QBtu
3. 30% Renewables(Wind/CSP/Geo/Bio)-13.09 QBtu
50% Renewables-9.84QBtureplace
coal free upnatural gas
replacecoal
free upnatural gas
Conventional Coal
Natural Gas
Transportation
2030 Blueprint
Building Operations
copyright 2030 inc.

Transportation
50% Renewables-9.84QBtu
Transportation9.84 QBtu
200721.79 Qbtu
(9.97 million barrels / day)
Imported
23%
Imported
202016.87 Qbtu
(7.72 million barrels / day)
4.92 QBtu
45%
Imported
203011.95 Qbtu
(5.48 million barrels / day)
9.84 QBtu
74%Freed up natural gas
(electric ~ 6.25 Qbtu)
20305.70 Qbtu
(2.59 million barrels / day)
ImportedFreed up oil & gas
(buildings ~ 3.25 Qbtu)
89%
Imported
20302.45 Qbtu
(1.09 million barrels / day)
copyright 2030 inc.

1. Update the National Energy Conservation Code Standard to meet the 2030 Challenge and…
…require that all state/local building codes meet the 2030 Challenge targets.
How do we implement the 2030 Blueprint?
2. Pass a National Renewable Portfolio Standard.
25% by 202050% by 2030
3. Invest in building efficiency.
Why efficiency?
copyright 2030 inc.
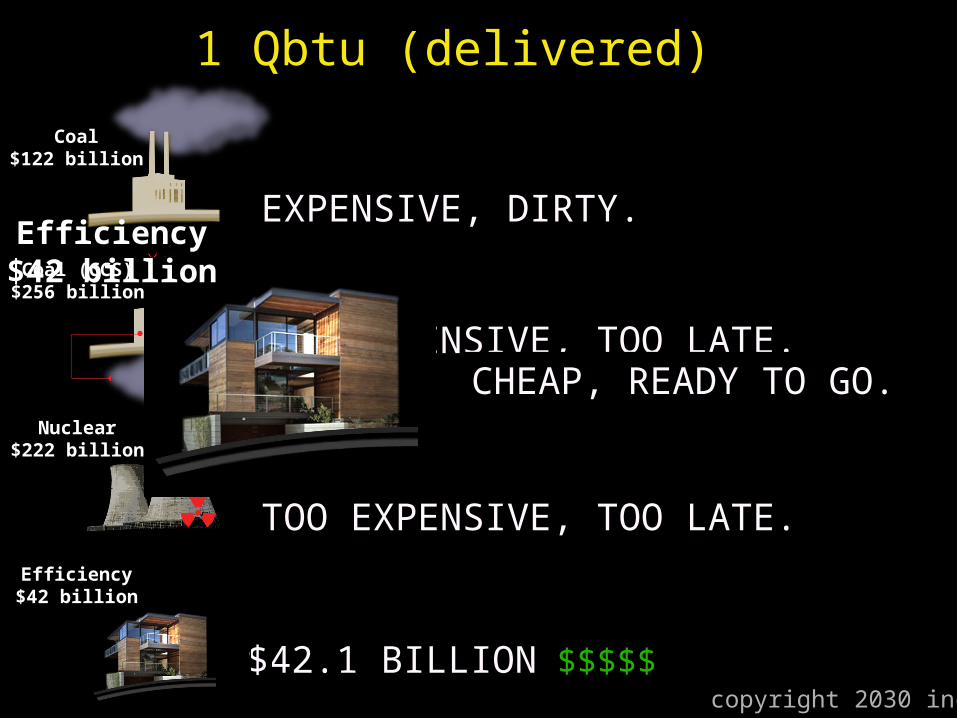
“CLEAN” COAL (CCS)?
NUCLEAR POWER?
$$$$$$$$$$$$$$$$$$$$$$$$$$$256 BILLION15-20 YEARS OUTTOO EXPENSIVE, TOO LATE.
CONVENTIONAL COAL?$122 BILLION$$$$$$$$$$$$$
$222 BILLION$$$$$$$$$$$$$$$$$$$$$
$42.1 BILLION $$$$$
EXPENSIVE, DIRTY.Coal
$122 billion
Coal (CCS)$256 billion
1 Qbtu (delivered)
8-12 YEARS OUT
Nuclear$222 billion
TOO EXPENSIVE, TOO LATE.Efficiency$42 billion
Efficiency$42 billion
CHEAP, READY TO GO.
copyright 2030 inc.

$21.6 billion in building energy efficiency each year for five years to:
• Stimulate building construction
• Create over 1 million new permanent jobs
• Save consumers $127 billion
• Distribute the $$$ throughout the US, and across all industries…
US Investment?
copyright 2030 inc.

123copyright 2030 inc.

Robert E. RubinChairman of the Executive Committee of the
Board of Citigroup Inc.

Restoring American Leadership:Jobs, Growth, Communities, and Trade
107
• Moderator: Danny Thompson, Executive Secretary-Treasurer, Nevada State AFL-CIO
• Somer Hollingsworth, President and CEO, Nevada Development Authority
• Ian Rogoff, Chairman and Trustee, Nevada Institute for Renewable Energy Commercialization
• Van Jones, Senior Fellow, Center for American Progress Action Fund and Founder & President, Green for All
• Fred Redmond, Vice President, United Steelworkers

Somer Hollingsworth
National Clean Energy SummitAugust 19, 2008

The NDA• Not-for-profit 501(c)6
• Founded in 1956• S.N.I.F. - Southern Nevada Industrial
Foundation
• Supported by 400 business and individual members, State and local government and educational institutions

NDA Mission
The Nevada Development Authority shall attract, retain and expand the business base to enhance the overall socioeconomic development of Southern Nevada.

The NDA
TARGET INDUSTRIES
• Technology
• Life Sciences
• Renewable Energy

October 2005 - Former President Bill Clinton keynote speaker at NDA annual meeting
• Wake-up call for Southern Nevada
The NDA

Fast forward three years later:Nevada is the No. 1 state in the
nation in solar watts per capita, and solar as a percentage of retail sales.
Goal…….to be solar capital of the U.S. and the world

State Legislation
• State mandate for Nevada Power to acquire power from renewable sources - 20% by 2015

Renewable & Energy Storage Abatements
• 50% abatement for up to 10 years on real and personal property for qualified energy companies
• A partial abatement of sales/use tax on capital equipment purchases

Clean Energy Is Good For Everyone
• Bring municipalities into clean energy movement
• Land usage – sale or lease
• Joint venture
• Purchase of solar

• Las Vegas won a World Leadership Award in London, England for their innovative Alternative Fuel program – December 2007.
• Competition that celebrates the very best in modern city leadership – over 400 cities from around the world were in competition.
• Alternative Fuel Program received top honors in the transportation category.
- 90% of the City’s fleet of nearly 1,500 vehicles operates on a variety of alternative fuels – WITHIN THE NEXT SIX MONTHS THE CITY OF LAS VEGAS’ FLEET WILL BE 100% ALTERNATIVELY FUELED!
• Las Vegas was first city in the world to construct/operate a Hydrogen Energy Station that generated electric power from a stand alone 50 Kw fuel cell that also produced hydrogen fuel.
Clean Energy Is Good For Everyone

• Nevada Solar One- 64 MW on 350 acres in Boulder City
• Nellis PV (SunPower Corp.)- 15 MW on 110 acres at Nellis
Since October 2005….(Up and running)

• Ausra Manufacturing LLC- 136,000 s.f. highly automated
(robotic) solar thermal component manufacturing facility
• Biodiesel of Las Vegas- 100 million gallon Biodiesel plant
Since October 2005….(Up and running)

• BrightSource Energy- 200+ MW on 1,000+ acres- Concentrating sun power tower
technology• Solar Millennium LLC
- 100-200 MW power plant on 480 acres• El Dorado Energy PV
- 165 MW on 400 acres
Since October 2005….(In the pipeline)

PROJECT NAME OWNER CITY LEED RATING
Desert Living Center Springs Preserve Las Vegas Platinum
ORIGEN Experience Springs Preserve Las Vegas Platinum
Molasky Corporate Center Molasky Group Las Vegas Gold
Palazzo Las Vegas Sands Corp. Las Vegas Silver
Regional Animal Campus Animal Foundation Las Vegas Silver
Tate Snyder Kimsey Architects Design Studio Tate Snyder Kimsey Henderson Certified
Miley Achievement Center Clark County School District Las Vegas Certified
Telecommunications Building College of Southern Nevada North Las Vegas Certified
LEED Certified Projects (Completed)
U.S. Green Building Council – Nevada Chapter

Kermit The Frog Said…….“It Ain’t Easy Being Green”
• There are nearly 100 LEED registered projects listed for Nevada.

Needs• Renewable Energy Tax Credit must pass
• State and local government – invest in clean energy– incentives for companies to grow– legislation to encourage clean energy
• Make permitting simple and fast
• In Nevada, Federal mandate BLM within six months have comprehensive plan to set aside land for clean energy

Nevada Institute for Renewable Energy Commercialization
(NIREC)
Transforming Scientific Research Into Viable Renewable Energy Business Solutions
National Clean Energy SummitIan Rogoff, NIREC Chairman
19 August 2008

Nevada Institute for Renewable Energy Commercialization
(NIREC)
APPROACHIntegrate researchers, experienced entrepreneurs,
business executives and venture capital to identify and fund viable, cost-effective renewable energy solutions.
CAPABILITIES1. Commercialization research 2. Business functions3. Financing vehicles4. Demonstration and outreach function

Mariah Power – Windspire Vertical Axis Wind Turbine

Commercializing Clean Energy Technology
Significant barriers exist today in the commercialization of clean energy technology
• Ambiguous research directions• Technology trapped in labs• Lack of commercialization know-how and funding• Short-term ROI constraints• Difficulty in attracting experienced entrepreneurial
management teams • Long maturation and characterization periods• Incumbent technologies and fiscal regimes

Commercialization Accelerators
Why they work…• Funded research by itself doesn’t create market solutions or
many jobs; commercializing technology does.• Accelerators synthesize promising research with business
skills and experience
When they work…• They do not try to perform basic research• They focus in specific industries• They focus on bringing solutions to market• They act as a catalyst and vector

NIREC Institutional Research Partners

Clean EnergyEconomic Development
• 70% of net new jobs in the past 15 years have been created by businesses less than 5 years old
• Clean energy is a high tech industry with significant job creation potential
• Clean energy skills• Engineering, biotech, materials science, finance
• Clean energy industrial impact• Manufacturing, installation and support• Transportation• Centralized and distributed power• Energy efficiency and storage

Nevada Institute for Renewable Energy Commercialization
NIREC is a public-private partnership uniquely designed to accelerate
renewable energy technologies to commercial success.
Thank you
Ian Rogoff, NIREC

132
Governor Jon HuntsmanState of Utah

The Visible Hand:Government’s Role in the Clean Energy Transformation;
Opportunities to Accelerate Deployment of Energy Efficiency and Renewable Energy
• Moderator: John Podesta, President & CEO, Center for American Progress Action Fund
• Governor Bill Ritter, State of Colorado• Commissioner John Wellinghoff, Federal Energy Regulatory
Commission• Dr. Steven Chu, Director of the Lawrence Berkeley National
Laboratory• Dr. David Overskei, President, Decision Factors• Jim Thoma, Senior Vice President, Manager of Energy
Services, Bank of America
133

The world’s energy problem and what we can
do about itNational Clean Energy Summit
Univ. Nevada, Las Vegas19 August, 2008

(1)The risk of adverse Climate Change.
(2) Potential for geopolitical conflict due to escalating competition for energy resources.
The Energy Problem
(3) Climate change may cause Resource Wars over water, arable land, and massive population displacement.
Climate experts predict that there is a 50% chance that the average temperature of the world will increase by 5 º C.
5 º C change is the difference between our world today and the world during the last Ice Age.

Frequently quoted myths about energy:
1. The wealth of a country is proportional to the energy it uses.

Human Development Index (GDP/capita, education level, health care, etc.) vs. Electricity
UseUnited States

Per Capita Electricity Sales (not including self-generation)(kWh/person) (2006 to 2008 are forecast data)
0
2,000
4,000
6,000
8,000
10,000
12,000
14,00019
6019
6219
6419
6619
6819
7019
7219
7419
7619
7819
8019
8219
8419
8619
8819
9019
9219
9419
9619
9820
0020
0220
0420
0620
08
United States
California
2005 Differences = 5,300kWh/yr = $165/capita
Electricity use per person (1960 – 2008)
From 1973 to 2008, the GDP/capita in California
has doubled.

Regulation stimulates technology: Refrigerator efficiency standards stimulated industry innovation
Regulation of consumer electronics and computers can save a similar amount of energy.

Annual Energy Saved vs. Several Sources of Supply
Energy Saved Refrigerator Stds
renewables
100 Million 1 KW PV systems
conventional hydro
nuclear energy
0
100
200
300
400
500
600
700
800
Billion kWh/year
= 40 power plants 1 GW
per plant
In the United States

Buildings consume 39% of U.S. energy, produce 48% of Carbon emissions, Commercial building annual energy bill: $120 billion
A 80 - 90% reduction in energy in new commercial buildings is possible with new technologies.
(CPUC, LBNL and United Technologies)
0
1
2
3
4
5
6
7
8
1 2 3 4 5 6
Qua
ds
3 GorgesDam
Hydro-electric
AllOtherRenewables
Coal
Nuclear
ProposedEnergy Savingsfrom CommercialBuildings 2030
Electricity Generation

Frequently quoted myths about energy:
1.The wealth of a country is proportional to the energy it uses.
2.We have all the technology we need to solve the energy problem. It is only a matter of political will.
Political will is necessary (e.g. a price on carbon, with no loopholes), but new technology can transform the energy
landscape.

Photovoltaics
Windmills
Gas turbines
2005
2005
Cost of electricity generation vs. installed capacity (1990 dollars / installed Megawatt hour)
10x cost difference
(not including distribution,
energy storage and
back-up generation
costs)
US Department of Energy projects silicon PV will become cost competitive with fossil fuel
electricity generation by ~2030.
We need transformative solutions to solve the climate problem.

• In 1914, AT&T completed the first transcontinental telephone line.
What is a transformative technology? • An essential component was
electronic amplification with the vacuum tube.Electronic
amplification and transcontinental telephones.
• Vacuum tubes required a red-hot wire to emit electrons. The tubes generated a lot of heat and burned out.
By the early 1930’s it became clear that a more reliable, miniature electronic amplifier was needed.

• AT&T Bell Laboratories also embarked on a research program to develop a solid state electronic amplifier and switch (The Transistor).
• This research would not have been possible without the development of a fundamentally new understanding of the atomic world (Quantum Mechanics) that occurred a decade before Bell Labs began their quest.

Reel-to-reel mass production of efficient solar cells based on rapidly developing
nano-technology may be possible.
Alan Heeger UCSB
Paul Alivisatos LBNL, UCB
Pei-Dong YangUCB, LBNL
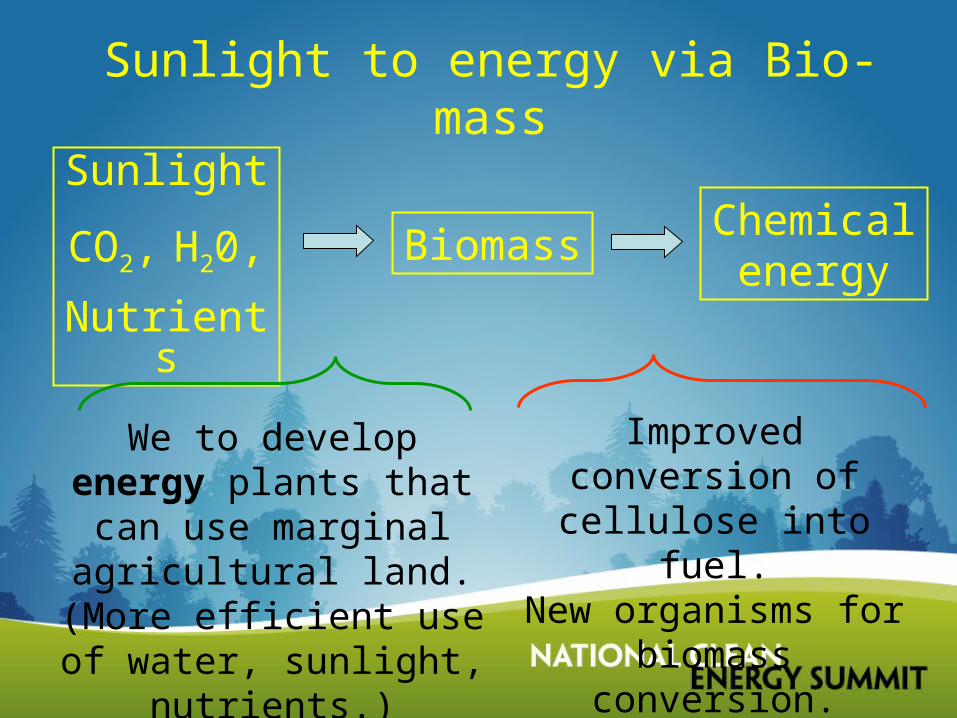
SunlightCO2, H20, Nutrients
Biomass Chemical energy
We to develop energy plants that can use
marginal agricultural land. (More efficient use of
water, sunlight, nutrients.)
Sunlight to energy via Bio-mass
Improved conversion of cellulose into fuel.New organisms for
biomass conversion.

Feedstock grasses (Miscanthus) is a largely unimproved crop.Non-fertilized, non-irrigated test field at U. Illinois yielded
15x more ethanol / acre than corn.
50 M acres of energy crops plus agricultural and urban wastes can produce 1/2 of current US consumption of gasoline.

At the Berkeley Lab:- Ionic liquids have shown dramatic improvement in the separation of lignin from cellulose.- “Synthetic Biology” technology has been used to turn yeast into producing a gasoline-like fuel.- Future fuels will include diesel andjet-fuel replacements.

Lawrence Berkeley Lab Helios Artificial Photosynthesis Project
The first important step:
Sunlight + 2H2O O2 + 4H+ + 4e-

Financing Renewable Energy Projects
Jim ThomaBank of America
National Clean Energy SummitCox Pavilion, University of Nevada Las Vegas
August 19, 2008

Bank of America and the Environment
• Bank of America sees the business opportunities inherent in addressing global climate change.
• Bank of America has made a $20 billion, 10-year environmental commitment.
• Bank of America:– Believes a defined regulatory environment with market-based
mechanisms, such as cap and trade, is needed.– Adopted The Carbon Principles in anticipation of carbon regulation.– Believes in a balanced approach to satisfying growing energy needs,
including investment in energy efficiency.– Supports renewal of the alternative energy and efficiency tax credits.– Supports state and local incentives.
152

Key Legislative/Regulatory Programs• Federal tax policy
– Section 45 production tax credit– Section 48 investment tax credit– Clean Renewable Energy Bonds (Section 54)
• Federal legislation– Energy Policy Act of 2005– Pending extenders legislation– Federal Energy Savings Performance Contracting (ESPC) program
• Renewable portfolio standards• Renewable energy credit & carbon credit trading regimes• State & local renewable energy incentives
– California Solar Initiative– Utility incentive programs
• State energy efficiency programs
153

Transaction Experience

Tax-Exempt Financing Example• The Douglas County School District
− Grades K-12− 6,700 students
• Energy conservation measures for 11 schools and support facilities
• Equipment and improvements include:− New lighting systems and controls− Upgraded energy management system− New vending machine controls− New energy star transformer and trash compactors− HVAC retrofit to install two new natural
gas-fired heating units− Replacement of exterior lighting
• $8.2MM in savings over 15-year term
155
$5,100,000
Tax-exempt
____
Energy Efficiency Improvements for School
Facilities

Clean Renewable Energy Bonds (“CREBs”)
• Southern Nevada Water Authority received $6.9 million CREBs allocation for four renewable energy projects
– Sloan Distributed Small Hydropower Projects One & Two
• 700 kilowatts, 3,200-3,300 MWhs per year.• Under future flow regimes, induction generator size
could be increased to approximately 1.3 MWhs per year.
– Horizon Ridge Distributed Small Hydropower Project • 605 kilowatts, 3,300 MWhs per year. • Under future conditions, up to 5,000 MWhs per
year could be produced.– River Mountain Water Treatment Facility Distributed
Solar Power Project• 250 kilowatts, minimum of 550,000 kWhs per year.
156
$6,900,000
Clean Renewable Energy Bond
____
Hydro-Electricity Generation & Solar Project
Southern Nevada Water Authority

Clean Renewable Energy Bonds (“CREBs”)
• The Las Vegas Valley Water District received a $2.5MM CREBs allocation for constructing and equiping solar panels at the Las Vegas Springs Preserve.
− 174 kilowatts of solar photovoltaic systems.
– Produce a minimum of 347,276 kWhs per year.
– Offset on-site energy requirements and reduce the need for imported power and ancillary services.
– Solar photovoltaic systems have low-water requirements, good for Southwest desert environments.
157
$2,500,000
Clean Renewable Energy Bond
____
Solar Parking Canopies
Las Vegas Valley Water District

Solar Services Contract• Largest solar power and energy-efficient facilities program in U.S. K-12 education.
• Chevron Energy Solutions will construct and a Bank of America subsidiary will own up to five megawatts of solar photovoltaic systems.
158
• No district capital investment required.
• More than $25 million in energy cost savings to the District over the life of the solar power system.
• Provides the District with budget stability and predictability through known energy costs.
• 25% reduction in the District’s demand for utility power.
• Reduction of 37,500 tons of carbon dioxide emissions, equivalent to planting 400 acres of trees.
$17,500,000
Solar Services Contract
____
Solar Power and EnergyEfficiency Project