natalie klym, mit research associate dirk trossen, nokia value
TRANSCRIPT

Value Chain Dynamics ToolkitNatalie Klym, MIT Research AssociateDirk Trossen, Nokia
Value Chain Dynamics Working Group Semi-Annual MeetingMay 24, 2006Cambridge, MA

• Objectives
• Approach
• Anatomy of a tool
• The basic idea
• General guidelines
• The toolkit
• User Guide
Value Chain Dynamics Toolkit
Agenda
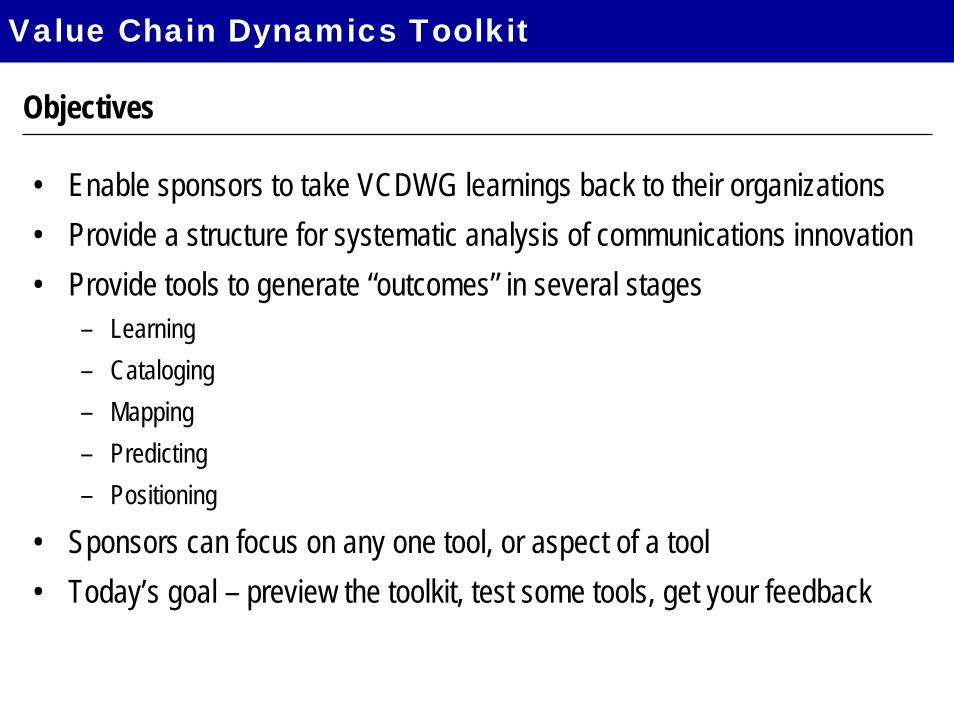
• Enable sponsors to take VCDWG learnings back to their organizations • Provide a structure for systematic analysis of communications innovation• Provide tools to generate “outcomes” in several stages
– Learning– Cataloging – Mapping– Predicting– Positioning
• Sponsors can focus on any one tool, or aspect of a tool• Today’s goal – preview the toolkit, test some tools, get your feedback
Value Chain Dynamics Toolkit
Objectives
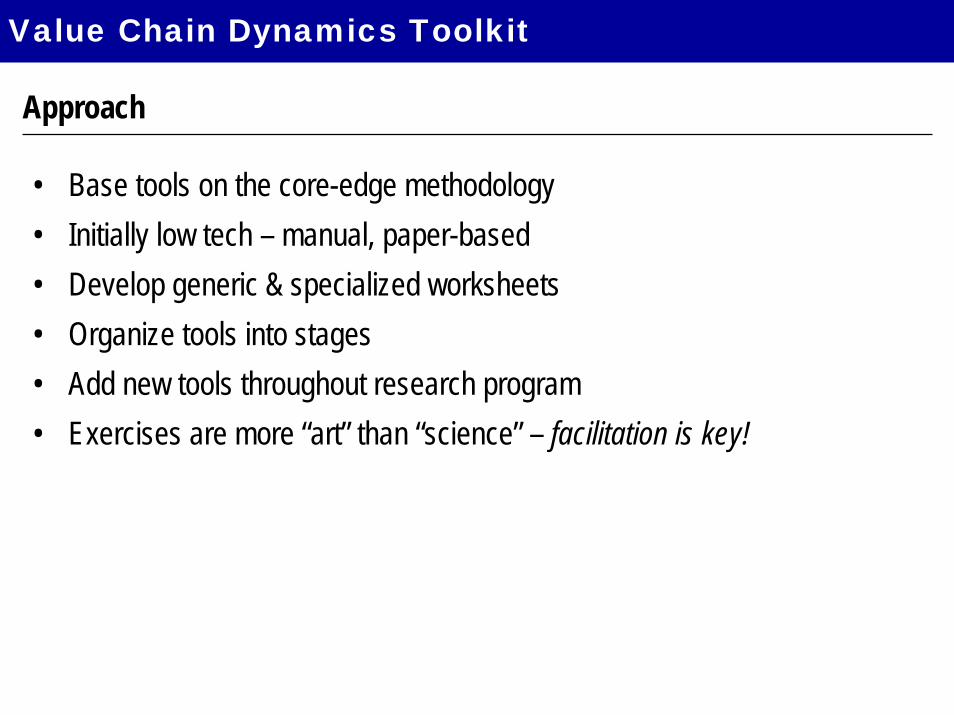
• Base tools on the core-edge methodology • Initially low tech – manual, paper-based• Develop generic & specialized worksheets• Organize tools into stages• Add new tools throughout research program• Exercises are more “art” than “science” – facilitation is key!
Value Chain Dynamics Toolkit
Approach

Purpose• What is the expected outcome/results of the tool – insights and/or output (e.g.,
a diagram, a list, etc.)
Background• Explain the rationale/theory behind the tool• Some tools will require deeper learning tools provided in the LEARN section
Process• Outline of the steps
Guidelines• Additional information regarding steps where necessary
Value Chain Dynamics Toolkit
Anatomy of a tool

1. Choose a type of service for analysis
Value Chain Dynamics Toolkit
2. Break it down to component parts• Individual services & functional elements
3. How are the parts organized?• Who provides what parts?• How does each part work? How do the different parts work together?• Where are key customer relationships? Where is value being
captured? By whom? By what means?• What’s the market share of the different business models?
4. How & why is this changing over time?• Triggers and dynamics
The basic idea
Value Chain Dynamics Toolkit
General guidelines
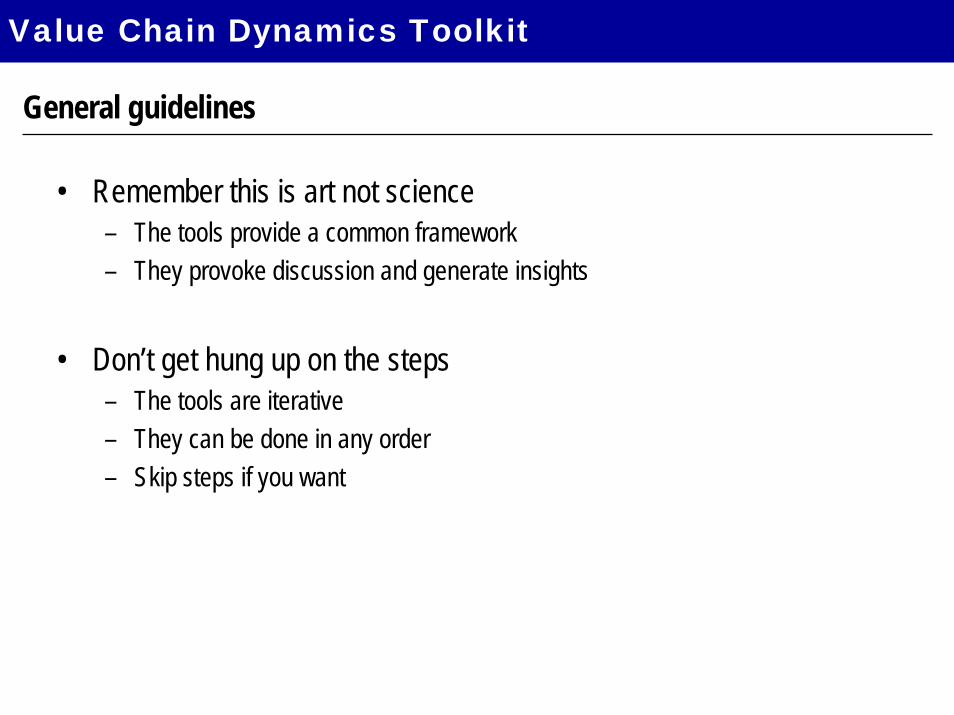
• Remember this is art not science– The tools provide a common framework– They provoke discussion and generate insights
• Don’t get hung up on the steps– The tools are iterative– They can be done in any order– Skip steps if you want
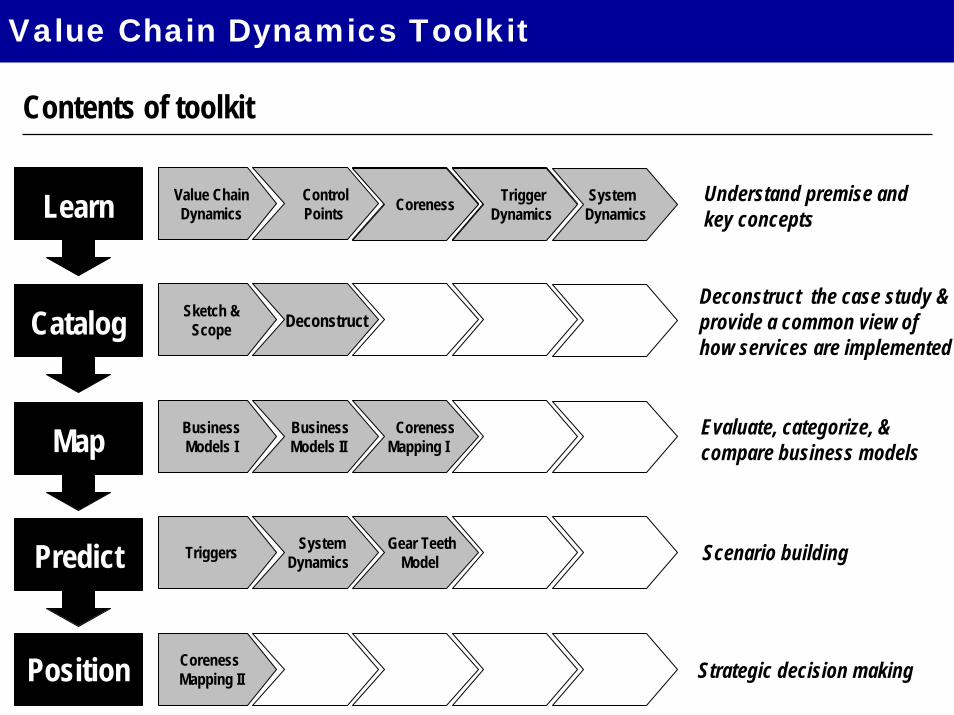
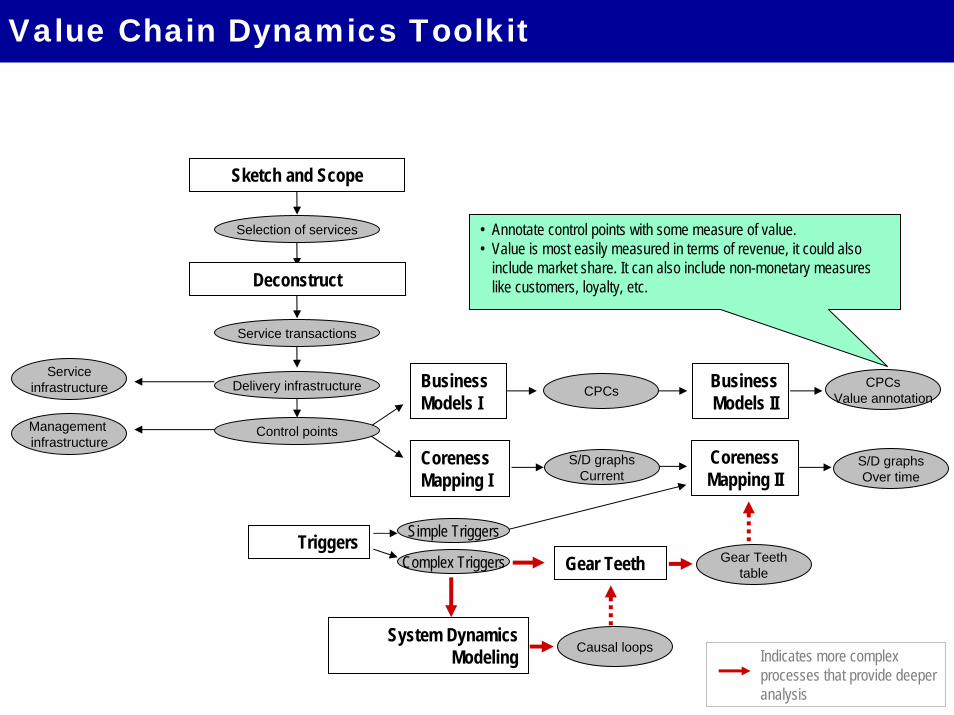
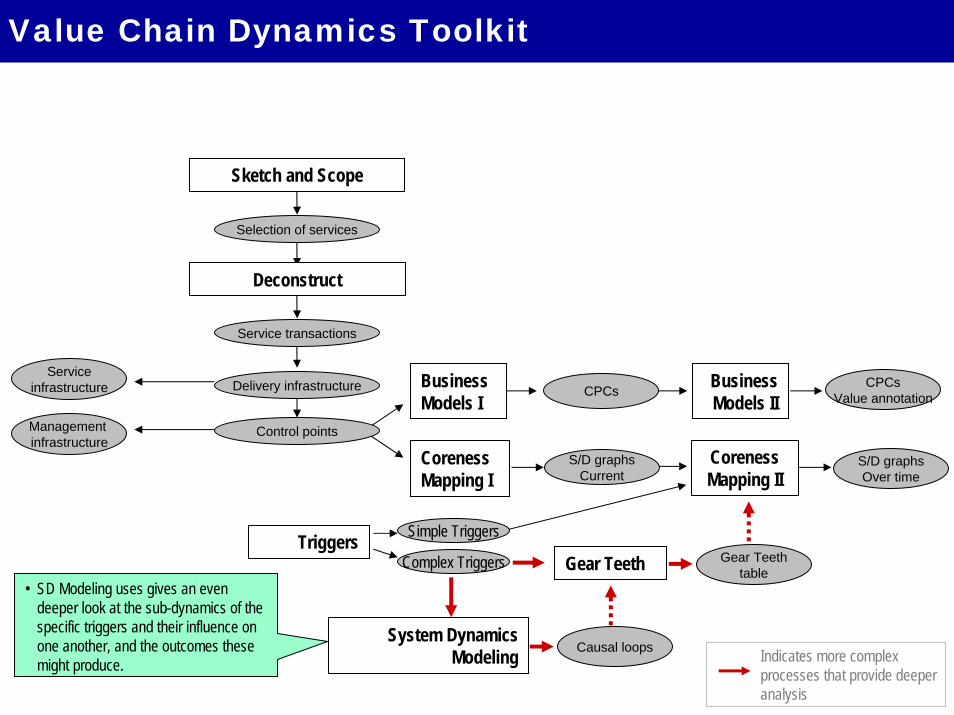
Sketch &Scope Deconstruct
Triggers System Dynamics
Gear TeethModel
BusinessModels I
Business Models II
CorenessMapping I
CorenessMapping II
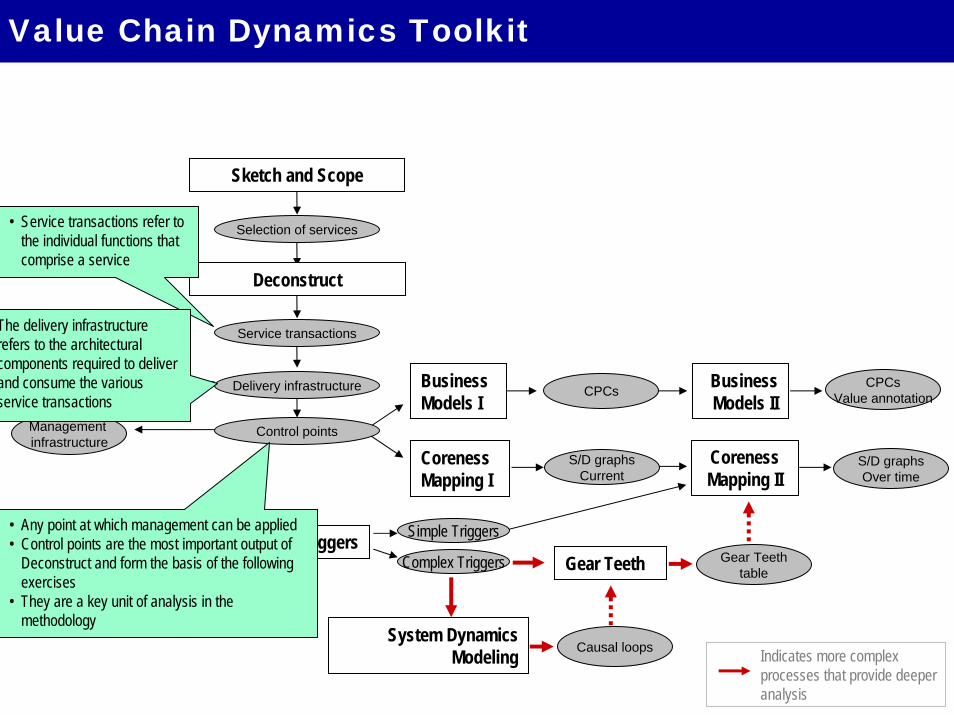
Value Chain Dynamics Toolkit
Value ChainDynamics
ControlPoints
TriggerDynamicsLearn
Catalog
Map
Predict
Position
Contents of toolkit
Understand premise and key concepts
Evaluate, categorize, & compare business models
Scenario building
Strategic decision making
System Dynamics
Deconstruct the case study & provide a common view of how services are implemented
Coreness TriggerDynamics
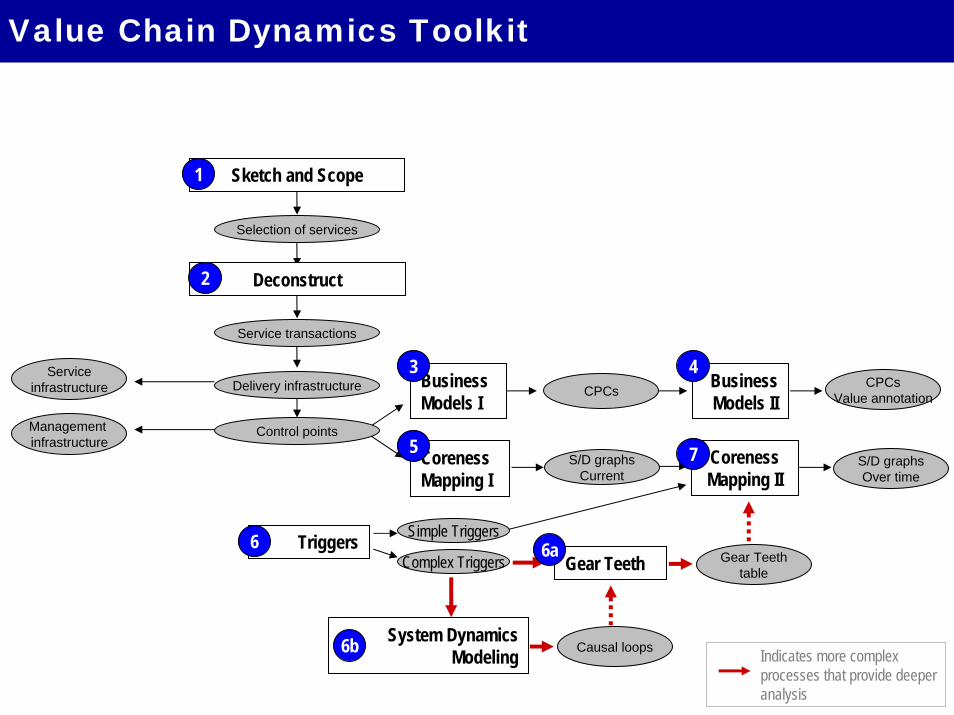
Business Models I
Control points
Delivery infrastructureService
infrastructure
Management infrastructure
Business Models II
CPCsValue annotation
S/D graphsOver time
Gear Teeth Gear Teethtable
System Dynamics Modeling Causal loops
Deconstruct
Selection of services
Sketch and Scope
Service transactions
CPCs
S/D graphsCurrent
CorenessMapping I
CorenessMapping II
Indicates more complex processes that provide deeper analysis
Value Chain Dynamics Toolkit
Complex Triggers
Simple TriggersTriggers
2
1
5
43
7
6b
6a6
Value Chain Dynamics Toolkit
Business Models I
Control points
Delivery infrastructureService
infrastructure
Management infrastructure
Business Models II
CPCsValue annotation
S/D graphsOver time
Gear Teeth Gear Teethtable
System Dynamics Modeling Causal loops
Deconstruct
Selection of services
Sketch and Scope
Service transactions
CPCs
S/D graphsCurrent
CorenessMapping I
CorenessMapping II
Indicates more complex processes that provide deeper analysis
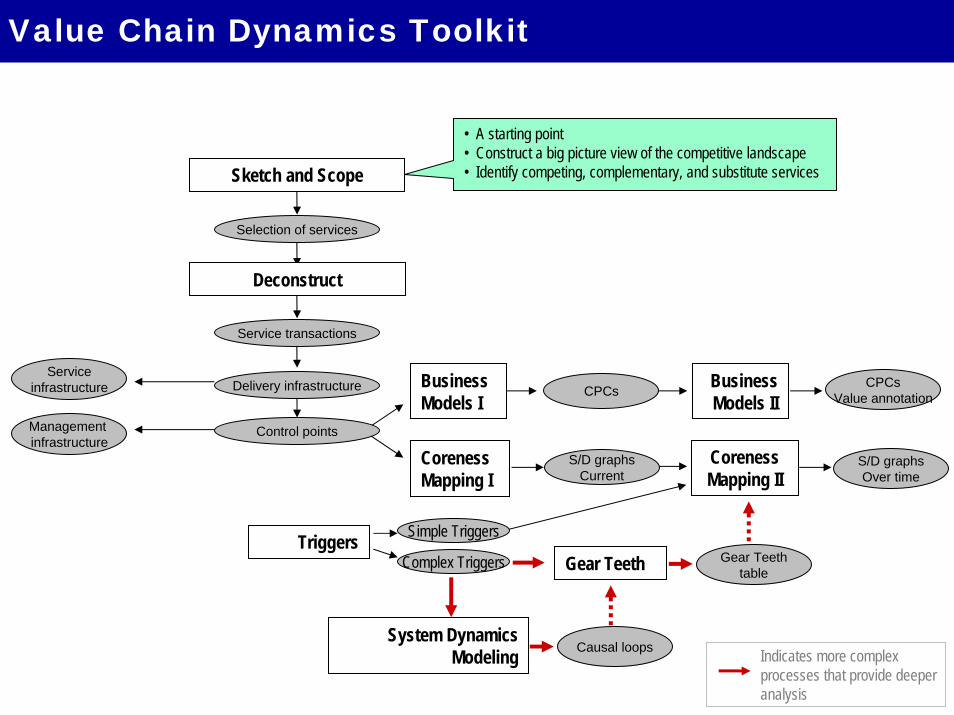
• A starting point• Construct a big picture view of the competitive landscape• Identify competing, complementary, and substitute services
Complex Triggers
Simple TriggersTriggers
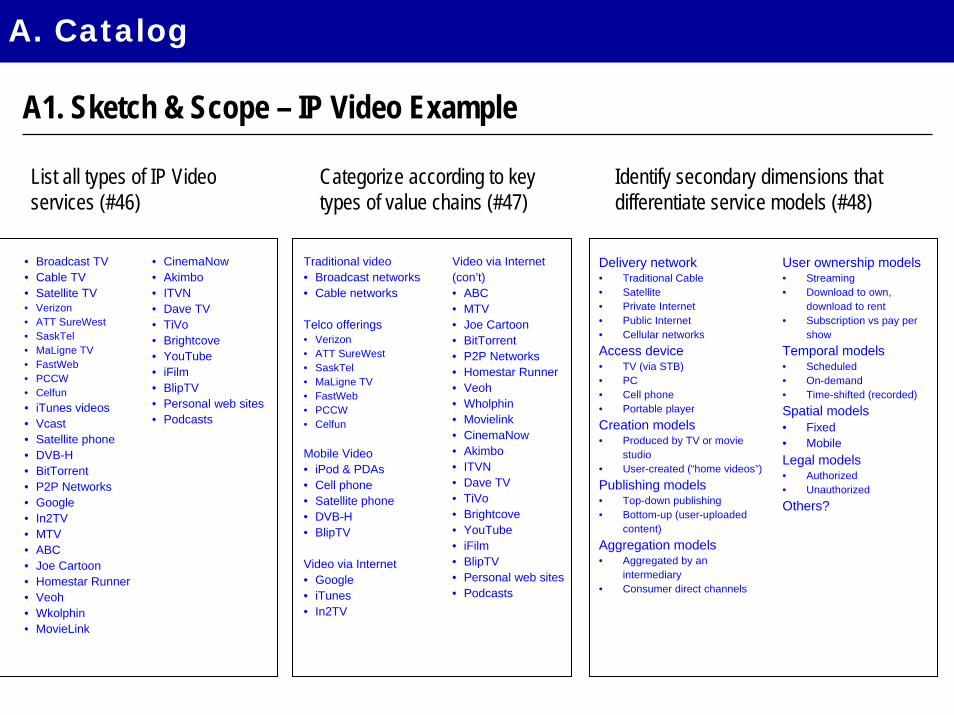
A1. Sketch & Scope – IP Video Example
Traditional video• Broadcast networks• Cable networks
Telco offerings• Verizon• ATT SureWest• SaskTel• MaLigne TV• FastWeb• PCCW• Celfun
Mobile Video• iPod & PDAs• Cell phone• Satellite phone• DVB-H• BlipTV
Video via Internet• Google• iTunes• In2TV
Video via Internet(con’t)• ABC• MTV• Joe Cartoon• BitTorrent• P2P Networks• Homestar Runner• Veoh• Wholphin• Movielink• CinemaNow• Akimbo• ITVN• Dave TV• TiVo• Brightcove• YouTube• iFilm• BlipTV• Personal web sites• Podcasts
A. Catalog
• Broadcast TV• Cable TV• Satellite TV• Verizon• ATT SureWest• SaskTel• MaLigne TV• FastWeb• PCCW• Celfun• iTunes videos• Vcast• Satellite phone• DVB-H• BitTorrent• P2P Networks• Google• In2TV• MTV• ABC• Joe Cartoon• Homestar Runner• Veoh• Wkolphin• MovieLink
• CinemaNow• Akimbo• ITVN• Dave TV• TiVo• Brightcove• YouTube• iFilm• BlipTV• Personal web sites• Podcasts
List all types of IP Video services (#46)
Categorize according to key types of value chains (#47)
Delivery network• Traditional Cable• Satellite• Private Internet • Public Internet• Cellular networksAccess device• TV (via STB)• PC• Cell phone• Portable playerCreation models• Produced by TV or movie
studio• User-created (“home videos”)Publishing models• Top-down publishing• Bottom-up (user-uploaded
content)Aggregation models• Aggregated by an
intermediary• Consumer direct channels
User ownership models• Streaming• Download to own,
download to rent• Subscription vs pay per
showTemporal models• Scheduled• On-demand • Time-shifted (recorded)Spatial models• Fixed• MobileLegal models• Authorized• UnauthorizedOthers?
Identify secondary dimensions that differentiate service models (#48)

A1. Sketch & Scope – IP Video Example
A. Catalog
• YouTubeTV• Veoh• iFilm• BlipTV
Use
r up
load
ed
Traditional IP Video
IPTVScheduled & on-demand
Viewed on TV via private Internet Internet Video
Scheduled & on-demand (mostly on-demand)Viewed on PC via public Internet
Authorized Unauthorized
Aggregated Direct
Streaming Download Streaming Download
Streaming Download
Mobile TVScheduled & On-demand
Viewed on cell phone
TVPC
Cell phone iPod
Top
-dow
n pu
blis
hed
Consumer video services
•Broadcast•Cable •Satellite
• Verizon (FiOS) (US)• ATT (US)• SureWest (US)• SaskTel (Canada)• PCCW (China)• FastWeb (Italy)• MaLigneTV (France)• Celfun TV (S.Korea)
• MTV• ABC• JoeCartoon• Homestar- runner
• ??
• ??? • P2P sites
• iTunes• Google• Movielink (films only)• BitTorrent
• In2TV (AOL)
• Akimbo• ITVN• Dave TV• TiVO+Brightcove
• 2G (Sprint TV)• 3G – Verizon VCast• DVB-H• Satellite phones
• Personal video blogs & Web sites• Podcasts
Use
r up
load
ed
Traditional IP Video
IPTVScheduled & on-demand
Viewed on TV via private Internet Internet Video
Scheduled & on-demand (mostly on-demand)Viewed on PC via public Internet
Authorized Unauthorized
Aggregated Direct
Streaming Download Streaming Download
Streaming Download
Mobile TVScheduled & On-demand
Viewed on cell phone
TVPC
Cell phone iPod
Top
-dow
n pu
blis
hed
Consumer video services
•Broadcast•Cable •Satellite
• Verizon (FiOS) (US)• ATT (US)• SureWest (US)• SaskTel (Canada)• PCCW (China)• FastWeb (Italy)• MaLigneTV (France)• Celfun TV (S.Korea)
• MTV• ABC• JoeCartoon• Homestar- runner
• ??
• ??? • P2P sites
• iTunes• Google• Movielink (films only)
• In2TV (AOL)
• Akimbo• ITVN• Dave TV• TiVO+Brightcove
• 2G (Sprint TV)• 3G – Verizon VCast• DVB-H• Satellite phones
• Personal video blogs & Web sites• Podcasts
STB + content via private Internet
User-based file-sharing(download only)
Cell phone TV
Published content via public Internet
STB + content via public Internet
Portable Internet video
DVB
User-uploaded content for downloading & streaming
(authorized?)
Show service types based on different dimensions in a graphic format if useful, and populate with services (#50)
Identify high-level categories (#51)
Value Chain Dynamics Toolkit
Business Models I
Control points
Delivery infrastructureService
infrastructure
Management infrastructure
Business Models II
CPCsValue annotation
S/D graphsOver time
Gear Teeth Gear Teethtable
System Dynamics Modeling Causal loops
Deconstruct
Selection of services
Sketch and Scope
Service transactions
CPCs
S/D graphsCurrent
CorenessMapping I
CorenessMapping II
Indicates more complex processes that provide deeper analysis
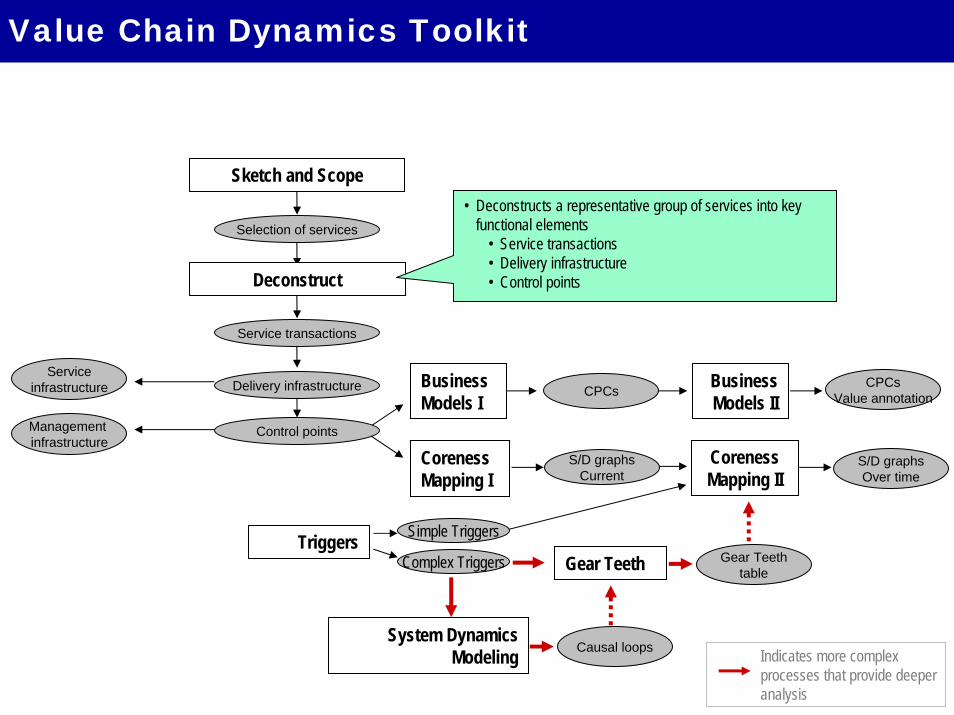
• Deconstructs a representative group of services into key functional elements
• Service transactions• Delivery infrastructure• Control points
Complex Triggers
Simple TriggersTriggers
Value Chain Dynamics Toolkit
Business Models I
Control points
Delivery infrastructureService
infrastructure
Management infrastructure
Business Models II
CPCsValue annotation
S/D graphsOver time
Gear Teeth Gear Teethtable
System Dynamics Modeling Causal loops
Deconstruct
Selection of services
Sketch and Scope
Service transactions
CPCs
S/D graphsCurrent
CorenessMapping I
CorenessMapping II
Indicates more complex processes that provide deeper analysis
• Service transactions refer to the individual functions that comprise a service
Complex Triggers
Simple TriggersTriggers
The delivery infrastructure refers to the architectural components required to deliver and consume the various service transactions
• Any point at which management can be applied• Control points are the most important output of
Deconstruct and form the basis of the following exercises
• They are a key unit of analysis in the methodology
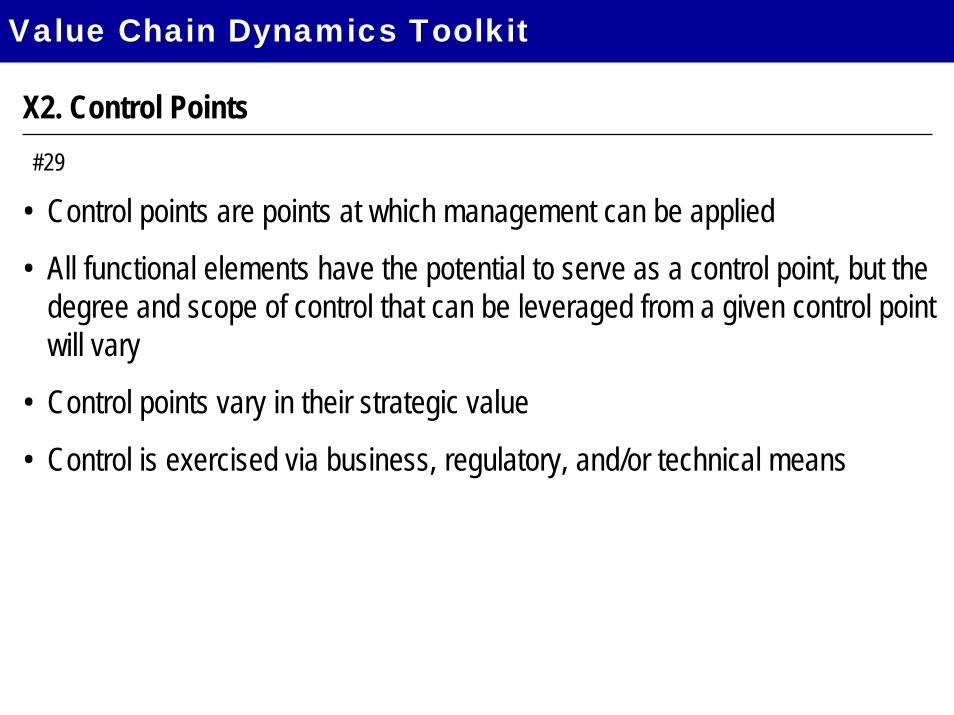
X2. Control Points
• Control points are points at which management can be applied
• All functional elements have the potential to serve as a control point, but the degree and scope of control that can be leveraged from a given control point will vary
• Control points vary in their strategic value
• Control is exercised via business, regulatory, and/or technical means
Value Chain Dynamics Toolkit
#29
#30
Access to the service provider’s storefront via a Web browser, proprietary P2P software, or embedded in playback software
The music store aggregates and distributes authorized (or “available”) digital files in the appropriate format. This is the actual music service.
Making of the computers/ cell phones for accessing communication networks and playing files.
Making of the jukebox (playback) software for playing music on the 1ary device
Making of the portable players/ cell phone Making of the portable
player jukebox (playback) software for playing music
Distribution of portable player jukebox software
Communication network for connecting to service provider (Internet, cellular networks or ad hoc P2P)
Dist. of computers/ cell phones
Transfer connection (USB, Bluetooth, etc.)
Distribution of jukebox software for the 1ary device
Distribution of portable players/ cell phone
Music store networkconnection
sourcing device & software
transferconnection
portable device & software
The
mus
ic s
tore
1ary
dev
ice
crea
tion
1ary
Dev
ice
dist
ribut
ion
1ary
juke
box
+ D
RM
softw
are
crea
tion
1ary
juke
box
+ D
RM
softw
are
dist
ribut
ion
2ary
Dev
ice
crea
tion
2ary
Dev
ice
dist
ribut
ion
2ary
juke
box
+ D
RM
Softw
are
crea
tion
2ary
juke
box
+ D
RM
Softw
are
dist
ribut
ion
1ary
dev
ice
(Net
wor
k)C
onne
ctiv
ity
Stor
efro
ntin
terfa
ce
1ary
dev
ice
OS
crea
tion
1ary
dev
ice
OS
dist
ribut
ion
2ary
dev
ice
Con
nect
ivity
2ary
dev
ice
OS
crea
tion
2ary
dev
ice
OS
dist
ribut
ion
Creation of computer/ cell phone OS
Dist. of computer/ cell phone OS
Creation of computer/ cell phone OS
Dist. of computer/ cell phone OS
Cont
rol
Poin
ts
X2. Control Points – Digital Music Services example
Value Chain Dynamics Toolkit
Value Chain Dynamics Toolkit
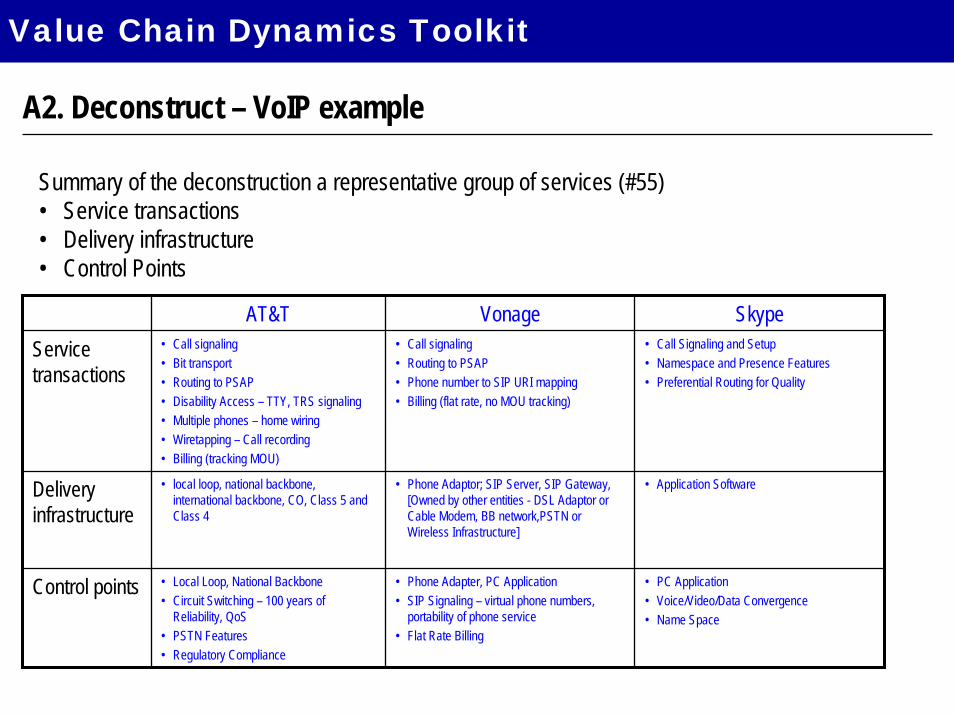
A2. Deconstruct – VoIP example
AT&T Vonage SkypeService transactions
• Call signaling• Bit transport• Routing to PSAP• Disability Access – TTY, TRS signaling• Multiple phones – home wiring• Wiretapping – Call recording• Billing (tracking MOU)
• Call signaling• Routing to PSAP• Phone number to SIP URI mapping• Billing (flat rate, no MOU tracking)
• Call Signaling and Setup• Namespace and Presence Features• Preferential Routing for Quality
Control points • Local Loop, National Backbone• Circuit Switching – 100 years of
Reliability, QoS• PSTN Features• Regulatory Compliance
• Phone Adapter, PC Application• SIP Signaling – virtual phone numbers,
portability of phone service• Flat Rate Billing
• PC Application• Voice/Video/Data Convergence• Name Space
Delivery infrastructure
• local loop, national backbone, international backbone, CO, Class 5 and Class 4
• Phone Adaptor; SIP Server, SIP Gateway, [Owned by other entities - DSL Adaptor or Cable Modem, BB network,PSTN or Wireless Infrastructure]
• Application Software
Summary of the deconstruction a representative group of services (#55) • Service transactions• Delivery infrastructure• Control Points
Triggers
Value Chain Dynamics Toolkit
Business Models I
Control points
Delivery infrastructureService
infrastructure
Management infrastructure
Business Models II
CPCsValue annotation
S/D graphsOver time
Gear Teeth Gear Teethtable
System Dynamics Modeling Causal loops
Deconstruct
Selection of services
Sketch and Scope
Service transactions
CPCs
S/D graphsCurrent
CorenessMapping I
CorenessMapping II
Indicates more complex processes that provide deeper analysis
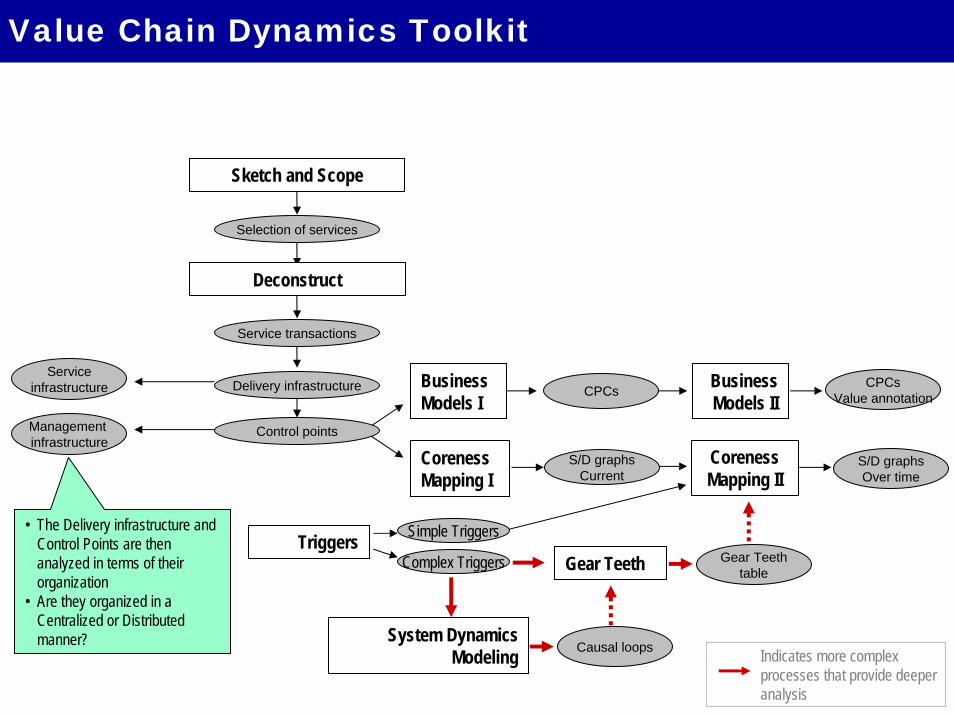
• The Delivery infrastructure and Control Points are then analyzed in terms of their organization
• Are they organized in a Centralized or Distributed manner?
Complex Triggers
Simple Triggers
Value Chain Dynamics Toolkit
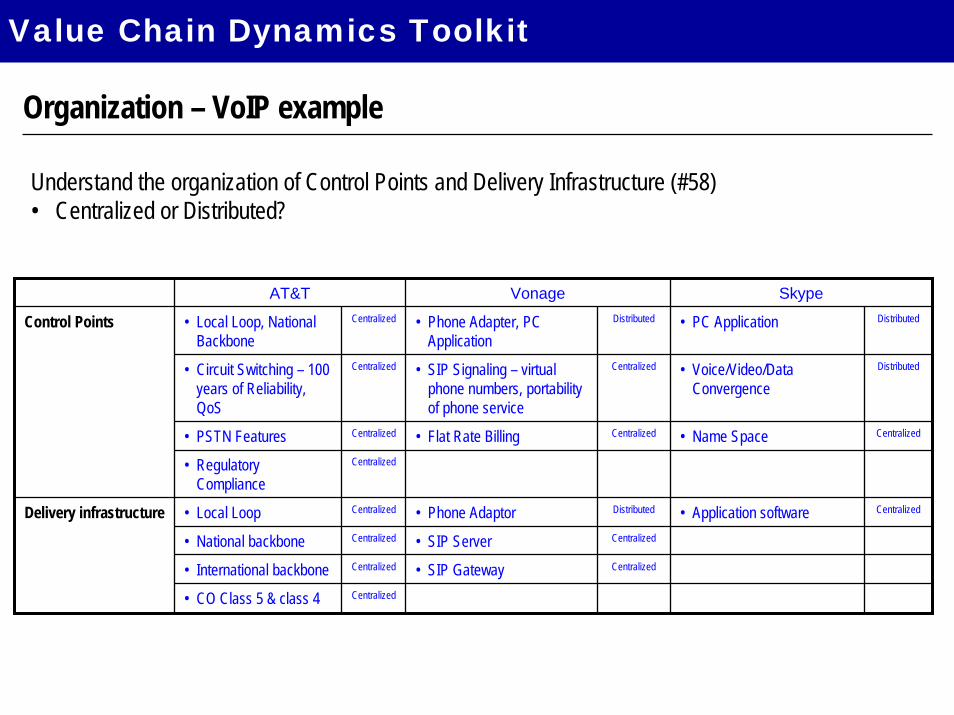
Organization – VoIP example
AT&T Vonage Skype
• Local Loop, National Backbone
Centralized • Phone Adapter, PC Application
Distributed • PC Application Distributed
• Circuit Switching – 100 years of Reliability, QoS
Centralized • SIP Signaling – virtual phone numbers, portability of phone service
Centralized • Voice/Video/Data Convergence
Distributed
• National backbone Centralized • SIP Server Centralized
• International backbone Centralized • SIP Gateway Centralized
• CO Class 5 & class 4 Centralized
• PSTN Features Centralized • Flat Rate Billing Centralized • Name Space Centralized
• Regulatory Compliance
Centralized
• Local Loop Centralized • Phone Adaptor Distributed • Application software CentralizedDelivery infrastructure
Control Points
Understand the organization of Control Points and Delivery Infrastructure (#58)• Centralized or Distributed?

Value Chain Dynamics Toolkit
Business Models I
Control points
Delivery infrastructureService
infrastructure
Management infrastructure
Business Models II
CPCsValue annotation
S/D graphsOver time
Gear Teeth Gear Teethtable
System Dynamics Modeling Causal loops
Deconstruct
Selection of services
Sketch and Scope
Service transactions
CPCs
S/D graphsCurrent
CorenessMapping I
CorenessMapping II
Indicates more complex processes that provide deeper analysis
• The Business Models tools examine how the Control Points are organized to produce a service offering.
Complex Triggers
Simple TriggersTriggers
Value Chain Dynamics Toolkit
Business Models I
Control points
Delivery infrastructureService
infrastructure
Management infrastructure
Business Models II
CPCsValue annotation
S/D graphsOver time
Gear Teeth Gear Teethtable
System Dynamics Modeling Causal loops
Deconstruct
Selection of services
Sketch and Scope
Service transactions
CPCs
S/D graphsCurrent
CorenessMapping I
CorenessMapping II
Indicates more complex processes that provide deeper analysis
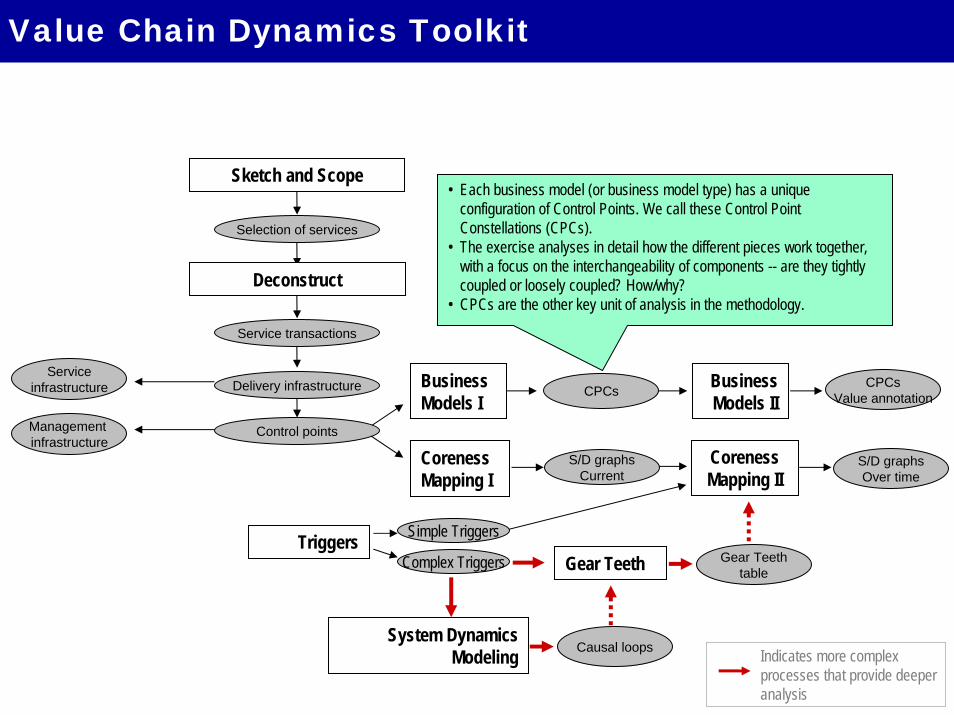
• Each business model (or business model type) has a unique configuration of Control Points. We call these Control Point Constellations (CPCs).
• The exercise analyses in detail how the different pieces work together, with a focus on the interchangeability of components -- are they tightly coupled or loosely coupled? How/why?
• CPCs are the other key unit of analysis in the methodology.
Complex Triggers
Simple TriggersTriggers
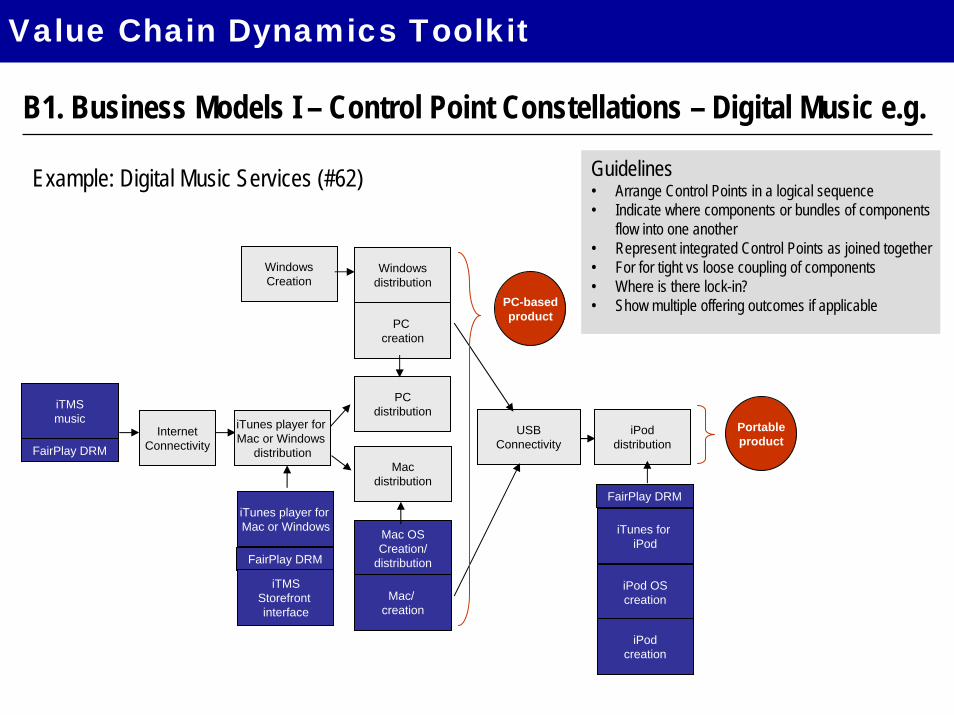
B1. Business Models I – Control Point Constellations – Digital Music e.g.
Example: Digital Music Services (#62)
iTMSmusic
InternetConnectivity
Mac OSCreation/
distribution
Macdistribution
iTunes player for Mac or Windows
Mac/ creation
USBConnectivity
iPod OScreation
iPoddistribution
iTunes for iPod
iPodcreation
FairPlay DRM
FairPlay DRM
FairPlay DRM
PC-basedproduct
Portableproduct
iTunes player for Mac or Windows
distribution
PCdistribution
Windowsdistribution
PC creation
iTMSStorefront interface
WindowsCreation
Guidelines• Arrange Control Points in a logical sequence• Indicate where components or bundles of components
flow into one another• Represent integrated Control Points as joined together• For for tight vs loose coupling of components• Where is there lock-in?• Show multiple offering outcomes if applicable
Value Chain Dynamics Toolkit

B1. Business Models I – Control Point Constellations – Digital Music e.g.
For more complex service industries, look for high level categories of CPCs (#63)O
nlin
e so
urci
ngM
obile
sou
rcin
g
DRM-free content DRM’d content
iTunesMusic Store
MS-basedMusic stores
MobileCarrier services
P2P networks& Indie Web sites
• Wireless carriers build their own music stores
• MS-based stores supported by the Windows Media Player
• DRM ties music to WMP, which is tied to the Windows platform
• Services provided by device manufactures like Apple (iTMS) and Sony (Connect)
• Dominated by iTunes• Proprietary DRM (FairPlay)
ties music to iPods
User-controlled networks and independent artists/ labels
support “free” and/or untethered music models
Value Chain Dynamics Toolkit
Value Chain Dynamics Toolkit
Business Models I
Control points
Delivery infrastructureService
infrastructure
Management infrastructure
Business Models II
CPCsValue annotation
S/D graphsOver time
Gear Teeth Gear Teethtable
System Dynamics Modeling Causal loops
Deconstruct
Selection of services
Sketch and Scope
Service transactions
CPCs
S/D graphsCurrent
CorenessMapping I
CorenessMapping II
Indicates more complex processes that provide deeper analysis
• Annotate control points with some measure of value. • Value is most easily measured in terms of revenue, it could also
include market share. It can also include non-monetary measures like customers, loyalty, etc.
Complex Triggers
Simple TriggersTriggers
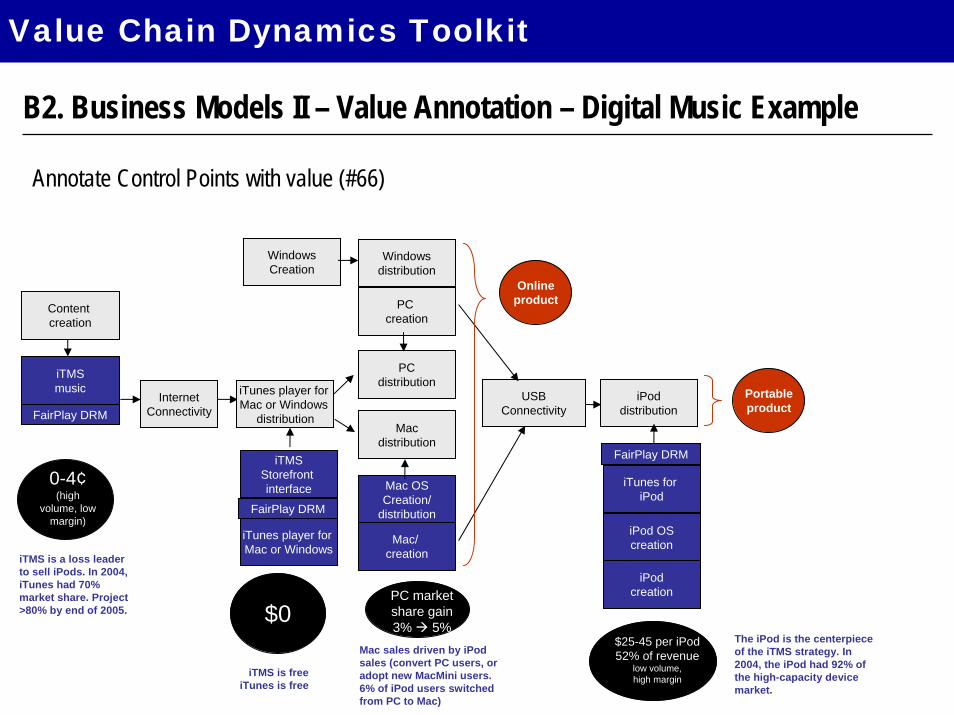
B2. Business Models II – Value Annotation – Digital Music Example
Annotate Control Points with value (#66)
Content creation
iTMSmusic
InternetConnectivity
Mac OSCreation/
distribution
Macdistribution
iTMSStorefront interface
Mac/ creation
USBConnectivity
iPod OScreation
iPoddistribution
iTunes for iPod
iPodcreation
FairPlay DRM
FairPlay DRM
FairPlay DRM
Onlineproduct
Portableproduct
iTMS is a loss leader to sell iPods. In 2004, iTunes had 70% market share. Project >80% by end of 2005.
The iPod is the centerpiece of the iTMS strategy. In 2004, the iPod had 92% of the high-capacity device market.
Mac sales driven by iPodsales (convert PC users, or adopt new MacMini users. 6% of iPod users switched from PC to Mac)
iTMS is freeiTunes is free
iTunes player for Mac or Windows
distribution
PCdistribution
Windowsdistribution
PC creation
iTunes player for Mac or Windows
WindowsCreation
0-4¢(high
volume, low margin)
$0$25-45 per iPod52% of revenue
low volume,high margin
PC market share gain 3% 5%
Value Chain Dynamics Toolkit

Value Chain Dynamics Toolkit
Business Models I
Control points
Delivery infrastructureService
infrastructure
Management infrastructure
Business Models II
CPCsValue annotation
S/D graphsOver time
Gear Teeth Gear Teethtable
System Dynamics Modeling Causal loops
Deconstruct
Selection of services
Sketch and Scope
Service transactions
CPCs
S/D graphsCurrent
CorenessMapping I
CorenessMapping II
Indicates more complex processes that provide deeper analysis
• Deeper analysis of market conditions (competitiveness) for individual Control Points and the service offering as a whole.
• Market conditions are analyzed in terms of “Scarcity & Demand”
Complex Triggers
Simple TriggersTriggers
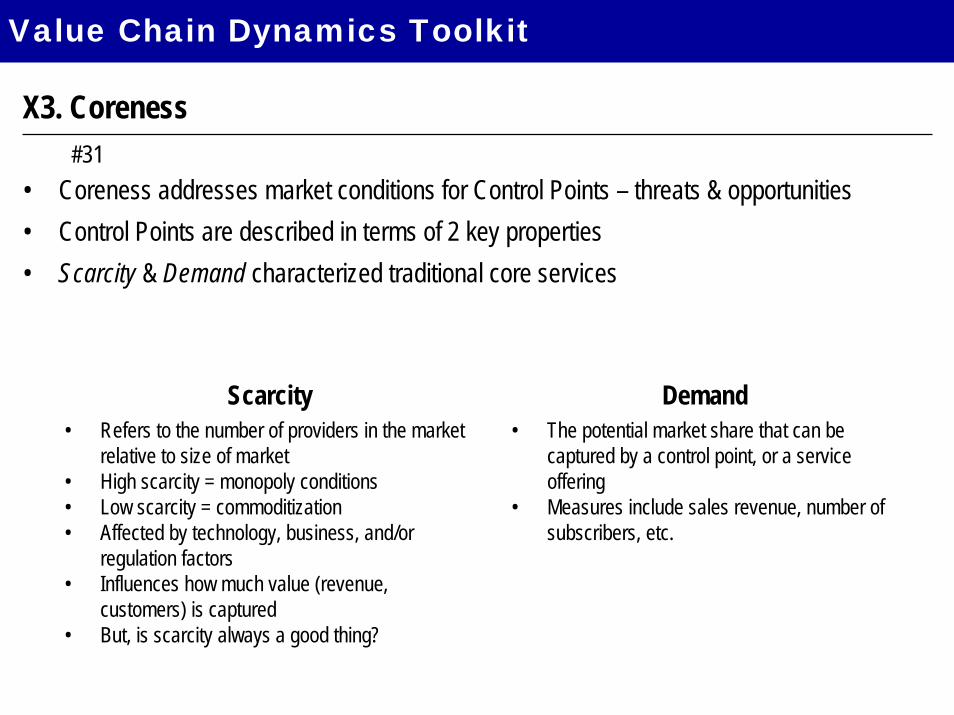
X3. Coreness
• Coreness addresses market conditions for Control Points – threats & opportunities• Control Points are described in terms of 2 key properties• Scarcity & Demand characterized traditional core services
Scarcity• Refers to the number of providers in the market
relative to size of market • High scarcity = monopoly conditions• Low scarcity = commoditization• Affected by technology, business, and/or
regulation factors• Influences how much value (revenue,
customers) is captured• But, is scarcity always a good thing?
Demand• The potential market share that can be
captured by a control point, or a service offering
• Measures include sales revenue, number of subscribers, etc.
Value Chain Dynamics Toolkit
#31
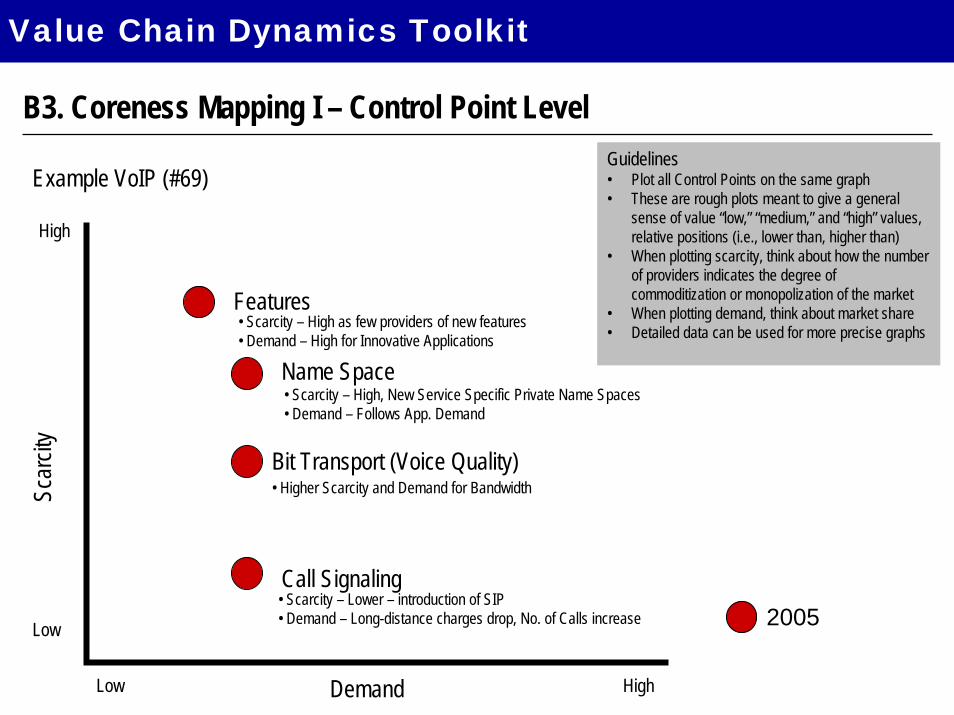
B3. Coreness Mapping I – Control Point Level
Example VoIP (#69)
Demand
Scar
city
• Scarcity – High as few providers of new features• Demand – High for Innovative Applications
Features
Bit Transport (Voice Quality)• Higher Scarcity and Demand for Bandwidth
Call Signaling
• Scarcity – High, New Service Specific Private Name Spaces• Demand – Follows App. Demand
Name Space
High
Low
Low High
Guidelines• Plot all Control Points on the same graph• These are rough plots meant to give a general
sense of value “low,” “medium,” and “high” values, relative positions (i.e., lower than, higher than)
• When plotting scarcity, think about how the number of providers indicates the degree of commoditization or monopolization of the market
• When plotting demand, think about market share• Detailed data can be used for more precise graphs
• Scarcity – Lower – introduction of SIP• Demand – Long-distance charges drop, No. of Calls increase 2005
Value Chain Dynamics Toolkit
Demand
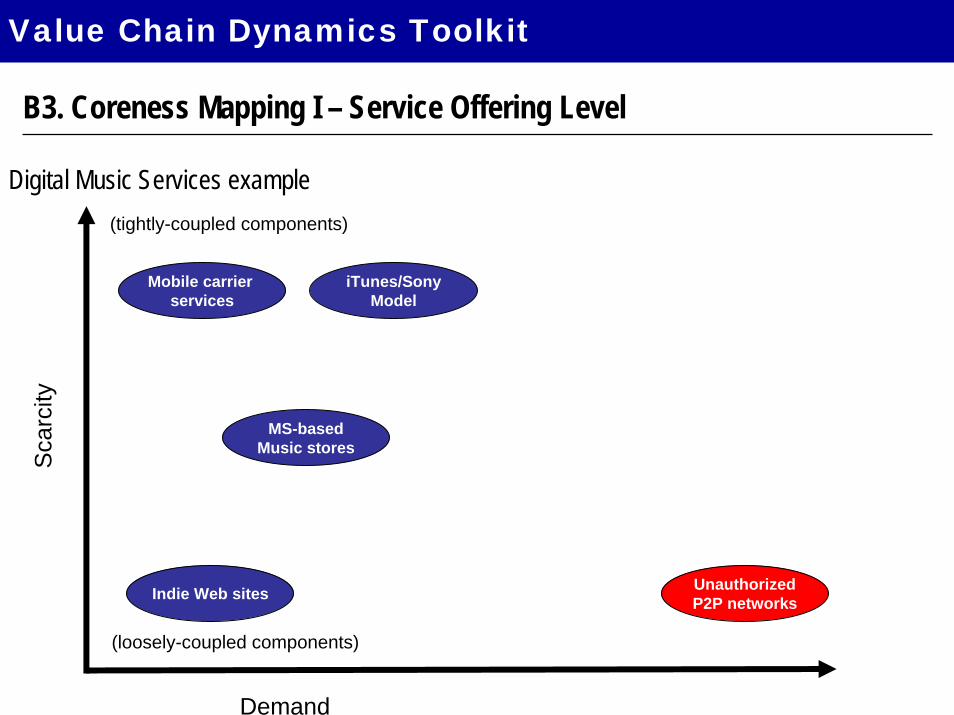
Digital Music Services example
Sca
rcity
iTunes/SonyModel
MS-basedMusic stores
Mobile carrier services
UnauthorizedP2P networksIndie Web sites
(tightly-coupled components)
B3. Coreness Mapping I – Service Offering Level
(loosely-coupled components)
Value Chain Dynamics Toolkit

Triggers
Value Chain Dynamics Toolkit
Business Models I
Control points
Delivery infrastructureService
infrastructure
Management infrastructure
Business Models II
CPCsValue annotation
S/D graphsOver time
Gear Teeth Gear Teethtable
System Dynamics Modeling Causal loops
Deconstruct
Selection of services
Sketch and Scope
Service transactions
CPCs
S/D graphsCurrent
CorenessMapping I
CorenessMapping II
Indicates more complex processes that provide deeper analysis
• Coreness is first analyzed in the current environment, but the idea is to get a sense of the future, based on an understanding of Triggers – the forces that will cause changes in market conditions.
• How sustainable is the business model?• Trigger dynamics can be analyzed in
simple or complex terms.
Complex Triggers
Simple Triggers
Triggers
Value Chain Dynamics Toolkit
Business Models I
Control points
Delivery infrastructureService
infrastructure
Management infrastructure
Business Models II
CPCsValue annotation
S/D graphsOver time
Gear Teeth Gear Teethtable
System Dynamics Modeling Causal loops
Deconstruct
Selection of services
Sketch and Scope
Service transactions
CPCs
S/D graphsCurrent
CorenessMapping I
CorenessMapping II
Indicates more complex processes that provide deeper analysis
• Simple triggers include 4 key types –Technology, Business, Regulatory, as well as Behavioral.
• These triggers are applied to the S/D graphs from Coreness Mapping I to show changes over time Complex Triggers
Simple Triggers
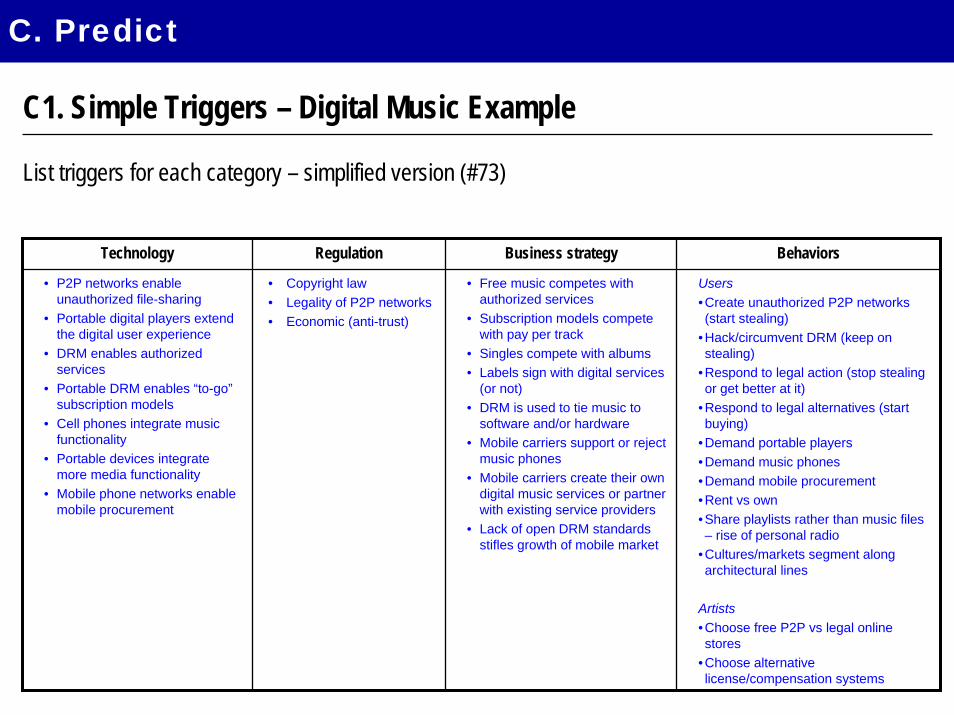
C. Predict
C1. Simple Triggers – Digital Music Example
List triggers for each category – simplified version (#73)
Technology Regulation Business strategy Behaviors
• P2P networks enable unauthorized file-sharing
• Portable digital players extend the digital user experience
• DRM enables authorized services
• Portable DRM enables “to-go”subscription models
• Cell phones integrate music functionality
• Portable devices integrate more media functionality
• Mobile phone networks enable mobile procurement
• Copyright law • Legality of P2P networks• Economic (anti-trust)
• Free music competes with authorized services
• Subscription models compete with pay per track
• Singles compete with albums• Labels sign with digital services
(or not)• DRM is used to tie music to
software and/or hardware• Mobile carriers support or reject
music phones• Mobile carriers create their own
digital music services or partner with existing service providers
• Lack of open DRM standards stifles growth of mobile market
Users•Create unauthorized P2P networks (start stealing)
•Hack/circumvent DRM (keep on stealing)
•Respond to legal action (stop stealing or get better at it)
•Respond to legal alternatives (start buying)
•Demand portable players •Demand music phones•Demand mobile procurement•Rent vs own•Share playlists rather than music files – rise of personal radio
•Cultures/markets segment along architectural lines
Artists•Choose free P2P vs legal online stores
•Choose alternative license/compensation systems

Value Chain Dynamics Toolkit
Business Models I
Control points
Delivery infrastructureService
infrastructure
Management infrastructure
Business Models II
CPCsValue annotation
S/D graphsOver time
Gear Teeth Gear Teethtable
System Dynamics Modeling Causal loops
Deconstruct
Selection of services
Sketch and Scope
Service transactions
CPCs
S/D graphsCurrent
CorenessMapping I
CorenessMapping II
Indicates more complex processes that provide deeper analysis
• Based on a simple view of triggers, changes in the market conditions (i.e., changes in Scarcity and Demand) of individual Control Points can be predicted.
• Changes in the market conditions for the service offering as a whole can also be examined
• This tool provides the ultimate set of insights in Value Chain Dynamics
Complex Triggers
Simple TriggersTriggers
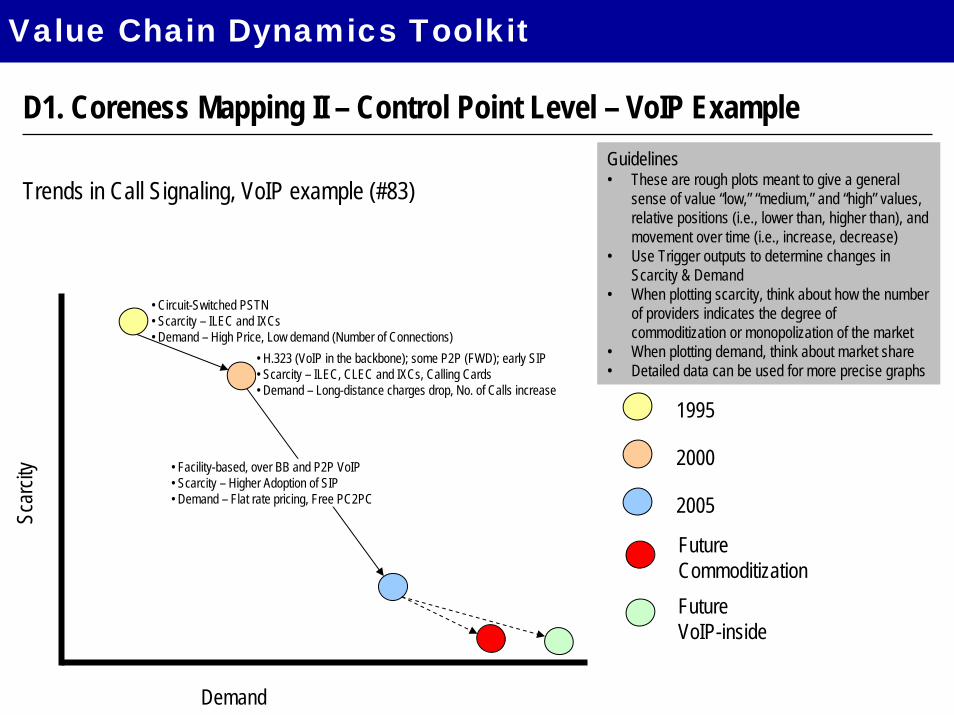
Guidelines• These are rough plots meant to give a general
sense of value “low,” “medium,” and “high” values, relative positions (i.e., lower than, higher than), and movement over time (i.e., increase, decrease)
• Use Trigger outputs to determine changes in Scarcity & Demand
• When plotting scarcity, think about how the number of providers indicates the degree of commoditization or monopolization of the market
• When plotting demand, think about market share• Detailed data can be used for more precise graphs
Demand
Scar
city
• Circuit-Switched PSTN• Scarcity – ILEC and IXCs• Demand – High Price, Low demand (Number of Connections)
• H.323 (VoIP in the backbone); some P2P (FWD); early SIP• Scarcity – ILEC, CLEC and IXCs, Calling Cards • Demand – Long-distance charges drop, No. of Calls increase
• Facility-based, over BB and P2P VoIP• Scarcity – Higher Adoption of SIP• Demand – Flat rate pricing, Free PC2PC
1995
2000
2005
FutureVoIP-inside
FutureCommoditization
D1. Coreness Mapping II – Control Point Level – VoIP Example
Trends in Call Signaling, VoIP example (#83)
Value Chain Dynamics Toolkit

D1. Coreness Mapping II – Service Offering Level – LBS example
The future of Location Based Services (#85)
Demand
Scar
city 1995
2000
2005
Future
Demand Stagnation
Widely Available
Operator Dominance
Guidelines• [Insert explanation for how to view Service
Offerings as “sum total” of Control Points.] • These are rough plots meant to give a general
sense of value “low,” “medium,” and “high” values, relative positions (i.e., lower than, higher than), and movement over time (i.e., increase, decrease)
• When plotting scarcity, think about how the number of providers indicates the degree of commoditization or monopolization of the market
• When plotting demand, think about market share• Detailed data can be used for more precise graphs
Value Chain Dynamics Toolkit
Value Chain Dynamics Toolkit
Business Models I
Control points
Delivery infrastructureService
infrastructure
Management infrastructure
Business Models II
CPCsValue annotation
S/D graphsOver time
Gear Teeth Gear Teethtable
System Dynamics Modeling Causal loops
Deconstruct
Selection of services
Sketch and Scope
Service transactions
CPCs
S/D graphsCurrent
CorenessMapping I
CorenessMapping II
Indicates more complex processes that provide deeper analysis
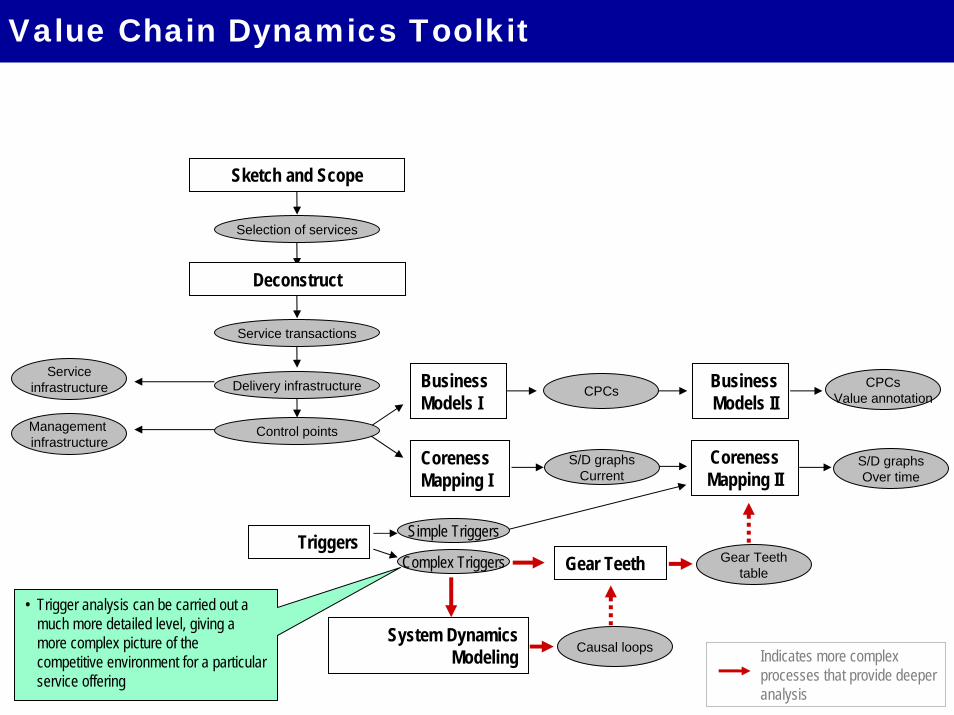
• Trigger analysis can be carried out a much more detailed level, giving a more complex picture of the competitive environment for a particular service offering
Complex Triggers
Simple TriggersTriggers
Value Chain Dynamics Toolkit
Business Models I
Control points
Delivery infrastructureService
infrastructure
Management infrastructure
Business Models II
CPCsValue annotation
S/D graphsOver time
Gear Teeth Gear Teethtable
System Dynamics Modeling Causal loops
Deconstruct
Selection of services
Sketch and Scope
Service transactions
CPCs
S/D graphsCurrent
CorenessMapping I
CorenessMapping II
Indicates more complex processes that provide deeper analysis
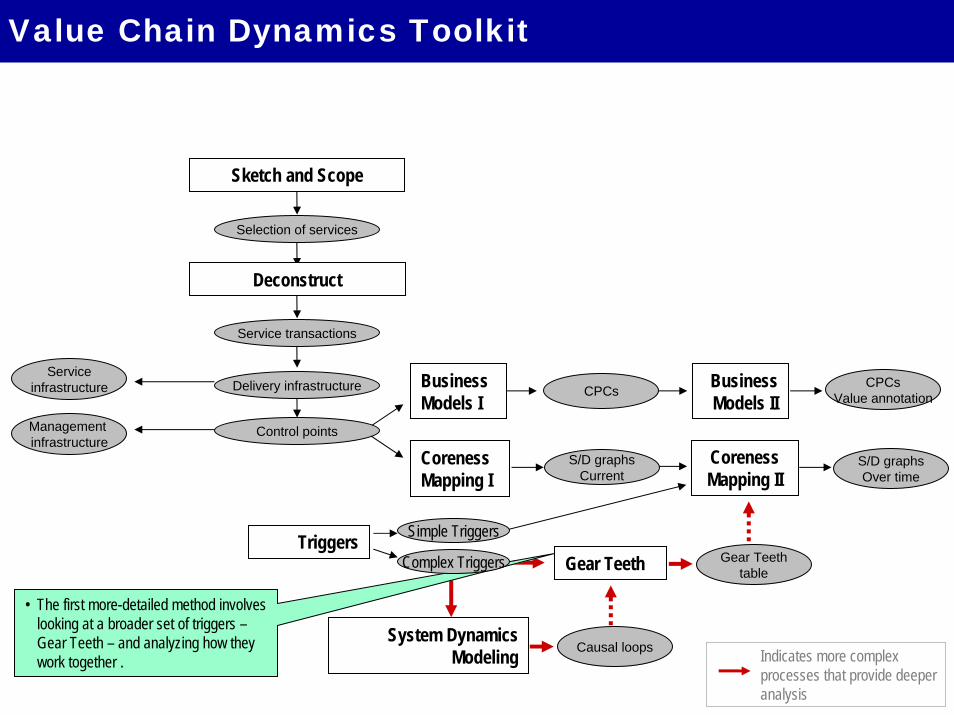
• The first more-detailed method involves looking at a broader set of triggers –Gear Teeth – and analyzing how they work together .
Complex Triggers
Simple TriggersTriggers

C1. Complex Triggers – VoIP exampleList triggers for each category of Gears -- complex version (#72)
convergenceVoIP capable devicesvoice qualityfeature integrationservice mobility optionsnumber portability optionsavailability of virtual phone numberssecondary phone numbers per linesecurity technologiesprivacy technologiesencryption schemesLatencyVoIP applicationsarbitrage opportunitynew Features availableavailable featuressize of namespacePSTN interconnectivitylegacy feature Compatibilitybroadband deploymentend-to-end IP networksWiFi HotspotsWiMax deploymentcommunity networks
Technology Industry Structure Business Cyclepropensity for deregulationsubsidiesbarrier to entrycost of regulationunbundling local loopcongressional pressurepublic pressurelobbyingregulationssocial regulationeconomic regulationinterconnection chargestime to develop technology to meet regulatory needstechnology availble to meet regulatory needsfeasibility of developing technologyregulatory delaysregulatory unclarity
monthly priceVoice communications costcost pressurespressure to reduce deployment costspressure to reduce operation costsnumber of service providersnumber of equipment providersNumber of developersservice and installation personelle
call blockingeconomic arbitragelobbyingnumber of basic service providersnumber of premium service providersservice availabilitymonthly priceprice bundlingin-service calling planscost of registring on the namespace
Customer Preferencesdemand for featuresstickiness to serviceconcern for privacyconcern for securitytolerance for voice qualityperceived coolnesspeer pressure
Corp. Strategy
number of basic service providers
number of equipment providers
mergers and acquisitions
Number of Namespaces
number of premium service providersnumber of service providers
vertical disintegrationvertical integration
Regulation
demand for featuresstickiness to serviceconcern for privacyconcern for securitytolerance for voice qualityperceived coolnesspeer pressure
Regulation
Value Chain Dynamics Toolkit

X4. Complex Trigger Dynamics
• Trigger dynamics examine the forces that cause changes in business models and industry value chains
• Our approach takes into account 7 types of triggers, viewed in relation to one another, as a set of interlocking gears:
• Technology• Regulation• Customer preference• Corporate strategy• Business cycles• Industry structure• Capital market
Corporate Strategy
Dynamics
TechnologyDynamics
CustomerPreferenceDynamics
Regulatory Policy
Dynamics
IndustryStructureDynamics
BusinessCycle
Dynamics
CapitalMarket
Dynamics
Value Chain Dynamics Toolkit
p. 33-42

It begins with Technology Dynamics
TechnologyDynamics
Moore’s LawAnd the Internet
X4. Complex Trigger Dynamics
Value Chain Dynamics Toolkit

New Technology drives Corporate Investments
Corporate Strategy
Dynamics
TechnologyDynamics
Moore’s LawAnd the Internet
Technology Shift
Investment inTechnology
X4. Complex Trigger Dynamics
Value Chain Dynamics Toolkit
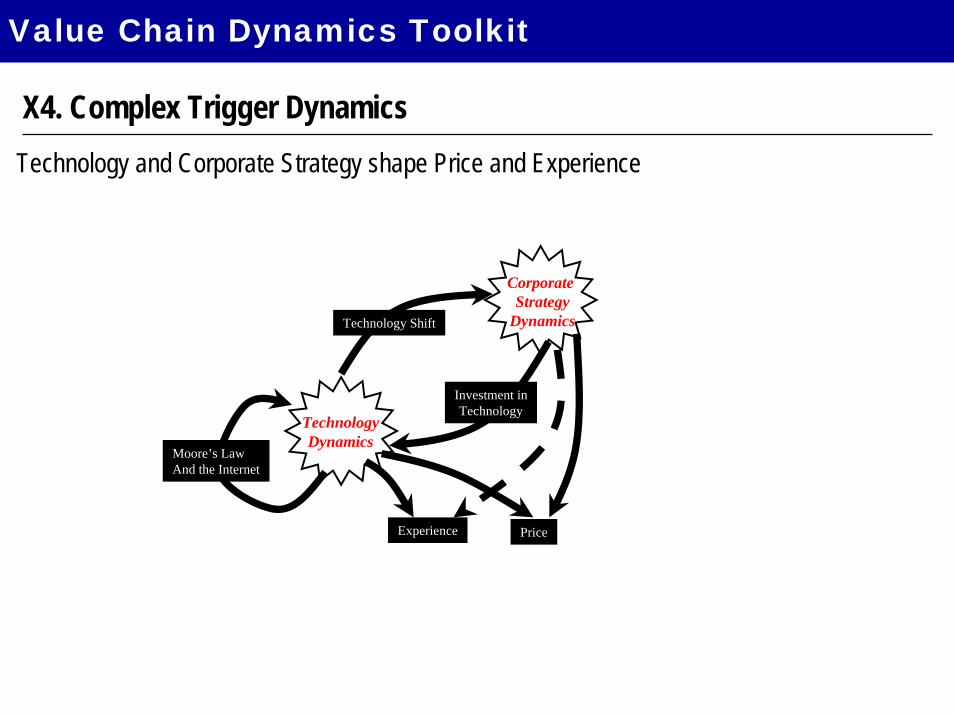
Technology and Corporate Strategy shape Price and Experience
Corporate Strategy
Dynamics
TechnologyDynamics
Moore’s LawAnd the Internet
Technology Shift
Investment inTechnology
Experience Price
X4. Complex Trigger Dynamics
Value Chain Dynamics Toolkit
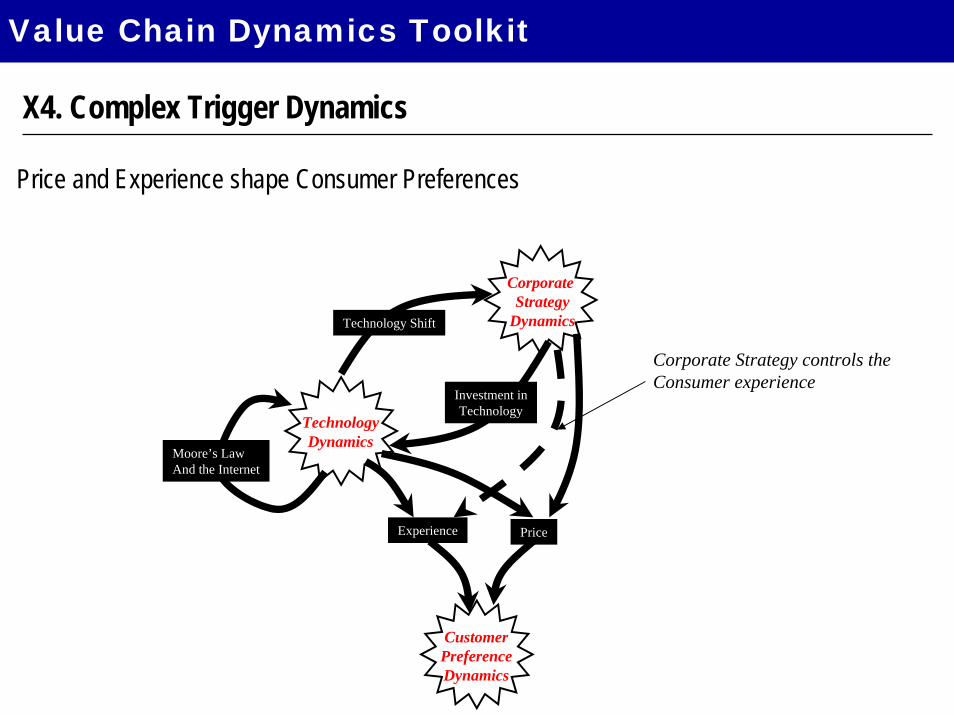
Price and Experience shape Consumer Preferences
Corporate Strategy
Dynamics
TechnologyDynamics
Moore’s LawAnd the Internet
Technology Shift
Investment inTechnology
Experience Price
CustomerPreferenceDynamics
Corporate Strategy controls the Consumer experience
X4. Complex Trigger Dynamics
Value Chain Dynamics Toolkit

Consumer Preferences churn Technology and Corporate Strategy Dynamics
Corporate Strategy
Dynamics
TechnologyDynamics
Moore’s LawAnd the Internet
Technology Shift
Investment inTechnology
Experience Price
CustomerPreferenceDynamics
New Requirements
RateOf
Diffusion
X4. Complex Trigger Dynamics
Value Chain Dynamics Toolkit
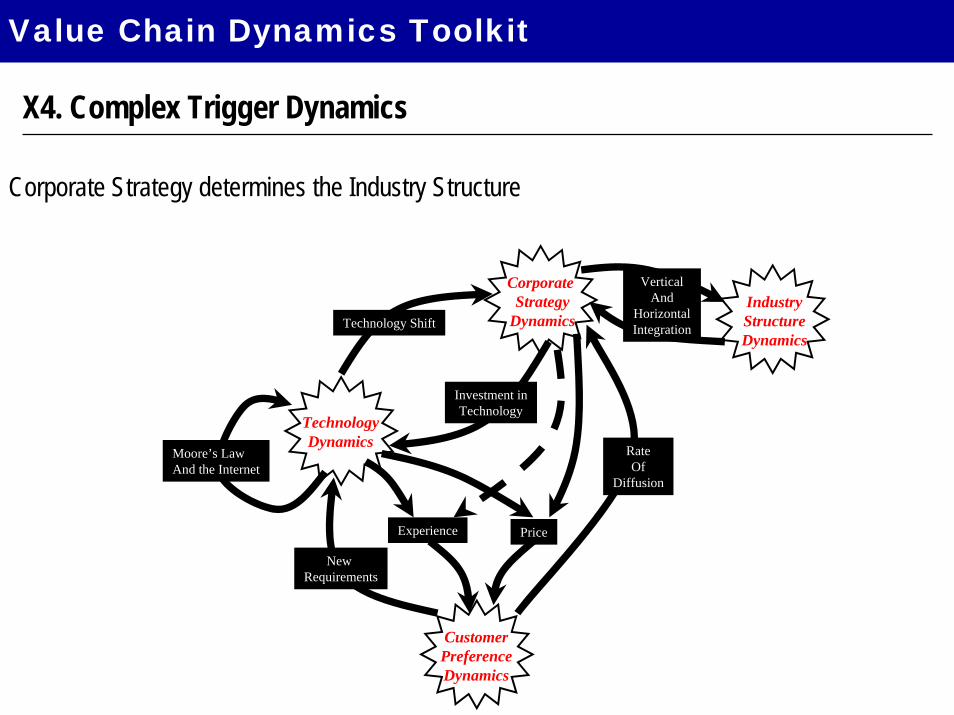
Corporate Strategy determines the Industry Structure
Corporate Strategy
Dynamics
TechnologyDynamics
Moore’s LawAnd the Internet
Technology Shift
Investment inTechnology
Experience Price
CustomerPreferenceDynamics
New Requirements
RateOf
Diffusion
IndustryStructureDynamics
VerticalAnd
HorizontalIntegration
X4. Complex Trigger Dynamics
Value Chain Dynamics Toolkit
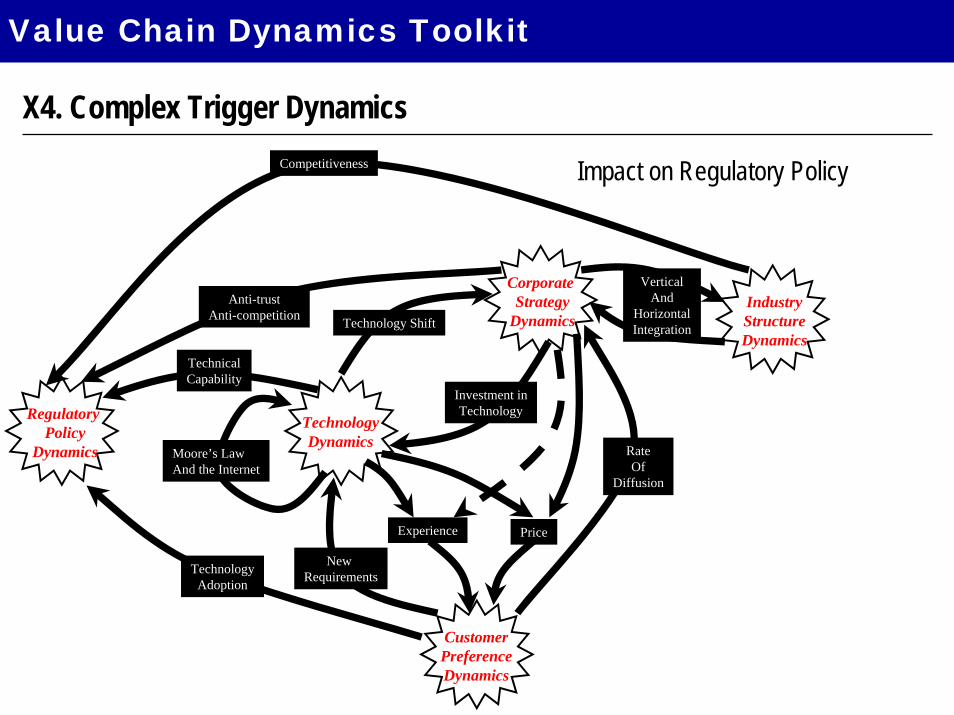
Impact on Regulatory Policy
Corporate Strategy
Dynamics
TechnologyDynamics
Moore’s LawAnd the Internet
Technology Shift
Investment inTechnology
Experience Price
CustomerPreferenceDynamics
New Requirements
RateOf
Diffusion
Regulatory Policy
Dynamics
Anti-trustAnti-competition
TechnicalCapability
TechnologyAdoption
IndustryStructureDynamics
VerticalAnd
HorizontalIntegration
Competitiveness
X4. Complex Trigger Dynamics
Value Chain Dynamics Toolkit
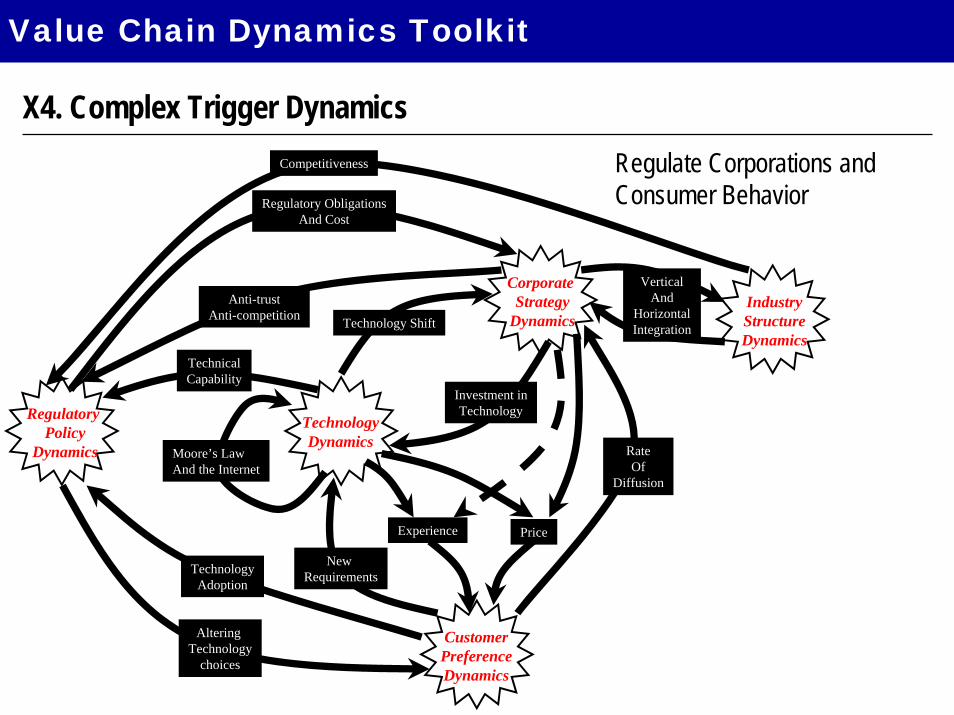
Regulate Corporations and Consumer Behavior
Corporate Strategy
Dynamics
TechnologyDynamics
Moore’s LawAnd the Internet
Technology Shift
Investment inTechnology
Experience Price
CustomerPreferenceDynamics
New Requirements
RateOf
Diffusion
Regulatory Policy
Dynamics
Anti-trustAnti-competition
TechnicalCapability
TechnologyAdoption
IndustryStructureDynamics
VerticalAnd
HorizontalIntegration
Competitiveness
Regulatory ObligationsAnd Cost
Altering Technology
choices
X4. Complex Trigger Dynamics
Value Chain Dynamics Toolkit
Business Cycle and Capital Market Dynamics
Corporate Strategy
Dynamics
TechnologyDynamics
Moore’s LawAnd the Internet
Technology Shift
Investment inTechnology
Experience Price
CustomerPreferenceDynamics
New Requirements
RateOf
Diffusion
Regulatory Policy
Dynamics
Anti-trustAnti-competition
TechnicalCapability
TechnologyAdoption
IndustryStructureDynamics
VerticalAnd
HorizontalIntegration
Competitiveness
Regulatory ObligationsAnd Cost
Altering Technology
choices
BusinessCycle
Dynamics
CapitalMarket
Dynamics
Surplus for Investment
X4. Complex Trigger Dynamics
Value Chain Dynamics Toolkit
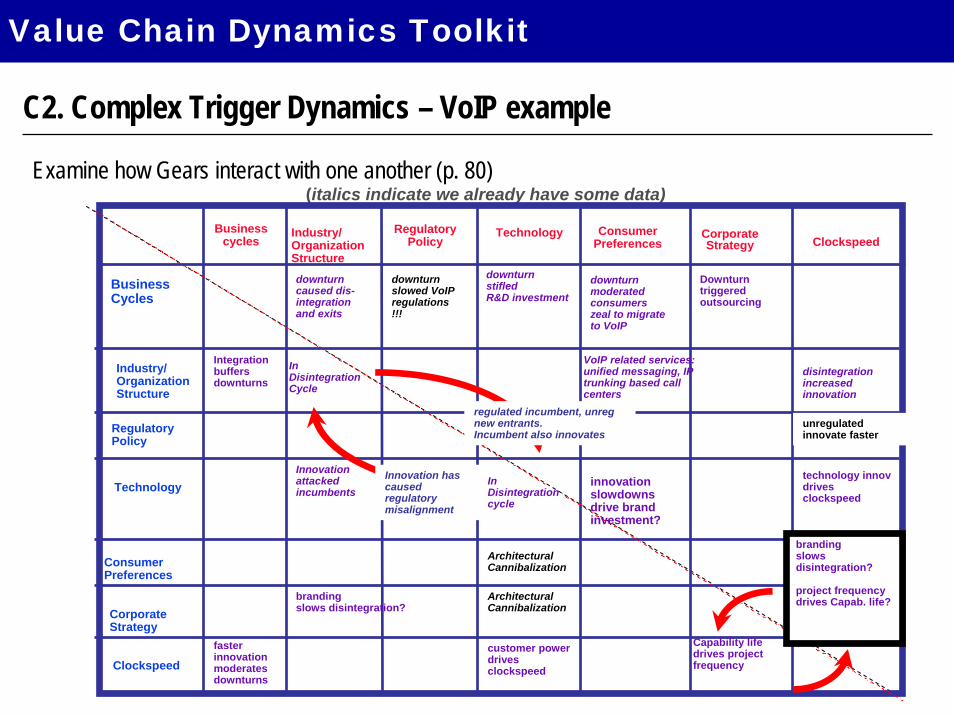
C2. Complex Trigger Dynamics – VoIP example
Examine how Gears interact with one another (p. 80)(italics indicate we already have some data)
Businesscycles
TechnologyRegulatoryPolicy
Industry/OrganizationStructure
ConsumerPreferences
BusinessCycles
CorporateStrategy
downturn caused dis-integration and exits
downturnstifledR&D investment
Downturntriggeredoutsourcing
Clockspeed
fasterinnovationmoderatesdownturns
Industry/Organization Structure
Regulatory Policy
Technology
ConsumerPreferences
Corporate Strategy
Clockspeed
Integrationbuffersdownturns
Innovation attacked incumbents
innovationslowdowns drive brand investment?
brandingslows disintegration?
InDisintegration Cycle
VoIP related services: unified messaging, IP trunking based call centers
In Disintegration cycle
Capability life drives project frequency
brandingslows disintegration?
project frequency drives Capab. life?
customer power drives clockspeed
technology innov drives clockspeed
disintegration increased innovation
regulated incumbent, unreg new entrants.Incumbent also innovates
Innovation has caused regulatory misalignment
unregulated innovate faster
downturn slowed VoIP regulations!!!
downturn moderated consumers zeal to migrate to VoIP
Architectural Cannibalization
Architectural Cannibalization
Value Chain Dynamics Toolkit
Business Models I
Control points
Delivery infrastructureService
infrastructure
Management infrastructure
Business Models II
CPCsValue annotation
S/D graphsOver time
Gear Teeth Gear Teethtable
System Dynamics Modeling Causal loops
Deconstruct
Selection of services
Sketch and Scope
Service transactions
CPCs
S/D graphsCurrent
CorenessMapping I
CorenessMapping II
Indicates more complex processes that provide deeper analysis
• SD Modeling uses gives an even deeper look at the sub-dynamics of the specific triggers and their influence on one another, and the outcomes these might produce.
Value Chain Dynamics Toolkit
Complex Triggers
Simple TriggersTriggers