nat ether-meter devices mmg...
TRANSCRIPT

NAT Ether-Meter Devices
Management Module Guide
®
9031529E3i
Notice
Cabletron Systems reserves the right to make changes in specifications and other information contained in this document without prior notice. The reader should in all cases consult Cabletron Systems to determine whether any such changes have been made.
The hardware, firmware, or software described in this manual is subject to change without notice.
IN NO EVENT SHALL CABLETRON SYSTEMS BE LIABLE FOR ANY INCIDENTAL, INDIRECT, SPECIAL, OR CONSEQUENTIAL DAMAGES WHATSOEVER (INCLUDING BUT NOT LIMITED TO LOST PROFITS) ARISING OUT OF OR RELATED TO THIS MANUAL OR THE INFORMATION CONTAINED IN IT, EVEN IF CABLETRON SYSTEMS HAS BEEN ADVISED OF, KNOWN, OR SHOULD HAVE KNOWN, THE POSSIBILITY OF SUCH DAMAGES.
Virus Disclaimer
Cabletron has tested its software with current virus checking technologies. However, because no anti-virus system is 100% reliable, we strongly caution you to write protect and then verify that the Licensed Software, prior to installing it, is virus-free with an anti-virus system in which you have confidence.
Cabletron Systems makes no representations or warranties to the effect that the Licensed Software is virus-free.
Copyright © April 1998, by Cabletron Systems, Inc. All rights reserved.
Printed in the United States of America.
Order Number: 9031529e4
Cabletron Systems, Inc.P.O. Box 5005Rochester, NH 03866-5005
SPECTRUM
, the
SPECTRUM
IMT/VNM
logo,
DCM
,
IMT
, and
VNM
are registered trademarks, and
SpectroGRAPH
,
SpectroSERVER
,
Inductive Modeling Technology
,
Device Communications Manager
, and
Virtual Network Machine
are trademarks of Cabletron Systems, Inc.
C++
is a trademark of American Telephone and Telegraph, Inc.
UNIX
is a trademark of UNIX System Laboratories, Inc.
OSF/Motif
and
Motif
are trademarks of the Open Software Foundation, Inc.
X Window System
is a trademark of X Consortium, Inc.
Ethernet
is a trademark of Xerox Corporation.
iiNAT EtherMeter Devices
Management Module Guide
Restricted Rights Notice
(Applicable to licenses to the United States Government only.)
1. Use, duplication, or disclosure by the Government is subject to restrictions as set forth in subparagraph (c) (1) (ii) of the Rights in Technical Data and Computer Software clause at DFARS 252.227-7013.
Cabletron Systems, Inc., 35 Industrial Way, Rochester, New Hampshire 03866-5005.
2. (a) This computer software is submitted with restricted rights. It may not be used, reproduced, or disclosed by the Government except as provided in paragraph (b) of this Notice or as otherwise expressly stated in the contract.
(b) This computer software may be:
(1) Used or copied for use in or with the computer or computers for which it was acquired, including use at any Government installation to which such computer or computers may be transferred;
(2) Used or copied for use in a backup computer if any computer for which it was acquired is inoperative;
(3) Reproduced for safekeeping (archives) or backup purposes;
(4) Modified, adapted, or combined with other computer software, provided that the modified, combined, or adapted portions of the derivative software incorporating restricted computer software are made subject to the same restricted rights;
(5) Disclosed to and reproduced for use by support service contractors in accordance with subparagraphs (b) (1) through (4) of this clause, provided the Government makes such disclosure or reproduction subject to these restricted rights; and
(6) Used or copied for use in or transferred to a replacement computer.
(c) Notwithstanding the foregoing, if this computer software is published copyrighted computer software, it is licensed to the Government, without disclosure prohibitions, with the minimum rights set forth in paragraph (b) of this clause.
(d) Any other rights or limitations regarding the use, duplication, or disclosure of this computer software are to be expressly stated in, or incorporated in, the contract.
(e) This Notice shall be marked on any reproduction of this computer software, in whole or in part.

9031529e4iii
ContentsContents
Preface
What Is in This Guide .......................................................................................................... xiConventions ......................................................................................................................... xiiRelated SPECTRUM Documentation................................................................................ xiiiOther Related Documentation ........................................................................................... xiiiGetting Help ....................................................................................................................... xiv
Chapter 1 Introduction
What Is in This Chapter..................................................................................................... 1-1NAT EtherMeter Management Module ............................................................................ 1-1NAT EtherMeter Model Types........................................................................................... 1-2NAT EtherMeter Applications ........................................................................................... 1-2
Chapter 2 Device View
What Is in This Chapter..................................................................................................... 2-1Accessing the Device View ................................................................................................. 2-1NAT EtherMeter Device View ........................................................................................... 2-2Logical Interface Icons ....................................................................................................... 2-4
Interface Number/Device Topology View Label.......................................................... 2-4IF Status View Label ................................................................................................... 2-5Interface Type/IF Configuration View Label .............................................................. 2-5Physical Address/IF Address Translation Table Label .............................................. 2-6Network Information Panel Label .............................................................................. 2-6Logical Gauge/Performance View Label ..................................................................... 2-7
Interface Options Panel...................................................................................................... 2-7Find............................................................................................................................... 2-7Network Information ................................................................................................... 2-7Interface Description ................................................................................................... 2-7
Gauge Control Panel .......................................................................................................... 2-8Selected Attribute ........................................................................................................ 2-8Gauge Mode.................................................................................................................. 2-8Gauge Type................................................................................................................... 2-9Gauge Control Panel Buttons...................................................................................... 2-9
Interface Performance View............................................................................................. 2-10Multi-Attribute Line Graph ...................................................................................... 2-10
Multi-Attribute Line Graph Buttons.................................................................. 2-10Additional Buttons..................................................................................................... 2-11

Contents NAT Ether-Meter Devicesiv Management Module Guide
Chapter 3 ConfigurationViews
What Is in This Chapter .....................................................................................................3-1NAT EtherMeter Device Configuration View....................................................................3-1
Community Names Alias Configuration View ............................................................3-3Modem Configuration View..........................................................................................3-4EtherMeter Download Control View ...........................................................................3-4NAT EtherMeter Accessing Hosts Configuration View..............................................3-6
Accessing Hosts Table ............................................................................................3-6Telephone Number and Traps Table .....................................................................3-7
Network Parameters Configuration View ...................................................................3-8
Chapter 4 Event and Alarm Messages
What Is in This Chapter .....................................................................................................4-1NAT EtherMeter Events and Alarms ................................................................................4-1
Chapter 5 Application View
What Is in This Chapter .....................................................................................................5-1NATMeter Application Views .............................................................................................5-1Accessing the Application View..........................................................................................5-2NATMeter Application........................................................................................................5-5
NATMeter Application Views ......................................................................................5-5EtherMeter Specific Configuration View ..............................................................5-5EtherMeter Performance Graphical Display........................................................5-7EtherMeter Error Statistics Display View ...........................................................5-7EtherMeter Top Ten Table Views ........................................................................5-10
EtherMeter Protocols (E-Type) Table ...........................................................5-11EtherMeter Summary Statistics Display View ..................................................5-12
NAT-Alerts Application Views ...................................................................................5-13EtherMeter Alert Configuration View ................................................................5-13Frame Rate Alert Configuration View ................................................................5-14Broadcast Alerts Configuration View..................................................................5-15Error Alerts Configuration View .........................................................................5-16Utilization Alert Configuration View ..................................................................5-17Multicast Alerts Configuration View ..................................................................5-18
NAT Configuration Application Views ......................................................................5-18NAT EtherMeter Device Configuration View.....................................................5-19NAT EtherMeter Accessing Hosts Configuration View .....................................5-19EtherMeter Download Control View...................................................................5-19Modem Configuration View .................................................................................5-19Community Names Alias Configuration View....................................................5-19Network Parameters Configuration View...........................................................5-20
Extended RMON Application ...........................................................................................5-20EtherMeter Extended RMON Configuration View...................................................5-20EtherMeter RMON Statistics Tables ........................................................................5-23

9031529e4 Contentsv
Chapter 5 Application View (continued)
RMON Statistics Configuration Detail View ..................................................... 5-25RMON Statistics Performance View................................................................... 5-25RMON Statistics Detail View ............................................................................. 5-25
EtherMeter RMON History Tables ........................................................................... 5-26EtherMeter RMON Host Tables Control View ......................................................... 5-27RMON Host TopN Tables........................................................................................... 5-29
TopN Host Table View ......................................................................................... 5-31RMON Matrix Tables View........................................................................................ 5-31RMON Events/Alarms Tables Configuration View .................................................. 5-33
Alarm Table.......................................................................................................... 5-33Event Table .......................................................................................................... 5-35
RMON Filter and Channel Configuration View....................................................... 5-37Filter Table........................................................................................................... 5-37Channel Table ...................................................................................................... 5-38
RMON Packet Capture Buffer Control View............................................................ 5-40EtherMeter IP Mapping Tables Control View .......................................................... 5-41EtherMeter New Node Discovery Control View ....................................................... 5-42
Standard RMON Application........................................................................................... 5-45
Index

Contents NAT Ether-Meter Devicesvi Management Module Guide

9031529e4vii
FiguresFigures
Chapter 2 Device View
Figure 2-1. Accessing the Device View ................................................................................... 2-2Figure 2-2. NAT EtherMeter Device View .............................................................................. 2-3Figure 2-3. Logical Interface Icon ........................................................................................... 2-4
Chapter 5 Application View
Figure 5-1. Accessing the Application View ........................................................................... 5-2Figure 5-2. NAT EtherMeter Application View (Icon Mode) ................................................. 5-3Figure 5-3. Application View (List Mode) ............................................................................... 5-4

Figures NAT Ether-Meter Devicesviii Management Module Guide
9031529e4ix
Tables Tables
Chapter 2 Device View
Table 2-1. Interface Status Label Definitions ....................................................................... 2-5Table 2-2. Totals and Percentages Mode Attributes and Color Definitions ........................ 2-8Table 2-3. Rates Mode Attributes and Color Definitions...................................................... 2-9Table 2-4. Packet Breakdown Pie Chart.............................................................................. 2-11Table 2-5. Error Breakdown Pie Chart................................................................................ 2-12Table 2-6. Discard Breakdown Pie Chart ............................................................................ 2-12
Chapter 3 ConfigurationViews
Table 3-1. Valid Status Entries .............................................................................................. 3-5Table 3-2. Valid Access Levels................................................................................................ 3-7
Chapter 4 Event and Alarm Messages
Table 4-1. NAT EtherMeter Events and Alarms................................................................... 4-1
Chapter 5 Application View
Table 5-1. NATMeter Application Model Types .................................................................... 5-5Table 5-2. Available Top Ten Selection Criterion ................................................................. 5-6Table 5-3. NATMeter Application Color Definitions............................................................. 5-7Table 5-4. Error Breakdown Pie Chart.................................................................................. 5-9Table 5-5. Top Ten View Information .................................................................................. 5-11Table 5-6. Valid Status Entries ............................................................................................ 5-23Table 5-7. Valid Status Entries ............................................................................................ 5-26Table 5-8. Valid Status Entries ............................................................................................ 5-28Table 5-9. Valid Status Entries ............................................................................................ 5-29Table 5-10. Valid Status Entries ............................................................................................ 5-32Table 5-11. Valid Status Entries ............................................................................................ 5-33Table 5-12. Valid Sample Types ............................................................................................. 5-34Table 5-13. Valid Status Entries ............................................................................................ 5-36Table 5-14. Valid Action Entries ............................................................................................ 5-36Table 5-15. Valid AcceptType Entries.................................................................................... 5-38Table 5-16. Valid Event Status Entries ................................................................................. 5-39Table 5-17. Valid Status Entries ............................................................................................ 5-42Table 5-18. Valid Status Entries ............................................................................................ 5-44Table 5-19. Valid Control Mode Entries ................................................................................ 5-45

Tables NAT Ether-Meter Devicesx Management Module Guide

9031529e4xi
Preface
What Is in This Guide
Use this guide if you are going to manage a NAT EtherMeter device through SPECTRUM. Before reading this manual, you should be familiar with SPECTRUM’s functions and operation. You should also be familiar with any network management and hardware requirements described in the related documentation.
The following chapter descriptions outline the organization of the
NAT EtherMeter Management Module Guide
.
NOTE
The NAT EtherMeter Management Module requires that RMON be installed and functioning on the network. You should be familiar with RMON and SPECTRUM’s management of it, as described in the
SPECTRUM Management Module Guide for RMON.
Chapter Description
Chapter 1
Introduction
Describes the NatEthMeter management module.
Chapter 2
Device View
Describes the Device View’s logical representation of a NAT EtherMeter device, as well as the views available from the Device Menu.
Chapter 3
Configuration Views
Describes the Configuration views available for the NatEthMeter management module.

Conventions
Preface NAT Ether-Meter Devicesxii Management Module Guide
Conventions
In this manual the following conventions are used.
• Command names are printed in
bold
; for example,
Clear
or
Save & Close
.
• Menu selections to access a view are printed in
bold
; for example,
Configuration
or
Detail
.
• Buttons are represented by a shadowed box; for example,
• Book and chapter titles are printed in
italics
; for example,
SPECTRUM System User’s Guide
or
Application View
.
Chapter 4
Alarms and Events View
Contains a listing and explanation of the alarm/events in the Event Log or Alarm View for the NatEthMeter device model type.
Chapter 5
Application View
Describes the Application View and view information for all applications supported by the NAT EtherMeter device.
Chapter Description
Help

9031529e4 Prefacexiii
Related SPECTRUM Documentation
Related SPECTRUM Documentation
When using this guide, you should have a clear understanding of SPECTRUM functionality and navigation techniques as described in the Administration and Operation, and following documentation:
SPECTRUM Report Generator User’s Guide
Getting Started with SPECTRUM for Operators
Getting Started with SPECTRUM for Administrators
Managing Your Network with SPECTRUM
Other Related Documentation
Refer to the following documentation for more information on managing TCP/IP-based networks:
LAN Troubleshooting Handbook
, Mark Miller (1989, M&T Publishing, Inc.)
The Simple Book — An Introduction to Management of TCP/IP-based Internets
, Marshall T. Rose, Performance Systems International, Inc.
Computer Networks
, Andrew S. Tanenbaum, Prentice-Hall, Inc.
Local Area Networks Architectures and Implementations
, James Martin & Kathleen K. Chapman for the Arben Group, Inc. (1989, Prentice-Hall, Inc.)

Getting Help
Preface NAT Ether-Meter Devicesxiv Management Module Guide
Getting Help
For additional support for SPECTRUM products, or to make comments or suggestions regarding SPECTRUM or this manual, contact Cabletron Systems Technical Support via one of the following means:
Location Mail FAX Telephone
North America
Cabletron Systems, Inc.P. O. Box 5005Rochester, NH 03866-5005
E-mail:
603-337-3075 603-337-3500
Europe
Cabletron Systems, Ltd.Network HouseNewbury Business ParkLondon Road, NewburyBerkshire, England RG13 2PZ
E-mail:
(*)-44-635-552062 (*)-44-635-580000
Pacific
Cabletron Systems, Inc.Allambie Grove Estate25 French’s Forest Road EastFrench’s Forest, NSW 2086Sydney, Australia
E-mail:
(*)-61-2-950-5950 (*)-61-2-950-5900
Japan
Cabletron Systems, KKHamamatsucho MK Bldg.4th Floor1-4-12 Kaigan, Minato-KuTokyo 101 Japan
E-mail:
(*)-81-3-3459-1985 (*)-81-3-3459-1981
Singapore
Cabletron Systems, Inc.85 Science Park Drive#03-03/04The CavendishSingapore 051
E-mail:
(*)-65-7763382 (*)-65-7755355
Germany
Cabletron Systems GmbHDreieich ParkIm Gefierth 13d63303 DreieichFrankfurt, Germany
E-mail:
(*)-49-6103/991-229 (*)-49-6103/991-269
*International Operator Code
Questions About SPECTRUM Documentation?
Send your questions, comments or suggestions regarding SPECTRUM documentation to the Technical Communications Department directly via the following internet address:

9031529e4Chapter 1–1
Chapter 1
Introduction
What Is in This ChapterThis chapter describes the SPECTRUM Management Module for the NAT EtherMeter devices. It also provides the model type names assigned to the NAT EtherMeter devices in SPECTRUM. The model type name refers to the template used to specify device attributes, actions, and associations for device models in SPECTRUM.
NAT EtherMeter Management ModuleThe NAT EtherMeter is a network device that collects statistics on the Ethernet network. The EtherMeters are polled through the network, and through intermediate bridges, routers, or concentrators. SPECTRUM’s network monitoring functions work with the EtherMeter to control and collect statictics, displaying the results in tables and in graphs.
NAT EtherMeter Model Types
Introduction NAT Ether-Meter DevicesChapter 1–2 Management Module Guide
NAT EtherMeter Model TypesThe NAT EtherMeter Management Module supports the following model types.
• LANB/250 Remote EtherMeter• LANB/450 Remote EtherMeter
The model type name for the meter appears on the text label at the bottom of the EtherMeter icon located in any applicable SPECTRUM view.
NAT EtherMeter ApplicationsThe NAT EtherMeter supports common and device-specific applications. Common applications are described inMIB II Applications, Bridging Applications, and Miscellaneous Applications and those listed below:
• MIB-II (SNMP2_Agent)- IP (IP2_App)- System (System2_App)- ICMP (ICMP_App)- UDP (UDP2_App)
The NAT EtherMeter supports device-specific applications. These applications are described in Chapter 5, Application Views, and are listed below.
• NatMetrApp• NAT_Alerts• NATCfgApp• Extended RMON
9031529e4Chapter 2–1
Chapter 2
Device View
What Is in This ChapterThis chapter describes the Device view for the NAT EtherMeter management module, including an explanation of the menu bar access to the various views used to control and monitor the device.
Accessing the Device ViewAccess the Device view through the Icon Subviews menu or the icon double-click zones.
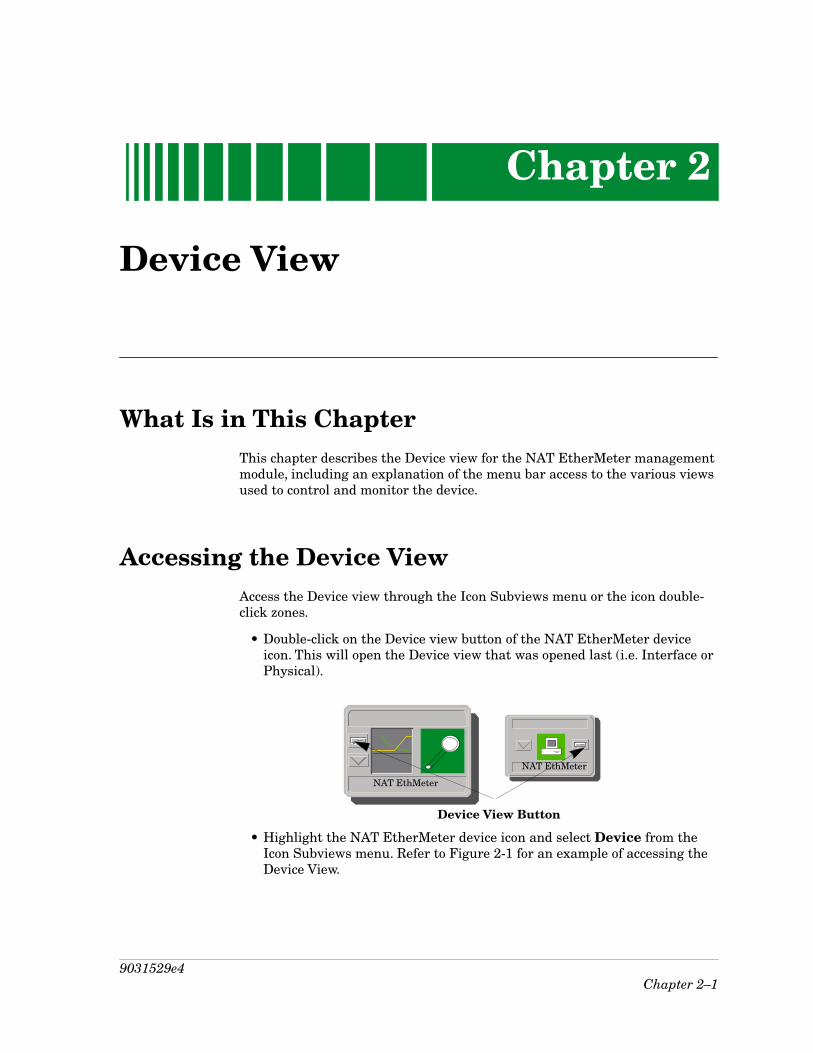
• Double-click on the Device view button of the NAT EtherMeter device icon. This will open the Device view that was opened last (i.e. Interface or Physical).
• Highlight the NAT EtherMeter device icon and select Device from the Icon Subviews menu. Refer to Figure 2-1 for an example of accessing the Device View.
Device View Button
NAT EthMeter
NAT EthMeter

NAT EtherMeter Device View
Device View NAT Ether-Meter DevicesChapter 2–2 Management Module Guide
Figure 2-1. Accessing the Device View
NAT EtherMeter Device ViewThe Device view allows you to view logical representations of the NAT EtherMeter’s interfaces. Each interface icon represents a port on the device. The Device view also provides you with menu access to the views that monitor and control the interfaces.
The logical representation in the Device view mirrors the actual configuration of the NAT EtherMeter device. If the configuration of the physical device changes, SPECTRUM makes the corresponding change within the Device view the next time it polls the device.
Figure 2-2 provides an example of a NAT EtherMeter Device view.
Clicking on the View
Icon SubView menu and selecting this choice accesses the Device View.

9031529e4 Device ViewChapter 2–3
NAT EtherMeter Device View
Figure 2-2. NAT EtherMeter Device View
* File View Help?
Primary Landscape 0x00400000 - VNM Host - NATEMeter of type NATEthMeter
Find
Interface Description
Network Information ADDRESSPhy Addr
1 OFFETHERNET
0
Model Name
Contact
Description
Location
Network Address System Up Time
Manufacturer
Device Type
Serial NumberPrimary-Application
NATEMeter
NAT EthMeter
2 ONSLIP
0

Logical Interface Icons
Device View NAT Ether-Meter DevicesChapter 2–4 Management Module Guide
Logical Interface IconsThe logical interface icons (refer to Figure 2-3) each have specific double-click zones and a pop-up menu.Access the menu by single-clicking on the logical interface icon, and then selecting Icon Subviews from the View menu. Figure 2-3 provides a breakdown of the interface icons, including applicable double-click zones and the available Icon Subviews menu selections. Following the figure is a more detailed description of each icon zone. Table 2-1 provides provides information for the logical interface Icon Subviews menu selections.
Figure 2-3. Logical Interface Icon
Interface Number/Device Topology View Label
This zone of the logical interface icon displays the number uniquely identifying this interface. Double-clicking on this zone accesses the Device Topology view.
1 ONETHERNET
0.0.1D.E.79.F5
0
(a) (b)
(c)(d)(e)(f)
(a) Interface Number/Device Topology View Label(b) IF Status/Interface Status View Label
(d) Physical Address/IF Address Translation Table Label
Label / Double-Click Access
(c) Interface Type/IF Configuration View Label
(e) Network Information Panel Label(f) Logical Gauge/Performance View Label
CloseNavigateAlarmsPerformanceNotes...UtilitiesDevTopDetailIF StatusIF ConfigurationIF Address Translation TableNetwork Information PanelThresholdsModel Information
Ctrl+c
132.177.118.24

9031529e4 Device ViewChapter 2–5
Logical Interface Icons
IF Status View Label
IF Status View Label
The IF Status view label displays a text label with an associated background color representing the current status of the interface. Table 2-1 lists the possible interface statuses and corresponding colors.
Double-clicking on this IF Status view label accesses the Interface Status view which provides the following information on the status of the interface:
Operational StatusA read-only indicator displaying the current operational state of the interface (ON, OFF, or Testing).
Administrative StatusThe desired operational state of the interface (ON, OFF, Testing, or Default).
Interface Type/IF Configuration View Label
The IF Configuration view label displays the type of device interface. Table X lists the possible interface types. Double-clicking on the IF Configuration view label accesses the Interface Configuration view, which provides the following information for the interface:
Operation StatusThe current operational state of the interface (On, Off, or Testing).
Admin. StatusThe desired operational state of the interface (On, Off, or Testing). You can modify this value.
Last ChangeThe System UpTime value when the interface entered its current operational state.
Physical AddressThe Ethernet (MAC) address of the interface.
Table 2-1. Interface Status Label Definitions
Operational Status
Administrative Status Text Display Color
ON ON ON Green
OFF OFF OFF Blue
OFF ON OFF Yellow
Testing Testing Test Red

Logical Interface IconsPhysical Address/IF Address Translation Table Label
Device View NAT Ether-Meter DevicesChapter 2–6 Management Module Guide
BandwidthThe estimated bandwidth of the interface measured in bits per second. For interfaces that do not vary in bandwidth, or no accurate estimate can be made, a nominal bandwidth is provided.
Packet SizeThe largest packet that can be transmitted or received by the port measured in octets.
Queue LengthThe length of the outbound packet queue in packets.
Physical Address/IF Address Translation Table Label
The IF Address Translation Table label displays the physical address of the device interface. Double-clicking on the IF Address Translation Table label accesses the Interface Address Translation Table. This table cross-references device IP addresses to device MAC (Ethernet) addresses for selected nodes between networks. Double-clicking on any column entry opens an address-specific Address Translation Table Information view.
This button allows you to sort the columns in the table incrementally.
This button allows you to locate a particular statistical entry.
This button updates the table.
Network Information Panel Label
Double-clicking on this zone of the logical interface icon accesses the Network Information Panel. This panel provides name, network address, and subnet mask information for the interface. Any of the network information entries from this panel can be displayed on zone (f) of the logical interface icon. Refer to the Interface Options Panel section of this chapter.
Sort
Find
Update

9031529e4 Device ViewChapter 2–7
Interface Options Panel
Logical Gauge/Performance View Label
Logical Gauge/Performance View Label
Double-clicking on this zone of the Logical Interface icon accesses the Performance view for the interface. This area is also a Logical Gauge which is described in the next section. The Interface Performance view provides network performance information for the selected interface, and is described later in this chapter.
Interface Options PanelThe Interface Option Panel area of the Device view allows you to modify the presentation of the logical interface icon.
Find
The Find area of the Interface Options Panel allows you to locate a specific interface by selecting either the interface’s physical address, IP address, type, or network name and entering the appropriate information in the pop-up dialog box. Once you enter the information, the corresponding area of the specific logical interface icon will become highlighted. The Find option will also allow you to look for and display other addresses in the Network Information Panel.
Network Information
The Network Information area of the Interface Options Panel allows you to select what interface information is displayed in the network information label of the selected interface’s logical interface icon. Possible values are ADDRESS, NAME, or MASK.
Interface Description
Selecting a logical interface icon displays the type of interface in the Interface Description area of the Interface Options Panel. Double-clicking on the Interface Description field accesses the Interface Description Map view, which provides a table mapping interface numbers to their descriptions. You can also access this view by single-clicking on the Interface Options Panel to highlight it and then selecting Inf Description Map from the Icon Subviews menu. Double-clicking on a column entry in the Interface Description Map accesses the Interface Configuration view described previously.

Gauge Control PanelSelected Attribute
Device View NAT Ether-Meter DevicesChapter 2–8 Management Module Guide
Gauge Control PanelThe Gauge Control Panel allows you to change the type of statistical information presented in the logical gauge area of the logical interface icon. To access the Gauge Control Panel, either double-click on the Interface Options Panel or single-click on the panel to highlight it and then select Gauge Control Panel from the Icon Subviews menu.
Selected Attribute
This area of the Gauge Control Panel allows you to select the statistical attribute displayed on the logical interface icon’s gauge. The label changes color to reflect the attribute selected. Table 2-2 and Table 2-3 provide lists of the attributes and their corresponding colors.
Gauge Mode
This area of the Gauge Control Panel allows you to select the mode presented by the logical gauge. Possible values are Totals, Rates, or Percentages. The Percentages selection presents the percentage of activity on the selected interface compared to the total activity on all of the interfaces. Table 2-2 lists the displayed attributes and their color definitions if the Totals or Percentages modes are selected. Table 2-3 lists the displayed attributes and their color definitions if the Rates mode is selected.
Table 2-2. Totals and Percentages Mode Attributes and Color Definitions
Selected Attribute Color
In Errors Orange
Out Errors Orange
In Packets Blue
Out Packets Blue
Unknown Protocols Yellow
In Discards Beige
Out Discards Beige
In Octets Green
Out Octets Green

9031529e4 Device ViewChapter 2–9
Gauge Control Panel
Gauge Type
.
Gauge Type
This area of the Gauge Control Panel allows you to select either a numeric or linear presentation of the logical gauge values.
Gauge Control Panel Buttons
The following buttons are available in the Gauge Control Panel:
This button allows you to apply the current selections to the logical gauge. This button will not save any of the current gauge settings.
This button allows you to save the current gauge settings without exiting the SpectroGRAPH.
This button allows you to reset the gauge settings to the values last saved.
Table 2-3. Rates Mode Attributes and Color Definitions
Selected Attribute Color
Load Green
Load In Green
Load Out Green
Packet Rate Blue
Packet In Rate Blue
Packet Out Rate Blue
Error Rate Orange
Error In Rate Orange
Error Out Rate Orange
Discard Rate Beige
Discard In Rate Beige
Discard Out Rate Beige
Apply
Keep Settings
Reset

Interface Performance View
Device View NAT Ether-Meter DevicesChapter 2–10 Management Module Guide
This button allows you to close the Gauge Control Panel.
This button allows you to reset the gauge settings back to the default values.
Interface Performance ViewYou can access the Interface Performance view by selecting Performance from the Icon Subviews menu for the interface icon in the Device or DevTop views. The Interface Performance view provides a breakdown of network traffic over a given time period for the selected interface. This view provides the following information:
Multi-Attribute Line Graph
The Multi-Attribute Line Graph provides a general indication of network activity. The attributes displayed are pre-selected and use colors to represent different statistics. The colors have the following definitions:
Green LoadBlue Packet RateRed Error RateGray Discard Rate
Multi-Attribute Line Graph Buttons
These buttons allow you to modify the statistical presentation of the Multi-Attribute Line Graph.
This button toggles between a linear or logarithmic scale presentation of the graph.
Close
Default
Lin/Log

9031529e4 Device ViewChapter 2–11
Interface Performance View
Additional Buttons
This button allows you to set the viewing area of the graph to begin at a specified date and time.
This button allows you to specify the Y axis time scale for the graph.
Additional Buttons
Seven additional buttons are available from the Interface Performance view, as follows:
This button accesses the Interface Detail view, which provides three color-coded pie charts displaying packet breakdown information for the interface. Each statistic is presented as a total amount since the interface was initialized and as a percentage of overall network traffic. Table 2-4, Table 2-5, and Table 2-6 list the information provided by these pie charts.
Scroll to Date-Time
Change Time Scale
Detail
Table 2-4. Packet Breakdown Pie Chart
Statistic Definition
Delivered Packets delivered to a higher level protocol.
Transmitted Packets transmitted through this interface.
Errors Packets containing errors preventing them from being delivered to a higher level protocol.
Discards Packets discarded even though no errors were detected to make them undeliverable - such packets may have been discarded to increase buffer space.
Interface Performance ViewAdditional Buttons
Device View NAT Ether-Meter DevicesChapter 2–12 Management Module Guide
This button accesses the Interface Configuration View described earlier in this chapter.
This button accesses the Interface Threshold View. The Interface Threshold View allows you to set statistical thresholds on a per interface basis. You can set thresholds for the following statistics:
• Load• Packet Rate• Error Rate• % Discarded
When a threshold is exceeded, SPECTRUM generates an event and the device icon turns yellow.
This button accesses the Events Log, which provides a history of the interface’s status at specific times.
Table 2-5. Error Breakdown Pie Chart
Statistic Definition
In Errors Packets received containing errors.
Out Errors Packets transmitted containing errors.
Table 2-6. Discard Breakdown Pie Chart
Statistic Definition
Unknown Locally addressed packets received successfully but discarded because of an unknown or unsupported protocol.
In Discards Received packets discarded even though no errors were encountered to prevent their continued processing - such packets may have been discarded to increase buffer space.
Out Discards Transmitted packets discarded even though no errors were encountered to prevent their continued processing - such packets may have been discarded to increase buffer space.
Config
Threshold
Events
9031529e4 Device ViewChapter 2–13
Interface Performance View
Additional Buttons
This button accesses the Alarms View, which provides information on current alarm conditions (if any) for the interface.
This button accesses an additional Performance View providing information on network traffic transmitted by this interface.
This button accesses an additional Performance View providing information on network traffic received by this interface.
Alarms
Transmit
Receive

Interface Performance ViewAdditional Buttons
Device View NAT Ether-Meter DevicesChapter 2–14 Management Module Guide
9031529e4Chapter 3–1
Chapter 3
ConfigurationViews
What Is in This ChapterThis chapter describes the Configuration views available for the NAT EtherMeter devices. These views allow you to access device-specific configuration information.
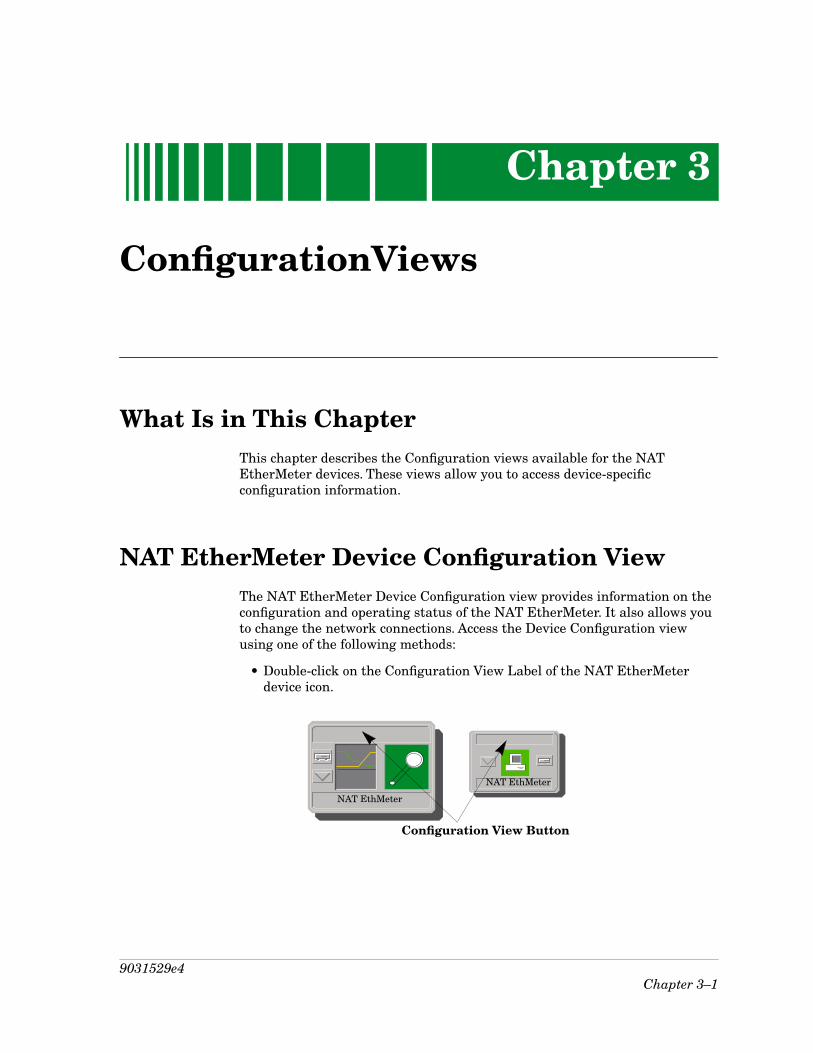
NAT EtherMeter Device Configuration ViewThe NAT EtherMeter Device Configuration view provides information on the configuration and operating status of the NAT EtherMeter. It also allows you to change the network connections. Access the Device Configuration view using one of the following methods:
• Double-click on the Configuration View Label of the NAT EtherMeter device icon.
Configuration View Button
NAT EthMeter
NAT EthMeter
NAT EtherMeter Device Configuration View
ConfigurationViews NAT Ether-Meter DevicesChapter 3–2 Management Module Guide
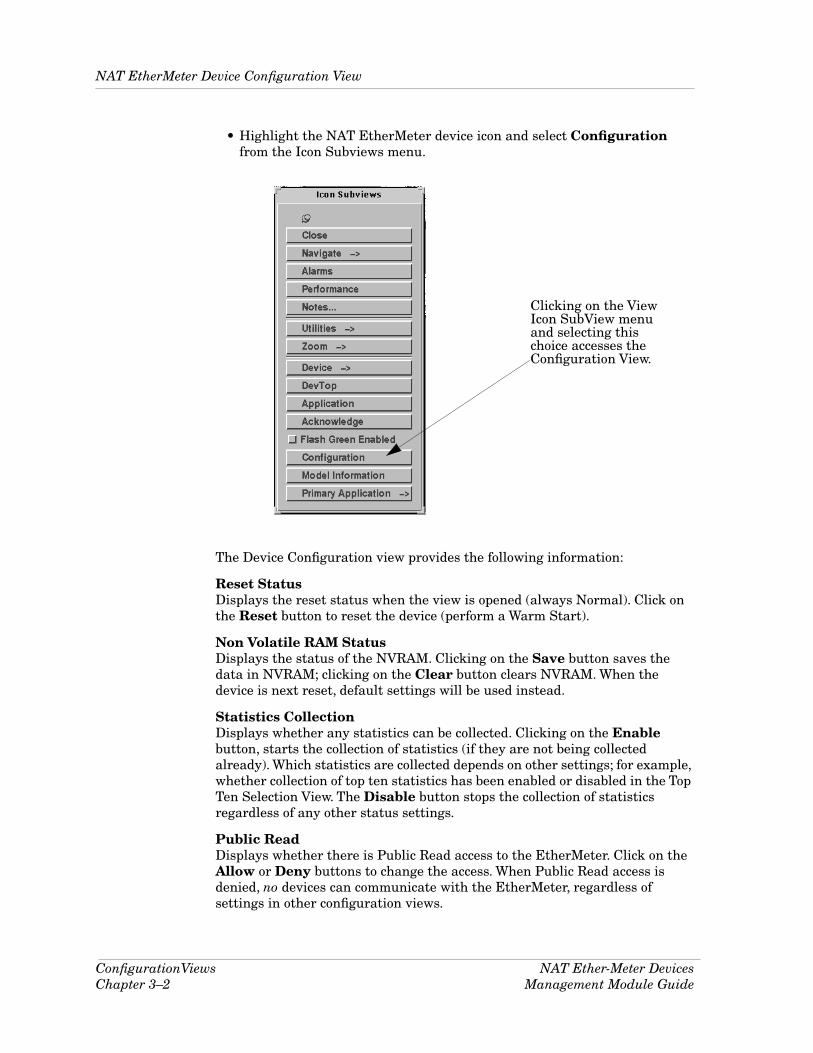
• Highlight the NAT EtherMeter device icon and select Configuration from the Icon Subviews menu.
The Device Configuration view provides the following information:
Reset StatusDisplays the reset status when the view is opened (always Normal). Click on the Reset button to reset the device (perform a Warm Start).
Non Volatile RAM StatusDisplays the status of the NVRAM. Clicking on the Save button saves the data in NVRAM; clicking on the Clear button clears NVRAM. When the device is next reset, default settings will be used instead.
Statistics CollectionDisplays whether any statistics can be collected. Clicking on the Enable button, starts the collection of statistics (if they are not being collected already). Which statistics are collected depends on other settings; for example, whether collection of top ten statistics has been enabled or disabled in the Top Ten Selection View. The Disable button stops the collection of statistics regardless of any other status settings.
Public ReadDisplays whether there is Public Read access to the EtherMeter. Click on the Allow or Deny buttons to change the access. When Public Read access is denied, no devices can communicate with the EtherMeter, regardless of settings in other configuration views.
Clicking on the View
Icon SubView menu and selecting this choice accesses the Configuration View.

9031529e4 ConfigurationViewsChapter 3–3
NAT EtherMeter Device Configuration View
Community Names Alias Configuration View
SNMP Trap ActivationDisplays whether SNMP Trap Activation is enabled. Click on the Enable or Disable button to change the status. If you select Disabled here, traps cannot be sent to SPECTRUM, regardless of settings in other views.
FirmwareDisplays the EtherMeter’s current firmware version.
NAT 450 DiagnosticDisplays a diagnostic string for use by NAT Engineers.
This button opens the Community Names Alias Configuration view, described later in this section.
This button opens the Modem Configuration view, described later in this section.
This button opens the EtherMeter Download Control view, described later in this section.
This button opens the NAT EtherMeter Accessing Hosts Configuration view, described later in this section.
This button opens the Network Parameters Configuration view, described later in this section.
Community Names Alias Configuration View
You can access the Community Names Alias Configuration view by clicking on the Community Name Aliases button in the NAT EtherMeter Device Configuration view. This view provides a security feature; it lets you restrict access to the EtherMeter by changing community names. It displays the Default and Alias community names for each host access level. In each case, you can enter or update the Alias name if you do not want hosts to be able to communicate with the EtherMeter using the default community name.
Community Name Aliases
Modem Configuration
Download Control
Accessing Hosts Table
Device Network Params

NAT EtherMeter Device Configuration ViewModem Configuration View
ConfigurationViews NAT Ether-Meter DevicesChapter 3–4 Management Module Guide
Modem Configuration View
You can access the Modem Configuration view by clicking on the Modem Configuration button in the NAT EtherMeter Device Configuration view. If the NAT EtherMeter is being accessed via the serial port (using a Hayes-compatible asynchronous mode), this view displays the following configuration information for the modem:
Hayes command string for modem initializationDisplays the default string that initializes the modem for proper operation. The following should be part of the configuration string: ‘e0v1q0&c1&d2’. If error correction and RTS/CTS flow control are provided by the modem, the string should also include commands for error and flow control. The initialization string can be up to 40 characters in length.
Dial PrefixDisplays the dialing prefix to be used. For touch tone dialing, this is ‘atdt’; for pulse tone dialing, use ‘atdp’. You can update this field.
Dial SuffixDisplays the dialing suffix to be used. Usually, this is not used unless you have a special dial out mechanism from your PBX (refer to your modem manual). You can update this field.
Hangup PrefixDisplays the prefix to use when terminating a modem session (generally ‘+++’). You can update this field.
Hangup SuffixDisplays the prefix to use when terminating a modem session (generally ‘ath’). You can update this field.
EtherMeter Download Control View
You can access the EtherMeter Download Control view by clicking on the Download Control button in the NAT EtherMeter Device Configuration view. This view controls the downloading of firmware from a server to the EtherMeter. This view provides the following information:
NOTE
Non-printable characters can be used in the initialization string by entering a back slash (\) followed by the character value or ASCII code; for example, \0703. The ASCII code should be represented by two hexadecimal digits. To enter a back slash as part of the string, use two back slashes, \\.

9031529e4 ConfigurationViewsChapter 3–5
NAT EtherMeter Device Configuration View
EtherMeter Download Control View
Download Server AddressDisplays the IP address of the TFTP server from which the FLASH code will be downloaded. You can update this field.
File NameDisplays the name of the file to be downloaded from the TFTP server. You can update this field.
StatusDisplays the current download operation status. You can initiate a download using the Start Downloading button. This field then shows the progress and success (or failure) of the operation. You cannot initiate a download when either the EtherMeter is waiting for downloading parameters (a Status of DownloadFileName or DownloadServerIP), or the downloading operation is in progress (a Status of ARP-Server-Sent, Rrq-Sent, or Downloading). If the Download Server Address and/or the File Name are not available within 60 seconds of your clicking on the Start Downloading button, the Status is set to Time-Out. You must reinitialize the downloading. Table 3-1 lists the valid status entries.
Table 3-1. Valid Status Entries
Entry Definition
ARP-Server-Sent The EtherMeter is trying to resolve the Ethernet address of the TFTP server.
Rrq-Sent The TFTP read request has been sent to the server.
Downloading The EtherMeter is performing a file transfer or programming the FLASH memory.
Finished Downloading has finished.
File-Verify-Error The downloaded file contains an error.
Flash-Write-Error An error occurred while writing to FLASH memory. It will be written to EEPROM.
Flash-Verify-Error An error was detected after the copying to FLASH memory. It will be written to EEPROM.
Time-Out The downloading process has experienced a general time out: either or both of the File Server Address and the File Name were not available within 60 seconds of the download initiation.
Invalid-File The File Name given is an invalid file for downloading.
Time-Out-Address The downloading process has timed out: a hardware address remained unresolved after 100 seconds.
Time-Out-Request The downloading process has timed out: the TFTP read request was not answered in 5 retries. (The EtherMeter retries after every 5 seconds.)

NAT EtherMeter Device Configuration ViewNAT EtherMeter Accessing Hosts Configuration View
ConfigurationViews NAT Ether-Meter DevicesChapter 3–6 Management Module Guide
NAT EtherMeter Accessing Hosts Configuration View
You can access the NAT EtherMeter Accessing Hosts Configuration view by clicking on the Accessing Hosts Tables button in the NAT EtherMeter Device Configuration view. This view allows you to define the access with which other devices can communicate with the EtherMeter. This is useful when a large network is managed remotely by a Network Administrator and monitored locally by a secondary station. Each accessing host can have a different access level; for example, if you grant Read Trap access to a local monitoring station, that station can set its own alarms. The local station can monitor the network, but since it does not have Read Write access, corrective action cannot be undertaken – it remains the responsibility of the Network Administrator. This view provides two inter-related tables, the Accessing Hosts Table and the Telephone Number and Traps Table. The maximum number of entries is 16.
Accessing Hosts Table
This table provides the access information for the hosts. This table consists of the following entries:
IP AddressDisplays the IP address of a host with access rights to the EtherMeter.
Time-Out-Download The downloading process has timed out: file transfer has not completed. Whenever the EtherMeter fails to receive the proper TFTP data packet, it retransmits the last ACK packet every 5 seconds. After 5 retries, the TFTP process is aborted.
Not-defined An unanticipated error occurred.
File-Not-Found The download file was not found.
Access-Violation A security access violation occurred.
Disk-Full The allocation of space has been exceeded.
Illegal-Operation An illegal TFTP operation was encountered.
Unknown-Transfer-ID
An unknown transfer ID was encountered.
File-Exists Download file has been found to exist.
No-Such-User An invalid user has been entered.
Table 3-1. Valid Status Entries (Continued)
Entry Definition
9031529e4 ConfigurationViewsChapter 3–7
NAT EtherMeter Device Configuration View
NAT EtherMeter Accessing Hosts Configuration View
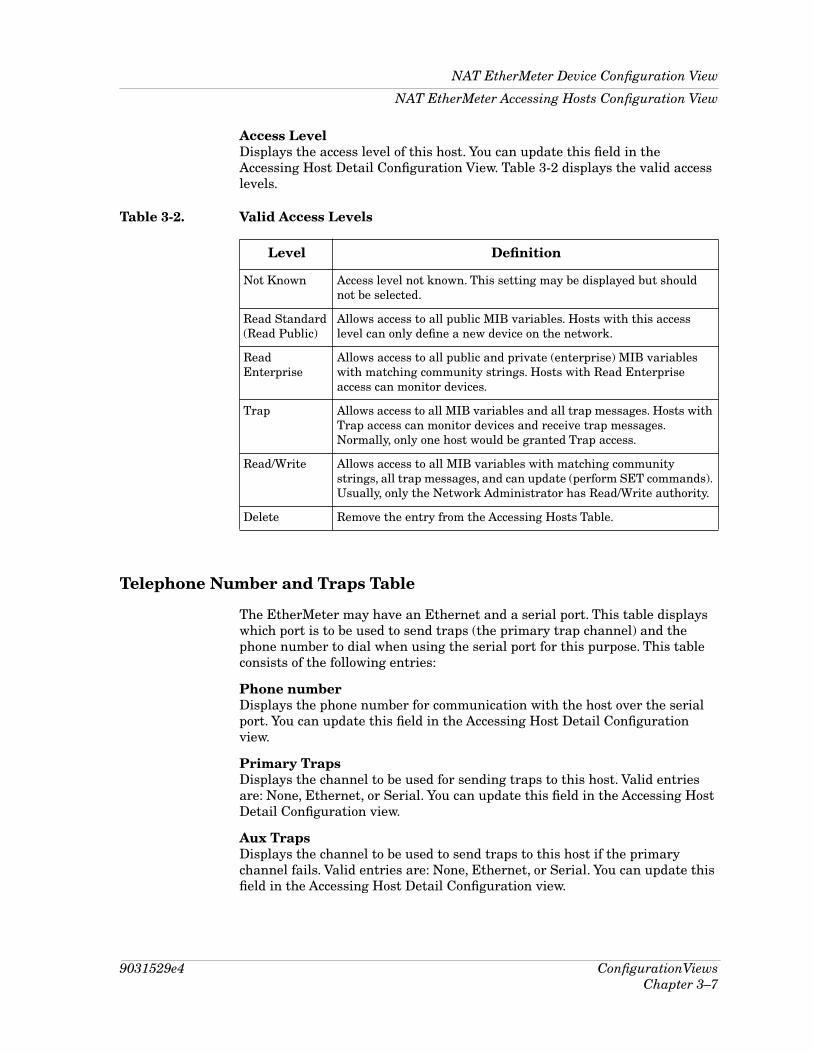
Access LevelDisplays the access level of this host. You can update this field in the Accessing Host Detail Configuration View. Table 3-2 displays the valid access levels.
Telephone Number and Traps Table
The EtherMeter may have an Ethernet and a serial port. This table displays which port is to be used to send traps (the primary trap channel) and the phone number to dial when using the serial port for this purpose. This table consists of the following entries:
Phone numberDisplays the phone number for communication with the host over the serial port. You can update this field in the Accessing Host Detail Configuration view.
Primary TrapsDisplays the channel to be used for sending traps to this host. Valid entries are: None, Ethernet, or Serial. You can update this field in the Accessing Host Detail Configuration view.
Aux TrapsDisplays the channel to be used to send traps to this host if the primary channel fails. Valid entries are: None, Ethernet, or Serial. You can update this field in the Accessing Host Detail Configuration view.
Table 3-2. Valid Access Levels
Level Definition
Not Known Access level not known. This setting may be displayed but should not be selected.
Read Standard(Read Public)
Allows access to all public MIB variables. Hosts with this access level can only define a new device on the network.
Read Enterprise
Allows access to all public and private (enterprise) MIB variables with matching community strings. Hosts with Read Enterprise access can monitor devices.
Trap Allows access to all MIB variables and all trap messages. Hosts with Trap access can monitor devices and receive trap messages. Normally, only one host would be granted Trap access.
Read/Write Allows access to all MIB variables with matching community strings, all trap messages, and can update (perform SET commands). Usually, only the Network Administrator has Read/Write authority.
Delete Remove the entry from the Accessing Hosts Table.

NAT EtherMeter Device Configuration ViewNetwork Parameters Configuration View
ConfigurationViews NAT Ether-Meter DevicesChapter 3–8 Management Module Guide
This button allows you to add table entries or modify an existing entry for a host. To add or modify an entry, type in the IP address and then click on this button. The Accessing Host Detail Configuration view is displayed.
Network Parameters Configuration View
You can access the Network Parameters Configuration view by clicking on the Device Network Params button in the NAT EtherMeter Device Configuration View. This view provides the following information:
Device IP AddressDisplays and allows you to modify the Ethernet port address. You must reset the EtherMeter to use the new address.
Device Subnet MaskDisplays and allows you to modify the subnet mask for the Ethernet port. You must reset the EtherMeter to use the new address.
Default RouterDisplays the address of the default router, as set up using the local terminal.
Serial Port IP AddressDisplays and allows you to modify the serial port address. You must reset the EtherMeter to use the new address.
Serial Port Subnet MaskDisplays and allows you to modify the subnet mask for the serial port. You must reset the EtherMeter to use the new address.
Local Terminal PasswordAllows you to set the password for the local terminal remotely, thereby restricting access. The existing password is not displayed; type the new password in this field.
Add Entry
9031529e4Chapter 4–1
Chapter 4
Event and Alarm Messages
What Is in This ChapterThis chapter describes the events and alarms generated by the NAT EtherMeter and any probable cause messages corresponding to these alarms.
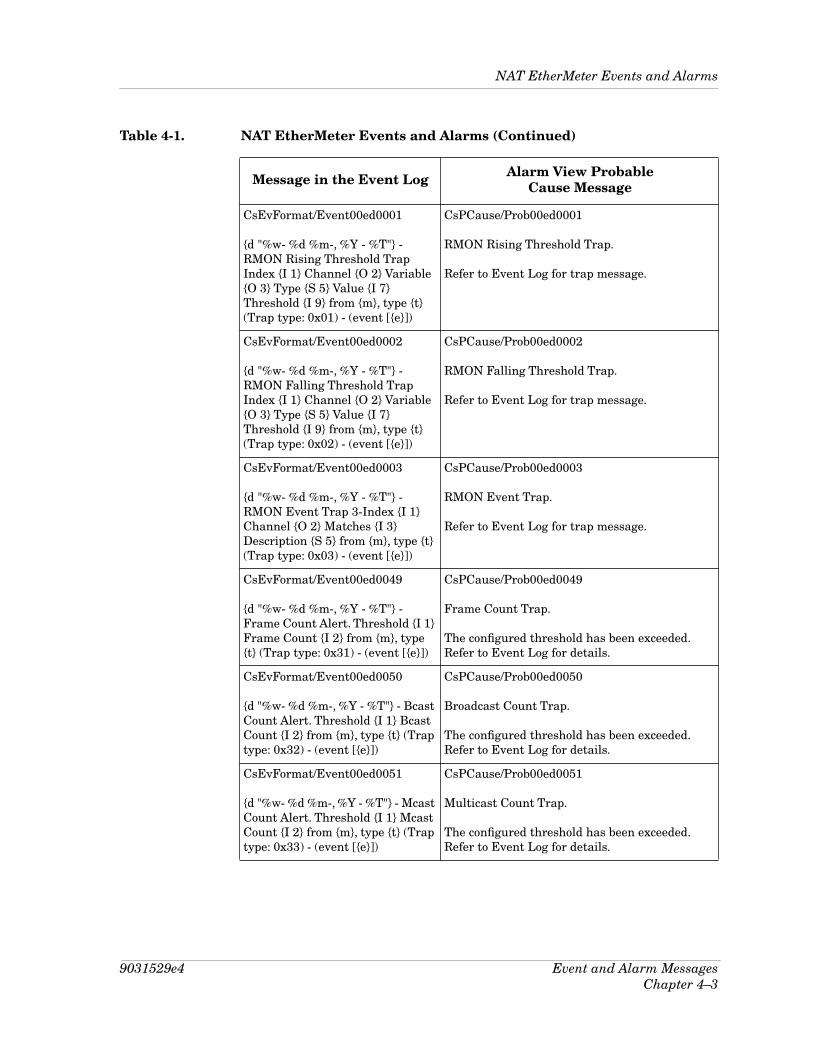
NAT EtherMeter Events and AlarmsThis table describes the event messages appearing in the Event Log, and any corresponding probable cause messages that may be displayed in the Enterprise Alarm View for the NAT EtherMeter.
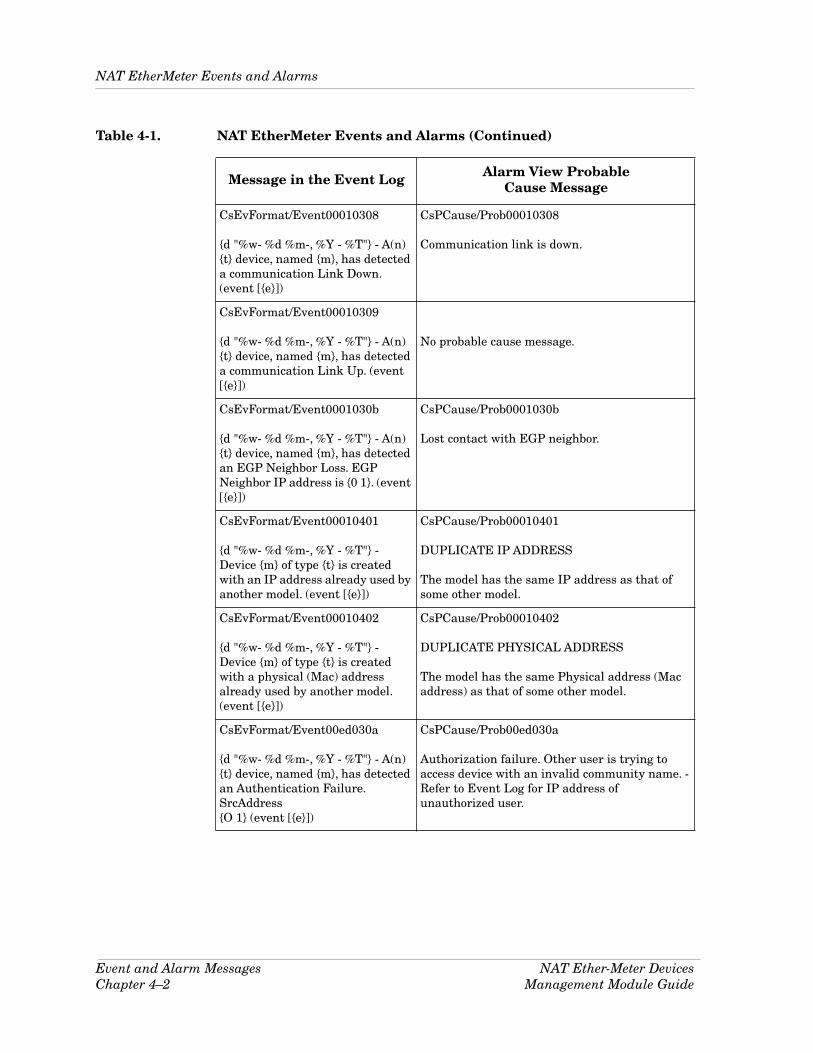
Table 4-1. NAT EtherMeter Events and Alarms
Message in the Event Log Alarm View Probable Cause Message
CsEvFormat/Event00010306
{d "%w- %d %m-, %Y - %T"} - A(n) {t} device, named {m}, has been cold started. (event [{e}])
No probable cause message.
CsEvFormat/Event00010307
{d "%w- %d %m-, %Y - %T"} - A(n) {t} device, named {m}, has been warm started. (event [{e}])
No probable cause message.
NAT EtherMeter Events and Alarms
Event and Alarm Messages NAT Ether-Meter DevicesChapter 4–2 Management Module Guide
CsEvFormat/Event00010308
{d "%w- %d %m-, %Y - %T"} - A(n) {t} device, named {m}, has detected a communication Link Down. (event [{e}])
CsPCause/Prob00010308
Communication link is down.
CsEvFormat/Event00010309
{d "%w- %d %m-, %Y - %T"} - A(n) {t} device, named {m}, has detected a communication Link Up. (event [{e}])
No probable cause message.
CsEvFormat/Event0001030b
{d "%w- %d %m-, %Y - %T"} - A(n) {t} device, named {m}, has detected an EGP Neighbor Loss. EGP Neighbor IP address is {0 1}. (event [{e}])
CsPCause/Prob0001030b
Lost contact with EGP neighbor.
CsEvFormat/Event00010401
{d "%w- %d %m-, %Y - %T"} - Device {m} of type {t} is created with an IP address already used by another model. (event [{e}])
CsPCause/Prob00010401
DUPLICATE IP ADDRESS
The model has the same IP address as that of some other model.
CsEvFormat/Event00010402
{d "%w- %d %m-, %Y - %T"} - Device {m} of type {t} is created with a physical (Mac) address already used by another model. (event [{e}])
CsPCause/Prob00010402
DUPLICATE PHYSICAL ADDRESS
The model has the same Physical address (Mac address) as that of some other model.
CsEvFormat/Event00ed030a
{d "%w- %d %m-, %Y - %T"} - A(n) {t} device, named {m}, has detected an Authentication Failure. SrcAddress{O 1} (event [{e}])
CsPCause/Prob00ed030a
Authorization failure. Other user is trying to access device with an invalid community name. - Refer to Event Log for IP address of unauthorized user.
Table 4-1. NAT EtherMeter Events and Alarms (Continued)
Message in the Event Log Alarm View Probable Cause Message
9031529e4 Event and Alarm MessagesChapter 4–3
NAT EtherMeter Events and Alarms
CsEvFormat/Event00ed0001
{d "%w- %d %m-, %Y - %T"} - RMON Rising Threshold Trap Index {I 1} Channel {O 2} Variable {O 3} Type {S 5} Value {I 7} Threshold {I 9} from {m}, type {t} (Trap type: 0x01) - (event [{e}])
CsPCause/Prob00ed0001
RMON Rising Threshold Trap.
Refer to Event Log for trap message.
CsEvFormat/Event00ed0002
{d "%w- %d %m-, %Y - %T"} - RMON Falling Threshold Trap Index {I 1} Channel {O 2} Variable {O 3} Type {S 5} Value {I 7} Threshold {I 9} from {m}, type {t} (Trap type: 0x02) - (event [{e}])
CsPCause/Prob00ed0002
RMON Falling Threshold Trap.
Refer to Event Log for trap message.
CsEvFormat/Event00ed0003
{d "%w- %d %m-, %Y - %T"} - RMON Event Trap 3-Index {I 1} Channel {O 2} Matches {I 3} Description {S 5} from {m}, type {t} (Trap type: 0x03) - (event [{e}])
CsPCause/Prob00ed0003
RMON Event Trap.
Refer to Event Log for trap message.
CsEvFormat/Event00ed0049
{d "%w- %d %m-, %Y - %T"} - Frame Count Alert. Threshold {I 1} Frame Count {I 2} from {m}, type {t} (Trap type: 0x31) - (event [{e}])
CsPCause/Prob00ed0049
Frame Count Trap.
The configured threshold has been exceeded. Refer to Event Log for details.
CsEvFormat/Event00ed0050
{d "%w- %d %m-, %Y - %T"} - Bcast Count Alert. Threshold {I 1} Bcast Count {I 2} from {m}, type {t} (Trap type: 0x32) - (event [{e}])
CsPCause/Prob00ed0050
Broadcast Count Trap.
The configured threshold has been exceeded. Refer to Event Log for details.
CsEvFormat/Event00ed0051
{d "%w- %d %m-, %Y - %T"} - Mcast Count Alert. Threshold {I 1} Mcast Count {I 2} from {m}, type {t} (Trap type: 0x33) - (event [{e}])
CsPCause/Prob00ed0051
Multicast Count Trap.
The configured threshold has been exceeded. Refer to Event Log for details.
Table 4-1. NAT EtherMeter Events and Alarms (Continued)
Message in the Event Log Alarm View Probable Cause Message

NAT EtherMeter Events and Alarms
Event and Alarm Messages NAT Ether-Meter DevicesChapter 4–4 Management Module Guide
CsEvFormat/Event00ed0052
{d "%w- %d %m-, %Y - %T"} - Error Count Alert. Threshold {I 1} Error Count {I 2} from {m}, type {t} (Trap type: 0x34) - (event [{e}])
CsPCause/Prob00ed0052
Error Count Trap.
The configured threshold has been exceeded. Refer to Event Log for details.
CsEvFormat/Event00ed0053
{d "%w- %d %m-, %Y - %T"} - Utilization Alert. Threshold {I 1} Utilization {I 2} from {m}, type {t} (Trap type: 0x35) - (event [{e}])
CsPCause/Prob00ed0053
Utilization Trap.
The configured threshold has been exceeded. Refer to Event Log for details.
CsEvFormat/Event00ed0054
{d "%w- %d %m-, %Y - %T"} - Duplicate IP Addr. IP Addr {O 1} PhysAddr {X 2} Message {S 3} (Trap type: 0x36 device {m} type {t}) - (event [{e}])
CsPCause/Prob00ed0054
Duplicate IP Address Trap Message Received.
Refer to Event Log for trap message.
CsEvFormat/Event00ed0055
{d "%w- %d %m-, %Y - %T"} - IP Address Change Detected. Old IP {O 1} New IP {O 2} PhysAddr {X 3} Message {S 4} (Trap type: 0x37 device {m} type {t}) - (event [{e}])
CsPCause/Prob00ed0055
IP Address Change Trap Received.
Refer to Event Log for trap message.
CsEvFormat/Event00ed0056
{d "%w- %d %m-, %Y - %T"} - Top10 Trap (Top 5 Logged). Opt {I 1} Address(es) {O 3} Count {I 8}, {O 4} Count {I 9}, {O 5} Count {I 10}, {O 6} Count {I 11}, {O 7} Count {I 12} (Trap type: 0x38 device {m} type {t}) - (event [{e}])
CsPCause/Prob00ed0056
Top Ten Trap.
Refer to Event Log for trap message.
CsEvFormat/Event00ed0058
{d "%w- %d %m-, %Y - %T"} - New Address Trap. PhysAddr {X 1} Message {S 2} from {m} of type {t}. (Trap type: 0x3a) - (event [{e}])
CsPCause/Prob00ed0058
New Address Trap.
Refer to Event Log for trap message.
Table 4-1. NAT EtherMeter Events and Alarms (Continued)
Message in the Event Log Alarm View Probable Cause Message
9031529e4Chapter 5–1
Chapter 5
Application View
What Is in This ChapterThis chapter describes the NAT EtherMeter Management Module specific Application views. This description includes detailed information about the applications supported by the device, and the SPECTRUM functions available from the Application View. The NAT EtherMeter Module Application views provide access to increasingly detailed views of network information. The following device-specific applications or the NAT EtherMeter module are described in this chapter:
NATMeter Application ViewsThe NAT EtherMeter supports common and device-specific applications. Common applications are described inMIB II Applications, Bridging Applications, and Miscellaneous Applications, and are accessed through the Icon Subviews menu. The common applications are listed below.
• MIB-II (SNMP2_Agent)- IP (IP2_App)- System (System2_App)- ICMP (ICMP_App)- UDP (UDP2_App)
The NAT EtherMeter supports device-specific applications. These applications are described in Chapter 5, Application Views, and are listed below.
• NatMtrApp• NAT_Alerts (NATAlrtApp)• NATCfgApp
Accessing the Application View
Application View NAT Ether-Meter DevicesChapter 5–2 Management Module Guide
• Extended RMON (NATRmonXApp)
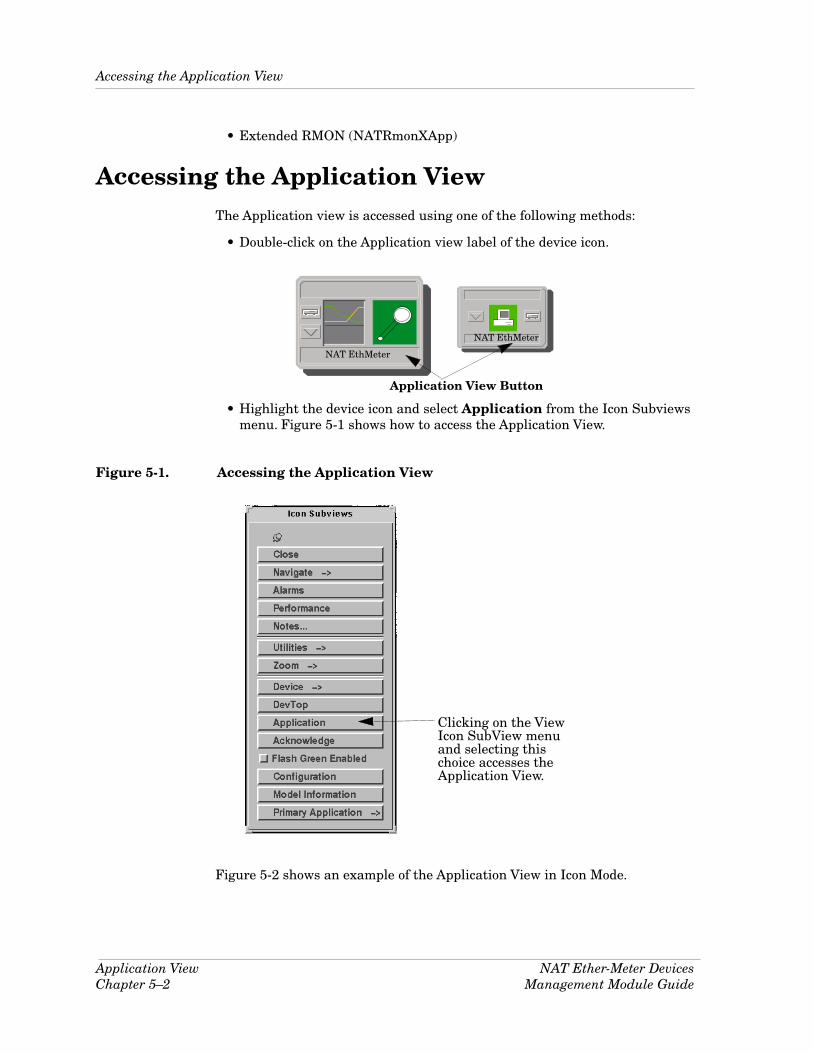
Accessing the Application ViewThe Application view is accessed using one of the following methods:
• Double-click on the Application view label of the device icon.
• Highlight the device icon and select Application from the Icon Subviews menu. Figure 5-1 shows how to access the Application View.
Figure 5-1. Accessing the Application View
Figure 5-2 shows an example of the Application View in Icon Mode.
Application View Button
NAT EthMeter
NAT EthMeter
Clicking on the View
Icon SubView menu and selecting this choice accesses the Application View.

9031529e4 Application ViewChapter 5–3
Accessing the Application View
Figure 5-2. NAT EtherMeter Application View (Icon Mode)
* File View Help?
Primary Landscape 0x00400000 - VNM Host -Name of type NATEthMeter
Model Name
Contact
Description
Location
Network Address System Up Time
Manufacturer
Device Type
Serial NumberPrimary-Application
NAT EM486
NAT Meter
132.177.118.24 6+06:34:10
Cabletron
EMM-E6
SNMP2_Agent
MIB-II NAT Config
NATCfgApp
ICMP
ICMP_App
NAT Meter
NATMtrApp
NAT-Alerts
NATAlrtApp
NAT -rmon
NATRmonXApp
118.24
NAT EthMeter
NATMtrApp
NATAlrtApp
IP
IP2_App
SNMP2_Agent
ICMP_App
IP2_App
System
System2_App
System2_App
NATCfgApp
NATRmonXApp

Accessing the Application View
Application View NAT Ether-Meter DevicesChapter 5–4 Management Module Guide
Figure 5-3. Application View (List Mode)
132.177.118.24
ICMP
IP
System
UDP
Double-click on the List View entry with the left mouse but-ton or single-click on the List View entry with the middle mouse button to explode or col-lapse each menu.
MIB-II ->IconList
9031529e4 Application ViewChapter 5–5
NATMeter Application
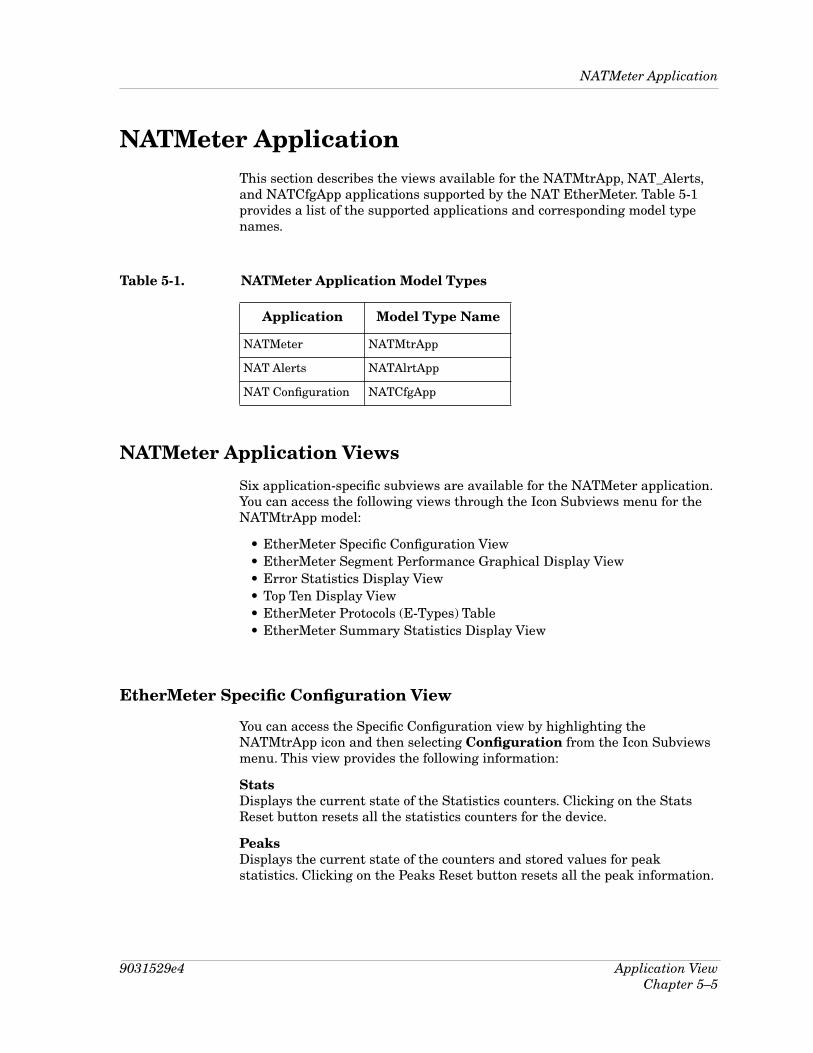
NATMeter ApplicationThis section describes the views available for the NATMtrApp, NAT_Alerts, and NATCfgApp applications supported by the NAT EtherMeter. Table 5-1 provides a list of the supported applications and corresponding model type names.
NATMeter Application Views
Six application-specific subviews are available for the NATMeter application. You can access the following views through the Icon Subviews menu for the NATMtrApp model:
• EtherMeter Specific Configuration View• EtherMeter Segment Performance Graphical Display View• Error Statistics Display View• Top Ten Display View• EtherMeter Protocols (E-Types) Table• EtherMeter Summary Statistics Display View
EtherMeter Specific Configuration View
You can access the Specific Configuration view by highlighting the NATMtrApp icon and then selecting Configuration from the Icon Subviews menu. This view provides the following information:
StatsDisplays the current state of the Statistics counters. Clicking on the Stats Reset button resets all the statistics counters for the device.
PeaksDisplays the current state of the counters and stored values for peak statistics. Clicking on the Peaks Reset button resets all the peak information.
Table 5-1. NATMeter Application Model Types
Application Model Type Name
NATMeter NATMtrApp
NAT Alerts NATAlrtApp
NAT Configuration NATCfgApp
NATMeter ApplicationNATMeter Application Views
Application View NAT Ether-Meter DevicesChapter 5–6 Management Module Guide
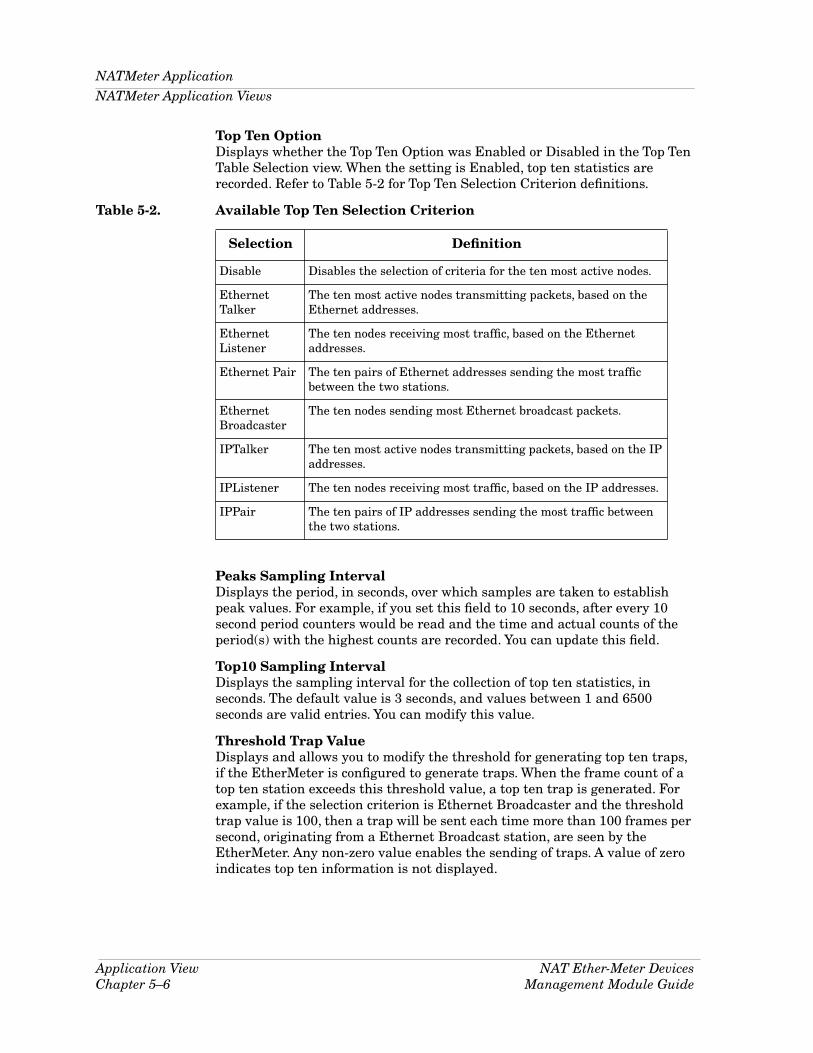
Top Ten OptionDisplays whether the Top Ten Option was Enabled or Disabled in the Top Ten Table Selection view. When the setting is Enabled, top ten statistics are recorded. Refer to Table 5-2 for Top Ten Selection Criterion definitions.
Table 5-2. Available Top Ten Selection Criterion
Peaks Sampling IntervalDisplays the period, in seconds, over which samples are taken to establish peak values. For example, if you set this field to 10 seconds, after every 10 second period counters would be read and the time and actual counts of the period(s) with the highest counts are recorded. You can update this field.
Top10 Sampling IntervalDisplays the sampling interval for the collection of top ten statistics, in seconds. The default value is 3 seconds, and values between 1 and 6500 seconds are valid entries. You can modify this value.
Threshold Trap ValueDisplays and allows you to modify the threshold for generating top ten traps, if the EtherMeter is configured to generate traps. When the frame count of a top ten station exceeds this threshold value, a top ten trap is generated. For example, if the selection criterion is Ethernet Broadcaster and the threshold trap value is 100, then a trap will be sent each time more than 100 frames per second, originating from a Ethernet Broadcast station, are seen by the EtherMeter. Any non-zero value enables the sending of traps. A value of zero indicates top ten information is not displayed.
Selection Definition
Disable Disables the selection of criteria for the ten most active nodes.
Ethernet Talker
The ten most active nodes transmitting packets, based on the Ethernet addresses.
Ethernet Listener
The ten nodes receiving most traffic, based on the Ethernet addresses.
Ethernet Pair The ten pairs of Ethernet addresses sending the most traffic between the two stations.
Ethernet Broadcaster
The ten nodes sending most Ethernet broadcast packets.
IPTalker The ten most active nodes transmitting packets, based on the IP addresses.
IPListener The ten nodes receiving most traffic, based on the IP addresses.
IPPair The ten pairs of IP addresses sending the most traffic between the two stations.

9031529e4 Application ViewChapter 5–7
NATMeter Application
NATMeter Application Views
Threshold TrapsThis provides a button to quickly set the Threshold Trap Value to zero, disabling the sending of traps. Enter any non-zero value into the Threshold Trap Value field to re-enable the sending of traps.
This button opens the Summary Statistics Display View.
This button opens the Error Statistics Display View.
This button opens the Protocols (E-Type) Table.
This button opens the Top Ten Selection and Display Views.
EtherMeter Performance Graphical Display
You can access the Performance Graphical Display by highlighting the NATMtrApp icon and then selecting Performance Graph from the Icon Subviews menu. This table contains a multi-line graph as described in the Application Performance views section earlier in this chapter. Table 5-3 provides definitions of the colors used in the graph to represent the different statistics. This view also provides four buttons providing alternative access to other views supported by this application.
EtherMeter Error Statistics Display View
You can access the Error Statistics Display view by highlighting the NATMtrApp icon and then selecting Error Summary from the Icon Subviews menu, or by clicking on the Error Summary button in either the
Performance Summary
Error Summary
Protocols Table
Top Ten Tables
Table 5-3. NATMeter Application Color Definitions
Statistic Color
% Load Yellow
Frame Rate Orange
% Error Red
% Collisions Gray

NATMeter ApplicationNATMeter Application Views
Application View NAT Ether-Meter DevicesChapter 5–8 Management Module Guide
Specific Configuration view or the Performance Graphical Display view. Table 5-4 provides information on the error statistics displayed by the view’s pie chart. The Error Statistics Display view also provides the following fields:
Peak Error TimeDisplays the date and time at which the period with the maximum overall errors occurred. Use the Update button to refresh this field; this allows you to see whether the values have changed while the view has been open.
Peak Err CountDisplays the number of errors recorded in the period in which the most errors occurred. Use the Update button to refresh this field; this allows you to see whether the values have changed while the view has been open.
Peak Sampling IntervalDisplays the sampling interval for peak statistics, in seconds, as configured in the EtherMeter Specific Configuration View.
Peak CRC Error CountDisplays the number of CRC errors in the sampling interval in which the Peak Err Count was seen by the EtherMeter.
Peak Alignment Error CountDisplays the number alignment errors in the sampling period in which the Peak Err Count was seen by the EtherMeter.
Peak Short Frame Error CountDisplays the number of packets (with or without CRC errors) less than 64 bytes in length (including four bytes of framing characters) in the sampling interval in which the Peak Err Count was seen by the EtherMeter.
Peak Oversize Error CountDisplays the number of packets (with or without CRC errors) greater than 1518 bytes in the sampling interval in which the Peak Err Count was seen by the EtherMeter.
Peak Txmit Collision CountDisplays the number of collisions in the sampling interval in which the Peak Err Count was seen by the EtherMeter.
Good Frames Count in Peak Error IntervalDisplays the number of good frames during the sampling period in which the Peak Err count was detected by the EtherMeter.
Peak Utilization ValueDisplays the maximum segment utilization by good packets (from 0.0% to 99.9%) in any peak sampling interval.
Errors at Peak UtilizationDisplays the number of error packets seen by the EtherMeter during the sampling period in which the peak utilization was measured.

9031529e4 Application ViewChapter 5–9
NATMeter Application
NATMeter Application Views
Good Frames at Peak UtilizationDisplays the number of good frames in the sampling period during which the peak utilization was measured.
Peak Broadcast Frame CountDisplays the maximum number of packets directed to the broadcast address that were seen by the EtherMeter in any one sampling interval.
Errors in Peak Bcast IntervalDisplays the number of error frames in the sampling period during which the Peak Broadcast Frame Count was measured.
Good Frame Count in Peak Bcast IntervalDisplays the number of good frames in the sampling period during which the Peak Broadcast Frame Count was measured.
Peak Kbyte CountDisplays the maximum number of kilobytes that all the packets were using in any one peak sampling interval.
Good Frame Count in Peak Kbyte IntervalDisplays the number of good frames in the sampling period in which the maximum number of kilobytes was used.
Errors in Peak Kbyte IntervalDisplays the number of errors during the sampling period in which the maximum number of kilobytes was used.
Table 5-4. Error Breakdown Pie Chart
Statistic Definition
CRC The number of Cyclical Redundancy Check errors received.
Alignment The number of alignment errors received.
Short Frame The number of short frame errors received.
Oversize The number of oversize errors received.
Collision The number of collision errors received.
Peak Err Count
The peak error count for the interval.
Buffer Overflow
The number of buffer overflow errors received.
Dropped Packets
The number of times packets were “dropped” because of a lack of buffer space.

NATMeter ApplicationNATMeter Application Views
Application View NAT Ether-Meter DevicesChapter 5–10 Management Module Guide
EtherMeter Top Ten Table Views
You can access the Top Ten Table Selection view by highlighting the NATMtrApp icon and then selecting Top Ten from the Icon Subviews menu, or by clicking on the Top Ten Tables button in either the Specific Configuration view or the Performance Graphical Display view. The following buttons are available for this view:
• Ethernet Table• Ethernet Pairs• IP TAble• IP Pairs
Each button provides the information below.
Sample TimeDisplays the time of the last sampling interval. The fields following this one are updated after each sampling interval and display real-time information.
Overflow ConditionDisplays whether a buffer overflow occurred during the last sample interval. A setting of Normal indicates no overflow.
Total PacketsDisplays the number of packets seen by the EtherMeter during the last sample interval.
Total EntriesDisplays the number of events (times a trap was sent) seen during the last sampling interval.
Valid EntriesDisplays the number of top ten events of the type being collected for top ten statistics (for example, IPTalkers), seen during the last sampling interval. The EtherMeter can accumulate up to 1000 addresses and then determine which were among the top ten of the selected type.
Matched Broadcast/IPDisplays the number of packets of the selected type seen during the last sampling interval. This field only applies to IP and Ethernet broadcast monitoring.
9031529e4 Application ViewChapter 5–11
NATMeter Application
NATMeter Application Views
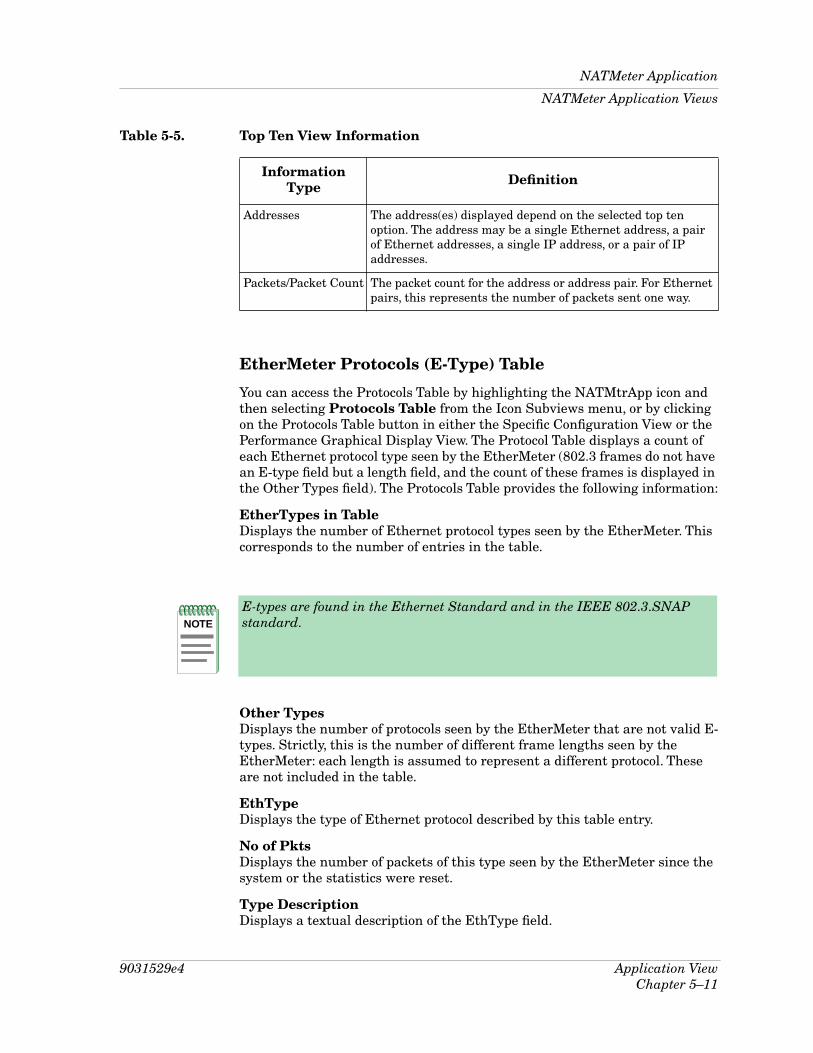
EtherMeter Protocols (E-Type) Table
You can access the Protocols Table by highlighting the NATMtrApp icon and then selecting Protocols Table from the Icon Subviews menu, or by clicking on the Protocols Table button in either the Specific Configuration View or the Performance Graphical Display View. The Protocol Table displays a count of each Ethernet protocol type seen by the EtherMeter (802.3 frames do not have an E-type field but a length field, and the count of these frames is displayed in the Other Types field). The Protocols Table provides the following information:
EtherTypes in TableDisplays the number of Ethernet protocol types seen by the EtherMeter. This corresponds to the number of entries in the table.
Other TypesDisplays the number of protocols seen by the EtherMeter that are not valid E-types. Strictly, this is the number of different frame lengths seen by the EtherMeter: each length is assumed to represent a different protocol. These are not included in the table.
EthTypeDisplays the type of Ethernet protocol described by this table entry.
No of PktsDisplays the number of packets of this type seen by the EtherMeter since the system or the statistics were reset.
Type DescriptionDisplays a textual description of the EthType field.
Table 5-5. Top Ten View Information
Information Type Definition
Addresses The address(es) displayed depend on the selected top ten option. The address may be a single Ethernet address, a pair of Ethernet addresses, a single IP address, or a pair of IP addresses.
Packets/Packet Count The packet count for the address or address pair. For Ethernet pairs, this represents the number of packets sent one way.
NOTE
E-types are found in the Ethernet Standard and in the IEEE 802.3.SNAP standard.

NATMeter ApplicationNATMeter Application Views
Application View NAT Ether-Meter DevicesChapter 5–12 Management Module Guide
EtherMeter Summary Statistics Display View
You can access the Summary Statistics Display view by highlighting the NATMtrApp icon and then selecting Performance Summary from the Icon Subviews menu, or by clicking on the Performance Summary button in either the Specific Configuration view or the Performance Graphical Display view. The Summary Statistics Display view provides two pie charts displaying summary statistics of Good Packets and Packet Size, and a table in this view provides the peak times and values of the statistics. This view provides the following information:
Peak Sampling IntervalDisplays the peak sampling interval, in seconds, as set in the EtherMeter Specific Configuration View.
Peak Frame TimeDisplays the date and time of the sampling interval in which the peak frame count was seen.
Pk Frame CountDisplays the number of frames in the peak sampling interval.
Peak Kbytes TimeDisplays the system time of the sampling interval in which the peak kbyte count was seen.
Pk Kbyte CountDisplays the number of kilobytes in the peak kbyte interval.
Peak Bcast TimeDisplays the system time of the sampling interval in which the peak broadcast count was seen.
Pk Bcast CountDisplays the maximum number of good packets, addressed to a broadcast address, in the peak broadcast sampling interval.
Peak Mcast TimeDisplays the system time of the sampling interval in which the peak multicast count was seen.
Pk Mcast CountDisplays the maximum number of good packets, directed to a multicast address, in the peak mcast interval.
Peak Util TimeDisplays the system time of the sampling interval in which peak utilization was seen (since the last Peaks Reset).
Pk Util PerCenDisplays the utilization (in the peak utilization interval) as a percentage.
9031529e4 Application ViewChapter 5–13
NATMeter Application
NAT-Alerts Application Views
Peaks Last ResetDisplays the system time when the Peaks Reset was last performed.
This button opens the Error Statistics Display view, described earlier in this chapter.
NAT-Alerts Application Views
Six application-specific subviews are available for the NAT-Alerts application. You can access the following views through the Icon Subviews menu for the NATMtrApp model:
• EtherMeter Alert Configuration View• Frame Rate Alert Configuration View• Broadcast Alerts Configuration View• Error Alerts Configuration View• Utilization Alert Configuration View• Multicast Alerts Configuration View
EtherMeter Alert Configuration View
You can access the Alert Configuration view by highlighting the NATAlrtApp icon and then selecting Configuration from the Icon Subviews menu. You can use this view to set the alert sampling interval, reset all alerts, and provide a summary of the five alert categories. This view provides the following information:
Last ResetDisplays the time at which the alerts were last reset. You can reset all alerts by clicking on the Reset All button. This sets the value of all the thresholds to zero (disabling all the alerts). You can enable or disable individual alerts in the appropriate configuration view.
Sampling IntervalDisplays the current alert Sampling Interval in seconds. You can modify this interval value (Do not confuse this sampling interval with other sampling intervals on the EtherMeter).
This view is divided into five areas, each with a button and fields showing whether that particular alert is enabled or disabled, the current threshold, and the count/value of that parameter. The count is updated dynamically after every alert sampling period.
Error Summary
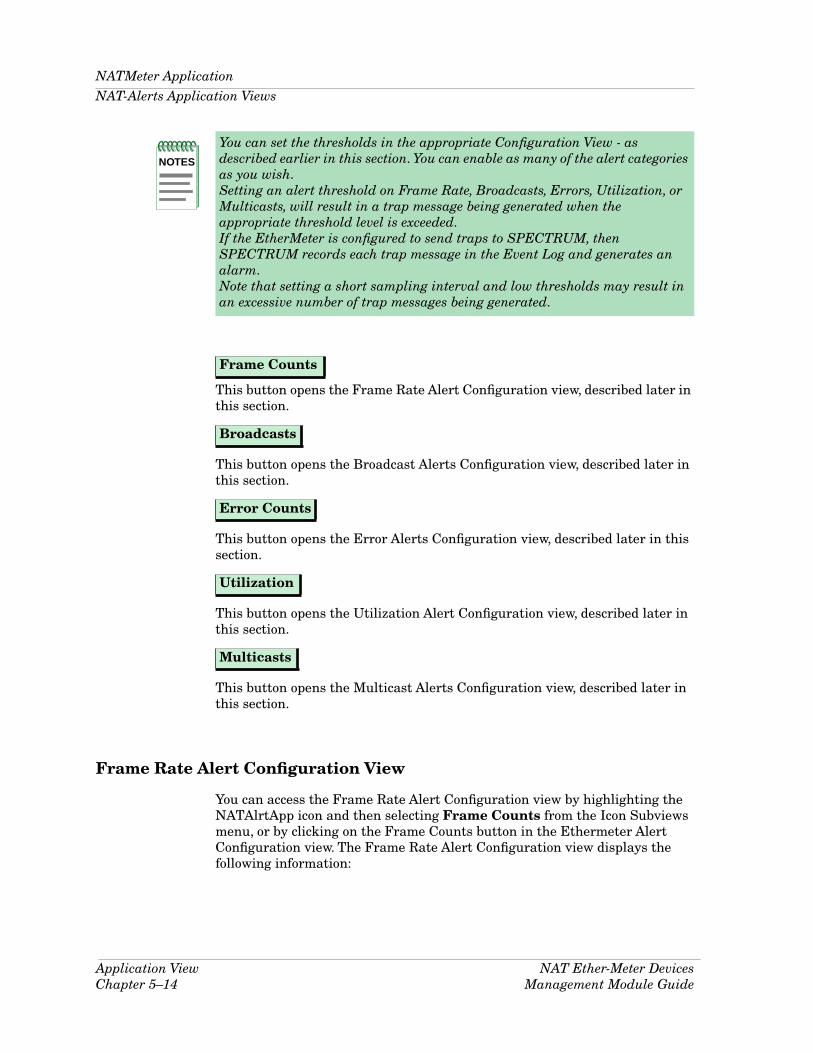
NATMeter ApplicationNAT-Alerts Application Views
Application View NAT Ether-Meter DevicesChapter 5–14 Management Module Guide
This button opens the Frame Rate Alert Configuration view, described later in this section.
This button opens the Broadcast Alerts Configuration view, described later in this section.
This button opens the Error Alerts Configuration view, described later in this section.
This button opens the Utilization Alert Configuration view, described later in this section.
This button opens the Multicast Alerts Configuration view, described later in this section.
Frame Rate Alert Configuration View
You can access the Frame Rate Alert Configuration view by highlighting the NATAlrtApp icon and then selecting Frame Counts from the Icon Subviews menu, or by clicking on the Frame Counts button in the Ethermeter Alert Configuration view. The Frame Rate Alert Configuration view displays the following information:
NOTES
You can set the thresholds in the appropriate Configuration View - as described earlier in this section. You can enable as many of the alert categories as you wish.Setting an alert threshold on Frame Rate, Broadcasts, Errors, Utilization, or Multicasts, will result in a trap message being generated when the appropriate threshold level is exceeded.If the EtherMeter is configured to send traps to SPECTRUM, then SPECTRUM records each trap message in the Event Log and generates an alarm.Note that setting a short sampling interval and low thresholds may result in an excessive number of trap messages being generated.
Frame Counts
Broadcasts
Error Counts
Utilization
Multicasts

9031529e4 Application ViewChapter 5–15
NATMeter Application
NAT-Alerts Application Views
Frame Rate AlertDisplays and allows you to configure whether the frame rate alert is Enabled or Disabled. Set a non-zero threshold to enable the alert; click on the Disable button to disable it.
ThresholdDisplays the current threshold for this alert. You can modify this value.
TimeDisplays the time of the last frame rate alert.
Sampling IntervalDisplays the alert sampling interval in seconds.
Frame PacketsDisplays the number of good packets in the previous sampling interval.
Total PacketsDisplays the total number of packets in the previous sampling interval.
ErrorsDisplays the number of errors in the previous sampling interval.
Broadcast Alerts Configuration View
You can access the Broadcast Alert Configuration view by highlighting the NATAlrtApp icon and then selecting Broadcasts from the Icon Subviews menu, or by clicking on the Broadcasts button in the Ethermeter Alert Configuration view. The Broadcasts Alerts Configuration view displays the following information:
Broadcast AlertsDisplays and allows you to configure whether the broadcast alert is Enabled or Disabled. Set a non-zero threshold to enable the alert; click on the Disable button to disable it.
ThresholdDisplays the current threshold (number of broadcast packets per sampling interval) for this alert. You can modify this value.
TimeDisplays the time of the last Broadcast alert.
Sampling IntervalDisplays the alert sampling interval in seconds.
Bcast PacketsDisplays the number of broadcast packets in the previous sampling interval.
Total PacketsDisplays the total number of packets in the previous sampling interval.

NATMeter ApplicationNAT-Alerts Application Views
Application View NAT Ether-Meter DevicesChapter 5–16 Management Module Guide
ErrorsDisplays the number of errors in the previous sampling interval.
Error Alerts Configuration View
You can access the Error Alerts Configuration view by highlighting the NATAlrtApp icon and then selecting Errors from the Icon Subviews menu, or by clicking on the Errors button in the Ethermeter Alert Configuration view. The Error Alerts Configuration view displays the following information:
Error AlertDisplays and allows you to configure whether the error alert is Enabled or Disabled. Set a non-zero threshold to enable the alert; click on the Disable button to disable it.
ThresholdDisplays the current threshold (number of errors per sampling interval) for this alert. You can modify this value.
TimeDisplays the time of the last error alert.
Sampling IntervalDisplays the alert sampling interval in seconds.
Total ErrorsDisplays the number of errors in the previous sampling interval (this includes errors, such a buffer overflows, which do not generate an error alert).
Total PacketsDisplays the total number of packets in the previous sampling interval.
ErrorsDisplays the number of errors in the previous sampling interval, and details the errors in the fields to the left of this field. The error count is divided into Short Frames, Transmit Collisions, Alignment Errors, CRC Errors, and Oversize Frames.
ShortDisplays the number of frames in the last sampling period with Short Frame errors. This field is updated dynamically after each alert sampling period.
CollsDisplays the number of frames in the last sampling period that suffered a collision. This field is updated dynamically after each alert sampling period.
AlgnsDisplays the number of frames in the last sampling period with alignment errors. This field is updated dynamically after each alert sampling period.

9031529e4 Application ViewChapter 5–17
NATMeter Application
NAT-Alerts Application Views
CRCDisplays the number of frames in the last sampling period with CRC errors. This field is updated dynamically after each alert sampling period.
OversizeDisplays the number of frames in the last sampling period with Oversize Frame errors. This field is updated dynamically after each alert sampling period.
Utilization Alert Configuration View
You can access the Utilization Alert Configuration view by highlighting the NATAlrtApp icon and then selecting Utilization from the Icon Subviews menu, or by clicking on the Utilization button in the Ethermeter Alert Configuration view. The Utilization Alert Configuration view displays the following information:
UtilizationAlertsDisplays and allows you to configure whether the utilization alert is Enabled or Disabled. Set a non-zero threshold to enable the alert; click on the Disable button to disable it.
ThresholdDisplays the current threshold for this alert as a percentage. You can modify this value.
TimeDisplays the time of the last utilization alert.
Sampling IntervalDisplays the alert sampling interval in seconds.
Utilization(%)Displays the utilization percentage in the previous sampling interval.
Total PacketsDisplays the total number of packets in the previous sampling interval.
ErrorsDisplays the number of errors in the previous sampling interval.

NATMeter ApplicationNAT Configuration Application Views
Application View NAT Ether-Meter DevicesChapter 5–18 Management Module Guide
Multicast Alerts Configuration View
You can access the Multicast Alerts Configuration view by highlighting the NATAlrtApp icon and then selecting Multicasts from the Icon Subviews menu, or by clicking on the Multicasts button in the Ethermeter Alert Configuration view. The Multicast Alerts Configuration view displays the following information:
Multicast AlertsDisplays and allows you to configure whether the multicast alert is Enabled or Disabled. Set a non-zero threshold to enable the alert; click on the Disable button to disable it.
ThresholdDisplays the current threshold (in multicast frames per sampling interval) for this alert. You can modify this value.
TimeDisplays the time of the last multicast alert.
Sampling IntervalDisplays the alert sampling interval in seconds.
Mcast PacketsDisplays the number of multicast packets in the previous sampling interval.
Total PacketsDisplays the total number of packets in the previous sampling interval.
ErrorsDisplays the number of errors in the previous sampling interval.
NAT Configuration Application Views
Six application-specific subviews are available for the NAT Configuration application. You can access the following views through the Icon Subviews menu for the NATCfgApp model:
• NAT EtherMeter Device Configuration View• NAT EtherMeter Accessing Hosts Configuration View• EtherMeter Download Control View• Modem Configuration View• Community Names Alias Configuration View• Network Parameters Configuration View

9031529e4 Application ViewChapter 5–19
NATMeter Application
NAT Configuration Application Views
NAT EtherMeter Device Configuration View
You can access the NAT EtherMeter Device Configuration view by highlighting the NATCfgApp icon and then selecting Configuration from the Icon Subviews menu, or by highlighting the main device icon and selecting Device Configuration from the Icon Subviews menu.
NAT EtherMeter Accessing Hosts Configuration View
You can access the NAT EtherMeter Accessing Hosts Configuration view by highlighting the NATCfgApp icon and then selecting Hosts Configuration from the Icon Subviews menu, or by clicking on the Accessing Hosts Tables button in the NAT EtherMeter Device Configuration view.
EtherMeter Download Control View
You can access the EtherMeter Download Control view by highlighting the NATCfgApp icon and then selecting Download Control from the Icon Subviews menu, or by clicking on the Download Control button in the NAT EtherMeter Device Configuration view.
Modem Configuration View
You can access the Modem Configuration view by highlighting the NATCfgApp icon and then selecting Modem Configuration from the Icon Subviews menu, or by clicking on the Modem Configuration button in the NAT EtherMeter Device Configuration view.
Community Names Alias Configuration View
You can access the Community Names Alias Configuration view by highlighting the NATCfgApp icon and then selecting Community Configuration from the Icon Subviews menu, or by clicking on the Community Name Aliases button in the NAT EtherMeter Device Configuration view.

Extended RMON Application
Application View NAT Ether-Meter DevicesChapter 5–20 Management Module Guide
Network Parameters Configuration View
You can access the Network Parameters Configuration view by highlighting the NATCfgApp icon and then selecting Network Params from the Icon Subviews menu, or by clicking on the Device Network Params button in the NAT EtherMeter Device Configuration View.
Extended RMON ApplicationEight application-specific subviews are available for the Extended RMON application. You can access the following views through the Icon Subviews menu for the NATRmonXApp model:
• EtherMeter Extended RMON Configuration View• EtherMeter RMON Statistics Tables View• EtherMeter RMON History Tables View• EtherMeter RMON Host Tables Control View• RMON Host TopN Tables View• RMON Matrix Tables View• EtherMeter IP Mapping Tables Control View• EtherMeter New Node Discovery Control View
EtherMeter Extended RMON Configuration View
You can access the EtherMeter Extended RMON Configuration view by highlighting the NATRmonXApp icon and then selecting Configuration from the Icon Subviews menu. In addition to the configuration information, this view provides ten buttons accessing other views, including the seven other Extended RMON views. This view provides the following information:
Host Table Maximum SizeDisplays and allows you to modify the maximum table size for a Host Table. The following sizes are valid: 128, 256, 512, 1024, 2048, and 4095. The new value is stored in non-volatile memory and takes effect after a power-up cycle.
No of Host Tables RequestedDisplays and allows you to modify the number of Host Tables requested(1 through 10). The value is stored in non-volatile memory and is used during power-on initialization.
No of Host Tables GrantedDisplays the maximum number of Host Tables supported by the EtherMeter. This is determined by the memory installed and the entries in the previous two fields. This number is evaluated only during power-on initialization and will be less than, or equal to, the number requested. A value of zero indicates that the Host Table is not supported due to lack of free memory. As with other RMON functions, the actual number of Host Tables at run time will depend on the memory available, regardless of the value in this field.

9031529e4 Application ViewChapter 5–21
Extended RMON Application
EtherMeter Extended RMON Configuration View
Matrix Table Maximum SizeDisplays and allows you to modify the maximum table size for a Matrix Table. The following sizes are valid: 512, 1024, 2048, and 4095. The new value is stored in non-volatile memory and takes effect after a power-up cycle.
No of Matrix Tables RequestedDisplays and allows you to modify the number of Matrix Tables requested (1 through 10). The value is stored in non-volatile memory and is used during power-on initialization.
No of Matrix Tables GrantedDisplays the maximum number of Matrix Tables supported by the EtherMeter. This is determined by the memory installed and the entries in the previous two fields. This number is evaluated only during power-on initialisation and will be less than, or equal to, the number requested. A value of zero indicates that the Matrix Table is not supported due to lack of free memory. As with other RMON functions, the actual number of Matrix Tables at run time will depend on the memory available, regardless of the value in this field.
RMON Learn Bad PacketsWhen this field is set to Enabled, the RMON host and matrix group can learn new entries from bad packets; that is, packets that could be read but had a Frame Check Sequence error. You can Enable or Disable this learning.
RMON Matrix AddressesDisplays and allows you to modify the learning type of the Matrix Tables. The following settings are valid: All, Both, Source, and Destination.
This button opens the EtherMeter RMON Statistics Tables View, described later in this section.
This button opens the EtherMeter RMON History Tables View, described later in this section.
This button opens the EtherMeter RMON Host Tables Control View, described later in this section.
This button opens the RMON Matrix Tables View, described later in this section.
RMON Statistics
RMON History
RMON Hosts
RMON Matrix

Extended RMON ApplicationEtherMeter Extended RMON Configuration View
Application View NAT Ether-Meter DevicesChapter 5–22 Management Module Guide
This button opens the RMON Host TopN Tables View, described later in this section.
Thsi button opens the RMON Events/Alarms View.
This button opens the RMON Filter & Channel Configuration View.
This button opens the RMON Packet Capture Buffer Control View.
This button opens the EtherMeter IP Mapping Tables Control View, described later in this section.
This button opens the EtherMeter New Node Discovery Control View, described later in this section.
RMON TopN
RMON Events/Alarms
RMON Filters/Channels
RMON Packet Capture
EtherMeter IP Mapping
EtherMeter NND
NOTES
In the following views, there are two fields that control the table entry order:Sort On field. Select the parameter on which table entries should be sorted from the drop-down list.Order field. Select whether to display entries in Ascending or Descending order.There is also an Add Table button for adding table entries.

9031529e4 Application ViewChapter 5–23
Extended RMON Application
EtherMeter RMON Statistics Tables
EtherMeter RMON Statistics Tables
You can access the EtherMeter RMON Statistics Tables view by highlighting the NATRmonXApp icon and then selecting RMON Statistics from the Icon Subviews menu, or by clicking on the RMON Statistics button in the EtherMeter Extended RMON Configuration view. This view provides the following statistics for each monitored interface:
Data SourceDisplays the Ethernet interface on which the statistics are collected. You can update this field in the RMON Statistics Configuration Detail view.
StatusDisplays the status of this entry: Valid indicates that statistics are being collected for this interface. You can update this field in the RMON Statistics Configuration Detail view. Table 5-6 lists valid settings for this field.
OwnerDisplays the identity of the owner that configured this statistics, and is therefore using the resources associated with it. You can update this field in the RMON Statistics Configuration Detail view.
NOTE
Double-clicking on: Data Source, Packets, Broadcasts, or Multicasts fields displays the RMON Statistic Performance View. In turn, you can display the RMON Statistics Detail View which contains two pie charts.Status or Owner fields displays the RMON Statistics Configuration Detail View in which you can update several fields.Any other field takes you directly to the RMON Statistics Detail View.
Table 5-6. Valid Status Entries
Entry Definition
Valid Start collecting statistics.
Create Create a new Host Table. If the request is successful, the status changes to UnderCreation.
Modify Updates the configuration with any changes made in the Configuration Detail View. Stops the collection of statistics until the status is changed to Valid again.
Delete Remove the statistics.
Extended RMON ApplicationEtherMeter RMON Statistics Tables
Application View NAT Ether-Meter DevicesChapter 5–24 Management Module Guide
PacketsDisplays the number of good packets seen by the EtherMeter on this interface since the status was last changed to Valid.
BroadcastsDisplays the number of good packets seen by the EtherMeter on this interface, since the status was last changed to Valid, that were directed to a broadcast address.
MulticastsDisplays the number of good packets seen by the EtherMeter on this interface, since the status was last changed to Valid, that were directed to a multicast address.
OctetsDisplays the number of octets seen by the EtherMeter on this interface since the status was last changed to Valid. This includes octets in bad packets and FCS (Frame Check Sequence) octets but excludes framing bits.
CRC/AlignDisplays the number of CRC and Alignment errors seen by the EtherMeter on this interface since the status was last changed to Valid.
CollisionsDisplays the best estimate of the number of collisions seen by the EtherMeter on this interface since the status was last changed to Valid.
FragmentsDisplays the number of fragments seen by the EtherMeter on this interface since the status was last changed to Valid.
JabbersDisplays the number of packets that were no longer than 1518 bytes and were not an integral number of octets in length or had a bad Frame Check Sequence. This value includes Frame Check Sequences, but excludes framing bits.
OversizedDisplays the number of packets received that were longer than 1518 bytes in length but were otherwise valid. This includes FCS octets, but not framing bits.
UndersizedDisplays the number of packets received that were less than 64 bytes in length but were otherwise valid. This includes FCS octets, but not framing bits.
Drop EventsDisplays the number of events in which packets were dropped because the EtherMeter did not have the buffer space.
9031529e4 Application ViewChapter 5–25
Extended RMON Application
EtherMeter RMON Statistics Tables
This button allows you to add or modify an entry. Type in the Table Index (for example, if the table already has five entries, type in 6 for a new table). Save and commit this index using the right mouse button, then click on the Config Detail button to display the RMON Statistics Configuration Detail view, described later in this section.
RMON Statistics Configuration Detail View
This view is used to add new table entries and to update existing configurations. You can enter/update the Data Source, Status, and Owner fields in this view. You can access this view from the EtherMeter RMON Statistics Table view by:
• Clicking on the Add Table button. Type in the Table Index to add or update. Save and commit the index, then click on the Config Detail button.
• Double-clicking on the Status or Owner fields. This displays the current configuration details for the selected entry, which you can then update.
RMON Statistics Performance View
You can access this view by double-clicking on an entry in one of the following fields in the EtherMeter RMON Statistics Table view: Data Source, Packets, Broadcasts, or Multicasts. This view provides a standard SPECTRUM Performance view with a multi-attribute line graph showing: %load, Frame Rate, %Errors, and % Collisions.
Clicking on this button displays the RMON Statistics Detail view, described later in this section.
RMON Statistics Detail View
You can access this view by clicking on the Detail button in the RMON Statistics Performance view, or by double-clicking on an entry in any of the following fields in the EtherMeter RMON Statistics Table View: Octets, CRC/Align, Collisions, Fragments, Jabbers, Oversized, Undersized, or Drop Events. This view provides two color-coded pie charts displaying the breakdown of Ethernet statistics since the device was last reset. Each statistic is represented both as a total count and as a percentage of the overall traffic. The two pie charts are of the following type:
Add Table
Detail

Extended RMON ApplicationEtherMeter RMON History Tables
Application View NAT Ether-Meter DevicesChapter 5–26 Management Module Guide
• The Frame Breakdown pie chart displays the network segment’s total traffic by frame size.
• The Error Breakdown pie chart displays the network segment’s frames with errors by error type.
EtherMeter RMON History Tables
You can access the EtherMeter RMON History Tables view by highlighting the NATRmonXApp icon and then selecting History from the Icon Subviews menu, or by clicking on the RMON History button in the EtherMeter Extended RMON Configuration view (A History Table shows the short-term history of network statistics). Each entry in this view shows the configuration of one History Table. It also provides access to that individual History Table via double-click zones.
IndexDisplays the unique index for the entry (History Table). When generating a new entry, use the next available index.
StatusDisplays the status of this entry: Valid indicates that statistics are being collected for this interface. You can update this field in the Detail Configuration view. Table 5-7 lists valid settings for this field.
NOTE
Double-clicking on: Status or Owner fields displays the RMON History Configuration Detail View in which you can update the configuration of a History Table.Any other field displays the RMON History Table associated with that configuration entry.
Table 5-7. Valid Status Entries
Entry Definition
Valid Start collecting statistics for the History Table.
Create Create a new History Table. If the request is successful, the status changes to UnderCreation.
Modify Updates the configuration with any changes made in the Configuration Detail View. Stops the collection of statistics until the status is changed to Valid again.
Delete Remove the History Table.
9031529e4 Application ViewChapter 5–27
Extended RMON Application
EtherMeter RMON Host Tables Control View
OwnerDisplays the administratively assigned name of the owner that configured this entry and is using the resources assigned to it.
Data SourceDisplays the interface on which the History Table statistics are being collected. More than one History Table can be configured for the same interface.
IntervalDisplays and allows you to modify the sampling interval, in seconds. Values between 1 and 3600 are allowed. The default is 1800 seconds (30 minutes).
SizeReqDisplays the requested size of the History Table (the maximum number of hosts).
SizeDisplays the number of good packets received during the interval.
This button allows you to add or modify a capture buffer. Type in the index to add or modify, then save and commit the index by using the save option. Click on the Config Detail button to access the Packet Capture Configuration Detail view.
EtherMeter RMON Host Tables Control View
You can access the EtherMeter RMON Host Tables Control view by highlighting the NATRmonXApp icon and then selecting Hosts from the Icon Subviews menu, or by clicking on the RMON Hosts button in the EtherMeter Extended RMON Configuration view. Each entry contains a list of parameters that set up the discovery of hosts on a particular interface, and the collection of statistics about these hosts. The Host Table shows the traffic statistics of the selected interface including: MAC addresses, in/out packets and octets, broadcasts and multicasts. It also shows the order in which hosts were entered into the table; if an earlier entry is deleted, the number of the remaining entries will change. (More than one Host Table can be configured for the same interface; for example, using different sample intervals.)
Add Table
NOTE
Double-clicking on: Status or Owner fields displays the RMON Hosts Configuration Detail View in which you can update several fields.Any other field displays the RMON Host Table associated with the selected control entry.

Extended RMON ApplicationEtherMeter RMON Host Tables Control View
Application View NAT Ether-Meter DevicesChapter 5–28 Management Module Guide
IndexDisplays the index of the Host Table (1 to 65355).
StatusDisplays the status of this entry. If the status is not Valid, all associated entries will be deleted from the Host Table. You can update this field in the Host Configuration Detail view. Table 5-8 lists valid settings for this field.
OwnerDisplays the identity of the owner who configured this entry and is using the resources assigned to it. You can update this field in the Detail Configuration view.
Data SourceDisplays the interface on which data for this Host Table is collected. You can update this field in the Configuration Detail view by updating the status to Modify; however, the collection of statistics is interrupted.
EntriesDisplays the number of entries in the Host Table associated with this control entry.
Last UpDisplays the value of the System Up Time when the last entry was deleted from the portion of the Host Table associated with this entry. If no deletions have occurred, this field has the value of zero.
This button allows you to add or modify a capture buffer. Type in the index to add or modify, then save and commit the index by using the save option. Click on the Config Detail button to access the Packet Capture Configuration Detail view.
Table 5-8. Valid Status Entries
Entry Definition
Valid Start collecting statistics.
Create Create a new Host Table. If the request is successful, the status changes to UnderCreation.
Modify Updates the configuration with any changes made in the Configuration Detail View. Stops the collection of statistics until the status is changed to Valid again.
Delete Remove the associated Host Table.
Add Table

9031529e4 Application ViewChapter 5–29
Extended RMON Application
RMON Host TopN Tables
RMON Host TopN Tables
You can access the RMON Hosts TopN Tables view by highlighting the NATRmonXApp icon and then selecting TopN from the Icon Subviews menu, or by clicking on the RMON TopN button in the EtherMeter Extended RMON Configuration view. You can use this view to define reports to find the hosts generating the most traffic for a given parameter; for example, the hosts generating most errors. Up to ten TopN reports can be defined. Unlike the Top10 reports, TopN statistics are only collected when you specifically start a report. You define the period over which you want to collect the statistics, and the number of top entries (the N in TopN) that you want to display information for. The actual TopN statistics are then displayed in the RMON TopN Host Table view. The table shows entries in descending order (highest traffic first).
IndexDisplays a system-generated index for the entry (1 to 65535).
StatusDisplays the current status. You can update this field in the TopN Configuration Detail view. Table 5-9 lists valid settings for this field.
NOTE
Double-clicking on: Status or Owner fields displays the RMON TopN Configuration Detail View in which you can update several fields.Any other field displays the RMON TopN Host Table View, which shows the last collected set of TopN data. You can also access the RMON TopN Configuration Detail View from this table. You can run the TopN report from either the TopN Host Table View or the RMON TopN Configuration Detail View.
Table 5-9. Valid Status Entries
Entry Definition
Valid Able to collect statistics.
Create Req Create a new TopN Report. If the request is successful, the status changes to UnderCreation.
Modify Updates the configuration with any changes made in the Configuration Detail View. Stops the collection of statistics until the status is changed to Valid again.
Delete Remove the TopN Report.
Extended RMON ApplicationRMON Host TopN Tables
Application View NAT Ether-Meter DevicesChapter 5–30 Management Module Guide
OwnerDisplays the administratively assigned name of the owner that configured this entry and is using the resources assigned to it. You can update this field in the Configuration Detail view.
Data SourceDisplays the interface on which data for the TopN Table is collected. You can update this field in the Configuration Detail view by changing the status to Modify; however, the collection of TopN statistics is interrupted.
ReportIdentifies the parameter that the TopN is reporting on. Valid entries are: In Pkts, Out Pkts, In Octets, Out Octets, Errors, Bcast Pkts, and Mcast Pkts. This is equivalent to the Rate Base field in the Configuration Detail view, and the Report Type in the TopN Host Table view.
StartedDisplays the time the report was started from the TopN Host Table view or the Configuration Detail view.
Time LeftDisplays the number of seconds left in the report currently being generated, if any, when the view is opened. A value of zero indicates that statistics for this particular report were not being collected when the view was opened. The Time Remaining/Time Left in Sample fields are used to start the collection of data in the Configuration Detail view, and the TopN host Table view, respectively. Setting a non-zero value defines the report duration. When you save and commit the value, data collection starts and the time left is counted down.
Req SizeDisplays the value of N; that is, the number of entries to include in the report. You can update this field in the Configuration Detail view. When you save and commit the size using the right mouse button, the Granted Size field indicates how many entries the system is able to provide (depending on the amount of memory available).
SizeDisplays the number of entries actually produced the last time this report was run. This will be equal to, or less than, the Req Size.
DurationDisplays the amount of time over which statistics for the last report were gathered.
This button allows you to add or modify a capture buffer. Type in the index to add or modify, then save and commit the index by using the save option. Click on the Config Detail button to access the Packet Capture Configuration Detail view.
Add Table
9031529e4 Application ViewChapter 5–31
Extended RMON Application
RMON Matrix Tables View
TopN Host Table View
You can access this view by double-clicking on any field (other than the Status and Owner fields) in the RMON Host TopN View. This view provides the parameters for the last TopN report, as well as the top N entries in the table. The meaning of the Rate Value field depends on the Report Type.
You can use this view to start another report. To do so, enter a non-zero value in the Time Left in Sample field, and save and commit the value. When the data collection period has been completed, click on the Update button to refresh the table with these latest results.
This button opens the RMON TopN Configuration Detail view.
RMON Matrix Tables View
You can access the RMON Matrix Tables view by highlighting the NATRmonXApp icon and then selecting Matrix Control from the Icon Subviews menu, or by clicking on the RMON Matrix button in the EtherMeter Extended RMON Configuration view. The RMON Matrix Tables provide a complete cross reference of devices that are transmitting (sources) and the corresponding devices that are receiving these transmissions over the network segment being monitored by the EtherMeter. The RMON Matrix maintains statistics (amount of traffic and the number of errors) for conversations between addresses (nodes); that is, it tells you which nodes are communicating on the Ethernet interface of the EtherMeter, and what traffic and errors occurred on each pair. The RMON Matrix Tables View is also useful in isolating nodes that are transmitting errors. There are two matrix tables in this view; the SD (Source to Destination) and the DS (Destination to Source) Matrix Tables. This view provides the following information:
IndexDisplays a unique index for the entry (1 to 65355).
Config Detail
NOTE
Double-clicking on: On the Owner or Status fields displays the Configuration Detail View in which you can update the Table size, Owner, and Data Source for the control entry.Any other field displays the RMON SD Matrix Table.
Extended RMON ApplicationRMON Matrix Tables View
Application View NAT Ether-Meter DevicesChapter 5–32 Management Module Guide
StatusDisplays the status of the entry. Unless the status is Valid, all associated entries in the Matrix Table are deleted. You can update this field in the Configuration Detail view. Table 5-10 lists valid settings for this field.
OwnerDisplays the owner of the resource you are using. This field helps you to track the table if more than one table is running. You can update this field in the Configuration Detail view by changing the status to Modify; however, the collection of statistics is interrupted.
Data SourceDisplays the source of data (interface) on which a traffic matrix is collected. You can update this entry in the Configuration Detail view by changing the status to Modify; however, the collection of statistics is interrupted.
SizeDisplays the number of entries in the Matrix Table that are associated with this entry.
Last DeletedDisplays the System Up Time value when the last entry was deleted from the portion of the Matrix Table associated with this entry. If no deletions have occurred, this field has the value of zero.
This button allows you to add or modify a capture buffer. Type in the index to add or modify, then save and commit the index by using the save option. Click on the Config Detail button to access the Packet Capture Configuration Detail view.
Table 5-10. Valid Status Entries
Entry Definition
Valid Start collecting statistics.
Create Create a new Matrix Table. If the request is successful, the status changes to UnderCreation.
Modify Updates the configuration with any changes made in the Configuration Detail View. Stops the collection of statistics until the status is changed to Valid again.
Delete Remove the associated Matrix Table.
Add Table
9031529e4 Application ViewChapter 5–33
Extended RMON Application
RMON Events/Alarms Tables Configuration View
RMON Events/Alarms Tables Configuration View
You can access the RMON Events/Alarms Tables Configuration view by clicking on the RMON Events/Alarms button in the EtherMeter Extended RMON Configuration view.
The RMON Alarm feature records statistical samples from the EtherMeter and compares them to the previously defined thresholds (a rising threshold and a falling threshold). SPECTRUM generates an event when the value crosses a threshold, and shows whether the values were rising or declining.
The Event Table processes any generated events based on parameters configured in the Events Table. For example, based on what events have been configured to be accepted, it could log the event or discard it. Some events are mapped to corresponding alarms via the index number.
Alarm Table
This table displays the following information on the RMON alarms that will be reported by the EtherMeter:
IndexDisplays a unique index for the entry in the Alarm Table (1 through 10).
StatusDisplays the status of the entry. You can update this field in the Configuration Detail view. Table 5-11 lists valid settings for this field.
NOTE
Double-clicking on: Status or Owner fields displays the RMON Alarm Configuration Detail View in which you can update several fields.Any other field displays the RMON Alarm Table.
Table 5-11. Valid Status Entries
Entry Definition
Valid Start collecting statistics.
Create Create a new entry. If the request is successful, the status changes to UnderCreation.

Extended RMON ApplicationRMON Events/Alarms Tables Configuration View
Application View NAT Ether-Meter DevicesChapter 5–34 Management Module Guide
OwnerDisplays the administratively assigned name of the owner that configured this table entry, and is therefore using the resources assigned to it.
VariableDisplays the Object Identifier (OID) of the variable being sampled. This can be of the type: Integer, Counter, Gauge, or TimeTicks.
RateDisplays the interval, in seconds, over which the data is sampled and compared with the alarm thresholds. Values between 1 and 32767 seconds are allowed. The default setting is 60 seconds.
Sample TypeDisplays the sampling method used. Table 5-12 provides definitions of the two methods available.
Last ValDisplays the absolute or delta value of the statistic during the last sampling interval. This field is updated after each sampling interval.
Rising ThreshDisplays the high threshold for the sampled statistic. SPECTRUM generates a single event for the object if either of the following conditions are met:
• The current sampled value is greater than or equal to this threshold and the value at the last sampling interval was less than this threshold.
Modify Updates the configuration with any changes made in the Configuration Detail View. Stops the collection of statistics until the status is changed to Valid again.
Delete Remove the associated entry.
Table 5-11. Valid Status Entries
Entry Definition
Table 5-12. Valid Sample Types
Entry Definition
Absolute The value of the selected variable is compared directly with the thresholds after each sampling interval.
Delta The change in the selected variable, from the end of one sampling period to the end of the next, is compared to the thresholds. This is the default Sampling Type.

9031529e4 Application ViewChapter 5–35
Extended RMON Application
RMON Events/Alarms Tables Configuration View
• The first sample after this entry becomes valid is greater than or equal to this threshold and the associated Startup Alarm is equal to Rising_or_Falling or Rising.
After a rising event is generated, another rising event will not be generated until the sampled value falls below the Rising Threshold and reaches the Falling Threshold. You can update this field in the Configuration Detail view.
EventDisplays the index of the event entry that is used when the rising threshold is crossed.
Falling ThreshDisplays the low threshold for the sampled statistic. SPECTRUM generates a single event for the object if either of the following conditions are met:
• The current sampled value is less than or equal to this threshold and the value at the last sampling interval was greater than this threshold.
• The first sample after this entry becomes valid is less than or equal to this threshold and the associated Startup Alarm is equal to Rising_or_Falling or Falling.
After a falling event is generated, another falling event will not be generated until the sampled value rises above the Falling Threshold and reaches the Rising Threshold. You can update this field in the Configuration Detail view. Values between 0 (the default) and 4294967295 are valid.
EventDisplays the index of the event entry that is used when the falling threshold is crossed.
This button allows you to add or modify an alarm. Type in the index of the alarm to modify, or the next available index to add an alarm, then save and commit the index using the mouse button. Click on the Config Detail button to access the Alarm Capture view.
Event Table
Each entry in this control table defines one event that will be generated by the EtherMeter when the appropriate conditions occur. The event is triggered by associated alarms or channel entries. You can create, modify, or remove events from this table.
Add Alarm

Extended RMON ApplicationRMON Events/Alarms Tables Configuration View
Application View NAT Ether-Meter DevicesChapter 5–36 Management Module Guide
IndexDisplays a unique index for the entry in the Event Control Table.
StatusDisplays the status of the entry. You can update this field in the Configuration Detail view. Table 5-13 lists valid settings for this field.
OwnerDisplays the administratively assigned name of the owner that configured this table entry, and is therefore using the resources assigned to it. You can update this field in the Configuration Detail view.
ActionDisplays the type of notification that will be made if this event is generated. You can update this field in the Configuration Detail view. Table 5-14 lists the valid settings for this field.
NOTE
Double-clicking on: Status or Owner fields displays the RMON Event Configuration Detail View in which you can update several fields.Any other field displays the RMON Event Log View with a list of logged events for the selected entry.
Table 5-13. Valid Status Entries
Entry Definition
Valid The Event Table is valid.
Create Create a new event entry. If the request is successful, the status changes to UnderCreation.
Modify Updates the configuration with any changes made in the Configuration Detail View.
Delete Remove the Event Table and all associated log entries.
Table 5-14. Valid Action Entries
Entry Definition
None No action is required. This is the default.
Log An entry is placed in the Log Table each time this event occurs. The last 128 log entries for each event are stored.
SNMP-Trap An SNMP trap is sent to all trap hosts each time the event occurs.
Trap-And-Log Both of the above actions occur.

9031529e4 Application ViewChapter 5–37
Extended RMON Application
RMON Filter and Channel Configuration View
CommunityDisplays the SNMP community name associated with any trap generated for this event. You can update this field in the Configuration Detail view.
Last SentDisplays the System UpTime value at the time the entry last generated an event. If the entry has not generated any event, this field has a zero value.
DescriptionDisplays a textual description of the entry. You can update this field in the Configuration Detail view.
This button opens the RMON Event Log Table. This shows the Event Index, its number in the Log Table, time of logging, and a description of every event generated by the EtherMeter.
This button allows you to add or modify an event. Type in the event index to add or modify, then save and commit the index by clicking save. Click on the Config Detail button to access the Event Capture view.
RMON Filter and Channel Configuration View
You can access the RMON Filter and Channel Configuration view by clicking on the RMON Filters/Channels button in the EtherMeter Extended RMON Configuration view. This view contains the Filter Table and the Channel Table. The Filter Table defines a filtering pattern against which packets are matched. The matching packets form a data stream (or channel), as defined in the Channel Table. The data stream can be captured (see the Packet Capture Buffer Control view) or can generate an event. The EtherMeter can support up to ten filters (Filter Table entries) and up to ten channels.
Filter Table
Each entry in this table defines one filtering condition to be applied to every packet received on the ethernet interface of the EtherMeter. You can create up to five filters. This table provides the following information:
FilterDisplays the index for entries in this table.
ChannelDisplays the name of the channel associated with this filter. The same name is used in the Channel Table.
View Event Log
Add Event

Extended RMON ApplicationRMON Filter and Channel Configuration View
Application View NAT Ether-Meter DevicesChapter 5–38 Management Module Guide
StatusDisplays the status of this filter entry.
OffsetDisplays the byte offset at which you want to start filtering data. The offset is measured from the beginning of the destination Ethernet address in a packet. The default is 0. You can update the offset in the Configuration Detail view.
HexDataDisplays the data to match to in hex format.
TxtDataDisplays the data to match as a text string.
OwnerDisplays the administratively assigned name of the owner that created this filter and uses the resources assigned to it. You can update this field in the Configuration Detail view.
This button allows you to add or modify a filter. Type in the filter index to add or modify, then save and commit the index by selecting Save. Click on the Config Detail button to access the Filter Capture view.
Channel Table
Each entry in this table defines one channel configuration. This table provides the following information:
ChannDisplays the channel for this table entry. This is the index for this table and corresponds to a value in the Channel field in the Filter Table.
AcceptTypeDisplays and allows you to modify the action of filters associated with this channel. Table 5-15 displays the valid entries for this field.
StatusDisplays the status of this channel entry.
Add Filter
Table 5-15. Valid AcceptType Entries
Entry Definition
AcceptMatched Packets will be accepted to this channel if they passed both the data and the status matches in the associated filter.
AcceptFailed Packets will be accepted to this channel only if they failed one of the matches in the associated filter(s).

9031529e4 Application ViewChapter 5–39
Extended RMON Application
RMON Filter and Channel Configuration View
DataCtrlDisplays and allows you to modify the flow of data through this channel. If it is set to On, data, status, and events flow through this channel; that is, matched packets may generate events or be captured by the Packet Capture function. The default setting is Off.
ONevntDisplays and allows you to modify the event that is configured to turn the channel Data Control from Off to On. This event is defined in the Event Table. If there is no entry with this event index, then no association exists and this field should be set to zero.
OFFevntDisplays and allows you to modify the event that is configured to turn the channel Data Control from On to Off. This event is defined in the Event Table. If there is no entry with this event index, then no association exists and this field should be set to zero.
EvtIndxDisplays and allows you to modify the event that is configured to be generated when the channel Data Control is On and a packet is matched. This event is defined in the Event Table. If there is no entry with this event index, then no association exists and this field should be set to zero.
EvntStatusDisplays and allows you to modify the event status of the channel. You can use this to control the flow of events, if this channel is configured to generate events, when packets are matched. Table 5-16 lists the valid settings for this field.
MatchesDisplays the number of matches on this channel to the filtering conditions set up in the Filter Table.This field is updated even if the DataCtrl field is set to Off.
Table 5-16. Valid Event Status Entries
Entry Definition
EventReady A single event may be generated after which the EvntStatus will be set to EventFired by the EtherMeter. This is the default setting.
EventFired No events will be generated until this field is updated to EventReady or EventAlwaysReady.
EventAlwaysReady Disables the flow control and allows events to be generated at will. This setting is not recommended because it may result in high network traffic or other performance problems.

Extended RMON ApplicationRMON Packet Capture Buffer Control View
Application View NAT Ether-Meter DevicesChapter 5–40 Management Module Guide
OwnerDisplays the owner of the table resources you are using. The owner name is usually assigned by the network administrator.
This button allows you to add or modify a channel. Type in the channel index to add or modify, then save and commit the index by selecting Save. Click on the Config Detail button to access the Channel Capture view.
RMON Packet Capture Buffer Control View
You can access the RMON Packet Capture Buffer Control view by clicking on the RMON Packet Capture button in the EtherMeter Extended RMON Configuration view. This view controls the capture of packets from associated channels and places them in a buffer specified by the Capture Buffer Table. Each entry controls one set of packets that is captured and controlled by one or more filters. Up to ten entries are allowed. This view provides the following information:
IndexDisplays the index for the entry in this table is displayed.
ChannelDisplays and allows you to modify the channel that is the source of packets being captured. This corresponds to a channel in the Channel Table from the RMON Filter and Channel Configuration View.
StatusDisplays and allows you to modify the status of this entry.
FullStatusDisplays the status of the memory allocated to this channel in the EtherMeter’s buffer. Possible values are: Full (memory is full), or Available (free memory remains).
FullActionDisplays the action to take when the buffer is full. Possible values are: Lock (stop capturing data when the buffer is full), or Wrap (keep capturing data, turning out the oldest data in the allocated memory as necessary to make room for it).
CaptureSizeDisplays the maximum amount of data (octets) in a frame that will be saved in this capture buffer (even if the packet size is larger). If this field is set to zero, the capture buffer will save as many octets as is possible.
BufferSizeDisplays the number of bytes of the EtherMeter’s buffer that have been allocated to this channel.
Add Channel

9031529e4 Application ViewChapter 5–41
Extended RMON Application
EtherMeter IP Mapping Tables Control View
TurnOnTimeDisplays the System UpTime value when this capture buffer was first turned on.
This button allows you to add or modify a capture buffer. Type in the index to add or modify, then save and commit the index by using the save option. Click on the Config Detail button to access the Packet Capture Configuration Detail view.
EtherMeter IP Mapping Tables Control View
You can access the EtherMeter IP Mapping Tables Control view by highlighting the NATRmonXApp icon and then selecting IP Mapping from the Icon Subviews menu, or by clicking on the EtherMeter IP Mapping button in the EtherMeter Extended RMON Configuration view. This view displays a table of MAC address to IP address mappings. Any duplicate MAC entries (such as would be produced by a router) can be entered into a separate table of router MAC addresses. This will prevent unecessary trap messages being generated for duplicate addresses or address changes.
The EtherMeter IP Mapping Tables Control view provides the following information:
IndexDisplays an index uniquely identifying the entry.
HostIndexDisplays the Host Table on which the MAC to/from IP mapping table will be based. You can update this field if the status is not set to Valid. Values for this field can range between 1 and 65535.
EntriesDisplays the total number of entries in the mapping tables.
UpTimeDisplays the time since the control entry was validated.
TrapsDisplays and allows you to configure whether traps will be generated if Duplicate IP Address or IP Address Change is detected.
Add Table
NOTE
Double-clicking on the Status field displays the Configuration Detail View.

Extended RMON ApplicationEtherMeter New Node Discovery Control View
Application View NAT Ether-Meter DevicesChapter 5–42 Management Module Guide
StatusDisplays and allows you to modify the mapping status. When the status is Valid, the physical address to/from IP address mapping function is enabled (if the associated Host Table exists; if not, a ‘BadValue’ error message will be returned). When the setting is not Valid, the mapping function is disabled and the entries in the two mapping tables, if any, are cleared. Table 5-17 lists the valid settings for this field.
ChangesDisplays the number of times the IP Address of any mapping has changed.
DuplicatesDisplays the number of times the IP address of any mapping was found to be a duplicate.
This button allows you to add or modify a capture buffer. Type in the index to add or modify, then save and commit the index by using the save option. Click on the Config Detail button to access the Packet Capture Configuration Detail view.
EtherMeter New Node Discovery Control View
You can access the EtherMeter New Node Discovery Control view by highlighting the NATRmonXApp icon and then selecting New Node Discovery from the Icon Subviews menu, or by clicking on the EtherMeter NND button in the EtherMeter Extended RMON Configuration view. Each entry in the table contains a list of parameters that set up the new node detection function on a Host Table. When you enable new node detection, the Host Table on which you are detecting new nodes is ‘frozen’. Any addresses detected, which were not in the host Table at the point it was frozen, are considered to be new nodes. New nodes are logged in a New Node Table. This view provides the following information:
Table 5-17. Valid Status Entries
Entry Definition
Valid Start collecting statistics.
Create Create a new event entry. If the request is successful, the status changes to UnderCreation.
Modify Updates the configuration with any changes made in the Configuration Detail View. Stops the collection of statistics until the status is changed to Valid again.
Delete Remove the associated entry.
Add Table

9031529e4 Application ViewChapter 5–43
Extended RMON Application
EtherMeter New Node Discovery Control View
IndexDisplays an index uniquely identifying the entry in this table.
HostTableIdentifies the RMON Host Table on which the new node detection function will be based. You can update this field if the Status is not set to Valid. Values between 1 and 65535 are allowed.
Freeze SizeDisplays the size of the Host Table (that is, the number of entries) when it was frozen.
New SizeDisplays the number of new nodes detected (entries in the New Node Detection Host Table). These entries also exist in the associated RMON Host Table but are considered to be ‘illegal’ hosts since they are learned after the RMON Host Table is set to Freeze.
NOTES
Double-clicking on the Status field displays the Configuration Detail View.Double-clicking on any other field displays the New Node Table containing new nodes discovered for the associated Host Table.
Extended RMON ApplicationEtherMeter New Node Discovery Control View
Application View NAT Ether-Meter DevicesChapter 5–44 Management Module Guide
Up TimeDisplays the System Up Time in relation to the Freeze. If the ControlMode is set to Freeze, this field indicates the time that has elapsed since the associated Host Table was Frozen. If the ControlMode is set to Edit, this field indicates how long the last Freeze was in force.
TrapsDisplays and allows you to configure whether traps will be generated if a new host entry is detected. You can update this field in the Configuration Detail View. When set to Enabled, the Control Mode must also be set to Freeze for traps to be generated.
StatusDisplays and allows you to configure the Control Status. When the Status is set to Valid, the new node detection function is enabled (if the associated Host Table exists; if it does not exist, a ‘BadValue’ error message will be returned). When the setting is not Valid, the new node detection function is disabled and the entries in the two mapping tables, if any, are cleared. You can update this field in the Configuration Detail view. Table 5-18 lists the valid settings for this field.
ControlModeDisplays the control mode. You can update this field in the Configuration Detail view. Table 5-19 lists the valid settings for this field.
This button allows you to add or modify a capture buffer. Type in the index to add or modify, then save and commit the index by using the save option. Click on the Config Detail button to access the Packet Capture Configuration Detail view.
Table 5-18. Valid Status Entries
Entry Definition
Valid Start collecting statistics.
Create Create a new event entry. If the request is successful, the status changes to UnderCreation.
Modify Updates the configuration with any changes made in the Configuration Detail View. Stops the collection of statistics until the status is changed to Valid again.
Delete Remove the associated entry.
Add Table
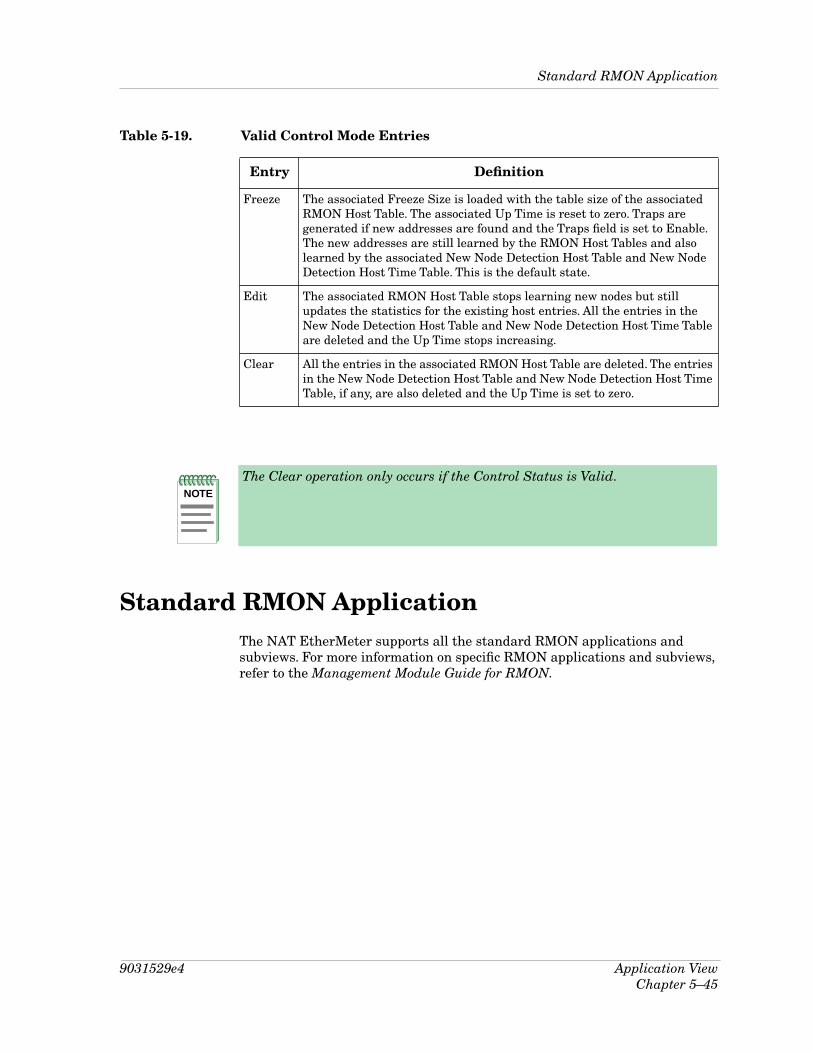
9031529e4 Application ViewChapter 5–45
Standard RMON Application
Standard RMON ApplicationThe NAT EtherMeter supports all the standard RMON applications and subviews. For more information on specific RMON applications and subviews, refer to the Management Module Guide for RMON.
Table 5-19. Valid Control Mode Entries
Entry Definition
Freeze The associated Freeze Size is loaded with the table size of the associated RMON Host Table. The associated Up Time is reset to zero. Traps are generated if new addresses are found and the Traps field is set to Enable. The new addresses are still learned by the RMON Host Tables and also learned by the associated New Node Detection Host Table and New Node Detection Host Time Table. This is the default state.
Edit The associated RMON Host Table stops learning new nodes but still updates the statistics for the existing host entries. All the entries in the New Node Detection Host Table and New Node Detection Host Time Table are deleted and the Up Time stops increasing.
Clear All the entries in the associated RMON Host Table are deleted. The entries in the New Node Detection Host Table and New Node Detection Host Time Table, if any, are also deleted and the Up Time is set to zero.
NOTE
The Clear operation only occurs if the Control Status is Valid.

Standard RMON Application
Application View NAT Ether-Meter DevicesChapter 5–46 Management Module Guide

9031529e41
IndexSymbols% Collisions 5-7% Error 5-7% Load 5-7
AAbsolute 5-34Accept
Failed 5-38Matched 5-38Type 5-38
Access Level 3-7Accessing the
Application View 5-2Device
View 2-1Hosts Table 3-3, 3-6
Access-Violation 3-6Action 5-36Add
Alarm 5-35Channel 5-40Entry 3-8Event 5-37Filter 5-38Table 5-25, 5-27, 5-28, 5-30, 5-32, 5-41, 5-
42, 5-44Additional Buttons 2-11Addresses 5-11Admin. Status 2-5Administrative Status 2-5Alarm
Messages 4-1Table 5-33
Alert Configuration View 5-13Algns 5-16Alignment 5-9Application
View 5-1Relations 5-5
ARP-Server-Sent 3-5
Audience xiAux Traps 3-7
BBandwidth 2-6Bcast Packets 5-15Beige 2-8Blue 2-5, 2-8Broadcast 5-14, 5-24
Alerts 5-15Configuration View 5-15
Buffer Overflow 5-9BufferSize 5-40
CCaptureSize 5-40Change Time Scale 2-11Changes 5-42Chann 5-38Channel 5-37, 5-40
Table 5-38Clear 5-45Collision 5-9, 5-24Colls 5-16Color 2-5Community 5-37
NameAlias Configuration View 3-3, 5-19Aliases 3-3
Config Detail 5-31Configuration 5-5ControlMode 5-44Conventions xiiCRC 5-9, 5-17
Align 5-24Create 5-23, 5-26, 5-28, 5-32, 5-33, 5-36, 5-
42, 5-44Req 5-29
Index NAT Ether-Meter Devices2 Management Module Guide
DData Source 5-23, 5-27, 5-28, 5-30, 5-32DataCtrl 5-39Default
Router 3-8Delete 3-7, 5-23, 5-26, 5-28, 5-29, 5-32, 5-34,
5-36, 5-42, 5-44Delivered 2-11Delta 5-34Description 5-37Detail 5-25Device
Configuration View 3-1Icon Panel 2-3IP Address 3-8Network Params 3-3Subnet Mask 3-8Topology View
Label 2-4View 2-1
DialPrefix 3-4Suffix 3-4
Disable 5-6Discard 2-11
Breakdown Pie Chart 2-12In Rate 2-9Out Rate 2-9Rate 2-9
Disk-Full 3-6Download 3-5
Control 3-3Server Address 3-5
Drop Events 5-24Dropped Packets 5-9Duplicates 5-42Duration 5-30
EEdit 5-45Entries 5-28, 5-41Error
Alert 5-16Configuration View 5-16
Breakdown Pie Chart 2-12Counts 5-14In Rate 2-9Out Rate 2-9
Rate 2-9Statistics Display View 5-7Summary 5-7, 5-13
Errors 2-11, 5-15, 5-16, 5-17, 5-18At Peak Utilisation 5-8In Peak
Bcast Interval 5-9Kbyte Interval 5-9
EtherMeterAlert Configuration View 5-13Download Control View 3-4, 5-19Error Statistics Display View 5-7Extended RMON Configuration View 5-
20IP Mapping 5-22
Tables Control View 5-41New Node Discovery Control View 5-42NND 5-22Protocols (E-Type) Table 5-11RMON
History Tables 5-26Host Tables Control View 5-27Statistics Tables 5-23
Summary Statistics Display View 5-12Top Ten Views 5-10
EthernetBroadcaster 5-6Listener 5-6Pair 5-6Talker 5-6
EtherTypes in Table 5-11EthType 5-11Event 5-35
AlwaysReady 5-39Fired 5-39Messages 4-1Ready 5-39Table 5-35
EvntStatus 5-39EvtIndx 5-39Extended RMON Application 5-20

9031529e4 Index3
FFalling Thresh 5-35File
Exists 3-6Name 3-5Not-Found 3-6Verify-Error 3-5
Filter 5-37Table 5-37
Find 2-6, 2-7Finished 3-5Firmware 3-3Flash
Verify-Error 3-5Write-Error 3-5
Fragments 5-24Frame
Counts 5-14Packets 5-15Rate 5-7
Alert 5-15Configuration View 5-14
Freeze 5-45Size 5-43
FullAction 5-40Status 5-40
GGauge
Control Panel 2-8Buttons 2-9
Mode 2-8Type 2-9
Good FrameAt Peak Utilisation 5-9Count in Peak
Bcast Interval 5-9Error Interval 5-8Kbyte Interval 5-9
Gray 5-7Green 2-5, 2-8
HHangup
Prefix 3-4Suffix 3-4
Hayes Command String 3-4HexData 5-38Host
Index 5-41Table 5-43
Maximum Size 5-20
IICMP_App 1-2, 5-1IF
Address Translation TableLabel 2-6
ConfigurationView Label 2-5
StatusView Label 2-5
Illegal-Operation 3-6In
Discards 2-8, 2-12Errors 2-8, 2-12Octets 2-8Packets 2-8
Index 5-26, 5-28, 5-29, 5-31, 5-33, 5-36, 5-40, 5-41, 5-43
InterfaceDescription 2-7Number 2-4Options Panel 2-7Performance View 2-10Status Label Definitions 2-5Type 2-5
Interval 5-27Introduction 1-1Invalid-File 3-5IP
Address 3-6Listener 5-6Pair 5-6Talker 5-6
IP Application 1-2, 5-1IP2_App 1-2, 5-1

Index NAT Ether-Meter Devices4 Management Module Guide
JJabbers 5-24
LLast
Change 2-5Deleted 5-32Reset 5-13Sent 5-37Up 5-28Val 5-34
Load 2-9In 2-9Out 2-9
Local Terminal Password 3-8Log 5-36Logical
Gauge 2-7Interface Icons 2-4
MManagement Views 3-1Matched Broadcast/IP 5-10Matches 5-39Matrix Table Maximum Size 5-21Mcast Packets 5-18MIB-II 1-2, 5-1Modem
Configuration 3-3View 3-4, 5-19
InitializationCommand String 3-4
Modify 5-23, 5-26, 5-28, 5-29, 5-32, 5-34, 5-36, 5-42, 5-44
Multi-Attribute Line Graph 2-10Buttons 2-10
Multicast 5-14, 5-24Alerts 5-18
Configuration View 5-18
NNAT
450 Diagnostic 3-3Alerts 5-5
Application Views 5-13
CfgApp 5-5Configuration 5-5
Application Views 5-18EtherMeter
Accessing Hosts Configuration View 3-6, 5-19
Device 1-1Configuration View 5-19View 2-2
Management Module 1-2Model Types 1-2Models 1-2
Meter 5-5Application 5-5
Views 5-5MtrApp 5-5
NetworkInformation 2-7
PanelLabel 2-6
Parameters Configuration View 3-8, 5-20
NewSize 5-43
No ofHost Tables
Granted 5-20Requested 5-20
Matrix TablesGranted 5-21Requested 5-21
Pkts 5-11Non Volatile RAM Status 3-2None 5-36No-Such-User 3-6Not
Defined 3-6Known 3-7
Notice i
OOctets 5-24OFF 2-5
evnt 5-39Offset 5-38ON 2-5
evnt 5-39Operational Status 2-5Orange 2-8, 5-7

9031529e4 Index5
O (continued)Organization xiOther
Types 5-11Out
Discards 2-8, 2-12Errors 2-8, 2-12Octets 2-8Packets 2-8
Overflow Condition 5-10Oversize 5-9, 5-17, 5-24Owner 5-23, 5-27, 5-28, 5-30, 5-32, 5-34, 5-
36, 5-38, 5-40
PPacket 5-11, 5-24
Breakdown Pie Chart 2-11Count 5-11In Rate 2-9Out Rate 2-9Rate 2-9Size 2-6
Peak 5-5Alignment Error Count 5-8Bcast Time 5-12Broadcast Frame Count 5-9CRC Error Count 5-8Err Count 5-8, 5-9Error Time 5-8Frame Time 5-12Kbytes
Count 5-9Time 5-12
Last Reset 5-13Mcast Time 5-12Oversize Error Count 5-8Sampling Interval 5-6, 5-8, 5-12Short Frame Error Count 5-8Txmit Collision Count 5-8Util Time 5-12Utilisation Value 5-8
PerformanceSummary 5-7View
Label 2-7Phone number 3-7Physical Address 2-5, 2-6Pk
Bcast Count 5-12Frame Count 5-12Kbyte Count 5-12Mcast Count 5-12Util PerCen 5-12
PortAdmin State 2-6, 2-9, 2-10, 2-11, 2-12, 2-
13Preface xiPrimary
Traps 3-7Protocol
(E-Type) Table 5-11Table 5-7
PublicRead 3-2
QQueue Length 2-6
RRate 5-34Read
Enterprise 3-7Public 3-7Standard 3-7Write 3-7
Receive 2-13Red 2-5, 5-7Related Reading xiiiReports 5-30Req Size 5-30Reset Status 3-2Restricted Rights Notice iiRising Thresh 5-34

Index NAT Ether-Meter Devices6 Management Module Guide
R (continued)RMON
Events/Alarms 5-22Tables Configuration View 5-33
Filters/Channels 5-22History 5-21Host 5-21
TopN Tables 5-29Learn Bad Packets 5-21Matrix 5-21
Addresses 5-21Tables View 5-31
PacketCapture
Buffer Control View 5-40Packet Capture 5-22Statistics 5-21
Configuration Detail View 5-25Detail View 5-25Performance View 5-25
TopN 5-22Rrq-Sent 3-5
SSample
Time 5-10Type 5-34
Sampling Interval 5-6, 5-13, 5-15, 5-16, 5-17, 5-18
Selected Attribute 2-8Serial
PortIP Address 3-8Subnet Mask 3-8
Short 5-16Short Frame 5-9Size 5-27, 5-30, 5-32
Req 5-27SNMP
Trap 5-36Activation 3-3
SNMP2_Agent 1-2, 5-1Specific Configuration View 5-5Started 5-30Statistic
Collection 3-2Stats 5-5Status 3-5, 5-23, 5-26, 5-28, 5-29, 5-32, 5-33,
5-36, 5-38, 5-40, 5-42, 5-44Summary Statistics Display 5-12System2_App 1-2, 5-1
TTelephone Number and Traps Table 3-7Test 2-5Testing 2-5Text Display 2-5Threshold 5-15, 5-16, 5-17, 5-18
TrapValue 5-6
Time 5-15, 5-16, 5-17, 5-18Left 5-30Out 3-5
Address 3-5Download 3-6Request 3-5
Top TenOption 5-6Tables 5-7Views 5-10
TopN Host Table View 5-31Total
Entries 5-10Errors 5-16Packets 5-10, 5-15, 5-16, 5-17, 5-18
Trademarks iTransmit 2-13Transmitted 2-11Trap 3-7, 5-41, 5-44
And-Log 5-36TurnOnTime 5-41TxtData 5-38Type Description 5-11
UUDP
Application 1-2, 5-1UDP2_App 1-2, 5-1Undersized 5-24Unknown 2-12
Protocols 2-8Transfer-ID 3-6
Up Time 5-41, 5-44Update 2-6

9031529e4 Index7
U (continued)Utilisation 5-14, 5-17
Alert 5-17Configuration View 5-17
VValid 5-23, 5-26, 5-28, 5-29, 5-32, 5-33, 5-36,
5-42, 5-44Entries 5-10
Variable 5-34View Event Log 5-37Virus Disclaimer i
YYellow 2-5, 2-8, 5-7