nass and u.s. crop production forecasts: methods and issues · crop production forecasts ..... 10...
TRANSCRIPT
NASS and U.S. Crop Production Forecasts:
Methods and Issues
Randy Schnepf
Specialist in Agricultural Policy
April 13, 2017
Congressional Research Service
7-5700
www.crs.gov
R44814
NASS and U.S. Crop Production Forecasts: Methods and Issues
Congressional Research Service
Summary The National Agricultural Statistics Service (NASS) of the U.S. Department of Agriculture
(USDA) estimates agricultural production (including area and yield) and stocks for more than 120
crops and 45 livestock items. Traditionally NASS estimates have focused on state and national
data, but in recent years county-level estimates have gained in importance. NASS crop production
estimates are crucial to people in the U.S. agricultural sector involved in making marketing and
investment decisions, policymakers who design farm support programs, USDA agents who
implement those programs, and producers who benefit from those programs.
NASS conducts hundreds of surveys every year and prepares reports covering many aspects of
U.S. agriculture. For example, NASS survey data are used to produce forecasts of area, yield,
production, value, and stocks for major crop and livestock products, as well as for estimates of
the historical number of farms and land in farms, land rental rates and values, farm labor usage,
fertilizer and chemical usage, computer usage and ownership on farms, and farm production
expenditures. NASS also undertakes a National Census of Agriculture every five years that
provides comprehensive information about the nation’s agriculture down to the county level. The
census includes data on the number of farms, land use, production expenses, value of land and
buildings, farm size and characteristics of farm operators, market value of agricultural production
sold, acreage of major crops, inventory of livestock and poultry, and farm irrigation practices.
NASS spending is controlled by annual appropriations acts. In FY2016, Congress appropriated
$177 million for NASS operations, including $126.2 million (75% of its budget) for annual
agricultural estimates and $42.2 million (25%) for the Census of Agriculture.
The critical role that NASS data plays in promoting a smooth and efficient marketing process for
U.S. agriculture makes NASS’s successful function a concern of Congress. In particular, three
issues related to NASS’s survey methodology and crop estimates are of potential concern to
Congress. First, a trend has emerged since the early 1990s of declining NASS survey response by
farmer participants. For most crops, NASS production estimates are based on data collected from
farm operations via grower survey responses. The quality of NASS crop acreage and production
estimates depends on a high level of participation by agricultural producers. As the number of
respondents falls, the statistical reliability of estimates and forecasts declines and the value of
NASS estimates for a host of other purposes declines as well.
The second issue derives primarily from the first in that the declining survey response impacts
more localized or regional estimates first, particularly county-level estimates and those programs
that are based on county-level data. In particular, insufficient response rates in some counties
have led to unexpectedly wide discrepancies across counties in farm program payment rates
under the county-based revenue support program—Agricultural Risk Coverage (ARC-CO)—
established under the 2014 farm bill (P.L. 113-79). These discrepancies have generated concern
about whether the new revenue program is working as intended or whether this is simply a data
problem that needs to be addressed. Barring any near-term fix by USDA, lawmakers may elect to
address county-to-county payment disparities in the context of the next farm bill.
Third, market participants and policymakers alike are concerned that NASS estimates be
unbiased and objective so as not to influence market prices or volatility. Analysis of NASS data
suggests that it is both objective and trustworthy; however, variability of data as measured by
market price reactions to NASS estimates appears to have increased in recent years.

NASS and U.S. Crop Production Forecasts: Methods and Issues
Congressional Research Service
Contents
Introduction ..................................................................................................................................... 1
Report Overview ....................................................................................................................... 1
Congressional Interest ..................................................................................................................... 1
NASS Overview .............................................................................................................................. 2
National Operations Center (NOC) .................................................................................... 3 Information Quality ............................................................................................................ 3
NASS Operating Authority ....................................................................................................... 4 Census of Agriculture (COA) ............................................................................................. 5 Agricultural Estimates Program .......................................................................................... 5 Work Performed for Others ................................................................................................. 5 Data Confidentiality ............................................................................................................ 6
Funding ..................................................................................................................................... 6 Cooperative Statistical Programs ........................................................................................ 7
NASS Survey Methodology ............................................................................................................ 7
Sampling Methods .................................................................................................................... 7 Crop Production Report Schedule ............................................................................................. 9 Crop Production Forecasts ...................................................................................................... 10
Acreage Surveys ............................................................................................................... 12 Yield and Production Surveys ........................................................................................... 12 Revisions to Final Estimates ............................................................................................. 13
Quarterly Stock Surveys ......................................................................................................... 14
Issues for Congress ........................................................................................................................ 14
Declining Survey Response .................................................................................................... 14 Nonresponse Bias Issues ................................................................................................... 15 Adjusting for Nonresponse ............................................................................................... 16
County-Level Crop Production Estimates ............................................................................... 16 County Agricultural Production Surveys (CAPS) ............................................................ 17 Increasing Nonresponse Degrades County Yield Calculations ......................................... 17
Objective, Unbiased USDA Crop Forecasts ........................................................................... 19 Objectivity Confirmed, but Subject to Increasing Variability ........................................... 20
Figures
Figure 1. NASS Annual Appropriations .......................................................................................... 6
Figure 2. NASS Objective Yield Survey Sample States by Crop .................................................. 10
Figure 3. Annual Calendar of NASS Area and Yield Surveys........................................................ 11
Figure 4. Response Rates for NASS Acreage and Production Surveys Have Been
Declining Since the Early 1990s ................................................................................................ 15
Figure D-1. Gross Yield Components: Number of Fruit and Weight per Fruit ............................. 28
Figure E-1. Market Price Reaction to NASS Production Forecasts: Corn .................................... 30
Figure E-2. Market Price Reaction to NASS Production Forecasts: Corn .................................... 31
Figure E-3. Market Price Reaction to NASS Production Forecasts: Soybeans ............................. 32

NASS and U.S. Crop Production Forecasts: Methods and Issues
Congressional Research Service
Figure E-4. Market Price Reaction to NASS Production Forecasts: Soybeans ............................. 33
Figure E-5. Market Price Reaction to NASS Production Forecasts: Upland Cotton .................... 34
Figure E-6. Market Price Reaction to NASS Production Forecasts: Upland Cotton .................... 35
Figure E-7. Market Price Reaction to NASS Production Forecasts: All Wheat ............................ 36
Tables
Table 1. NASS Seasonal Pattern of Crop Forecasts and Estimates ................................................. 8
Table 2. NASS Acreage, Yield, and Production Report Schedule for 2017 .................................... 9
Table 3. NASS Survey Data Sources for Forecasts and Estimates: Key Variables ........................ 11
Table 4. Examples of ARC-CO Payment Rates Under Varied Yield Scenarios for Corn,
Soybeans, and Wheat ................................................................................................................. 19
Table 5. Price Reactions to USDA Crop Reports by Crop and Report .......................................... 21
Table B-1. Summary of NASS Survey Collection Period and Sample Size ................................. 24
Appendixes
Appendix A. Historical Origins of NASS ..................................................................................... 22
Appendix B. Details on NASS Sampling Method ........................................................................ 23
Appendix C. Planted and Harvested Area Surveys ....................................................................... 25
Appendix D. Crop Yield Methodology ......................................................................................... 27
Appendix E. Monthly Price Reaction Charts for Corn, Soybeans, Upland Cotton, and
Wheat ......................................................................................................................................... 30
Contacts
Author Contact Information .......................................................................................................... 37

NASS and U.S. Crop Production Forecasts: Methods and Issues
Congressional Research Service 1
Introduction The United States is one of the world’s largest producers and exporters of major field crops
including wheat, rice, coarse grains (corn, barley, sorghum, and oats), oilseeds (soybeans,
peanuts, canola, sunflowers, and other minor oilseeds), and cotton. Unexpected changes in the
outlook for production of a major U.S. crop can lead to sharp movements in both domestic and
global market prices. If sustained, large price volatility can lead to significant resource
adjustments in the agricultural sector and possibly to large changes in outlays under U.S. farm
support programs.1
The potential for market disruptions and financial loss led to the creation of a statistical bureau
within the U.S. Department of Agriculture (USDA) in 1863, just a year after USDA was
established. This statistical bureau eventually became the National Agricultural Statistics Service
(NASS). NASS and its USDA precursors were created to provide independent, objective, reliable,
timely, and accurate market information for the agriculture industry.2
Report Overview
This report provides an overview of NASS. First, it reviews the origins, legislative authority, and
funding for NASS. Then, the report describes the survey methodology used by NASS to generate
crop production forecasts and estimates for U.S. crops at both the state and national level. Third,
this report describes the systematic evolution that occurs over the course of a growing season for
both the survey methodology and the annual sequence of NASS reports that are used to convey
the crop production forecasts to the U.S. agricultural sector. Fourth, this report describes how
NASS survey methodology is extended to collect county-level crop area and yield estimates. This
fourth section also includes a discussion of emergent issues related to low producer response rates
to NASS surveys and the subsequent discrepancies in neighboring county yield estimates and
farm program payments. Finally, the report discusses how evidence on market price reaction to
USDA crop production forecasts indicates that there is no visible pattern of bias or error.
Congressional Interest NASS conducts a series of surveys throughout the year to assess farmer planting decisions and
production outcomes. The resulting NASS crop production and stock estimates underlie USDA
and private analysis that affects markets throughout the year. They provide a benchmark in the
marketplace because of their comprehensive nature, objectivity, and timeliness. For example,
NASS estimates provide the foundation for USDA’s global commodity supply and demand
balance sheets published in the monthly World Agricultural Supply and Demand Estimates
(WASDE) report.3
1 Darrel Good and Scott Irwin, “USDA Corn and Soybean Acreage Estimates and Yield Forecasts: Dispelling Myths
and Misunderstandings,” Marketing & Outlook Briefs, University of Illinois, March 23, 2011. 2 NASS’s origins are discussed in section Appendix A of this report. NASS’s legislative authorities are reviewed in the
section “NASS Operating Authority.” 3 USDA, Office of the Chief Economist (OCE), World Agricultural Supply and Demand Estimates (WASDE), monthly
report released at http://www.usda.gov/oce/commodity/wasde/index.htm. An annual calendar is prepared in December
of every year showing the date and hour of the coming year’s WASDE report releases at the OCE website.

NASS and U.S. Crop Production Forecasts: Methods and Issues
Congressional Research Service 2
The public benefits of NASS data are notable, and the literature on those benefits was recently
reviewed by the Council on Food, Agricultural and Resource Economics, which highlighted how
public information on market prices and quantities helps improve market efficiency.4 NASS data
are considered crucial to both policymakers in government and those making marketing and
investment decisions, as well as to the design and implementation of U.S. farm support
programs.5 The reliability and accuracy of USDA’s crop supply and demand estimates play a
prominent role in the smooth function of agricultural commodity supply chains, including
forward contracting, stock management, and commodity futures exchanges. This reliability helps
to ensure a more informed and stable marketplace.
The quality of NASS crop acreage and production estimates depends on a high level of
participation by agricultural producers. In recent years declining grower response rates to NASS
surveys have diminished the statistical reliability of NASS estimates. In particular, low response
rates to NASS surveys in some counties have led to unexpected and inconsistent farm program
payment rates under the new county-based revenue support program—Agricultural Risk
Coverage (ARC-CO)—established under the 2014 farm bill (P.L. 113-79). This issue is discussed
in more detail in the section “Increasing Nonresponse Degrades County Yield Calculations” of
this report. These discrepancies have generated considerable concern about whether the new
revenue program is working as intended or whether this is simply a data problem that needs to be
addressed. Barring any near-term fix by USDA, lawmakers could elect to address county-to-
county payment disparities in the context of the next farm bill.
NASS Overview NASS’s mission statement states that the agency “provides timely, accurate, and useful statistics
in service to agriculture.”6 In fulfillment of this mission, NASS collects and publishes current
national, state, and county agricultural statistics. NASS is also responsible for administration of
the Census of Agriculture, which occurs every five years and provides comprehensive data on the
U.S. agricultural economy.7
NASS is one of four agencies—along with the Agricultural Research Service, the National
Institute of Food and Agriculture, and the Economic Research Service—in USDA’s agricultural
research, education, and extension mission area.8 NASS is headquartered in Washington, DC,
9 but
maintains a network of 12 regional offices, including a National Operations Center in St. Louis,
4 J. Lusk, “From Farm Income to Food Consumption: Valuing USDA Data Products,” Council on Food, Agricultural
and Resource Economics, October 2013, http://www.cfare.org/events/c-fare-events/2013/seminar-to-elucidate-the-
value-of-usda-data. 5 For an overview and listing of USDA farm programs, see CRS Report R43076, The 2014 Farm Bill (P.L. 113-79):
Summary and Side-by-Side. 6 NASS, “Mission Statement,” as of February 21, 2017, https://www.nass.usda.gov/About_NASS/Mission_Statement/
index.php. 7 For a description of NASS see NASS, National Agricultural Statistics Service: Strategic Plan, FYs 2010-2015,
January 2011, at https://www.nass.usda.gov/About_NASS/Strategic_Plan/pdf/spnass2015.pdf. 8 USDA, “Mission Areas,” https://www.usda.gov/our-agency/about-usda/mission-areas. 9 As of September 30, 2015, NASS had 982 full-time employees. USDA, FY2017 Budget, Explanatory Notes for
Committee on Appropriations, vol. 1, p. 17-2. About a third of the agency’s employees are located in Washington,
D.C., with the rest located in offices around the country.
NASS and U.S. Crop Production Forecasts: Methods and Issues
Congressional Research Service 3
MO, and 50 state field offices through cooperative agreements with state departments of
agriculture or universities.10
NASS survey data are used to produce forecasts of area, yield, production, value, and stocks for
major crop and livestock products, as well as for estimates of the historical number of farms and
land in farms, land rental rates and values, farm labor usage, fertilizer and chemical usage,
computer usage and ownership on farms, and farm production expenditures.11
In addition to the
several hundred nationally focused statistical reports from its headquarters each year, NASS state
statistical offices issue some 9,000 reports and news releases annually that highlight or expand on
information from the national reports.12
In addition, NASS conducts and releases the Census of
Agriculture every five years.
In support of this work, NASS maintains a fairly comprehensive working list of farms and
ranches in the United States, one of its unique federal roles. NASS also performs important
reimbursable agricultural survey work for other federal agencies, state governments, and producer
organizations and provides technical assistance for agricultural statistics programs in developing
countries.
National Operations Center (NOC)
Among its activities, NASS’s NOC houses the National Operations Division (NOD). NOD is
responsible for several critical survey support activities, including maintenance of the list
sampling frame, interviewer training for both field and telephone enumerators, centralized data
collection via telephone interviewing (NOD has 154 calling seats and conducted over 1.1 million
telephone calls in 2015), and processing of the paper-based survey questionnaires that are
completed and returned by mail from farmers and ranchers.13
In 2015, the Forms Processing
Group at NOD handled over 436,000 forms. It also processes a significant portion of the
Objective Yield Samples collected by field personnel from winter wheat, corn, soybean, and
cotton field plots.
Information Quality
NASS operations are guided by an Advisory Committee on Agriculture Statistics.14
The purpose
of the committee is to advise the Secretary of Agriculture on the scope, timing, content, etc., of
the periodic censuses and surveys of agriculture, other related surveys, and the types of
information to obtain from respondents concerning agriculture. The committee also prepares
recommendations regarding the content of agriculture reports and presents the views and needs
for data of major suppliers and users of agriculture statistics.
10 Puerto Rico is served by the Southeast Regional office in Atlanta, GA. For more information, see NASS, “Directory
of NASS Regional and State Field Offices,” https://www.nass.usda.gov/Statistics_by_State/RFO/index.php. 11 For a list of NASS reports see https://www.nass.usda.gov/Publications/Reports_by_Release_Day/index.php. 12 NASS, USDA’s National Agricultural Statistics Service, https://www.nass.usda.gov/About_NASS/pdf/
evolving_nass.pdf. 13 USDA, FY2017 Budget, Explanatory Notes for Committee on Appropriations, vol. 1, p. 17-25. 14 More information on the committee, its membership, and executive summaries of its meetings is available at
https://www.nass.usda.gov/About_NASS/Advisory_Committee_on_Agriculture_Statistics/index.php.

NASS and U.S. Crop Production Forecasts: Methods and Issues
Congressional Research Service 4
In addition to guidance from the committee, NASS is subject to USDA’s Information Quality
Guidelines that apply to any information disseminated by NASS.15
The guidelines emphasize the
confidentiality of respondents and objectivity of analysis.
Annual Data Users’ Meeting
Annually, NASS—in coordination with the World Agricultural Outlook Board (WAOB), ERS,
Agricultural Marketing Service (AMS), Foreign Agricultural Service (FAS), and the U.S. Census
Bureau—hosts a meeting of key data users. The annual Data Users Meeting provides an open
forum for data users—both government and nongovernment—to ask questions and provide
feedback about the entire USDA statistics program, including data products from NASS.16
At the 2016 meeting held in Chicago on October 18, the Farm Service Agency (FSA) participated
for the first time and addressed questions about NASS county-level data availability, particularly
in relation to the issues that emerged with regard to payments under the ARC county-level
program. This issue is discussed in more detail in the section “County-Level Crop Production
Estimates” of this report.
NASS Operating Authority
NASS’s responsibilities are authorized under the Agricultural Marketing Act of 1946 (7 U.S.C.
1621-1627) and the Census of Agriculture Act of 1997 (P.L. 105-113; 7 U.S.C. 2204g).17
Under
this broad authority and the discretion of the Secretary, NASS exists and performs its data
collection and dissemination functions in support of the U.S. agricultural sector.18
In particular,
because of its transparent and objective methodology, NASS data contribute to the orderly
association among the consumption, supply, marketing, and input sectors of agriculture.
Over the years, various other laws have designated specific authority to the Secretary for data
collection and publication regarding particular commodities and reports.19
These include laws
concerning the collection of agricultural production and price data for apples (7 U.S.C. 411b),
cotton (7 U.S.C. 476), peanuts (7 U.S.C. 951), commodity reports (7 U.S.C. 1421d), distribution
and marketing of agricultural products (7 U.S.C. 1626), mandatory reporting for dairy products (7
U.S.C. 1637b), and data on the environment and water quality (7 U.S.C. 136i-2). Additional laws
cover confidentiality of information and data security,20
research and international programs (7
U.S.C. 3291), cooperative agreements (7 U.S.C. 3318 and 7 U.S.C. 2242a), public printing and
documents (44 U.S.C. 1302), and penalties for disclosure and false reports (19 U.S.C. 1905).
15 More information on USDA’s Information Quality Guidelines is available at https://www.nass.usda.gov/
About_NASS/Information_Quality_Guidelines/index.php. 16 More information on the annual data users’ meeting is available at https://www.nass.usda.gov/
Education_and_Outreach/Meeting/. 17 USDA, FY2017 Budget, Explanatory Notes for Committee on Appropriations, vol. 1, p. 17-1. 18 The functions of USDA and NASS—including the establishment of USDA, the Secretary of Agriculture, and the
Secretaries’ general duties—are authorized in the U.S. Code at 7 U.S.C. 2201-2204. 19 NASS, “Regulations Guiding NASS,” https://www.nass.usda.gov/About_NASS/Regulations_Guiding_NASS/
index.php. 20 7 U.S.C. 2276, USDA regulation DR1042-042, May 29, 2009, https://www.ocio.usda.gov/sites/default/files/docs/
2012/DR1042-042_0.pdf; and Office of Management and Budget, “Order Providing for the Confidentiality of
Statistical Information,” Federal Register, vol. 62, no. 124, June 27, 1997.

NASS and U.S. Crop Production Forecasts: Methods and Issues
Congressional Research Service 5
Census of Agriculture (COA)
The COA originated as part of the 1820 national decennial census, when U.S. marshals began to
ask how many people within each household were engaged in agricultural pursuits.21
The Census
of Agriculture Act of 1997 (P.L. 105-113; 7 U.S.C. 2204g) transferred responsibility for the COA
and other special studies from the Department of Commerce to NASS. Despite the shift in
funding, the Census Bureau continues to design the questionnaires, mail questionnaires, manage
returns, and process the data for USDA.
The COA is conducted every five years and provides comprehensive information about the
nation’s agriculture down to the county level, including data on the number of farms, land use,
production expenses, value of land and buildings, farm size and characteristics of farm operators,
market value of agricultural production sold, acreage of major crops, inventory of livestock and
poultry, and farm irrigation practices. The COA ensures that the “list frame” used for sampling
records for various surveys is current.22
Agricultural Estimates Program
Annually, NASS publishes about 400 national agricultural statistical reports and thousands of
additional state agricultural statistical reports covering more than 120 crops and 45 livestock
items. NASS statistical data include forecasts of state and national agricultural production for an
extensive number of agricultural products, including major field crops, small grains and pulses,
minor oilseeds, fruits and vegetables, tree nut crops, several additional horticultural products
(such as hops, flowers, and mushrooms), and dairy and livestock and poultry products. NASS
also produces forecasts and estimates of county production for major program crops.23
(See the
box “Forecasts versus Estimates” on page 8 for a distinction between estimates and forecasts.)
Work Performed for Others
NASS lends technical expertise and conducts surveys for other federal agencies, state
governments, and private organizations on a reimbursable basis.24
Through the reimbursable
program, NASS provides support and assistance with questionnaire and sample design, data
collection and editing, analysis of survey results, and training. NASS also provides technical
consultation, support, and assistance for international programs under participating agency
service agreements and to foreign countries desiring to enhance their statistical programs.
With respect to this type of “shared” work, USDA states the following:
Providing such assistance benefits the United States as well by helping other countries
improve their agricultural statistics systems, USDA improves its ability to assess world
food and fiber production. In today’s global economy, timely and accurate supply
statistics for fair and efficient price discovery in the global market are critical.
21 U.S. Census Bureau, “History: Census of Agriculture,” https://www.census.gov/history/www/programs/agriculture/
census_of_agriculture.html. 22 The list frame is described in the section “Sampling from the List Frame” of this report 23 County data is discussed in the section “County-Level Crop Production Estimates” of this report. Program crops
include wheat, corn, sorghum, barley, oats, rice, peanuts, soybeans, sunflower seed, rapeseed, canola, safflower,
flaxseed, mustard seed, crambe, sesame seed, dry peas, lentils, and chickpeas. For information on the associated farm
programs, see CRS Report R43758, Farm Safety Net Programs: Background and Issues. 24 USDA, FY2017 Budget, Explanatory Notes for Committee on Appropriations, vol. 1, p. 17-1. For examples of
external project agreements, see pp. 17-31 to 17-33.

NASS and U.S. Crop Production Forecasts: Methods and Issues
Congressional Research Service 6
Establishing strong working relationships with other agricultural statisticians around the
world allows NASS staff to gather and develop new ideas for improving the U.S.
agricultural statistics system, while exposure to other cultures and work situations
enhances NASS employees’ abilities to solve problems.25
Data Confidentiality
Personal information collected by NASS is protected from legal subpoena and Freedom of
Information Act requests.26
NASS releases only aggregate totals and averages—never individual
farm-level reports. Furthermore, every person working for or in cooperation with NASS—from
the agency administrator to the person collecting the information—signs a confidentiality form
that states that no confidential information will be compromised. This includes sworn agents who
are authorized by NASS to provide data collection support or statistical research.27
Any offender
is subject to a jail term (five years), a fine ($250,000), or both.28
Funding
NASS spending is controlled by annual appropriations acts.29
In FY2016, Congress appropriated
$177 million for NASS operations, including $126.2 million (75%) for annual agricultural
estimates and $42.2 million (25%) for the COA (Figure 1).
Figure 1. NASS Annual Appropriations
Source: USDA, Budget Summary, President’s Budget, various years.
25 Ibid., pp. 17-30 to 17-31. 26 M. Schleusener, “NASS Surveys Have Direct Impact on Critical Farm Programs,” Farmdoc daily, vol. 6, no. 222,
University of Illinois, November 23, 2016. 27 Brad Schwab, Director, and Mark Schleusener, Deputy Director, NASS Illinois Field Office, USDA, 2011 IFES:
USDA—NASS Revealed: Procedures in Setting Crop, Livestock and Economic Estimates, presentation from 2011
Illinois Farm Economics Summit , December 20, 2011, http://farmdocdaily.illinois.edu/2011/12/2011-ifes-usda-nass-
revealed-p.html. 28 NASS, Confidentiality Pledge, visited on December 7, 2016, https://www.nass.usda.gov/About_NASS/
Confidentiality_Pledge/index.php. 29 For information on current and proposed NASS appropriations, see CRS Report R44588, Agriculture and Related
Agencies: FY2017 Appropriations.

NASS and U.S. Crop Production Forecasts: Methods and Issues
Congressional Research Service 7
Cooperative Statistical Programs
Through its network of state offices, NASS carries out many of its surveys with the support of
state departments of agriculture, land-grant universities, and agricultural industries.30
This
cooperation allows NASS to supplement its own survey activities with the collection of detailed
data on commodities important to local economies, county estimates, and other items not covered
by federal funds. The National Association of State Departments of Agriculture (NASDA)
provides grassroots support for NASS by employing part-time field and office enumerators to
collect survey data by telephone or in person. This partnership allows the NASDA staff to focus
on data collection while NASS staff concentrates on survey integrity and data analysis. All
NASDA employees are sworn to the same confidentiality pledge as NASS employees.
NASS Survey Methodology NASS independently prepares U.S. crop production and inventory estimates in accordance with a
transparent, scientific survey methodology. NASS survey results are released via a series of
periodic reports (Table 2) that are produced on a preannounced schedule to inform commodity
market participants, ensure stable market processes, and contribute to an efficient investment
environment for the U.S. agricultural sector.
NASS survey methodology combines both producer surveys and field observations to gather data
for making acreage estimates and yield forecasts. NASS combines a comprehensive area frame
representing the entire U.S. land mass with a list frame of producers under a multiple-frame
methodology to improve the completeness and accuracy of its forecasts. This statistical
framework surveys large and small farms in an area-weighted probability sample.
Sampling Methods
NASS uses a system of sample surveys to make statistical inferences (forecasts and estimates) for
the total U.S. farm producer population.31
Every sample survey requires the availability of a
sampling frame that defines the population and identifies the members that are available to be
sampled. The basic requirements of an effective sampling frame are that its sample units (when
aggregated) contain the entire population, that individual sample units do not overlap, and that the
probability of selection is known. The NASS sample survey design uses two different sampling
frames—an area frame and a list frame—which are combined into a multiple-frame sample to
produce inferences.
The area frame is essentially the entire land mass of the United States. Thus, it ensures complete
coverage of the U.S. farm population.32
As a result, every piece of land (or segment, as described
below) has a known chance to be selected. Constructing the area frame was a major undertaking
that included a combination of aerial photography and satellite remote sensing imagery verified
by onsite visits. The advantage of an area frame is that, once established, it does not change
rapidly over time, although it can become less efficient as the characteristics of the farming
30 NASS, USDA’s National Agricultural Statistics Service, p. 14, https://www.nass.usda.gov/About_NASS/pdf/
evolving_nass.pdf. 31 USDA, Statistical Reporting Service, Scope and Methods of the Statistical Reporting Service, Miscellaneous
Publication No. 1308, revised September 1983. 32 NASS, Area Frame Design for Agricultural Surveys, Research and Development Division Research Report No.
RDD-09-xx, June 2009.

NASS and U.S. Crop Production Forecasts: Methods and Issues
Congressional Research Service 8
population change. A frame is generally used for 15 to 20 years, and when it becomes outdated, a
new frame is constructed to replace it. Each year, three to four states are selected to receive a new
frame.
The list frame is a fairly comprehensive list of known farm operators, ranchers, and
agribusinesses. It includes the names, addresses, and relevant control data (e.g., crop area,
production, or stocks, or head of livestock) that identify the relative size of the operation—which
is critical in determining the probability of selection into the sample. A basic disadvantage of a
list frame is that it is nearly impossible to maintain a list that covers the entire farm population or
is completely up to date, and attempting to do so is costly. However, a list frame permits the use
of data collection by mail, email, or telephone, and it allows for use of more efficient sampling
methods than are available for the area frame, especially for items grown on a small percentage of
farms or where there is extreme variability in the size of operation.
Multiple-frame sampling is a survey technique that uses list and area frames in combination to
gain the advantages of both. The list frame is extremely efficient for large operations and
operations that produce rare items. The area frame ensures complete coverage and can be used to
estimate the incompleteness of the list frame. Data from the area and list samples are combined
using multiple-frame statistical methodology developed jointly by NASS and Iowa State
University, which ensures that all land areas in the United States can be accounted for only once.
Forecasts versus Estimates
Forecasts and estimates represent two distinct concepts. Forecasts relate to an expected future occurrence, such as
crop yields expected prior to actual harvest of the crop. Estimates generally refer to an accomplished fact, such as
crop yield after the crop is harvested. Such postharvest data are referred to as “estimates” because they are based on
a sample of the crop-producing population. For example, NASS’s crop reporting schedule encompasses forecasts
made during the growing season and estimates made after harvest for major field crops at the county, state, and
national levels.
Table 1. NASS Seasonal Pattern of Crop Forecasts and Estimates
Timing Variable Forecast or Estimate
Early season Area/trees planted
Area/trees expected for harvest
Forecast or estimatea
Forecast
During season Yield Forecast
End of season Area/trees harvested
Yield and production
Estimate
Estimates
End of marketing year Revised area, yield, and production Final estimatesb
Source: Theresa Holland, “Overview of Sample Surveys for Forecasting and Estimating U.S. Crops,” NASS,
Regional Workshop on Sampling for Agricultural Surveys, Montevideo, Uruguay, June 23, 2011.
Notes:
a. Depends on the specific survey. For example, the March Planting Intentions survey provides a forecast of
planted acres, whereas the June Acreage survey provides an estimate of planted acres.
b. Although described as “final,” the end-of-marketing-year estimates may be revised the following year if new
information becomes available, or they may be revised based on NASS’s Census of Agriculture.
NASS and U.S. Crop Production Forecasts: Methods and Issues
Congressional Research Service 9
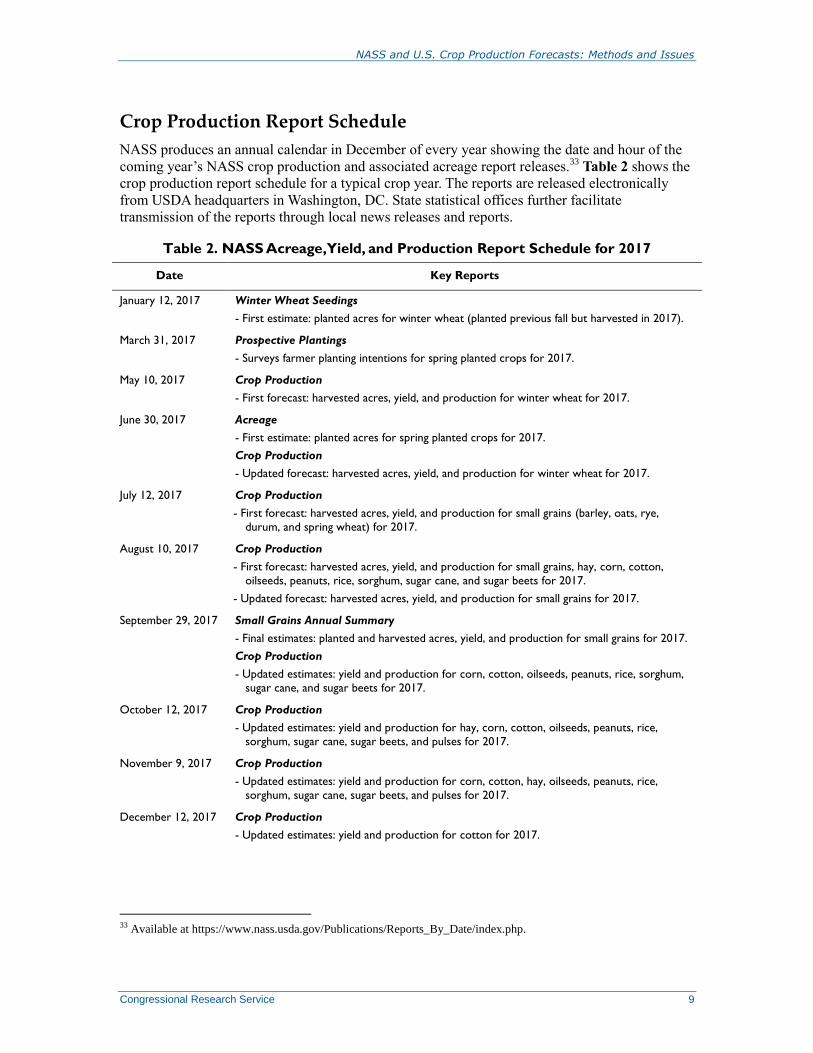
Crop Production Report Schedule
NASS produces an annual calendar in December of every year showing the date and hour of the
coming year’s NASS crop production and associated acreage report releases.33
Table 2 shows the
crop production report schedule for a typical crop year. The reports are released electronically
from USDA headquarters in Washington, DC. State statistical offices further facilitate
transmission of the reports through local news releases and reports.
Table 2. NASS Acreage, Yield, and Production Report Schedule for 2017
Date Key Reports
January 12, 2017 Winter Wheat Seedings
- First estimate: planted acres for winter wheat (planted previous fall but harvested in 2017).
March 31, 2017 Prospective Plantings
- Surveys farmer planting intentions for spring planted crops for 2017.
May 10, 2017 Crop Production
- First forecast: harvested acres, yield, and production for winter wheat for 2017.
June 30, 2017 Acreage
- First estimate: planted acres for spring planted crops for 2017.
Crop Production
- Updated forecast: harvested acres, yield, and production for winter wheat for 2017.
July 12, 2017 Crop Production
- First forecast: harvested acres, yield, and production for small grains (barley, oats, rye,
durum, and spring wheat) for 2017.
August 10, 2017 Crop Production
- First forecast: harvested acres, yield, and production for small grains, hay, corn, cotton,
oilseeds, peanuts, rice, sorghum, sugar cane, and sugar beets for 2017.
- Updated forecast: harvested acres, yield, and production for small grains for 2017.
September 29, 2017 Small Grains Annual Summary
- Final estimates: planted and harvested acres, yield, and production for small grains for 2017.
Crop Production
- Updated estimates: yield and production for corn, cotton, oilseeds, peanuts, rice, sorghum,
sugar cane, and sugar beets for 2017.
October 12, 2017 Crop Production
- Updated estimates: yield and production for hay, corn, cotton, oilseeds, peanuts, rice,
sorghum, sugar cane, sugar beets, and pulses for 2017.
November 9, 2017 Crop Production
- Updated estimates: yield and production for corn, cotton, hay, oilseeds, peanuts, rice,
sorghum, sugar cane, sugar beets, and pulses for 2017.
December 12, 2017 Crop Production
- Updated estimates: yield and production for cotton for 2017.
33 Available at https://www.nass.usda.gov/Publications/Reports_By_Date/index.php.

NASS and U.S. Crop Production Forecasts: Methods and Issues
Congressional Research Service 10
Date Key Reports
January 2018 Crop Production 2017 Summary
- Final estimate: planted and harvested acres, yields, and production for all crops harvested in
2017 (other than small grains whose final estimates are repeated here).
- First estimate: winter wheat plantings (to be harvested in 2018).
Source: Compiled by CRS from various NASS reports, https://www.nass.usda.gov/Publications/index.php.
Notes: Estimates and forecasts of crop production are published in monthly Crop Production reports. Not every
month contains new or updated information relevant to the production processes for major program crops.
Corn and soybean estimates are published in the August through November Crop Production reports and the
January Crop Production Annual Summary. Wheat estimates are published in the May through August Crop
Production reports and the September Small Grains Annual Summary. Cotton estimates are included in the August through December Crop Production reports and the January Crop Production Annual Summary. NASS also provides
production estimates for various non-program crops (e.g., fruit and nut crops, potatoes, hops, and tobacco) in
various monthly issues of the Crop Production report.
Crop Production Forecasts
NASS provides production forecasts and estimates for most crops based primarily on data
collected from farm operations via grower survey responses. Additional yield information is
collected for five major crops—corn, soybeans, cotton, winter wheat, and potatoes—from direct
field observations (referred to as objective yield surveys) conducted by trained enumerators in the
primary producing states for each crop (Figure 2).
Figure 2. NASS Objective Yield Survey Sample States by Crop
Source: NASS, 2016 Objective Yield Workshop, “Objective Yield Survey,” slide 4, http://www.nasda.org/
File.aspx?id=43911.
Crop progress and growing conditions are also reported by NASS during the growing season
based on the opinion of experts residing within the major growing zones supplemented by remote
sensing technology that provides evidence on both cultivated area and plant growth (Table 3).

NASS and U.S. Crop Production Forecasts: Methods and Issues
Congressional Research Service 11
Table 3. NASS Survey Data Sources for Forecasts and Estimates: Key Variables
Variable Survey Data Source
Area/trees expected to be planted or harvested Growers’ expectations
Area/trees planted or harvested Growers’ actual data
Expected yields Growers’ expectations
Yields Objective plant/fruit counts and measurements
Calculated from growers’ data on area and quantities harvested
Crop progress Expert opinion and remote sensing
Growing conditions Expert opinion and remote sensing
Quantities harvested, sold, or stored Growers’ actual data
Source: Theresa Holland, “Overview of Sample Surveys for Forecasting and Estimating U.S. Crops,” NASS,
Regional Workshop on Sampling for Agricultural Surveys, Montevideo, Uruguay, June 23, 2011.
NASS production forecasts for major crops have two components—harvested acres and yield per
acre (Figure 3). Forecasts for these two measures vary with each crop’s seasonal growth pattern.
The three largest summer crops in terms of area and output are corn, soybeans, and cotton, which
are spring-planted and fall-harvested. The wheat crop has both fall-planted (winter wheat) and
spring-planted (spring wheat) components. The wheat harvest begins in late May in southern
states and works its way north to finish in the Dakotas in September.34
Figure 3. Annual Calendar of NASS Area and Yield Surveys
Source: Theresa Holland, “Overview of Sample Surveys for Forecasting and Estimating U.S. Crops,” NASS,
Regional Workshop on Sampling for Agricultural Surveys, Montevideo, Uruguay, June 23, 2011.
34 USDA, Office of the Chief Economist, “Major World Crop Areas: North America,” https://www.usda.gov/oce/
weather/pubs/Other/MWCACP/index.htm.

NASS and U.S. Crop Production Forecasts: Methods and Issues
Congressional Research Service 12
Acreage Surveys
NASS conducts three principal acreage surveys for summer-grown crops during the year—a
spring preliminary forecast in March (Planting Intentions report), an initial estimate of planted
acreage and forecast of harvested acreage in June (Acreage report), and a final survey undertaken
in early December (Figure 3) and published in the January Crop Production Annual Summary.
Because of their importance to the overall NASS survey design, these three acreage surveys for
summer crops are discussed in more detail in Appendix C. In terms of the calendar year, the
three principal acreage surveys are preceded by the Winter Wheat Seedings report, which is
released in early January and forecasts the acreage for the previously fall-seeded small grains—
winter wheat and rye crops—to be harvested in spring (Table 2).
Yield and Production Surveys
NASS also releases forecasts for yield and production in its monthly Crop Production report. For
winter wheat yield and production, forecasts are published in the Crop Production reports for
May through August; for spring wheat and other small grains—barley, oats, rye, durum, and
spring wheat—in July through August; and for summer crops—corn, cotton, hay, oilseeds,
peanuts, rice, sorghum, sugar cane, and sugar beets—in August through November.35
Year-end
estimates of acreage, yield, and production for barley, durum, oats, rye, and wheat are published
in the Small Grains Annual Summary, released at the end of September. For all remaining
summer crops, year-end estimates are published in the January Crop Production Annual
Summary.
Mid-Course Area and Yield Corrections
NASS’s goal is to make the production forecasts as accurate as possible. Generally, estimates of planted acres from
the June Agricultural Survey are not changed during the crop season. However, occasionally the planting season runs
late due to widespread coolness and/or wet weather conditions, and many fields are not yet planted with the
intended crops at the time the survey is conducted. When this happens, farmers are asked during the June survey
what they intend to plant, and these planting intentions are incorporated in the published June Acreage report. Then,
these farms are revisited during late July to determine what was actually planted. If necessary, harvested acreage estimates will be revised and published in the August Crop Production report.36 The preliminary projections for
harvested acres may also be adjusted using data from the August yield surveys.
During the growing season, actual growing conditions for the surveyed crops are known up to the date of each
month’s survey. NASS production forecasts assume “normal weather conditions” for the remainder of the growing
season. In other words, a forecast of prospective yield or production on a given date assumes that weather
conditions and damage from insects, diseases, or other causes will be about normal (or the same as the average of
previous years) during the remainder of the growing season. If weather, disease, insects, or other conditions change
substantially from the “expected” normal, then the final estimate may differ significantly from earlier forecasts. As a
result, NASS may also revise the June estimates of harvested acres if necessary during the forecast season to account
for significant unexpected changes in growing conditions. Similarly, yield forecasts may be adjusted to reflect
significant unexpected changes that occur during the growing and harvest season.
If acres are lost during the forecast season because of weather or disease problems, those yields drop to zero, the
acres are classified as planted but abandoned, and acres for harvest are reduced. For this reason, it is possible for the
production forecast to be reduced without a corresponding drop in forecast yield per acre. It is also possible for the
yield per acre to increase during adverse periods if acres for harvest are abandoned and classified as not for harvest.
Data on which to base changes in harvested acres come from the yield forecast surveys when sample yields are taken
35 NASS, Crop Production, http://usda.mannlib.cornell.edu/MannUsda/viewDocumentInfo.do?documentID=1046. 36 For example, this supplementary procedure was used due to late planting issues in selected states in the following
years: 1993, 1995, 1996, 1999, 2008, 2011, 2013, and 2015. See the August Crop Production report for those years
listed for more information.

NASS and U.S. Crop Production Forecasts: Methods and Issues
Congressional Research Service 13
out of production or the operator reports acres no longer being considered for harvest.
Revisions to Final Estimates
Final estimates reported in the Crop Production Annual Summary may be revised the following
year if new information becomes available that would justify a change. For example, considerable
data are available from other organizations—both private and public—that may be used to
evaluate the accuracy of NASS production estimates and to help determine the final estimates.
These sources of information generally become available after the crop harvest, often after the
preliminary production estimates are determined:
FSA program data. Farm operators that participate in USDA farm programs
routinely report their planted and harvested acreage and yield data to their local
FSA offices in compliance with program requirements for determining both
payment eligibility and payment amounts. Aggregated FSA program data provide
a benchmark for evaluating the historical consistency of NASS survey data and
for verifying current-year estimates.
Market utilization data. A wide range of information about commodity imports,
exports, food and industrial use, soybean crush,37
and cotton ginning becomes
available to USDA during the year from different industry sources. This
information is evaluated monthly for reliability and consistency, under the
guidance and chairmanship of WAOB, within one of nine Interagency
Commodity Estimates Committees (ICECs).38
Once validated, the data are used
in a U.S. commodity balance sheet that starts with carryover stocks from the
previous year and the current production estimate to give a measure of total
supply. The subtraction of the utilization data at the end of the marketing year
from the total supply established at the beginning of the crop year should
correspond closely with the ending stocks. Based on the work of the ICEC
committees, both the domestic and international commodity balance sheets are
published by the WAOB in a monthly WASDE report.39
If there is a large
unexplained difference or residual, the previous year’s acreage, yield, and
production survey and stocks data are reviewed to determine where revisions
within the range of the survey sampling errors can be made to minimize the
residual in the balance sheet.
USDA Census of Agriculture data. In addition, the final crop production
estimates are reviewed after data for USDA’s five-year Census of Agriculture
become available. No further revisions are made once the survey data are
synchronized to the census data.40
37 Soybeans are processed (or crushed) into two products—soybean oil and soybean meal. 38 Each ICEC committee assembles the knowledge and resources of four USDA agencies—ERS, FAS, FSA, and AMS.
Each of these agencies covers a different range of technical expertise on domestic and international agricultural
production, markets, and trade. For a list of the nine ICEC committees and their chairpersons, see WAOB, “Interagency
Commodity Estimates Committees,” https://www.usda.gov/oce/commodity/committee.htm#. 39 For details, see USDA, Office of the Chief Economist, “How the WASDE Is Prepared,” https://www.usda.gov/oce/
commodity/wasde/prepared.htm. 40 For additional information on the Census of Agriculture, see https://www.agcensus.usda.gov/.
NASS and U.S. Crop Production Forecasts: Methods and Issues
Congressional Research Service 14
Quarterly Stock Surveys
NASS also conducts quarterly surveys of grain and soybeans stored both on and off farms. The
quarterly Grain Stocks report (released in January, March, June, and September) includes
estimates of stocks of all wheat, durum wheat, corn, sorghum, oats, barley, soybeans, flaxseed,
canola, rapeseed, rye, sunflower, safflower, and mustard seed for the nation and by state and
position (on-farm or off-farm storage). In addition, it provides estimates of the number and
capacity of off-farm storage facilities and the capacity of on-farm storage facilities.41
Similarly,
the quarterly Rice Stocks report presents the most current estimates of rough and milled rice
stocks by position (on and off farms), as well as stocks by length of grain classes for the nation
and for the six major producing states (Arkansas, California, Louisiana, Mississippi, Missouri,
and Texas).42
Issues for Congress The critical role that NASS data reports play in promoting a smooth and efficient marketing
process for U.S. agriculture make NASS’s successful functioning a concern of Congress. Any
interruption or deviation from the transparent and timely delivery of objective, trustworthy
market data could increase costs to all market participants as well as taxpayers that underwrite the
U.S. farm support programs. There are three issues of potential concern to Congress:
1. A trend has emerged since the early 1990s of declining survey response by
farmer participants. Such a decline, if sufficiently severe, could jeopardize the
integrity of NASS estimates.
2. Increasing nonresponse at the county level degrades the viability of county yield
calculations or, in some cases, prevents a calculation from being made.
3. NASS estimates must be as objective as possible so as not to adversely influence
the market’s function.
These issues are addressed in greater detail below.
Declining Survey Response
NASS targets an 80% response rate in all its surveys.43
After achieving response rates of 80% to
85% in the early 1990s, rates have declined to the 60% range, with a notable drop-off in response
occurring since 2010 (Figure 4).44
Some economists worry that the acceleration in the decline
since 2010 could suggest a long-term permanent change.45
41 NASS, Grain Stocks, https://usda.mannlib.cornell.edu/MannUsda/viewDocumentInfo.do?documentID=1079. 42 NASS, Rice Stocks, https://usda.mannlib.cornell.edu/MannUsda/viewDocumentInfo.do?documentID=1141. 43 Telephone discussion with Anthony Prillaman, Head, Field Crops Section, NASS, December 8, 2016. 44 NASS does not publish official information on survey response rates. However, information on NASS response rates
is maintained internally and frequently appears in NASS and USDA research papers as cited below. 45 R. Johansson, A. Effland, and K. Coble, “Falling Response Rates to USDA Crop Surveys: Why It Matters,”
Farmdoc Daily, vol. 7, no. 9, University of Illinois, January 19, 2017.

NASS and U.S. Crop Production Forecasts: Methods and Issues
Congressional Research Service 15
Figure 4. Response Rates for NASS Acreage and Production Surveys Have Been
Declining Since the Early 1990s
(Survey Response Rates Expressed as a Percent)
Source: Johansson et al., “Falling Response Rates,” Farmdoc Daily, January 2017.
This is of concern to USDA and policymakers because NASS survey data play a critical role in
the proper functioning of several USDA farm programs, particularly those programs that are
based on reliable county-level yield estimates.46
For example, NASS county yield estimates are
used to determine county-level payments under the ARC-CO program administered by the FSA.47
The quality of the information and analysis provided from NASS data depends on a high level of
producer participation in these surveys. As the number of respondents falls, the statistical
reliability of estimates and forecasts and the value of NASS estimates for a host of other purposes
declines.48
Survey nonresponse may occur for a variety of reasons: a farmer may simply refuse to
answer, a farmer may not know or not remember, a farmer may not be accessible during the
period of data collection, or a farmer may inadvertently or incorrectly be excluded from the
sample.49
There is also concern that the increasing difficulty in accessing households may be
related to new telephone technologies like caller ID and the replacement of land lines with cell
phones.
Nonresponse Bias Issues
Survey nonresponse, if systemic, can introduce a bias in the data and undermine the accuracy of
survey estimates. Systemic nonresponse occurs when sampled farms that choose to not respond to
the survey have certain characteristics in common that may be important to the survey. For
46 Schleusener, “NASS Surveys Have Direct Impact on Critical Farm Programs.” 47 This issue is discussed in more detail in the section “Increasing Nonresponse ” of this report. 48 Johansson et al., “Falling Response Rates.” 49 The material in this section is from Diane K. Willimack, The NASS Response to Nonresponse, NASS,
https://www.nass.usda.gov/Education_and_Outreach/Understanding_Statistics/Statistical_Aspects_of_Surveys/
nonresponse.pdf.

NASS and U.S. Crop Production Forecasts: Methods and Issues
Congressional Research Service 16
example, if higher-yielding farms tend to not respond to the survey more than lower-yielding
farms, then the data resulting from the abridged sample may produce a lower average yield
estimate that is unrepresentative of the farm population that the survey is trying to measure. The
extent of the bias depends on the number of nonrespondents relative to the total sample and the
degree to which the nonrespondents differ from the respondents.
The potential bias related to nonresponse becomes increasingly important for more localized
estimates. For example, NASS estimates remain most accurate at the national level, but low
response rates become increasingly important for estimates at the state and especially county
levels. This is described in more detail in the section “Increasing Nonresponse Degrades County
Yield Calculations” of this report.
NASS tries to minimize nonresponse by working with various agricultural commodity and farm
groups, as well as its own public relations and educational materials, to publicize the importance
of the survey. In addition, NASS includes specific components to its enumerator training that are
designed to address nonresponse. Finally, NASS conducts follow-up attempts to contact
nonrespondents. In order to achieve the highest possible response rates, NASS surveys are
conducted first by Internet and mail contact and then followed up with telephone and personal
interviews.50
The cost of these contacts increases substantially at each stage: $2 per respondent
for the Internet survey, $4 for mail, $12 for telephone, and more than $50 per respondent for
personal interview. So the more responses obtained at the earliest stages of the survey, the more
cost effective the collection of the needed data.
Adjusting for Nonresponse
NASS has strategies to address nonresponse in survey data. Increasing the sample size might help
to increase the number of responses, but the additional cost may be prohibitive, and if the reasons
behind the low response rate are systemic, larger sample sizes will not necessarily counteract
lower response rates.51
In some cases, NASS estimates are “reweighted” to reflect the
nonresponse rates. This procedure assumes that the nonrespondents within each sample stratum
are like the respondents. Another procedure is to draw a sample of the nonrespondents and make
a special effort to obtain the required information from them. Then nonresponse bias can be
measured, and the overall estimate can be adjusted accordingly. When only a few items are
missing from an entire questionnaire, it may be possible to impute, or estimate, these data from
other available information. NASS statisticians evaluate the particular circumstances during the
questionnaire edit phase and adopt their adjustment strategy accordingly to preserve the integrity
of the data.
County-Level Crop Production Estimates
In recent years, NASS county-level area and yield estimates have grown in importance. In
particular, USDA’s FSA uses NASS county-level yield estimates for calculating producer
payments under the county-level ARC-CO program established under the 2014 farm bill (the
Agricultural Act of 2014; P.L. 113-79).52
Other users include the Risk Management Agency
(RMA), which uses county estimate data to determine when crop loss insurance payments are
made to farmers under certain types of policies. RMA also uses the data directly and indirectly in
50 Johansson et al., “Falling Response Rates.” 51 Ibid. 52 See CRS Report R43448, Farm Commodity Provisions in the 2014 Farm Bill (P.L. 113-79).

NASS and U.S. Crop Production Forecasts: Methods and Issues
Congressional Research Service 17
its actuarial process. The FSA also uses the estimates in its formulas for posted county prices and
disaster assistance programs. Other government agencies, universities, and research organizations
use county estimate data to determine many production and economic values on a small area
basis.
County Agricultural Production Surveys (CAPS)
In response to the growing demand for county-level data, NASS conducts a County Agricultural
Production Survey (CAPS).53
The CAPS is designed to increase the usable sample size to a level
adequate for county-level estimation. In particular, CAPS provides data needed to estimate
acreage and production of selected crops and inventories of major livestock species at the county
level for state and federal programs. The CAPS is conducted in 44 states. All counties in these
states must be represented in the sample. The commodities covered by the survey are specific to
each state. A federal county estimates program is jointly defined by NASS, RMA, and FSA.
Individual states will add commodities to the program to cover special needs of local cooperators.
The CAPS is conducted annually at the end of the harvest season. Some states conduct two
surveys, one in late summer for the early harvested crops (small grains) and another in late fall for
row crops, hay, and livestock. Most states conduct only one late fall survey.
The target population is all farms and ranches in each state. Operations already participating in
other NASS acreage and livestock surveys are excused from the CAPS. However, their responses
to these other surveys are merged into the county summaries. Special sampling considerations are
employed to ensure that all counties and rarer commodities are adequately represented. Also,
farms that have not responded to a survey for several years may be added to the sample for the
purpose of refreshing sampling information.
Each state develops its own data collection strategy. Most states conduct a mail survey with
second mailings or a telephone follow-up to ensure adequate coverage for each county. Response
targets are set for each county and the follow-up strategy is defined accordingly. The number of
reports returned is monitored, and a nonresponse follow-up strategy is mapped out to achieve
response targets. Summaries compute the measures needed to allocate previously released state
totals to regions and counties. State estimates for commodities are made from acreage and
livestock surveys conducted under more rigid controls.
Increasing Nonresponse Degrades County Yield Calculations
In October 2015, when FSA announced the first ARC-CO payments under the 2014 farm bill (for
the 2014 crop year), wide discrepancies in county yields and payments to farmers in nearby
counties were noticed.54
This problem was particularly acute (but not unique) for county-level
ARC-CO corn payments in North Dakota.55
Farmers in two counties, LaMoure and Logan,
received no payments, while farmers in neighboring counties received payments ranging from
$20 to $60 per acre. Similar county-wide disparities appeared again for the 2015 crop year ARC-
CO payments.
53 For more information, see https://www.nass.usda.gov/Surveys/Guide_to_NASS_Surveys/
County_Agricultural_Production/index.php. 54 For FSA information on ARC county-level yield calculations and payment rates, see https://www.fsa.usda.gov/
programs-and-services/arcplc_program/arcplc-program-data/index. 55 Similarly, Iowa’s Calhoun County recently received a payment of $23.21 per acre, while a county directly north
received $91.52, and two counties to the south received about $75.

NASS and U.S. Crop Production Forecasts: Methods and Issues
Congressional Research Service 18
The ARC-CO program is a revenue guarantee triggered by crop revenue losses at the county
level. Payments are made whenever the actual county revenue drops below an ARC county
revenue guarantee. The ARC revenue guarantee is calculated as 86% of the product of the recent
historical five-year Olympic average (removing the high and low observations) county yield and
the five-year Olympic average national farm price.56
The actual county revenue is calculated as
the product of the national season average farm price for a crop and its county average yield.
The cause of the discrepancies in ARC-CO payments among counties appears to be related
directly to FSA’s use of a “cascading policy” for determining what county yield estimate is used
in the payment calculation.57
Under its current policy, FSA requires that the NASS yield estimate
be used. However, NASS can only publish a county yield estimate if at least 30 producer yield
surveys are returned for that county or at least three responses are received from producers
representing a minimum of 25% of the total county acreage.
If NASS does not get enough responses to publish an estimate, then it uses the county’s yield
estimate from RMA’s crop insurance data base. RMA uses actual reported yield data from
producers that participate in crop insurance to calculate a county yield estimate. However, RMA
yields may differ from NASS estimates since not all farms may participate in crop insurance.
Furthermore, for a variety of reasons, RMA yield data tend to be higher than NASS yield data.
Whatever the reason for the difference, the substitution of RMA yield data in lieu of NASS yield
data tends to inflate the calculated “actual” county revenue for the crop year and, thus, produce a
lower ARC-CO payment.58
In the event that neither NASS nor RMA yield data are available, then the FSA state committee
will determine the county yield using “best available data.” This may involve NASS or RMA
yield data for a neighboring county or a higher aggregated level, such as the NASS district yield
or 70% of the crop insurance transitional yield.59
As yield estimates become increasingly
disconnected from the target county, the odds tend to increase that an ARC-CO payment will not
be triggered when the county would otherwise qualify for payments.60
Even a relatively small change in the yield estimate for a county can have a substantial effect on
the payment rate. For example, a 5% decline in the current county yield estimate can result in a
tripling of the payment rate, whereas a 5% increase results in zero payments (Table 4).61
56 For more information, see CRS Report R43758, Farm Safety Net Programs: Background and Issues. 57 Johansson et al., “Falling Response Rates,” p. 4. 58 Philip Brasher, “Questions About ARC Likely to Extend into Farm Bill Debate,” Agri-Pulse, vol. 12, no. 32 (August
24, 2016), https://www.agri-pulse.com/articles/7395-questions-about-arc-likely-to-extend-into-farm-bill-debate. 59 RMA generally requires that a farmer have a four- to 10-year history of yields to determine insurable yield. Farmers
without adequate records can be assigned a transition yield (T-yield) for each missing year of data, which is generally
based on average county yields for the crop. 60 Johansson et al., “Falling Response Rates,” p. 4. 61 For another example, see FSA, “How Much Could a Five or 10 Percent Change in a County Yield ARC Payment,”
December 1, 2016, https://askfsa.custhelp.com/app/answers/detail/a_id/1796/session/
L3RpbWUvMTQ4OTYwNDYxOC9zaWQvSHhFM2hEZG4%3D.

NASS and U.S. Crop Production Forecasts: Methods and Issues
Congressional Research Service 19
Table 4. Examples of ARC-CO Payment Rates Under Varied Yield Scenarios for
Corn, Soybeans, and Wheat
Crop Payment Rate 5% lower yield 5% higher yield
Corn $14.83 $41.84 $0.00
Soybeans $12.51 $38.27 $0.00
Wheat $14.35 $49.49 $0.00
Source: Johansson et al., “Falling Response Rates,” Farmdoc Daily, January 2017.
Commodity groups have argued that FSA is under no legal requirement to use RMA yield data
when NASS data are unavailable. These groups have proposed several alternatives, including
using NASS data from neighboring counties instead of own-county RMA yields or using RMA
data exclusively for all counties nationwide as a “fairness” gesture, since crop insurance data are
more widely available at the county level. Similarly, during the 114th Congress, Senator Hoeven
of North Dakota proposed an amendment (§751) to the 2017 agriculture appropriations bill (S.
2956) to create a new $5 million nationwide pilot program to address county yield discrepancies.
Specifically, under the proposed pilot program, if an FSA office finds a disparity between yield
calculations in comparable counties, it will have an opportunity to remedy the inaccuracy by
using an alternate calculation method.62
USDA appears to be under no legislative requirement or guidance for this cascade policy.
Regarding the choice of county yield data used in calculating the farm year’s actual crop revenue,
the 2014 farm bill conveys implementation authority to the Secretary of Agriculture in Section
1117(b)(A), where the formula is to use “the actual average county yield per planted acre for the
covered commodity, as determined by the Secretary.”
According to the American Soybean Association (ASA), FSA decided not to change its policy for
the current farm bill period (2014-2018) because it thought that such a change could create
winners and losers or possibly increase the cost of the program.63
Moreover, ASA asserts that
FSA has expressed concern that making a change in the middle of the current farm bill could
bring unwanted attention to both NASS and RMA. This issue may be part of the debate
surrounding the ARC-CO program in particular—and farm revenue support programs in
general—during the next farm bill debate.64
Objective, Unbiased USDA Crop Forecasts
The farm community has frequently expressed concerns that large grain and commercial food
companies and hedge funds have inordinate market power and access to the hallways of Congress
and thus can potentially influence USDA reports in such a manner as to profit from them at the
expense of the “small farmer.” As a result, USDA and NASS expressly operate in a very public
fashion to discourage such criticisms.
62 For details, see Office of Senator Hoeven, “Agriculture Appropriations Committee Adopts Hoeven Pilot Plan to
Provide Fair Arc County Yield Calculations,” press release May 19, 2016, https://www.hoeven.senate.gov/news/news-
releases/agriculture-appropriations-committee-adopts-hoeven-pilot-plan-to-provide-fair-arc-county-yield-calculations. 63 American Soybean Association, “Update on ACR-CO Yield Issue,” press release, July 28, 2016,
https://soygrowers.com/update-on-arc-co-yield-issue/. 64 Brasher, “Questions About ARC Likely to Extend into Farm Bill Debate.”
NASS and U.S. Crop Production Forecasts: Methods and Issues
Congressional Research Service 20
Every March, NASS publishes Price Reactions After USDA Crop Reports, which evaluates
market reactions to NASS crop production forecasts by measuring the market price changes for
corn, soybeans, wheat, and upland cotton both one day and one week after the NASS reports are
released. The price reactions are done for those NASS reports that occur during the critical
growing and harvesting months. This includes the months when crop production estimates are
first made and then again when they are finalized (in the Crop Production Annual Summary
released in January following the harvest) by USDA.
The prices used by NASS to assess the market reaction for corn, soybeans, wheat, and cotton
represent sales from producers to first buyers at major markets as reported by AMS. The price
reaction data provide a measure of both the objectivity of USDA data (i.e., the presence or
absence of any visible bias) and the degree to which the market was “surprised” by the NASS
crop production data.
It is important to note that NASS Crop Production reports are released simultaneously with
USDA’s WASDE report. Thus, substantial market information concerning both supply and
demand for major commodity markets is made available at the same time as NASS estimates of
U.S. crop production. This implies that NASS reports are not necessarily solely responsible for
any changes to the price level for commodities in the short term following the data release. The
price level for any commodity can potentially be affected by other information available to the
market at that time but is ultimately determined by supply and demand.
Objectivity Confirmed, but Subject to Increasing Variability
An examination of the market reaction to NASS crop production forecasts for the four largest
crops—corn, soybeans, wheat, and upland cotton—confirms that there is no visible pattern of bias
or error in the forecasting results. Summary statistics (Table 5) suggest that positive and negative
price reactions are nearly equal in absolute number and average magnitudes of change in either
direction. A visual inspection of the monthly price reaction data charted over the time period from
1987 to 2015 for corn (Figure E-1 and Figure E-2) and wheat (Figure E-7) and 1989 to 2015 for
soybeans (Figure E-3 and Figure E-4) and upland cotton (Figure E-5 and Figure E-6) similarly
shows a random pattern of reactions. However, the variability of price reactions appears to have
grown substantially since 2000.
A similar but more thorough study65
examined NASS production forecasts for corn and soybeans
over the 1970-2005 period. The study charted (1) the annual change in forecasts of harvested
area, yield, and production; (2) the month-to-month variations in forecast changes; (3) the
relationship between the forecast and the actual production outcomes; (4) the pattern of forecast
errors; (5) comparisons of USDA versus private sector production forecast errors; and (6) the
price reaction of contract prices on futures exchanges. The authors concluded that the objectivity
and consistency of NASS forecasting procedures and methodology was confirmed by the data.
There appeared to be no trend in the size or direction of forecast errors over time, except that
NASS production forecast errors were largest in August (when the greatest amount of yield
uncertainty was at play) and smaller in subsequent forecasts as the yield uncertainty was reduced
until the final harvest.
65 D. L. Good and S. H. Irwin, “Understanding USDA Corn and Soybean Production Forecasts: Methods, Performance
and Market Impact over 1970-2005,” University of Illinois, February 2006.
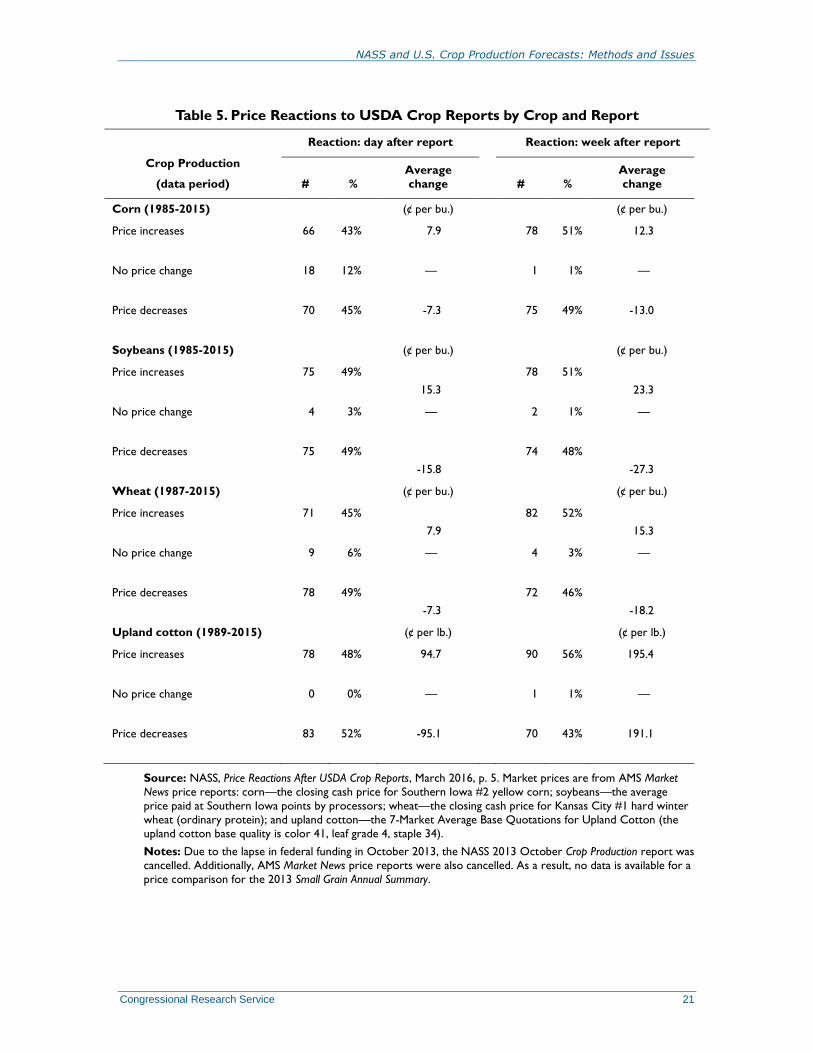
NASS and U.S. Crop Production Forecasts: Methods and Issues
Congressional Research Service 21
Table 5. Price Reactions to USDA Crop Reports by Crop and Report
Crop Production
(data period)
Reaction: day after report Reaction: week after report
# %
Average
change # %
Average
change
Corn (1985-2015) (¢ per bu.) (¢ per bu.)
Price increases
66 43% 7.9 78 51% 12.3
No price change
18 12% — 1 1% —
Price decreases
70 45% -7.3 75 49% -13.0
Soybeans (1985-2015) (¢ per bu.) (¢ per bu.)
Price increases
75 49%
15.3
78 51%
23.3
No price change
4 3% — 2 1% —
Price decreases
75 49%
-15.8
74 48%
-27.3
Wheat (1987-2015) (¢ per bu.) (¢ per bu.)
Price increases
71 45%
7.9
82 52%
15.3
No price change
9 6% — 4 3% —
Price decreases
78 49%
-7.3
72 46%
-18.2
Upland cotton (1989-2015) (¢ per lb.) (¢ per lb.)
Price increases
78 48% 94.7 90 56% 195.4
No price change
0 0% — 1 1% —
Price decreases
83 52% -95.1 70 43% 191.1
Source: NASS, Price Reactions After USDA Crop Reports, March 2016, p. 5. Market prices are from AMS Market
News price reports: corn—the closing cash price for Southern Iowa #2 yellow corn; soybeans—the average
price paid at Southern Iowa points by processors; wheat—the closing cash price for Kansas City #1 hard winter
wheat (ordinary protein); and upland cotton—the 7-Market Average Base Quotations for Upland Cotton (the
upland cotton base quality is color 41, leaf grade 4, staple 34).
Notes: Due to the lapse in federal funding in October 2013, the NASS 2013 October Crop Production report was
cancelled. Additionally, AMS Market News price reports were also cancelled. As a result, no data is available for a
price comparison for the 2013 Small Grain Annual Summary.
NASS and U.S. Crop Production Forecasts: Methods and Issues
Congressional Research Service 22
Appendix A. Historical Origins of NASS President Lincoln established the U.S. Department of Agriculture in 1862. The precursor of
NASS—the Division of Statistics—was established within USDA a year later in 1863.66
One of
the key missions of the Division of Statistics was to provide information on commodity and
agricultural markets to improve their operating efficiency and provide a fair and equitable
environment for price discovery in the marketplace.67
The Administration argued that without
federal provision of objective, transparent data on U.S. and world markets to all participants on an
equal basis, powerful interests with deep resources could get access to this critical information
and either manipulate these markets or simply profit from it at the cost of individual farmers and
ranchers. An initial duty of the Division of Statistics was to prepare monthly reports on the
condition of U.S. crops. In 1866, it began to publish annual statistics on production of major
crops, livestock numbers, and annual farm prices. In 1882, state statistical agents were hired on a
part-time basis. In 1898 additional state agents were hired to provide better coordination and
greater coverage. By 1905, USDA had state-level statistical agents in 43 states.
A scandal involving advance knowledge of USDA’s crop forecasts by a New York cotton
speculator occurred in 1905 and led to the establishment of the Crop Reporting Board (now called
the Agricultural Statistics Board [ASB]).68
The Crop Reporting Board consisted of several
statisticians who provided an independent review of the survey data forwarded from NASS’s
regional offices.
In addition, a secure system of data collection and release—referred to as the “lockup” system—
was established to prevent early release or advance knowledge of USDA’s crop forecasts.69
Field
offices forward their estimates to NASS headquarters, where they are combined under the secure
lockup system and released at preannounced scheduled times to the press and public by the ASB.
In 1961, under a USDA-wide reorganization, NASS’s immediate precursor—the Statistical
Reporting Service (SRS)—was established.70
In 1986, the SRS was renamed as NASS and the
Crop Reporting Board was renamed as the ASB.71
Over the years NASS’s reporting program of
agricultural estimates has responded to an increased demand for agricultural production and
market information with more frequent and detailed reports, including weekly reports on crop
progress during the growing season, monthly reports on farm prices received and cattle on feed,
and quarterly reports of hogs.
66 USDA, The Story of U.S. Agricultural Estimates, “Chapter 12. A Chronology of Development and Progress, 1866-
1966,” Statistical Reporting Service, Miscellaneous Publication No. 1088, April 1969. 67 USDA, “National Agricultural Statistics Service, Agricultural Estimates Program,” FY2017 Budget, Explanatory
Notes for Committee on Appropriations, vol. 1, p. 17-8. 68 Richard Allen, Safeguarding America’s Agricultural Statistics, NASS, April 2007. 69 For more information on lockup procedures, see NASS, “Reports Procedures,” February 21, 2017,
https://www.nass.usda.gov/About_NASS/Reports_Procedures/index.php; NASS, “Agricultural Statistics Board and
Lockup,” https://www.nass.usda.gov/About_NASS/ASB_and_Lockup/index.php; and NASS, Fact Finders for
Agriculture: NASS at Work, April 2016, p. 9, https://www.nass.usda.gov/About_NASS/pdf/
NASSFactFinders_April_2016_FINAL.pdf. 70 Secretary’s Memorandum No. 1446, Supplement 1, of April 3, 1961, under Reorganization Plan No. 2 of 1953 and
other authorities; USDA, FY2017 Budget, Explanatory Notes for Committee on Appropriations, vol. 1, p. 17-1. 71 This was the result of a 1984 NASS task group on Structure and Identification. The task group’s report in July 1985
made several recommendations, including the name changes. Richard Allen, Agriculture Counts: The Founding and
Evolution of the National Agricultural Statistics Service, 1957-2007, NASS, https://www.nass.usda.gov/About_NASS/
pdf/agriculture_counts.pdf.

NASS and U.S. Crop Production Forecasts: Methods and Issues
Congressional Research Service 23
Appendix B. Details on NASS Sampling Method
Sampling from the Area Frame
Sampling from the area frame is a multistep process. First, all land in each state is classified into
land use categories by intensity of cultivation—referred to as stratification—using a variety of
map products, satellite imagery, and computer software packages. These land use classifications
range from intensively cultivated areas to marginally cultivated grazing areas to urban areas.
Most states use six general land-use strata: intensive agriculture, extensive agriculture, cities and
towns, rangeland, non-agriculture, and water. Then, the land in each land use category is divided
into smaller segments ranging from about 1 square mile in cultivated areas to 0.1 square mile in
urban areas. This segmentation allows intensively cultivated land segments to be selected with a
greater frequency than those in less intensively cultivated areas. Segments representing cultivated
areas are selected at a rate of about 1 out of 125. Sample segments in land use classifications with
decreasing amounts of cultivated land are selected into the survey sample at rates ranging from 1
out of 250 to 1 out of 500.
Sampling from the List Frame
Before sampling from the list frame, each farm is classified by various characteristics such as the
number of acres by crop. Large farms, as determined by the relevant control data, are sampled at
high rates. For example, Illinois farms on the list with over 5,500 acres of cropland, or grain
storage capacity exceeding 500,000 bushels, are selected with certainty, as are Iowa farms with
over 5,000 acres of cropland. Smaller farms are selected at rates of 1 out of 25 to 50. Table B-1
provides a comparison of samples from the list and area frames used for NASS crop reports on
corn and soybean production during 2016.

NASS and U.S. Crop Production Forecasts: Methods and Issues
Congressional Research Service 24
Table B-1. Summary of NASS Survey Collection Period and Sample Size
(Based on the 2016 Crop Year for Corn and Soybeans)
Report
List Frame Area Frame Estimates/Forecasts
Data Collection Period
Sample # Used
Sample # Pltd Hvst Yield Prod
Prospective
Plantings
1st 2 weeks, March 83,000
No — Yes No No No
Acreage 1st 2 weeks, June 70,500
Yes 11,000 Yes Yes No No
Crop Prod., Aug. July 25 to Aug. 8 22,100
Yes NA Yes Yes Yes Yes
Crop Prod. Sept. Aug. 24 to Sept. 7 10,300
Yes NA Yes Yes Yes Yes
Crop Prod. Oct. Sept 24 to Oct. 5 11,600
Yes NA Yes Yes Yes Yes
Crop Prod. Nov. Oct. 25 to Nov. 4 8,900
Yes NA Yes Yes Yes Yes
Crop Prod. Annual 1st 2 weeks, Dec. 82,900
No — Yes Yes Yes Yes
Source: NASS, “Statistical Methodology,” included in each of the reports as identified in the table.
Notes: NA = not available; Pltd = planted; Hvst = harvested; Prod = production. This table is meant to be
exemplary. Crops with a different growing season, such as cotton, would rely on somewhat different monthly
Crop Production reports.

NASS and U.S. Crop Production Forecasts: Methods and Issues
Congressional Research Service 25
Appendix C. Planted and Harvested Area Surveys Every year NASS conducts three major acreage surveys that correspond with the crop reporting
schedule briefly outlined above and shown in Table 2. In late March, the Planting Intentions
report gives a first look at the crops that farmers intend to plant in the spring. This is followed in
late June by the Acreage report, which includes both estimates of spring-planted acreages and
forecasts of harvested acreages. An end-of-year acreage and production survey conducted in early
December, after most of the field crops have been harvested, contributes to final year-end
estimates for planted and harvested acres.
March Prospective Plantings Survey
The spring planting intentions contained in the Prospective Plantings report are based primarily
on a survey—conducted during the first two weeks of March—of the current field crop planting
intentions for about 83,000 randomly selected farm operators.72
The acreage estimates are
intended to reflect grower planting intentions as of the survey period and give the first indication
of potential crop plantings for the year. Each state NASS field office reviews the survey data for
“reasonableness and consistency” with historical estimates, and the results are submitted to the
statisticians of NASS’s ASB for an independent review.73
The published acreage estimates are
based on survey data, but some judgment may be used based on the historical relationship of
official estimates to the survey data. Actual spring plantings may vary from intentions in
accordance with changes in weather or market conditions between early March and the actual
planting period of April to June.
June Acreage Survey
The largest single survey NASS conducts each year is the June Agricultural Survey.74
During the
first two weeks in June, about 2,400 interviewers contact over 125,000 farmers, either by
telephone or in person, to obtain information on crop acreages, grain stocks, and livestock
inventories. This pool of sampled farmers is drawn from two sources—about 70,000 farms from
the list frame75
and every farm with land inside of one of the approximately 11,000 area segments
that are selected nationwide from the area frame.76
Data from the two surveys (list and area
frame) are combined in such a way as to account for all acreage but to avoid double-counting of
acreage. The sample of farm operators surveyed as part of the area frame varies from year to year
as the segments selected vary, but it may represent as many as 50,000 farm operators that are
additional to the list frame sample.
NASS interviewers use maps and aerial photos showing the exact location and boundaries of each
sample area segment to locate and interview every operator with land inside the segment
boundaries to identify crops planted in each field and obtain livestock inventory information and
quantities of grain in storage. Telephone interviewers collect most of the data from this pooled
72 USDA, Statistical Methodology,” Prospective Plantings, “March 31, 2016, p. 34. 73 Good and Irwin, “USDA Acreage and Yield Forecasts,” p. 2. 74 This section is based on Frederic A. Vogel, NASS, and Gerald A. Bange, WAOB, Office of the Chief Economist,
USDA, Understanding USDA Crop Forecasts, Miscellaneous Publication No. 1554, March 1999, pp. 4-5. 75 In 2016, approximately 70,500 farm operators were included in the list frame sample. NASS, Statistical
Methodology,” Acreage, “June 2016, p. 44. 76 Ibid.

NASS and U.S. Crop Production Forecasts: Methods and Issues
Congressional Research Service 26
sample, asking producers to report the acreage, by crop, that has either been planted or that they
intend to plant and the acreage they expect to harvest as grain. The ASB reviews survey data at
the state and national level in the same way described for the March survey data.
Data from this survey are used to estimate, among other things, total acres planted to corn,
soybeans, and other crops regardless of the intended uses. Also, preliminary projections of acres
to be harvested for grain or soybeans, including seed, are made using these data. The winter
wheat planted and harvested acreage released in earlier NASS reports is subject to revisions in the
June Acreage report.
Midyear estimates of harvested acreage for the earliest harvested crops, such as the small grains,
are based on reported area for harvest from the June survey. For the later harvested crops, such as
corn and soybeans, initial projections make normal allowances for abandonment and acres used
for other purposes to derive a harvested area projection from the planted area estimate.
The June Agricultural Survey is subsampled for surveys in July, September, December, and
March for the basic livestock inventory, crop production, and quarterly stocks estimates.
Final December Survey for Acreage and Yields
A final survey—drawn from the current field crop planting intentions for about 83,000 randomly
selected farm operators—is conducted during the first two weeks of December.77
These data
provide season final estimates for planted and harvested area, yield per harvested acre, and
production for summer crops and an initial estimate of winter wheat acres planted that fall. The
December survey results for winter wheat plantings are reported in the Winter Wheat Seedings
report, released in early January of the following year. The final estimates for area and yield for
all other crops are reported in the Crop Production Annual Summary that is also released in early
January of the following year.
77 NASS, “Statistical Methodology,” Crop Production: 2016 Summary, January 12, 2017, p. 120.

NASS and U.S. Crop Production Forecasts: Methods and Issues
Congressional Research Service 27
Appendix D. Crop Yield Methodology NASS uses two basic methods to forecast crop yield:
1. Grower-reported yields ask growers what their yields were for each crop as part
of the monthly agricultural yield survey, and
4. Objective-yield measurements take scientific field measurements of fruit count
and weight to estimate yield.78
Yield data from these two sources flows in to NASS headquarters as part of the monthly surveys.
At NASS, the statisticians of the ASB convene to review regional yield indicators and determine
an official yield forecast. Each member reviews all the data and brings his or her perspective to
the collective review where the ASB reaches a consensus on the national yield forecast.79
Grower-Reported Yields
A subsample of farmers who respond to the list portion of the June Agricultural Survey is selected
to provide monthly crop yield projections through the remainder of the growing season.80
This
provides a way to screen farmers so that only those currently growing the commodities of interest
are contacted during the monthly surveys. This subsample may be supplemented with other
known growers randomly selected from the list frame when monthly district level production
forecasts are required for some states.81
The sampled farmers are asked what they expect their crops to yield before harvest, and in a later
survey they are asked what their actual yields were after harvest. All yield data for an individual
report are weighted by the farm’s crop acres for harvest.
Objective-Yield Surveys
Under this second method, specially trained enumerators conduct direct field observations during
the principal growing season for major crops. Objective yield surveys are conducted for five
crops—corn, soybean, cotton, winter wheat, and potatoes. Sample fields are selected from those
farm operations identified in the area-frame sample portion of the June Agricultural Survey but
focus on each commodity’s major producing states—that is, those states that contribute most
heavily to total U.S. production (Figure 2).82
These surveys provide information for making forecasts and estimates of crop yields based on
counts, measurements, and weights obtained from small plots in a random sample of fields.83
Observations within each selected field are made in two randomly located plots. Plots include two
78 In a strict botanical sense, a plant’s fruit is the ripened ovary of the plant enclosing the seed or seeds. For example, in
the case of wheat or rice, the fruit is the harvestable grain; for corn, it is the kernels on the ear; and for soybeans, it is
the beans within the pods. 79 Good and Irwin, “USDA Acreage and Yield Forecasts,” p. 8. 80 Vogel and Bange, Understanding USDA Crop Forecasts, pp. 5-8. 81 Additional district-level data is often needed to enhance the statistical precision estimates for major producing states. 82 See NASS, Crop Production, August 12, 2016, for crop tables listing the relevant states included in the survey for
each of the major program crops—including corn, sorghum, oats, barley, winter wheat, durum wheat, other spring
wheat, rice, soybeans, peanuts, cotton, and other crops. 83 For specific details on NASS’s objective yield surveying procedures for each crop, see NASS, The Yield Forecasting
Program of NASS, Statistical Methods Branch Staff Report No. SMB 06-01, May 2006.

NASS and U.S. Crop Production Forecasts: Methods and Issues
Congressional Research Service 28
or three adjacent rows of predetermined length. Measurements are made to determine row
spacing so that conversions to yield per acre can be made.
The enumerators objectively measure yields by counting the crop’s fruit in the field and assessing
the fruit’s weight and yield.84
Plant characteristics used as gross-yield prediction variables change
as the crop maturity progresses. Figure D-1 shows the forecast variables used to predict the two
gross yield components for each crop—the fruit count and the weight per fruit. While the plant is
in its early growth stages, plant counts may be the only data available for forecasting the number
of mature fruit, and they are supplemented with historical averages of weight per fruit. Later, as
the crop matures, actual fruit samples can be taken and lab measurements used to estimate the
fruit’s weight and yield per acre. The same sample plots are revisited each month during the
growing season until the crop is mature and can be harvested. At harvest the final fruit counts and
weights are obtained.
Figure D-1. Gross Yield Components: Number of Fruit and Weight per Fruit
(Variables Used for Pre-Harvest Forecast and Harvest-time Estimate)
Source: Theresa Holland, “Overview of Sample Surveys for Forecasting & Estimating U.S. Crops,” NASS,
Regional Workshop on Sampling for Agricultural Surveys, Montevideo, Uruguay, June 23, 2011.
Note: The variables measured and used in the forecast or estimate are determined by the crop’s stage of
maturity.
The potential accuracy of each month’s forecast for the major field crops is dependent on both the
crop maturity at the time of the forecast and future weather. When maturity lags normal patterns,
84 Yield equals the fruit count times the fruit weight minus harvest loss. An assessment of harvest loss is measured by
gleaning grain from the ground of sample plots after the harvest is completed.

NASS and U.S. Crop Production Forecasts: Methods and Issues
Congressional Research Service 29
for example, the numbers of pods and ears are based on the numbers of plants and fruiting
positions rather than actual number of fruit. Thus, when maturity lags, the forecasts become more
variable because the expected number of fruit can differ from the final. However, the primary
source of forecast error occurs when final end of season fruit weights differ from the historical
average, because fruit weight cannot be fully determined until the crop matures.
After the entire field has been harvested, the sample field is revisited and two more plots are laid
out. These sample plots are gleaned to estimate the harvest loss. Also, once the harvest is
complete, the farmers who operate the sample fields are recontacted to obtain final harvested
acres and yields for all of the sample fields.
Harvested yield can be thought of as the gross yield minus harvest loss. Counts, measurements,
and other observations from each sample plot are put into statistical models based on historical
data to predict the final number of fruit and final weight per fruit. A forecast of gross yield is
calculated by multiplying these two components together and dividing by land area.
Gross yield overstates the production that is actually harvested and marketed. Harvesting loss
must be deducted to compute net yield. Initially, an adjustment is made for expected harvest
losses based on past averages. Once the harvest is complete, the grain left on the ground in the
sample plots is picked up (gleaned) and weighed to provide an estimate of the harvest loss.

NASS and U.S. Crop Production Forecasts: Methods and Issues
Congressional Research Service 30
Appendix E. Monthly Price Reaction Charts for
Corn, Soybeans, Upland Cotton, and Wheat
Figure E-1. Market Price Reaction to NASS Production Forecasts: Corn
(August-September-October)
Source: NASS, Price Reactions After USDA Crop Reports, March 2016. Market prices are from AMS Market News
price reports: corn—the closing cash price for Southern Iowa #2 yellow corn; soybeans—the average price paid
at Southern Iowa points by processors; wheat—the closing cash price for Kansas City #1 hard winter wheat
(ordinary protein); and upland cotton—the 7-Market Average Base Quotations for Upland Cotton (the upland
cotton base quality is color 41, leaf grade 4, staple 34).
Notes: Due to the lapse in federal funding in October 2013, the NASS 2013 October Crop Production report was
cancelled. Additionally, AMS Market News price reports were also cancelled. As a result, no data is available for a
price comparison for the 2013 Small Grain Annual Summary.
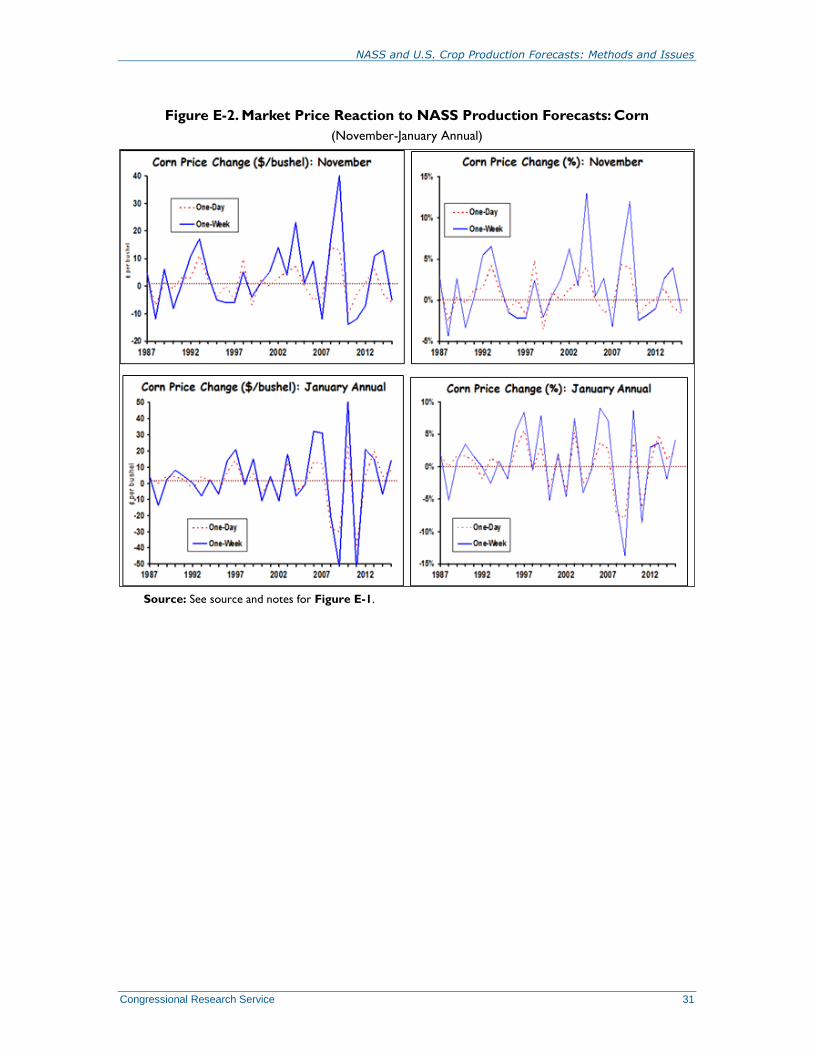
NASS and U.S. Crop Production Forecasts: Methods and Issues
Congressional Research Service 31
Figure E-2. Market Price Reaction to NASS Production Forecasts: Corn
(November-January Annual)
Source: See source and notes for Figure E-1.

NASS and U.S. Crop Production Forecasts: Methods and Issues
Congressional Research Service 32
Figure E-3. Market Price Reaction to NASS Production Forecasts: Soybeans
(August-September-October)
Source: See source and notes for Figure E-1.

NASS and U.S. Crop Production Forecasts: Methods and Issues
Congressional Research Service 33
Figure E-4. Market Price Reaction to NASS Production Forecasts: Soybeans
(November-January Annual)
Source: See source and notes for Figure E-1.
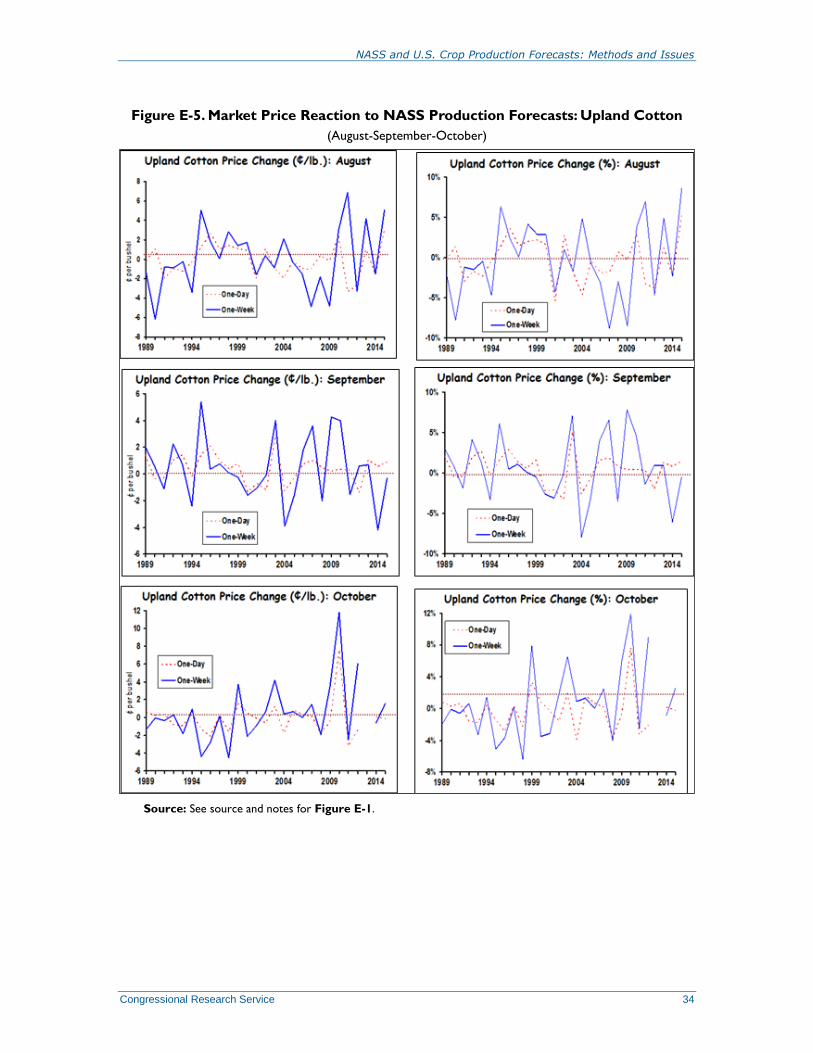
NASS and U.S. Crop Production Forecasts: Methods and Issues
Congressional Research Service 34
Figure E-5. Market Price Reaction to NASS Production Forecasts: Upland Cotton
(August-September-October)
Source: See source and notes for Figure E-1.

NASS and U.S. Crop Production Forecasts: Methods and Issues
Congressional Research Service 35
Figure E-6. Market Price Reaction to NASS Production Forecasts: Upland Cotton
(November-January Annual)
Source: See source and notes for Figure E-1.

NASS and U.S. Crop Production Forecasts: Methods and Issues
Congressional Research Service 36
Figure E-7. Market Price Reaction to NASS Production Forecasts: All Wheat
(May-August-January Annual)
Source: See source and notes for Figure E-1.

NASS and U.S. Crop Production Forecasts: Methods and Issues
Congressional Research Service 37
Author Contact Information
Randy Schnepf
Specialist in Agricultural Policy
[email protected], 7-4277