nan pao resins chemical co., ltd. and subsidiaries q2 financial report.pdf · as stated in note 17...
TRANSCRIPT
Nan Pao Resins Chemical Co.,
Ltd.
and Subsidiaries
Consolidated Financial
Statements and CPAs’ Report Second Quarter of June 30, 2018, and
2017
Address: No. 12, Nanhaipu, Nanhai Li, Xigang
Dist. , Tainan City
Tel: (06)795-2801
Stock Code: 4766

TABLE OF CONTENTS
Items Pages
Financial
Statements
Note number
I. Cover 1 -
II. Table of Contents 2 -
III. CPAs’ Report 3-4 -
IV. Consolidated Balance Sheet 5 -
V. Consolidated Statement of
Comprehensive Income
6-7 -
VI. Consolidated Statement of Changes in
Equity
8 -
VII. Consolidated Cash Flow Statement 9-10 -
VIII. Notes to the Consolidated Financial
Statements
(1) Company History 11 1
(2) Date and Procedures of
Authorization of Financial
Statements
11 2
(3) Applicability of Newly Issued and
Revised Standards and
Interpretations
11-16 3
(4) Summarized Remarks on
Significant Accounting Policies
16-24 4
(5) Significant Accounting Judgments,
Estimates, and Key Sources of
Uncertainty over Assumptions
24-25 5
(6) Remarks on Material Accounts 25-61 6 to 33
(7) Related Party Transactions 61-63 34
(8) Pledged Assets 63 35
(9) Significant Contingent Liabilities
and Unrecognized Contract
Commitments
63-64 36
(10) Material Disaster Loss - -
(11) Material Subsequent Events - -
(12) Others 64-68 37
(13) Note Disclosure Matters
1. Related Information on
Material Transactions
68-69, 71-75, 80-
81
38
2. Information on Investees 68-69, 76-77 38
3. Information on Investments in
China
69, 78-79 38
(14) Segment Information 70 39

CPAs’ Report
To Nan Pao Resins Chemical Co., Ltd.
Introduction
We have reviewed the Consolidated Balance Sheets of Nan Pao Resins
Chemical Co., Ltd. and its subsidiaries as of June 30, 2018, and 2017, the
related Consolidated Statements of Comprehensive Income for the three -month
and six-month periods ending on June 30, 2018 and 2017, the Consolidated
Shareholders’ Equity Statements and Consolidated C ash Flow Statements for the
six-month periods ending on June 30, 2018 and 2017, as well as the
accompanying Notes to the Consolidated Financial Statements (including
summarized remarks on significant accounting policies). It is the management ’s
responsibil ity to prepare a set of fairly presented financial statements in
accordance with Regulations Governing the Preparation of Financial Reports by
Securities Issuers and IAS 34 Interim Financial Reporting as endorsed, issued,
and affected by the Financial Supe rvisory Commission (FSC). Our responsibil ity
is to provide a conclusion on the consolidated financial statements based on our
reviews.
Boundaries
Except for matters described in the following paragraph titled Basis for
Qualified Conclusion, we conducted our reviews in compliance with Statements
of Auditing Standards (SAS) No.65 Review of Financial Information Performed
by the Independent Auditor of the Entity. A review of the consolidated financial
statements consists of making inquiries, primarily of perso ns responsible for
financial and accounting matters, and applying analytical and other review
procedures. Since a review is substantially less in scope than an audit, we might
not be fully aware of all material matters that might be identified in an audit .
Accordingly, we do not express an audit opinion.
Basis for Qualified Conclusion
As stated in Note 13 of the Consolidated Financial Statements, the
financial statements of the same period for some of the immaterial subsidiaries

that have been included in the Consolidated Financial Statements, have not been
reviewed by us. The total assets are (denoted in NTD) NT$3,128,044 thousand
and NT$2,312,608 thousand as of June 30, 2018, and June 30, 2017, and account
for 18% and 16% respectively of the consolidated a ssets. Total liabilities are
NT$672,616 thousand and NT$386,880 thousand and account for 8% and 5% of
the consolidated l iabilities respectively. Its total comprehensive income from
April 1, 2018 to June 30, 2018 and 2017, and from January 1 to June 30, 201 8
and 2017 are profit of NT$14,101 thousand, profit of NT$4,791 thousand, profit
of NT$25,622 thousand, and profit of NT$26,582 thousand, and account for 4%,
2%, 5%, and 12% of the consolidated comprehensive income respectively.
Information disclosure has been included in the Notes to the Consolidated
Financial Statements and compiled and disclosed as financial statements not
reviewed by the CPAs for immaterial subsidiaries of the same period. In
addition, as stated in Note 14 of the Consolidated Financial Statements,
investments accounted for using the equity method as of June 30, 2018, and
2017 are NT$283,660 thousand and NT$263,388 thousand respectively. Income
or loss recognized using the equity method from April 1 to June 30, 2018, and
2017, and from January 1 to June 30, 2018, and 2017 are the profit of NT$5,203
thousand, loss of NT$1,759 thousand, profit of NT$12,709 thousand and profit
of NT$8,362 thousand respectively. The above figures have been recognized and
disclosed in the financial statements o f the same period for the investee
companies, which have not been reviewed by CPAs.
Qualified Conclusion
Based on our review and reviews from other CPAs (please see Other
Matters), except for the effects as stated in the paragraph of Basis for Qualified
Conclusion that there would have been adjustments to the financial statements
of the said insignificant subsidiaries and investees accounted for using the
equity method if they had been reviewed by CPAs, we do not find in the said
consolidated financial stat ements, in all material aspects, any violation of the
Regulations Governing the Preparation of Financial Reports by Securities
Issuers, and of IAS 34 Interim Financial Reporting endorsed by the FSC, which
may result in unfairly presenting the consolidated financial status of Nan Pao
Resins Chemical Co., Ltd. and its subsidiaries as of June 30, 2018 and 2017, and
their consolidated financial performance and consolidated cash flows for the
three-month and six-month periods ending on June 30, 2018 and 2017.
Emphasis of Matter
As stated in Note 17 of the Consolidated Financial Statements, Nan Pao
Resins Chemical Co., Ltd. acquired substantial control over Noroo-Nan Pao
Paints & Coatings (Vietnam) Co., Ltd. on April 1, 2017. As the Acquisit ion

Pricing Allocation Report had not been completed, the difference between the
investment cost and net acquisition price was listed under Goodwill as for now.
Subsequently, the Acquisition Pricing Allocation Report was completed in
March 2018; hence, Nan Pao Resins Chemical Co ., Ltd. was requested to restate
Q2 2017 Consolidated Financial Statements, which have been reviewed by us.
The Qualified Conclusion has not been amended based on the
aforementioned matter.
Other Matters
Financial statements of NP Australia Pty Ltd. and i ts subsidiaries, which
have been included in the Consolidated Financial Statements of Nan Pao Resins
Chemical Co., Ltd., have been reviewed by CPAs other than us. Therefore, any
value of such financial statements that we have used to form our conclus ion on
the aforementioned consolidated financial statements is based on other CPAs ’
review reports. The total assets of such subsidiaries are NT$1,336,145 thousand
and NT$1,005,908 thousand on June 30, 2018, and 2017, accounting for 8% and
7% respectively of the consolidated assets. The net operating revenues from
April 1 to June 30, 2018, and 2017, and from January 1 to June 30, 2018, and
2017 are NT$506,625 thousand, NT$463,331 thousand, NT$982,658 thousand,
and NT$902,867 thousand respectively, and each of which accounts for 13% of
the consolidated net operating revenue.
Deloitte & Touche Taiwan
CPA Liao, Hung-Ju
CPA Kung, Chun-Chi
Approval No. from Financial Supervisory
Commission R.O.C. (Taiwan)
No. 0990031652 in FSC
Approval No. from the Securities and Futures
Commission
No. 0920123784 in TWSE
A u g u s t 9 , 2 0 1 8

Nan Pao R es in s Ch emica l C o . , Ltd . an d Su b s id i a r i es
Con so l i d a t ed Fin an c i a l S t a t emen t s
Ju n e 3 0 , 2 0 1 8 , Decemb er 3 1 , 2 0 1 7 , an d Ju n e 3 0 , 20 1 7
Un i t : N T$ 1 ,0 0 0
June 30, 2018 (Reviewed) December 31, 2017
(Audited) June 30, 2017
Res t a t ed an d rev i ewed June 30, 2018 (Reviewed) December 31, 2017
(Audited) June 30, 2017
Res t a t ed an d rev i ewed
C o d e A s s e t S u m % S u m % S u m % C o d e L i a b i l i t i e s a n d S h a r e h o l d e r s ’ E q u i t y S u m % S u m % S u m %
Current assets Current liabilities
1100 Cash and cash equivalents (Note 4 and 6) $ 3,848,651 22 $ 3,866,587 25 $ 4,626,186 31 2100 Short-term loans (Note 21 and 35) $ 1,714,192 10 $ 1,306,649 9 $ 1,572,239 11 1136 Financial assets at amortized cost - current (Note 4 2110 Short-term notes payable (Note 21) 99,938 1 119,923 1 149,807 1
, 8, and 35) 316,453 2 - - - - 2130 Contract liabilities - current (Note 4 and 26) 36,109 - - - - -
1150 Notes receivable (Note 4 and 11) 296,888 2 298,490 2 235,131 2 2150 Notes payable (Note 22) 53,878 - 52,334 - 52,335 - 1170 Accounts receivable (Note 4, 5, and 11) 3,102,829 17 2,653,921 18 2,547,030 17 2170 Accounts payable (Note 22 and 34) 1,963,922 11 1,948,306 13 1,656,987 11
1180 Accounts receivable - related persons (Note 4, 5, 11,
and 34) 341,130 2 331,830 2 367,804 3
2216 Dividends payable
543,104 3 - - 532,455 4 1200 Other receivables (Note 4 and 11) 36,764 - 37,861 - 44,972 - 2219 Other payables (Note 34) 817,776 5 789,681 5 775,125 5
1220 Current income tax assets 20,632 - 19,763 - 40,100 - 2230 Current income tax liabilities 144,041 1 224,170 2 150,797 1
130X Inventory (Note 5 and 12) 2,475,593 14 2,251,781 15 2,011,521 13
2320 Long-term debt maturing within one year (Note 21 and 35) 45,529 - 33,553 - 4,281 -
1412 Prepaid rent (Note 19) 14,787 - 14,044 - 8,927 - 2399 Other current liabilities (Note 23) 174,639 1 32,302 - 60,946 -
1476 Other financial assets - current (Note 4, 10, and 35) - - 263,565 2 126,744 1 21XX Total current liabilities 5,593,128 32 4,506,918 30 4,954,972 33 1479 Other current assets (Note 20) 476,683 3 399,662 3 315,721 2
11XX Total current assets 10,930,410 62 10,137,504 67 10,324,136 69 Non-current liabilities
2540 Long-term debt (Note 21 and 35) 1,624,178 9 1,604,339 11 1,156,809 8 Non-current assets 2570 Deferred income tax liabilities (Note 5) 694,698 4 751,050 5 811,652 5
1517 Financial assets measured at FVTOCI 2640 Net defined benefit liabilities - non-current 172,976 1 179,041 1 230,598 2
non-current (Note 4 and 7) 1,559,529 9 - - - - 2670 Other Non-Current Liabilities (Note 23) 42,649 - 41,999 - 40,582 - 1523 Available-for-sale on financial assets - current
(Notes 4 and 9) - - 183,580 1 183,580 1
25XX Total Non-current Liabilities
2,534,501 14 2,576,429 17 2,239,641 15
1535 Financial assets at amortized cost - non-current (Notes 4, 8, and 35)
55,591 - - - - - 2XXX Total Liabilities 8,127,629 46 7,083,347 47 7,194,613 48
1550 Investments accounterd for using the equity method (Note 14) 283,660 2 278,451 2 263,388 2
1600 Property, Plants & Equipment (Notes 15 and 35)
3,629,571 21 3,346,729 22 2,952,269 20
Equity attributable to shareholders of the Company (Note
25) 1760 Investment property (Note 16) 17,760 - 17,760 - 17,760 - Equity
1805 Goodwill (Note 17) 89,613 - 91,978 1 92,640 1 3110 Ordinary Shares 1,086,207 6 1,086,207 7 1,064,909 7
1821 Other intangible assets (Note 18) 51,729 - 49,301 - 51,283 1 3150 Stock dividends to be distributed - - - - 21,298 - 1840 Deferred income tax assets 244,320 1 247,094 2 190,563 1 3100 Total share capital 1,086,207 6 1,086,207 7 1,086,207 7
1980 Other financial assets - non-current (Notes 4, 10,
and 35) - - 10,221 - 3,619 -
3200 Capital reserve
1,290,212 7 1,290,212 9 1,290,212 9 1985 Prepaid rent - non-current (Note 19) 619,552 4 598,033 4 476,908 3 Retained earnings
1990 Other non-current assets (Note 20) 124,832 1 238,491 1 326,884 2 3310 Statutory Surplus Reserve 988,725 6 900,538 6 900,538 6
15XX Total Non-Current Assets 6,676,157 38 5,061,638 33 4,558,894 31 3320 Special Surplus Reserve 313,321 2 313,321 2 313,321 2 3350 Undistributed earnings 3,878,792 22 4,158,679 27 3,664,341 25
3300 Total Reserved Earnings 5,180,838 30 5,372,538 35 4,878,200 33
3400 Other equity 1,209,138 7 ( 291,717 ) ( 2 ) ( 230,318 ) ( 2 ) 31XX Total Owner’s Equity 8,766,395 50 7,457,240 49 7,024,301 47
36XX Non-controlling Interests 712,543 4 658,555 4 664,116 5
3XXX Total Equity 9,478,938 54 8,115,795 53 7,688,417 52
1XXX Total Assets $17,606,567 100 $15,199,142 100 $14,883,030 100 Total Liabilities and Equity $17,606,567 100 $15,199,142 100 $14,883,030 100
Th e a t t ach ed N ote s a r e p a r t s o f t h i s s e t o f C on so l i d a t ed Fi n an c i a l S t a t em en t s .
(P l ea s e r e f er t o Au d i t Rep or t o f D elo i t t e & Tou ch e on Au gu s t 9 , 2 0 1 8 . )
Ch a i rman : Wu , Ch en g -H s i en Man ager : Hsu , Min g -H s i en A ccou n t in g Man ager : Lin , Ku n -Ch in

Na n P a o R e s i n s C h e m i c a l C o . , Lt d . a n d S u b s id i a r i es
C on s o l i d a t e d C om p r e h e n s i ve B a la n c e S h e e t
Ap r i l 1 t o J u n e 30 , 20 1 8 , an d 2 0 17 , a n d J a nu a r y 1 t o J u n e 30 , 2 01 8 , an d 20 17
( R e v i e we d on l y, n o t a u d i t e d in a c c or d a n c e wi t h ge n e r a l l y a c c e p t e d a ud i t i n g s t an d a r d s )
Un i t : NT$ 1 , 0 0 0
( e x c e p t e a r n in gs p e r s h a r e , wh i c h i s d e n o t e d in NT$ )
January 1, 2018 to June
30, 2018
January 1, 2017 to June
30, 2017
( R e s t a t e d )
January 1, 2018 to June
30, 2018
January 1, 2017 to June
30, 2017
( R e s t a t e d )
C o d e S u m % S u m % S u m % S u m %
4000 Operating revenue (Notes 4, 26,
and 34)
$ 4,073,039 100 $ 3,652,967 100 $ 7,579,886 100 $ 6,886,235 100
5000 Operating cost (Notes 12, 27, and
34)
3,147,058 77 2,680,347 73 5,870,301 77 4,977,110 72
5900 Gross profit 925,981 23 972,620 27 1,709,585 23 1,909,125 28
Operating expenses (Note 27)
6100 Selling expenses 424,426 11 365,673 10 799,291 11 684,433 10
6200 General and administrative
expenses
196,553 5 227,999 6 380,744 5 426,045 6
6300 Research and development expenses
102,674 3 90,076 3 197,116 3 179,468 3
6450 Estimated credit impairment
loss or gain
17,189 - - - 22,220 - - -
6000 Total operating
expenses
740,842 19 683,748 19 1,399,371 19 1,289,946 19
6900 Net operating profit 185,139 4 288,872 8 310,214 4 619,179 9
Non-operating income and
expenses (Notes 14 and 27)
7010 Other income 120,917 3 54,586 1 129,349 2 59,659 1
7020 Other gains and losses 58,249 1 ( 39,446 ) ( 1 ) 32,184 - ( 76,684 ) ( 1 )
7050 Financing cost ( 15,381 ) - ( 12,528 ) - ( 29,247 ) - ( 23,442 ) ( 1 )
7060 Share of the profit or loss of
associates accounted for
using the equity method
5,203 - ( 1,759 ) - 12,709 - 8,362 - 7000 Total Non-operating
Income and
Expenses
168,988 4 853 - 144,995 2 ( 32,105 ) ( 1 )
7900 Pre-tax profit 354,127 8 289,725 8 455,209 6 587,074 8
7950 Income tax expenses (Note 4 and 28)
94,934 2 83,462 3 87,492 1 140,834 2
8200 Net profit of this period 259,193 6 206,263 5 367,717 5 446,240 6
Other comprehensive gain or loss
8310 Items that will not be
reclassified to profit or
loss:
8316 Unrealized valuation
loss (gain) on
investments in an
equity instrument
measured at
FVTOCI
( 547 ) - - - ( 547 ) - - -
8349 Income tax relating to
items that will not be reclassified (Note
28)
- - - - ( 1,727 ) - - -
( 547 ) - - - ( 2,274 ) - - -
8360 Items that may be
reclassified to profit or
loss:
8361 Foreign currency translation
difference
147,928 4 74,564 2 153,947 2 ( 279,107 ) ( 4 )
8399 Income tax relating to
items that may be
reclassified (Notes
28)
( 28,406 ) ( 1 ) ( 12,074 ) - ( 18,047 ) - 46,103 1

119,522 3 62,490 2 135,900 2 ( 233,004 ) ( 3 )
8300 Comprehensive income or loss (net
value after tax) in
this period
118,975 3 62,490 2 133,626 2 ( 233,004 ) ( 3 )
8500 Total Consolidated Profit/Loss for
the Current Period
$ 378,168 10 $ 268,753 7 $ 501,343 7 $ 213,236 3
( C on t i n u e d on t h e n ex t p a ge )

( C on t i n u e d f r om t h e p r e v i ou s p a ge )
April 1, 2018 to June 30,
2018
April 1, 2017 to June 30,
2017
( R e s t a t e d )
January 1, 2018 to June
30, 2018
January 1, 2017 to June
30, 2017
( R e s t a t e d )
C o d e S u m % S u m % S u m % S u m %
Profit attributable to:
8610 Owners $ 251,676 6 $ 196,377 5 $ 353,990 5 $ 427,776 6
8620 Non-controlling Interests 7,517 - 9,886 - 13,727 - 18,464 -
8600 $ 259,193 6 $ 206,263 5 $ 367,717 5 $ 446,240 6
Total comprehensive income attributable to:
8710 Owners $ 364,750 10 $ 255,328 7 $ 476,622 6 $ 202,687 3
8720 Non-controlling Interests 13,418 - 13,425 - 24,721 1 10,549 -
8700 $ 378,168 10 $ 268,753 7 $ 501,343 7 $ 213,236 3
Earnings per share (Note 29)
9710 Base $ 2.32 $ 1.85 $ 3.26 $ 4.04 9810 Diluted $ 2.31 $ 1.84 $ 3.25 $ 4.01
Th e a t t a c h e d Not e s a r e p a r t s of t h i s s e t o f C on s o l i d a t e d F i n a n c i a l S t a t e m e n t s .
( P le a s e r e fe r t o Au d i t R e p or t o f De l o i t t e & Tou c h e on Au gus t 9 , 2 0 18 . )
C h a i r m a n : Wu , C h e n g-Hs i e n M a n a ge r : Hs u , M i n g -Hs i e n Ac c o u n t in g M a n a ge r : Li n , Ku n -C h i n

Na n P a o R e s i n s C h e m i c a l C o . , Lt d . a n d S u b s id i a r i es
C on s o l i d a t e d S t a t e m e n t o f C h a n ge s i n Eq u i t y
J a n u a r y 1 t o J u n e 3 0 , 2 01 8 and 2 01 7
( R e v i e we d on l y, n o t a u d i t e d in a c c or d a n c e wi t h ge n e r a l l y a c c e p t e d a ud i t i n g s t an d a r d s )
Un i t : NT$ 1 , 0 0 0
( e x c e p t e a r n in gs p e r s h a r e a nd s h a r e i s s u a n c e p r i c e , wh i c h a re d e n o t e d in NT$ )
E q u i t y a t t r i b u t a b l e t o o w n e r s
C a p i t a l R e t a i n e d e a r n i n g s O t h e r E q u i t y
C o d e
C a p i t a l f r o m
c o m m o n s t o c k
Stock dividends to
b e d i s t r i b u t e d C a p i t a l r e s e r v e
Statutory Surplus
R e s e r v e
S p e c i a l S u r p lu s
R e s e r v e
U n d i s t r i b u t e d
e a r n i n g s
Overseas Operations
on translat ion of
foreign operations’
financial statements
F i n an c i a l as se t s m e a s u r e d a t
F V T O C I
Unrealized gain or
l o s s S u b t o t a l T o t a l
Non -c on t r o l l i n g
I n t e r e s t s T o t a l E q u i t y
A1 Balance as of January 1, 2018 $ 1,086,207 $ - $ 1,290,212 $ 900,538 $ 313,321 $ 4,158,679 ( $ 291,717 ) $ - ( $ 291,717 ) $ 7,457,240 $ 658,555 $ 8,115,795
A3 Impact of retrospective application (Note 3) - - - - - - - 1,376,496 1,376,496 1,376,496 - 1,376,496
A5 Adjusted balance as of January 1, 2018 1,086,207 - 1,290,212 900,538 313,321 4,158,679 ( 291,717 ) 1,376,496 1,084,779 8,833,736 658,555 9,492,291
Appropriation of net income in 2017 (Note 25)
B1 Statutory Surplus Reserve - - - 88,187 - ( 88,187 ) - - - - - -
B5 Cash dividend - NT$5 per share - - - - - ( 543,104 ) - - - ( 543,104 ) - ( 543,104 )
D1 Net income from January 1 to June 30, 2018 - - - - - 353,990 - - - 353,990 13,727 367,717
D3 Other comprehensive income after tax from January
1, 2018, to June 30, 2018
- - - - - ( 1,727 ) 124,906 ( 547 ) 124,359 122,632 10,994 133,626
D5 Total comprehensive income from January 1, 2018,
to June 30, 2018
- - - - - 352,263 124,906 ( 547 ) 124,359 476,622 24,721 501,343
M5 Differences from book value in acquisition of shares
from subsidiaries (Note 31)
- - - - - ( 859 ) - - - ( 859 ) ( 806 ) ( 1,665 )
O1 Increase in non-controlling interests - - - - - - - - - - 30,073 30,073
Z1 Balance as of June 30, 2018 $ 1,086,207 $ - $ 1,290,212 $ 988,725 $ 313,321 $ 3,878,792 ( $ 166,811 ) $ 1,375,949 $ 1,209,138 $ 8,766,395 $ 712,543 $ 9,478,938
A1 Balance as of January 1, 2017 $ 1,034,909 $ - $ 778,977 $ 768,016 $ 313,321 $ 3,902,903 ( $ 5,229 ) $ - ( $ 5,229 ) $ 6,792,897 $ 337,219 $ 7,130,116
Appropriation of net income in 2016 (Note 25) B1 Statutory Surplus Reserve - - - 132,522 - ( 132,522 ) - - - - - -
B5 Cash dividend - NT$5 per share - - - - - ( 532,455 ) - - - ( 532,455 ) - ( 532,455 )
C13 Distribution of capital surplus stock dividend -
NT$0.2 per share (Note 25)
- 21,298 ( 21,298 ) - - - - - - - - -
D1 Net profit from January 1, 2017 to June 30, 2017 - - - - - 427,776 - - - 427,776 18,464 446,240
D3 Other comprehensive income after tax from January
1, 2017, to June 30, 2017
- - - - - - ( 225,089 ) - ( 225,089 ) ( 225,089 ) ( 7,915 ) ( 233,004 )
D5 Total comprehensive income from January 1, 2017,
to June 30, 2017
- - - - - 427,776 ( 225,089 ) - ( 225,089 ) 202,687 10,549 213,236
E1 Capital increase on June 16, issued at NT$180 per share (Note 25)
30,000 - 510,000 - - - - - - 540,000 - 540,000
M5 Differences from book value in the acquisition of
shares from subsidiaries (Note 31)
- - - - - ( 1,361 ) - - - ( 1,361 ) ( 4,630 ) ( 5,991 )
M7 Changes in shares in the subsidiaries (Note 31) - - 22,533 - - - - - - 22,533 ( 22,533 ) -
O1 Increase in non-controlling interests - - - - - - - - - - 343,511 343,511
Z1 Balance as of June 30, 2017 $ 1,064,909 $ 21,298 $ 1,290,212 $ 900,538 $ 313,321 $ 3,664,341 ( $ 230,318 ) $ - ( $ 230,318 ) $ 7,024,301 $ 664,116 $ 7,688,417
Th e a t t a c h e d Not e s a r e p a r t s of t h i s s e t o f C on s o l i d a t e d F i n a n c i a l S t a t e m e n t s .
( P le a s e r e fe r t o Au d i t R e p or t o f De l o i t t e & Tou c h e on Au gus t 9 , 2 0 18 . )
C h a i r m a n : Wu , C h e n g -Hs i e n M a n a ge r : Hs u , M i n g -Hs i e n Ac c o u n t in g M a n a ge r : Li n , Ku n -C h i n

Nan Pao Resins Chemical Co., Ltd. and Subsidiar ies
Consol idated Cash Flow Statement
January 1 to June 30, 2018, and 2017
(Reviewed only, not audited in accordance with general ly accepted audit ing standards)
Unit : NT$1,000
C o d e
January 1, 2018
to June 30, 2018
January 1, 2017
to June 30, 2018
( R e s t a t e d )
Cash flow from operating activities
A10000 Current net profit before tax $ 455,209 $ 587,074
A20010 Gains and Losses:
A20100 Depreciation 132,438 111,400
A20200 Amortization 14,000 10,378
A20300 Estimated credit impairment loss or gain 22,220 -
A20300 Bad debt expenses - 5,448
A20900 Interest expenses 29,247 23,442
A21200 Interest income ( 17,226 ) ( 9,260 )
A21300 Dividend income ( 98,176 ) ( 45,864 )
A22300 Share of the profit and loss of associates
accounted for using the equity
method
( 12,709 ) ( 8,362 )
A22500 Loss on disposal of properties, plants,
and equipment
1,131 4,082
A23200 Loss of investments on disposal of
assets using the equity method
- 17,268
A23700 Allowance for inventory valuation and
obsolescence loss
22,159 43,474
A29900 Compensation paid - 34,715
A30000 Net variable in operational assets/liabilities
A31130 Notes receivable 1,608 23,514
A31150 Accounts receivable ( 410,591 ) 14,157
A31160 Accounts receivable - stakeholders 30,153 54,022
A31180 Other receivables from subsidiaries 2,694 ( 10,892 )
A31200 Inventory ( 226,356 ) ( 266,083 )
A31240 Other current assets ( 81,642 ) 53,568
A31990 Other non-current assets 64 ( 6,080 )
A32125 Contract liabilities 13,326 -
A32130 Notes payable ( 9,246 ) ( 26,911 )
A32150 Accounts payable 1,563 ( 84,196 )
A32180 Other payables 56,760 ( 47,691 )
A32230 Other Current Liabilities 87,590 14,188
A32240 Net defined benefit liabilities ( 6,065 ) ( 4,639 )
A32990 Other noncurrent liabilities ( 76 ) ( 10,095 )
A33000 Cash flow from operating activities 8,075 476,657
A33100 Interest income received 16,154 9,025
A33300 Interest Paid ( 29,105 ) ( 25,319 )
A33500 Income Tax Paid ( 241,842 ) ( 158,283 )
AAAA Net cash inflow (outflow) from
operating activities
( 246,718 ) 302,080
(Continued on the next page)

(Continued from the previous page)
C o d e
January 1, 2018
to June 30, 2018
January 1, 2017
to June 30, 2018
( R e s t a t e d )
Cash flow from investment activities
B00040 Acquisition of financial assets measured at
amortized cost
( $ 98,174 ) $ -
B00050 Disposal of financial assets measured at
amortized cost
51,308 -
B00300 Acquisition of available-for-sale financial
assets
- ( 20,000 )
B01800 Acquisition of shares in subsidiaries ( 1,665 ) ( 5,991 )
B02200 Acquisition of net cash inflow from
subsidiaries
- 66,258
B02700 Purchase of property, plant and equipment ( 330,275 ) ( 414,292 )
B02800 Disposition of PPE 11,814 9,529
B03700 Increases in refundable deposits ( 1,067 ) ( 3,429 )
B03800 Decreases in refundable deposits 2,125 348
B04500 Purchased intangible assets ( 9,760 ) ( 1,580 )
B06500 Increases in other financial assets - ( 44,755 )
B06600 Decreases in other financial assets - 66,967
B07300 Increases in prepaid rent - ( 42,543 )
B07600 Dividends received 105,234 53,364
BBBB Net cash flow from investing activities
(out)
( 270,460 ) ( 336,124 )
Cash from from financing activities
C00100 Increases in short-term loans 2,275,401 2,949,713
C00200 Decreases in short-term loans ( 1,873,029 ) ( 3,080,560 )
C00500 Increases in short-term notes and bills
payable
199,612 299,371
C00600 Decreases in short-term notes and bills
payable
( 219,597 ) ( 299,450 )
C01600 Long-term loans borrowed 181,622 965,678
C01700 Long-term loans repaid ( 154,111 ) ( 958,719 )
C03000 Increases in guarantee deposits 1,024 399
C03100 Decreases in guarantee deposits ( 323 ) ( 709 )
C04600 Capital cash increase - 540,000
C05800 Changes in non-controlling equity 30,073 223,837
CCCC Net cash inflow from financing
activities
440,672 639,560
DDDD Impacts on cash and cash equivalents from
changes in exchange rates
58,570 ( 256,410 )
EEEE Increases (decreases) in cash and cash equivalents ( 17,936 ) 349,106
E00100 Cash and cash equivalents at the beginning of the
year
3,866,587 4,277,080
E00200 Cash and cash equivalents at the end of the year $ 3,848,651 $ 4,626,186
The at tached Notes are parts of this set of Consolidated Financial Statements.
(Please refer to Audit Report of Deloi t te & Touche on August 9, 2018.)

Chairman: Wu, Cheng-Hsien Manager: Hsu, Ming -Hsien Accounting Manager: Lin, Kun -
Chin

Nan Pao Resins Chemical Co., Ltd. and Subsidiaries
Consolidated Financial Report
January 1 to June 30, 2018, and 2017
(Reviewed only, not audited in accordance with generally accepted audit ing
standards)
(In NT$ ‘000, unless otherwise specified)
I. Company History
Nan Pao Resins Chemical Co., Ltd. (hereinafter called "Nan Pao" or "the
Company") was founded in October 1963, and our main business concerns
the manufacturing, wholesale, and retail of synthetic resins, synthetic
plastics, adhesives, resin coatings, dyes, and pigments.
The Company was permitted to undertake public share issuance in May
2017, and in July of the same year, the Company ’s shares can be traded
and sold as an emerging stock at the Taipei Exchange (GreTai Securities
Market).
The Consolidated Financial Report will be shown in New Taiwan Dollars
(NT$), the Company’s functional currency.
II. Date and procedures of the passage of the Financial Report
The Consolidated Financial Statements were released on August 9, 2018,
after being approved by the Board of Directors.
III. Applicabil ity of New Announcements and Standards and Interpretations of
Amendments
(I) The first application of the amended Regulations Governing the
Preparation of Financial Reports by Securities Issuers and the
International Financial Reporting Standards (IFRS), International
Accounting Standards (IAS), the International Financial Reporting
Interpretations Committee (IFRIC), and the Standard
Interpretations Committee (SIC) (hereinafter called "IFRSs")
endorsed by the Financial Supervisory Commission (hereinafter
called "FSC").
With the exception of the following, the applicabili ty of the
aforementioned revised Regulations Governing the Preparation of

Financial Reports by Securities Issuers and the IFRSs endorsed and
announced by the FSC should not result in major changes to the
accounting policies of the Company:
1. IFRS 9 "Financial Instruments" and related amendments
IFRS 9 - "Financial Instruments” supersedes IAS 39
“Financial Instruments: Recognition and Measurement” and
several requirements of IFRS 7 “Financi al Instruments:
Disclosures” are amended. New requirements of IFRS 9 cover
the classification, measurement, impairment of financial
assets, and the general hedge accounting. Please refer to Note
4 for related accounting policies.

Measurement Types, Valuat ion, and Impairment of Financial
Assets
Based on existing facts and conditions on January 1, 2018, the
Company has made restatements on the measurement types of
existing financial assets and chosen not to restate the
comparison period. Bellow summarizes me asurement types as
determined by IAS 39 and IFRS 9, the carrying amount and
changes therein of the various financial assets as of January
1, 2018:
T y p e s o f m e a s u r e m e n t A t b o o k v a l u e
Category of Financial
A s s e t s IAS 39 IFRS 9 IAS 39 IFRS 9 Details
Cash and cash
equivalents
Loans and accounts
receivable
Measured at amortized cost
(check)
$ 3,866,587 $ 3,866,587 (2)
Investment in stocks Available-for-sale
financial assets
Investments in equity
instruments measured at
FVTOCI
183,580 1,560,076 (1)
Bank time deposit with
the original maturity
date over 3 months
Loans and accounts
receivable
Measured at amortized cost
(check)
273,037 273,037 (2)
Restricted bank
deposits
Loans and accounts
receivable
Measured at amortized cost
(check)
749 749 (2)
Notes receivables,
accounts
receivables, and
other receivables
Loans and accounts
receivable
Measured at amortized cost
(check)
3,322,102 3,322,102 (2)
Refundable deposit Loans and accounts
receivable
Measured at amortized cost
(check)
49,285 49,285 (2)
2 0 1 8
J a n u a r y 1
At book value
( I A S 3 9 )
Reclassificati
o n
Revaluat ion
2 0 1 8
J a n u a r y 1
At book value
( I F R S 9 )
2 0 1 8
J a n u a r y 1
Other equity
I m p a c t
Details
Financial assets measured at
FVTOCI - equity
instrument
Add: Reclassification of
available-for-sale
financial assets (IAS
39)
$ -
$ 183,580
$ 1,376,496
(1)
- 183,580 1,376,496 $ 1,560,076 $ 1,376,496
Financial assets measured at
amortized cost
Add: Reclassification of
loans and receivables
(IAS 39)
-
7,511,760
-
(2)
- 7,511,760 - 7,511,760 -
$ - $ 7,695,340 $ 1,376,496 $ 9,071,836 $ 1,376,496
(1) As the equity investments classified as financial assets
available-for-sale under IAS 39 were not held for trading,
the Company has chosen to reclassify the entire sum as
Financial assets measured at FVTOCI based on IFRS 9.
In particular, for the unlisted stock investments
originally measured at cost by IAS 39, are classified as

financial assets measured at FVTOCI based on IFRS 9,
and should be re-measured at fair value. Therefore, the
Company’s financial assets and other equity, measured at
fair value through other comprehensive income, have
increased by NT$1,376,496,000 through the adjustment
of unrealized income from financial assets measured at
FVTOCI on January 1, 2018.
(2) Cash and cash equivalents, accounts receivabl e, accounts
payable, other receivables, other financial assets, and
refundable deposits, which were classified as loans and
receivables under IAS 39, are now classified as financial
assets measured at amortized cost under IFRS 9 and will
be evaluated for expected credit loss.
2. IFRS 15 “Revenue from Customer Contracts” and related
amendments
IFRS 15 st ipulates the principle of recognition of revenue
from customer contracts. The guideline will replace IAS 18
"Income" and IAS 11 "Construction Contract ," and related
interpretations. Please see Note 4 for relevant accounting
policies.
The net result of revenue recognized and amounts received
and receivables would be recognized as contract assets
(liabilit ies). Prior to the application of IFRS 15, contracts
under IAS 18 recognize the decrease in receivables or advance
receipts upon revenue recognition.
Discount on sales that may occur is recognized as a refund
liability when the income is recognized (other current
liabilities are accounted for). Before adopti on of IFRS 15, this
was only recognized as a deduction from accounts receivable.
The Company has chosen to undertake retrospective
adjustment for IFRS 15 for contracts not completed by
January 1, 2018. Relevant accumulated impacts will be
adjusted to the retained earnings as of January 1, 2018.

Current Effects on Assets and Liabilities
2 0 1 8
J a n u a r y 1
Amount Before
Res t a t e men t
Adjustment to
F i r s t - t i m e
A d o p t i o n
2 0 1 8
J a n u a r y 1
Amount After
Res t a t e men t
Accounts receivable $ 2,653,921 $ 37,112 $ 2,691,033
Accounts receivable -
stakeholders
331,830 40,411 372,241
Effects on Assets $ 2,985,751 $ 77,523 $ 3,063,274
Other Current Liabilities $ 32,302 $ 54,740 $ 87,042
Provision - Current - 22,783 22,783
Effects on Liabilities $ 32,302 $ 77,523 $ 109,825
(II) The Regulations Governing the Preparation of Financial Reports by
Securities Issuers and IFRSs endorsed by FSC for application
starting 2018
New announcements/revisions/standards and
i n t e r p r e t a t i o n s o f a m e n d m e n t s
E f f e c t i v e D a t e o f
Publication by IASB
( N o t e 1 )
"Annual Improvements cycle 2015-2017" On January 1st, 2019
Amendments to IFRS 9, "Prepayment Features with
Negative Compensation"
January 1, 2019 (Note
2)
IFRS 16 "Leases" On January 1st, 2019
Amendments to IAS 19 in "Plan Amendment,
Curtailment, or Settlement"
January 1, 2019 (Note
3)
‘Long-term Interests in Associates and Joint
Ventures (Amendments to IAS 28)’
On January 1st, 2019
IFRIC 23 "Uncertainty over Income Tax
Treatments"
On January 1st, 2019
Note 1: Unless otherwise stated, the aforementioned New
Publication/Amendment/ Standards and Interpretations of
Amendments are effective from the fiscal year after
specified dates.
Note 2: FSC allows the Company to elect an earlier application
of such amendments beginning on or after January 1, 2018.
Note 3: Plan amendments, curtailment, or sett lement occurring
after January 1, 2019, shall be applicable to this amendment.
1. IFRS 16 "Leases"

IFRS 16 stipulates accounting treatments for leases and will
supersede IAS 17 “Leases” and related interpretations.
Definition of "Leases"
For the first-t ime application of IFRS 16, the Company will
choose whether to conform to (or include) the lease based on
IFRS 16 for the contract signed or changed after January 1,
2019. Contracts currently considered to be leasing contracts
according to IAS 17 and IFRIC 4 will not be re -evaluated and
will be processed in accordance with the transitional
provisions of IFRS 16.
The Company is the lessee.
For the first-time application of IFRS 16, except for the low -
value target asset leases and short -term leases, the leases are
recognized on a straight -l ine basis, and other leases will
recognize the right -of-use assets and lease l iabilities on the
Consolidated Balance Sheet. The Consolidated Statements of
Comprehensive Income will state clearly and separately the
depreciation expense of the right -of-use assets and the
interest expenses accrued on the lease liabilities. The interest
should be calculated using the effective rate method. On the
Consolidated Statements of Cash Flows, cash payments for
the principle of lease liabilities will be classified under
financing activities, whereas cash payments for interest of
lease liabilities will be classified under operating activities.
Prior to the application of IFRS 16, expenses for contracts
classified as operating leases were recognized through a
straight-l ine basis, and leases prepaid for obtaining the right -
of-use for land were recognized as prepaid rent. Cash flow
from operating leases is shown in operating activities on the
Consolidated Statement of Cash Flow. Contracts classified as
financing leases were recognized as rental assets and rent
payable on the Consolidated Balance Sheet.

The Company is expected to adjust the cumulative impact of
the retroactive application of IFRS 16 to the retained earnings
on January 1, 2019, without recompiling the comparative
information.
Current agreements processed as operating rental contracts
under IAS 17 will be discounted by the remaining lease
payments at the increase borrowing rate of the lessee on
January 1, 2019. All right -of-use assets will be measured as
lease liabilit ies on that day (and the amount of the prepaid or
rent payable previously recognized will be adjusted). Except
for the following practical expedients, the recognized right -
of-use assets will be subject to IAS 36 assessment impairment.
The Company is expected to adopt the following practical
expedients:
(1) A single discount rat e is used to measure the lease liability
for a lease combination with reasonably similar
characteristics.
(2) The lease contract liabili ties recognized at the end of 2018
will be adjusted for the right -of-use assets as of January
1, 2019, and will not be assessed for impairment
according to IAS 36.
(3) Leases that are closed before December 31, 2019, will be
treated on a short -term lease basis.
(4) The original direct cost is not included in the measurement
of the right-of-use assets on January 1, 2019.
(5) When measuring the lease l iabilities, after sight will be
used for decisions on the lease term.
For the leases classified as finance leases under IAS 17, the
carrying amount of the lease assets and lease l iabilities on
December 31, 2018, will be used as the carrying amount of
the right-of-use assets and lease l iabilities on January 1, 2019.
The Company is the lessor.

No adjustments will be made to the lessor ’s leases during the
transition and IFRS 16 will be applied from January 1, 2019.
2. Amendments to IAS 19 in "Plan Amendment, Curtailment or
Settlement"
The amendment provides that when the plan is amended,
curtailed, or settled, the current service cost and net interest
for the remainder of the year shall be determined on the basis
of the actuarial assumptions used to re -measure the net
defined benefit liabil ities (assets). In addition, the amendment
clarifies the plan’s amendment, curtailment, or settlement ’s
impact on the asset cap-related regulations. The Company will
defer the application of the aforementioned amendments.

Except for the aforementioned impact, as of the date of
authorization of the consolidated financial statements, the
Company has continued to assess the effects of amendments to
other standards and interpretations on financial status and
performance. Related effects will be disclosed upon completion of
the assessment.
(3) IFRSs issued by the IASB but not yet approved by the FSC and have
entered into effect
New announcements/revisions/standards and
i n t e r p r e t a t i o n s o f a m e n d m e n t s
E f f e c t i v e D a t e o f
Publication by IASB
( N o t e )
Amendments to IFRS 10 and IAS 28 in "Sale or
Contribution of Assets between an Investor and its
Associate or Joint Venture"
To be determined
IFRS17 “Insurance Contracts” January 1, 2021
Note: The aforementioned new, revised or amended standards or
interpretations are effective for annual periods beginning on
or after the effective dates unless stated otherwise.
After the passage of the Consolidated Financial Report, the
Company will continue to assess the impact of the revision of other
standards and interpretations on the financial condition and
performance. The related impact will be disclosed on the
completion of the assessment.
IV. Description of Significant Accounting Policies
(I) Statement of Compliance
The Consolidated Financial Report is formulated in accordance
with the Regulations Governing the Preparation of Financial
Reports by Securities Issuers and IFRSs recognized and announced
by the FSC that have entered into effect . The Consolida ted
Financial Statements does not include all IFRSs disclosure
information required for the Annual Report.
(II) Basis of Preparation
In addition to assessment of financial instruments based on their
fair value and the present value of defined benefit assets minus net

defined benefit liabili ties recognized at fair value, the
Consolidated Financial Report is prepared based on historical c osts.
The fair value assessment is categorized into three levels of inputs
based on the observability and importance of the related input:
1. Level 1 input value: The quoted prices (unadjusted) of similar
instruments available in the market for the same cl ass of
assets or liabilities on the day of assessment.
2. Level 2 input value: It refers to market inputs other than Level
1 inputs as directly observable (i.e. , the price) or indirectly
observable (i.e. , deduced from the price) assets or l iabilities.
Level 3 input value: It refers to inputs based not on observable
assets or liabilities.
(IV) Basis of the Merger
The Consolidated Financial Report includes the financial reports
of the Company and its wholly-owned subsidiaries. The financial
reports of subsidiaries have been reorganized to bring uniformity
in their accounting policies and those of the Company. In the
Consolidated Financial Report, all transactions, account balances,
income, and expenses between the entities have been written off.
The comprehensive income of a subsidiary belongs to the owners
of the Company as also its non-controlling interests, even its
liabilities.
When a change is effected in the ownership of the subsidiary, the
Company does not lose control of it , and i t will be treated a s equity
transactions. The carry-forward amounts of the Company and its
non-controll ing interests have been adjusted to reflect the relative
changes in the interest of the subsidiaries. The difference between
the adjusted amount in non-controlling interest and the fair value
of consideration will be considered as interest belonging to the
owners of the Company.
Please refer to Note 13 and Table 6 and 7 for details , shareholding
ratio, and business i tems of subsidiaries.

(4) Other Material Accounting Policies
In addition to the financial instruments and income recognition
related accounting policies and the following statements, please
refer to the Summary of Material Accounting Policies for the 2017
Consolidated Financial Statements.
1. Financial instruments
Financial assets and liabilities will be recognized in the
consolidated balance sheet when the Company becomes a
party to the contract of the financial instrument.
While recognizing the financial assets and liabilities, if their
fair value cannot be evaluated based on profit or loss, it will
be the fair value plus the cost of the transaction directly
attributable to its acquisition or of financial assets or
liabilities. The transaction costs attributable to these assets or
liabilities have to be shown as gain or loss.
(1) Financial assets
Regular trading in financial assets will be effective as
per the rules of trading account.
1. Measurement category
2018
The financial assets held by the Company are financial
assets measured at amortized cost and equity
instrument investments measured at fair value through
other comprehensive income.
a. Financial assets measured at amortized cost
When the Company’s investments in financial assets
satisfy the following two conditions simultaneously,
they are classified as financial assets measured at
amortized cost:
(a) Held under a certain business model of which
the objective of holding the financial assets is to
collect contractual cash flows; and
(b) The cash flows on specific dates that are

generated from the contractual terms of the
financial assets are solely payments of the
principal and interest on the principal amount
outstanding.
After initial recognition, the total book value of the
financial assets measured by amortized cost
(including cash and cash equival ents, receivables
measured at amortized cost, other receivables, and
debt instrument investments), is measured at
amortized cost after deducting any impairment loss
through the effective interest method. Any foreign
currency exchange gain and loss are reco gnized as
profit or loss.
Except for the following two circumstances, interest
revenue is calculated at the value of effective
interest rate times the gross carrying amount of
financial assets:
a) For purchased or originated credit -impaired
financial assets, interest revenue is calculated by
applying the credit -adjusted effective interest
rate to the amortized cost of the financial assets.
b) For financial assets that are not purchased or
originated credit -impaired but subsequently have
become credit -impaired, interest revenue is
calculated by applying the effective interest rate
to the amortized cost balance of such financial
assets.
Cash equivalents include time deposits with
maximum maturity of 3 months, which are highly
liquid, and can be converted into a fixed amount of
cash at any t ime and fixed deposits and banker ’s
acceptances with a relatively low risk in price

changes, are used for satisfying short -term cash
commitments.
b. Investments in equity instruments measured at
FVTOCI
The Company may, at init ial recognition, make an
irrevocable election to designate an equity
instrument that is neither held for trading nor
contingent consideration arising from a business
combination to be measured at FVTOCI.
Investments in an equity instrument measured at
FVTOCI are measured at fair value, and any
subsequent fair value changes are recognized in
other comprehensive income and accumulated in
other equity. Upon disposal, cumulative gain or loss
is directly transferred to retained earnings and are
not reclassified to profit or loss.
Dividends of investments in equity instruments
measured at FVTOCI are recognized in profit or loss
when the Company’s right to receive payment is
established unless such dividends clearly represent
the recovery of a part of the inves tment cost.
2017
Financial assets of the Company are available -for-sale
financial assets, loans, and accounts receivable.
a. Available-for-sale financial assets
Available-for-sale financial assets are non -
derivative financial assets that are designated as
available for sale, uncategorized into loans and
accounts receivable, held-to-maturity investments,
or at fair value through profit or loss.
These assets are measured at fair value; changes in
the carrying amount of these assets that have profit
or loss in foreign currencies, interest income

derived on the basis of effective interest method,
and dividends from available -for-sale equity
investments are recognized in profit or loss account.
Changes in the carrying amount of the remaining
available-for-sale financial assets are recognized in
other consolidated profit and loss accounts,
reclassified as profit or loss on the disposal of the
investment or on the determination of the
impairment.
The dividend proceeds from the sale of equity
interest are recognized when the rights of the
Company are identified.
If the available-for-sale financial assets are equity
instruments that are not quoted in an active market
and whose fair value cannot be reliably measured,
the subsequent measurement will be evaluated at
cost after deducting impairment loss. The difference
between the carrying amount and the fair value will
be recognized in the other comprehensive profit and
loss when financial assets are later assessed at fair
value. Any impairment has to be recognized in
profit or loss account.
b. Loans and Receivables
Loans and receivables (including cash and cash
equivalents, accounts receivable, debt instruments
not actively traded, refundable deposits, and other
financial assets) have to be measured at amortized
cost after deducting impairment loss through the
effective interest method unless the interest on
short-term account receivable is immaterial.
Cash equivalents include time deposits with
maximum maturity of 3 months, which are highly
liquid, and can be converted into a fixed amount of

cash at any t ime and fixed deposits and banker ’s
acceptances with a relatively low risk in price
changes, are used for satisfying short -term cash
commitments.
B. Impairment of financial assets
2018
The impairment loss of financial as sets (including
accounts receivable) measured by the Company on the
Balance Sheet date is based on the estimated amortized
cost on each balance sheet date.
Accounts receivable are recognized for al lowance loss
based on expected credit loss during the durat ion of
the period. For other debt instrument investments,
whether credit risk has significantly increased since
initial recognition will be evaluated. A loss allowance
for the 12-month expected credit loss is required if the
credit risk has not increased s ignificantly after initial
recognition, and a loss allowance for the full lifetime
expected credit loss is required if the credit risk has
increased significantly after initial recognition.
The expected credit loss is the weighted average of
credit loss with the respective risk of a default
occurring as the weightings. The 12 -month expected
credit loss represents the expected credit loss that
results from those possible default events on the
financial instrument within 12 months after the
reporting date, whereas the full lifetime expected
credit loss represents the expected credit loss that
results from all possible default events over the life of
the financial instrument.
The impairment loss on all financial assets is
accounted for by reducing the carryin g amount of the
allowance account.

2017
The Company assesses at each balance sheet date
whether there is any objective evidence that a
financial asset other than the ones at fair value through
profit or loss is impaired. A financial asset is deemed
to be impaired if there is objective evidence of
impairment as a result of single or multiple events that
have occurred after the initial recognition of the asset
and the events have a negative impact on the estimated
future cash flows of the financial assets.
For financial assets measured at amortized cost, such
as accounts receivable, if there is no objective
evidence of impairment exists for an individually
assessed financial asset , they shall be collectively
assessed for impairment. Evidence of objective
impairment of the collective existence of receivables
may include past experience of the Company ’s
collections and observable changes in the national or
regional economic situation associated with the
arrears of receivables.
The impairment loss in financial ass ets after
amortization is measured as the difference between the
asset’s carrying amount and the discounted present
value of estimated future cash flows of the original
effective interest rate on the financial assets.
The decrease in the impairment loss of amortized
financial assets is objectively determined as related to
that which occurred after the impairment. Then the
previously recognized impairment loss is either
directly or by adjusting the allowance account for
reversal recognized as profit or loss. Of course,
provided the reversal of the carrying amount of the
financial assets does not exceed the amortized cost of

the financial assets in the event of an impairment loss
not reported as of the reversal date.
When the fair value of the available -for-sale equity
investment is lower than its cost and if there is a
substantial or persistent decline, it is evidence of
objective impairment.
Other objective evidence of impairment of financial
assets includes significant financial difficulties of the
issuer or the debtor, breach of contract (e.g. delay or
non-payment of interest or principal), the increased
likelihood of a debtor going bankrupt or seeking
financial reorganization, or the disappearance of the
financial asset from the market due to financial
difficulties.
The amount of accumulated loss originally recognized
as other comprehensive profit and loss will be
reclassified as profit or loss when the available -for-
sale financial assets are impaired.
Impairment loss of an investment in an equity
instrument recognized in profit or loss account cannot
be reversed through profit or loss. Any increase in the
fair value after recognition of impairment loss has to
be recognized in other comprehensive profits and
losses.
For financial assets assessed at cost , the amount of
impairment loss is measured as the difference between
the asset ’s carrying amount and the discounted present
value of the estimated future cash flows at the similar
market rate of return of financial assets. Such
impairment loss will not be reversed in subsequent
periods.
All impairment loss of financial assets is directly
deducted from the carrying amount of financial assets.

However, the carrying amount of accounts receivable
is reduced through the use of an allowance account.
When it is determined a receivable is not collectible,
it is written off via the allowance account. Receivables
that have been written off and subsequently collected
would be recorded as credits to the allowance account.
Except for written-off because the receivable is not
collectible, changes in the carrying amount of the
allowance account shall be recognized in profit or loss.
C. Derecognition of financial assets
The Company derecognizes the financial assets when
the contractual rights to the cash inflow from the
assets expire or when the Company transfers all the
risks and rewards of ownership of the financial assets
to other enterprises substantially.
When derecognizing an entire financial asset , the
difference in the accumulated interest or loss between
the nominal value and the additional consideration
collected that has been recognized in other
comprehensive profits and losses has to be recognized
in the profit or loss account. Since 2018, after
amortization, when the financial assets are measured
by the total cost, the difference between the carrying
amount and the consideration received is recognized
in profit or loss. When the Company ’s equity
instruments are measured at fair value through other
comprehensive gain and loss, the accumulated profit
or loss is transferred directly to retained earnings and
is not reclassified to profit or loss.
(2) Financial liabilities
A. Subsequent assessment
Financial liabilities are measured at amortized cost by
the effective interest method.

B. Derecognition of financial liabilities
When derecognizing financial liabilities, the
difference between its nominal value and the paid
consideration (including any transferred non -cash
assets or liabil ities) is to be recognized in the profit
or loss account.
2. Revenue recognition
2018
After the Company has identifies the performance obligation,
the Company distributes the transaction price to each
performance obligation and recognizes the income when the
performance obligations are met.
Product sales revenue
Product sales revenue comes from sales of adhesives and
coatings. For the adhesives and coatings, at the time when
terms of trade are fulfilled or the trading counterparty has
inspected and accepted the goods, the client has already
obtained the rights to establish the price and usage of the
goods and is primarily liable for the resell of the goods and
will undertake the related product obsolescence risk; the
Company will recognize revenue and accounts receivable at
that t ime. Advance payments are recognized as contract
liabilities before the terms of trade of the products are
fulfilled.
When supplying materials for processing, control of the
processed goods is not transferred, in which case it is not
recognized as revenue.
2017
Revenue is assessed at the fair value of the received or
receivable consideration and deducted by the estimated return
or discounts for customers and other similar discounts. The
recognition of the return on sales is based on past experience

and other factors that could reasonably provide an estimation
of the future return.
(1) Sale of goods
Revenue from sale of goods is recognized when the
following conditions are satisfied:
A. The Company has transferred significant risks and
returns of ownership to the buyer;
B. The Company has not controlled any activities and
also has not maintained effective control over the
goods sold;
C. The amount of revenue can be reliably assessed;
D. Economic benefits related to the transactions will
likely flow to the Company; and
E. Costs related to transactions, whether incurred or
anticipated can be reliably assessed.
When supplying material for processing, the significant
risk and rewards of ownership of the processed goods are
not transferred, in which case sales processing is not
undertaken at the time.
(2) Dividend and interest income
Dividend income from investments is recognized when
the shareholders’ rights to collect payments are
established.
Interest income is recognized on an accrual basis based
on the outstanding principal and the applicable effective
interest rate.
3. Pension Benefit in Defined Benefit Plan
The pension cost for the interim period is calculated based on
the actuarial cost ratio determined by the actuarial calculation
at the end of the previous year. Calculation term is from the
beginning of the period to the end of the period, and
adjustments, a settlement will be made for major market

fluctuations in the current period, major plans, or other
significant one-time matters.
4. Income tax
Income tax expenses are the sum of the current income tax
and deferred income tax. Income tax in the interim is
evaluated on an annual basis by taking into calculation the
applicable tax rates to the expected annual earnings and
income before tax in the interim. The accounting treatment is
the same for transactions that gener ate taxation and effects of
tax rate changes due to the amendment to taxation laws in the
interim, both of which are recognized in profit or loss and
other comprehensive profit or loss account when occurred.
V. Significant accounting assumptions and judgme nts, and major sources of
estimation uncertainty
When the Company follows accounting policies, the management must
judge, estimate, and assume based on past experience and other crit ical
factors not readily accessible from other sources. The actual result s may
differ from original estimates.
The management has to review estimates and basic assumptions. If an
amendment of estimates only affects the current period, it shall be
recognized in the current period of amendment; if an amendment of
accounting estimates affects the current year and future periods, it shall
be recognized in the current year and future periods.
(1) Estimated impairment on financial assets (applicable for 2018)
Impairment of accounts receivable is estimated based on the
Company’s assumption about the default rate and the expected loss
rate. The Company takes into account the historical experience,
current market conditions, and forward -looking information in
order to make an assumption and elect the input value for
impairment estimates. If the actual cash flow in the future is less
than the expected amount, it may result in significant impairment
losses.
(2) Estimated impairment on accounts receivable (applicable for 2017)

When there is objective evidence that shows signs of impair ment,
the Company shall consider estimation of future cash flows. The
amount of the impairment loss is measured as the difference
between the asset ’s carrying amount and the present value of
estimated future cash flows discounted at the financial asset ’s
original effective interest rate. If the actual cash flow in the future
is less than the expected amount, it may result in significant
impairment losses.
(3) Inventory impairment
The net realized value of the inventories is the estimated selling
price from normal day-to-day operations, it is the balance of the
estimated cost after deducting the estimated cost of completion and
the estimated cost of completing the transaction. These estimates
are based on current market conditions and historical sales
experience of similar products, and changes in market conditions
may significantly affect these estimates.
(4) Income tax
To continue to expand the scale of operations of the Company and
to support the working capital needs of overseas investment
companies, the management level of the Company decided that the
retained earnings as of the end of 2017 from certain Chinese
subsidiaries will be first attributed to permanent investment
(resolution passed by the Company’s Board of Directors on June 6,
2018). The deferred income tax liabilities are not estimated based
on the retained earnings of the above subsidiaries. If the surplus is
remitted in the future, it may give rise to significant deferred
income tax liabil ities, which will be recognized in profit or loss at
the time of occurrence.

VI. Cash and cash equivalents
2018
June 30
2017
December 31
2017
June 30
Cash in hand and petty cash $ 6,367 $ 5,091 $ 5,800
Bank checks and demand deposit 3,262,467 3,377,495 4,462,918
Cash equivalents (investments with original
maturity date of less than three months)
Bank acceptance bill 3,728 18,562 10,418
Bank fixed deposit 576,089 465,439 147,050 $ 3,848,651 $ 3,866,587 $ 4,626,186
The interest rate interval of bank fixed deposits on the Balance Sheet date
is as follows:
2018
June 30
2017
December 31
2017
June 30
Bank fixed deposit 1.4% - 5.3% 0.14% - 5% 1% - 4.5%
VII. The financial asset in other comprehensive income measured at fair value
through profit and loss - non-current
2018
June 30
Domestic investment
Unlisted equity $ 1,559,529
The Company invests in the aforementioned equity instruments based on
medium and long-term strategic purposes and expects to make a profit
through long-term investments. The management of the Company believes
that it is not consistent with the aforementioned long -term investment
planning if the short -term fair value changes of such investment The
financial in profit or loss. Therefore, the Company elects to designate such
investment as to be measured at FVTOCI. These investments were
originally classified as available -for-sale financial assets under the IAS
39 series. Please refer to Notes 3 and 9 for reclassification and 2017
information.
The equity instruments held by the Company measured at FVTOCI are not
pledged.

8. Financial assets measured at amortized cost
2018
June 30
Current
Bank time deposit with original maturity
date over 3 months (1)
$ 313,449
Refundable deposit 3,004
$ 316,453
Non-current
Bank time deposit with original maturity
date over 3 months (1)
$ 9,597
Restricted bank demand deposit (2) 727
Refundable deposit 45,267
$ 55,591
(1) As of June 30, 2018, the interest rate range of fixed deposit with an
original maturity date of more than 3 months is an annual interest
rate of 0.66% to 6.5%. These deposits were classified as other
financial assets under IAS 39. Please see Note 3 and 10 for their
reclassification and 2017 information.
(2) Restricted bank demand deposits were classified as other financial
assets under IAS 39. Please see Note 3 and 10 for their
reclassification and 2017 information.
(3) Please refer to Note 35 for information on the pledge of financial assets
measured at amortized cost.
9. Available-for-sale financial assets - non-current
2017
December 31
2017
June 30
Domestic unlisted equity $ 183,580 $ 183,580
10. Other financial assets
2017
December 31
2017
June 30
Current
Bank time deposit with original maturity
date over 3 months $ 263,565 $ 126,744
Non-current
Bank time deposit with original maturity
date over 3 months $ 9,472 $ 2,884
Restricted bank demand deposit 749 735

$ 10,221 $ 3,619

The interest rate interval of bank fixed deposits on the Balance Sheet date
is as follows:
2017
December 31
2017
June 30
Bank fixed deposit 0.94% - 2.75% 0.94% - 2.6%
11. Notes receivable, accounts receivable (including related parties), and other
receivables
2018
June 30
2017
December 31
2017
June 30
Notes receivable
Measured at amortized cost (check)
Total carrying amount $ 296,888 $ 298,496 $ 237,490
Less: allowance for impairment/allowance
for bad debt - 6 2,359
$ 296,888 $ 298,490 $ 235,131
Arising from operations $ 296,888 $ 298,490 $ 235,131
Accounts receivable (including related
parties)
Measured at amortized cost (check)
Total carrying amount $ 3,494,548 $ 3,018,225 $ 2,962,003
Less: allowance for impairment/allowance
for bad debt 50,589 32,474 47,169
$ 3,443,959 $ 2,985,751 $ 2,914,834
Other receivables from subsidiaries
Gross carrying amount $ 36,764 $ 37,861 $ 50,142
Less: allowance for impairment/allowance
for bad debt - - 5,170
$ 36,764 $ 37,861 $ 44,972
January 1, 2018 to June 30, 2018
Average credit period for sales of goods from the Company ranges from
30 days to 180 days. Interest is not calculated for accounts receivable. To
lower the credit risk, the management of the Company has delegated a
dedicated team to handle decisions on credit limits, credit approval, and
other monitoring procedures to ensure that appropriate actions are taken
to recover overdue receivables. In addition, the Company would review
the recoverable amount of each receivable on the balance s heet dates to
ensure that impairment loss is recognized for unrecoverable receivables.
As a result, the Company’s management concludes that the credit risk of
the Company is significantly reduced.

The Company adopts the simplified approach as stipulated in IFRS 9 and
recognizes loss allowance for accounts receivables based on the full
lifetime expected credit loss. The full lifetime expected credit loss takes
into account past client default conditions and current financial position
and industry economic factors, and at the same time also takes into account
industry outlook as the basis for evaluation. Since the Company ’s
historical experience of credit loss indicates no significant difference in
the loss patterns between the various customer segments, the Company
does not group customers into different segments but determines the
expected credit loss rate based on the overdue days of accounts receivables.
If evidence indicates that the counterparty is facing severe financial
difficulty and the Company cannot reasonably anticipate recoverable
amounts, for instance, if the counterparty is undergoing liquidation, the
Company will directly hedge against the relevant accounts receivable.
Nevertheless, collection activities will continue, as recovered amounts
that have been collected will be recognized in the profit or loss accounts.
The Company’s allowance for accounts receivable are as follows:
Not overdue
P a s t d u e
1 to 90 days
P a s t d u e
91 to 180 days
P a s t d u e
1 81 t o 27 0
d a y s
P a s t d u e
2 71 t o 36 0
d a y s
P a s t d u e
O v e r 3 6 0
d a y s
T o t a l
Gross carrying amount $ 2,957,568 $ 445,342 $ 33,454 $ 13,703 $ 6,556 $ 37,925 $ 3,494,548
Loss allowance (full
lifetime expected credit losses)
( 26 )
( 429 )
( 2,023 )
( 5,389 )
( 4,832 )
( 37,890 )
( 50,589 )
Amortized cost $ 2,957,542 $ 444,913 $ 31,431 $ 8,314 $ 1,724 $ 35 $ 3,443,959
The information on the changes in the allowance for receivables is as
follows:
January 1, 2018
to June 30, 2018
Beginning balance $ 32,480
Add: Current period 22,220
Less: charge off ( 4,868 )
Translation differences of foreign
currency
757
December 31 $ 50,589
January 1, 2017 to June 30, 2017
The credit policy of the Company in 2017 is the same as the
aforementioned 2018 credit policy. The allowance for bad debts for

accounts receivable is estimated by assessing the past payment records and
the Company’s current financial status.
For accounts receivable that are du e on the Balance Sheet date but not
been assessed by the Company as bad debt, will be considered as
recoverable if their credit quality has not undergone significant changes.
The Company has no collateral or other credit protection in such cases.

Aging analysis of accounts receivable is as follows:
2017
December 31
2017
June 30 Not overdue $ 2,406,104 $ 2,499,609
Below 60 days 493,992 315,133
61 to 180 days 72,956 73,706
181 to 365 days 9,728 9,809
More than 365 days 2,971 16,577
$ 2,985,751 $ 2,914,834
The above is the aging analysis based on the balance of the overdue days
after deducting the balance of the allowance for bad debts.
The information on the allowance for bad debts of notes receivable,
accounts receivable and other receivables is as follows:
Impai rment
l o s s b y
i n d i v i d u a l
a s s e s s m e n t
Impai rment
loss by group
a s s e s s m e n t
T o t a l
Balance as of January 1, 2017 $ 16,888 $ 27,978 $ 44,866
Add: Current period 2,067 3,381 5,448
Less: charge off - ( 2,352 ) ( 2,352 )
Add: Consolidated acquisition - 7,501 7,501
Translation differences of foreign
currency
( 4 ) ( 761 ) ( 765 )
Balance as of June 30, 2017 $ 18,951 $ 35,747 $ 54,698
12. Inventory
2018
June 30
2017
December 31
2017
June 30
Product $ 188,879 $ 159,442 $ 84,724
Finished goods and work-in-process 787,460 783,051 776,206
Work-in-process 88,011 77,371 54,501
Raw material 1,153,744 1,036,380 926,215
Raw materials and supplies in transit 257,499 195,537 169,875
$ 2,475,593 $ 2,251,781 $ 2,011,521
Cost of goods sold relevant to inventory from April 1 to June 30, 2018,
and 2017, and from January 1 to June 30, 2018, and 2017 were
NT$3,146,033 thousand, NT$ 2,676,578 thousand, NT$ 5,869,710
thousand, and NT$ 4,973,028 thousand respectively. The inventory
depreciation and obsolescence loss in the cost of goods sold from April 1
to June 30, 2018, and 2017, and from January 1 to June 30, 2018, and 2017

were NT$5,223 thousand, NT$ 37,945 thousand, NT$ 22,159 thousand and
NT$ 43,474 thousand respectively.

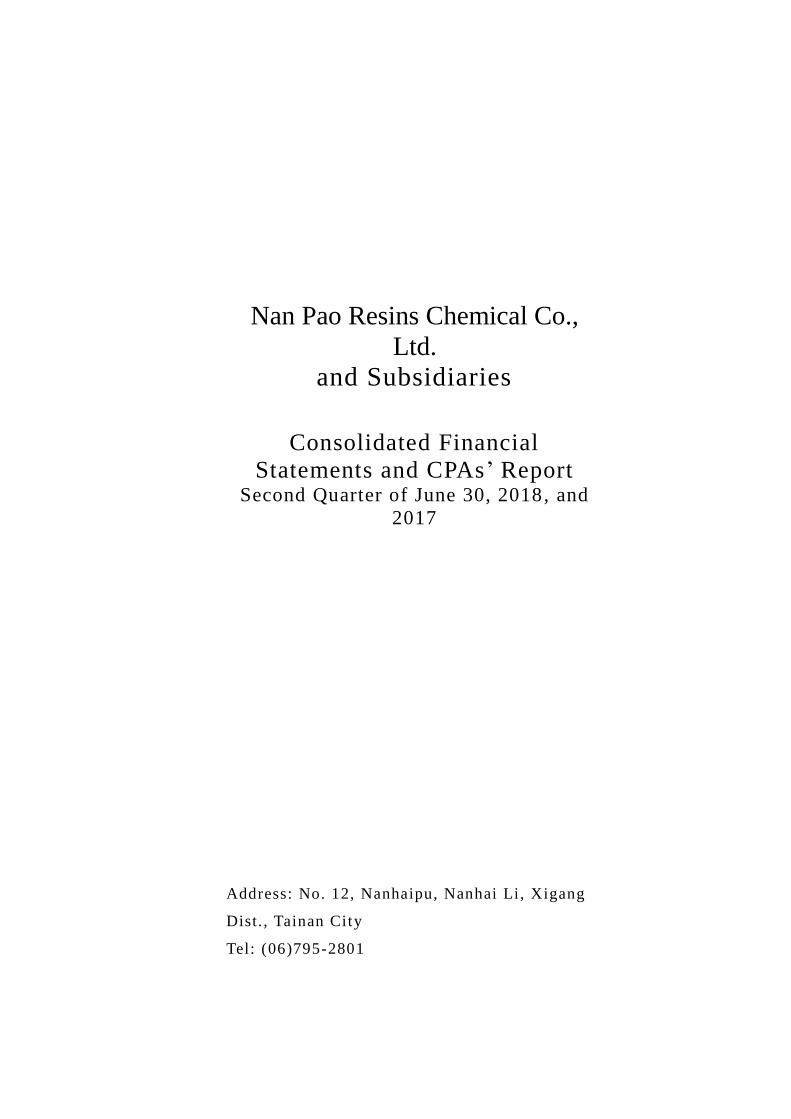
13. Subsidiaries
The entities of the Consolidated Financial Report are as follows:
S h a r e h o l d i n g r a t i o ( % )
Investor Company Name o f su b s id i a r i es Business activities
2018 June 30
2017 December
31
2017
June 30 Details Nan Pao Resins
Chemical Co., Ltd. Nan Pao Chemical
Company Ltd. Trading of chemical
substances 100 100 100 Note
14 Nan Pao Application
Material Co., Ltd.
Trading of chemical
substances 100 100 100 Note
14 Nan Pao Electronic
Material Company
Production and
trading of
electronic materials
100 100 100 Note
14
ITLS International
Development Co., Ltd.
Trading of
construction materials and
chemical
substances
100 100 100
Prince Pharmaceutical Co.,
Ltd.
Manufacturing,
packaging, and
processing of raw materials for
various
pharmaceutical and health food
49.9 49.9 49.9 Note 1
and
Note 14
PHYMED BIO-TEC CO.,
LTD.
R&D and trading of
health food 100 100 100 Note
14 Biorich Biotechnology Co.,
Ltd.
R&D, production,
and trading of new
high protein business and
health food
57.06 57.06 57.06 Note
14
Nan Pao Advanced Materials Co.,LTD.
Trading of adhesives and chemicals
70 70 70 Note 14
Fuqing Nan Pao
Investments Ltd.
General investment
100 100 100
Thai Nan Pao Investments
Ltd.
General investment
100 100 100
Nan Pao Resins India Pvt
Ltd.
Trading of adhesives
100 100 100 Note
14 Nan Pao Materials
Vietnam Co., Ltd. Production and
trading of
adhesives and
chemicals
100 100 100
Nan Pao Advanced
Materials Vietnam Co.,
Ltd.
Production and
trading of
adhesives and chemicals
100 100 100 Note
14
Nan Pao Overseas
Holdings Ltd.
General investment
100 100 100
Profit Land Ltd. General investment 73.75 73.75 73.75 Note 3 All Saints Enterprises Ltd. General investment 54.53 54.53 54.53 Note 3 Ongoing Profits Ltd. General investment 32.18 32.18 32.18 Note 3 PT. Indo Nan Pao Resins
Chemical
Production and
trading of
adhesives
49 49 49 Note 2
and
Note 14
ITLS International
Development Co., Ltd.
ITLS Holding Pte. Ltd. General investment
100 100 100
Aftek Materials Vietnam
Co., Ltd.
Production and
trading of construction
materials
70 - - Note 4
and Note
14 ITLS Holding Pte.
Ltd. ITLS(Malaysia)SDN
BHD
Production and trading of
construction
materials
100 100 100 Note 14
PT. ITLS Indonesia Production and
trading of 100 100 100 Note
14

construction materials
ITLS Vietnam Co., Ltd. Production and
trading of construction
materials
100 100 100 Note
14
ITLS-Rich(S)Pte. Ltd. Trading of hardware and construction
materials
100 80 80 Note 5 and
Note
14 ITLS-SB SDN BHD Production and
trading of
hardware and construction
materials
100 100 100 Note
14 and
Note 15
Fuqing Nan Pao Investments Ltd.
Wealth Castle Development Ltd.
General investment
100 100 100
Wealth Castle
Development Ltd.
Fuqing Nan Pao Resins
Co., Limited
Production and
trading of adhesives
100 100 100
(Continued on the next page)
(Continued from the previous page)
S h a r e h o l d i n g r a t i o ( % )
Investor Company Name o f su b s id i a r i es Business activities
2018 June 30
2017 December
31
2017
June 30 Details Thai Nan Pao
Investments Ltd.
Thai Nanpao Resins
Chemical Co., Ltd.
Production and
trading of adhesives
100 100 100 Note
14
Nan Pao Overseas
Holdings Ltd.
Nan Pao Group Holdings
Ltd.
General investment
100 100 100
Nan Pao Group
Holdings Ltd.
Greatwill Materials (HK)
Ltd.
General investment
67.68 67.68 67.68
Profit Land Ltd. General investment 26.25 26.25 26.25 Note 3 Nan Pao Resins (Holdings)
Ltd.
General investment
100 100 100
All Saints Enterprises Ltd. General investment 45.47 45.47 45.47 Note 3 Qang Yi Electronic Factory
Company Ltd.
General investment
- - 99.87 Note 6
Mega Victory Ltd. General investment 100 100 100 ITLS-TWA Australia Pty
Ltd.
Production and
trading of hardware,
construction
materials, and chemical
substances
100 100 100 Note
14
NP Australia Pty Ltd. General investment 100 100 100 Ongoing Profits Ltd. General investment 67.82 67.82 67.82 Note 3
Treasure Wealth (HK) Ltd. General investment 100 100 100 Goldford Investments Ltd. General investment 100 100 100 Nan Pao Resins Chemical
Philippines, Inc.
Trading of adhesives
100 100 100 Note
14 Nan Pao Resins
International Ltd. Trading of chemical
substances and
related products
100 100 100
Nanpao Advanced Investment Co., Ltd.
General investment
100 100 - Note 7
Greatwill Materials
(HK) Ltd.
Foshan Nan Pao Advanced
Materials Co., Ltd.
Production and
trading of adhesives
99 99 99 Note 3
Profit Land Ltd. Giant Profit Development
Ltd.
General investment
100 100 100
Giant Profit
Development Ltd.
Nan Pao Resins (Fo Shan)
Co., Ltd.
Production and
trading of
adhesives
100 100 100
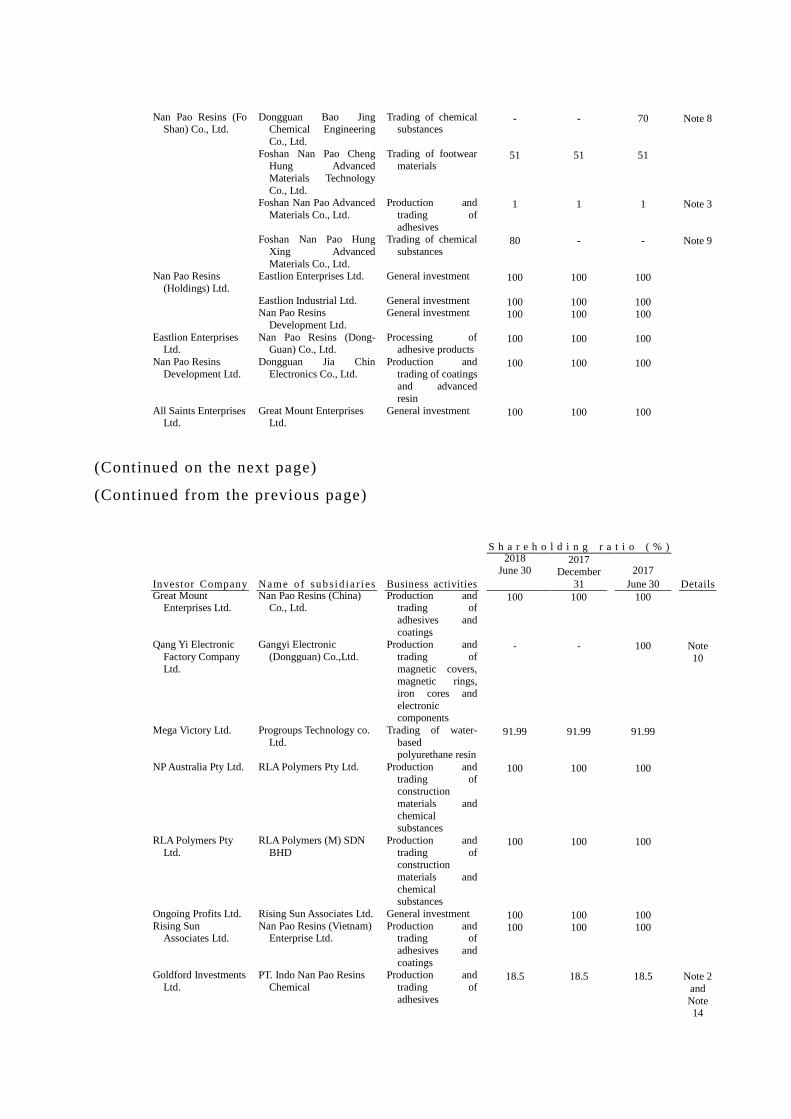
Nan Pao Resins (Fo Shan) Co., Ltd.
Dongguan Bao Jing Chemical Engineering
Co., Ltd.
Trading of chemical substances
- - 70 Note 8
Foshan Nan Pao Cheng Hung Advanced
Materials Technology
Co., Ltd.
Trading of footwear materials
51 51 51
Foshan Nan Pao Advanced
Materials Co., Ltd.
Production and
trading of
adhesives
1 1 1 Note 3
Foshan Nan Pao Hung
Xing Advanced
Materials Co., Ltd.
Trading of chemical
substances
80 - - Note 9
Nan Pao Resins
(Holdings) Ltd.
Eastlion Enterprises Ltd. General investment
100 100 100
Eastlion Industrial Ltd. General investment 100 100 100 Nan Pao Resins
Development Ltd.
General investment
100 100 100
Eastlion Enterprises Ltd.
Nan Pao Resins (Dong-Guan) Co., Ltd.
Processing of adhesive products
100 100 100
Nan Pao Resins
Development Ltd.
Dongguan Jia Chin
Electronics Co., Ltd.
Production and
trading of coatings and advanced
resin
100 100 100
All Saints Enterprises Ltd.
Great Mount Enterprises Ltd.
General investment
100 100 100
(Continued on the next page)
(Continued from the previous page)
S h a r e h o l d i n g r a t i o ( % )
Investor Company Name o f su b s id i a r i es Business activities
2018 June 30
2017 December
31
2017
June 30 Details Great Mount
Enterprises Ltd. Nan Pao Resins (China)
Co., Ltd. Production and
trading of
adhesives and
coatings
100 100 100
Qang Yi Electronic
Factory Company
Ltd.
Gangyi Electronic
(Dongguan) Co.,Ltd.
Production and
trading of
magnetic covers, magnetic rings,
iron cores and
electronic components
- - 100 Note
10
Mega Victory Ltd. Progroups Technology co.
Ltd.
Trading of water-
based polyurethane resin
91.99 91.99 91.99
NP Australia Pty Ltd. RLA Polymers Pty Ltd. Production and
trading of construction
materials and
chemical
substances
100 100 100
RLA Polymers Pty
Ltd.
RLA Polymers (M) SDN
BHD
Production and
trading of construction
materials and
chemical substances
100 100 100
Ongoing Profits Ltd. Rising Sun Associates Ltd. General investment 100 100 100 Rising Sun
Associates Ltd. Nan Pao Resins (Vietnam)
Enterprise Ltd. Production and
trading of
adhesives and
coatings
100 100 100
Goldford Investments
Ltd.
PT. Indo Nan Pao Resins
Chemical
Production and
trading of
adhesives
18.5 18.5 18.5 Note 2
and
Note 14

Treasure Wealth (HK) Ltd.
Noroo-Nan Pao Paints & Coatings (Vietnam) Co.,
Ltd.
Production and trading of coatings
50 50 50 Note 11 and
Note
14 Nanpao Advanced
Investment Co.,
Ltd.
Nan Pao (Kunshan) E-
commerce Ltd.
Agency of online
business and
general merchandise
100 100 - Note
12
Nantong Nanpao Resins
Materials Co., Ltd.
Production and
trading business of adhesives
100 100 - Note
13
Note 1: In February 2017, the Company ’s subscription for the NT$100,000
thousand new issuances from Prince Pharmaceutical Co., Ltd. was
not undertaken according to the shareholding ratio. In April 2017,
Prince Pharmaceutical Co., Ltd. issued an executive stock option,
and some employees executed the subscription right, causing the
shareholding ratio to decrease to 49.9%.
Note 2: Total direct and indirect shareholding account for 67.50%.
Note 3: Total direct and indirect shareholding account for 100%.
Note 4: ITLS International Development Co., Ltd. has invested in and
established Aftek Materials Vietnam Co., Ltd. in February 2018,
with the shareholding ratio of 70%.
Note 5: The Company has acquired the remaining shares of ITLS -Rich (S)
Pte. Ltd. in March 2018, leading the shareholding ratio to increase
to 100% from 80%.
Note 6: Qang Yi Electronic Factory Company Ltd. completed liquidation
and cancellation in December 2017.
Note 7: Nan Pao Group Holdings Ltd. invested in and establi shed Nanpao
Advanced Investment Co., Ltd. , in July 2017, with a 100%
shareholding ratio.
Note 8: Nan Pao Resins (Fo Shan) Co., Ltd. disposed of all shares of
Dongguan Bao Jing Chemical Engineering Co., Ltd. for CNY 1,820
thousand in December 2017; therefo re, i t is no longer included in
the consolidated individual.
Note 9: Nan Pao Resins (Fo Shan) Co., Ltd. established Foshan Nan Pao
Hung Xing Advanced Materials Co., Ltd. in May 2018 with an 80%
shareholding ratio.
Note 10: Gangyi Electronic (Dongguan) Co., Ltd. completed liquidation

and cancellation in October 2017.
Note 11: Treasure Wealth (HK) Ltd. purchased 1% of share from non-
related party Naroo-Nan Pao Paints & Coatings (Vietnam) Co.,
Ltd. for US$180 thousand in April 2017, leading shareholding
ratio to increase to 50% from 49%, and the primary management
is designated by the Company, posing effective, substantial
control over Naroo-Nan Pao Paints & Coatings (Vietnam) Co., Ltd.
Therefore, i t has been included in the compilation body of the
Consolidated Report since April 2017.
Note 12: Nanpao Advanced Investment Co., Ltd. established Nan Pao
(Kunshan) E-commerce Co., Ltd. in August 2017, with the
shareholding ratio of 100%.
Note 13: Nanpao Advanced Investment Co., Ltd. established Nantong
Nanpao Resins Materials Co., Ltd. in July 2017, with the
shareholding ratio of 100%.
Note 14: Such companies are immaterial subsidiaries, and their financial
statements have not been reviewed by CPA.
Note 15: The Company has acquired the remaining shares of ITLS -SB SDN
BHD in April 2017, leading the shareholding ratio to increase to
100% from 80%.
14. Investment using equity method
2018
June 30
2017
December 31
2017
June 30
Investment in affiliates
Individual associates without
significance $ 283,660 $ 278,451 $ 263,388
For compilation of information on individual associates without
significance, please see the following:
2018
April 1
to June 30,
2018
2017
April 1
to June 30,
2018
2018
January 1
to June 30,
2018
2017
January 1
to June 30,
2018
Shares from the
Company
Net income (loss) and
total
$ 5,203 ( $ 1,759 ) $ 12,709 $ 8,362

comprehensive
income for the
period
The Company’s investments accounted for using the equity method and its
share of profit or loss and other comprehensive income within investees
are computed based on financial statements that have not been audited by
CPAs.
15. Properties, plants, and equipment
L a n d Land re fo r m B u i l d i n g
M a c h i n e r y
e q u i p m e n t
Transportation
E q u i p m e n t
O t h e r
E q u i p m e n t
U n f i n i s h e d
construct ions
and equipment
t o be t e s t ed
T o t a l
Cost
Balance as of January 1, 2018 $ 1,179,025 $ 5,625 $ 1,621,156 $ 2,334,664 $ 204,299 $ 694,247 $ 170,477 $ 6,209,493
Additions - 839 4,507 44,615 8,345 18,352 180,249 256,907
Disposals - - ( 3,188 ) ( 46,130 ) ( 6,061 ) ( 7,819 ) - ( 63,198 )
Reclassification - - 7,432 120,256 ( 300 ) 18,385 ( 19,122 ) 126,651
Net exchange differences 71 ( 30 ) 27,577 7,924 421 2,847 14,625 53,435
Balance as of June 30, 2018 $ 1,179,096 $ 6,434 $ 1,657,484 $ 2,461,329 $ 206,704 $ 726,012 $ 346,229 $ 6,583,288
Accumulated depreciation
and impairment
Balance as of January 1, 2018 $ - $ 5,625 $ 626,257 $ 1,568,788 $ 146,487 $ 515,607 $ - $ 2,862,764
Depreciation - 42 26,854 71,135 8,101 26,306 - 132,438
Disposals - - ( 2,260 ) ( 35,957 ) ( 4,368 ) ( 7,668 ) - ( 50,253 )
Reclassification - - ( 491 ) ( 160 ) ( 129 ) 1,152 - 372
Net exchange differences - ( 22 ) 6,051 835 161 1,371 - 8,396
Balance as of June 30, 2018 $ - $ 5,645 $ 656,411 $ 1,604,641 $ 150,252 $ 536,768 $ - $ 2,953,717
Net amount on December 31,
2017 and January 1, 2018
$ 1,179,025 $ - $ 994,899 $ 765,876 $ 57,812 $ 178,640 $ 170,477 $ 3,346,729
Balance as of June 30, 2018 $ 1,179,096 $ 789 $ 1,001,073 $ 856,688 $ 56,452 $ 189,244 $ 346,229 $ 3,629,571
Cost
Balance as of January 1, 2017 $ 995,878 $ 5,665 $ 1,052,950 $ 2,231,119 $ 214,514 $ 668,440 $ 317,887 $ 5,486,453
Additions - - 14,930 37,044 2,357 20,130 287,365 361,826
Disposals - - ( 6,695 ) ( 71,777 ) ( 7,864 ) ( 32,015 ) - ( 118,351 )
Acquired from merger - - 34,180 30,321 5,989 9,263 5,835 85,588
Reclassification ( 17,760 ) - 81,003 28,081 1,750 24,793 ( 79,384 ) 38,483
Net exchange differences ( 43 ) ( 19 ) ( 24,953 ) ( 27,389 ) ( 3,005 ) ( 4,673 ) ( 14,223 ) ( 74,305 )
Balance as of June 30, 2017 $ 978,075 $ 5,646 $ 1,151,415 $ 2,227,399 $ 213,741 $ 685,938 $ 517,480 $ 5,779,694
Accumulated depreciation
and impairment
Balance as of January 1, 2017 $ - $ 5,665 $ 594,097 $ 1,561,423 $ 146,049 $ 517,344 $ - $ 2,824,578
Depreciation - - 17,332 61,354 8,190 24,524 - 111,400
Disposals - - ( 4,101 ) ( 66,665 ) ( 4,495 ) ( 29,479 ) - ( 104,740 )
Acquired from merger - - 7,208 12,826 3,478 5,727 - 29,239
Reclassification - - - - - 3,325 - 3,325
Net exchange differences - ( 19 ) ( 12,888 ) ( 15,628 ) ( 2,225 ) ( 5,617 ) - ( 36,377 )
Balance as of June 30, 2017 $ - $ 5,646 $ 601,648 $ 1,553,310 $ 150,997 $ 515,824 $ - $ 2,827,425
Balance as of June 30, 2017 $ 978,075 $ - $ 549,767 $ 674,089 $ 62,744 $ 170,114 $ 517,480 $ 2,952,269
Depreciation expense is calculated using the straight -line basis based on
the below useful years:
Land reform 4 to 20 years
Building 3 to 60 years
Machinery equipment 2 to 30 years
Transportation Equipment 2 to 20 years
Other Equipment 2 to 20 years
Please refer to Note 35 for the PP&E amount considered as collateral.
16. Investment Property

L a n d
Balance as of January 1, 2017 $ -
Outflow from property, plant and
equipment
17,760
Balance as of June 30, 2017 $ 17,760
Balance on January 1, 2018 and
June 30, 2018
$ 17,760
The fair value of investment property was NT$63,863 thousand on both
June 30, 2018, December 31, 2017, and June 30, 2017, respectively. It has
not been evaluated by independent evaluators, and only through the
management level of the Company by referencing the actual transaction
price of nearby regions in the most recent year.
The investment property of the Company is self -owned and no mortgage
condition exists.
17. Goodwill
January 1, 2018
to June 30, 2018
January 1, 2017
to June 30, 2018
Beginning balance $ 91,978 $ 89,291
Acquired in this period (Note 30) - 3,075
Net exchange differences ( 2,365 ) 274
December 31 $ 89,613 $ 92,640
The Company conducts an impairment test on the recoverable amount of
goodwill at the end of each year, using the value -in-use as the basis for
the calculation of the recoverable amount. The calculation of the value -
in-use is based on the cash flows of the Company ’s future financial
projections as an estimate to reflect the specific risks o f the relevant cash
generating unit.
No impairment loss on goodwill has been recognized by the Company from
January 1 to June 30, 2018, and 2017.
The Company has obtained the Acquisit ion Pricing Allocation Report in
March 2018. Based on the report , invento ry, PP&E, and prepaid rent based
on the fair value on the date of acquisition were NT$80,000, NT$56,349
thousand, and NT$47,069 thousand respectively for the subsidiary Noroo -
Nan Pao Paints & Coatings (Vietnam) Co., Ltd. The Company has adjusted

the initial accounting treatment and provisional amounts since the
acquisition date and restated the comparison information.
The increase (decrease) in the adjustment of related items on the Balance
Sheet is as follows:
June 30, 2017
B e f o r e
r e s t a t e m e n t A d j u s t m e n t
A f t e r
r e s t a t e m e n t
Goodwill $ 92,657 ( $ 17 ) $ 92,640
Property, plant, and equipment $ 2,951,741 $ 528 $ 2,952,269
Prepaid rent - non-current $ 447,977 $ 28,931 $ 476,908
Deferred income tax assets $ 193,636 ( $ 3,073 ) $ 190,563
Other non-current assets $ 339,422 ( $ 12,538 ) $ 326,884
Deferred income tax liabilities $ 813,300 ( $ 1,648 ) $ 811,652
Retained earnings $ 4,886,246 ( $ 8,046 ) $ 4,878,200
Other equity ( $ 245,320 ) $ 15,002 ( $ 230,318 )
Non-controlling Interests $ 655,718 $ 8,398 $ 664,116
The increase (decrease) in the adjustment of related items in the
Comprehensive Income Statement is as follows:
April 1, 2017
to June 30, 2018
January 1, 2017
to June 30, 2018
Cost of goods sold ( $ 14,696 ) ( $ 14,696 )
Operating expenses - depreciation
expense
( $ 688 ) ( $ 688 )
Operating expenses - amortization
expense
$ 237 $ 237
Other profit and loss - disposal of
investment loss
( $ 17,268 ) ( $ 17,268 )
Income tax expense ( $ 1,649 ) ( $ 1,649 )
18. Other intangible assets
2018
June 30
2017
December 31
2017
June 30
Customer relations $ 28,337 $ 32,231 $ 35,497
Computer software 14,237 16,296 14,809
Others 9,155 774 977
$ 51,729 $ 49,301 $ 51,283
Except for the recognition of amortization expenses, the Company did not
have any significant additions, dispositions, and impairments to other
intangible assets from January 1 to June 30, 2018, and 2017. The
amortization cost is calculated based on the straight -line basis for the
following useful life:

Customer relations 9 to 11 years
Computer software 3 to 10 years
Others 2 to 10 years
19. Prepaid rent
2018
June 30
2017
December 31
2017
June 30
Current $ 14,787 $ 14,044 $ 8,927
Non-current 619,552 598,033 476,908
$ 634,339 $ 612,077 $ 485,835

As of June 30, 2018, and December 31, 2017, and June 30, 2017, the
prepaid rent positions are located in the following areas:
2018
June 30
2017
December 31
2017
June 30
Vietnam $ 420,819 $ 398,438 $ 364,013
China 206,396 206,471 114,823
Malaysia 4,964 4,872 4,564
Indonesia 2,160 2,296 2,435
$ 634,339 $ 612,077 $ 485,835
The above-mentioned land use rights are set for a period of 30 to 60 years,
and all of their terms will expire before the year 2068.
20. Other assets
2018
June 30
2017
December 31
2017
June 30
Current
Input tax amount $ 283,900 $ 218,186 $ 152,376
Prepaid cost of goods 106,284 90,522 66,345
Prepaid expense 52,015 37,396 65,000
Tax overpaid retained 18,560 20,622 2,714
Inventory of Supplies 424 2,003 3,051
Refundable deposit - 4,621 1,069
Others 15,500 26,312 25,166
$ 476,683 $ 399,662 $ 315,721
Non-current
Prepaid Equipment $ 119,445 $ 188,376 $ 266,097
Refundable deposit - 44,664 45,637
Others 5,387 5,451 15,150
$ 124,832 $ 238,491 $ 326,884
21. Loans
(1) Short-term borrowings
2018
June 30
2017
December 31
2017
June 30
Secured loans from banks $ 60,000 $ 60,000 $ 60,000
Bank credit loans 1,654,192 1,246,649 1,512,239
$ 1,714,192 $ 1,306,649 $ 1,572,239

The annual rate for short -term loans is as follows:
2018
June 30
2017
December 31
2017
June 30
Secured loans from banks 1.52% 1.52% 1.52%
Bank credit loans 0.9% - 5.6% 0.9% - 5.11% 1% - 5.07%
(2) Shor-term bills payable
June 30, 2018
G u a r a n t e e o r
A c c e p t i n g
I n s t i t u t i o n F a c e v a l u e
D i s c o u n t
a m o u n t At book value
Interest rate
r a n g e ( % )
N a m e o f
c o l l a t e r a l
Commercial
paper payable
International
Bills Finance
Corp.
$ 60,000 $ 37 $ 59,963
1.038
None
China Bills
Finance
Corporation
40,000 25 39,975
1.038
None
$ 100,000 $ 62 $ 99,938
December 31, 2017
G u a r a n t e e o r
A c c e p t i n g
I n s t i t u t i o n F a c e v a l u e
D i s c o u n t
a m o u n t At book value
Interest rate
r a n g e ( % )
N a m e o f
c o l l a t e r a l
Commercial
paper payable
International
Bills Finance
Corp.
$ 60,000 $ 6 $ 59,994
1.058
None
China Bills
Finance
Corporation
10,000 14 9,986
1.038
None
Dah Chung Bills
Finance Corp
50,000 57 49,943
1.038
None
$ 120,000 $ 77 $ 119,923
June 30, 2017
G u a r a n t e e o r
A c c e p t i n g
I n s t i t u t i o n F a c e v a l u e
D i s c o u n t
a m o u n t At book value
Interest rate
r a n g e ( % )
N a m e o f
c o l l a t e r a l
Commercial
paper payable
International
Bills Finance
Corp.
$ 60,000 $ 92 $ 59,908
1.138
None
China Bills
Finance
Corporation
40,000 35 39,965
1.138
None
Dah Chung Bills
Finance Corp
50,000 66 49,934
1.150
None
$ 150,000 $ 193 $ 149,807
(3) Long-term debt

2018
June 30
2017
December 31
2017
June 30
Unsecured loans
1. Mizuho Bank $ 500,000 $ 500,000 $ 500,000
2. O-Bank 150,000 150,000 150,000
3. O-Bank 30,000 30,000 -
4. Yuanta Commercial Bank 140,000 140,000 140,000
5. Chinatrust Commercial Bank
210,000 210,000 210,000
(Continued on the next page)
(Continued from the previous page)
2018
June 30
2017
December 31
2017
June 30
6. E.Sun Bank $ - $ 130,000 $ 130,000
7. KGI Bank 300,000 300,000 -
8. Taipei Fubon Commercial
Bank
130,000 - -
9. Taiwan Cooperative Bank 32,000 - -
10. Mega International
Commercial Bank
176,237 175,269 27,056
11. Mega International
Commercial Bank
1,470 2,623 4,034
1,669,707 1,637,892 1,161,090
Less: portion recognized as
maturing within one year
45,529 33,553 4,281
$ 1,624,178 $ 1,604,339 $ 1,156,809
1. The Company signed a two-year loan agreement with Mizuho
Bank in December 2016 with a credit line of NT$500,000
thousand. In December 2017, the Company applied for a one-
year extension to December 2019, the credit will be used
cyclically within the credit line, and the loan principal
repayment will be paid at once. Annual rates on June 30, 2018,
December 31, 2017, and June 30, 2017 were 1.1%, 1.1% , and
1.15% respectively.
1. The Company signed a three-year loan agreement with O-Bank
in June 2016 with a credit line of NT$150,000 thousand. The
loan principal repayment will be paid at once. Annual rates
on June 30, 2018, December 31, 2017, and June 3 0, 2017 were
1.1998%, 1.1998%, and 1.2209% respectively.

3. The Company signed a five-year loan agreement with O-Bank in
June 2017 with the credit line of NT$300,000 thousand. The
credit term is every three months starting from September
2020, and loan principal repayment will be made in equal
portions. Annual rates on June 30, 2018 and December 31,
2017 were both 1.1839%.
4. The Company signed a three -year loan agreement with Yuanta
Commercial Bank in June 2015 with a credit l ine of
NT$300,000 thousand. In August 2017, the Company applied
for an extension to August 2020; the credit will be used
cyclically within the credit line, and the loan principal
repayment will be paid at once. Annual rates on June 30, 2018,
December 31, 2017, and June 30, 2017, were 1.15%, 1.18%,
and 1.26% respectively.
5. The Company signed a two-year loan agreement with Chinatrust
Commercial Bank in September 2016 with a credit line of
NT$260,000 thousand. In September 2017, the Company
applied for an extension until August 2019; the credit will be
used cyclically within the credit line, and the loan principal
repayment will be paid at once. Annual rates on June 30, 2018,
December 31, 2017, and June 30, 2017, were 1.1861% -
1.1877%, 1.1863% - 1.2464%, and 1.246% - 1.2472%
respectively.
6. The Company signed a two-year loan agreement with E.Sun
Bank in April 2016 with a credit line of NT$200,000 thousand.
In July 2017, the Company applied for an extension until April
2019. In May 2018, the Company applied for another
extension to May 2020, and the credit line was raised to
NT$300,000 thousand. The credit will be used cyclically
within the credit line, and the loan principal repayment will
be paid at once. The loan principal has already been fully
repaid in April 2018. Annual rates on December 31, 2017, and
June 30, 2017, were both 1.15%.

7. The Company signed a two-year loan agreement with KGI Bank
in August 2017 with a credit line of NT$400,000 thousand.
The credit will be used cyclically within the credit line, and
the loan principal repayment will be paid at once. Annual
rates on June 30, 2018, and December 31, 2017, were both
1.036%.
8. The Company signed a two-year loan agreement with Taipei
Fubon Commercial Bank in December 2017 with a credit line
of NT$300,000 thousand. The credit will be used cyclically
within the credit line, and the loan principal repayment will
be paid at once. The annual rate on June 30, 2018 was
1.0424%.
9. The Company signed a two-year loan agreement with Taiwan
Cooperative Bank in August 2017 with a cr edit line of
NT$320,000 thousand. The loan shall be allocated in
accordance with 80% coverage according to the progress of
the construction project through verifying invoices or relevant
transaction payment certificates. The loan principal
repayment will be paid at once or the loan shall be changed to
a long-term debt with collateral at credit line of NT$320,000.
The annual rate on June 30, 2018 was 1.6%.
10. The Company signed a five-year loan agreement with Mega
International Commercial Bank in June 2017 with a credit line
of US$ 15,000 thousand. The credit will be repaid in 17
installments start ing from June 2018, where each installment
is for every 3 months. Annual rates on June 30, 2018,
December 31, 2017, and June 30, 2017 were 2.695% - 3.084%,
2.695% - 3.084%, and 2.695% - 2.697% respectively.
11. The Company signed a four -year loan agreement with Mega
International Commercial Bank in December 2014 with a
credit line of US$ 1,000 thousand. The credit will be repaid
in installments start ing from Decem ber 2015, where each
installment is for every 6 months. The loan principal will be

repaid in equal portions. Annual rates on June 30, 2018,
December 31, 2017 and June 30, 2017 were all 7%.
22. Accounts payable and bills payable
2018
June 30
2017
December 31
2017
June 30
Notes payable
Arising from operations $ 22,593 $ 28,025 $ 25,712
Non-operating 31,285 24,309 26,623
$ 53,878 $ 52,334 $ 52,335
Accounts payable
Arising from operations $ 1,963,922 $ 1,948,306 $ 1,656,987
The Company has established a set of financial risk management policy to
ensure that all payables are repaid within the pre -agreed term of the credit.
23. Other liabilities
2018
June 30
2017
December 31
2017
June 30
Current
Other liabilities
Refund liability (Note 26 and 34) $ 153,763 $ - $ -
Unearned receipts - 22,783 28,017
Others 20,876 9,519 32,929
$ 174,639 $ 32,302 $ 60,946
Non-current
Other liabilities
Guarantee deposits $ 1,867 $ 1,141 $ 2,137
Others 40,782 40,858 38,445
$ 42,649 $ 41,999 $ 40,582
24. Post-retirement benefit program
Pension expenses such as the defined benefit plan recognized from April
1 to June 30, 2018, and 2017, and January 1 to June 30, 2018, and 2017,
were calculated based on the pension cost rate from actuarial decision as
of December 31, 2017, and 2016, and the costs were NT$1,975 thousand,
NT$2,972 thousand, NT$3,873 thousand, and NT$5,456 thousand
respectively.

25. Equity
(1) Capital
Ordinary Shares
2018
June 30
2017
December 31
2017
June 30
Shares (thousand shares) 200,000 200,000 200,000
Nominal capital $ 2,000,000 $ 2,000,000 $ 2,000,000
Number of issued and paid-for
shares (thousand shares) 108,621 108,621 106,491
Current issued capital $ 1,086,207 $ 1,086,207 $ 1,064,909
Stock dividends to be distributed - - 21,298
$ 1,086,207 $ 1,086,207 $ 1,086,207
Common stocks are issued with the par value of NT$10 per share,
and each common stock represents a right to vote and receive
dividends.
On March 3, 2017, the Company’s Board of Directors has adopted
the resolution to issue 3,000 new shares at the premium of NT$180
per share, for a total of NT$540,000 thousand. June 16, 2017, was
designated to be the base date of the capital increase.
On May 16, 2017, the Company’s Shareholders’ Meeting has
adopted the resolution to issue NT$21,298 thousand of ordinary
shares through capital surplus transfer. A total of 21,30 thousand
shares were issued at par value of NT$10 per share. August 2, 2017,
was designated as the base date of the capital increase.
(2) Capital surplus
2018
June 30
2017
December 31
2017
June 30
May be used to make up for loss,
cash distribution, or for capital
replenishment (1)
Stock issuance premium $ 1,266,401 $ 1,266,401 $ 1,266,401
May be used to make up for loss
(2)
Recognized value of changes in
equity of ownership of
subsidiaries 23,811 23,811 23,811
$ 1,290,212 $ 1,290,212 $ 1,290,212
1. The capital surplus from stock issuance premium may be used
to cover loss and may also be used to issue cash or capital

when the Company has no loss, but the capital replenishment
is restricted to a certain ratio of paid -in capital every year.

2. The capital surplus of the recognized value of changes in the
equity of ownership of subsidiaries is the value of affected
equity transactions recognized for change in the equity of
subsidiaries, or the adjustment value of the capital surplus of
the subsidiary recognized by the Company through the equity
method.
(3) Retained earnings and dividend policy
Pursuant to the policy on allocation of surplus in the Company ’s
Articles of Association, the Company shall first pay taxes and
cover for loss from previous years if the surplus is found after
closing the accounts for the year. Subsequently, 10% shall be
appropriated as a legal capital reserve, and after which the surplus
could be appropriated based on other legal regulations or
regulations of the competent authority, or appropriated as a special
capital reserve. The remaining surplus will be accumulated toward
the undistributed surplus over the years, and the Board of Directors
will draft a motion for appropriation, and ask the Shareholders ’
Meeting for appropriation. The Company ’s Articles of Association
has stipulated policy on employee remuneration and directorial
compensations. Please see (6) Employee Remuneration and
Directorial Compensations in Note 27 -6.
As the Company is in a period of robust growth, in order to cope
with the future operational expansion plan, dividend distribution
shall not be less than 10% of the remaining profit of the year.
Shareholder dividend shall be paid in a corresponding mix of cash
and stock dividend, in which cash dividend will account for 20%
to 100%, and the stock dividend of 0% to 80%.
The legal reserve may be used to cover losses. When the Company
has no loss, the portion of the legal reserve that exceeds 25% of
the total paid-in capital may be used to pay in cash, in addition to
capital replenishment.
The Company distributes and appropriates special capital reserve
pursuant to Letter No. 1010012865 and Letter No. 1030006415
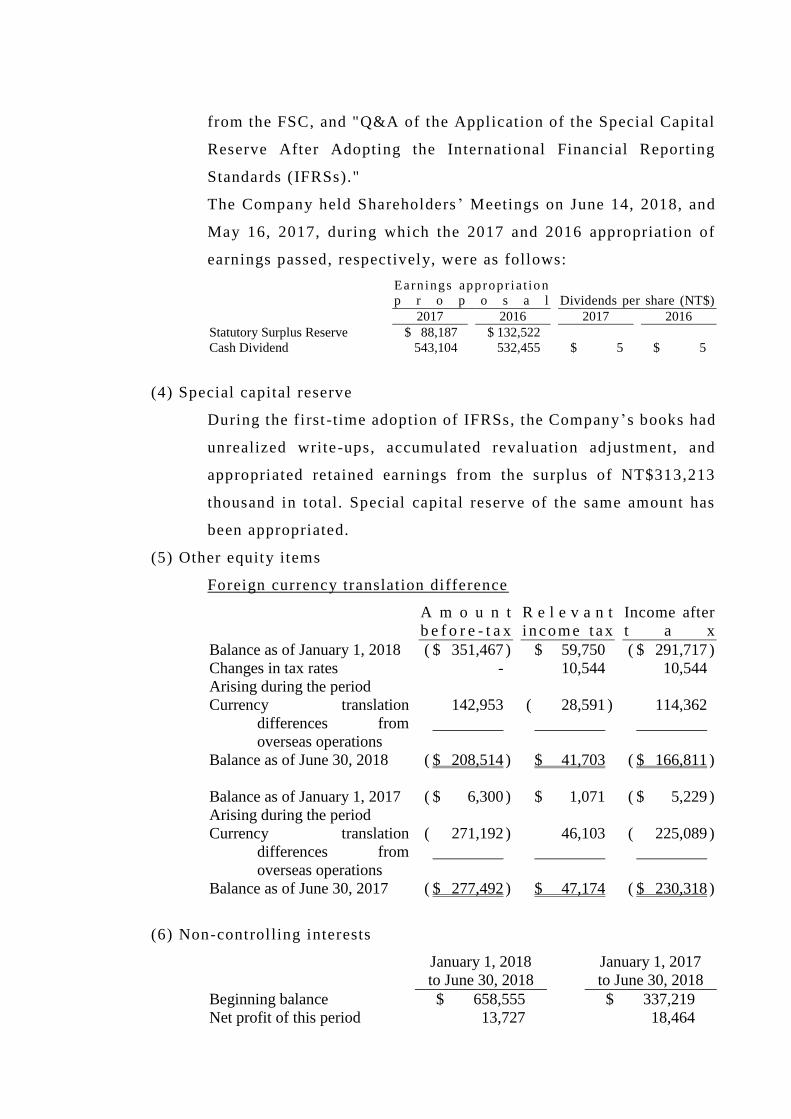
from the FSC, and "Q&A of the Application of the Special Capital
Reserve After Adopting the International Financial Reporting
Standards (IFRSs)."
The Company held Shareholders ’ Meetings on June 14, 2018, and
May 16, 2017, during which the 2017 and 2016 appropriation of
earnings passed, respectively, were as follows:
Earn ings appropr i a t io n
p r o p o s a l Dividends per share (NT$)
2017 2016 2017 2016
Statutory Surplus Reserve $ 88,187 $ 132,522
Cash Dividend 543,104 532,455 $ 5 $ 5
(4) Special capital reserve
During the first -time adoption of IFRSs, the Company’s books had
unrealized write-ups, accumulated revaluation adjustment, and
appropriated retained earnings from the surplus of NT$313,213
thousand in total. Special capital reserve of the same amount has
been appropriated.
(5) Other equity items
Foreign currency translation difference
A m o u n t
b e f o r e - t a x
R e l e v a n t
i n co m e t ax
Income after
t a x
Balance as of January 1, 2018 ( $ 351,467 ) $ 59,750 ( $ 291,717 )
Changes in tax rates - 10,544 10,544
Arising during the period
Currency translation
differences from
overseas operations
142,953
( 28,591 )
114,362
Balance as of June 30, 2018 ( $ 208,514 ) $ 41,703 ( $ 166,811 )
Balance as of January 1, 2017 ( $ 6,300 ) $ 1,071 ( $ 5,229 )
Arising during the period
Currency translation
differences from
overseas operations
( 271,192 )
46,103
( 225,089 )
Balance as of June 30, 2017 ( $ 277,492 ) $ 47,174 ( $ 230,318 )
(6) Non-controlling interests
January 1, 2018
to June 30, 2018
January 1, 2017
to June 30, 2018
Beginning balance $ 658,555 $ 337,219
Net profit of this period 13,727 18,464

Other comprehensive
income of the year
Exchange differences on
translation of
foreign financial
statements 10,994 ( 7,915 )
Increases in non-
controlling interest by
acquisition of
subsidiaries 30,477 119,674
Acquisition of non-
controlling interest in
subsidiaries (Note 31) ( 806 ) ( 4,630 )
Difference between prices
of shares acquired from
subsidiaries and book
value - ( 22,533 )
Dividend payout from
subsidiary ( 404 ) -
Capital increase by share
subscription at
subsidiaries - 200,000
Others - 23,837
December 31 $ 712,543 $ 664,116

26. Revenue
(1) Diaggregation of revenue from customer contracts
2018
April 1
to June 30,
2018
2017
April 1
to June 30,
2018
2018
January 1
to June 30,
2018
2017
January 1
to June 30,
2018
Adhesives $ 2,876,478 $ 2,585,214 $ 5,275,913 $ 4,945,573
Coatings 455,578 398,816 849,654 661,940
Construction materials 537,997 517,220 1,052,432 997,403
Others 202,986 151,717 401,887 281,319
$ 4,073,039 $ 3,652,967 $ 7,579,886 $ 6,886,235
(2) Balance on contracts
June 30, 2018
Accounts receivable
(Note 11)
$ 3,494,548
Provision - Current
Product sales $ 36,109
Refund liability - current
(listed in other currrent
liabilities)
Product sales $ 153,763
Changes in contract l iabil ities are caused mainly by the difference
of timing between when performance obligations are fulfilled and
when customers make payments.
27. Net income
(1) other revenues
2018
April 1
to June 30,
2018
2017
April 1
to June 30,
2018
2018
January 1
to June 30,
2018
2017
January 1
to June 30,
2018
Dividend income $ 98,176 $ 45,864 $ 98,176 $ 45,864
Revenue from subsidies 13,475 3,894 13,865 4,108
Interest income 9,223 4,657 17,226 9,260
Rental income 43 171 82 427
$ 120,917 $ 54,586 $ 129,349 $ 59,659

(2) Other gain and loss
2018
April 1
to June 30,
2018
2017
April 1
to June 30,
2018
2018
January 1
to June 30,
2018
2017
January 1
to June 30,
2018
Foreign exchange gain or loss,
net
$ 50,565 $ 8,071 $ 22,551 ( $ 24,567 )
Compensation paid - ( 34,715 ) - ( 34,715 )
Disposal of loss on investments - ( 17,268 ) - ( 17,268 )
Others 7,684 4,466 9,633 ( 134 )
$ 58,249 ( $ 39,446 ) $ 32,184 ( $ 76,684 )
(3) Financial costs
2018
April 1
to June 30,
2018
2017
April 1
to June 30,
2018
2018
January 1
to June 30,
2018
2017
January 1
to June 30,
2018
Interest of bank loans $ 15,150 $ 12,399 $ 28,766 $ 23,284
Loan interest paybale 309 129 559 158
Less: amounts included in the
cost of the required
assets
( 78 ) - ( 78 ) -
$ 15,381 $ 12,528 $ 29,247 $ 23,442
Information on the capitalization of interest is as follows:
2018
April 1
to June 30,
2018
2017
April 1
to June 30,
2018
2018
January 1
to June 30,
2018
2017
January 1
to June 30,
2018
Amount of capitalization of
interest
$ 78 $ - $ 78 $ -
Interest rate of capitalization of
interest
1.6% - 1.6% -
(4) Depreciation and amortization
2018
April 1
to June 30,
2018
2017
April 1
to June 30,
2018
2018
January 1
to June 30,
2018
2017
January 1
to June 30,
2018
Properties, plants, and
equipment
$ 67,349 $ 57,502 $ 132,438 $ 111,400
Intangible assets and prepaid
rent
7,012 6,367 14,000 10,378
$ 74,361 $ 63,869 $ 146,438 $ 121,778
Depreciation summarized by
functions
Operating costs $ 50,761 $ 43,698 $ 99,914 $ 83,936
Operating expenses 16,588 13,804 32,524 27,464
$ 67,349 $ 57,502 $ 132,438 $ 111,400
Amortization summarized by

functions
Operating costs $ 506 $ 462 $ 1,008 $ 971
Operating expenses 6,506 5,905 12,992 9,407
$ 7,012 $ 6,367 $ 14,000 $ 10,378
(5) Employee benefit expenses
2018
April 1
to June 30,
2018
2017
April 1
to June 30,
2018
2018
January 1
to June 30,
2018
2017
January 1
to June 30,
2018
Short-term employee benefits
Salaries $ 460,657 $ 404,160 $ 878,977 $ 802,738
Labor and health insurance 25,334 21,505 52,131 45,483
Others 28,452 32,065 55,680 71,322
514,443 457,730 986,788 919,543
Benefits after retirement
Defined contribution plans 20,003 24,784 40,680 37,041
Defined benefit plan (Note 24) 1,975 2,972 3,873 5,456
21,978 27,756 44,553 42,497
$ 536,421 $ 485,486 $ 1,031,341 $ 962,040
Summarized by functions
Operating costs $ 182,322 $ 160,847 $ 353,772 $ 328,367
Operating expenses 354,099 324,639 677,569 633,673
$ 536,421 $ 485,486 $ 1,031,341 $ 962,040
(6) Employee remuneration and directoral compensations
The Company’s remuneration for employees and Directors shall be
2 to 6% and under 3% of the earnings before tax of the year and
before deducting remuneration for employees and Directors. From
April 1 to June 30, 2018, and 2017, and January 1 to June 30, 2018,
and 2017, the estimated ratio of employee and directorial
remuneration is as follows:
Estimated ratio
January 1, 2018
to June 30, 2018
January 1, 2017
to June 30, 2018
Employee remuneration 3.5% 4.4%
Director’s compensations 1.5% 1.6%
Amount
2018
April 1
to June 30,
2018
2017
April 1
to June 30,
2018
2018
January 1
to June 30,
2018
2017
January 1
to June 30,
2018
Employee remuneration $ 12,000 $ 14,108 $ 15,000 $ 24,015
Remuneration to directors and
supervisors
4,832 5,291 6,332 9,006
If changes are made to the amount after the publication of the

Consolidated Annual Financial Report, they apply in accordance
with accounting estimation changes and will be included in the
financial statements of the following year.

Employee compensation and remuneration to directors in 2 017 and
2016 resolved in Board of Directors ’ meetings on April 12, 2018,
and April 5, 2017, respectively, were as follows:
2017 2016
C a s h C a s h
Employee remuneration $ 35,000 $ 58,702
Remuneration to directors
and supervisors 18,000 25,158
The actual employee compensation and remuneration to directors
in 2017 and 2016 were consistent with the amounts recognized in
the Consolidated Financial Statements for the years ended
December 31, 2017, and 2016.
Please refer to the "Market Observation Post System" of Taiwan
Stock Exchange for information on the Company ’s employee
dividend and remuneration for directors.
(7) Gain or loss from exchange
2018
April 1
to June 30,
2018
2017
April 1
to June 30,
2018
2018
January 1
to June 30,
2018
2017
January 1
to June 30,
2018
Total currency exchange gain $ 71,512 $ 10,143 $ 107,048 $ 74,633
Total currency exchange loss ( 20,947 ) ( 2,072 ) ( 84,497 ) ( 99,200 )
Net gain (loss) $ 50,565 $ 8,071 $ 22,551 ( $ 24,567 )
28. Income tax
(1) Income tax reconigzed in profit or loss
Major items comprising of the income tax expense are as follows:
2018
April 1
to June 30,
2018
2017
April 1
to June 30,
2018
2018
January 1
to June 30,
2018
2017
January 1
to June 30,
2018
Current income tax
Generated in the current year $ 108,267 $ 53,925 $ 132,718 $ 110,172
Surtax on unappropriated
retained earnings
29,110 68,553 29,110 68,553
Adjustments from previous
years
( 2,373 ) ( 61,474 ) 1,836 ( 59,501 )
135,004 61,004 163,664 119,224
Deferred income tax
Generated in the current year ( 37,322 ) 22,458 ( 152,716 ) 21,610
Changes in tax rates ( 2,748 ) - 76,544 -
( 40,070 ) 22,458 ( 76,172 ) 21,610
$ 94,934 $ 83,462 $ 87,492 $ 140,834
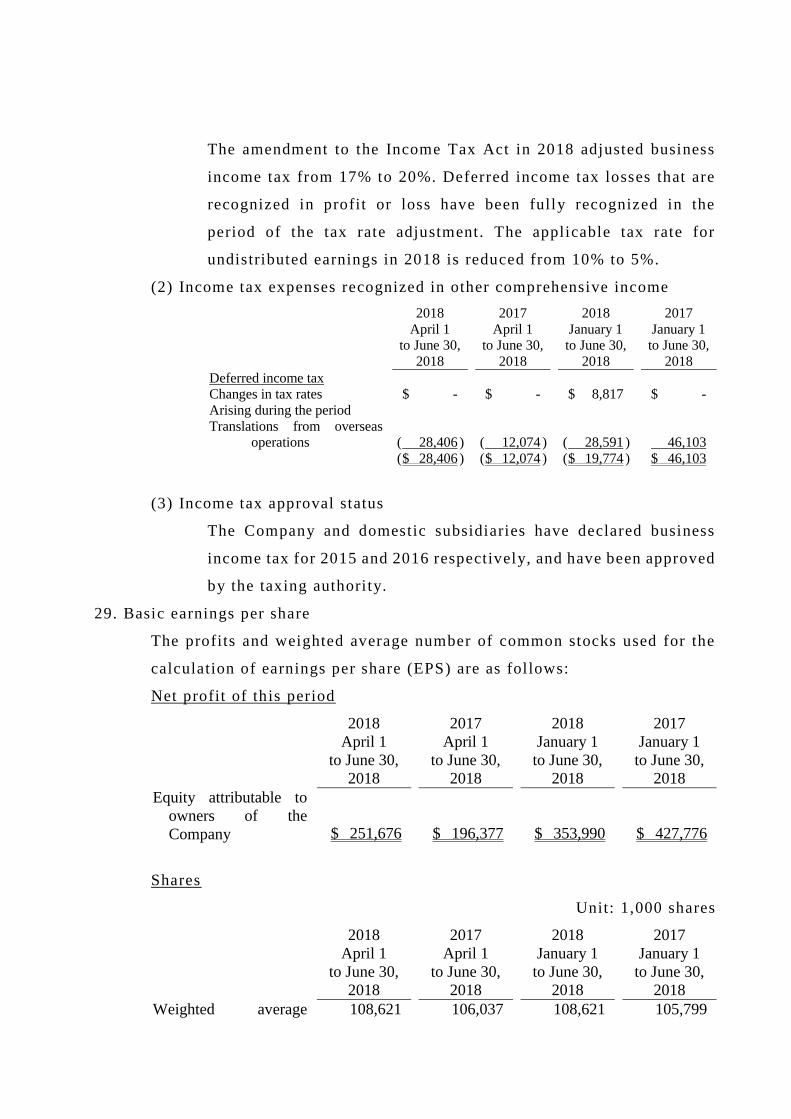
The amendment to the Income Tax Act in 2018 adjusted business
income tax from 17% to 20%. Deferred income tax losses that are
recognized in profit or loss have been fully recognized in the
period of the tax rate adjustment. The applicable tax rate for
undistributed earnings in 2018 is reduced from 10% to 5%.
(2) Income tax expenses recognized in other comprehensive income
2018
April 1
to June 30,
2018
2017
April 1
to June 30,
2018
2018
January 1
to June 30,
2018
2017
January 1
to June 30,
2018
Deferred income tax
Changes in tax rates $ - $ - $ 8,817 $ -
Arising during the period
Translations from overseas
operations ( 28,406 ) ( 12,074 ) ( 28,591 ) 46,103
( $ 28,406 ) ( $ 12,074 ) ( $ 19,774 ) $ 46,103
(3) Income tax approval status
The Company and domestic subsidiaries have declared business
income tax for 2015 and 2016 respectively, and have been approved
by the taxing authority.
29. Basic earnings per share
The profits and weighted average number of common stocks used for the
calculation of earnings per share (EPS) are as follows:
Net profit of this period
2018
April 1
to June 30,
2018
2017
April 1
to June 30,
2018
2018
January 1
to June 30,
2018
2017
January 1
to June 30,
2018
Equity attributable to
owners of the
Company $ 251,676 $ 196,377 $ 353,990 $ 427,776
Shares
Unit: 1,000 shares
2018
April 1
to June 30,
2018
2017
April 1
to June 30,
2018
2018
January 1
to June 30,
2018
2017
January 1
to June 30,
2018
Weighted average 108,621 106,037 108,621 105,799

number of common
stocks used for the
calculation of basic
EPS
Effect of dilutive
potential common
stocks:
Employee remuneration 237 411 423 922
Weighted average
number of common
stocks used for the
calculation of diluted
EPS 108,858 106,448 109,044 106,721
If the Company chooses to offer employees remuneration or share profits
by way of shares or cash, then while calculating the diluted earnings per
share, and assuming that the remuneration is paid in the form of stocks,
the dilutive potential ordinary shares will be included in the weighted
average number of outstanding shares to calculate the diluted earnings per
share. While determining the diluted earnings per share before distributing
shares to employees as remuneration in the following yea r, the dilutive
effects of such potential ordinary shares shall continue to be considered.
30. Business Consolidation
(1) Acquisition of subsidiaries
Primary operating
a c t i v i t i e s Acquisition date
A l l o w n e r s h i p
i n t e r e s t w i t h
v o t i n g r i g h t s
Acquisition ratio
( % ) Transfer price
Noroo-Nan Pao Paints
& Coatings
(Vietnam) Co., Ltd.
Production and
trading of
coatings
April 1, 2017 50/1 $ 5,459
The Company’s acquisition of Noroo-Nan Pao Paints & Coatings
(Vietnam) Co., Ltd. in April 2017 was to achieve the business
expansion effect of the Company. The acquisition ratio was 1%, in
which the shareholding ratio had increased to 50% from 49%. Since
the primary management level was designated by the Company,
hence the Company poses substantial control over Noroo -Nan Pao
Paints & Coatings (Vietnam) Co., Ltd. Please see Note 13 for
relevant explanations.
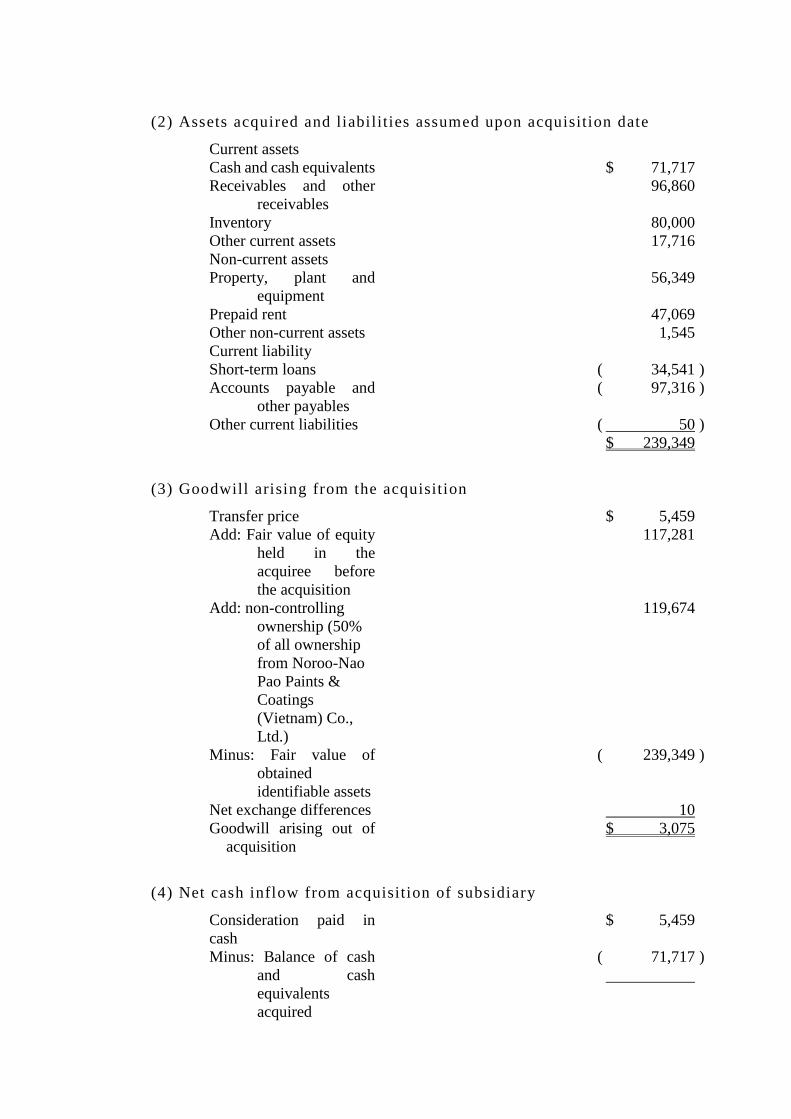
(2) Assets acquired and liabilities assumed upon acquisition date
Current assets
Cash and cash equivalents $ 71,717
Receivables and other
receivables
96,860
Inventory 80,000
Other current assets 17,716
Non-current assets
Property, plant and
equipment
56,349
Prepaid rent 47,069
Other non-current assets 1,545
Current liability
Short-term loans ( 34,541 )
Accounts payable and
other payables
( 97,316 )
Other current liabilities ( 50 )
$ 239,349
(3) Goodwill arising from the acquisition
Transfer price $ 5,459
Add: Fair value of equity
held in the
acquiree before
the acquisition
117,281
Add: non-controlling
ownership (50%
of all ownership
from Noroo-Nao
Pao Paints &
Coatings
(Vietnam) Co.,
Ltd.)
119,674
Minus: Fair value of
obtained
identifiable assets
( 239,349 )
Net exchange differences 10
Goodwill arising out of
acquisition
$ 3,075
(4) Net cash inflow from acquisition of subsidiary
Consideration paid in
cash
$ 5,459
Minus: Balance of cash
and cash
equivalents
acquired
( 71,717 )

( $ 66,258 )
(5) Effects of business consolidation on the management performance
If the acquisition date of the above-said business consolidation was
at the beginning of the fiscal year, the Company ’s pro forma
business revenues from April 1 to June 30, 2017, and January 1 to
June 30, 2017, would have been NT$3,652,976 thousand and
NT$6,995,445 thousand, and pro forma net profit would have been
NT$206,263 thousand, and NT$452,906 thousand respectively.
When such amounts cannot reflect whether the busi ness
consolidation had been completed at the beginning of the fiscal
year in the year of acquisition, the actual revenue and business
performance that could arise for the Company cannot be used
toward predicting future operating performance.
When hypothesizing that the acquisition of Noroo -Nan Pao Paints
& Coatings (Vietnam) Co., Ltd. had been completed at the
beginning of the fiscal year and estimating revenue and net profit
pro forma, the management level would have taken the following
into consideration:
1. Depreciation is calculated based on the carrying amounts of the
pre-acquisition financial statements and the fair value of the
plant and property at the time of the original accounting
treatment; and
2. The borrowing cost will be estimated based on th e capital status,
credit rating, and the debt -to-equity ratio of the Company
after the business consolidation.
31. Equity transaction with non -controlling interests
The Company acquired the remaining 20% of shares from ITLS -SB SDN
BHD in April 2017, and the shareholding ratio had thus increased from
80% to 100%.
The Company had further acquired the remaining 20% of shares from
ITLS-Rich (S) Pte. Ltd. in February 2018, and the shareholding ratio had
thus increased from 80% to 100%.

In addition, in February 2017, the Company’s subscription for the
NT$100,000 thousand new issuances from by Prince Pharmaceutical Co.,
Ltd. was not undertaken according to the shareholding ratio. In April of
the same year, Prince Pharmaceutical Co., Ltd. issued executive stock
option and some employees executed the subscription right, causing the
shareholding ratio to decrease to 49.9%.
As the above-mentioned transactions did not change the control over such
subsidiaries, the Company treated the transactions as equity transactions .
ITLS-Rich
(S)Pte.
Ltd.
ITLS-SB
SDN BHD
P r i n c e
Pharmaceutic
al Co., Ltd.
.
Cash consideration paid $ 1,665 $ 5,991 $ 100,000
The amount that shall be transferred out
of non-controlling interest based on
the calculation of relative changes in
equity in the carrying amount of net
asset from subsidiaries
( 806 )
( 4,630 )
( 122,533 )
Difference in equity transactions $ 859 $ 1,361 ( $ 22,533 )
Equity transaction balance adjustment
Capital surplus - The difference between
the share price received from the
acquisition of a subsidiary and its
book value
$ - $ - $ 22,926
Capital surplus – changes in ownership
of subsidiaries
- - ( 393 )
Retained earnings ( 859 ) ( 1,361 ) -
( $ 859 ) ( $ 1,361 ) $ 22,533
22. Operating lease agreements
The Company’s operating leases are for rental of factories, machinery,
equipment, and office.

The total minimum future payable amount for operating leases that cannot
be annulled is as follows:
2018
June 30
2017
December 31
2017
June 30
Less than 1 year $ 60,713 $ 48,496 $ 58,236
1 to 5 years 141,928 118,428 97,204
More than 5 years 370,984 359,431 351,964
$ 573,625 $ 526,355 $ 507,404
33. Financial instruments
(1) Fair value information - financial instruments not measured at fair
value
The carrying amount of the Company’s financial instrument not
measured at fair value would be a significant approximation of fair
value.
(2) Fair value information - financial instruments measured at fair value
on a repetitive basis
1. Fair value measurement hierarchy
June 30, 2018
L e v e l 1 L e v e l 2 L e v e l 3 T o t a l
Financial assets measured at
FVTOCI
Domestic unlisted stocks: $ - $ - $ 1,559,529 $ 1,559,529
December 31, 2017
L e v e l 1 L e v e l 2 L e v e l 3 T o t a l
Available- for-sale financial
assets
Domestic unlisted stocks: $ - $ - $ 183,580 $ 183,580
June 30, 2017
L e v e l 1 L e v e l 2 L e v e l 3 T o t a l
Available- for-sale financial
assets
Domestic unlisted stocks: $ - $ - $ 183,580 $ 183,580

2. Reconciliation of financial instruments using Level 3 fair value
January 1, 2018 to June 30, 2018
O t h e r
c o m p r e h e n s i v e
income of the year
F i n a n c i a l
i n s t r u m e n t s
m e a s u r e d a t
f a i r v a l u e
Beginning balance $ 183,580
Recognized in other
comprehensive
income
(unrealized gain
or loss from
financial asset
measured at fair
value through
other
comprehensive
income)
1,375,949
December 31 $ 1,559,529
January 1, 2017 to June 30, 2017
Available-for-sale
f i n an c i a l a s s e t s
Beginning balance $ 163,580
Add 20,000
December 31 $ 183,580
3. Valuation technique and input measured at Level 3 fair value
(1) Certain domestic unlisted (or OTC) stocks use the market
method to estimate the fair value. The judgment is based
on the industry type, valuation from a similar type of
business and the Company’s operating status, or in
reference to the Company’s net value.
(2) Certain domestic unlisted (or OTC) equity use the income
approach, in which estimated present value (PV) that
could be obtained through holding the investment is
calculated based on the discounted value of cash fl ow.

Major unobservable inputs are as follows. When the rate
of revenue growth and operating profit increase or the
weighted average cost of capital (WACC) decrease, the
fair value of such investment will increase.
June 30, 2018 December 31, 2017
Achievement rate
of revenue
growth rate and
operating profit
rate 50% 50%
Weighted average
cost of capital
(WACC) 18.47% 18.47%
If the following input values are changed to reflect a
reasonably possible alternative hypothesis, with all other
inputs remaining unchanged, the amount of fair value
increase (decrease) in the equity investment would be as
follows:
June 30, 2018 December 31, 2017
Achievement rate
of revenue
growth rate and
operating profit
rate
Increase by 10% $ 2,490 $ 2,490
Decrease by 10% ( $ 2,589 ) ( $ 2,589 )
Weighted average
cost of capital
(WACC)
Increase by 1% ( $ 697 ) ( $ 697 )
Decrease by 1% $ 698 $ 698
(3) Classification of financial instruments
2018
June 30
2017
December 31
2017
June 30
Financial assets
Loans and receivables (Note 1) $ - $ 7,511,760 $ 7,998,192
Available-for-sale financial assets - 183,580 183,580
Financial assets measured at
amortized cost (Note 2) 7,998,306 - -
Financial assets measured at
FVTOCI 1,559,529 - -

Financial liabilities
Valuation of cost after
amortization 6,864,384 5,855,926 5,902,175
Note 1: Balance refers to the loan and receivables measured at
amortized cost, including cash and cash equivalents,
accounts receivable (including related parties) other
receivables, other financial assets, and refundable deposits.
Note 2: Balance refers to the financial assets measured at
amortized cost, including cash and cash equivalents,
accounts receivable (including related parties) other
receivables, other financial assets, and refundable deposits.
Note 3: Balance refers to the financial liabilities measured at
amortized cost, including short -term loans, short-term notes
payable, accounts payable, other payables, long -term debt
(including maturity within 1 year), and guarantee deposits.
(4) Objectives and policy of financial risk management
The primary financial instruments of the Company include equity
and debt instrument investments, accounts receivable, accounts
payable, and short -term notes payable and loans. The financial
management department provides services for each business unit,
coordinates and operates them to enter domestic and international
financial markets, and analyzes internal risk report based on the
level and scale of risk to monitor and manage the financial risk
relevant to operations of the Company. Such risks include market
risk (including exchange rate risk, interest rate risk, and ot her
pricing risks), credit risk, and liquidity risk.
Material financial activities from the Company are reviewed by the
Board of Directors based on relevant regulations and internal
control. While carrying out financial planning, the financing
department will rigorously abide by segregation of duties and

relevant financial risk control procedures. The internal auditors
will also continue to review compliance to policy and level of risk
exposure. The Company does not undertake transactions of
financial instruments (including derivative financial instruments)
for speculative purposes.
1. Market risks
Due to the Company’s operating activities, most of the
financial risks undertaken by the Company are foreign
exchange risk (see the following summary (1)), inter est rate
risks (see summary (2)), and risks of other pricing.
The management and measurement of market risks of financial
instruments and risk exposure of the merging company remain
unchanged.
(1) Foreign exchange risk
The Company undertakes product sales and purchases in
foreign currencies, leading to the exposure of foreign
exchange risk.
Please see Note 37 for details on the carrying amount of
monetary assets and monetary liabilities denominated by
the Company in non-functional currency at the balance
sheet date (including monetary items denominated in
non-functional currencies that have been charged -off in
the Consolidated Financial Statements).
Sensitivity Analysis
The Company is mostly affected by the exchange rate
fluctuation of the USD and the Vietn amese Dong (VND).
The following table was a sensitivity analysis of the
Company regarding the impact of 1% change in the
functional currency against the exchange rate of each
foreign currency. The sensitivity analysis only includes
monetary items in circulating foreign currency. A
positive figure in the table below indicates the amount of
increase in profit before tax when the functional currency

depreciates by 1% against each relevant foreign currency.
When the functional currency appreciates by 1% against
each relevant foreign currency, the impact on the net
profit will be the negative sum of the same amount.
I n f l u e n c e f r o m t h e U S D
January 1, 2018
to June 30, 2018
January 1, 2017
to June 30, 2018
Profit or loss $ 12,771 $ 14,653 A
I n f l u e n c e f r o m V N D
January 1, 2018
to June 30, 2018
January 1, 2017
to June 30, 2018
Profit or loss $ 6,364 $ 4,148 B
A. Mainly derived from cash and cash equivalents,
receivables, payables and borrowings denominated in
USD that are stil l outstanding on the Balance Sheet
date and have not been hedged by cash flows.
B. Mainly derived from cash and cash equivalents,
receivables, payables and borrowings denominated in
Vietnamese Dong that is st ill outstanding on the
Balance Sheet date and has not been hedged by cash
flows.
(2) Interest rate risk
As the individual entities in the Company borrow capital
with both fixed and floating rates, there is exposure to
interest rate risk. The Company manages interest rate
risk by maintaining an appropria te mix of fixed and
floating rates.
The nominal value of financial assets exposed to interest
rate and the nominal value of financial liabili ties of the
Company on the balance sheet date are as follows:
2018
June 30
2017
December 31
2017
June 30
Interest rate risks
with cash flow
Financial assets $ 3,134,069 $ 3,268,202 $ 4,364,837
Financial liabilities 3,383,899 2,944,541 2,733,329

Sensitivity Analysis
The sensitivity analysis on interest rate risks is based on
exposure of non-derivative instruments to interest rate
risks on the balance sheet date. For liabilities on float
rate, the analysis assumes them to be in external
circulation on the reporting date (to be in external
circulation throughout the reporting pe riod).

When interest rate increases (or decreases) by 1%, when
all other variables are unchanged, the Company ’s profit
before tax from January 1 to June 30, 2018, and 2017 will
increase/decrease by NT$16,919 thousand and
NT$13,667 thousand respectively. This is mostly due to
changes in the Company’s interest rate from loans.
(3) Risks to other prices
The Company is exposed to equity price risk due to
investments in domestic unlisted equity. As there is no
open market quotation for such equity pricing, the price
risk is immaterial.
2. Credit risk
Credit risks refer to risks that cause financial loss to the
Group due to borrower ’s delay in honoring contractual
obligations. As of the balance sheet date, the Company ’s
largest credit risk exposure from counter party’s failure to
fulfill obligation comes from the carrying amount of financial
assets recognized in the Consolidated Balance Sheet.
As counterparties of the Company are all business
organizations with fair credit rating, there is no anticipated
material credit risk. The Company also continues to evaluate
the financial status of clients for accounts receivables.
The amount of accounts receivable with a significant
concentration of credit risk is as follows:
June 30, 2018 December 31, 2017 June 30, 2017
S u m % S u m % S u m %
Group A $ 341,130 10 $ 279,978 9 $ 338,763 12
3. Liquidity risk
The Company manages and maintains sufficient cash and cash
equivalents and readily available financial products to support
the Company’s operations and to mitigate the effects of
fluctuations in cash flows. The management of the Company

supervises the use of financing credit from banks and ensures
compliance with the terms of loan agreements.
The Company’s working capital and financing cred it from
banks can sufficiently accommodate future operational needs.
Hence, there is no liquidity risk due to the inability to raise
funds to fulfill contractual obligations.
(1) Liquidity of non-derivative financial l iabil ities and table
of interest rate risk
The contractual maturity analysis of balances for non -
derivative financial l iabil ities is calculated based on the
earliest required loan repayment date of the Company. It
is compiled based on the undiscounted cash flows of the
financial liabilities (including principal and estimated
interest). Therefore, the following table presents the
bank loans that the Company may be asked to
immediately repay first, regardless of the chances of the
banks in exercising such right. The analysis of the
maturity of other non-derivative l iabilities is prepared in
accordance with the agreed repayment date.
The undiscounted payment relating to borrowings with
floating interest rates is extrapolated based on the
estimated interest rate yield curve on the balance sheet
date.
June 30, 2018
Less than 1
year 1 to 2 years 2 to 5 years
More than 5
years
Non-derivative
financial
liabilities
Non-interest-
bearing
liabilities
$ 3,378,687 $ 1,867 $ - $ -
Fixed interest rate
instruments
100,000 - - -
Floating interest
rate instruments
1,779,856 1,343,750 322,399 -
$ 5,258,543 $ 1,345,617 $ 322,399 $ -
December 31, 2017

Less than 1
year 1 to 2 years 2 to 5 years
More than 5
years
Non-derivative
financial
liabilities
Non-interest-
bearing
liabilities
$ 2,790,321 $ 1,141 $ - $ -
Fixed interest rate
instruments
120,000 - - -
Floating interest
rate instruments
1,355,424 1,311,736 334,369 -
$ 4,265,745 $ 1,312,877 $ 334,369 $ -
June 30, 2017
Less than 1
year 1 to 2 years 2 to 5 years
More than 5
years
Non-derivative
financial
liabilities
Non-interest-
bearing
liabilities
$ 3,016,902 $ 2,137 $ - $ -
Fixed interest rate
instruments
150,000 - - -
Floating interest
rate instruments
1,588,486 1,180,287 - -
$ 4,755,388 $ 1,182,424 $ - $ -
The above-mentioned amount of non-derivative financial
asset and liability instruments with floating interests are
subject to change due to floating rates and differences in
interest rate estimated as of the balance sheet date.

(2) Financing credit
2018
June 30
2017
December 31
2017
June 30
Unsecured bank
borrowing credit
(to be reviewed in
each year)
Amount used $ 3,519,747 $ 3,096,995 $ 3,005,343
Amount available 4,455,772 4,254,100 3,224,145
$ 7,975,519 $ 7,351,095 $ 6,229,488
Secured bank
borrowing
Amount used $ 60,000 $ 60,000 $ 60,000
Amount available 40,000 40,000 40,000
$ 100,000 $ 100,000 $ 100,000
34. Related party transactions
All transactions between the Company and its subsidiaries (related parties
of the Company), account balances, income, and expenses are disregarded
during consolidation and therefore are not shown in this Note. In addit ion
to those disclosed in other Notes, the transactions between the Company
and other related parties are as follows.
(I) The names and relations of related parties
N a m e o f r e l a t e d p a r t y R e l a t i o n s w i t h t h e c o m p a n y
Hsin-Tsung Industrial Co., Ltd. Affiliate enterprises
Fu Fu Lu Industrial Co., Ltd. Other affiliates (the Chairman of the
company is an executive of the
Company)
Noroo-Nan Pao Paints & Coatings
(Vietnam) Co., Ltd.
Affiliate enterprises (subsidiaries of
the Company as of April 2017)
Pou Chen Group and subsidiaries Investors with significant influence
Kunshan Nan Pao Coatings
Engineering Co., Ltd.
Other affiliates (the Chairman of the
Company is an executive of the
Company prior to May 2018.)
(2) Operating revenue
C a t e g o r y o f r e l a t e d
p a r t i e s / N a m e
2018
April 1
to June 30,
2018
2017
April 1
to June 30,
2018
2018
January 1
to June 30,
2018
2017
January 1
to June 30,
2018
Investors with significant
influence
Pou Chen Group and
subsidiaries
$ 338,032
$ 347,039 $ 621,883 $ 692,882
Affiliate enterprises - - - 23,986

Other related parties 13,369 14,891 19,624 24,004
$ 351,401 $ 361,930 $ 641,507 $ 740,872
There is no significant difference between the Company ’s selling
price to related parties and from average customers. Payment term
is 30 to 125 days, which shows no significant difference between
non-related parties.
(3) Inventory
Category of related parties
2018
April 1
to June 30,
2018
2017
April 1
to June 30,
2018
2018
January 1
to June 30,
2018
2017
January 1
to June 30,
2018
Affiliate enterprises $ 4,553 $ 11,587 $ 7,132 $ 14,748
There is no significant difference between the Company ’s purchase
price from related parties and from non -affiliates. Payment term is
30 days to 45 days, which shows no significant difference between
non-related parties.
(4) Receivables from related parties
Accounting item
Category of re la ted
p a r t i e s
2018
June 30
2017
December
31
2017
June 30 Accounts
receivable
Investors with
significant influence
Pou Chen Group and
subsidiaries
$ 341,130 $ 279,978 $ 338,763
Other related parties - 51,852 29,041
$ 341,130 $ 331,830 $ 367,804
No guarantee is received for outstanding receivables from related
parties.
(5) Payable to related parties
Accounting item
Category of re la ted
p a r t i e s
2018
June 30
2017
December
31
2017
June 30 Accounts payable Affiliate enterprises $ 4,560 $ 5,714 $ 2,317
Other payables Investors with
significant influence
$ 136 $ 135 $ 25,562
No guarantee is given for outstanding payables to related parties.
(6) Others
Return liability - June 30, 2018

C a t e g o r y o f r e l a t ed
p a r t i e s / N a m e
Investors with significant
influence
Pou Chen Group and
subsidiaries
$ 89,121

(7) Managerial remuneration
2018
April 1
to June 30,
2018
2017
April 1
to June 30,
2018
2018
January 1
to June 30,
2018
2017
January 1
to June 30,
2018
Short-term employee benefits $ 17,699 $ 15,638 $ 29,952 $ 31,519
Benefits after retirement 767 496 1,024 860
$ 18,466 $ 16,134 $ 30,976 $ 32,379
Remuneration to directors and other executives are determined by
the Remuneration Committee in reference to compensations from
the industry standard, individual performance, company
performance, and reasonable ties to future risks.
35. Assets pledged as collateral
The following assets are provided as collateral for customs duties, letters
of credit and long-term and short-term financing and borrowings:
2018
June 30
2017
December 31
2017
June 30
Property, plant and equipment $ 111,723 $ 112,406 $ 113,089
Time deposits 15,057 18,037 5,632
Bank demand deposit 727 749 735
$ 127,507 $ 131,192 $ 119,456
36. Significant contingent liability and unrecognized contract commitments
In addition to those stated in the other Notes, the Company has the
following significant contingent liability and recognized contract
commitments as of the balance sheet date:
(1) As of June 30, 2018, December 31, 2017, and June 30, 2017, the
number of unused credits issued by the Company for procurement
of raw material and machinery and equipment are NT$86,709
thousand, NT$83,526 thousand, and NT$82,165 thousand
respectively.
(2) Unrecognized contract commitments of the Company were as follows:
2018
June 30
2017
December 31
2017
June 30
Purchase of property, plant, and
equipment $ 98,290 $ 60,053 $ 60,007
Procurement of raw material 55,343 - -
$ 153,633 $ 60,053 $ 60,007


(3) Material lawsuits
The Company had won the bid for land, plant, and machinery
equipment owned by He Kui Chemical Company from Taiwan
Changhua District Court in 2007 and sold the above assets to
subsidiary Nan Pao Chemical Co., Ltd. for production purposes.
On January 31, 2008, third-party Fu-chien Management Consulting
Company claimed to be the mortgagee of the aforementioned
machinery and equipment at Taiwan Changhua District Court and
seized the batch of machinery and equipment. Subsidiary Nan Pao
Chemical Co., Ltd. has filed for Third Party of Dissent Action
arguing that Fu-chien Management Consulting Company’s claims
over the above-mentioned machinery and equipment were false.
Nevertheless, a fire had broken out in subsidiary Nan Pao Chemical
Co., Ltd. in January 2010, and the plant and machinery were all
burnt down. Hence, the content of the li tigation was changed to
confirming whether the machinery had belonged to Nan Pao
Chemical Co., Ltd. If the court believed that the machinery was
not the property of Nan Pao Chemical Co., Ltd., and was destroyed
due to its negligence, Nan Pao Chemical Co., Ltd. would be liable
for damage. In June 2017, the Supreme Court of Taiwan ruled in
the civil lawsuit that the machinery and equipment did not belong
to subsidiary Nan Pao Chemical Co., Ltd.
Based on the ruling of Taiwan Changhua District Court , He Kui
Chemical Company argued for ownership of the machinery and
equipment in the plant. Based on the above -mentioned, He Kui
Chemical Company filed for indemnity lawsuit against Nan Pao
Chemical Co., Ltd. for damage caused by the use of machinery and
equipment, and sought for indemnity of NT$53,102 thousand.
Nevertheless, the amount that He Kui Chemical Company claimed
for was based on the purchase price of the machinery and
equipment, and did not factor in depreciation based on the useful
life of property, plant, and equipment. The batch of machinery was
purchased in the ‘90s to early 2000 ’s, with the surplus value under

NT$53,102 thousand. The Consolidated Company has appropriated
NT$38,445 thousand liability reserve based on the remaining value.
As of the publication date of the Consolidated Financial Statements,
the indemnity lawsuit with He Kui Chemical Company was still
being ruled at Taiwan Changhua District Court .
37. Information regarding the significant assets and liabilities denominated in
foreign currencies
The following information was summarized by foreign currencies of
entit ies within the Group. The exchange rates were ones used to translate
the foreign currencies into the functi onal currency. Information regarding
the significant assets and liabilit ies denominated in foreign currencies is
listed below:

Unit: Each foreign currency and NTD are both denominated in 1000 ’s.
June 30, 2018
F i n a n c i a l a s s e t s Foreign currency E x c h a n g e r a t e A t b o o k va l u e
Monetary items
USD $ 45,603 30.42
(USD:NTD)
$ 1,387,175
USD 9,672 6.6166
(USD:CNY)
294,609
USD 6,394 14,300
(USD:IDR)
194,756
USD 6,548 7.8482
(USD:HKD)
199,443
USD 2,978 22,844
(USD:VND)
90,717
Vietnamese Dong 592,552,801 0.000044
(VND:USD)
792,639
Malaysian ringgit 29,275 0.3352
(MYR:AUD)
220,744
F i n a n c i a l l i a b i l i t i e s
Monetary items
USD 6,407 30.39
(USD:NTD)
194,682
USD 5,715 6.6165
(USD:CNY)
174,089
USD 4,407 7.8485
(USD:HKD)
134,232
USD 4,526 14,300
(USD:IDR)
137,861
USD 2,894 22,811
(USD:VND)
88,016
USD 5,277 1.3541
(USD:AUD)
160,725
Vietnamese Dong 117,007,977 0.000044
(VND:USD)
156,272

December 31, 2017
F i n a n c i a l a s s e t s Foreign currency E x c h a n g e r a t e A t b o o k va l u e
Monetary items
USD $ 46,268 29.76
(USD:NTD)
$ 1,376,957
USD 11,065 6.534
(USD:CNY)
329,280
USD 6,994 13,345
(USD:IDR)
208,133
USD 4,670 7.8113
(USD:HKD)
138,868
Hong Kong Dollar 25,686 0.1279
(HKD:USD)
97,787
Vietnamese Dong 480,353,227 0.000044
(VND:USD)
628,619
F i n a n c i a l l i a b i l i t i e s
Monetary items
USD 5,151 29.79
(USD:NTD)
153,429
USD 4,623 6.5342
(USD:CNY)
137,577
USD 4,139 7.8172
(USD:HKD)
123,176
USD 6,102 13,345
(USD:IDR)
181,592
USD 4,445 22,745
(USD:VND)
120,303
Vietnamese Dong 108,485,564 0.000044
(VND:USD)
142,398
June 30, 2017
F i n a n c i a l a s s e t s Foreign currency E x c h a n g e r a t e A t b o o k va l u e
Monetary items
USD $ 48,768 30.5344
(USD:NTD)
$ 1,489,091
USD 2,003 6.7744
(USD:CNY)
60,933
USD 9,979 13,056
(USD:IDR)
303,576
USD 2,688 24,913
(USD:VND)
81,711
Hong Kong Dollar 18,194 0.1293
(HKD:USD)
71,535
(Continued on the next page)
(Continued from the previous page)
F i n a n c i a l a s s e t s Foreign currency E x c h a n g e r a t e A t b o o k va l u e

Australian Dollar $ 6,027 0.7674
(AUD:USD)
$ 140,693
Vietnamese Dong 425,701,409 0.000044
(VND:USD)
569,647
F i n a n c i a l l i a b i l i t i e s
Monetary items
USD 3,274 30.2253
(USD:NTD)
98,970
USD 10,323 6.7797
(USD:CNY)
314,273
USD 823 1.3031
(USD:AUD)
25,045
USD 1,044 13,056
(USD:IDR)
31,764
Vietnamese Dong 125,085,098 0.000041
(VND:USD)
154,828
The Company mostly undertakes exchange rate risk in US Dollars. The
following information is aggregated in terms of the functional currency of
the foreign currency held. The exchange rate disclosed is the exchange
rate of the functional currency into the presentation currency. The
following are significant influences on currency exc hange gain or loss
(realized and unrealized):
January 1, 2018 to June 30, 2018 January 1, 2017 to June 30, 2017
F u n c t i o n a l
c u r r e n c y
Functional currency
and p resent a t i on
c u r r e n c y
Net exchange
profit or loss
Functional currency
and p resent a t i on
c u r r e n c y
Net exchange
profit or loss
USD 29.774
(USD:NTD)
( $ 4,116 ) 30.256
(USD:NTD)
( $ 703 )
NTD 1
(NTD:NTD)
51,037 1
(NTD:NTD)
8,793
CNY 4.669
(CNY:NTD)
5,449 4.412
(CNY:NTD)
4,186
Singaporean
dollar
22.33
(SGD:NTD)
205 21.73
(SGD:NTD)
222
Australian
Dollar
22.54
(AUD:NTD)
( 5,208 ) 22.71
(AUD:NTD)
( 1,176 )
Indonesian
rupiah
0.00213
(IDR:NTD)
3,004 0.00230
(IDR:NTD)
( 4,635 )
Vietnamese
Dong
0.00118
(VND:IDR)
( 525 ) 0.00121
(VND:IDR)
( 1,874 )
Others 719 3,258
$ 50,565 $ 8,071
January 1, 2018, to June 30, 2018 January 1, 2017 to June 30, 2017

F u n c t i o n a l
c u r r e n c y
Functional currency
and p resent a t i on
c u r r e n c y
Net exchange
profit or loss
Functional currency
and p resent a t i on
c u r r e n c y
Net exchange
profit or loss
USD 29.537
(USD:NTD)
( $ 4,214 ) 30.675
(USD:NTD)
$ 5,902
NTD 1
(NTD:NTD)
26,706 1
(NTD:NTD)
( 48,153 )
CNY 4.64
(CNY:NTD)
( 2,812 ) 4.4645
(CNY:NTD)
4,637
Singaporean
dollar
22.27
(SGD:NTD)
70 21.840
(SGD:NTD)
1,789
Australian
Dollar
22.785
(AUD:NTD)
( 3,379 ) 23.135
(AUD:NTD)
( 521 )
Indonesian
rupiah
0.00215
(IDR:NTD)
4,769 0.00233
(IDR:NTD)
( 1,018 )
Vietnamese
Dong
0.0013
(VND:IDR)
( 95 ) 0.00122
(VND:IDR)
2,439
Others 1,506 10,358
$ 22,551 ( $ 24,567 )
38. Other disclosures
Information on (1) Significant Transactions and (2) Investees
1. Financing provided (Table 1)
2. Endorsements/guarantees provided to others (Table 2)
3. Marketable securities held at balance sheet date (excluding
investments in subsidiaries, associates, and joint ventures)
(Table 3)
4. Accumulated purchase or disposal of individual mar ketable
securities in excess of NT$300 million or 20% of the paid -in
capital (None)
5. Acquisition of real estate at price in excess of NT$300 million
or 20% of the paid-in capital (None)
6. Disposal of real estate at price in excess of NT$300 million or
20% of the paid-in capital (None)
7. Purchases and sales with related parties in excess of NT$100
million or 20% of the paid-in capital (Table 4)
8. Amount of receivable from related parties in excess of NT$100
million or 20% of its paid-in capital (Table 5)
9. Derivative financial instrument transactions (None)
10. Others: intercompany relationships and significant

intercompany transactions (Table 9)
11. Information on investees (Table 6)
(3) Information on Investments in Mainland China:
1. China investees’ names, business i tems, amounts of paid -in
capital, investment methods, capital transaction conditions,
shareholding ratios, investment gains and losses, the ending
investment book value, investment income repatriation and
limits of investment in China. (Table 7)
2. Significant transactions with China investee company through
direct or indirect third region, and their prices, terms of
payment, unrealized gains and losses: (Table 8)
(1) Purchase amount and percentage, and the ending balance
and percentage of payables.
(2) Sales amount and percentage, and the ending balance and
percentage of receivables.
(3) Property transaction amount and the resulting gain or loss.
(4) Ending balance of endorsement, guarantee or collateral
provided and purposes .
(5) The maximum balance, ending balance, interest rate range
and the total amount of current interest in financing.
(6) Other transactions having a significant impact on profit or
loss or financial status of the period, such as providing
or receiving services.

39. Segment Information
The information is provided to the main business decision -maker to
allocate resources and assess the performance of each department and
focus on the type of product or service delivered or provided. The
Company shall report on the following information for segments:
Segment revenue and operations
The income and results of ongoing operations of the merging company
based on the reporting departments are analyzed as follows:
T a i w a n
M a i n l a n d
C h i n a V i e t n a m A u s t r a l i a Other Regions
Adjus tments
and charge off T o t a l
January 1, 2018 to June 30, 2018
Revenue
Revenue from external
customers
$ 1,735,081 $ 2,722,453 $ 1,526,292 $ 982,653 $ 613,407 $ - $ 7,579,886
Revenue between segments 1,200,911 475,125 290,148 13,036 14,712 ( 1,993,932 ) -
Total revenue $ 2,935,992 $ 3,197,578 $ 1,816,440 $ 995,689 $ 628,119 ( $ 1,993,932 ) $ 7,579,886
Segment profit (loss) $ 143,389 $ 15,271 $ 67,318 $ 23,854 $ 34,018 $ 26,364 $ 310,214
Interest income 17,226
Other income 112,123
Other income 32,184
Interest expense ( 29,247 )
Share of profit (loss) of
associates accounted for using
the equity method
12,709
Pre-tax profit $ 455,209
January 1, 2017, to June 30,
2017
Revenue
Revenue from external
customers
$ 1,652,149 $ 2,106,459 $ 1,583,389 $ 902,455 $ 641,783 $ - $ 6,886,235
Revenue between segments 1,366,871 425,752 81,639 12,360 27,578 ( 1,914,200 ) -
Total revenue $ 3,019,020 $ 2,532,211 $ 1,665,028 $ 914,815 $ 669,361 ( $ 1,914,200 ) $ 6,886,235
Segment profit (loss) $ 242,295 $ 33,421 $ 179,546 $ 44,406 $ 51,138 $ 68,373 $ 619,179
Interest income 9,260
Other income 50,399
Other income ( 76,684 )
Interest expense ( 23,442 )
Share of profit (loss) of
associates accounted for using
the equity method
8,362
Pre-tax profit $ 587,074
Segment profit/loss refers to the profit made by each segment and excludes
non-operating income and expense nor income tax expense. The
assessment is provided to the main business decision -maker to allocate
resources to segments and assess their performance.
The main business decision-maker of the Company will form decisions
based on the operating performance of each type. Information on classified
assets and liabilities from different business activities are not evaluated,
and only the operating results of the reportable segments are shown.
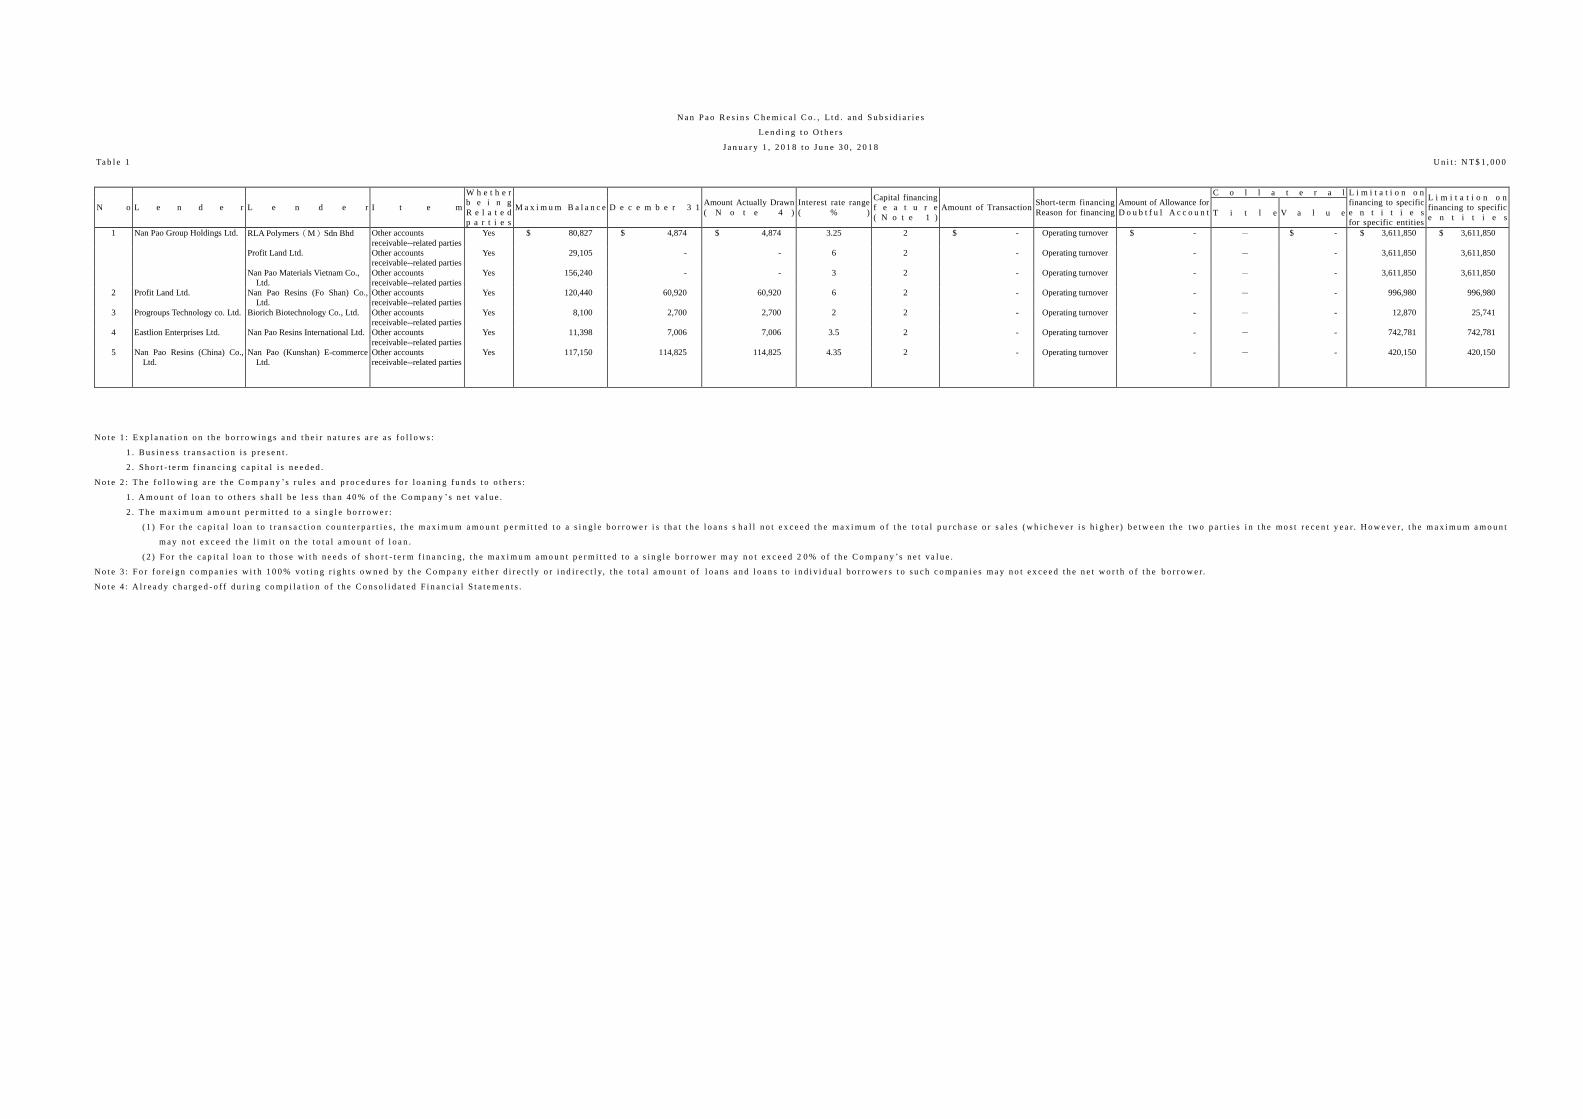
N a n P a o R e s i n s C h e m i c a l C o . , L t d . a n d S u b s i d i a r i e s
L e n d i n g t o O t h e r s
J a n u a r y 1 , 2 0 1 8 t o J u n e 3 0 , 2 0 1 8
Ta b l e 1 U n i t : N T $ 1 , 0 0 0
N o L e n d e r L e n d e r I t e m
W h e t h e r
b e i n g
R e l a t e d
p a r t i e s
M a x i m u m B a l a n c e D e c e m b e r 3 1 Amount Actually Drawn
( N o t e 4 )
Interest rate range
( % )
Capital financing
f e a t u r e
( N o t e 1 )
Amount of Transaction Short-term financing
Reason for financing
Amount of Allowance for
D o u b t f u l A c c o u n t
C o l l a t e r a l L i m i t a t i o n o n
financing to specific
e n t i t i e s
for specific entities
L i m i t a t i o n o n
financing to specific
e n t i t i e s T i t l e V a l u e
1 Nan Pao Group Holdings Ltd. RLA Polymers(M)Sdn Bhd Other accounts
receivable--related parties
Yes $ 80,827 $ 4,874 $ 4,874 3.25 2 $ - Operating turnover $ - - $ - $ 3,611,850 $ 3,611,850
Profit Land Ltd. Other accounts
receivable--related parties
Yes 29,105 - - 6 2 - Operating turnover - - - 3,611,850 3,611,850
Nan Pao Materials Vietnam Co.,
Ltd.
Other accounts
receivable--related parties
Yes 156,240 - - 3 2 - Operating turnover - - - 3,611,850 3,611,850
2 Profit Land Ltd. Nan Pao Resins (Fo Shan) Co.,
Ltd.
Other accounts
receivable--related parties
Yes 120,440 60,920 60,920 6 2 - Operating turnover - - - 996,980 996,980
3 Progroups Technology co. Ltd. Biorich Biotechnology Co., Ltd. Other accounts
receivable--related parties
Yes 8,100 2,700 2,700 2 2 - Operating turnover - - - 12,870 25,741
4 Eastlion Enterprises Ltd. Nan Pao Resins International Ltd. Other accounts
receivable--related parties
Yes 11,398 7,006 7,006 3.5 2 - Operating turnover - - - 742,781 742,781
5 Nan Pao Resins (China) Co.,
Ltd.
Nan Pao (Kunshan) E-commerce
Ltd.
Other accounts
receivable--related parties
Yes 117,150 114,825 114,825 4.35 2 - Operating turnover - - - 420,150 420,150
N o t e 1 : E x p l a n a t i o n o n t h e b o r r o w i n g s a n d t h e i r n a t u r e s a r e a s f o l l o w s :
1 . B u s i n e s s t r a n s a c t i o n i s p r e s e n t .
2 . S h o r t - t e r m f i n a n c i n g c a p i t a l i s n e e d e d .
N o t e 2 : T h e f o l l o w i n g a r e t h e C o m p a n y ’s r u l e s a n d p r o c e d u r e s f o r l o a n i n g f u n d s t o o t h e r s :
1 . A m o u n t o f l o a n t o o t h e r s s h a l l b e l e s s t h a n 4 0 % o f t h e C o m p a n y ’s n e t v a l u e .
2 . T h e m a x i m u m a m o u n t p e r m i t t e d t o a s i n g l e b o r r o w e r :
( 1 ) F o r t h e c a p i t a l l o a n t o t r a n s a c t i o n c o u n t e r p a r t i e s , t h e m a x i m u m a m o u n t p e r m i t t e d t o a s i n g l e b o r r o w e r i s t h a t t h e l o a n s s h a l l n o t e x c e e d t h e m a x i m u m o f t h e t o t a l p u r c h a s e o r s a l e s ( w h i c h e v e r i s h i g h e r ) b e t w e e n t h e t w o p a r t i e s i n t h e m o s t r e c e n t y e a r. H o w e v e r , t h e m a x i m u m a m o u n t
m a y n o t e x c e e d t h e l i m i t o n t h e t o t a l a m o u n t o f l o a n .
( 2 ) F o r t h e c a p i t a l l o a n t o t h o s e w i t h n e e d s o f s h o r t - t e r m f i n a n c i n g , t h e m a x i m u m a m o u n t p e r m i t t e d t o a s i n g l e b o r r o w e r m a y n o t e x c e e d 2 0 % o f t h e C o m p a n y ’s n e t v a l u e .
N o t e 3 : F o r f o r e i g n c o m p a n i e s w i t h 1 0 0 % v o t i n g r i g h t s o w n e d b y t h e C o m p a n y e i t h e r d i r e c t l y o r i n d i r e c t l y, t h e t o t a l a m o u n t o f l o a n s a n d l o a n s t o i n d i v i d u a l b o r r o w e r s t o s u c h c o m p a n i e s m a y n o t e x c e e d t h e n e t w o r t h o f t h e b o r r o w e r.
N o t e 4 : A l r e a d y c h a r g e d - o f f d u r i n g c o m p i l a t i o n o f t h e C o n s o l i d a t e d F i n a n c i a l S t a t e m e n t s .

Nan Pao Resins Chemical Co. , Ltd . and Subsid iar ies
Provis ions of Endorsements /Guarantees
January 1 , 2018, to June 30 , 2018
Table 2 Unit : NT$1,000
C e i l i n g l i m i t o n
endorsements and
g u a r a n t e e s f o r a
s i n g l e en t e rp r i s e
( N o t e 2 )
Property-guaranteed A g g r e g a t e d
e n d o r s e m e n t o r
guarantee amount
E n d o r s e m e n t /
G u a r a n t e e
Endorsem
e n t
guarantee
f o r t h e
subsidiary
b y t h e
p a r e n t
company
Endorsem
e n t
guarantee
f o r t h e
p a r e n t
company
b y t h e
subsidiary
f o r
Endorsement/Guarantee
P r o v i d e r
G u a r a n t e e d P a r t y E n d o r s e m e n t o r
guarantee amount
Highest endorsement
or guarantee amount
for current period
At end of the Period . Ratio of which on
t h e f i n a n c i a l
s t a t e m e n t s
M a x i m u m
A m o u n t
F o r
subsidiari
e s
F o r t h e
p a r e n t
company
Mainland
C h i n a
No C o m p a n y n a m e C o m p a n y n a m e Relation (Note
1 )
( N o t e 2 ) E n d o r s e m e n t o r
guarantee amount
E n d o r s e m e n t o r
guarantee amount
Amount Actua l ly
D r a w n
Guarantee amount Ratio on net value
( % )
( N o t e 2 ) Endorsem
e n t /
Guarantee
Endorsem
e n t /
Guarantee
Endorsem
e n t /
Guarantee
0 Nan Pao Resins Chemical
Co., Ltd.
NP Australia Pty Ltd. 2 $ 1,753,279 $ 117,775 $ - $ - $ - - $ 6,136,477 Y N N
ITLS-SB SDN BHD 2 1,753,279 9,138 9,138 - - 0.10 6,136,477 Y N N
Phytomed Bio-tec 2 1,753,279 10,000 10,000 - - 0.11 6,136,477 Y N N
ITLS-Rich(S)Pte. Ltd. 2 1,753,279 15,230 15,230 - - 0.17 6,136,477 Y N N
Nan Pao Resins Chemical Philippines,
Inc.
2 1,753,279 15,230 15,230 - - 0.17 6,136,477 Y N N
ITLS Holding Pte. Ltd. 2 1,753,279 45,690 45,690 - - 0.52 6,136,477 Y N N
ITLS International Development Co., Ltd. 2 1,753,279 50,000 50,000 974 - 0.57 6,136,477 Y N N
Nan Pao Advanced Materials Vietnam
Co., Ltd.
2 1,753,279 60,920 60,920 - - 0.69 6,136,477 Y N N
Nan Pao Materials Vietnam Co., Ltd. 2 1,753,279 91,380 91,380 36,271 - 1.04 6,136,477 Y N N
RLA Polymers (M) SDN BHD 2 1,753,279 91,380 91,380 91,380 - 1.04 6,136,477 Y N N
RLA Polymers Pty Ltd. 2 1,753,279 385,495 262,526 132,721 - 2.99 6,136,477 Y N N
Nan Pao Resins International Ltd. 2 1,753,279 304,600 304,600 - - 3.47 6,136,477 Y N N
Nan Pao Group Holdings Ltd. 2 1,753,279 635,460 395,980 - - 4.52 6,136,477 Y N N
Nan Pao (Kunshan) E-commerce Ltd. 2 1,753,279 30,460 - - - - 6,136,477 Y N Y
Progroups Technology co. Ltd. 2 1,753,279 10,000 10,000 - - 0.11 6,136,477 Y N N
PT. Indo Nan Pao Resins Chemical 2 1,753,279 90,680 60,920 30,460 - 0.69 6,136,477 Y N N
Note 1 : Re lat ionship between the endorser/guaran tor and the Compan y is c lass i f i ed in to the fo l lowing categor ies :
(1) Companies with business relat ionship
2 . A compan y in which the Compan y, d i rect l y and indirect l y, holds more than 50 percent of the vot ing r ights
3 . A compan y tha t d i rect ly and indi rect l y ho lds more than 50 percent of the vot ing r igh ts in the Company
4 . Between compan ies in which the Company, d irect l y and indi rect l y, ho lds more than 90 percent of the vot ing r igh ts
5 . Companies wi th the same indust ry or mutual pro ject undertakers tha t have mutual guarantee based on contrac t agreements due to cont ractual p ro ject needs
6 . Jo in t ven ture endorsed /guaranteed b y shareholders based on the ir ho ld ing ra t io
7 . The performance guarantee of the p re -sa le house sa les cont ract in the in te r -bank business in accordance wi th the Consumer Protec t ion Law is jo in t l y guaranteed
Note 2 : The Company ’s maximum guarantee and the endorsement for a s ingle business is no more than 20% of the Compan y ’s ending ne t va lue, and the maximum, d i rec t l y and indirect l y, o r endorsemen t is no more than 70%
of the Compan y’s endin g net va lue.


Nan Pao Resins Chemical Co., Ltd. and Subsidiaries
Details on marketable securities held at the end of the period
June 30, 2018
Table 3 Unit: NT$1,000
Company holding shares Type and name of securi t ies
Relationship with the
Relationship with the
i s s u e r
A c c o u n t i n g i t e m
A t e n d o f t h e P e r i o d
R e m a r k s Number of shares A t b o o k v a l u e
Percentage of
s h a r e s ( % ) F a i r v a l u e
Nan Pao Resins Chemical
Co., Ltd.
Dairen Chemical Corp. - publicly
owned company
None The financial asset in
other comprehensive
income measured at
fair value through
profit and loss - non-
current
6,515,606 $ 1,529,325 2 $ 1,529,325
Hua Chi Venture Capital Co., Ltd.
- privately-issued equity
. . 157,895 3,878 1 3,878
Hsin Sheng Photovaltaic Co., Ltd.
- privately-issued equity
. . 1,600,000 7,171
10 7,171
$ 1,540,374 $ 1,540,374
Nan Pao Chemical Company
Ltd.
Ace Chemical Corp. - privately-
issued equity
None The financial asset in
other comprehensive
income measured at
fair value through
profit and loss - non-
current
653,800 $ 19,155 10 $ 19,155
Note 1: Marketable securities in the table refer to stocks, bonds, beneficiary certificates, and other related derivative securit ies within the scope of IAS 39: Financial instruments:
recognition and measurement.
Note 2: Please see Table 6 and Table 7 for information on investments in subsidiaries and affi liated compani es.
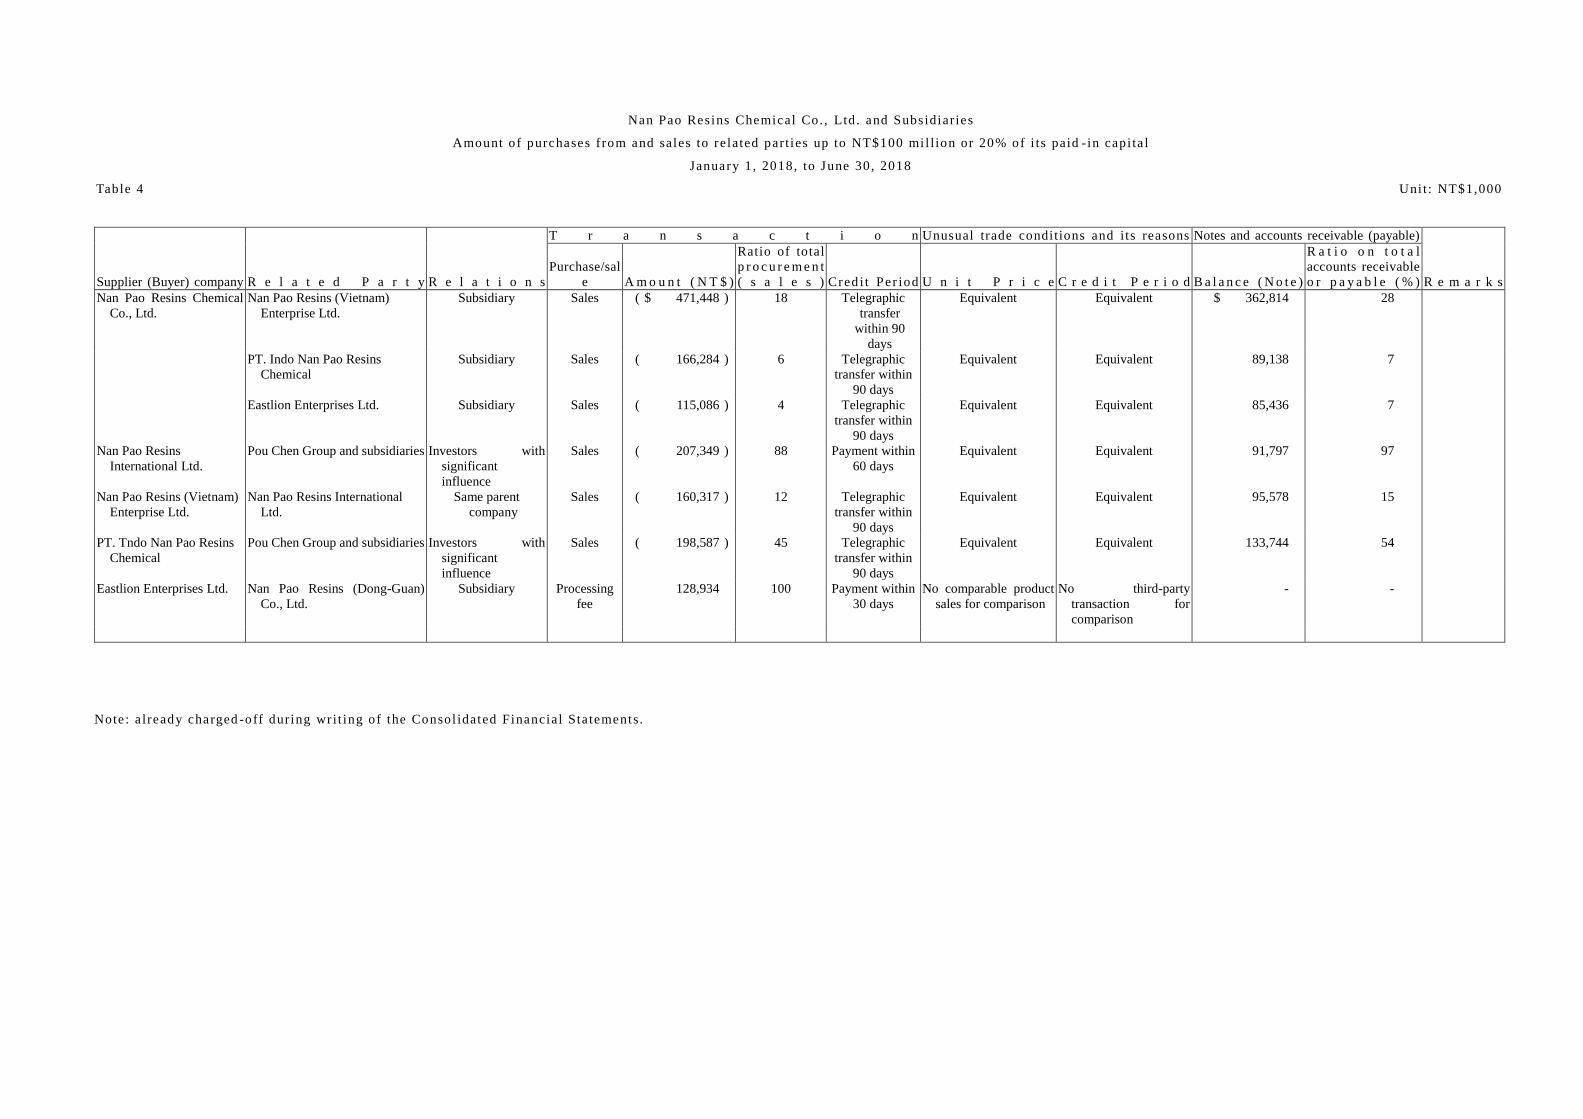
Nan Pao Resins Chemical Co. , Ltd. and Subsidiar ies
Amount o f purchases f rom and sales to related par t ies up to NT$100 mi l l ion or 20% of i ts paid - in capi ta l
January 1, 2018, to June 30, 2018
Table 4 Uni t : NT$1,000
Supplier (Buyer) company R e l a t e d P a r t y R e l a t i o n s
T r a n s a c t i o n Unusual trade conditions and i ts reasons Notes and accounts receivable (payable)
R e m a r k s
Purchase/sal
e A m o u n t ( N T $ )
Ratio of total
p r o c u r e m e n t
( s a l e s ) Cred i t Per iod U n i t P r i c e C r e d i t P e r i o d B a l a n c e ( N o t e )
R a t i o o n t o t a l
accounts receivable
o r p a y a b l e ( % )
Nan Pao Resins Chemical
Co., Ltd.
Nan Pao Resins (Vietnam)
Enterprise Ltd.
Subsidiary Sales ( $ 471,448 ) 18 Telegraphic
transfer
within 90
days
Equivalent Equivalent $ 362,814 28
PT. Indo Nan Pao Resins
Chemical
Subsidiary Sales ( 166,284 ) 6 Telegraphic
transfer within
90 days
Equivalent Equivalent 89,138 7
Eastlion Enterprises Ltd. Subsidiary Sales ( 115,086 ) 4 Telegraphic
transfer within
90 days
Equivalent Equivalent 85,436 7
Nan Pao Resins
International Ltd.
Pou Chen Group and subsidiaries Investors with
significant
influence
Sales ( 207,349 ) 88 Payment within
60 days
Equivalent Equivalent 91,797 97
Nan Pao Resins (Vietnam)
Enterprise Ltd.
Nan Pao Resins International
Ltd.
Same parent
company
Sales ( 160,317 ) 12 Telegraphic
transfer within
90 days
Equivalent Equivalent 95,578 15
PT. Tndo Nan Pao Resins
Chemical
Pou Chen Group and subsidiaries Investors with
significant
influence
Sales ( 198,587 ) 45 Telegraphic
transfer within
90 days
Equivalent Equivalent 133,744 54
Eastlion Enterprises Ltd. Nan Pao Resins (Dong-Guan)
Co., Ltd.
Subsidiary Processing
fee
128,934 100 Payment within
30 days
No comparable product
sales for comparison
No third-party
transaction for
comparison
- -
Note : a lready charged -off during wr it ing of the Consol idated Financial Sta tements.

Nan Pao Resins Chemical Co. , Ltd. and Subsidiar ies
Amount o f accounts receivab le from re lated par t ies up to NT$100 mil l ion or 20% of i ts paid - in capi tal
June 30, 2018
Table 5 Uni t : NT$1,000
Related party of account
r e c e i v a b l e
Overdue accounts receivable from related
p a r t y
Accounts receivable
f r o m r e l a t e d p a r t y
L i s t e d d e d u c t i b l e s
C o m p a n y w i t h a c c o u n t s r e c e i v a b l e R e l a t e d P a r t y R e l a t i o n s Account balance (Note
2 )
Turnover ra t io% S u m Handling Method Amount recoverable
a f t e r p e r i o d
B a d d e b t
Nan Pao Resins Chemical Co., Ltd. Nan Pao Resins (Vietnam) Enterprise Ltd. Subsidiary $ 362,814 2.67 $ - Not applicable $ 183,857 $ -
PT. Indo Nan Pao Resins Chemical Pou Chen Group and subsidiaries Investors with
significant influence
133,744 2.82 - Not applicable 34,546 24
Nan Pao Resins (China) Co., Ltd. Nan Pao (Kunshan) E-commerce Ltd. Same parent company 114,825 -
(Note 1)
- Not applicable - -
Note 1: ba lance of o ther rece ivab les a t the end of the per iod in which turnover rat io is not appl icable
Note 2: a lready charged -off dur ing wr it ing of the Conso lida ted Financia l S ta tements

N a n P a o R e s i n s C h e mi c a l C o . , L t d . a n d S u b s i d i a r i e s
I n f o r ma t i o n o n I n v e s t e e s , L o c a t i o n s , e t c .
J a n ua r y 1 , 2 0 1 8 t o J u n e 3 0 , 2 0 1 8
Ta b le 6 U n i t : N T $ 1 , 0 0 0
( O n l y f o r e i g n c u r r e n c y i s d e n o t e d i n d o l l a r s )
I n i t i a l i n v e s t m e n t P o s s e s s i o n b y t h e e n d o f t h e p e r i o d I n v e s t e e c o m p a n y
Share of Profits/Losses
Investment Profit/Loss
I n v e s t o r C o m p a n y I n v e s t e e C o m p a n y L o c a t i o n Main Businesses and Products D e c e m b e r 3 1 , 2 0 1 5 D e c e m b e r 3 1 , 2 0 1 4 Number o f s ha res R a t i o A t b o o k v a l u e
Profit ( loss) for the
p e r i o d ( N o t e 1 ) R e m a r k s
Nan Pao Resins Chemical Co., Ltd. Nan Pao Chemical Company Ltd. No.12, Nanhaipu, Nanhai Vil., Xigang Dist., Tainan City Trading of chemical substances $ 300,000 $ 300,000 15,000,000 100 $ 149,852 $ 4,555 $ 4,555
Nan Pao Application Material Co.,
Ltd.
No.12, Nanhaipu, Nanhai Vil., Xigang Dist., Tainan City Trading of chemical substances 60,000 60,000 200,000 100 9,786 ( 110 ) ( 110 )
Nan Pao Electronic Material Company No.510, Zhongshan Rd., Xigang Dist, Tainan City Production and trading of
electronic materials
63,540 63,540 4,000,000 100 45,174 2,004 2,004
ITLS International Development Co.,
Ltd.
5F, No.356, Sec.1, NeiHu Rd., Taipei Trading of construction materials
and chemical substances
755,000 755,000 30,500,000 100 304,126 ( 6,815 ) ( 3,677 )
Prince Pharmaceutical Co., Ltd. 9F, No. 107, Sec.3, Chung-Shin Rd., Sanchung Dist., New
Taipei City
Manufacturing, packaging, and
processing of raw materials for
various pharmaceutical and
health food
268,000 268,000 14,500,000 49.90 307,904 3,162 1,578
PHYMED BIO-TEC CO., LTD. No.12, Nanhaipu, Nanhai Vil., Xigang Dist., Tainan City R&D and trading of health food 16,000 16,000 600,000 100 3,477 ( 2,064 ) ( 2,064 )
Biorich Biotechnology Co., Ltd. 5F, No.356, Sec.1, NeiHu Rd., Taipei R&D, production, and trading of
new high protein business and
health food
64,121 64,121 6,412,054 57.06 5,029 2,070 1,181
Nan Pao Advanced Materials
Co.,LTD.
No. 521, Zhongshan Rd., Xigang Dist, Tainan City Trading of adhesives and
chemicals
3,500 3,500 350,000 70 4,670 1,522 1,065
Hsin-Tsung Industrial Co., Ltd. 12F., No. 117, Sec. 2, Chongqing N. Rd., Datong Dist.,
Taipei City
Production and trading of
chemical materials including
adhesives and resins
120,000 120,000 1,500,000 30 283,660 42,362 12,709
Fuqing Nan Pao Investments Ltd. Palm Grove House, P.O. Box 438, Road Town, Tortola,
British Virgin Islands
General investment 166,699 166,699 4,990,000 100 198,947 5,890 5,890
Thai Nan Pao Investments Ltd. Palm Grove House, P.O. Box 438, Road Town, Tortola,
British Virgin Islands
General investment 169,909 169,909 5,282,000 100 170,143 7,099 7,099
Nan Pao Resins India Pvt Ltd. 204, Abhishek, off New Link Road, Andheri (W), Mumbai
400053, India
Trading of adhesives 16,499 16,499 3,000,000 100 20,862 ( 331 ) ( 331 )
Nan Pao Materials Vietnam Co., Ltd. LotA4, A5, A10, A11 Daden Industrial Park, Thu Dau Mot
City, Binh Duong Province,Vietnam
Production and trading of
adhesives and chemicals
685,094 451,270 - 100 665,470 8,332 8,332
Nan Pao Advanced Materials Vietnam
Co., Ltd.
C2 Zone, Industry Area, Ninh Phúc Village, Ninh Binh City,
Ninh Binh Province, Vietnam
Production and trading of
adhesives and chemicals
465,970 439,197 - 100 445,740 ( 1,363 ) ( 1,363 )
Nan Pao Overseas Holdings Ltd. Palm Grove House, P.O. Box 438, Road Town, Tortola,
British Virgin Islands
General investment 1,963,219 1,839,886 63,784,333 100 3,571,436 66,294 70,265
Profit Land Ltd. Equity Trrust Chambers, P.O. Box 3269, Apia, Samoa General investment 186,588 186,588 983,333 73.75 726,625 13,762 9,643 Nan Pao Resins
Chemical Co., Ltd.
and related
companies hold
100% of voting
shares
All Saints Enterprises Ltd. Palm Grove House, P.O. Box 438, Road Town, Tortola,
British Virgin Islands
General investment 143,375 143,375 5,452,549 54.53 229,173 ( 8,710 ) ( 4,749 ) Nan Pao Resins
Chemical Co., Ltd.
and related
companies hold
100% of voting
shares
Ongoing Profits Ltd. P.O. Box 957, Offshore Incorporations Centre, Road Town,
Tortola, British Virgin Island
General investment 46,426 46,426 1,560,000 32.18 329,595 64,781 21,783 Nan Pao Resins
Chemical Co., Ltd.
and related
companies hold
100% of voting
shares
PT. Indo Nan Pao Resins Chemical Jl. Pajajaran Raya No.44, Jatiuwung Tangerang 15137,
Indonesia
Production and trading of
adhesives
39,276 39,276 2,756,250 49 171,081 24,380 11,946 Nan Pao Resins
Chemical Co., Ltd.
and related
companies hold
67.5% of voting
shares
ITLS International Development Co., Ltd. ITLS Holding Pte. Ltd. Blk 1049, Eunos Avenue 6, #01-132, Singapore 409628 General investment 545,462 545,462 24,064,549 100 161,765 ( 7,780 )
Aftek Materials Vietnam Co., Ltd. No. 16 Kim Dong Street, Ninh Xa Ward, Bac Ninh City, Bac
Ninh Province
Production and trading of
construction materials
49,172 - - 70 47,962 ( 4,015 )
Fuqing Nan Pao Investmens Ltd. Wealth Castle Development Ltd. Flat 13, 10F., Building B Tong-li Industrial Center, 19 Lam
Hing Street, Kowloon Bay, Hong Kong
General investment 138,898
(USD 4,560,000)
138,898
(USD 4,560,000)
10,000 100 198,461 5,890
Thai Nan Pao Investments Ltd. Thai Nanpao Resins Chemical Co.,
Ltd.
412 Kor Soi, 1cBangpoo Industrial Tumbon Preaksa Ampur
Muang Samutprakarn 10280, Thailand
Production and trading of
adhesives
169,931
(USD 5,578,821)
169,931
(USD 5,578,821)
21,197,000 100 106,117 7,044
Nan Pao Overseas Holdings Ltd. Nan Pao Group Holdings Ltd. 4th Floor, Willow House, Cricket Square, P.O. Box 2804,
Grand Cayman KY1-1112, Islands
General investment 1,942,871
(USD 63,784,333)
1,814,939
(USD 59,584,333)
63,784,333 100 3,611,850 66,304
ITLS Holding Pte. Ltd. ITLS(Malaysia)SDN BHD Lot 75289, Lebuhraya Pasir Gudang, Mukim Plentong
(PermasJaya), 81750 Masai, Johor, Malaysia
Production and trading of
construction materials
31,285
(USD 1,027,092)
31,285
(USD 1,027,092)
3,250,000 100 18,834 ( 270 )
PT. ITLS Indonesia Jl. Pajajaran Raya No. 44, Kel. Gandasari, Kec. Jatiuwung,
Tangerang-15137 Indonesia
Production and trading of
construction materials
74,981
(USD 2,461,620)
74,981
(USD 2,461,620)
2,437,109 100 25,176 1,119
ITLS Vietnam Co., Ltd. No.16 Kim Dong Street, Ninh Xa Ward, Bac Ninh City, Bac
Ninh Province
Production and trading of
construction materials
132,607
(USD 4,353,487)
132,607
(USD4,353,487)
- 100 88,250 ( 6,022 )
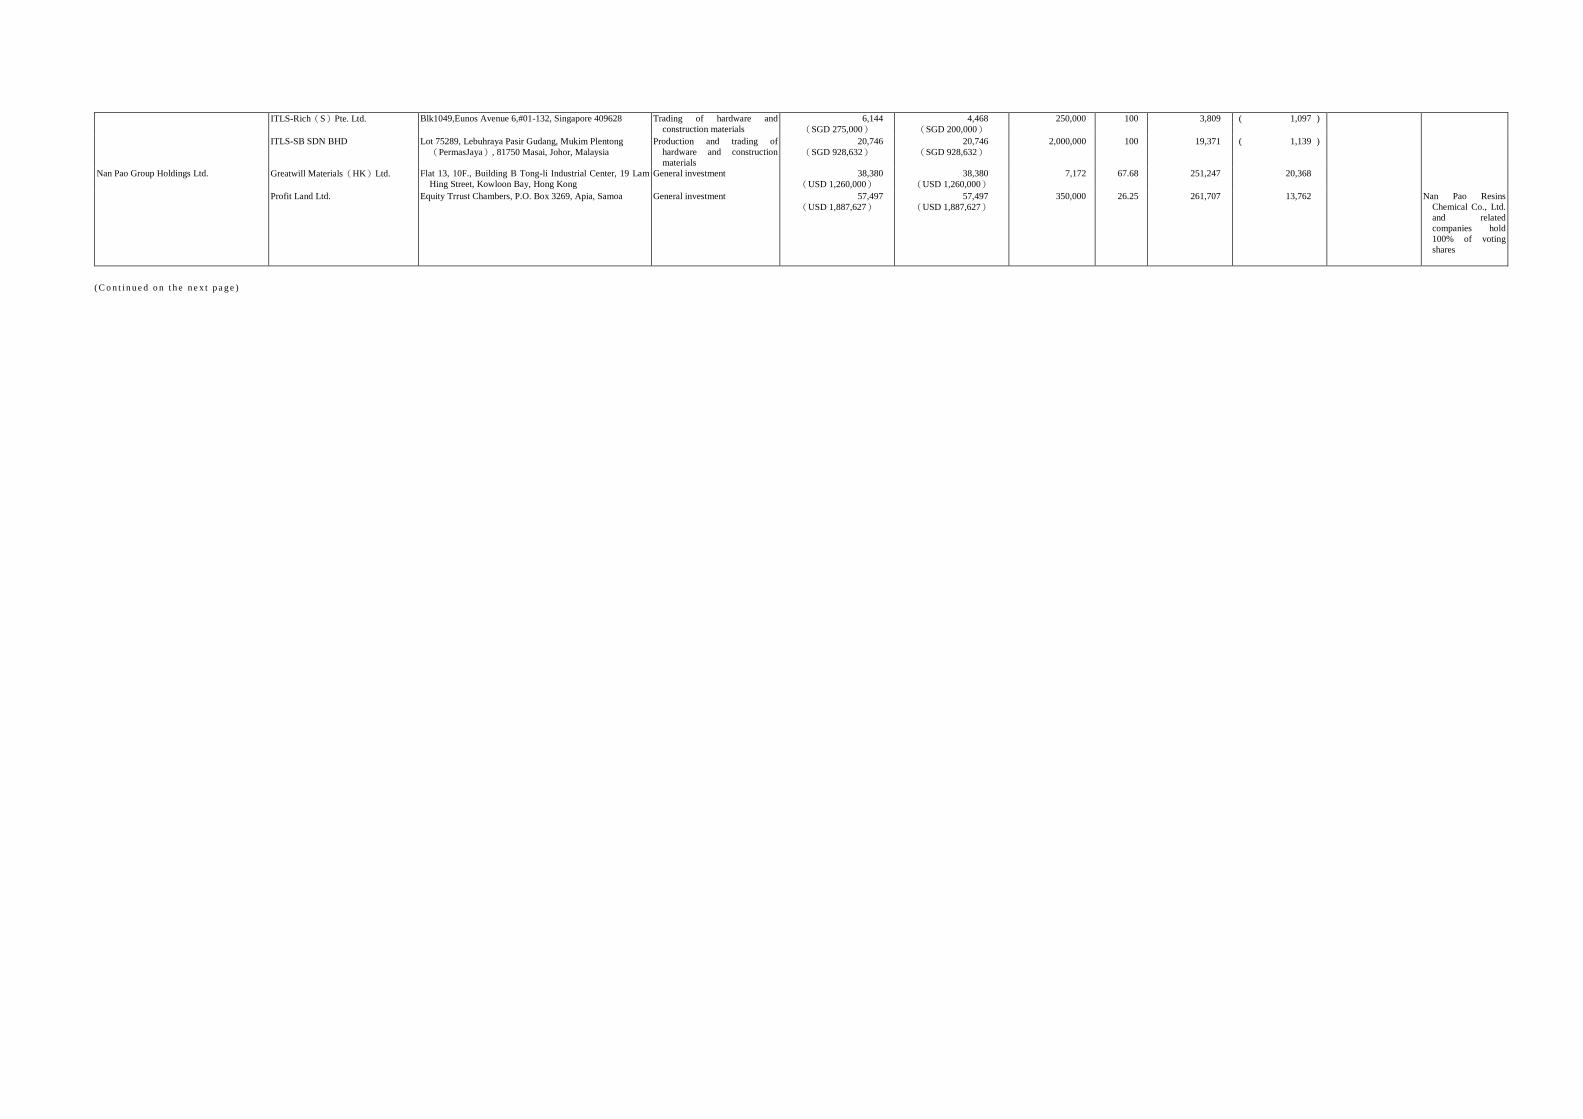
ITLS-Rich(S)Pte. Ltd. Blk1049,Eunos Avenue 6,#01-132, Singapore 409628 Trading of hardware and
construction materials
6,144
(SGD 275,000)
4,468
(SGD 200,000)
250,000 100 3,809 ( 1,097 )
ITLS-SB SDN BHD Lot 75289, Lebuhraya Pasir Gudang, Mukim Plentong
(PermasJaya), 81750 Masai, Johor, Malaysia
Production and trading of
hardware and construction
materials
20,746
(SGD 928,632)
20,746
(SGD 928,632)
2,000,000 100 19,371 ( 1,139 )
Nan Pao Group Holdings Ltd. Greatwill Materials(HK)Ltd. Flat 13, 10F., Building B Tong-li Industrial Center, 19 Lam
Hing Street, Kowloon Bay, Hong Kong
General investment 38,380
(USD 1,260,000)
38,380
(USD 1,260,000)
7,172 67.68 251,247 20,368
Profit Land Ltd. Equity Trrust Chambers, P.O. Box 3269, Apia, Samoa General investment 57,497
(USD 1,887,627)
57,497
(USD 1,887,627)
350,000 26.25 261,707 13,762 Nan Pao Resins
Chemical Co., Ltd.
and related
companies hold
100% of voting
shares
( C o n t i n u e d o n t h e n e x t p a g e )

( C o n t i n u e d f r o m t h e p r e v i o u s p a g e )
I n i t i a l i n v e s t m e n t P o s s e s s i o n b y t h e e n d o f t h e p e r i o d I n v e s t e e c o m p a n y
Share of Profits/Losses
Investment Profit/Loss
I n v e s t o r C o m p a n y I n v e s t e e C o m p a n y L o c a t i o n Main Businesses and Products D e c e m b e r 3 1 , 2 0 1 5 D e c e m b e r 3 1 , 2 0 1 4 Number o f s ha res R a t i o A t b o o k v a l u e
Profit ( loss) for the
p e r i o d ( N o t e 1 ) R e m a r k s
Nan Pao Resins (Holdings) Ltd. P.O.Box 71, Craigmuir Chambers, Road Town, Tortola,
British Virgin Islands
General investment $ 793,607
(USD 26,054,073)
$ 793,607
(USD 26,054,073)
10,000 100 $ 857,680 $ 116
All Saints Enterprises Ltd. Palm Grove House, P.O. Box 438, Road Town, Tortola,
British Virgin Islands
General investment 162,445
(USD 5,333,075)
162,445
(USD 5,333,075)
4,547,451 45.47 193,151 ( 8,710 ) Nan Pao Resins
Chemical Co., Ltd.
and related
companies hold
100% of voting
shares
Mega Victory Ltd. Visits Corporate Services Centre, Ground Floor NPF
Building, Beach Road, Apia, Samoa
General investment 72,104
(USD 2,367,154)
72,104
(USD 2,367,154)
2,367,154 100 59,231 490
ITLS –TWA Australia Pty. Ltd. Level 4, 147 Collins Street Melbourne Vic 3000 Production and trading of
hardware, construction
materials, and chemicals
134,970
(AUD 6,000,000)
134,970
(AUD 6,000,000)
6,000,000 100 ( 53,254 ) ( 11 )
NP Australia Pty. Ltd. Level 4, 147 Collins Street Melbourne Vic 3000 General investment 533,454
(AUD 23,714,354)
533,454
(AUD 23,714,354)
23,714,354 100 657,679 14,376
Ongoing Profits Ltd. P.O. Box 957, Offshore Incoporations Centre, Road Town,
Tortola, British Virgin Island
General investment 116,869
(USD 3,836,817)
116,869
(USD 3,836,817)
3,287,546 67.82 720,795 64,781 Nan Pao Resins
Chemical Co., Ltd.
and related
companies hold
100% of voting
shares
Treasure Wealth (HK) Ltd. Flat 13, 10F., Building B Tong-li Industrial Center, 19 Lam
Hing Street, Kowloon Bay, Hong Kong
General investment 140,421
(USD 4,610,000)
140,421
(USD 4,610,000)
4,610 100 144,295 ( 2,880 )
Goldford Investments Ltd. Creque Buildin, P.O. Box 116, Road Town, Tortola, British
Virgin Islands
General investment 17,814
(USD 584,844)
17,814
(USD 584,844)
486,000 100 70,705 4,468
Nan Pao Resins Chemical Philippines,
Inc.
Road 22 Phase 11, Cogeo Village, Antipolo City, Philippines Trading of adhesives 6,397
(USD 210,000)
6,397
(USD 210,000)
9,000 100 34,359 437
Nan Pao Resins International Ltd. Flat 13, 10F., Building B Tong-li Industrial Center, 19 Lam
Hing Street, Kowloon Bay, Hong Kong
Trading of chemical substances
and related products
776
(HKD 200,000)
776
(HKD 200,000)
1,000 100 9,074 979
Profit Land Ltd. Giant Profit Development Ltd. Flat 13, 10F., Building B Tong-li Industrial Center, 19 Lam
Hing Street, Kowloon Bay, Hong Kong
General investment 243,680
(USD 8,000,000)
243,680
(USD 8,000,000)
10,000 100 897,263 11,973
Nan Pao Resins(Holdings)Ltd. Eastlion Enterprises Ltd. P.O.Box 71, Craigmuir Chambers, Road Town, Tortola,
British Virgin Islands
General investment 613,467
(USD 20,140,100)
613,467
(USD 20,140,100)
20,240 100 742,781 ( 552 )
Eastlion Industrial Ltd. P.O.Box 71, Craigmuir Chambers, Road Town, Tortola,
British Virgin Islands
General investment 3
(USD 100)
3
(USD 100)
100 100 1,223 ( 240 )
Nan Pao Resins Development Ltd. P.O.Box 71, Craigmuir Chambers, Road Town, Tortola,
British Virgin Islands
General investment 91,380
(USD 3,000,000)
91,380
(USD 3,000,000)
3,000 100 106,424 919
All Saints Enterprises Ltd. Great Mount Enterprises Ltd. Unit 2102, 21/F The Broadway, No., 54-62 Lockhart, Road,
Wanchai, Hong Kong
General investment 304,600
(USD 10,000,000)
304,600
(USD 10,000,000)
10,000 100 420,317 ( 8,713 )
Mega Victory Ltd. Progroup Technology Co., Ltd. No.12, Nanhaipu, Nanhai Vil., Xigang Dist., Tainan City Trading of water-based
polyurethane resin
75,000 75,000 459,950 91.99 59,197 534
NP Australia Pty Ltd. RLA Polymers Pty. Ltd. Level 4, 147 Collins Street Melbourne Vic 3000 Production and trading of
construction materials and
chemical substances
333,699
(AUD 14,834,344)
333,699
(AUD 14,834,344)
10,052,080 100 508,850 16,566
Ongoing Profits Ltd. Rising Sun Associates Ltd. P.O. Box 957, Offshore Incoporations Centre, Road Town,
Tortola, British Virgin Island
General investment 147,656
(USD 4,847,546)
147,656
(USD 4,847,546)
3,000,000 100 1,060,907 64,780
Treasure Wealth(HK)Ltd. Noroo-Nan Pao Paints & Coatings
(Vietnam)Co., Ltd.
741 No. 1 St. An Phu-An Khanh New Urban Area, An Phu
Ward, Dist, 2, Ho Chi Minh City
Production and trading of
coatings
139,811
(USD 4,590,000)
139,811
(USD 4,590,000)
- 50 143,856 ( 5,758 )
Goldford Investments Ltd. PT. Indo Nan Pao Resins Chemical Jl. Pajajaran Raya No. 44, Jatiuwung Tangerang 15137,
Indonesia
Production and trading of
adhesives
2,217
(IDR 1,040,625,000)
2,217
(IDR 1,040,625,000)
1,040,625 18.5 69,903 24,380 Nan Pao Resins
Chemical Co., Ltd.
and related
companies hold
67.5% of voting
shares
Rising Sun Associates Ltd. Nan Pao Resins (Vietnam) Enterprise
Ltd.
Cong ThanIiIz, DiAn District, Binh Duong Province Production and trading of
adhesives and coatings
103,814
(USD 3,408,217)
103,814
(USD 3,408,217)
- 100 1,057,853 64,775
RLA Polymers Pty Ltd. RLA Polymers (M) SDN BHD No.5, Lebuhraya Petai, Pandamaran, 42000 Port Klang,
Selangor Darul Ehsan, Malaysia
Production and trading of
construction materials and
chemical substances
134,336
(AUD 5,971,801)
134,336
(AUD 5,971,801)
18,415,500 100 196,381 2,181
N o t e : T h e C o mp a n y i s o n l y r e q u i r e d t o l i s t t h e a mo u n t o f p r o f i t a nd l o s s o f e a c h o f t h e s u b s i d i a r i e s a n d e a c h i n v e s t e e a c c o u n t e d f o r u s i n g t h e e q u i t y me t h o d . T h e r e s t o f t h e i n f o r ma t i o n c a n b e e xe mp t e d .
N o t e 2 : P l e a s e r e f e r t o Ta b l e 7 f o r i n f o r ma t i o n o n i n v e s t e e s i n M a i n l a n d C h i n a .

Na n P a o R e s i n s C h e m i c a l C o . , Lt d . a n d S u b s id i a r i es
In fo r m a t i on on i n ve s t m e n t in M a i n la n d C h i n a
J a n u a r y 1 , 2 0 1 8 ~ J un e 3 0 , 2 01 8
At t a c h m e n t 7 Un i t : NT$ 1 , 0 0 0
( On l y f o r e i gn c u r r e n c y i s d e n o t e d i n d o l l a r s )
I n v e s t e e C o m p a n y
C o m p a n y n a m e Main Businesses and Products
Actual paid-in capital
( N o t e 4 )
I n v e s t e e C o m p a n y
( N o t e 1 )
Accumulated Out flow
of Investment from Taiwan at the beginning of the
p e r i o d
Amount invested (Note 4)
Outflow or recovery during the period Accumulated Out flow
from Taiwan at the end of t h e p e r i o d
Amount invested (Note 4)
I n v e s t e e c o m p a n y
Profit (loss) for the period
Shareholding ratio of
t h e C o m p a n y ’ s di rect or indi rec t
i n v e s t m e n t s ( % )
P r o f i t o r l o s s Investment Profit/Loss
( N o t e 2 )
Carrying amount of investment at the end of
t h e p e r i o d
B o o k v a l u e
Remitted as of the
end of the current p e r i o d
I n v e s t m e n t
i n c o m e
O u t f l o w R e c o v e r y
Nan Pao Resins (China) Co.,
Ltd.
Production and trading of adhesives
and coatings
$ 304,600
(USD 10,000,000)
(2) Great Mount Enterprises
Ltd.
$ 328,661
(USD 10,789,932)
$ - $ - $ 328,661
(USD 10,789,932)
( $ 8,713 ) 100 ( $ 8,713 )
(2)B.
$ 420,150 $ -
Fuqing Nan Pao Resins Co.,
Limited
Production and trading of adhesives 138,898
(USD 4,560,000)
(2)Wealth Castle Development
Ltd.
151,995
(USD 4,990,000)
- - 151,995
(USD 4,990,000)
5,960 100 5,960
(2)B.
197,194 112,121
Nan Pao Resins (Dong-Guan)
Co., Ltd.
Processing of adhesive products 82,242
(USD 2,700,000)
(2)Eastlion Enterprises Ltd. 77,425
(USD 2,541,860)
- - 77,425
(USD 2,541,860)
7,399 100 7,399
(2)B.
89,805 -
Dongguan Jia Chin Electronics Co., Ltd.
Production and trading of coatings and advanced resin
91,380
(USD 3,000,000)
(2)Nan Pao Resins Development Ltd.
93,350
(USD 3,064,683)
- - 93,350
(USD 3,064,683)
919 100 919 (2)B.
106,406 -
Foshan Nan Pao Advanced
Materials Co., Ltd.
Production and trading of adhesives 45,690
(USD 1,500,000)
(2) Greatwill Materials (HK)
Ltd. and Nan Pao Resins
(Fo Shan) Co., Ltd.
- - - - 20,863 68 14,188
(2)B.
251,256 -
Nan Pao Resins (Fo Shan) Co.,
Ltd.
Production and trading of adhesives 243,680
(USD 8,000,000)
(2)Giant Profit Development
Ltd.
237,211
(USD 7,787,627)
- - 237,211
(USD 7,787,627)
11,986 100 11,986
(2)B.
896,228 128,367
Foshan Nan Pao Cheng Hung Advanced Materials
Technology Co., Ltd.
Trading of footwear materials 22,965
(RMB 5,000,000)
(3) Nan Pao Resins (Fo Shan) Co., Ltd.
- - - - 688 51 351 (2)B.
12,595 -
Foshan Nan Pao Hung Xing
Advanced Materials Co., Ltd.
Trading of chemical substances 36,744
(RMB 8,000,000)
(3) Nan Pao Resins (Fo Shan)
Co., Ltd.
- - - - ( 2 ) 80 ( 2 )
(2)B.
36,827 -
Gangyi Electronic (Dongguan)
Co.,Ltd. (Note 5)
Production and trading of magnetic
covers, magnetic rings, iron cores
and electronic components
- (2)Qang Yi Electronic Factory
Company Ltd.
12,184
(USD 400,000)
- - 12,184
(USD 400,000)
- - - - -
Nanpao Advanced Investment
Co., Ltd.
General investment 462,992
(USD 15,200,000)
(2)Nan Pao Group Holdings
Ltd.
335,060
(USD 11,000,000)
127,932
(USD 4,200,000)
- 462,992
(USD 15,200,000)
( 3,187 ) 100 ( 3,187 )
(2)B.
448,277 -
Nan Pao (Kunshan) E-
commerce Ltd.
Agency of online business and
general merchandise
152,300
(USD 5,000,000)
(3) Nanpao Advanced
Investment Co., Ltd.
- - - - ( 4,564 ) 100 ( 4,564 )
(2)B.
138,901 -
Nantong Nanpao Resins
Materials Co., Ltd.
Production and trading of adhesives 167,530
(USD 5,500,000)
(3) Nanpao Advanced
Investment Co., Ltd.
- - - - 1,083 100 1,083
(2)B.
165,501 -
Aggregate investment amount remitted from Taiwan to
Mainland China at the end of the period (Note 4)
In ves t men t Am ounts Auth or i z ed b y
Investment Commission, MOEA (Note 4) Limitation on investment in Mainland China by Investment Commission of Ministry of
E c o n o m i c A f f a i r s ( M O E A ) ( N o t e 4 )
$ 1,363,819
(USD 44,774,102)
$ 1,838,238
(USD 60,349,260) $ 5,259,837
No t e 1 : In ve s t m e n t i s d i v i d ed i n t o t h e fo l l owi n g t h r e e c a t e g or i e s ( m a r k t h e c a t e go r y n u m b e r ) :
( 1 ) Di r e c t i n ve s t m e n t i n m a in la n d C h in a .
( 2 ) In ve s t i n M a i n la n d C h i n a th r ou gh c om p a n i e s i n a t h i rd -p a r t y r e g i on a l ( p le a s e s p e c i f y t h e i n ve s t m e n t c om p a n y i n t h e t h i r d -p a r t y r e g i on ) .
( 3 ) Ot h e r m e t h od s
Not e 2 : In ve s t m e n t ga i n s a n d los s e s r e c ogn i z e d i n t h e cu r r e n t p e r i od c o lu m n :
( 1 ) I f t h e C om p a n y i s i n p r e p ar a t i on s t a tu s , n o in ve s t m e n t los s a n d p r o f i t oc c u r, i t s h a l l b e n o t e d
( 2 ) Th e r e a r e t h r e e t yp e s o f r e c ogn i z e d i n ve s t m e n t los s a n d p r o f i t , a n d t h e C om p a n y i s r e q u i r e d t o n o t e t h e t yp e t h a t a p p l i e s t o t h e C om p a n y :
A . Th e f i n a n c i a l s t a t e m e n t s h ave b e e n c e r t i f i e d b y i n t e r n a t i on a l a c c ou n t i n g f i r m s wi t h r e l a t i on s wi t h t h e C PA R e p ub l i c o f C h i n a
B . Th e f i n a n c i a l s t a t e m e n t s h ave b e e n c e r t i f i e d b y a C PA t h r ou gh t h e p a r e n t c om p a n y i n Ta i wa n .
C . Ot h e r s .
No t e 3 : Th e i n ve s t m e n t l i m i t o f t h e C om p a n y i n M a i n la n d C h i n a i s c a lc u la t e d a s fo l l ows :
$ 8 , 76 6 ,3 9 5× 60 %= $5 , 25 9 ,8 3 7
Not e 4 : r e l e va n t a m ou n t s we r e c a lc u l a t e d b a s e d on t h e e x ch an ge r a t e o f US $ 1 = NT$ 3 0 . 4 6 a t t h e e nd o f t h e p e r i od .
R e le v a n t a m ou n t s we r e c a lc u la t e d b a s ed on t h e ex c h a n ge r a t e o f C NY 1 = NT$ 4 . 5 9 3 0 a t t h e e n d o f t h e p e r i od .
G a n gyi E le c t r on i c ( Don g gu a n ) C o . , Lt d . h a s f i n i s h ed l i q u id a t i on i n Oc t ob e r 2 01 7 b u t t h e sh a r e a m ou n t s h a ve n o t ye t b e e n r e m i t t ed t o Ta i wa n ; h e n c e , i t h a s n o t b e en r e m ove d f r om t h e a u t h or i z e d in ve s t m e n t a m oun t f r om t h e M OE A.

Nan Pao Resins Chemical Co., Ltd. and Subsidiar ies
Signif icant direct or indirect t ransact ions with the investee in Mainland China through a third region, and i ts pr ices and terms of payment, unr ealized gain or loss , and other information:
January 1, 2018 ~ June 30, 2018
Table 8 Unit : expressed in NT$1,000 unless otherwise s ta ted.
Notes and accounts receivable
( p a y a b l e )
T r a n s a c t i o n Different amounts from normal transactions R a t i o o n t o t a l
a c c o u n t s
r e c e i v a b l e
Ratio on total
p u r c h a s e s
R e a s o n s a n d c o n d i t i o n s Notes Payable , U n r e a l i z e d
p r o f i t
Supplier (Buyer)
c o m p a n y
C o u n t e r p a r t y R e l a t i o n s P u r c h a s e / s a l e Amount (NT$) R a t i o ( % ) C r e d i t P e r i o d U n i t P r i c e C r e d i t P e r i o d Balance (Note) Ratio of account
( % )
( N o t e )
Nan Pao Resins
Chemical Co.,
Ltd.
Nan Pao Resins (Fo Shan)
Co., Ltd.
Subsidiary Sales ( $ 94,280 ) ( 4 ) Telegraphic
transfer within
90 days
Equivalent Equivalent $ 43,112 3 $ 7,012
Nan Pao Resins (China) Co.,
Ltd.
Subsidiary Sales ( 78,457 ) ( 3 ) Telegraphic
transfer within
90 days
Equivalent Equivalent 42,271 3 4,518
Foshan Nan Pao
Advanced
Materials Co.,
Ltd.
Nan Pao Resins Chemical
Co., Ltd.
Ultimate parent
company
Sales ( 43,058 ) ( 6 ) Telegraphic
transfer within
30 days
Equivalent Equivalent 15,549 4 -
Nan Pao Resins India Pvt
Ltd.
Same parent
company
Sales ( 14,832 ) ( 2 ) Telegraphic
transfer within
90 days
Equivalent Equivalent 6,785 2 -
Greatwill Materials (HK)
Ltd.
Same parent
company
Sales ( 16,525 ) ( 2 ) Telegraphic
transfer within
90 days
Equivalent Equivalent - - -
Nan Pao Resins
(Dong-Guan)
Co., Ltd.
Eastlion Enterprises Ltd. Parent company Net sale of
processing
( 128,934 ) ( 100 ) Payment within 30
days
No comparable
product sales for
comparison
No third-party transaction for
comparison
- - -
Note: a lready charged -off during wri ting of the Consolidated Financial Statements .

Nan Pao Resins Chemical Co. , Ltd. and Subsidiar ies
Business rela t ionships , impor tant t ransac tions, and amounts be tween the parent company and subsid iar ies
January 1, 2018 to June 30, 2018
Table 9 Uni t : NT$1,000
N o C o m p a n y N a m e C o u n t e r p a r t y
Relationship
w i t h
Counterparty
( N o t e 1 )
T r a n s a c t i o n S t a t u s
I t e m A m o u n t ( N o t e 2 ) T e r m s
P e r c e n t a g e o f
C o n s o l i d a t e d N e t
R e v e n u e o r
T o t a l a s s e t ( % )
0 Nan Pao Resins Chemical Co., Ltd. Nan Pao Resins (China) Co., Ltd. 1 Accounts receivable - stakeholders $ 42,271 -
Sales revenue 78,457 Payment term is telegraphic transfer within 90 days based
on average transaction price
1
Nan Pao Resins (Vietnam) Enterprise Ltd. 1 Accounts receivable - stakeholders 362,814 2
Sales revenue 471,448 Payment term is telegraphic transfer within 90 days based
on average transaction price
6
Nan Pao Resins (Fo Shan) Co., Ltd. 1 Accounts receivable - stakeholders 43,112 -
Sales revenue 94,280 Payment term is telegraphic transfer within 90 days based
on average transaction price
1
PT. Indo Nan Pao Resins Chemical 1 Accounts receivable - stakeholders 89,138 1
Sales revenue 166,284 Payment term is telegraphic transfer within 90 days based
on average transaction price
2
Nan Pao Resins Chemical Philippines,
Inc.
1 Sales revenue 13,800 Payment term is telegraphic transfer within 90 days based
on average transaction price
-
Eastlion Enterprises Ltd. 1 Accounts receivable - stakeholders 85,436 -
Sales revenue 115,086 Payment term is telegraphic transfer within 90 days based
on average transaction price
2
Purchase 18,219 No comparable product sales for comparison; telegraphic
transfer of payment within 90 days
-
Foshan Nan Pao Advanced Materials Co.,
Ltd.
1 Accounts payable - related parties 15,549 -
Purchase 43,058 No comparable product sales for comparison; telegraphic
transfer of payment within 30 days
1
Nan Pao Materials Vietnam Co., Ltd. 1 Accounts receivable - stakeholders 59,141 -
Sales revenue 67,216 Payment term is telegraphic transfer within 90 days based
on average transaction price
1
ITLS International Development Co., Ltd. 1 Sales revenue 12,984 Receipt through credit term of 90 days based on average
transaction price
-
1 Nan Pao Resins (Vietnam) Enterprise
Ltd.
PT. Indo Nan Pao Resins Chemical 3 Accounts receivable - stakeholders 30,172 -
Sales revenue 45,572 Payment term is telegraphic transfer within 90 days based
on average transaction price
1
Nan Pao Resins International Ltd. 3 Accounts receivable - stakeholders 95,578 1
Sales revenue 160,317 Payment term is telegraphic transfer within 90 days based
on average transaction price
2
Progroups Technology co. Ltd. 3 Accounts payable - related parties 16,459 -
Purchase 23,941 No comparable product sales for comparison; telegraphic
transfer of payment within 90 days
-
Eastlion Enterprises Ltd. 3 Accounts payable - related parties 22,315 -
Purchase 38,696 Receipt through telegraphic transfer of 90 days based on
average transaction price
1
Nan Pao Chemical Company Ltd. 3 Accounts payable - related parties 13,568 -
Purchase 27,400 Receipt through telegraphic transfer of 90 days based on
average transaction price
-
2 Profit Land Ltd. Nan Pao Resins (Fo Shan) Co., Ltd. 3 Other accounts receivable--related 60,920 -

parties
3 Nan Pao Resins (Fo Shan) Co., Ltd. Fuqing Nan Pao Resins Co., Limited 3 Accounts receivable - stakeholders 44,348 -
Sales revenue 63,551 Receipt through credit term of 90 days based on average
transaction price
1
4 Eastlion Enterprises Ltd. Nan Pao Resins (Dong-Guan) Co., Ltd. 3 Processing fee 128,934 No comparable product price, credit term is payment in 30
days
2
Nan Pao Resins Chemical Philippines,
Inc.
3 Accounts receivable - stakeholders 22,488 -
Sales revenue 27,267 Payment term is telegraphic transfer within 90 days based
on average transaction price
-
PT. Indo Nan Pao Resins Chemical 3 Sales revenue 15,800 Payment term is telegraphic transfer within 90 days based
on average transaction price
-
(Continued on the next page)
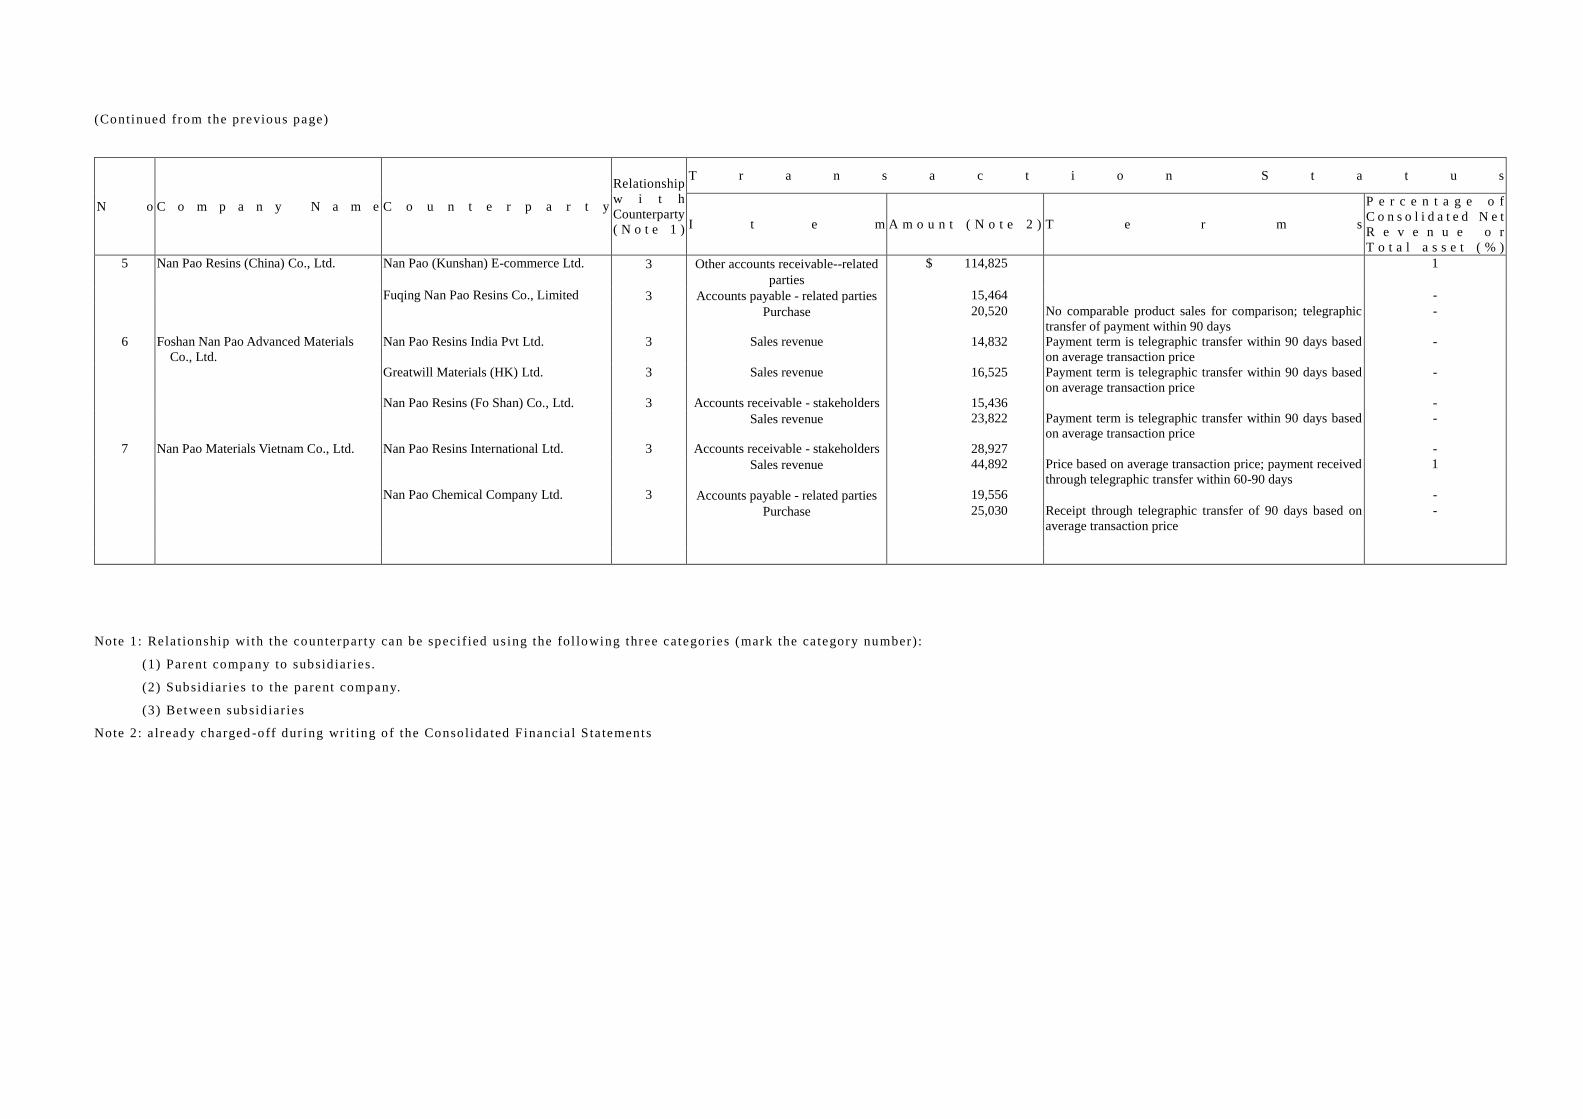
(Continued from the previous page)
N o C o m p a n y N a m e C o u n t e r p a r t y
Relationship
w i t h
Counterparty
( N o t e 1 )
T r a n s a c t i o n S t a t u s
I t e m A m o u n t ( N o t e 2 ) T e r m s
P e r c e n t a g e o f
C o n s o l i d a t e d N e t
R e v e n u e o r
T o t a l a s s e t ( % )
5 Nan Pao Resins (China) Co., Ltd. Nan Pao (Kunshan) E-commerce Ltd. 3 Other accounts receivable--related
parties
$ 114,825 1
Fuqing Nan Pao Resins Co., Limited 3 Accounts payable - related parties 15,464 -
Purchase 20,520 No comparable product sales for comparison; telegraphic
transfer of payment within 90 days
-
6 Foshan Nan Pao Advanced Materials
Co., Ltd.
Nan Pao Resins India Pvt Ltd. 3 Sales revenue 14,832 Payment term is telegraphic transfer within 90 days based
on average transaction price
-
Greatwill Materials (HK) Ltd. 3 Sales revenue 16,525 Payment term is telegraphic transfer within 90 days based
on average transaction price
-
Nan Pao Resins (Fo Shan) Co., Ltd. 3 Accounts receivable - stakeholders 15,436 -
Sales revenue 23,822 Payment term is telegraphic transfer within 90 days based
on average transaction price
-
7 Nan Pao Materials Vietnam Co., Ltd. Nan Pao Resins International Ltd. 3 Accounts receivable - stakeholders 28,927 -
Sales revenue 44,892 Price based on average transaction price; payment received
through telegraphic transfer within 60-90 days
1
Nan Pao Chemical Company Ltd. 3 Accounts payable - related parties 19,556 -
Purchase 25,030 Receipt through telegraphic transfer of 90 days based on
average transaction price
-
Note 1: Rela t ionship wi th the counterpar ty can be speci f ied us ing the fol lowing three categories (mark the ca tegory number) :
(1) Parent company to subsid iar ies.
(2) Subsid iar ies to the parent company.
(3) Between subsid iar ies
Note 2: a lready charged -off dur ing wr it ing of the Conso lida ted Financia l S ta tements