nagios monitoring tools...nagios is an awesome open source monitoring tool, its provides you more...
TRANSCRIPT

NAGIOS MONITORING TOOLS
Deelipkumar Yadav
Nagios is an awesome Open Source monitoring tool, its
provides you more comprehensive monitoring environment
to always keep an eye on your all machines / networks
whether you are in your data center or just your small labs

1
Step by Step Nagios Installation and Configuration
Nagios is an awesome Open Source monitoring tool, its provides you more comprehensive monitoring
environment to always keep an eye on your all machines / networks whether you are in your data center
or just your small labs.
With Nagios, you can monitor your remote hosts and their services remotely on a single window. It
shows warnings and indicates if something goes wrong in your servers which eventually help us to detect
some problems before they occur. It helps us to reduce downtime and business losses.
Read about check_mk,
Below are some iterview question
Q.What is Nagios and how it Works?
Ans:Nagios is an open source System and Network Monitoring application.Nagios runs on a
server, usually as a daemon or service. Nagios periodically run plugins residing (usually) on
the same server; they contact (PING etc.) hosts and servers on your network or on the
Internet. You can also have information sent to Nagios. You then view the status
information using the web interface. You can also receive email or SMS notifications if
something happens. Event Handlers can also be configured to "act" if something happens.
The Nagios daemon behaves like a scheduler that runs certain scripts at certain moments. It
stores the results of those scripts and will run other scripts if these results change. All these
scripts are, of course, the scripts from the Nagios plug-in project or are scripts that you
have created.
Q.Explain Main Configuration file and its location?
Ans: 1.Resource File: It is used to store sensitive information like username, passwords
without making them available to the CGIs.
2.Object Definition Files: It is the location were you define all you want to monitor and how
you want to monitor. It is used to Define hosts,services, hostgroups, contacts, contact
groups, commands, etc
3.CGI Configuration File : The CGI configuration file contains a number of directives that
affect the operation of the CGIs. It also contains a reference the main configuration file, so
the CGIs know how you've configured Nagios and where your object definitions are stored.
Q.Explain Ngaios files and its location?
1.log_file=/usr/local/nagios/var/nagios.log
The main configuration file is usually named nagios.cfg and located in the
/usr/local/nagios/etc/ directory.
2.Object Configuration File :This directive is used to specify an object configuration file
containing object definitions that Nagios should use for monitoring.
cfg_file=/usr/local/nagios/etc/hosts.cfg
cfg_file=/usr/local/nagios/etc/services.cfg
cfg_file=/usr/local/nagios/etc/commands.cfg
3.Object Configuration Directory :This directive is used to specify a directory which contains
object configuration files that Nagios should use for monitoring.
cfg_dir=/usr/local/nagios/etc/commands

2
cfg_dir=/usr/local/nagios/etc/services
cfg_dir=/usr/local/nagios/etc/hosts
4.Object Cache File :This directive is used to specify a file in which a cached copy of object
definitions should be stored.
object_cache_file=/usr/local/nagios/var/objects.cache
5.Precached Object File: precached_object_file=/usr/local/nagios/var/objects.precache
This is used to specify an optional resource file that can contain $USERn$ macro
definitions. $USERn$ macros are useful for storing usernames, passwords, and items
commonly used in command definitions (like directory paths). The CGIs will not attempt to
read resource files, so you can set restrictive permissions (600 or 660) on them to protect
sensitive information. You can include multiple resource files by adding multiple
resource_file statements to the main config file - Nagios will process them all.
6.Temp File :temp_path=/tmp
This is a directory that Nagios can use as scratch space for creating temporary files used
during the monitoring process. You should run tmpwatch, or a similiar utility, on this
directory occasionally to delete files older than 24 hours.
7.Status File :status_file=/usr/local/nagios/var/status.dat
This is the file that Nagios uses to store the current status, comment, and downtime
information. This file is used by the CGIs so that current monitoring status can be reported
via a web interface. The CGIs must have read access to this file in order to function
properly. This file is deleted every time Nagios stops and recreated when it starts.
8.Log Archive Path :log_archive_path=/usr/local/nagios/var/archives/
This is the directory where Nagios should place log files that have been rotated. This option
is ignored if you choose to not use the log rotation functionality.
9.External Command File :command_file=/usr/local/nagios/var/rw/nagios.cmd
This is the file that Nagios will check for external commands to process. The command CGI
writes commands to this file. The external command file is implemented as a named pipe
(FIFO), which is created when Nagios starts and removed when it shuts down. If the file
exists when Nagios starts, the Nagios process will terminate with an error message
10.Lock File :lock_file=/tmp/nagios.lock
This option specifies the location of the lock file that Nagios should create when it runs as a
daemon (when started with the -d command line argument). This file contains the process
id (PID) number of the running Nagios process.
11.State Retention File: state_retention_file=/usr/local/nagios/var/retention.dat
This is the file that Nagios will use for storing status, downtime, and comment information
before it shuts down. When Nagios is restarted it will use the information stored in this file
for setting the initial states of services and hosts before it starts monitoring anything. In
order to make Nagios retain state information between program restarts, you must enable
the retain_state_information option.
12.Check Result Path :check_result_path=/var/spool/nagios/checkresults
This options determines which directory Nagios will use to temporarily store host and
service check results before they are processed. This directory should not be used to store
any other files, as Nagios will periodically clean this directory of old file (see the
max_check_result_file_age option for more information).
13.Host Performance Data File :host_perfdata_file=/usr/local/nagios/var/host-perfdata.da.
This option allows you to specify a file to which host performance data will be written after
every host check. Data will be written to the performance file as specified by the
host_perfdata_file_template option. Performance data is only written to this file if the
process_performance_data option is enabled globally and if the process_perf_data directive
in the host definition is enabled.
14.Service Performance Data File:service_perfdata_file=/usr/local/nagios/var/service-
perfdata.dat

3
This option allows you to specify a file to which service performance data will be written
after every service check. Data will be written to the performance file as specified by the
service_perfdata_file_template option. Performance data is only written to this file if the
process_performance_data option is enabled globally and if the process_perf_data directive
in the service definition is enabled
13.Debug File :debug_file=/usr/local/nagios/var/nagios.debug
This option determines where Nagios should write debugging information. What (if any)
information is written is determined by the debug_level and debug_verbosity options. You
can have Nagios automaticaly rotate the debug file when it reaches a certain size by using
the max_debug_file_size option.
Q. Explain Host and Service Check Execution Option?
Ans:This option determines whether or not Nagios will execute Host/service checks when it
initially (re)starts. If this option is disabled, Nagios will not actively execute any service
checks and will remain in a sort of "sleep" mode (it can still accept passive checks unless
you've disabled them). This option is most often used when configuring backup monitoring
servers or when setting up a distributed monitoring environment. Note: If you have state
retention enabled, Nagios will ignore this setting when it (re)starts and use the last known
setting for this option (as stored in the state retention file), unless you disable the
use_retained_program_state option. If you want to change this option when state retention
is active (and the use_retained_program_state is enabled), you'll have to use the
appropriate external command or change it via the web interface. Values are as follows:
0 = Don't execute host/service checks
1 = Execute host/service checks (default)
Q. Explain active and Passive check in Nagios?
Ans:Nagios will monitor host and services in two ways actively and passively.Active checks
are the most common method for monitoring hosts and services. The main features of
actives checks as as follows:Active checks are initiated by the Nagios process
A. Active checks:
1.Active checks are run on a regularly scheduled basis
2.Active checks are initiated by the check logic in the Nagios daemon.
When Nagios needs to check the status of a host or service it will execute a plugin and pass
it information about what needs to be checked. The plugin will then check the operational
state of the host or service and report the results back to the Nagios daemon. Nagios will
process the results of the host or service check and take appropriate action as necessary
(e.g. send notifications, run event handlers, etc).
Active check are executed At regular intervals, as defined by the check_interval and
retry_interval options in your host and service definitions
On-demand as needed.Regularly scheduled checks occur at intervals equaling either the
check_interval or the retry_interval in your host or service definitions, depending on what
type of state the host or service is in. If a host or service is in a HARD state, it will be
actively checked at intervals equal to the check_interval option. If it is in a SOFT state, it
will be checked at intervals equal to the retry_interval option.
On-demand checks are performed whenever Nagios sees a need to obtain the latest status
information about a particular host or service. For example, when Nagios is determining the
reach ability of a host, it will often perform on-demand checks of parent and child hosts to
accurately determine the status of a particular network segment. On-demand checks also
occur in the predictive dependency check logic in order to ensure Nagios has the most
accurate status information.
b.Passive checks:
They key features of passive checks are as follows:
1.Passive checks are initiated and performed external applications/processes
2.Passive check results are submitted to Nagios for processing

4
The major difference between active and passive checks is that active checks are initiated
and performed by Nagios, while passive checks are performed by external applications.
Passive checks are useful for monitoring services that are:
Asynchronous in nature and cannot be monitored effectively by polling their status on a
regularly scheduled basis
Located behind a firewall and cannot be checked actively from the monitoring host
Examples of asynchronous services that lend themselves to being monitored passively
include SNMP traps and security alerts. You never know how many (if any) traps or alerts
you'll receive in a given time frame, so it's not feasible to just monitor their status every
few minutes.Passive checks are also used when configuring distributed or redundant
monitoring installations.
Here's how passive checks work in more detail...
1.An external application checks the status of a host or service.
2.The external application writes the results of the check to the external command file.
3.The next time Nagios reads the external command file it will place the results of all
passive checks into a queue for later processing. The same queue that is used for storing
results from active checks is also used to store the results from passive checks.
4.Nagios will periodically execute a check result reaper event and scan the check result
queue. Each service check result that is found in the queue is processed in the same
manner - regardless of whether the check was active or passive. Nagios may send out
notifications, log alerts, etc. depending on the check result information.
Q.What Are Objects?
Ans:Objects are all the elements that are involved in the monitoring and notification logic.
Types of objects include:
Services :are one of the central objects in the monitoring logic. Services are associated with
hosts Attributes of a host (CPU load, disk usage, uptime, etc.)
Service Groups :are groups of one or more services. Service groups can make it easier to
(1) view the status of related services in the Nagios web interface and (2) simplify your
configuration through the use of object tricks.
Hosts :are one of the central objects in the monitoring logic.Hosts are usually physical
devices on your network (servers, workstations, routers, switches, printers, etc).
Host Groups :are groups of one or more hosts. Host groups can make it easier to (1) view
the status of related hosts in the Nagios web interface and (2) simplify your configuration
through the use of object tricks
Contacts :Conact information of people involved in the notification process
Contact Groups :are groups of one or more contacts. Contact groups can make it easier to
define all the people who get notified when certain host or service problems occur.
Commands :are used to tell Nagios what programs, scripts, etc. it should execute to
perform ,Host and service checks and when Notifications should send etc.
Time Periods: are are used to control ,When hosts and services can be monitored
Notification Escalations :Use for escalating the the notication
Q.What Are Plugins?
Ans:Plugins are compiled executables or scripts (Perl scripts, shell scripts, etc.) that can be
run from a command line to check the status or a host or service. Nagios uses the results
from plugins to determine the current status of hosts and services on your network.
Nagios will execute a plugin whenever there is a need to check the status of a service or
host. The plugin does something (notice the very general term) to perform the check and
then simply returns the results to Nagios. Nagios will process the results that it receives
from the plugin and take any necessary actions (running event handlers, sending out
notifications, etc).
Q.How Do I Use Plugin X?

5
Ans:Most all plugins will display basic usage information when you execute them using '-h'
or '--help' on the command line. For example, if you want to know how the check_http
plugin works or what options it accepts, you should try executing the following command:
./check_http --help
Q.Explain External Commands ?
Ans:Nagios can process commands from external applications (including the CGIs) and
alter various aspects of its monitoring functions based on the commands it receives.
External applications can submit commands by writing to the command file, which is
periodically processed by the Nagios daemon.External commands can be used to accomplish
a variety of things while Nagios is running. Example of what can be done include
temporarily disabling notifications for services and hosts, temporarily disabling service
checks, forcing immediate service checks, adding comments to hosts and services, etc
Q.When Does Nagios Check For External Commands?
Ans:At regular intervals specified by the command_check_interval option in the main
configuration file
Immediately after event handlers are executed. This is in addition to the regular cycle of
external command checks and is done to provide immediate action if an event handler
submits commands to Nagios.
External commands that are written to the command file have the following format
[time] command_id;command_arguments
where time is the time (in time_t format) that the external application submitted the
external command to the command file. The values for the command_id and
command_arguments arguments will depend on what command is being submitted to
Nagios.
Q.Explain Nagios State Types?
Ans:The current state of monitored services and hosts is determined by two components:
The status of the service or host (i.e. OK, WARNING, UP, DOWN, etc.)
Tye type of state the service or host is in
There are two state types in Nagios - SOFT states and HARD states. These state types are a
crucial part of the monitoring logic, as they are used to determine when event handlers are
executed and when notifications are initially sent out.
a.Soft States:
When a service or host check results in a non-OK or non-UP state and the service check has
not yet been (re)checked the number of times specified by the max_check_attempts
directive in the service or host definition. This is called a soft error.
When a service or host recovers from a soft error. This is considered a soft recovery.
The following things occur when hosts or services experience SOFT state changes:
The SOFT state is logged. Event handlers are executed to handle the SOFT state. SOFT
states are only logged if you enabled the log_service_retries or log_host_retries options in
your main configuration file.
The only important thing that really happens during a soft state is the execution of event
handlers. Using event handlers can be particularly useful if you want to try and proactively
fix a problem before it turns into a HARD state. The $HOSTSTATETYPE$ or
$SERVICESTATETYPE$ macros will have a value of "SOFT" when event handlers are
executed, which allows your event handler scripts to know when they should take corrective
action.
b.Hard states :occur for hosts and services in the following situations:
When a host or service check results in a non-UP or non-OK state and it has been
(re)checked the number of times specified by the max_check_attempts option in the host or
service definition. This is a hard error state.
When a host or service transitions from one hard error state to another error state (e.g.
WARNING to CRITICAL).

6
When a service check results in a non-OK state and its corresponding host is either DOWN
or UNREACHABLE.
When a host or service recovers from a hard error state. This is considered to be a hard
recovery.
When a passive host check is received. Passive host checks are treated as HARD unless the
passive_host_checks_are_soft option is enabled.
The following things occur when hosts or services experience HARD state changes:
The HARD state is logged.
Event handlers are executed to handle the HARD state.
Contacts are notifified of the host or service problem or recovery.
The $HOSTSTATETYPE$ or $SERVICESTATETYPE$ macros will have a value of "HARD" when
event handlers are executed, which allows your event handler scripts to know when they
should take corrective action.
Q.What is State Stalking?
Ans:Stalking is purely for logging purposes.When stalking is enabled for a particular host or
service, Nagios will watch that host or service very carefully and log any changes it sees in
the output of check results. As you'll see, it can be very helpful to you in later analysis of
the log files. Under normal circumstances, the result of a host or service check is only
logged if the host or service has changed state since it was last checked. There are a few
exceptions to this, but for the most part, that's the rule.
If you enable stalking for one or more states of a particular host or service, Nagios will log
the results of the host or service check if the output from the check differs from the output
from the previous check.
Q.Explain how Flap Detection works in Nagios?
Ans:Nagios supports optional detection of hosts and services that are "flapping". Flapping
occurs when a service or host changes state too frequently, resulting in a storm of problem
and recovery notifications. Flapping can be indicative of configuration problems (i.e.
thresholds set too low), troublesome services, or real network problems.
Whenever Nagios checks the status of a host or service, it will check to see if it has started
or stopped flapping. It does this by:
a.Storing the results of the last 21 checks of the host or ser vice
b.Analyzing the historical check results and determine where state changes/transitions
occur
c.Using the state transitions to determine a percent state change value (a measure of
change) for the host or service
d.Comparing the percent state change value against low and high flapping thresholds
e.A host or service is determined to have started flapping when its percent state change
first exceeds a high flapping threshold.
A host or service is determined to have stopped flapping when its percent state goes below
a low flapping threshold (assuming that is was previously flapping).
The historical service check results are examined to determine where state
changes/transitions occur. State changes occur when an archived state is different from the
archived state that immediately precedes it chronologically. Since we keep the results of the
last 21 service checks in the array, there is a possibility of having at most 20 state changes.
In this example there are 7 state changes, indicated by blue arrows in the image above.
The flap detection logic uses the state changes to determine an overall percent state change
for the service. This is a measure of volatility/change for the service. Services that never
change state will have a 0% state change value, while services that change state each time
they're checked will have 100% state change. Most services will have a percent state
change somewhere in between.
Q.Explain Distributed Monitoring?
Ans:Nagios can be configured to support distributed monitoring of network services and
resources.

7
When setting up a distributed monitoring environment with Nagios, there are differences in
the way the central and distributed servers are configured.
The function of a distributed server is to actively perform checks all the services you define
for a "cluster" of hosts. it basically just mean an arbitrary group of hosts on your network.
Depending on your network layout, you may have several cluters at one physical location,
or each cluster may be separated by a WAN, its own firewall, etc. There is one distributed
server that runs Nagios and monitors the services on the hosts in each cluster. A distributed
server is usually a bare-bones installation of Nagios. It doesn't have to have the web
interface installed, send out notifications, run event handler scripts, or do anything other
than execute service checks if you don't want it to.
The purpose of the central server is to simply listen for service check results from one or
more distributed servers. Even though services are occasionally actively checked from the
central server, the active checks are only performed in dire circumstances,
Q.What is NRPE?
Ans: The NRPE addon is designed to allow you to execute Nagios plugins on remote
Linux/Unix machines. The main
reason for doing this is to allow Nagios to monitor "local" resources (like CPU load, memory
usage, etc.) on remote machines. Since these public resources are not usually exposed to
external machines, an agent like NRPE must be installed on the remote Linux/Unix
machines.
The NRPE addon consists of two pieces:
– The check_nrpe plugin, which resides on the local monitoring machine
– The NRPE daemon, which runs on the remote Linux/Unix machine
When Nagios needs to monitor a resource of service from a remote Linux/Unix machine:
– Nagios will execute the check_nrpe plugin and tell it what service needs to be checked
– The check_nrpe plugin contacts the NRPE daemon on the remote host over an (optionally)
SSL-protected
connection
– The NRPE daemon runs the appropriate Nagios plugin to check the service or resource
– The results from the service check are passed from the NRPE daemon back to the
check_nrpe plugin, which
then returns the check results to the Nagios process.
Q.What is NNDDOOUUTTIILLSS?
Ans:The NDOUTILS addon is designed to store all configuration and event data from Nagios
in a database. Storing information from Nagios in a database will allow for quicker retrieval
and processing of that data and will help serve as a foundation for the development of a
new PHP-based web interface in Nagios 3.0.
MySQL databases are currently supported by the addon and PostgreSQL support is in
development.
The NDOUTILS addon was designed to work for users who have:
– Single Nagios installations
– Multiple standalone or "vanilla" Nagios installations
– Multiple Nagios installations in distributed, redundant, and/or failover environments.
Each Nagios process, whether it is a standalong monitoring server, or part of a distributed,
redundant, or failover monitoring setup, is referred to as an "instance". In order to maintain
the integrity of stored data, each Nagios instance must be labeled with a unique identifier or
name.
Q.What are the components that make up the NDO utilities ?
Ans:There are four main components that make up the NDO utilities:
1. NDOMOD Event Broker Module :The NDO utilities includes a Nagios event broker module
(NDOMOD.O) that exports data from the Nagios daemon.Once the module has been loaded

8
by the Nagios daemon, itcan access all of the data and logic present in the running Nagios
process.The NDOMOD module has been designed to export configuration data, as well as
information about various runtime events that occur in the monitoring process, from the
Nagios daemon. The module can send this data to a standard file, a Unix domain socket, or
a TCP socket.
2. LOG2NDO Utility :The LOG2NDO utility has been designed to allow you to import
historical Nagios and NetSaint log files into a database via the NDO2DB daemon (described
later). The utility works by sending historical log file data to a standard file, a Unix domain
socket, or a TCP socket in a format the NDO2DB daemon understands. The NDO2DB
daemon can then be used to process that output and store the historical logfile information
in a database.
3. FILE2SOCK Utility :The FILE2SOCK utility is quite simple. Its reads input from a standard
file (or STDIN) and writes all of that data to either a Unix domain socket or TCP socket. The
data that is read is not processed in any way before it is sent to the socket.
4. NDO2DB Daemon:The NDO2DB utility is designed to take the data output from the
NDOMOD and LOG2NDO components and store it in a MySQL or PostgreSQL database.When
it starts, the NDO2DB daemon creates either a TCP or Unix domain socket and waits for
clients to connect. NDO2DB can run either as a standalone, multi-process daemon or under
INETD (if using a TCP socket).Multiple clients can connect to the NDO2DB daemon's socket
and transmit data simultaneously. A seperate NDO2DB process is spawned to handle each
new client that connects. Data is read from each client and stored in a user-specified
database for later retrieval and processing.
Install required dependencies:
During portions of the installation you'll need to have root access to your machine.
Make sure you've installed the following packages on your RHEL5.8 installation before continuing
installation of Nagios 4.0.1.
GD development libraries
You can use yum default package installer to install these packages by running the following commands
(as root):
[root@nagios ~]# yum install httpd php
[root@nagios ~]# yum install gcc glibc glibc-common
[root@nagios ~]# yum install gd gd-devel
[root@nagios ~]# yum install make net-snmp
Create Nagios user and Group:

9
[root@nagios ~]# useradd nagios
[root@nagios ~]# passwd nagios
Changing password for user nagios.
New password:
BAD PASSWORD: it is based on a dictionary word
BAD PASSWORD: is too simple
Retype new password:
passwd: all authentication tokens updated successfully.
Create a new nagcmd group for allowing external commands to be submitted through the web interface.
Add both the nagios user and the apache user to the group.
[root@nagios ~]# groupadd nagcmd
You have new mail in /var/spool/mail/root
[root@nagios ~]# /usr/sbin/usermod -a -G nagcmd nagios
[root@nagios ~]# /usr/sbin/usermod -a -G nagcmd apache
Download Nagios Core 4.0.1 and Nagios Plugin 1.5
Create a directory for your Nagios installation and all its future downloads.
[root@nagios ~]# mkdir /root/downloads
[root@nagios ~]# cd /root/downloads/
Now download latest Nagios Core 4.0.1 and Nagios plugins 1.5 packages with wget command.
[root@nagios downloads]# wget http://prdownloads.sourceforge.net/sourceforge/nagios/nagios-
4.0.1.tar.gz
[root@nagios downloads]# wget https://www.nagios-plugins.org/download/nagios-plugins-
1.5.tar.gz
When you extract these tarballs with tar command, two new folders will appear in that directory.

10
[root@nagios downloads]# tar -xzvf nagios-4.0.1.tar.gz
[root@nagios downloads]# tar -xzvf nagios-plugins-1.5.tar.gz
root@nagios downloads]# ls -ltr
total 4036
drwxr-xr-x. 15 200 300 4096 Oct 2 2013 nagios-plugins-1.5
drwxrwxr-x. 18 root root 4096 Oct 16 2013 nagios-4.0.1
-rw-r--r--. 1 root root 2428258 Jan 19 21:58 nagios-plugins-1.5.tar.gz
-rw-r--r--. 1 root root 1695367 Jul 18 18:38 nagios-4.0.1.tar.gz
Configure Nagios Core:
Now, first we will configure Nagios Core and to do so we need to go to Nagios directory
and run configure file and if everything goes fine, it will show the output in the end as sample output.
Please see below
[[email protected]]#./configure--with-command-group=nagcmd
Creating sample config files in sample-config/ ...
*** Configuration summary for nagios 4.0.1 10-15-2013 ***:
General Options:
-------------------------
Nagios executable: nagios
Nagios user/group: nagios,nagios
Command user/group: nagios,nagcmd
Event Broker: yes
Install ${prefix}: /usr/local/nagios
Install ${includedir}: /usr/local/nagios/include/nagios
Lock file: ${prefix}/var/nagios.lock
Check result directory: ${prefix}/var/spool/checkresults
Init directory: /etc/rc.d/init.d
Apache conf.d directory: /etc/httpd/conf.d
Mail program: /bin/mail
Host OS: linux-gnu
Web Interface Options:
------------------------
HTML URL: http://localhost/nagios/
CGI URL: http://localhost/nagios/cgi-bin/
Traceroute (used by WAP):
Review the options above for accuracy. If they look okay,
type 'make all' to compile the main program and CGIs.

11
Now, after configuring we need to Compile and install all the binaries with make command and make
install command will install all the needed libraries in your machine and we can proceed further.
[root@nagios nagios-4.0.1]# make all
[root@nagios nagios-4.0.1]#make install
*** Support Notes *******************************************
If you have questions about configuring or running Nagios,
please make sure that you:
- Look at the sample config files
- Read the documentation on the Nagios Library at:
http://library.nagios.com
before you post a question to one of the mailing lists.
Also make sure to include pertinent information that could
help others help you. This might include:
- What version of Nagios you are using
- What version of the plugins you are using
- Relevant snippets from your config files
- Relevant error messages from the Nagios log file
For more information on obtaining support for Nagios, visit:
http://support.nagios.com
*************************************************************
Enjoy.
Following command will install the init scripts for Nagios.
[root@nagios nagios-4.0.1]# /usr/bin/install -c -m 755 -d -o root -g root /etc/rc.d/init.d
[root@nagios nagios-4.0.1]# /usr/bin/install -c -m 755 -o root -g root daemon-init
/etc/rc.d/init.d/nagios
Next, install sample nagios files, please run following command.
[root@nagios nagios-4.0.1]# make install-commandmode
/usr/bin/install -c -m 775 -o nagios -g nagcmd -d /usr/local/nagios/var/rw
chmod g+s /usr/local/nagios/var/rw
*** External command directory configured ***
You have new mail in /var/spool/mail/root
[root@nagios nagios-4.0.1]# /usr/bin/install -c -m 775 -o nagios -g nagcmd -d

12
/usr/local/nagios/var/rw
[root@nagios nagios-4.0.1]# chmod g+s /usr/local/nagios/var/rw
Next, install sample nagios files, please run following command.
[root@nagios nagios-4.0.1]# make install-config
Customizing Nagios Configuration:
Open the “contacts.cfg” file with your choice of editor and set the email address associated with the
nagiosadmin contact definition to receiving email alerts.
[root@nagios nagios-4.0.1]# vi /usr/local/nagios/etc/objects/contacts.cfg
define contact{
contact_name nagiosadmin ; Short name of user
use generic-contact ; Inherit default values from generic-contact template (defined
above)
alias Nagios Admin ; Full name of user
email [email protected] ; <<***** CHANGE THIS TO YOUR EMAIL
ADDRESS ******
}
Install and configure Web Interface for Nagios: We are done with all configurations in the backend, now we will configure Web Interface for Nagios with
following command. The below command will Configure Web interface for Nagios and a web admin user
will be created “nagiosadmin”.
[root@nagios nagios-4.0.1]# make install-webconf
/usr/bin/install -c -m 644 sample-config/httpd.conf /etc/httpd/conf.d/nagios.conf
*** Nagios/Apache conf file installed ***
You have new mail in /var/spool/mail/root

13
In this step, we will be creating a password for “nagiosadmin”. After executing this command, please
provide a password twice and keep it remember because this password will be used when you login in
the Nagios Web interface.
[root@nagios nagios-4.0.1]# htpasswd -s -c /usr/local/nagios/etc/htpasswd.users nagiosadmin
New password:
Re-type new password:
Adding password for user nagiosadmin
You have new mail in /var/spool/mail/root
Restart Apache to make the new settings take effect.
[root@nagios nagios-4.0.1]# /etc/init.d/httpd restart
Stopping httpd: [ OK ]
Starting httpd: [ OK ]
[root@nagios nagios-4.0.1]#
Compile and Install Nagios Plugin:
Compile and Install Nagios Plugin:
We have downloaded nagios plugins in /root/downloads, Go there and configure and install it as directed
below.
[root@nagios nagios-4.0.1]# cd nagios-plugins-1.5
[root@nagios nagios-plugins-1.5]# ./configure --with-nagios-user=nagios --with-nagios-
group=nagcmd
[root@nagios nagios-4.0.1]# make
[root@nagios nagios-4.0.1]# make install
Verify Nagios configuration file:
Now we are all done with Nagios configuration and its time to verify it and to do so please insert
following command. If everything goes smooth it will show up similar to below output.
[root@nagios ~]# /usr/local/nagios/bin/nagios -v /usr/local/nagios/etc/nagios.cfg
Nagios Core 4.0.1
Copyright (c) 2009-present Nagios Core Development Team and Community Contributors
Copyright (c) 1999-2009 Ethan Galstad
Last Modified: 10-15-2013
License: GPL
Website: http://www.nagios.org
Reading configuration data...
Read main config file okay...

14
Read object config files okay...
Running pre-flight check on configuration data...
Checking objects...
Checked 8 services.
Checked 1 hosts.
Checked 1 host groups.
Checked 0 service groups.
Checked 1 contacts.
Checked 1 contact groups.
Checked 24 commands.
Checked 5 time periods.
Checked 0 host escalations.
Checked 0 service escalations.
Checking for circular paths...
Checked 1 hosts
Checked 0 service dependencies
Checked 0 host dependencies
Checked 5 timeperiods
Checking global event handlers...
Checking obsessive compulsive processor commands...
Checking misc settings...
Total Warnings: 0
Total Errors: 0
Things look okay - No serious problems were detected during the pre-flight check
Add Nagios Services to System Startup:
To make Nagios work across reboots, we need to add nagios and https with chkconfig command.
[root@nagios ~]# chkconfig --add nagios
[root@nagios ~]# chkconfig --level 35 nagios on
[root@nagios ~]# chkconfig --add httpd
[root@nagios ~]# chkconfig --level 35 httpd on
Restart Nagios to make the new settings take effect.
[root@nagios ~]# /etc/init.d/httpd restart
Stopping httpd: [ OK ]
Starting httpd: [ OK ]
[root@nagios ~]# /etc/init.d/nagios restart
Stopping nagios: [ OK ]
Starting nagios: [ OK ]
15
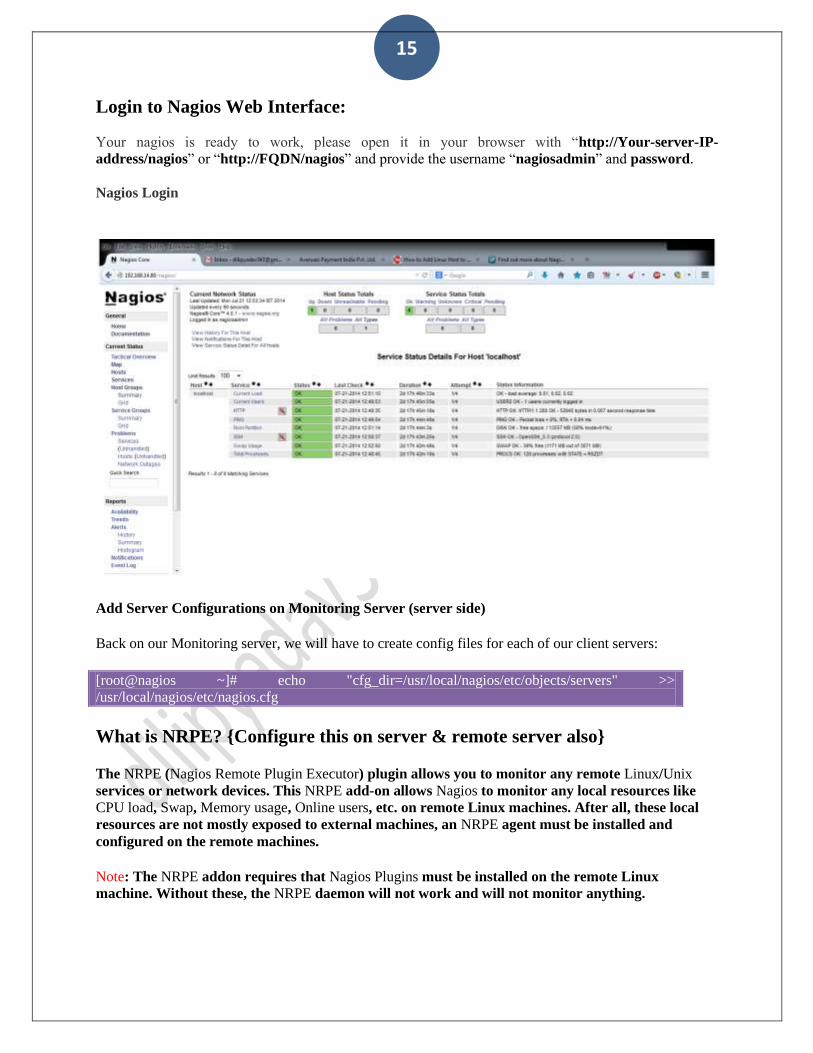
Login to Nagios Web Interface:
Your nagios is ready to work, please open it in your browser with “http://Your-server-IP-
address/nagios” or “http://FQDN/nagios” and provide the username “nagiosadmin” and password.
Nagios Login
Add Server Configurations on Monitoring Server (server side)
Back on our Monitoring server, we will have to create config files for each of our client servers:
[root@nagios ~]# echo "cfg_dir=/usr/local/nagios/etc/objects/servers" >>
/usr/local/nagios/etc/nagios.cfg
What is NRPE? {Configure this on server & remote server also}
The NRPE (Nagios Remote Plugin Executor) plugin allows you to monitor any remote Linux/Unix
services or network devices. This NRPE add-on allows Nagios to monitor any local resources like
CPU load, Swap, Memory usage, Online users, etc. on remote Linux machines. After all, these local
resources are not mostly exposed to external machines, an NRPE agent must be installed and
configured on the remote machines.
Note: The NRPE addon requires that Nagios Plugins must be installed on the remote Linux
machine. Without these, the NRPE daemon will not work and will not monitor anything.

16
Nagios NRPE to Monitor Remote Linux Server
Scenario / Question:
How do I monitor a remote linux system using Nagios
Solution / Answer:
Use th NRPE daemon to execute Nagios plugins on the remote server and report back to the monitoring host server.
NRPE Remote Server Installation and Setup
Create a new nagcmd group for allowing external commands to be submitted through the web interface.
Add both the nagios user and the apache user to the group.
[root@nagios ~]# groupadd nagcmd
[root@svn Desktop]# adduser nagios
You have new mail in /var/spool/mail/root
[root@nagios ~]# /usr/sbin/usermod -a -G nagcmd nagios
[root@nagios ~]# /usr/sbin/usermod -a -G nagcmd apache
Download and Install Nagios Plugins: #mkdir -p /opt/Nagios/Nagios_Plugins
#cd /opt/Nagios/Nagios_Plugins
Save file to directory /opt/Nagios
http://www.nagios.org/download/download.php
As of this writing Nagios 3.0.6 (Stable) and Nagios Plugins 1.4.13 (Stable)
Extract Files:
# tar xzf nagios-plugins-2.0.3.tar.gz
# cd nagios-plugins-1.4.13
Compile and Configure Nagios Plugins
** You need the openssl-devel package installed to compile plugins with ssl support. **

17
# yum -y install openssl-devel
We have downloaded nagios plugins in /root/downloads, Go there and configure and install it as directed
below.
[root@nagios nagios-4.0.1]# cd nagios-plugins-1.5
[root@nagios nagios-plugins-1.5]# ./configure --with-nagios-user=nagios --with-nagios-
group=nagcmd
[root@nagios nagios-4.0.1]# make
[root@nagios nagios-4.0.1]# make install
The permissions on the plugin directory and the plugins will need to be changed to nagios user
# chown nagios.nagios /usr/local/nagios
# chown -R nagios.nagios /usr/local/nagios/libexec
Package xinted is needed
# yum install xinetd
Downlad and Install NRPE Daemon # mkdir -p /opt/Nagios/Nagios_NRPE
# cd /opt/Nagios/Nagios_NRPE
Save file to directory /opt/Nagios
http://www.nagios.org/download/download.php
As of this writing NRPE 2.12 (Stable)
Extract the Files:
# tar -xzf nrpe-2.12.tar.gz
# cd nrpe-2.12
Compile and Configure NRPE ** You need the openssl-devel package installed to compile NRPE with ssl support. **
# yum -y install openssl-devel
Install NRPE:

18
# ./configure
General Options:
-------------------------
NRPE port: 5666
NRPE user: nagios
NRPE group: nagios
Nagios user: nagios
Nagios group: nagios
# make all
# make install-plugin
# make install-daemon
# make install-daemon-config
# make install-xinetd
Post NRPE Configuration
Edit Xinetd NRPE entry:
Add Nagios Monitoring server to the “only_from” directive
# vi /etc/xinetd.d/nrpe
only_from = 127.0.0.1 <nagios_ip_address>
Edit services file entry:
Add entry for nrpe daemon
# vi /etc/services
nrpe 5666/tcp # NRPE
Restart Xinetd and Set to start at boot:
# chkconfig xinetd –-level 35 on
# service xinetd restart
Centos 7
]# systemctl enable xinetd.service
]# systemctl start xinetd.service
Test NRPE Daemon Install
Check NRPE daemon is running and listening on port 5666:
# netstat -at |grep nrpe
Output should be:

19
tcp 0 0 *:nrpe *.* LISTEN
Check NRPE daemon is functioning:
# /usr/local/nagios/libexec/check_nrpe -H 127.0.0.1
Output should be NRPE version:
NRPE v2.12
On the remotehost - that is the one you want to check...
Vim /usr/local/nagios/etc/nrpe.cfg command[check_users]=/usr/local/nagios/libexec/check_users -w 5 -c 10
command[check_load]=/usr/local/nagios/libexec/check_load -w 15,10,5 -c 30,25,20
command[check_sda1]=/usr/local/nagios/libexec/check_disk -w 20% -c 10% -p /dev/sda1
command[check_zombie_procs]=/usr/local/nagios/libexec/check_procs -w 5 -c 10 -s Z
command[check_procs]=/usr/local/nagios/libexec/check_procs -w 150 -c 200
command[check_sda2]=/usr/local/nagios/libexec/check_disk -w 20% -c 10% -p /dev/sda2
command[check_sda5]=/usr/local/nagios/libexec/check_disk -w 20% -c 10% -p /dev/sda5
command[check_swap]=/usr/local/nagios/libexec/check_swap -w 20 -c 10
command[check_ssh]=/usr/local/nagios/libexec/check_ssh -H localhos
After that on server side
Edit each client's configuration file and define which services you would like monitored.
[root@nagios servers]# pwd ; cat openfire.apindia.com.cfg /usr/local/nagios/etc/objects/servers define host {

20
use linux-server host_name openfire.apindia.com alias openfire.apindia.com address 192.168.14.66 } define service{ use generic-service host_name openfire.apindia.com service_description Current Users check_command check_nrpe!check_users } define service { use generic-service host_name openfire.apindia.com service_description Current Load check_command check_nrpe!check_load }
define service{
use generic-service
host_name Webserver
service_description /dev/sda1 Free Space
check_command check_nrpe!check_sda1
}
define service{
use generic-service
host_name Webserver
service_description /dev/sda2 Free Space
check_command check_nrpe!check_sda2
}
define service{
use local-service
host_name openfire.apindia.com
service_description Total Processes
check_command check_nrpe!check_procs
}
define service{
use generic-service
host_name Staging-WebServer
service_description Swap Usage
check_command check_nrpe!check_swap
}
define service{
use generic-service

21
host_name Staging-WebServer
service_description SSH Monitoring
check_command check_nrpe!check_ssh
}
After that restart nagios service
http://xmodulo.com/monitor-server-memory-usage-nagios-remote-plugin-
executor.html
Define mem monitor by pl script

22
http://www.thegeekstuff.com/2008/06/how-to-monitor-remote-linux-host-using-nagios-30/
http://www.kernelhardware.org/nagios-nrpe-to-monitor-remote-linux-server/
Installing Munin Network Monitoring in CentOS RHEL
Munin is a networked resource monitoring tool that can help analyze resource trends. Munin the
monitoring tool surveys all your computers and remembers what it saw. It presents all the
information in graphs through a web interface.
This article will help you to install Munin on your system.
Step 1: Set Up EPEL Repository
First we need to add epel repository in our system. Use one of following command to install as per
system architecture.
CentOS/RHEL 6, 32 Bit (i386):
# rpm -Uvh http://download.fedoraproject.org/pub/epel/6/i386/epel-
release-6-8.noarch.rpm
CentOS/RHEL 6, 64 Bit x86_64):
# rpm -Uvh http://download.fedoraproject.org/pub/epel/6/x86_64/epel-
release-6-8.noarch.rpm
CentOS/RHEL 5, 32 Bit (i386):
# rpm -Uvh http://dl.fedoraproject.org/pub/epel/5/i386/epel-release-5-
4.noarch.rpm

23
CentOS/RHEL 5, 64 Bit (x86_64):
# rpm -Uvh http://dl.fedoraproject.org/pub/epel/5/x86_64/epel-release-5-
4.noarch.rpm
Step 2: Install Munin Packages
Use following command to install Munin and required packages
# yum --enablerepo=epel install munin munin-node rrdtool
Step 3: Configure Apache
By default Munin creates Apache configuration file /etc/httpd/conf.d/munin.conf. Edit Munin Apache configuration file and add following content.
# vim /etc/httpd/conf.d/munin.conf
Alias /munin /var/www/html/munin
<Directory /var/www/html/munin>
Options FollowSymLinks
AllowOverride None
Order allow,deny
Allow from all
</Directory>
<directory /var/www/html/munin>
AuthUserFile /etc/munin/munin-htpasswd
AuthName "Munin"
AuthType Basic
require valid-user
ExpiresActive On
ExpiresDefault M310
</directory>
ScriptAlias /munin-cgi/munin-cgi-graph /var/www/cgi-bin/munin-cgi-graph
Create munin htpasswd file using following command
# htpasswd -cm /etc/munin/munin-htpasswd muninadmin
New password:
Re-type new password:
Above created login details will required to access Munin web interface

24
Step 4: Restart Services
First start Munin node service and configure to auto start on system boot.
# /etc/init.d/munin-node start
# chkconfig munin-node on
Restart Apache service
# service httpd restart
Step 5: Access Munin Web Interface
Open following url in browser to access Munin web interface. Change ip/domain as per your setup
http://192.168.1.100/munin
or
http://nagios.apindia.com/munin
Install And Configure munin On the Client
On the client system, we only have to install the munin client package which is called munin-node:
# yum -y install munin munin-node

25
Next we must tell the munin client that our munin server nagios.apindia.com with the IP address
192.168.14.80 is allowed to connect to retrieve details from the client. To do this, we open
/etc/munin/munin-node.conf and add the line allow ^192\.168\.0\.80$ at the bottom of it. Afterwards,
the file should look like this:
# vi /etc/munin/munin-node.conf allow ^127\.0\.0\.1$
allow ^::1$
allow ^193\.168\.14\.80$ # munin server ip
Finally, we restart the munin client:
[root@fs ~]# /etc/init.d/munin-node restart
Stopping Munin Node agents: [ OK ]
Starting Munin Node: [ OK ]
[root@fs ~]# chkconfig --level 35 munin-node on
Update The munin Server Configuration
[root@fs ~]# cat /etc/munin/munin.comf
dbdir /var/lib/munin
htmldir /var/www/fs.apindia.com/web/monitoring
logdir /var/log/munin
rundir /var/run/munin
tmpldir /etc/munin/templates
[fs.apindia.com]
address 192.168.14.65
use_node_name yes
[root@fs ~]# mkdir -p /var/www/fs.apindia.com/web/monitoring
[root@fs ~]# chown munin:munin /var/www/fs.apindia.com/web/monitoring

26