nagios: building enterprise-grade monitoring ...ptgmedia.pearsoncmg.com/images/9780133135732/... ·...
TRANSCRIPT


NAGIOS
Josephsen_Book 1.indb i 3/6/13 3:18 PM

This page intentionally left blank
NAGIOS
Building Enterprise-Grade Monitoring Infrastructure for Systems and Networks
Second Edition
David Josephsen
Upper Saddle River, NJ • Boston • Indianapolis • San FranciscoNew York • Toronto • Montreal • London • Munich • ParisMadrid • Cape Town • Sydney • Tokyo • Singapore • Mexico City
Josephsen_Book 1.indb iii 3/6/13 3:18 PM

Many of the designations used by manufacturers and sellers to distinguish their products are claimed as trademarks. Where those designations appear in this book, and the publisher was aware of a trademark claim, the designations have been printed with initial capital letters or in all capitals.
The author and publisher have taken care in the preparation of this book, but make no expressed or implied warranty of any kind and assume no responsibility for errors or omissions. No liability is assumed for incidental or consequential damages in connection with or arising out of the use of the information or programs contained herein.
The publisher offers excellent discounts on this book when ordered in quantity for bulk purchases or special sales, which may include electronic versions and/or custom covers and content particular to your business, training goals, marketing focus, and branding interests. For more information, please contact:
U.S. Corporate and Government Sales(800) [email protected]
For sales outside the United States, please contact:
International [email protected]
Visit us on the Web: informit.com/aw
Library of Congress Cataloging-in-Publication Data is on fi le.
Copyright © 2013 Pearson Education, Inc.
All rights reserved. Printed in the United States of America. This publication is protected by copyright, and permission must be obtained from the publisher prior to any prohibited reproduction, storage in a retrieval system, or transmission in any form or by any means, electronic, mechanical, photocopying, recording, or likewise. To obtain permission to use material from this work, please submit a written request to Pearson Education, Inc., Permissions Department, One Lake Street, Upper Saddle River, New Jersey 07458, or you may fax your request to (201) 236-3290.
ISBN-13: 978-0-13-313573-2ISBN-10: 0-13-313573-X
Text printed in the United States on recycled paper at R.R. Donnelley in Crawfordsville, Indiana.
First Printing: April 2013
Josephsen_Book 1.indb iv 3/6/13 3:18 PM

For Cynthia, for enduring and encouraging my incessant curiosity.
And for Tito, the cat with the biggest heart.
Josephsen_Book 1.indb v 3/6/13 3:18 PM

This page intentionally left blank
vii
C O N T E N T S
Foreword by the Nagios Creator, Ethan Galstad xiii
Introduction 1
Do It Right the First Time 1
Why Nagios? 2
What’s in This Book? 4
Who Should Read This Book? 7End Notes 7
CHAPTER 1 Best Practices 9
A Procedural Approach to Systems Monitoring 9
Processing and Overhead 12Remote Versus Local Processing 12Bandwidth Considerations 13
Network Location and Dependencies 14
Security 16
Silence Is Golden 19
Watching Ports Versus Watching Applications 20
Who’s Watching the Watchers? 21End Notes 22
CHAPTER 2 Theory of Operations 23The Host and Service Paradigm 24
Starting from Scratch 24Hosts and Services 26Interdependence 26The Downside of Hosts and Services 27
Plug-ins 28Exit Codes 28Remote Execution 31
Josephsen_Book 1.indb vii 3/6/13 3:18 PM
viii Contents
Scheduling 34Check Interval and States 34Distributing the Load 36Reapers and Parallel Execution 38
Noti� cation 39Global Gotchas 39Noti� cation Options 40Templates 41Time Periods 41Scheduled Downtime, Acknowledgments, and Escalations 42
I/O Interfaces Summarized 43The Web Interface 43Monitoring 45Reporting 46The External Command File 48Performance Data 48The Event Broker 49End Notes 50
CHAPTER 3 Installing Nagios 51
OS Support and the FHS 51
Installation Steps and Prerequisites 53
Installing Nagios 54Con� gure 54Make 55Make Install 56
Installing the Plug-ins 57
Installing NRPE 59End Notes 60
CHAPTER 4 Con� guring Nagios 61Objects and De� nitions 62
nagios.cfg 64
The CGI Con� g 67
Templates 68
Timeperiods 70
Commands 71
Contacts 73
Contactgroup 74
Josephsen_Book 1.indb viii 3/6/13 3:18 PM
ixContents
Hosts 75
Services 77
Hostgroups 79
Servicegroups 79
Escalations 80
Dependencies 81
Extended Information 83
Apache Con� guration 83
GO! 85End Notes 85
CHAPTER 5 Bootstrapping the Nagios Con� g Files 87
Scripting Templates 87
Autodiscovery 91Check_MK 91Nagios XI 92Autodiscovery Is Dead: Long Live Autodiscovery 92
NagiosQL 92
CHAPTER 6 Watching: Monitoring Through the Nagios Plug-ins 95Local Queries 95
Pings 96Port Queries 98Querying Multiple Ports 100 (More) Complex Service Checks 102E2E Monitoring with WebInject and Cucumber-Nagios 104
Watching Windows 111The Windows Scripting Environment 111COM and OLE 113WMI 113To WSH or Not to WSH 118To VB or Not to VB 119The Future of Windows Scripting 119Getting Down to Business 121NRPE 122Check_NT 123NSCP 124
Josephsen_Book 1.indb ix 3/6/13 3:18 PM
x Contents
Watching UNIX 125NRPE 125CPU 126Memory 129Disk 130
Check_MK 131
Watching “Other Stuff ” 135SNMP 135Working with SNMP 137Environmental Sensors 142Standalone Sensors 143LMSensors 144IPMI 145End Notes 146
CHAPTER 7 Scaling Nagios 149
Tuning, Optimization, and Some Building Blocks 149NRDP/NSCA 150NDOUtils 150
Distributed Passive Checks with Secondary Nagios Daemons 150
Event Broker Modules: DNX, Merlin, and Mod Gearman 153
DNX 154Mod Gearman 156Op5 Merlin 157
Distributed Dashboards: Fusion, MNTOS, and MK-Multisite 159
CHAPTER 8 Visualization 167Nagios Performance Data 168
RRDTool: The Foundation 168Enter RRDTool 170RRD Data Types 171Heartbeat and Step 172Min and Max 174Round Robin Archives 174RRDTool Create Syntax 175RRDTool Graph Mode 180RPN 182
Josephsen_Book 1.indb x 3/6/13 3:18 PM
xiContents
Data Visualization Strategies: A Tale of Three Networks 185Suitcorp: Nagios, NagiosGraph, and Drraw 185singularity.gov: Nagios and Ganglia 192Massive Ginormic: Nagios, Logsurfer, Graphite, and Life After RRDTool 200
DIY Dashboards 209Know What You’re Doing 210RRDTool Fetch Mode 212The GD Graphics Library 214NagVis 215GraphViz 217Sparklines 218Force Directed Graphs with jsvis 220End Notes 221
CHAPTER 9 Nagios XI 223
What Is It? 223
How Does It Work? 224
What’s in It for Me? 226One Slick Interface 226Integrated Time Series Data 227Modularized Components 228Enhanced Reporting and Advanced Visualization 228Integrated Plug-ins and Con� guration Wizards 230Operational Improvements 234
How Do I Get My Hands on It? 235
CHAPTER 10 The Nagios Event Broker Interface 237
Function References and Callbacks in C 237
The NEB Architecture 239
Implementing a Filesystem Interface Using NEB 242
DNX, a Real-World Example 255
Wrap Up 258End Notes 259
Index 261
Josephsen_Book 1.indb xi 3/6/13 3:18 PM

This page intentionally left blank

xiii
F O R E W O R D
People often say that Nagios is “fl exible,” by which I think they mean that it is easily extended, but that misses the point. The power inherent in Nagios’ design derives not from its exten-sibility, but rather from its insistence on being extended. This is an admittedly small but important distinction. Many pieces of software can be extended to do new things, but very few pieces of software do nothing until you’ve extended them, and it is exactly because of this—this inherent demand that you customize it to suit your needs—that Nagios has always been a synthesis of contributions from engineers and administrators working to solve their own individual problems. No two installations are alike, and that is by design.
In the years since I fi rst created Nagios, it has grown in breadth and scope beyond any-thing I’d imagined. With over 1 million users worldwide, Nagios Core has found a home everywhere from huge Fortune-500 conglomerates to state of the art scientifi c research labs. The Nagios user community is one of the healthiest and most actively contributing open source communities out there, with nearly 4,000 published plug-ins, add-ons, and exten-sions—many of which are suffi ciently complex to warrant books of their own. The commu-nity is so large, diverse, and active, that Nagios now has its own annual conference where contributors, users, and educators come together to share ideas, learn tips and tricks, and fi nd out about upcoming developments in the project.
There is also a thriving community of corporations at work on extending and supporting Nagios. In 2007 I joined them, founding Nagios Enterprises. Our fl agship product, Nagios XI, is both an evolutionary step forward, and (as it should be) a fully-reverse compatible extension to Nagios Core. XI embraces the extend-by-design lineage of Core, preserving the power and fl exibility of Core, while expanding its accessibility and usability.
But even given the wonderful success Nagios has enjoyed, I’m the fi rst to admit that fl ex-ibility comes with a price. It can be diffi cult for newcomers and experienced admins alike to build and deploy a successful monitoring solution, and many of the challenges have nothing whatsoever to do with computers. Luckily, David is one of the few technical writers that are able to cover a complex subject like this in an easy-to-understand format. Whether you’re a newcomer to the world of network, system, and IT monitoring, or you’re an experienced Nagios admin, David’s work is sure to be helpful to you.
—Ethan Galstad, Nagios Founder and President
Josephsen_Book 1.indb xiii 3/6/13 3:18 PM

This page intentionally left blank

xv
A C K N O W L E D G M E N T S
My lovely wife, Cynthia, is patient and encouraging and pretty, and I love her.
Ethan Galstad, whose interest prompted the second edition, and without whom there would be no Nagios.
The tech reviewers on this project were outstanding—thanks, guys.
Last, my editors at Prentice Hall have been great. They aren’t at all like the editors in Spiderman or Fletch. Debra Williams Cauley and Kim Boedigheimer are a hardworking, on the ball, and clued-in pair of professionals. They’ve been patient and helpful, and I appreciate their time and attention.
Thanks.
00_9780133135732_FM.indd xv 3/8/13 10:15 AM

This page intentionally left blank

xvii
A B O U T T H E A U T H O R
David Josephsen is the Director of Systems Engineering at DBG, Inc., where he maintains a collection of geographically dispersed server farms. He has more than a decade of hands-on experience with UNIX systems, routers, fi rewalls, and load balancers in support of complex, high-volume networks. In addition to this book, he authored several chapters in the O’Reilly book Monitoring with Ganglia, and currently writes “iVoyer,” the systems monitoring col-umn for ;login magazine. Josephsen is just one of many thousands of avid Nagios users.
Josephsen_Book 1.indb xvii 3/6/13 3:18 PM

This page intentionally left blank
xix
A B O U T T H E T E C H N I C A L R E V I E W E R S
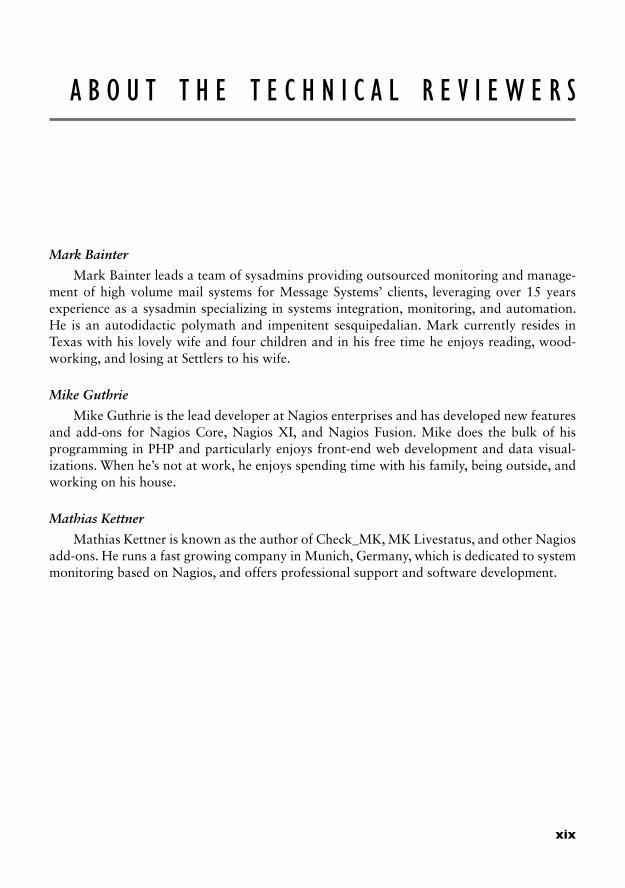
Mark Bainter
Mark Bainter leads a team of sysadmins providing outsourced monitoring and manage-ment of high volume mail systems for Message Systems’ clients, leveraging over 15 years experience as a sysadmin specializing in systems integration, monitoring, and automation. He is an autodidactic polymath and impenitent sesquipedalian. Mark currently resides in Texas with his lovely wife and four children and in his free time he enjoys reading, wood-working, and losing at Settlers to his wife.
Mike Guthrie
Mike Guthrie is the lead developer at Nagios enterprises and has developed new features and add-ons for Nagios Core, Nagios XI, and Nagios Fusion. Mike does the bulk of his programming in PHP and particularly enjoys front-end web development and data visual-izations. When he’s not at work, he enjoys spending time with his family, being outside, and working on his house.
Mathias Kettner
Mathias Kettner is known as the author of Check_MK, MK Livestatus, and other Nagios add-ons. He runs a fast growing company in Munich, Germany, which is dedicated to system monitoring based on Nagios, and offers professional support and software development.
00_9780133135732_FM.indd xix 3/8/13 12:46 PM

This page intentionally left blank
1
Introduction
This is a book about untrustworthy machines—machines, in fact, that are every bit as untrustworthy as they are critical to our well being. But I don’t need to bore you with a laundry list of how prevalent computer systems have become or with horror stories about what can happen when they fail. If you picked up this book, I’m sure you’re well aware of the problems: layer upon layer of interdependent libraries hiding bugs in their abstraction, script kiddies, viruses, DDOS attacks, hardware failure, end-user error, backhoes, hurricanes, and on and on. It doesn’t matter whether the root cause is malicious or accidental; your systems will fail, and when they do, only two things will save you from the downtime: redundancy and monitoring systems.
Do It Right the First Time
In concept, monitoring systems are simple: an extra system or collection of systems whose job is to watch the other systems for problems. For example, the monitoring system could periodically connect to a Web server to make sure it responds and, if not, send notifi cations to the administrators. Although it sounds straightforward, monitoring systems have grown into expensive, complex pieces of software. Many now have agents larger than 500MB, include proprietary scripting languages, and sport price tags above $60,000.
When implemented correctly, a monitoring system can be your best friend. It can notify administrators of glitches before they become crises, help architects tease out patterns corresponding to chronic interoperability issues, and give engineers detailed capacity planning information. A good monitoring system will help the security guys correlate interesting events, show the network operations center personnel where the bandwidth bottlenecks are, and provide management with much needed high-level visibility into the critical systems that they bet their business on. A good monitoring system can help you uphold your service level
Josephsen_Book 1.indb 1 3/6/13 3:18 PM
2 Introduction
agreement (SLA) and even take steps to solve problems without waking anyone up at all. Good monitoring systems save money, bring stability to complex environments, and make everyone happy.
When done poorly, however, the same system can wreak havoc. Bad monitoring systems cry wolf at all hours of the night so often that nobody pays attention anymore; they install backdoors into your otherwise secure infrastructure, leech time and resources away from other projects, and congest network links with megabyte upon megabyte of health checks. Bad monitoring systems can really suck.
Unfortunately, getting it right the fi rst time isn’t as easy as you might think, and in my experience, a bad monitoring system doesn’t usually survive long enough to be fi xed. Bad monitoring systems are too much of a burden on everyone involved, including the systems being monitored. In this context, it’s easy to see why large corporations and governments employ full-time monitoring specialists and purchase software with six-fi gure price tags. They know how important it is to get it right the fi rst time.
Small- to medium-sized businesses and universities can have environments as complex as or even more complex than large companies, but they obviously don’t have the luxury of high-priced tools and specialized expertise. Getting a well-built monitoring infrastructure in these environments, with their geographically dispersed campuses and satellite offi ces, can be a challenge. But having spent a good part of the past 13 years building and maintaining monitoring systems, I’m here to tell you that not only is it possible to get it done right the fi rst time, but you can do it for free, with a bit of elbow grease, some open source tools, and a pinch of imagination.
Why Nagios?
Nagios is, in my opinion, the best system and network monitoring tool available, open source or otherwise. Its modularity and straightforward approach to monitoring make it easy to work with and highly scalable. Further, Nagios’s open source license makes it freely available and easy to extend to meet your specifi c needs. Instead of trying to do everything for you, Nagios excels at interoperability with other open source tools, which makes it very fl exible. If you’re looking for a monolithic piece of software with check boxes that solve all your problems, this probably isn’t the book for you. But before you stop reading, give me another paragraph or two to convince you that the check boxes aren’t really what you’re looking for.
Most commercial offerings get it wrong because their approach to the problem assumes that everyone wants the same solution. To a certain extent, this is true. Everyone has a large glob of computers and network equipment and wants to be notifi ed if some subset of it fails.
Josephsen_Book 1.indb 2 3/6/13 3:18 PM
3Why Nagios?
So if you want to sell monitoring software, the obvious way to go about it is to create a piece of software that knows how to monitor every conceivable piece of computer software and networking gear in existence. The more gadgets your system can monitor, the more people you can sell it to. To someone who wants to sell monitoring software, it’s easy to believe that monitoring systems are turnkey solutions and whoever’s software can monitor the largest number of gadgets wins.
The large commercial packages I’ve worked with all seem to follow this logic. Not unlike the Borg, they are methodically locating new computer gizmos and adding the requisite monitoring code to their solution—or worse, acquiring other companies who already know how to monitor lots of computer gadgetry and bolting those companies’ code onto their own. They quickly become obsessed with features, creating enormous spreadsheets of supported gizmos. Their software engineers exist so that the presales engineers can come to your offi ce and say to your managers, through seemingly layers of white gleaming teeth, “Yes, our software can monitor that.”
The problem is that monitoring systems are not turnkey solutions. They require a large amount of customization before they start solving problems and herein lies the difference between people selling monitoring software and those designing and implementing monitoring systems. When you’re trying to build a monitoring system, a piece of software that can monitor every gadget in the world by clicking a check box is not as useful to you as one that makes it easy to monitor what you need, in exactly the manner that you want. By focusing on what to monitor, the proprietary solutions neglect the how, which limits the context in which they may be used.
Take ping, for example. Every monitoring system I’ve ever dealt with uses ICMP Echo requests, otherwise known as pings, to check host availability in one way or another. But if you want to control how a proprietary monitoring system uses ping, architectural limitations become quickly apparent. Let’s say I want to specify the number of ICMP packets to send, or I want to be able to send notifi cations based on the round-trip time of the packet in microseconds instead of simple pass/fail. More complex environments may necessitate that I use IPv6 pings, or that I portknock1 before I ping. The problem with the monolithic, feature-full approach is that these changes represent changes to the core application logic and are, therefore, nontrivial to implement.
In the commercial monitoring applications I’ve worked with, if these ping examples could be performed at all, they would require reimplementing the ping logic in the monitoring system’s proprietary scripting language. In other words, you would have to toss out the built-in ping functionality altogether. Perhaps being able to control the specifi cs of ping checks is of questionable value to you, but if you don’t have any control over something as basic as ping, what are the odds that you’ll have fi nite enough control over the most important checks
Josephsen_Book 1.indb 3 3/6/13 3:18 PM

4 Introduction
in your environment? They’ve made the assumption that they know how you want to ping things and from then on it was game over; they never thought about it again. And why would they? The ping feature is already in the spreadsheet, after all.
When it comes to gizmos, Nagios’s focus is on modularity. Single-purpose monitoring applets called plug-ins provide support for specifi c devices and services. Rather than participating in the feature arms race, hardware support is community driven. As community members have a need to monitor new devices or services, new plug-ins are written and usually more quickly than the commercial applications can add the same support. In practice, Nagios will always support everything you need it to and without ever needing to upgrade Nagios itself. Nagios also provides the best of both worlds when it comes to support, with several commercial options, as well as a thriving and helpful community that provides free support through various forums and mailing lists.
Choosing Nagios as your monitoring platform means that your monitoring effort will be limited by your own imagination, technical prowess, and political savvy. Nagios can go anywhere you want it to and the trip there is usually pretty simple. Although Nagios can do everything the commercial applications can, and more, without the bulky, insecure agent install, it usually doesn’t compare favorably to commercial monitoring systems because when spreadsheets are parsed, Nagios doesn’t have as many checks. In fact, if they’re counting correctly, Nagios has no checks at all, because technically it doesn’t know how to monitor anything; it prefers that you tell it how. The question of “how” is diffi cult to encompass with a check box.
What’s in This Book?
Although Nagios is the biggest piece of the puzzle, it’s only one of the myriad of tools that make up a world-class open source monitoring system. With several books, superb online documentation, and lively and informative mailing lists, it’s also the best-documented piece of the puzzle. So my intention in writing this book is to pick up where the documentation leaves off. This is not a book about Nagios as much as it is a book about the construction of monitoring systems using Nagios, and there is much more to building monitoring systems than confi guring a monitoring tool.
I’ll cover the usual confi guration boilerplate, but confi guring and installing Nagios is not my primary focus. Instead, to help you build great monitoring systems, I need to introduce you to the protocols and tools that enhance Nagios’s functionality and simplify its confi guration. I need to give you an in-depth understanding of the inner workings of Nagios itself, so you can extend it to do whatever you might need. I need to spend some time in this book exploring possibilities because Nagios is limited only by what you feel it can do.
Josephsen_Book 1.indb 4 3/6/13 3:18 PM

5What’s in This Book?
Finally, I need to write about things only loosely related to Nagios, like best practices, SNMP, visualizing time-series data, and various Microsoft scripting technologies, such as WMI and WSH.
Most important, I need to document Nagios itself in a different way. By introducing it in terms of a task-effi cient scheduling and notifi cation engine, I can keep things simple while talking about the internals up front. Rather than relegating important information to the seldom-read advanced section, I’ll empower you early by covering topics like plug-in customization and scheduling as core concepts.
Although the chapters more or less stand on their own, and I’ve tried to make the book as reference-friendly as possible, I think it reads better as a progression from start to fi nish. I encourage you to read from cover to cover, skipping over anything you are already familiar with. The text is not large, but I think you’ll fi nd it dense with information and even the most seasoned monitoring veterans should fi nd more than a few useful nuggets of wisdom.
The chapters tend to build on each other and casually introduce Nagios-specifi c details in the context of more general monitoring concepts. Because many important decisions need to be made before any software is installed, I begin with “Best Practices” in Chapter 1. This should get you thinking in terms of what needs to take place for your monitoring initiative to be successful, such as how to go about implementing, who to involve, and what pitfalls to avoid.
Chapter 2, “Theory of Operations,” builds on Chapter 1’s general design guidance by providing a theoretical overview of Nagios from the ground up. Rather than inundating you with confi guration minutiae, Chapter 2 will give you a detailed understanding of how Nagios works without being overly specifi c about confi guration directives. This knowledge will go a long way toward making confi guration more transparent later.
Before we can confi gure Nagios to monitor our environment, we need to install it. Chapter 3, “Installing Nagios,” should help you install Nagios, either from source or via a package manager.
Chapter 4, “Confi guring Nagios,” is the dreaded confi guration chapter. Confi guring Nagios for the fi rst time is not something most people consider to be fun, but I hope I’ve kept it as painless as possible by taking a bottom-up approach, documenting only the most used and required directives, providing up front examples, and specifying exactly what objects refer to what other objects and how.
Josephsen_Book 1.indb 5 3/6/13 3:18 PM

6 Introduction
Most people who try Nagios become attached to it2 and are loathe to use anything else. But if there is a universal complaint, it is certainly confi guration. Chapter 5, “Bootstrapping the Nagios Confi g Files,” takes a bit of a digression to document some of the tools available to make confi guration easier to stomach. These include automated discovery tools, as well as graphical user interfaces.
In Chapter 6, “Watching: Monitoring Through the Nagios Plug-ins,” we are fi nally ready to get into the nitty-gritty of watching systems, including specifi c examples with Nagios plug-in confi guration syntax solving real-world problems. I begin with a section on watching Microsoft Windows boxes, followed by a section on UNIX, and ending with the “other stuff” section, which encompasses networking gear and environmental sensors.
Chapter 7, “Scaling Nagios,” is new to the second edition. Scaling Nagios for large networks has been one of the most interesting problems Nagios sysadmins have had to deal with over the past fi ve or six years. The explosion of machine virtualization and cost-effective cloud services have created a lot of interest in large parallel processing architectures that are composed of lots of little nodes. In this chapter, I cover several tools and strategies that will enable you to distribute the monitoring load and build a stable large-scale monitoring infrastructure for tens of thousands of nodes and beyond.
Chapter 8, “Visualization,” covers one of my favorite topics: data visualization. Good data visualization solves problems that couldn’t be solved otherwise, and I’m excited about the options that exist now, as well as what’s on the horizon. With fantastic visualization tools like RRDTool, Ganglia, and Graphite, graphing time series data from Nagios is getting easier every day, but this chapter doesn’t stop at mere line graphs.
Also new in the second edition is Chapter 9, “Nagios XI,” which is dedicated to the new commercial version of Nagios. Built from many of the tools covered in this book by the guys who originally wrote Nagios, XI is truly a masterpiece of integration and usability. They’ve made monitoring with Nagios so simple my mom could do it (well, my mom writes optimizing cross-compilers for embedded FLIR systems, but you get my point).
And fi nally, now that you know the rules, it’s time to teach you how to break them. At the time of this writing, Chapter 10, “The Nagios Event Broker Interface,” is the only print documentation I’m aware of that covers the new Nagios Event Broker interface. The event broker is the most powerful Nagios interface available. Mastering it rewards you with nothing less than the ability to rewrite Chapter 2 for yourself by fundamentally changing any aspect of how Nagios operates or extending it to meet any need you might have. I describe how the event broker works and walk you through building an NEB module.
Josephsen_Book 1.indb 6 3/6/13 3:18 PM
7Who Should Read This Book?
Who Should Read This Book?
If you are a systems administrator with a closet full of UNIX and Windows systems and assorted network gadgetry, and you need a world-class monitoring system on the cheap, this book is for you. Contrary to what you might expect, building monitoring systems is not a trivial undertaking. Constructing the system that potentially interacts with every TCP-based device in your environment requires a bit of knowledge on your part. But don’t let that give you pause; systems monitoring has taught me more than anything else I’ve done in my career and, in my experience, no matter what your level of knowledge, working with monitoring systems has a tendency to constantly challenge your assumptions, deepen your understanding, and keep you right on the edge of what you know.
To get the most out of this book, you should have a pretty good handle on the text-based Internet protocols that you use regularly, such as SMTP and HTTP. Although it interacts with Windows servers very well, the Nagios daemon is meant to run on Linux, which makes the text pretty Linux heavy, so a passing familiarity with Linux or POSIX-ish systems is helpful. Although not strictly required, you should also have some programming skills. The book has a fair number of code listings, but I’ve tried to keep them as straightforward and as easy-to-follow as possible. With the exception of Chapter 8, which is exclusively C, the code listings are written in either UNIX shell or Perl.
Perhaps the only strict requirement is that you approach the subject matter with a healthy dose of open curiosity. If something seems unclear, don’t be discouraged; check out the online documentation, ask on the lists, or even shoot me an email; I’d be glad to help if I can.
Have fun!
—Dave
End Notes 1 www.portknocking.org 2 Dare I say, love it?
Josephsen_Book 1.indb 7 3/6/13 3:18 PM

This page intentionally left blank
223
C H A P T E R 9
Nagios XI
In 2009, Nagios Enterprises, the corporation formed by Nagios creator Ethan Galstad, launched Nagios XI, a commercial version of Nagios. XI truly is an amazing accomplish-ment. You need to know next to nothing to use it, and yet the fi rst eight chapters of this book are prerequisite to your understanding it. But now that you have a good handle on how Nagios and the various add-ons surrounding it work, we can fi nally examine XI and see if it might be a good fi t for you.
What Is It?
After the release of 3.0, Nagios was, it seemed, in danger of becoming a victim of its own success. Sysadmins who knew and loved it were happy to see it continue in the way it always had, but its popularity had risen to the point that a different and more populous group of potential end users had taken notice, and with them, Nagios wasn’t comparing favorably with newer, prettier, and less fl exible commercial competitors.
This new breed of user was quite vocal and had a few very specifi c gripes. First they found Nagios’s confi guration syntax unwieldy, to say nothing of the intolerable notion of (gasp) editing text fi les by hand. Second, they found the Nagios web interface, with its C-based CGI and lack of integrated time-series data, unforgivably old-fashioned. Finally they had no idea what to make of the fact that there was no database back-end. Jiminy Christmas—wrist watches and garbage disposals run MySQL these days! How was one to take seriously a monitoring system that didn’t?
Josephsen_Book 1.indb 223 3/6/13 3:18 PM
224 Chapter 9 Nagios XI
For this considerable subset of users, Nagios’s price tag didn’t make up for its abhorrent lack of bling, and answers to the effect that all these things could be rectifi ed with add-ons fell on deaf Bluetooth earpieces. Add-on options were birds in the bush, and they would rather pay for a bird in the hand than go beating around the bush themselves for free.
XI might best be called the perfect compromise between maintaining the power and fl exibility of Nagios and providing a turnkey monitoring system that more than satiates the desires of the PHP proletariat. But that description sells it short; XI is much more than just a shiny interface; it represents a huge amount of custom development and integration work. Further, there is real functionality in XI that simply can’t be found in Nagios Core. But neither can it be called a new monitoring system in its own right, because in very important ways, it remains Nagios and retains all the fl exibility and power that I’ve described in the previous chapters. Everything I’ve written up to now about the underlying architecture, plug-ins, scalability, and even advanced visualization, is applicable to Nagios XI.
It’ll be easier to just show you.
How Does It Work?
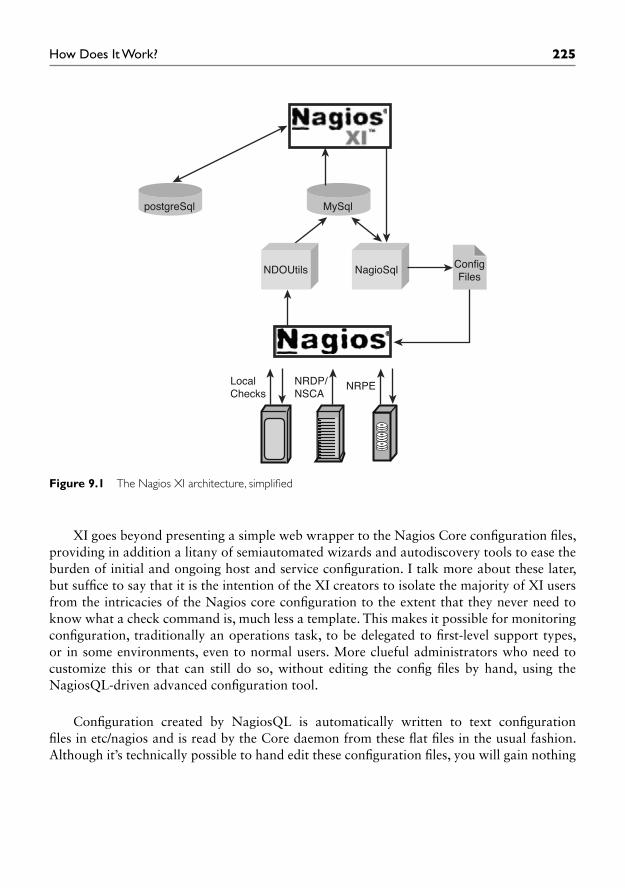
Figure 9.1 is a rough sketch of the Nagios XI architecture. As you can see, all host and service monitoring, as well as notifi cation, escalation, and so on, relies on an unmodifi ed Nagios Core daemon, so any preexisting plug-ins or customization you might have can be made to work under XI. The NDOUtils plug-in (described in Chapter 7, “Scaling Nagios”) has been enabled and confi gured to replicate state information from Nagios Core into a MySQL database. Here is the primary information hand-off between Core and XI; Nagios XI reads this database to glean information about the current state of hosts and services, as well as the Core daemon itself. This adds an information layer to Core that can be consumed by third-party UIs as well as your own custom integration scripts.
The NagiosQL add-on (described in Chapter 5, “Bootstrapping the Nagios Confi g Files”) provides the hooks necessary to modify the Nagios Core confi guration from the XI interface. Every parameter that can be confi gured in the fl at fi les may be set via the web interface using the customized NagiosQL forms in the “Advanced Confi guration” section of the XI interface. Although these forms are well integrated into XI, and retain an XI look and feel, there is a bit of a line in the sand between NagiosQL-driven core confi guration, which is referred to as “advanced” in the XI interface, and the confi guration parameters that are specifi c to XI itself.
Josephsen_Book 1.indb 224 3/6/13 3:18 PM
225How Does It Work?
Figure 9.1 The Nagios XI architecture, simplifi ed
XI goes beyond presenting a simple web wrapper to the Nagios Core confi guration fi les, providing in addition a litany of semiautomated wizards and autodiscovery tools to ease the burden of initial and ongoing host and service confi guration. I talk more about these later, but suffi ce to say that it is the intention of the XI creators to isolate the majority of XI users from the intricacies of the Nagios core confi guration to the extent that they never need to know what a check command is, much less a template. This makes it possible for monitoring confi guration, traditionally an operations task, to be delegated to fi rst-level support types, or in some environments, even to normal users. More clueful administrators who need to customize this or that can still do so, without editing the confi g fi les by hand, using the NagiosQL-driven advanced confi guration tool.
Confi guration created by NagiosQL is automatically written to text confi guration fi les in etc/nagios and is read by the Core daemon from these fl at fi les in the usual fashion. Although it’s technically possible to hand edit these confi guration fi les, you will gain nothing
NDOUtils NagioSql
MySqlpostgreSql
ConfigFiles
LocalChecks
NRDP/NSCA
NRPE
Josephsen_Book 1.indb 225 3/6/13 3:18 PM
226 Chapter 9 Nagios XI
because NagiosQL will eventually overwrite any changes you make. If you have your own confi guration-generating automation (like Check_MK), or preexisting confi guration that you do not want to import into NagiosQL, or even if you’re a curmudgeon who just prefers to manually edit the confi guration, you can still maintain static confi g fi les in etc/nagios/static, and your fi les will still be parsed by the Core daemon while being left alone by NagiosQL. That runs both ways; statically confi gured hosts and services can’t be modifi ed via the UI unless you manually import them into NagiosQL (at which point they cease to be static).
Finally, Nagios XI maintains its own Postgresql database to store various confi guration parameters such as user-settings, custom dashboards, authentication info, and the like. Given the shiny new PHP interface, the simplifi ed confi guration options, and the open database back-end, Nagios XI should satisfy the complaints I’m used to hearing from corporate administrators who are in the market for a “grown up” commercial monitoring product; however, there’s a lot more functionality than what I’ve encompassed in the architecture diagram.
What’s in It for Me?
Now that we’ve taken a quick look at what XI is and how it works, let’s take a look at how XI compares to Nagios Core and the various commercial monitoring systems with which it was designed to compete.
One Slick Interface
Given the general quality of the alternative PHP interfaces we fi nd in the Nagios Exchange repository, the XI interface is shockingly excellent. It is certainly not yet another effort to bring the CGI interface “up to date” by replacing it with a PHP version of itself. The XI user interface is a complete rethinking of the UI, which truly takes advantage of the strengths of a web programming platform like PHP at every opportunity. Elements within dashboards can be unlocked, moved around, or even deleted to suit the preferences of the user. AJAX is employed, both to update individual information elements and to provide feedback, so that when I send a command via the UI to reschedule a service check or acknowledge an alert, a box momentarily appears to let me know my command has been accepted. One of my least favorite things about the Core UI is the way it dumps me to an acknowledgment page after I’ve issued a command, forcing me to manually navigate back to somewhere useful.
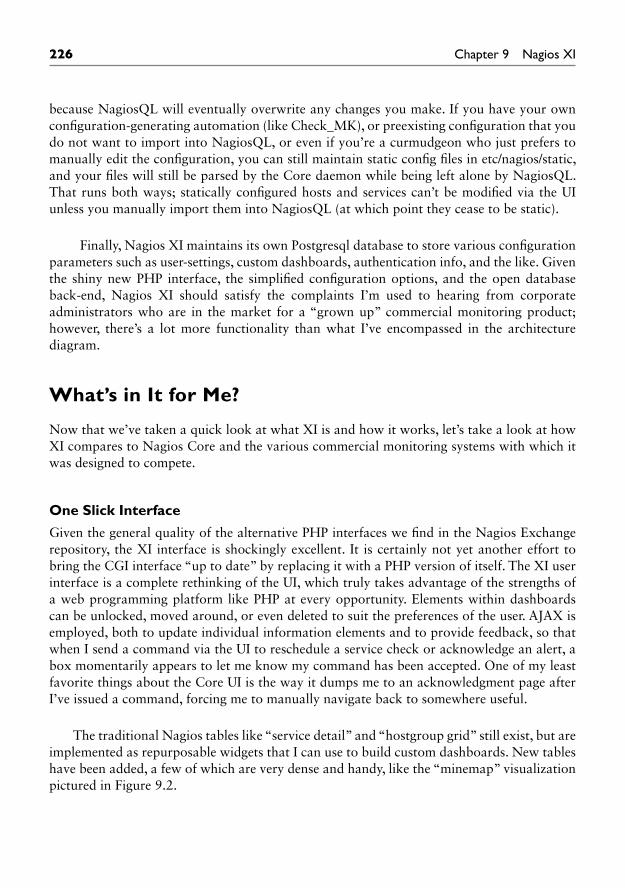
The traditional Nagios tables like “service detail” and “hostgroup grid” still exist, but are implemented as repurposable widgets that I can use to build custom dashboards. New tables have been added, a few of which are very dense and handy, like the “minemap” visualization pictured in Figure 9.2.
Josephsen_Book 1.indb 226 3/6/13 3:18 PM
227What’s in It for Me?
Figure 9.2 Nagios XI Minemap
One of my favorite Nagios Core views is the hostgroup grid, which shows at a glance the state of entire hostgroups, including their services. This is one of the more dense status visualizations available in the old UI; unfortunately, I still need to scroll around to see everything in my environment. The Minemap visualization, by comparison, shows the same information in a much smaller amount of screen space, enabling me to get a coherent, uncluttered, detailed service-level visualization of my entire network on a single screen.
Integrated Time Series Data
PNP4Nagios (described in Chapter 8, “Visualization”) is integrated out of the box, and defi -nitions exist for all the included plug-ins. This means that without any additional confi gu-ration whatsoever you get time series data for every service you confi gure. The RRDTool graphs are so well integrated into the UI that the uninitiated user would never guess PNP or RRDTool were community-sourced add-ons, so you get a snazzy UI without losing any of the power and fl exibility that these community-driven development efforts provide.
In addition to the RRDTool graphs, small bar-graph visualizations for metrics collected by the Nagios Core daemon, as well as remote execution tools like NRPE, are sprinkled throughout the interface. These do a great job of conveying capacity planning info at a glance, as well as giving the UI a very polished look.
Rounding out the time series visualization is a Graph Explorer tool, which allows you to draw, among other things, ad hoc time series and stacked time series graphs. The graph explorer uses a commercial JavaScript library from HiCharts.com and looks quite elegant. The data comes from the RRD’s resident on the Nagios server via rrdtool fetch and is provided to the end-user’s browser to compute the graph locally. This saves the server’s
Hostgroup ‘all boxes’ Status Grid
Hosts192.168.1.254
192.168.1.3
192.168.1.4
192.168.1.69
DiskStation
localhost
lois-PC
skeptech.org
Last Updated: 2012-08-16 19:07:56
Services
1919 1919 1919
Josephsen_Book 1.indb 227 3/6/13 3:18 PM
228 Chapter 9 Nagios XI
CPU and provides a snappy, feature-rich data visualization, allowing you to scale the graph by dragging to select a range and providing pop-up numerical values when you mouse over any data areas. The stacked time series graphs include time-shifted historical data, so you can easily compare today’s data to that of yesterday, and so on.
Modularized Components
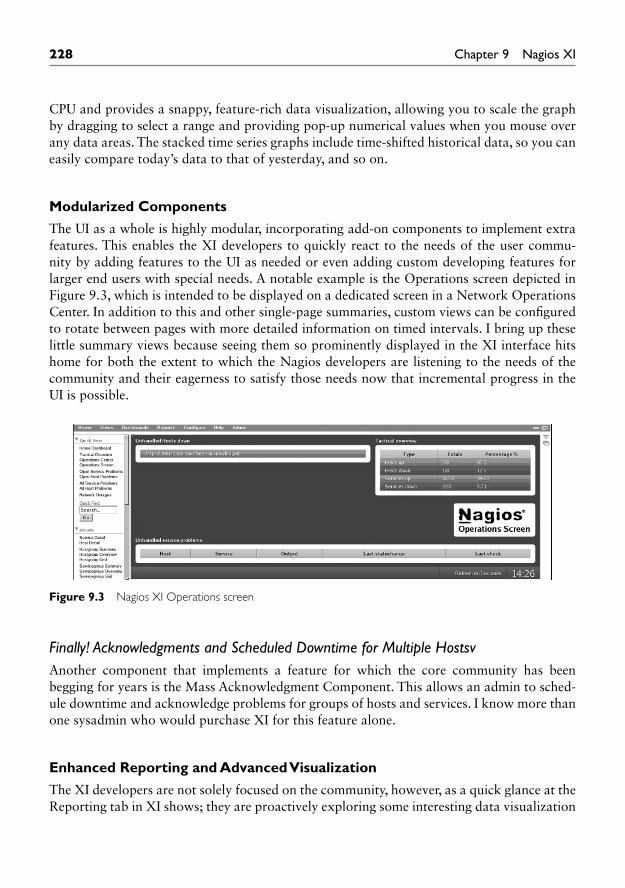
The UI as a whole is highly modular, incorporating add-on components to implement extra features. This enables the XI developers to quickly react to the needs of the user commu-nity by adding features to the UI as needed or even adding custom developing features for larger end users with special needs. A notable example is the Operations screen depicted in Figure 9.3, which is intended to be displayed on a dedicated screen in a Network Operations Center. In addition to this and other single-page summaries, custom views can be confi gured to rotate between pages with more detailed information on timed intervals. I bring up these little summary views because seeing them so prominently displayed in the XI interface hits home for both the extent to which the Nagios developers are listening to the needs of the community and their eagerness to satisfy those needs now that incremental progress in the UI is possible.
Figure 9.3 Nagios XI Operations screen
Finally! Acknowledgments and Scheduled Downtime for Multiple HostsvAnother component that implements a feature for which the core community has been begging for years is the Mass Acknowledgment Component. This allows an admin to sched-ule downtime and acknowledge problems for groups of hosts and services. I know more than one sysadmin who would purchase XI for this feature alone.
Enhanced Reporting and Advanced Visualization
The XI developers are not solely focused on the community, however, as a quick glance at the Reporting tab in XI shows; they are proactively exploring some interesting data visualization
Josephsen_Book 1.indb 228 3/6/13 3:18 PM
229What’s in It for Me?
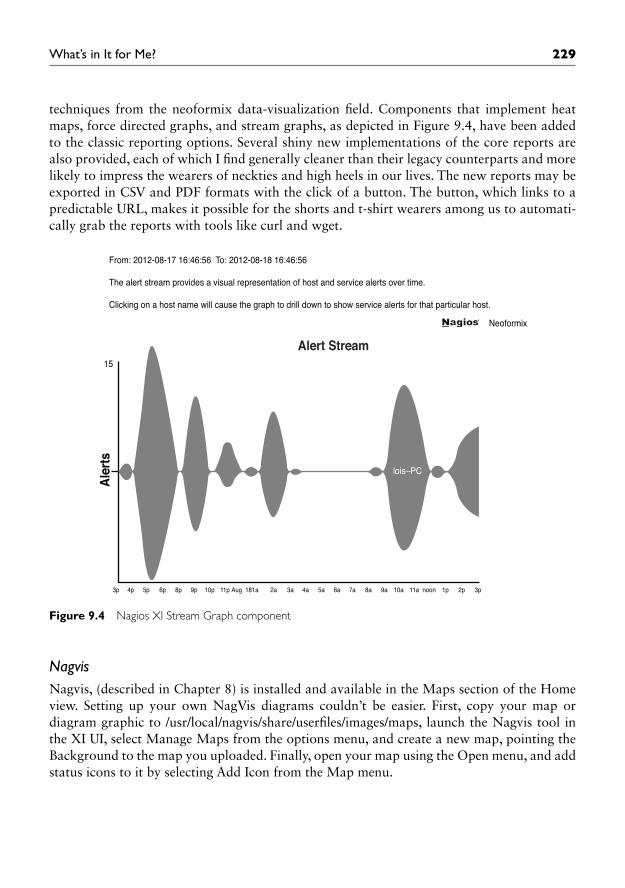
techniques from the neoformix data-visualization fi eld. Components that implement heat maps, force directed graphs, and stream graphs, as depicted in Figure 9.4, have been added to the classic reporting options. Several shiny new implementations of the core reports are also provided, each of which I fi nd generally cleaner than their legacy counterparts and more likely to impress the wearers of neckties and high heels in our lives. The new reports may be exported in CSV and PDF formats with the click of a button. The button, which links to a predictable URL, makes it possible for the shorts and t-shirt wearers among us to automati-cally grab the reports with tools like curl and wget.
Ale
rts
From: 2012-08-17 16:46:56 To: 2012-08-18 16:46:56
The alert stream provides a visual representation of host and service alerts over time.
Clicking on a host name will cause the graph to drill down to show service alerts for that particular host.
Neoformix
15
3p 4p 5p 6p 8p 9p 10p 11p Aug 181a 2a 3a 4a 5a 6a 7a 8a 9a 10a 11a noon 1p 2p 3p
lois–PC
Alert Stream
Figure 9.4 Nagios XI Stream Graph component
NagvisNagvis, (described in Chapter 8) is installed and available in the Maps section of the Home view. Setting up your own NagVis diagrams couldn’t be easier. First, copy your map or diagram graphic to /usr/local/nagvis/share/userfi les/images/maps, launch the Nagvis tool in the XI UI, select Manage Maps from the options menu, and create a new map, pointing the Background to the map you uploaded. Finally, open your map using the Open menu, and add status icons to it by selecting Add Icon from the Map menu.
Josephsen_Book 1.indb 229 3/6/13 3:18 PM
230 Chapter 9 Nagios XI
Business ProcessesNagios XI contains wrapper logic for grouping individual services into higher-level entities called business processes. The intent here is to implement what the Gardiner Group calls Business Application Monitoring, or BAM. BAM attempts to provide real-time status for critical business entities like a sales catalog web site or corporate email. Nagios XI imple-ments BAM by breaking a high-level concept like “corporate email,” into its requisite pieces, such as Mail Transfer Agents, Mail Exchangers, Groupware systems, and Databases, and then quantifying the relative importance of each of the services that make up those pieces as well as describing dependency relationships between them.
XI Business Process groups contain services that are said to be “essential” or “non-essential.” A database service in our example might be considered essential, whereas the SMTP port on a single mail exchanger might be “non-essential” (because they are usually redundant, and even if they go down, the mail will queue somewhere else). When any essential service or the combination of all non-essential services goes critical, the XI business process logic registers this as a “problem.”
Each business process group contains critical and warning thresholds that depend on the number of problems that are occurring in the group. In our example, we might imagine two business process groups, one for SMTP speakers (MXs and MTAs) and one for SQL-speakers (groupware systems and DBs). If the latter group registers a single problem because a database is down, that might throw the whole group into a warning state.
Business process groups can contain other nested business process groups, and so on. Our top-level entity, corporate email, is therefore just a business process group that contains the two groups previously described. It is confi gured like the other two groups so that a single “problem” in any of the nested groups causes it to go into a warning state. Finally, notifi cation commands can be assigned on each business process group in the same way they are assigned to individual host and service events. Additionally, visualization widgets exist for the top-level groups. These can be added to any dashboard or view, and they allow the user to drill down into the groups to see what services or subgroups constitute them.
Integrated Plug-ins and Confi guration Wizards
The core installation of Nagios XI includes all the plug-ins in the standard plug-ins package, as well as NRPE, NSCA, and NRDP. In addition to all the plug-ins being preinstalled, the XI developers have provided a plethora of semiautomated confi guration wizards, which, given the bare-minimum information about a host, take care of the initial setup as well as adding and modifying services on already confi gured hosts.
Josephsen_Book 1.indb 230 3/6/13 3:18 PM
231What’s in It for Me?
If you consult the offi cial XI documentation at
http://library.nagios.com/library/products/nagiosxi/documentation,
you’ll quickly discover that the wizards are the preferred method for host and service confi guration. With names like Exchange Server, website, and Windows Workstation, they make setting up new hosts and services easy enough that these tasks can be delegated to fi rst-level support techs, or even end users. The autodiscovery wizard is capable of bootstrapping an environment given only a CIDR netblock to start with, and it does a good job of initial setup. To add NRPE-based host checks or other services after the fact, run the appropriate wizard on the preexisting host.
For example, if Server1 was created with the autodiscovery wizard, and you now want to add NRPE checks to get CPU, memory, and disk information from the host, you must fi rst install NRPE on Server1. If Server1 doesn’t already have NRPE on it, and is one of several common server types, such as a Windows 200X server, Red Hat, or Ubuntu, the XI developers have an agent package designed to work with XI specifi cally at:
http://assets.nagios.com/downloads/nagiosxi/wizards
After the agent is installed on Server1, run the NRPE Wizard on the server from the confi guration tab of the XI user interface, as shown in Figure 9.5, entering the IP or FQDN of the server, and choosing the type from the drop-down list. The wizard will then display a preconfi gured subset of available check commands relevant to your server type, and provide text-entry fi elds for you to specify custom settings or additional commands if you’d like.
As I said earlier, static confi guration fi les may still be maintained in etc/nagios/static. So it’s entirely possible to run your own scripts, or autogeneration tools like those included with check_mk, provided you confi gure them to write their confi guration to the static directory. I can’t deny that the automated confi guration features in XI have, perhaps ironically, complicated things a bit for those of us who have reason to maintain the confi guration manually. In the Nagios Core universe, there is a single way to confi gure Nagios (text fi les). However, there are three ways to confi gure Nagios Core in the XI universe (text fi les, NagiosQL, and XI Wizards), and although the three coexist well enough, it can become burdensome to ensure a uniformity of parameters if the administrators mix and match their confi guration methodologies in XI. I’ll give you an example.
Larry, his brother Darryl, and his other brother Darryl all work at Bloody Stump Lumber Mill, where they recently purchased a Nagios XI server to monitor their growing sales web-application server farm. Larry was a UNIX admin in college, so he prefers to edit the confi g fi les. Darryl likes to have fi ne-grained control over the confi g, but isn’t very good
Josephsen_Book 1.indb 231 3/6/13 3:18 PM
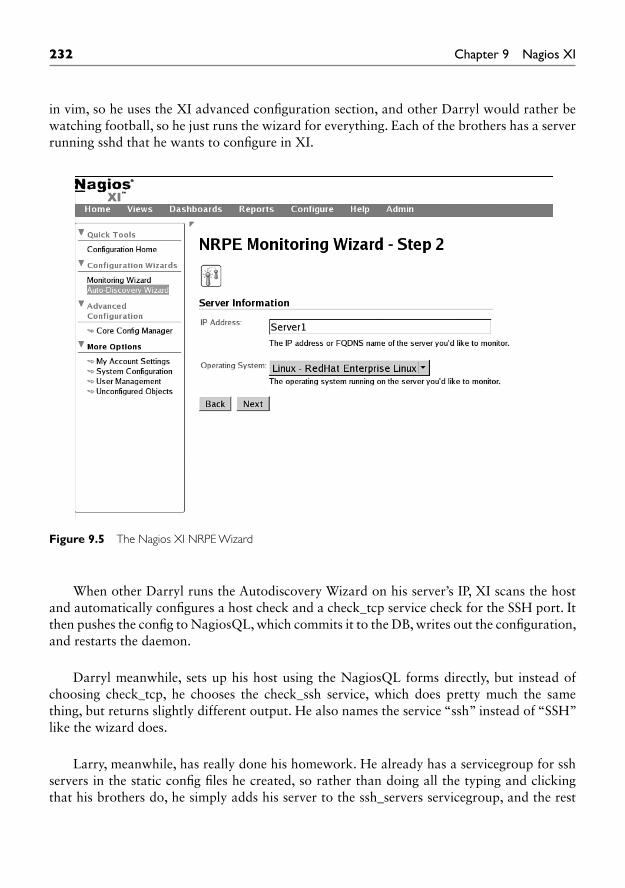
232 Chapter 9 Nagios XI
in vim, so he uses the XI advanced confi guration section, and other Darryl would rather be watching football, so he just runs the wizard for everything. Each of the brothers has a server running sshd that he wants to confi gure in XI.
Figure 9.5 The Nagios XI NRPE Wizard
When other Darryl runs the Autodiscovery Wizard on his server’s IP, XI scans the host and automatically confi gures a host check and a check_tcp service check for the SSH port. It then pushes the confi g to NagiosQL, which commits it to the DB, writes out the confi guration, and restarts the daemon.
Darryl meanwhile, sets up his host using the NagiosQL forms directly, but instead of choosing check_tcp, he chooses the check_ssh service, which does pretty much the same thing, but returns slightly different output. He also names the service “ssh” instead of “SSH” like the wizard does.
Larry, meanwhile, has really done his homework. He already has a servicegroup for ssh servers in the static confi g fi les he created, so rather than doing all the typing and clicking that his brothers do, he simply adds his server to the ssh_servers servicegroup, and the rest
Josephsen_Book 1.indb 232 3/6/13 3:18 PM
233What’s in It for Me?
takes care of itself. The problem is, his servicegroup inherits a different set of templates than NagiosQL, so although his service check uses the same name and check command as the wizard, his polling interval is different, and he has a different notifi cation target for service warnings.
In this way, the brothers end up with three different defi nitions for the same service, which might not be a problem immediately, but will cause all manner of headaches if and when they want to integrate Nagios with another tool, or generally try to do any sort of automation using their monitoring server.
I admit these sorts of disconnects are possible with text confi guration fi les, but my point is the text confi guration encourages administrators to use templates to normalize the confi guration, like Larry did in the previous example. The automated tools by comparison encourage isolating the confi guration at the host level, because it’s easier for the automated tools to parse them that way. Thus, in Larry’s confi guration, we fi nd a single services.cfg wherein every service is defi ned and assigned a hostgroup, whereas in NagiosQL’s confi guration, we fi nd a services directory with a single fi le for each host. The former makes it pretty easy to verify that all the service checks for every host are implemented in the same way. The later makes it much more diffi cult.
Further, in my experience, the disdain that people like Larry naturally feel for people like other Darryl generally discourages them from paying close attention to what people like other Darryl are doing. In fact, merely inviting other Darryl to confi gure the monitoring server with wizards might trigger a tendency in Larry to go off on his own and “do it the right way” using well-written static confi g fi les, which only exacerbates the problem by more widely diverging the confi guration paths.
Whether this will be a problem in your shop will depend on how many hands are stirring the pot and the extent to which the more clueful users are aware of the potential problem. The idea of delegating the confi gs is certainly tempting, and I’m not saying you shouldn’t. If you do, my advice would be to use either the wizards or static confi g for service and host creation, and avoid using NagiosQL directly if you can avoid it (you could still safely use it for host and service modifi cation). That way, you can carefully set up the static confi g to ensure that it references the wizard templates, or simply copy defi nitions from the NagiosQL fi les, and everything should remain pretty much uniform.
Automated Confi guration for Passive ChecksAnother very cool bit of functionality that is related to automated confi guration in Nagios XI is the Unconfi gured Objects feature. In the event that XI receives a passive check result for a host or service that it doesn’t know about, it automatically generates an inert confi guration for that host or service and places it in the Unconfi gured Objects section of the Confi gure tab.
Josephsen_Book 1.indb 233 3/6/13 3:18 PM
234 Chapter 9 Nagios XI
Administrators may then approve the inert objects, and they will become part of the running confi guration. Good stuff.
Operational Improvements
In addition to the myriad functional improvements in Nagios XI, several maintenance-related features exist that make it easier to manage the Nagios server itself.
BackupsOut of the box, XI takes a snapshot of the running confi guration each time it changes. These confi guration snapshots can be downloaded from the UI in an automated fashion using tools like curl or wget. It can be used to restore the confi guration in the event the monitoring system kicks the bucket, or it can roll it back to a prior version if someone made an inap-propriate change. A real system backup, including historical state and metric data, involves a lot more than just the confi guration fi les, however. Remember, XI maintains three databases and has untold amounts of performance data stored in RRDs, not to mention the Nagios Core state fi le and logs. For detailed instructions on properly backing up your XI install, see:
http://assets.nagios.com/downloads/nagiosxi/docs/Backing_Up_And_Restoring_XI.pdf
User ManagementAccount management is more important in XI, especially when individual users are encour-aged to change confi guration parameters and create new hosts and services. Individual users in XI also have the ability to confi gure the interface with custom views and dashboards as they see fi t. For these reasons, XI must track users in its own database rather than leaving it up to Apache to sort out like the Nagios Core UI does. Account management is well done in XI and generally behaves in a manner that enterprise users expect. Access control exists to prevent individual accounts from making modifi cations, and components exist to enable XI to use LDAP servers. Nagios has published offi cial documentation on multitenant setups, where, for example, access to a Nagios server hosted by a service provider is shared by multiple customers. This documentation resides at:
http://assets.nagios.com/downloads/nagiosxi/docs/XI_Multi-Tenancy.pdf
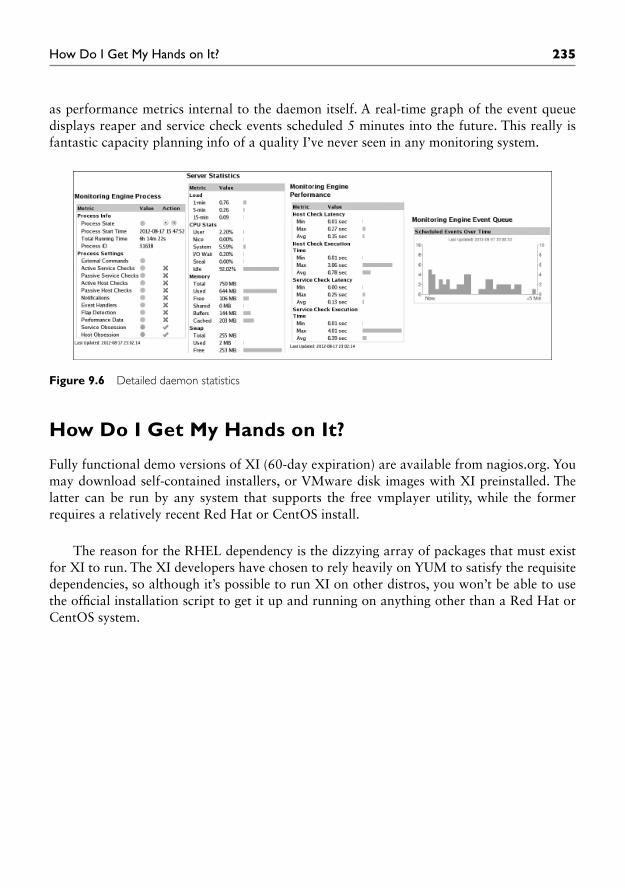
Daemon StatusAs depicted in Figure 9.6, the XI interface provides an array of detailed of information about the Core daemon process. This includes metric values for the server hardware as well
Josephsen_Book 1.indb 234 3/6/13 3:18 PM
235How Do I Get My Hands on It?
as performance metrics internal to the daemon itself. A real-time graph of the event queue displays reaper and service check events scheduled 5 minutes into the future. This really is fantastic capacity planning info of a quality I’ve never seen in any monitoring system.
Figure 9.6 Detailed daemon statistics
How Do I Get My Hands on It?
Fully functional demo versions of XI (60-day expiration) are available from nagios.org. You may download self-contained installers, or VMware disk images with XI preinstalled. The latter can be run by any system that supports the free vmplayer utility, while the former requires a relatively recent Red Hat or CentOS install.
The reason for the RHEL dependency is the dizzying array of packages that must exist for XI to run. The XI developers have chosen to rely heavily on YUM to satisfy the requisite dependencies, so although it’s possible to run XI on other distros, you won’t be able to use the offi cial installation script to get it up and running on anything other than a Red Hat or CentOS system.
Josephsen_Book 1.indb 235 3/6/13 3:18 PM

This page intentionally left blank
261
I N D E X
Symbols.1.3.6.1 prefi x, 135* (asterisk), 67{} (curly braces), 64$ (dollar signs), 96. (dot), 116
Aabnormal utilization, 169acknowledgement, notifi cation, 43action_url, 198-199active_checks_enabled, 150address directive, 75Afterglow, 218alarms, false alarms, 19Alert summary, 47Apache, confi guration, 83-85applications versus ports, watching,
20-22architecture
Event Broker, 239-241Nagios XI, 225
AREA, RRDTool, 181argument passing, command defi nitions
(check_load), 128asterisk (*), 67authorized_for_all_host_commands, 68authorized_for_all_hosts, 68
authorized_for_all_service_commands, 68
authorized_for_all_services, 68authorized_for_confi guration_
information, 68authorized_for_system_information, 68authorizied_for_system_commands, 68autodiscovery, 91-92
Check_MK, 91Nagios XI, 92
automated confi guration for passive checks, 233
AVERAGE, RRDTool, 180averageSeries, 209awk, 196
Bbackups, Nagios XI, 234bandwidth, monitoring systems, 13-14bar charts, data visualization, 210baselines, 19benefi ts of Nagios XI
advanced reporting and advanced visualization, 228-230
integrated plug-ins and confi guration wizards, 230-233
integrated time series data, 227-228interface, 226-227modularized components, 228operational improvements, 234
Josephsen_Book 1.indb 261 3/6/13 3:18 PM
262 Index
bootstrapping Nagios confi g fi les, 87business processes, Nagios XI, 230
CC
callbacks, 237-239function references, 237-239
-c, SNMP, 141callbacks, 157
C, 237-239NEB callback types, 240
carbon, 202CDEF, 185
data summarization, 184RRDTool, 181syntax, 182
cgi.cfg, 63, 67-68directives, 68
check_cluster, 116check_command directive, 76-78check_disk, 189
command defi nition, 131check_dllhost
command defi nitions, 122service defi nitions, 123
check_dllHost, 114check_host_regix.sh, 197check_http, 99-100, 104check_http service defi nition, 98-100check_load
command defi nitions with argument passing, 128
service defi nitions, 129
Check_MK, 13, 91, 131-134Check_NT, 123-124check_nt_cpuload, 124check_ping, 96, 189check_ping service defi nition, 97check_snmp, command defi nitions, 141check_ssl service defi nition, 104check_swap, command defi nitions, 130check_tcp, 98-99check_tcp command defi nition, 99check_tcp wrappers, 101child instance, ping service
defi nitions, 152child/parent relationships, 27CIM (Common Information Model), 114Cisco routers, enabling SNMP, 138COM, 113command, 62command defi nition, check_ping, 96command defi nitions, 68
check_disk, 131check_dllhost, 122check_load with argument passing,
128check_nt_cpuload, 124check_snmp, 141check_swap, 130check_tcp, 99WebInject, 108
command_line, 72command_name, 72command objects, 72commands, 71-73
Josephsen_Book 1.indb 262 3/6/13 3:18 PM
263Index
compile-time options, 55complex service checks, local queries,
102-104confi guration wizards, Nagios XI,
230-233confi guring Nagios, 54-55confi g.xml, WebInject, 106consolidation functions, RRDTool, 177contact, 62contactgroup, 62contact_groups, 78contactgroups, 74-75contact objects, 73contacts, 73-74COUNTER, 171-172CPU, UNIX, 126-129Cscript, 113Cucumber-Nagios, 108-111
installing, 110cut, 196
Ddaemon, OS support, 51daemon status, Nagios XI, 234daemon, 51dashboards, 209
creating, 210-212distributed. See distributed dashboardsforce direct graphs with jsvis, 220-221GD graphics library, 214-215GraphViz, 217-218NagVis, 215-216RRDTool fetch mode, 212-214sparklines, 218-220
data, sendingwith Event Broker, 249from Nagios to Ganglia, 194-197
data polling glitches, heartbeat, 173data sources (DS), 171data summarization, CDEF, 184data visualization, 167, 185
dashboardscreating, 210-212
force directed graphs with jsvis, 220-221
GD graphics library, 214-215
GraphViz, 217-218
NagVis, 215-216
RRDTool fetch mode, 212-214
sparklines, 218-220
Massive Ginormic, 200-209Nagios XI, 228-230singularity.gov, 192-193
displaying graphs from Ganglia in Nagios UI, 198-200
Ganglia, 193-194
monitoring Ganglia metrics using Nagios, 197-198
sending data from Nagios to Ganglia, 194-197
Suitcorp, 185-187drraw, 190-192
NG (NagiosGraph), 187-190
DEF, RRDTool, 180default_user_name, 68defi nitions, 64defi nition skeleton, services template, 89
Josephsen_Book 1.indb 263 3/6/13 3:18 PM
264 Index
dependencies, 81-83monitoring systems, 14-16
dependent_host_name, 82DERIVE, 172directives
address, 75cgi.cfg, 68check_command, 76-78event_handler, 76fi rst_notifi cation, 81hostgroup, 79host_name, 77_interval type, 78last_notifi cation, 81parents, 76service_description, 77servicegroup_members, 80
disk, UNIX, 130-131displaying graphs from Ganglia in
Nagios UI, 198-200distributed architecture with passive
checks, 151distributed dashboards, 159-165
Fusion, 160-161Livestatus. See LivestatusMNTOS (Multi Nagios Tactical Over-
view System), 160-161distributed passive checks with second-
ary Nagios daemons, 150-153distributing loads, scheduling, 36-38DNX (Distributed Nagios Executor),
154-155, 255-258dnxPluginInit(), 257dollar signs ($), 96
dot (.), 116downtime
scheduled downtime, 42scheduling (Nagios XI), 228
drraw, 190-192DS (data sources), 171ds struct, 251-252
E-e, 99E2E (End to End), 20E2E monitoring, 104
Cucumber-Nagios, 108-111WebInject, 105-108
ehProcessData, 256ehSvcCheck function, 258EMU, 143End to End (E2E), 20environmental sensors, 142-143escalations, 80-81
notifi cation, 42Event Broker, 237
architecture, 239-241DNX, 255-258implementing fi le system interfaces,
242-255I/O interfaces, 49-50
event broker modules, 153DNX (Distributed Nagios Executor),
154-155Mod Gearman, 154-157Op5 Merlin, 154, 157-159
event_handler directive, 76
Josephsen_Book 1.indb 264 3/6/13 3:18 PM
265Index
event scheduling, 35execution_failure_criteria, 82Exit Codes, 28-32extended information, 83external command fi le, I/O interfaces, 48
Ffalse alarms, 19fetch mode, RRDTool, 212-214FHS (File System Hierarchy
Standard), 52fi le locations, 52File System Hierarchy Standard
(FHS), 52fi lesystem interfaces, implementing
(Event Broker), 242-255fi lter headers, LQL, 165fi rst_notifi cation directive, 81force directed graphs with jsvis, 220-221fPointer, 239function pointers, 237-239function references, C, 237-239functions, Massive Ginormic, 208Fusion, 160-161
GGalstad, Ethan, 223Ganglia, 193-194
displaying graphs in Nagios UI, 198-200
monitoring using Nagios, 197-198sending data from Nagios to, 194-197
ganglia_service_name, 199GAUGE, 171-172
GD graphics library, 214-215GET columns, 163GET hosts, 163global enablers, nagios.cfg, 65global notifi cation settings, 39-40global timeouts, nagios.cfg, 66gmetric, 194Gmond.conf, 194Graphite, 202-204graph mode, RRDTool, 180-182graph.php, 198graphs
forced directed graphs, jsvis, 220-221from Ganglia displaying in Nagios UI,
198-200GraphViz, 217-218
H
-H switch, 96headers, LQL, 163
OR headers, 166stats headers, 166
heartbeat, RRDTool, 172-173host and service paradigm, 24
downside of, 27-28hosts and services, 26interdependence, 26-27starting from scratch, 24-25
host defi nition skeletons, 88hostdependency, 63hostescalation, 63hostextendedinfor, 63hostgroup, 63, 79
Josephsen_Book 1.indb 265 3/6/13 3:18 PM
266 Index
hostgroups, 79host_name, 82host_name directive, 77hosts, 26, 62, 75-77
downside of, 27-28host templates, 69host template skeletons, 88
Ii2c, 142ICMP Echo requests, 3implementing fi lesystem interfaces (Event
Broker), 242-255include statements, 245installing
Cucumber-Nagios, 110Nagios, 54
confi guring, 54-55
make install, 56-57
make targets, 55-56
steps for, 53-54
NRPE, 59-60plug-ins, 57-58
integrated plug-ins, Nagios XI, 230-233integrated time series data, Nagios XI,
227-228Intelligent Platform Management Inter-
face (IPMI), 145-146interdependence, host and service
paradigm, 26-27interesting events, 20interfaces
I/O interfacesEvent Broker, 49-50
external command fi le, 48
monitoring, 45-46
overview, 43
performance data, 48-49
reporting, 46-47
web interfaces, 43-44
Nagios XI, 226-227internal RRDTool metric averaging, 214_interval type directives, 78intervals, scheduling, 34-36I/O interfaces
Event Broker, 49-50external command fi le, 48monitoring, 45-46overview, 43performance data, 48-49reporting, 46-47web interfaces, 43-44
IPMI (Intelligent Platform Management Interface), 145-146
J
jsvis, force directed graphs, 220-221
K
Kettner, Mathias, 131, 161Klein, Dan, 143
L
last_notifi cation directive, 81LINE, RRDTool, 181Linux, installing daemon, 59
Josephsen_Book 1.indb 266 3/6/13 3:18 PM
267Index
listingsApache Sample VirtualHost Confi g,
84Broker5s smake_callbackm code for
SERVICE_STATUS_DATA, 251CDEFs for Data Summarization, 184CDEF Syntax, 182A check_cluster Plug-in in
Perl/WMI, 116Check_disk Command Defi nition, 131A check_disk Defi nition for NG, 189Check_dllHost, 114Check_dllhost Command
Defi nition, 122Check_dllhost Service Defi nition, 123Check_http service Defi nition, 98Check_load Command Defi nition
with Argument Passing, 128The check_load Service Defi nition,
129Check_nt_cpuload Command
Defi nition, 124Check_nt_cpuload Service
Defi nition, 124Check_ping Command Defi nition, 96Check_ping Service defi nition, 97The Check_snmp Command
Defi nition, 141The check_ssl Service Defi nition, 104Check_swap Command Defi nition,
130A check_tcp Wrappper, 101Command Example, 71A Command to Perform an SMTP
Handshake, 103
The confi g.xml for WebInject, 106Contact Example, 73-74Creating a Multicounter RRD, 178Creating a Single-Counter RRD, 175A Cucumber Feature File, 109dnxPluginInit() Function, 257Enabling SNMP on Cisco Routers,
138The Event Broker Sending Data, 249Fully MIBd snmpwalk Output, 140The Generic check_tcp Defi nition, 98The Host Defi nition Skeleton, 88A Host Template and Consumer
Defi nition, 69Hostdependency Example, 81Hostescalation Example, 80Host Example, 75Hostextendedinfo Example, 83Hostgroup Example, 79A Host Template Skeleton, 88Includes, 245The init Function, 246Installing Nagios for the Impatient
Person, 54Internal RRDTool Metric Averaging,
214A List of Boxes, 120A List of Hosts, 89A Merlin Load-Balanced Peer
Confi guration, 159Modifying RRAs in Nagios Graph,
188My qls Script, an Interactive Shell for
MK-Livestatus, 163
Josephsen_Book 1.indb 267 3/6/13 3:18 PM
268 Index
The nebmodule struct, 247An NEB Module That Implements a
Filesystem Interface, 242The nebstruct_service_status_data
struct, 252NGns check_ping Defi nition, 189A Notifi cation Command
Defi nition, 74OCSP Confi guration in the nagios.cfg
on the Child, 152Our Event Handler Function, 250Output from sconfi gurec, 57Output from Plug-ins Oconfi gurec, 58Output from the rrdtool Fetch
Command, 212Output from the Sensors Program,
144A Performance Data Wrapper for All
Plug-ins, 49A Ping Plug-in, 30Ping Service Defi nition for the Child
(Poller) Instance, 152Ping Service Defi nition for the Parent
Instance, 151Ping with Summary Output, 30The process-service-perfdata Com-
mand for Use with NG, 188Protocol_Specifi c check_tcp Com-
mand Defi nition, 99A Realistic Nagios Installation, 56A Remote Load Average Checker, 31A Remote Load Average Checker with
Exit Codes, 32A Sample Host Defi nition, 64A Script That Calls load-checker and
Parrots Its Output and Exit Code, 33
Servicedependency Example, 82Service Example, 77Servicegroup Example, 79Servicescalation Example, 80A Services Defi nition Skeleton, 90A Services Template for Use with a
Defi nition Skeleton, 89The service_struct Def from
nagios.h, 252A Shell Script to Create a hosts.cfg
from the Skeletons and Host List, 89A Shell Script to Parse the Output
from the fetch Command, 213Shiny New check_http Service
Defi nition, 100A Solution for Ted, 104Some Required Tidbits, 245Specifying Object Confi g Files by
Directory, 65Specifying Object Confi g Files
Individually, 65Step Defi nition Example, 109The submit_service_check.sh Shell
Script on the Child, 153The submit_service_check_to_parent
Defi nition on the Child, 153The Test Case File for WebInject, 106Timeperiod Example, 70Unrecognizable SNMP
Gobbledygook, 138Using a Function Pointer, 238Verbose Output from WebInject, 107A WebInject Command Defi nition,
108A WebInject Service Defi nition, 108
Josephsen_Book 1.indb 268 3/6/13 3:18 PM
269Index
Livestatus, 161-163, 166fi lter headers, 165tables, 162
Livestatus Query Language (LQL), 162lm78 sensor chip, 142lm-sensors, 144-145local installs, fi le locations, 52local processing versus remote
processing, 12-13local queries, 95
complex service checks, 102-104pings, 96-98port queries, 98-100querying multiple ports, 100-102
LQL (Livestatus Query Language), 162headers, 163OR headers, 166stats headers, 166
Mmacros, 73make cgis, 56make contrib, 56make install, 56-57make install-command mode, 65make install-confi g, 64make modules, 56make nagios, 56make targets, 55-56Mass Acknowledgement
Component, 228Massive Ginormic, 200-209
max, RRDTool, 174max_check_attempts, 78max check attempts option, 35memory, UNIX, 129-130MIBs, SNMP, 140Microsoft Visual Basic, script
Edition, 112Microsoft Windows, installing NRPE, 60min, RRDTool, 174Minemap, Nagios XI, 227minimizing overhead, 14MK-Livestatus, 163MK-Multisite, 161MMCs (Microsoft Management
Consoles), 113MNTOS (Multi Nagios Tactical Over-
view System), 160-161Mod Gearman, 154
event broker modules, 156-157modularized components, Nagios
XI, 228monitoring
Ganglia metrics, using Nagios, 197-198
I/O interfaces, 45-46monitoring systems, 1-2
bandwidth considerations, 13-14dependencies, 14-16network locations, 14-16procedural approach to, 9-12processing, remote versus local, 12-13silence, 19-20
MRTG, 170multicounter RRD, 178
Josephsen_Book 1.indb 269 3/6/13 3:18 PM
270 Index
Multi Nagios Tactical Overview System (MNTOS), 160-161
Multisite, 166MX outages, 28
NNagios, 2-4
installing, 54confi guring, 54-55
make install, 56-57
make targets, 55-56
steps for, 53-54
nagios.cfg, 62-65global enablers, 65global timeouts, 66
nagios.cfg fi le, 62Nagios Core, XI, 231NagiosGraph, 187-190NagiosQL, 92-94, 225Nagios Remote Plugin Executor.
See NRPENagios UI, displaying Ganglia graphs,
198-200Nagios XI, 92, 160, 223-224
architecture, 225benefi ts of
enhanced reporting and advanced visualization, 228-230
integrated plug-ins and confi guration wizards, 230-233
integrated time series data, 227-228
interface, 226-227
modularized components, 228
operational improvements, 234
business processes, 230getting access to, 235how it works, 224-226Minemap, 227
NagVis, 215-216, 229name-space collisions, preventing, 73NANs, 201Navigation bar, 44NDOUtils, tuning, 150NEB_API_VERSION, 245NEBCALLBACK_PROCESS_DATA, 256NEB call back types, 240NEB module, 161neb_register_callback, 248, 256nebstruct_service_status_data struct, 252.NET, 119Network Interface Card (NIC), 18network locations, monitoring systems,
14-16network segments, security, 18NG, 189NIC (Network Interface Card), 18normal_check_interval, 78notifi cation, 39
acknowledgement, 43escalation, 42global, 39-40scheduled downtime, 42templates, 41time periods, 41-42
notifi cation_commands, 74notifi cation_failure_criteria, 82
Josephsen_Book 1.indb 270 3/6/13 3:18 PM
271Index
notifi cation_interval, 77-78, 81notifi cation options, 40-41notifi cation_options, 74, 78notifi cation_period, 78notifi cations, service notifi cations, 78NRDP, tuning, 150NRPE (Nagios Remote Plugin Executor),
33, 59, 122-123installing, 59-60UNIX, 125
NRPE-NT, 122-123NRPE Wizard, 231NSC++, 124NSCA, tuning, 150NSClient++, 60, 124-125NSCP, 124-125
Oobject confi guration fi les, 62object defi nitions, 68object defi nition skeletons, 88objects, 62-63
summary of, 62object template skeletons, 88OCSP (Obsessive Compulsive Service
Processor), 152Oetiker, Tobias, 170OIDs, SNMP, 136, 139-141OLE, 113OLE CPAN, 118-On switch, SNMP, 139Op5 Merlin, 154, 157-159
OR headers, LQL, 166OS support, 51overhead, minimizing, 14
Pparallel executing, scheduling, 38-39parent instances, ping service
defi nitions, 151parents directive, 76passive checks
automated confi guration, 233distributed passive checks, 150-153
passive_checks_enabled, 150PDPs (primary data points), 174performance data, 168I/O interfaces, 48-49Perl, 111pie charts, data visualization, 210ping, 3
local queries, 96-98service defi nitions
child instance, 152
parent instances, 151
summary output, 30PluginInit function, 257plug-ins
check_host_regex.sh, 197check_http, 104Check_MK, 131-134check_ping, 189check_swap, 130Exit Codes, 28-31
Josephsen_Book 1.indb 271 3/6/13 3:18 PM
272 Index
installing, 57-58integrated plug-ins, Nagios XI,
230-233redundant plug-ins, 13Remote Execution, 31-34
PNP4Nagios, 187-190port queries, 98-100ports
versus applications, watching, 20-21querying multiple, 100-102
PowerShell, 120PowerShell cmdlets, 121preventing name-space collisions, 73primary data points (PDPs), 174problems, defi ning, 11procedural approach to monitoring
systems, 9-12processing monitoring systems, remote
versus local, 12-13process-service-perfdata, 188Python, 111
Q
queries, local queries, 95complex service checks, 102-104pings, 96-98port queries, 98-100querying multiple ports, 100-102
querying multiple ports, 100-102
Rreapers, scheduling, 38-39redundant plug-ins, 13
relationships, child/parent relationships, 27
remote execution, NRPE, 59Remote Execution, 31-34remote processing versus local
processing, 12-13reporting
I/O interfaces, 46-47Nagios XI, 228-230
resource_fi le, 72resources.cfg, 72retry_check_interval, 78Round Robin Archive (RRA), 174-175RPN, RRDTool, 182-185RRA (Round Robin Archive), 174-175RRD data types, 171-172RRDs, 171
multicounter, 178RRDTool, 149, 168-171
AREA, 181AVERAGE, 180CDEF, 181consolidation functions, 177create syntax, 175-179DEF, 180fetch mode, 212-214graph mode, 180-182heartbeat, 172-173history of, 171LINE, 181max, 174min, 174RPN, 182-185
Josephsen_Book 1.indb 272 3/6/13 3:18 PM
273Index
RRA (Round Robin Archive), 174-175
RRD data types, 171-172step, 172-173
RRDTool wrappers, 187Ruby, 110
S-s, 99scheduled downtime, notifi cations, 42scheduling, 34
check intervals and states, 34-36distributing loads, 36-38downtime, Nagios XI, 228events, 35parallel execution, 38-39reapers, 38-39
Scholz, Kyle, 221scripting templates, 87-90secondary Nagios daemons, distributed
passive checks, 150-153secondAxis, 209security, 16-19
network segments, 18sending data
Event Broker, 249from Nagios to Ganglia, 194-197
sensorsenvironmental sensors, 142-143lm-sensors, 144-145standalone sensors, 143
service, 63
SERVICE_CHECK_DATA, 258service checks, complex service checks,
102-104service defi nitions, 68
check_dllhost, 123check_http, 98-100check_load, 129check_nt_cpuload, 124check_ping, 97check_ssl, 104ping
child instance, 152
parent instances, 151
WebInject, 108servicedependency, 63service_description directive, 77serviceescalation, 63serviceextendedinfo, 63servicegroup, 63servicegroup_members directive, 80servicegroups, 79-80service notifi cations, 78service objects, 77-78SERVICEOUTPUT, 195service_perfdata_command, 194services, 26, 77-78
downside of, 27-28services defi nition skeleton, 90SERVICE_STATUS_DATA, 251services template, defi nition skeleton, 89shell wrappers, 100silence, monitoring systems, 19-20Simple Network Protocol. See SNMP
Josephsen_Book 1.indb 273 3/6/13 3:18 PM
274 Index
singularity.gov, 192-193displaying graphs from Ganglia in
Nagios UI, 198-200Ganglia, 193-194monitoring Ganglia metrics using
Nagios, 197-198sending data from Nagios to Ganglia,
194-197skeleton confi g fi les, scripting templates,
87-90SMTP handshakes, 103SNMP (Simple Network Management
Protocol), 17, 135-138-c, 141enabling on Cisco routers, 138MIBs, 140OIDs, 139-141-On switch, 139-v switch, 138
SNMP agents, 137SNMP Version 1, 136SNMP Version 2, 136SNMP Version 3, 137Solaris, vmstat, 130sparklines, 218-220SSH authentication, 33standalone sensors, 143states, scheduling, 34-36stats headers, LQL, 166step, RRDTool, 172-173struct, 254submit_service_check_to_parent com-
mand, 152
Suitcorp, data visualization, 185-187draw, 190-192NG (NagiosGraph), 187-190
summarize, 206syntax
CDEF, 182RRDTool, 175-179
Ttables, Livestatus, 162templates, 69-70
notifi cations, 41scripting, 87-90
test case fi les, WebInject, 106Thermd, 143threshold, 207TIMED_EVENT_DATA, 258timeperiod, 62timeperiods, 70-71
notifi cation, 41-42Tufte, Edward, 210, 218tuning, 149
NDOUtils, 150NRDP, 150NSCA, 150
tuning documentation, 149
UUNIX, 125
CPU, 126-129disk, 130-131memory, 129-130NRPE, 125
Josephsen_Book 1.indb 274 3/6/13 3:18 PM
275Index
use_authentication, 68use directives, 69user management, Nagios XI, 234user registrations, 208
V-v switch, SNMP, 138VBScript, 112
choosing to use, 119verbose output, WebInject, 107vmstat (Solaris), 130
W-Zwatching ports versus watching
applications, 20-21watching the watchers, 21-22web GUI, 43WebInject, 105-108
command defi nition, 108confi g.xml, 106service defi nitions, 108test case fi les, 106verbose output, 107
web interfaces, 43-44Websensor EM01B, 143Whisper, 201Windows, 111
Check_NT, 123-124COM, 113future of Windows scripting, 119-121NRPE-NT, 122-123NSCLient++, 124-125
OLE, 113VBScript, choosing to use, 119Windows Scripting Environment,
111-113WMI (Windows Management Instru-
mentation), 113-117WSH, choosing to use, 118
Windows Management Instrumentation (WMI), 113-117
Windows Script Host (WSH), 111Windows scripting, future of, 119-121Windows Scripting Environment,
111-113wizards
confi guration wizards, Nagios XI, 230-233
NRPE Wizard, 231WMI (Windows Management
Instrumentation), 113-117wrappers, RRDTool, 187Wscript, 112WSH (Windows Script Host), 111-112
choosing to use, 118
Josephsen_Book 1.indb 275 3/6/13 3:18 PM