na tional s t a tis t ics - canwest dhi western statistics.pdf · production laitiÈre (kg) ......
TRANSCRIPT
H E R D I M P R O V E M E N T R E P O R T 1 3
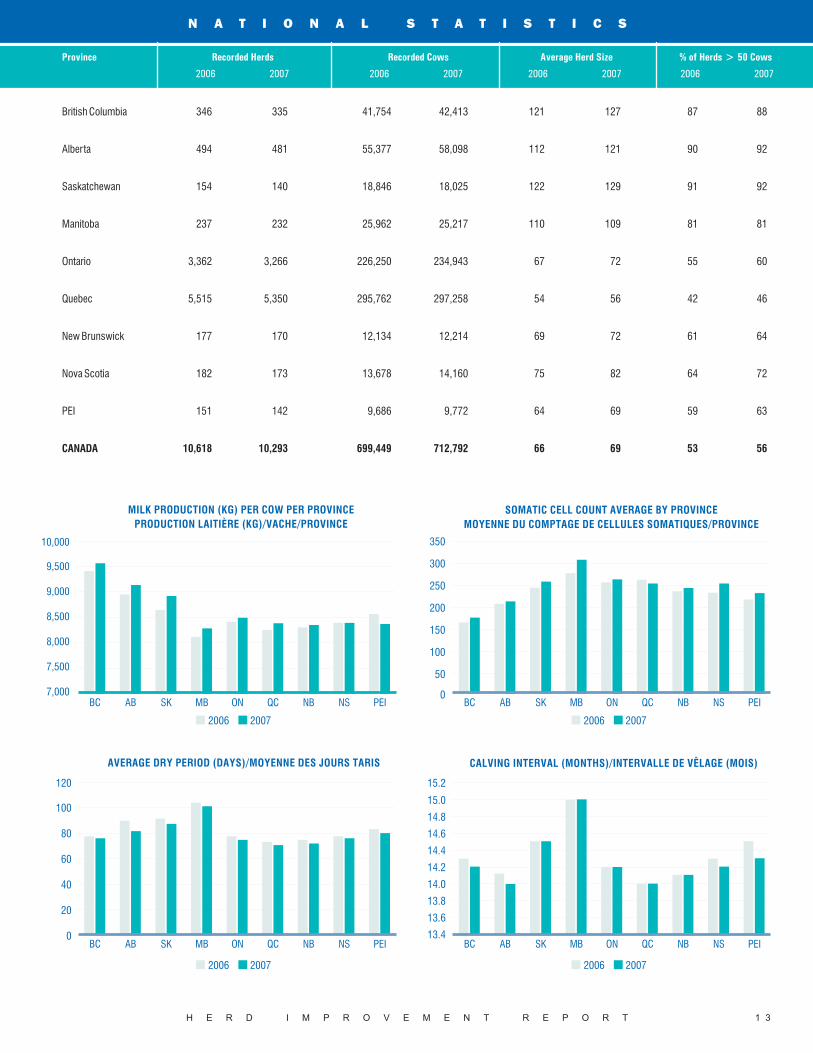
N A T I O N A L S T A T I S T I C S
Province Average Herd Size % of Herds > 50 CowsRecorded Herds Recorded Cows
British Columbia 346 335 41,754 42,413 121 127 87 88
Alberta 494 481 55,377 58,098 112 121 90 92
Saskatchewan 154 140 18,846 18,025 122 129 91 92
Manitoba 237 232 25,962 25,217 110 109 81 81
Ontario 3,362 3,266 226,250 234,943 67 72 55 60
Quebec 5,515 5,350 295,762 297,258 54 56 42 46
New Brunswick 177 170 12,134 12,214 69 72 61 64
Nova Scotia 182 173 13,678 14,160 75 82 64 72
PEI 151 142 9,686 9,772 64 69 59 63
CANADA 10,618 10,293 699,449 712,792 66 69 53 56
2006 2007 2006 2007 2006 2007 2006 2007
120
10,000
15.2
350
300
250
200
150
100
50
0
15.0
14.8
14.6
14.4
14.2
14.0
13.8
13.6
13.4
100
9,500
80
9,000
60
8,500
40
8,000
20
7,500
0
7,000
2006 2007
2006 2007
2006 2007
2006 2007
BC
BC
BC
BC
AB
AB
AB
AB
SK
SK
SK
SK
MB
MB
MB
MB
ON
ON
ON
ON
QC
QC
QC
QC
NB
NB
NB
NB
NS
NS
NS
NS
PEI
PEI
PEI
PEI
MILK PRODUCTION (KG) PER COW PER PROVINCEPRODUCTION LAITIÈRE (KG)/VACHE/PROVINCE
SOMATIC CELL COUNT AVERAGE BY PROVINCEMOYENNE DU COMPTAGE DE CELLULES SOMATIQUES/PROVINCE
AVERAGE DRY PERIOD (DAYS)/MOYENNE DES JOURS TARIS CALVING INTERVAL (MONTHS)/INTERVALLE DE VÊLAGE (MOIS)

RegionNumber
of Herds305 M 305 F 305 P BCA M
Composite
BCABCA F BCA P
Composite BCA
2006 2005
R E G I O N A L S T A T I S T I C S
E N R O L L M E N T
P R O D U C T I O N
P R O D U C T I O N T R E N D S
BRITISH COLUMBIA
ALBERTA
SASKATCHEWAN
MANITOBA
AGASSIZ 20 10,026 364 316 217.1 220 214 218 212.6 210.9
CENTRAL B.C. 9 9,282 343 295 203.3 203 203 203 200.6 199.6
CHILLIWACK 64 10,232 374 323 223.8 227 221 224 219.3 219.6
COURTENAY-COMOX 13 9,061 344 291 204.9 204 206 205 199.8 207.6
COWICHAN 30 9,867 373 315 219.4 218 221 219 210.6 214.5
DELTA-RICHMOND 15 10,042 362 321 217.0 219 212 220 214.8 213.8
DEWDNEY-DEROCHE 28 9,838 366 317 223.6 227 218 226 220.9 220.3
KAMLOOPS-OKANAGAN 64 9,893 360 316 216.7 218 213 219 214.4 212.3
KOOTENAY 6 10,344 369 323 217.8 222 214 218 214.1 214.6
MATSQUI 22 10,095 358 319 218.2 223 211 221 220.3 218.9
PITT MEADOWS-MAPLE RIDGE 9 9,557 356 306 220.9 229 211 222 218.9 219.0
SUMAS 38 9,950 360 315 218.0 221 214 219 213.3 212.7
SURREY-LANGLEY 32 10,217 368 326 228.7 234 220 232 223.8 226.0
CALGARY 65 9,539 344 303 209.1 212 204 211 205.4 204.5
EDMONTON 126 9,224 333 292 199.8 203 196 201 195.1 194.5
LETHBRIDGE / BROOKS 119 9,955 359 314 216.8 220 213 218 210.1 208.7
PEACE RIVER 4 8,925 324 289 199.5 200 196 203 190.7 196.4
RED DEER 172 9,804 351 309 212.7 216 208 214 206.8 205.7
VERMILION 16 8,467 316 271 194.5 198 190 196 190.3 187.5
CANORA 9 8,411 295 271 175.4 178 168 180 174.8 172.1
PRINCE ALBERT/MELFORT 12 9,247 322 298 197.6 201 188 204 192.7 191.4
REGINA 18 10,132 352 324 214.6 219 205 220 209.7 201.1
SASKATOON 16 9,144 336 296 204.3 206 199 208 198.4 205.7
SASKATOON EAST 45 9,528 343 304 207.7 210 202 210 206.5 206.0
SASKATOON WEST 16 9,497 343 303 208.7 210 205 211 206.1 207.3
SWIFT CURRENT 21 9,487 350 306 208.7 208 207 211 199.5 202.7
WEYBURN 18 9,416 351 303 202.0 201 202 204 196.7 198.4
CENTRAL 69 9,331 336 299 201.6 204 196 205 199.9 201.2
EASTERN 106 9,015 329 289 195.3 197 192 197 188.1 191.9
INTERLAKE 41 9,353 346 300 201.4 202 199 203 195.3 194.6
Milk (kg)Milk (kg)Milk (kg)Milk (kg) Fat (kg)Fat (kg)Fat (kg)Fat (kg) Protein (kg)Protein (kg)Protein (kg)Protein (kg)
British Columbia
British Columbia
YearAlberta
Alberta
Saskatchewan
SaskatchewanAll Western Provinces
20062007 2005 2004
Manitoba
Manitoba
DHI HERDS 351 505 157 241 1,254 1,301 1,355 1,419
PERCENT PUBLISHABLE 85% 56% 66% 75% 69% 68% 66% 66%
PERCENT MANAGEMENT 15% 44% 34% 25% 31% 32% 34% 34%
DHI COWS 43,123 57,629 19,432 25,312 145,496 146,873 149,930 148,160
PERCENT PUBLISHABLE 84% 61% 69% 79% 72% 71% 69% 69%
PERCENT MANAGEMENT 16% 39% 31% 21% 28% 29% 31% 31%
AVERAGE HERD SIZE 123 114 124 105 116 113 111 104
2007 9,961 364 317 9,605 346 304 9,432 340 303 9,113 333 292
2006 9,823 356 310 9,406 337 296 9,294 337 297 8,835 318 283
2005 9,928 354 312 9,353 334 295 9,297 336 298 8,974 325 288
2004 10,077 350 316 9,518 333 300 9,379 335 302 9,148 325 295
1 4

Rank & Farm Name Herd Owner City Total Score Herd Size Breed Region
B R I T I S H C O L U M B I A H E R D M A N A G E M E N T S C O R E
P R O D U C E R P R O F I L E
Nelson Dinn not only faces the normal challenges of managing a
herd of 230 milking cows, but also following management protocols
for dozens of research projects underway at the University of British
Columbia's Dairy Education Research Centre at Agassiz.
As an example, there was a trial last year to compare four different
estrous synchronization systems, and they obviously are not all the
best and that impacts the herd management score for reproductive
performance. Despite these challenges, he still managed to bring
the herd in at third for the province for Herd Management Score.
In addition to the many students from UBC who have been educated
through research training and presentations, visiting students and
researchers have come from 25 countries during the last decade to
take advantage of Canada's largest and most up-to-date facility. It's one of the few in the world that can gather individual data on
feed and water intake for a herd that's in free-stall housing.
Dinn is delighted with the service that CanWest DHI provides. Data collection and analysis is integrated among the Boumatic
milking system, Dairy Comp 305 and DHI. The DHI lab also runs the additional milk component tests the researchers require to
complement the usual data set provided to commercial dairymen.
“I pay close attention to somatic cell counts,” Dinn says of his personal use of the DHI data.
Animal welfare is one of the key areas of research, so there are always lots of cow comfort trials underway. Lameness is one of
the themes right now.
“There is the potential to have 31 different milking groups” in the herd, Dinn said, so keeping track of everything is a major
challenge, and DHI is a big help in meeting those challenges. “Milk production is useful in almost every research project.”
University of British Columbia, Dairy Education and Research Centre, Agassiz, BC
1 MARTIN & MARY ZWARTBOL CHILLIWACK 952 72 HO CHILLIWACK
2 MILKY WAY DAIRY FRANK & DEBBIE LES CHILLIWACK 942 63 HO CHILLIWACK
3 UBC DAIRY EDUCATION & RESOURCE CENTRE NELSON DINN AGASSIZ 922 280 HO AGASSIZ
4 VAN JAARSVELD HOLDINGS LTD RON & SUSAN VAN JAARSVELD DUNCAN 921 80 HO COWICHAN
5 E. P. FARMS LTD J EDGE PARTINGTON CRESTON 914 74 HO KOOTENAY
6 COUNTRY CHARM FARMS LTD HUIZING BROTHERS MATSQUI 893 214 HO MATSQUI
7 MARLENA FARMS LTD MARTIN VERMEER DEWDNEY 890 176 HO DEWDNEY-DEROCHE
8 MEADOW GOLD FARMS ERNEST & SIG BIRKHOLZ CHILLIWACK 883 183 HO CHILLIWACK
9 FRUEH FARM LTD STEVE FRUEH DUNCAN 878 91 HO COWICHAN
10 PENDRAY FARMS LTD LINDA PENDRAY NORTH SAANICH 870 275 HO COWICHAN
11 JOHN HYLKEMA CHILLIWACK 864 138 HO CHILLIWACK
12 ALPINA DAIRY FARM LTD R & T RUSSENBERGER ABBOTSFORD 860 127 HO SUMAS
13 VALEDOORN FARMS INC TOM & JOHN HOOGENDORN AGASSIZ 855 197 HO AGASSIZ
14 JASON & JENNIFER PRETTY GRINDROD 853 52 HO KAMLOOPS-OKANAGAN
15 MALABAR FARM NORMAN VANDER WYK DEWDNEY 849 119 HO DEWDNEY-DEROCHE
16 ROBERT DALE MISSION 844 94 JE DEWDNEY-DEROCHE
17 WIKKSVIEW FARM LTD FRED WIKKERINK COBBLE HILL 844 69 HO COWICHAN
18 HARDENBERG & SONS CHRIS VONHARDENBERG DEWDNEY 839 165 HO DEWDNEY-DEROCHE
19 WILLIAM WIKKERINK FARMS J WIKKERINK COBBLE HILL 833 146 HO COWICHAN
20 MARTIANN HOLSTEINS LTD MARTIN HAMMING DELTA 827 215 HO DELTA-RICHMOND
H E R D I M P R O V E M E N T R E P O R T1 6
He finds the 305-day milking reports useful in arranging
groups of similar cows.
He has high regard for the staff of six farm workers. He also
appreciates the generosity of B.C. dairy farmers and local
companies in providing money and contributions in kind.
The research centre, which is a joint venture between the
University of British Columbia and the federal agriculture
department, can then use this base support to seek
matching funds from governments and others.
Dinn offers special personal thanks to Westgen which not
only provides research funding, but also “helps me in my
breeding program to improve the genetics of the herd all the
time.”
Dinn is building on a long tradition of excellence because
some of the herd traces its pedigrees to the federal
agriculture research herd at Agassiz which, during the late
1960s, ranked among the best in the country. Today, the
cows may not have kept up with Canada's best, but the
herd management surely has.

P R O D U C E R P R O F I L E
Hulleman Farms, Lacombe, AB
A L B E R T A H E R D M A N A G E M E N T S C O R E
Martijn Hulleman immigrated from the Netherlands five
years ago, worked two years as a hired hand and then
bought a 280-acre farm east of Lacombe, built a new barn
and bought two herds to start farming on his own.
Despite the challenges of introducing the cattle to each
other and a new barn with hard concrete floors, he has
managed to bring them up to good production and has
achieved one of the best reproduction records in the area.
In fact, things have improved so much that Hulleman Farms
ranks second in Alberta for overall Herd Management
Score.
“It's always hard when you're starting out like that,” he says.
“That's going to cost you in production and reproduction.
But the last two years, things have been getting better.”
Martijn makes full use of DHI services. The first data he
checks is the Somatic Cell Count scores, then reproductive
performance. His veterinarian and nutritionist have full
access to delve into his DHI records “whenever they want”
and whenever they come to the farm, they're fully prepared
to address any issues either they or Martijn have spotted.
Martijn is also using DHI for MUN analyses and has had the
herd checked for Johne's.
He's milking about 60 Holsteins, working with minimal part-
time help from milkers three afternoons per week. His
brother, Ronald, is potato farming nearby and “we help each
other out during the busy times.” Martijn might gain some
help when he marries his fiancée, a florist in Lacombe, “but
maybe it's me who will be helping her,” he joked.
He feeds a ration that's a third each corn silage, barley silage
and haylage, plus some hay, rolled barley and supplement.
His secret to high reproductive performance is
synchronizing heats and doing all of his own artificial
insemination. “By using the Presynch program, I get my
cows bred within 60 days of calving and we preg-check
them every two weeks. That's especially important because
my home is not located on the dairy itself and it creates
flexibility during potato season,” he said.
“I was surprised to be second in Alberta,” says Martijn,
“especially since I'm just starting out.”
1 KOOY DAIRY DELBERT KOOY LETHBRIDGE 960 79 HO LETHBRIDGE / BROOKS
2 HULLEMAN FARMS MARTIJN HULLEMAN LACOMBE 938 62 HO RED DEER
3 ROSEGLEN COLONY RUEBEN ENTZ HILDA 937 93 HO LETHBRIDGE / BROOKS
4 HOUWELING FARMS LTD PETE HOUWELING COALDALE 933 185 HO LETHBRIDGE / BROOKS
5 NIELSEN FARMS LTD LACOMBE 926 168 HO RED DEER
6 ROSS LAKE DAIRIES LTD JOE & NICOLE VERHOEVEN STETTLER 910 57 HO RED DEER
7 BRANDO HOLSTEINS WIM & SYLVIA SCHAKEL LACOMBE 907 186 HO RED DEER
8 TEN BRUMMELHUIS DAIRY ALFONS & WILMA TEN BRUMMELHUIS OLDS 901 87 HO CALGARY
9 EARNEWALD HOLSTEINS BRAM & INEKE DE JONG LACOMBE 894 141 HO RED DEER
10 PRAIRIEHOME COLONY JONATHAN WALDNER WRENTHEM 890 117 HO LETHBRIDGE / BROOKS
11 HARMEN LEUSINK PICTURE BUTTE 890 107 HO LETHBRIDGE / BROOKS
12 JAN & AGNES HEIDA BARRHEAD 889 61 HO EDMONTON
13 ARIE & DINEKE PHILIPSEN LACOMBE 887 281 HO RED DEER
14 WETOKA FARMS LTD ART & EILEEN ROTH MILLET 886 71 HO RED DEER
15 WOUTERS DAIRY MAARTEN & JOHANNA WOUTERS INNISFALL 881 93 HO RED DEER
16 DEERFIELD COLONY ANDY WALDNER MAGRATH 880 103 HO LETHBRIDGE / BROOKS
17 SUNALTA FARMS SIEBE BROUWER PONOKA 877 247 HO RED DEER
18 BLES-WOLD DAIRY HENNIE & TINIE E BOS LACOMBE 876 233 HO RED DEER
19 H & W ROMMENS FARMS H & W ROMMENS DUCHESS 876 188 HO LETHBRIDGE / BROOKS
20 POLY-C FARMS COR & CATHY HAAGSMA PONOKA 874 152 HO RED DEER
Herd Owner City Total Score Herd Size Breed RegionRank & Farm Name
H E R D I M P R O V E M E N T R E P O R T1 8

S A S K A T C H E W A N H E R D M A N A G E M E N T S C O R E
P R O D U C E R P R O F I L E
Neither hail, nor sleet nor a strike kept Marlene Fehr from
leading the staff tending the University of Saskatchewan's
70-head Holstein herd to first place for Herd Management
Score for Saskatchewan.
The month-long strike that began Nov. 2 was the biggest
challenge of the year because all six of the staff she
supervises are union members. It took five days to
establish the dairy herd as an essential service, and then
only one person per day could come in to help. Students
filled in as milkers and university managers fed the cattle.
“It turned out to be a good experience for them,” she says
of the managers “because they learned what it's like to
work in a dairy barn.”
“We have a really good staff and that's probably why the university ranked first”, she said. They not only have to manage a
dairy herd, but also incorporate many research projects, most of them related to nutrition.
Those challenges mean Fehr depends heavily on CanWest DHI to furnish the data required not only for routine
management, but also to serve the needs of the research teams from the Department of Animal and Poultry Science, the
Western College of Veterinary Medicine and the Vaccine and Infectious Diseases Organization (VIDO). She makes sure the
students she teaches are well aware of the value of DHI for herd management ranging from nutrition to herd health and
reproduction.
Students visit the herd to learn about issues such as
TMR, particle size, body condition scores, type
classification, she said. Some are diploma course
students, some in their third or fourth year of Animal and
Poultry Science studies and some from first year at the
veterinary college.
She personally pays the closest attention to the DHI data
for somatic cell counts and the persistency of milk
production, both on a herd-wide and individual basis.
Her word of advice for dairy farmers is to make the best
quality forage possible. “It makes all the difference,” she
said. Concentrates can be formulated to optimize
production from available forage, but the better the forage
base, the better the herd's performance will be, she says.
“That comes as no surprise to dairy farmers, yet it bears
repeating.”
When it comes to balancing rations, Fehr tailors them
closely to different groupings – a calf starter, calf grower,
growing heifer, dry cow and a couple of standard milking-
cow rations. The university has its own mill, but during
the strike Fehr purchased from Federated Cooperatives.
University of Saskatchewan, Department of Animal and Poultry Science, Saskatoon, SK
Herd Owner City Total Score Herd Size Breed Region
1 DEPARTMENT OF ANIMAL & POULTRY SCIENCE SASKATOON 893 62 HO SASKATOON EAST
2 HAVEN COLONY JAKE ENTZ FOX VALLEY 887 89 HO SWIFT CURRENT
3 PRAIRIE DIAMOND FARM HARLEY STRUDWICK BALGONIE 882 71 HO REGINA
4 SUNNYSIDE DAIRY BAS & MARTHA FROESE SASKATOON 854 23 HO SASKATOON
5 PENNANT COLONY DAN WIPF PENNANT 842 94 HO SWIFT CURRENT
6 GLENRIDGE HOLSTEINS BRUCE LOVERIDGE GRENFELL 838 64 HO WEYBURN
7 RYNVIEW HOLSTEINS MICHAEL WESSELINGH SASKATOON 838 60 HO SASKATOON EAST
8 FOTH VENTURES LTD MELVIN FOTH HAGUE 818 307 HO SASKATOON EAST
9 ELKREST FARMS BRAD JASON TREVOR KORNELIUS OSLER 812 537 HO SASKATOON EAST
10 SMILEY HUTTERITE COLONY LEONARD KLEINSASSER SMILEY 806 65 HO SASKATOON WEST
11 ABBYVIEW FARMS BEN VANDERKOOI SASKATOON 794 444 HO SASKATOON EAST
12 ALLEY HOLSTEINS ALBERT LEYENHORST DALMENY 775 144 HO SASKATOON EAST
13 SPRINGLAKE COLONY SAMUEL HOFER SWIFT CURRENT 775 100 HO SWIFT CURRENT
14 DELAINE HOLSTEINS ELAINE DONALD SASKATOON 771 129 HO SASKATOON EAST
15 SCHULTZ FAMILY FARM ALVIN & MITCH SCHULTZ DALMENY 770 126 HO SASKATOON EAST
16 EAGLEWOOD HOLDINGS LTD EARL & SCOTT WOODSIDE ASQUITH 767 76 HO SASKATOON WEST
17 BAUMANN HOLSTEINS EMANUEL & SIMON BAUMANN KIPLING 765 76 HO WEYBURN
18 D & E DAIRY LTD DENNIS & ESTER ENS HAGUE 763 48 HO SASKATOON EAST
19 KENBERT ACRES HERB, JAKE & KEN FRIESEN DRAKE 759 116 HO SASKATOON EAST
20 HAGUEVIEW FARM INC DALE NEUDORF HAGUE 754 77 HO SASKATOON EAST
Rank & Farm Name
H E R D I M P R O V E M E N T R E P O R T2 0

P R O D U C E R P R O F I L E
Springmeadow Farm, Libau, MB
M A N I T O B A H E R D M A N A G E M E N T S C O R E
Laurent and Corinne Failletaz pay close attention to most
everything involved in their 48-head Holstein herd of milking
cows, so they ended up second in Manitoba for overall Herd
Management Score. “We do the best we can every day of the
year,” says Laurent.
He also enjoys the thrill of winning awards, so works hard to
improve his herd management. “I don't want to boast, or
show off,” he says, “but it's fun to compare with each other. It
gives me the passion.”
Laurent and Corinne came to Canada as exchange students,
working at a farm near Winchester, Ontario, before buying
their Manitoba farm in November, 2002. They changed the
ration to boost milk production and in 2003 they renovated
the barn “and milk production really jumped.”
The renovation widened the tie stalls, eliminating those narrower than 48 inches and making room for some as wide as 56
inches. There are three different stall sizes now to make sure that every cow is comfortable. Laurent and Corinne are firm
believers in cow comfort.
They also pay close attention to DHI data. For example, Laurent uses it to identify the best cows and to cull those with the lowest
BCA. He keeps a close eye on milk components and milk value and uses that information to choose sires that will improve the
next generation for his herd.
“Managing without DHI is short term,” he says. “With DHI,
you can improve your herd and income for the long term,
the next 25 years. DHI isn't a cost. It pays back over the long
term.”
Laurent feeds a TMR that features dry hay, supplement,
high-moisture corn and corn silage. The supplement is in
the TMR, not top-dressed.
Corinne, who is expecting a second child soon, can and
does handle most types of jobs in the barn, such as feeding,
milking and tending calves. Laurent estimates her
contribution equals three-quarters of a full-time hired hand.
Their first child, daughter Morgane, is two.
Laurent and Corinne placed fifth for overall herd
management in 2006, second last year and will be aiming
for first this year. “I like it,” he says of the challenge to get
better.
Herd Owner City Total Score Herd Size Breed RegionRank & Farm Name
1 COLUMBINE HOLSTEINS JACOB & ANNITA BENTHEM ELM CREEK 857 87 HO CENTRAL
2 SPRINGMEADOW FARM LAURENT & CORINNE FAILLETAZ LIBAU 851 56 HO INTERLAKE
3 JUBEMA HOLSTEINS BEERD HOP & FAMILY TOLSTOI 832 85 HO EASTERN
4 VANDEL HOLSTEINS L VANDENBOSSCHE BRUXELLES 826 51 HO CENTRAL
5 SNOWFLAKE JERSEYS GRANT DIDKOWSKI SNOWFLAKE 826 49 JE CENTRAL
6 PHILIPPOT DAIRY FARMS ALAIN PHILIPPOT ST CLAUDE 805 77 HO CENTRAL
7 BOONSTRA FARMS LTD BRIAN & ROB BOONSTRA MARQUETTE 804 300 HO INTERLAKE
8 HANMAR HOLSTEINS HANS & MARIANN BUCHELI ANOLA 798 58 HO EASTERN
9 FIFI HOLSTEINS GABRIEL FIFI BRUXELLES 793 27 HO CENTRAL
10 AIRPORT COLONY LEVI HOFER PORTAGE 777 74 HO CENTRAL
11 HARDA HOLSTEINS KIRK & HARRIETTE WILE STEINBACH 772 37 HO EASTERN
12 DONFIELD FARMS GARRY DONOHOE BRANDON 757 81 HO SOUTH WEST
13 CURRENT HOLSTEINS CURTIS & DARREN HUEGING WOODLANDS 755 71 HO INTERLAKE
14 COTTONWOOD HOLSTEINS EDWOOD, GWEN & BRENT OSWALD STEINBACH 751 111 HO EASTERN
15 DELICHTE HOLSTEINS HENRY & MAURICE DELICHTE ST ALPHONSE 751 48 HO CENTRAL
16 ROCKY RIDGE DAIRY HOTZE & PIETJE WOUDSTRA GRUNTHAL 746 137 HO EASTERN
17 C&D FARMS CORNIE PENNER ALTONA 743 63 HO CENTRAL
18 MATT & TANYA PLETT LANDMARK 742 39 HO EASTERN
19 GEECEE GUY & CLAUDE FOREST ST MALO 741 49 HO EASTERN
20 WILDROSE JERSEYS F & S SCHWEIGERT INWOOD 738 46 JE INTERLAKE
H E R D I M P R O V E M E N T R E P O R T2 2

B R I T I S H C O L U M B I A
Farm Herd Owner City Avg BCA BCA M BCA F BCA P Records Milk kg Fat kg Prot kg Breed
P U B L I S H A B L E H E R D L I S T I N G S
In order for a herd to be included in the listing, 75% or more of the total records contributing to the herd's average must be Publishable. *Greater than 2X a day milking
MEADOW GOLD FARMS ERNEST & SIG BIRKHOLZ CHILLIWACK 282.0 298 264 284 135 13,341 * 440 405 H
JOHN TAMIS SURREY 276.3 288 260 281 53 12,350 430 388 H,G,B
TRIWEST FARMS VIC & TERRY TRIEMSTRA CHILLIWACK 274.3 282 269 272 106 12,655 * 449 387 H
BARBROS JERSEY FARM TOM BARICHELLO LANGLEY 274.3 290 252 281 36 8,157 384 300 J
E.P. FARMS LTD J EDGE PARTINGTON CRESTON 268.3 272 265 268 67 12,273 441 384 H
JOHN HYLKEMA CHILLIWACK 267.7 268 267 268 93 12,395 460 392 H
FRUEH FARM LTD STEVE FRUEH DUNCAN 267.3 259 286 257 62 12,291 501 385 H
NATURE GLEN DAIRY BEN BRANDSMA & BI BOWMAN ABBOTSFORD 261.3 263 254 267 62 11,847 426 384 H,J
LYBA FARMS LYLE MAMMEL CHILLIWACK 261.0 265 245 273 51 11,555 398 381 H
MARLENA FARMS LTD MARTIN VERMEER DEWDNEY 258.7 267 245 264 136 11,820 * 403 373 H
MALABAR FARM NORMAN VANDER WYK DEWDNEY 257.0 272 232 267 104 12,183 386 382 H
KOOLDALE FARMS LTD KOOLDALE FARMS LTD SURREY 256.7 258 255 257 89 11,934 441 379 H
TELFORD FARMS JAMES TELFORD ABBOTSFORD 256.0 268 234 266 48 12,615 406 396 H
BLOSSOM DAIRY LTD VICTOR & BRIAN GOERTZEN CHILLIWACK 255.0 248 270 247 83 11,363 461 359 H
MILKY WAY DAIRY FRANK & DEBBIE LES CHILLIWACK 254.3 257 256 250 49 11,420 424 353 H
DAVISON FARM KEVIN DAVISON MAPLE RIDGE 253.0 289 209 261 95 7,658 299 263 J
VAN GARD FARMS LTD JIM VAN GARDEREN CHILLIWACK 253.0 262 234 263 58 11,688 392 374 H
ST CHRISTOPHER ALLAN, RANDELL DE JONG & FAMILY SURREY 252.3 268 221 268 118 12,154 * 371 388 H
H ANTONSEN & CO. LTD HARVEY ANTONSEN ALDERGROVE 252.3 257 245 255 48 11,835 420 375 H
SWAANSITE HOLSTEINS NEIL SWAAN SALMON ARM 251.3 254 249 251 19 11,726 424 368 H
H E R D I M P R O V E M E N T R E P O R T2 4

Farm Herd Owner City Avg BCA BCA M BCA F BCA P Records Milk kg Fat kg Prot kg Breed
P U B L I S H A B L E H E R D L I S T I N G S
A L B E R T A
In order for a herd to be included in the listing, 75% or more of the total records contributing to the herd's average must be Publishable. *Greater than 2X a day milking
RINSMA HOLSTEINS GEERT RINSMA OLDS 285.7 301 266 290 62 14,445 * 471 440 H
NORTHEND FARM BRODIE & BRENDA CUPPLES THORSBY 280.0 293 258 289 13 8,133 297 263 M,G
EARNEWALD HOLSTEINS BRAM & INEKE DE JONG LACOMBE 273.3 277 273 270 126 12,084 441 376 H
VANDEN POL DAIRY GYS & SILIA VANDEN POL COALDALE 266.7 278 248 274 58 12,362 * 410 387 H
ROSELANE HOLSTEINS ROLLYVIEW 265.0 276 255 264 51 12,367 429 382 H,B
H & W ROMMENS FARMS H & W ROMMENS DUCHESS 264.3 271 252 270 160 12,418 428 393 H
WESTPRIDE FARMS LTD DALE & ADAM STANNARD RED DEER 262.3 275 249 263 104 12,433 * 419 378 H
TEN BRUMMELHUIS DAIRY A & W TEN BRUMMELHUIS OLDS 261.0 274 245 264 63 12,210 405 376 H,B
OK COLONY JONATHON WALDNER RAYMOND 259.0 264 255 258 30 11,703 418 363 H
SCOVA FARMS LTD SCOTT INGWERSEN PONOKA 258.7 273 252 251 115 12,186 * 419 358 H
HAPPY COW DAIRY KEES & MIRANDA VERHOEF INNISFAIL 256.7 269 236 265 56 11,814 * 389 374 H,B
EVERT & JANNETT VAN BENTHEM INNISFAIL 256.3 270 241 258 99 12,212 404 371 H
DE LINGE DAIRY FARM JOOP GARRETSEN CRANFORD 255.0 267 239 259 128 12,202 404 376 H
WETOKA FARMS LTD ART & EILEEN ROTH MILLET 255.0 268 243 254 59 12,281 414 370 H
MORSAN DAIRY MORRIS THALEN PONOKA 254.3 264 248 251 487 11,753 * 412 357 H,B
WILL & ROB ROMMENS DUCHESS 254.3 262 241 260 136 11,849 404 374 H
MORSAN DAIRY MORRIS THALEN PONOKA 254.3 255 250 258 40 11,319 414 365 H
THORNSPYC DAIRY WIM VAN DE BRAKE LACOMBE 253.0 258 250 251 136 11,574 417 360 H
NEW MARS DAIRY HENK SCHRIJVER MILLET 252.7 247 266 245 162 11,361 453 359 H
BUIT DAIRIES LTD RUSS & JUDI BUIT BENTLEY 252.7 265 243 250 53 11,477 * 391 345 H
H E R D I M P R O V E M E N T R E P O R T2 6

Farm Herd Owner City Avg BCA BCA M BCA F BCA P Records Milk kg Fat kg Prot kg Breed
P U B L I S H A B L E H E R D L I S T I N G S
S A S K A T C H E W A N
In order for a herd to be included in the listing, 75% or more of the total records contributing to the herd's average must be Publishable. *Greater than 2X a day milking
RYNVIEW HOLSTEINS MICHAEL WESSELINGH SASKATOON 282.7 289 272 287 49 12,948 452 410 H
PRAIRIE DIAMOND FARM HARLEY STRUDWICK BALGONIE 276.0 277 269 282 57 13,042 467 421 H
FOTH VENTURES LTD MELVIN FOTH HAGUE 260.3 269 246 266 232 12,109 * 412 382 H
NEXGEN FARMS KEN LISCHKA STEELEMAN 260.0 256 262 262 47 12,324 467 399 H
KAWARTHA HOLSTEINS DAVE & MELISSA MCMORROW OSLER 251.0 254 237 262 60 11,425 407 379 H,J
NORWIND DAIRY ERNIE FRIESEN MARTENSVILLE 247.0 256 233 252 41 11,109 379 350 H,J
PENNANT COLONY DAN WIPF PENNANT 245.7 240 261 236 75 10,985 446 344 H
DELAINE HOLSTEINS ELAINE DONALD SASKATOON 245.3 246 250 240 103 11,281 425 351 H
DEPARTMENT OF ANIMAL & POULTRY SCIENCE SASKATOON 241.3 241 239 244 52 10,948 402 353 H
BAUMANN HOLSTEINS EMANUEL & SIMON BAUMANN KIPLING 240.7 241 246 235 57 10,843 410 336 H
KESSEL FAMILY FARM RAYMOND KESSEL BALGONIE 235.3 242 225 239 110 11,052 378 346 H
ROBERTSON DAIRY LTD CLAYTON ROBERTSON BULYEA 235.3 240 221 245 87 11,184 380 361 H
FORNWALD & SONS FARMS LTD D, T & C FORNWALD LAMPMAN 234.7 243 217 244 108 11,280 383 362 H,J
EAGLEWOOD HOLDINGS LTD EARL & SCOTT WOODSIDE ASQUITH 232.0 234 225 237 66 10,701 380 345 H
ELKREST FARMS BRAD, JASON & TREVOR KORNELIUS OSLER 230.7 239 222 231 417 10,852 * 374 334 H,A
RIVERBEND INSTITUTION CORCAN AGRIBUSINESS PRINCE ALBERT 230.3 230 230 231 42 10,682 395 340 H
GLENRIDGE HOLSTEINS BRUCE LOVERIDGE GRENFELL 229.7 232 232 225 44 10,796 402 332 H
COSSETTE FARMS LTD RANDY COSSETTE ESTEVAN 227.7 230 218 235 74 10,635 372 344 H
ARTOMDA FARMS RANDY STOKER HAGUE 227.3 235 217 230 81 10,839 373 337 H
SPRINGWATER COLONY ANDY STAHL RUTHILDA 227.0 234 219 228 163 10,526 364 325 H
H E R D I M P R O V E M E N T R E P O R T 2 7

Farm Herd Owner City Avg BCA BCA M BCA F BCA P Records Milk kg Fat kg Prot kg Breed
P U B L I S H A B L E H E R D L I S T I N G S
M A N I T O B A
AGGIES HOLSTEINS HERMANN & AUDREY HUEGING WOODLANDS 288.0 298 278 288 89 13,561 468 417 H
AIRPORT COLONY LEVI HOFER PORTAGE 267.0 281 253 267 52 12,323 412 374 H
VANDEL HOLSTEINS L VANDENBOSSCHE BRUXELLES 264.7 266 255 273 43 12,096 431 394 H
JUBEMA HOLSTEINS BEERD HOP & FAMILY TOLSTOI 261.7 268 247 270 60 11,405 394 367 H
JAMES VALLEY COLONY TIM WURTZ ELIE 261.3 270 260 254 64 12,986 * 463 385 H
PENNVIEW HOLSTEINS LARRY PENNER BLUMENORT 260.3 259 262 260 49 12,080 453 384 H
CURRENT HOLSTEINS CURTIS & DARREN HUEGING WOODLANDS 259.0 269 245 263 52 13,078 440 406 H
SPRINGMEADOW FARM LAURENT & CORINNE FAILLETAZ LIBAU 249.0 254 239 254 40 11,735 413 374 H,J
SWISS DREAM FARM WAWANESA 248.7 250 248 248 50 9,544 381 332 B
DONFIELD FARMS GARRY DONOHOE BRANDON 246.0 239 250 249 65 11,124 434 368 H
FRIECREST HOLSTEINS ED & KATHY FRIESEN KLEEFELD 245.0 243 252 240 71 11,138 428 349 H
STEINMANN DAIRY FARM W & M STEINMANN CLANDEBOYE 243.7 245 241 245 50 11,237 410 356 H
COTTONWOOD HOLSTEINS EDWOOD, GWEN & BRENT OSWALD STEINBACH 243.3 233 267 230 79 10,824 460 339 H
LIFEWIND HOLSTEINS CHRISTOPHE ROULIN STONEWALL 240.7 247 234 241 74 11,716 412 363 H
LAINGSPRING FARM RAY & BERTHA LAING STEINBACH 238.3 242 238 235 91 10,893 398 337 H
WILDROSE JERSEYS F & S SCHWEIGERT INWOOD 237.0 248 211 252 31 7,820 361 301 J
DELICHTE HOLSTEINS HENRY & MAURICE DELICHTE ST ALPHONSE 236.7 239 224 247 38 10,353 371 344 H,J
COLUMBINE HOLSTEINS JACOB & ANNITA BENTHEM ELM CREEK 236.0 238 230 240 77 10,673 384 344 H
MATT & TANYA PLETT LANDMARK 235.3 235 233 238 26 11,399 421 366 H
POUTEAU HOLSTEINS LTD DARCY, RANDY & ED POUTEAU SWAN LAKE 234.0 236 224 242 85 10,655 377 348 H
In order for a herd to be included in the listing, 75% or more of the total records contributing to the herd's average must be Publishable. *Greater than 2X a day milking
H E R D I M P R O V E M E N T R E P O R T2 8

Herd Size Housing Frequency
0-49 50-99 100-199 200+ Free StallTie-Stall 2x 3x
H E R D D E M O G R A P H I C S
BRITISH COLUMBIA
ALBERTA
SASKATCHEWAN
MANITOBA
% OF HERDS 12.3 40.5 33.9 13.4 5.4 94.3 92.3 7.7
% OF COWS 3.9 24.5 37.3 34.4 2.5 97.5 86.4 13.6
AVERAGE HERD SIZE 38.8 74.3 135.2 315.2 56.5 127 115 216.8
AVERAGE MILK PRODUCTION 9,477 9,894 10,134 10,168 9,515 9,990 9,882 10,901
AVERAGE FAT PRODUCTION 355 363 368 365 348 365 364 369
AVERAGE PROTEIN PRODUCTION 302 315 322 322 305 318 315 340
BCA MILK 212 221 226 225 214 222 220 243
BCA FAT 210 214 219 217 203 216 215 221
BCA PROTEIN 211 219 225 224 213 221 219 238
% OF HERDS 9.7 41.2 40.2 8.9 14.9 84 89.9 10.1
% OF COWS 3.4 27.7 46.5 22.4 9.3 89.8 85.5 14.5
AVERAGE HERD SIZE 40.3 76.7 132 287.1 71.7 122.1 108.6 163.6
AVERAGE MILK PRODUCTION 8,919 9,583 9,743 9,838 9,380 9,660 9,513 10,427
AVERAGE FAT PRODUCTION 324 342 353 356 337 348 343 369
AVERAGE PROTEIN PRODUCTION 287 303 307 309 299 305 301 326
BCA MILK 205 210 215 218 204 214 210 230
BCA FAT 193 202 209 211 196 207 203 219
BCA PROTEIN 204 209 213 214 204 212 209 226
% OF HERDS 9.6 40.1 34.4 15.9 26.1 67.5 93.6 6.4
% OF COWS 2.8 23.9 36.6 36.7 14.6 81.2 85.6 14.4
AVERAGE HERD SIZE 36 73.8 131.7 285.1 69.4 148.8 113.2 279.6
AVERAGE MILK PRODUCTION 8,017 9,635 9,378 9,886 9,222 9,511 9,380 10,191
AVERAGE FAT PRODUCTION 287 345 341 356 332 342 339 357
AVERAGE PROTEIN PRODUCTION 259 310 301 315 296 305 302 318
BCA MILK 177 211 205 217 201 209 206 223
BCA FAT 167 203 201 210 193 202 199 211
BCA PROTEIN 178 213 207 217 202 210 207 219
% OF HERDS 20.3 44 26.6 9.1 51.9 47.7 93.8 6.2
% OF COWS 7.3 29.8 33.1 29.9 35.6 64.1 87.8 12.2
AVERAGE HERD SIZE 37.5 71.2 130.7 344 72 141 98.3 206.1
AVERAGE MILK PRODUCTION 8,861 9,222 9,157 9,015 9,152 9,075 9,078 9,635
AVERAGE FAT PRODUCTION 325 333 337 335 333 333 332 344
AVERAGE PROTEIN PRODUCTION 285 295 294 290 294 291 292 304
BCA MILK 197 203 198 198 202 198 199 208
BCA FAT 190 194 195 197 194 194 194 200
BCA PROTEIN 197 203 199 199 202 199 200 206
H E R D I M P R O V E M E N T R E P O R T 2 9

Reason British Columbia Alberta Saskatchewan Manitoba
D I S T R I B U T I O N O F H E R D S I Z E ( A L L P R O V I N C E S )
D I S P O S A L R E A S O N S
140
120
100
80
60
40
20
10-1
9
20-2
9
30-3
9
40-4
9
50-5
9
60-6
9
70-7
9
80-8
9
90-9
9
100-1
09
110-1
19
120-1
29
130-1
39
140-1
49
150-1
59
160-1
69
170-1
79
180-1
89
190-1
99
200+
NU
MB
ERO
FH
ERD
S
NUMBER OF COWS
REPRODUCTIVE 3,056 29% 3,647 29% 973 28% 1,497 27%
MASTITIS AND/OR HIGH SCC 2,095 20% 1,982 16% 634 18% 961 17%
LOW MILK PRODUCTION 1,123 11% 1,909 15% 348 10% 740 13%
FEET & LEG PROBLEMS 1,432 14% 1,213 10% 349 10% 703 13%
SICKNESS 927 9% 1,124 9% 390 11% 514 9%
UDDER BREAKDOWN 696 7% 1,314 10% 324 9% 545 10%
INJURY/ACCIDENT 690 7% 641 5% 235 7% 309 6%
OLD AGE 274 3% 532 4% 131 4% 193 3%
SLOW MILKER 97 1% 207 2% 42 1% 67 1%
BAD TEMPERAMENT 95 1% 131 1% 40 1% 58 1%
H E R D I M P R O V E M E N T R E P O R T3 0
