n p successfully resenting earned value - microplanning€¦ · · 2014-03-24successfully...
TRANSCRIPT
PresentingSuccessfully
Earned Value Your guide to Earned Value Management
What is Earned Value Management?Earned Value Management (EVM) is a project management system that combines schedule performance and cost performance to answer the question, “What did we get for the money we spent?”
Basic concepts of EVM:
• All project steps “earn” value as work is completed. • The Earned Value (EV) can then be compared to actual costs and planned costs to
determine project performance and predict future performance trends. • Physical progress is measured in dollars, so schedule performance and cost
performance can be analyzed in the same terms.
Earned Value has been used since the 1960’s by the Department of Defense as a central part of the C/SCSC (Cost/Schedule Control Systems Criteria). Recently, the DOD revised the 35 criteria contained in the C/SCSC and produced the 32 criteria for EVMS (Earned Value Management Systems).
These criteria have since been accepted by the American National Standards Institute/Electronic Industry Association as a new standard, called ANSI/EIA 748. Now, EVM is being used in a wider variety of government contracts, and is spreading through the private sector as a valuable tool for project managers.
2002October
NovemberDecember
SummaryProgram Review
Status
$0.00
$1,000.00
$2,000.00
$3,000.00
$4,000.00
Earned ValueBudget
Spending
Earned Value Report
Contract ReviewProject /Tasks
Budget ACWPSpending BCWPEarned ValuePRCNTCMPLT
Totals for Project
$4,025.00 $1,375.00$2,585.62 64.2%
Task 1
$950.00 $725.00$743.50 78.3%
Task 1-A
$300.00 $200.00$235.71 78.6%
Task 1-B
$400.00 $350.00$321.74 80.4%
Task 1-C
$250.00 $175.00$186.05 74.4%
Task 2
$1,300.00 $500.00$836.56 64.4%
Task 2-A
$725.00 $200.00$483.33 66.7%
Task 2-B
$225.00 $100.00$109.29 48.6%
Task 2-C
$350.00 $200.00$243.94 69.7%
SummaryProgram Review
Status
Contracts review: 11-30-02Sign Off: _________________
2002
March AprilMay
Summary
Status
Program Review
CPI from
1 to 1.3
Completed TaskIncomplete Task
CPI above 1.3CPI below 1
$0.00
$500.00
$1,000.00
$1,500.00
$2,000.00
$2,500.00
$3,000.00
BCWSBCWPBudget
ACWP
Performance Review
Project/Tasks
TotalBudget
BCWSACWP
SpendingBCWPE Value
PRCNTCMPLT
SV CV CPI SPI
Project ABC
$2,975 $1,740 $1,575 $2,005 67.4% $267 $431 1.27 1.15
Task 1
$300 $300$350 $300 100.0% $0 ($50) 0.86 1.00
Task 2
$400 $400$400 $400 100.0% $0 $0 1.00 1.00
Task 3
$250 $128$175 $140 55.8% $12 ($35) 0.80 1.09
Task 4
$725 $456$200 $564 77.8% $108 $364 2.82 1.24
Task 5
$400 $189$100 $211 52.6% $22 $111 2.11 1.12
Task 6
$350 $159$200 $223 63.6% $64 $23 1.12 1.40
Task 7
$550 $107$150 $168 30.6% $61 $18 1.12 1.57
Summary
Status
Program Review
CPI from
1 to 1.3
Completed TaskIncomplete Task
CPI above 1.3CPI below 1
ACWP
Budget
BCWP
BCWS

Successfully Presenting Earned Value page 2
What are the benefi ts of usingEarned Value Management?In a typical spend plan analysis, physical progress is not taken into account when analyzing cost performance. Instead, a project’s actual costs to date are simply compared to planned costs, often with misleading results.
March April May
$0.00
$500.00
$1,000.00
$1,500.00
$2,000.00
$2,500.00
$3,000.00
BudgetAC
Budget-at-Completion
Planned Value = $1000
Actual Costs = $1000
Figure 1
2002March April May
$0.00
$500.00
$1,000.00
$1,500.00
$2,000.00
$2,500.00
$3,000.00
EVBudgetAC
PlannedValue = $1000
ActualCosts = $1000
EarnedValue = $750
Example:
A task has a planned value (PV) of $1000, and actual costs (AC) of $1000. It appears this task has perfect cost performance, and is in good shape to fi nish on-budget (Figure 1).However, if physical progress is taken into account, the results may differ.
Figure 2
In Figure 2, the project has spent $1000 in actual costs but has only achieved $750 of Earned Value.
This is called a cost overrun, and this project would have a Cost Variance (CV) of -$250.
From this example, we can see that EVM expands on the two-dimensional analysis– “Has this project spent more or less money than planned?”– by adding the third dimension– “What did we get for the money we spent?”

Successfully Presenting Earned Value page 3
Building Blocks of Earned Value AnalysisIn addition to more accurate project status assessment, EVM makes it easy for a project manager to analyze both schedule and cost performance in a variety of ways. Using a limited set of basic task information, it is possible not only to determine how a project has been performing, but to predict future performance trends as well.
Basis for Earned Value Analysis:
• Budget at Completion (BAC) = Overall approved budget for a task. • Actual Costs (AC) = Total amount spent on a task up to the current date. • Percent Complete = Task progress, related as either EV/BAC, or simply physical
progress shown by the fi ll of the task bar.
Once these three measurements have been established, the following calculations can be performed:
• Earned Value (EV) = BAC x Percent Complete. The budgeted cost of completed work as of the current date.
• Planned Value (PV) = The point along the time-phased budget that crosses the current date. Shows the budgeted cost of scheduled work as of the current date.
2002
October November December
$4,000.00
Earned Value Report Contract Review
Project /Tasks
BAC AC %Complete
Totals for Project $4,025.0 $1,375.00 63.7%
Task 1 $950.0 $725.00 78.3%
Task 1-A $300.0 $200.00 78.6%
Task 1-B $400.0 $350.00 80.4%
Task 1-C $250.0 $175.00 74.4%

Successfully Presenting Earned Value page 4
Building Blocks of Earned Value Analysis
View detailed EVM data in actual dollars as part of a presentation schedule...
...or use an easy-to-read DataGraph for at-a-glance visual analysis of project trends.
October November December
Summary Program Review Status
$0.00
$500.00
$1,000.00
$1,500.00
$2,000.00
$2,500.00
$3,000.00
$3,500.00
$4,000.00
Earned ValueBudgetActual CostsPlanned Value
Summary Program Review Status
BAC
PV
EV
AC
DATELINE
October November December1 2 3 4 5 6 7 8 9 10 11 12 13 14
Project /Tasks
% BAC ActualCosts
EarnedValue
PlannedValue
Totals for Project 64% $4,025 $1,375 $2,564 $2,780
Task 1 78% $950 $725 $743 $783
Task 1-A 79% $300 $200 $236 $246
Task 1-B 80% $400 $350 $322 $339
Task 1-C 74% $250 $175 $186 $198

In Figure 6, the project shown has a negative SV, because it has “earned” less value than was planned, as of the current date.
However, it has a positive CV, because the Earned Value is greater than the Actual Costs accrued.
Successfully Presenting Earned Value page 5
Performance Indicesand VarianceOnce Earned Value and Planned Value are known, they can then be used to determine schedule and cost variance, and calculate performance effi ciency.
• Schedule Variance (SV) = Earned Value – Planned Value. The difference between what was planned to be completed and what has actually been completed as of the current date.
• Cost Variance (CV) = Earned Value – Actual Costs. The difference between the work that has been accomplished (in dollars) and how much was spent to accomplish it.
October November December January
$0.00
$500.00
$1,000.00
$1,500.00
$2,000.00
$2,500.00
$3,000.00
$3,500.00
Planned ValueEarned ValueBACActual Costs
Schedule Variance (SV)
Cost Variance (CV)
Figure 6

Successfully Presenting Earned Value page 6
Performance Indicesand Variance
• Schedule Performance Index (SPI) = Earned Value / Planned Value. Schedule variance related as a ratio instead of a dollar amount. A ratio less than 1 indicates that work is being completed slower than planned.
• Cost Performance Index (CPI) = Earned Value / Actual Costs. Cost variance related as a ratio instead of a dollar amount. A ratio less than 1 indicates that the value of the work that has been accomplished is less than the amount of money spent.
In Figure 7, Project A has a CPI greater than 1.00. This showsus that the project has been earning value faster than it has beenaccruing costs.
However, Project A also has a SPI value that is less than 1.00. Although Actual Costs are low, Task 1 is behind schedule,so the project has not earned as much value as was planned.
2004March April May
Performance ReviewBACTasks Earned
ValuePlanned
ValueActualCosts CPI SPI
$850Project A $270 $335 $250 1.08 0.81
$350Task 1 $195 $260 $150 1.30 0.75
$500Task 2 $75 $75 $100 0.75 1.00
Figure 7
Successfully Presenting Earned Value page 7
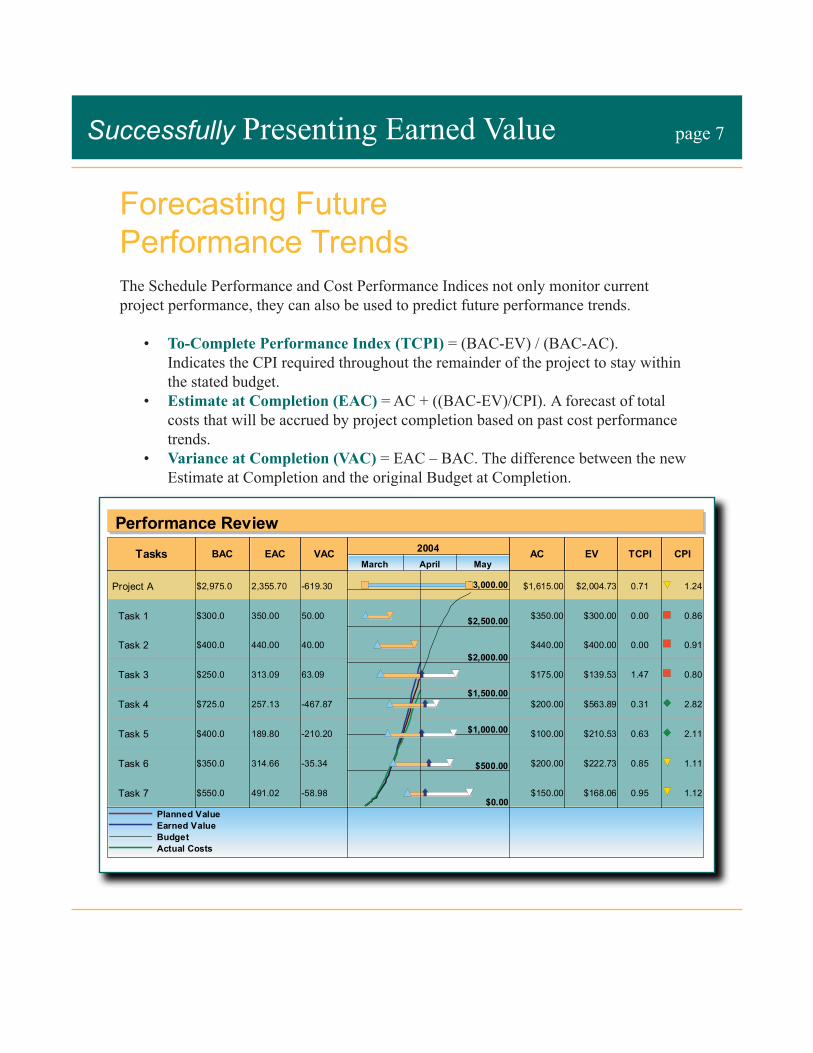
Forecasting FuturePerformance TrendsThe Schedule Performance and Cost Performance Indices not only monitor current project performance, they can also be used to predict future performance trends.
• To-Complete Performance Index (TCPI) = (BAC-EV) / (BAC-AC). Indicates the CPI required throughout the remainder of the project to stay within
the stated budget. • Estimate at Completion (EAC) = AC + ((BAC-EV)/CPI). A forecast of total
costs that will be accrued by project completion based on past cost performance trends.
• Variance at Completion (VAC) = EAC – BAC. The difference between the new Estimate at Completion and the original Budget at Completion.
2004March April May
$0.00
$500.00
$1,000.00
$1,500.00
$2,000.00
$2,500.00
$3,000.00
Planned ValueEarned ValueBudgetActual Costs
Performance ReviewVACEACBACTasks AC EV TCPI CPI
-619.302,355.70$2,975.0 Project A $1,615.00 $2,004.73 0.71 1.24
50.00350.00$300.0Task 1 $350.00 $300.00 0.00 0.86
40.00440.00$400.0Task 2 $440.00 $400.00 0.00 0.91
63.09313.09$250.0Task 3 $175.00 $139.53 1.47 0.80
-467.87257.13$725.0Task 4 $200.00 $563.89 0.31 2.82
-210.20189.80$400.0Task 5 $100.00 $210.53 0.63 2.11
-35.34314.66$350.0Task 6 $200.00 $222.73 0.85 1.11
-58.98491.02$550.0Task 7 $150.00 $168.06 0.95 1.12

Successfully Presenting Earned Value page 8
How do I get started using Earned Value Management?Identify and Organize all Project Steps
First, identify all tasks that need to be accomplished and organize the tasks into sub-groups (1). Breaking down activities into the smallest possible steps makes it easier to pinpoint schedule and cost performance problems.
Allocate the Budget and Schedule the Tasks
Each activity in the project should have a planned Budget-at-Completion (BAC). All subsequent earned value calculations will be based on this amount (2). In addition to the BAC, each task should also have a specifi c duration (3), which provides the basis for monitoring actual costs and physical progress.
2004March April May
Status Incomplete Task Completed Task Started Task
Tasks TotalBudget
3/10 5/8 Project A $2,975.0
Task 1 $300.0
Task 2 $400.0
Task 3 $250.0
Task 4 $725.0
Task 5 $400.0
Task 6 $350.0
Task 7 $550.0
3/10 5/8
(1) (2)
(3)
Successfully Presenting Earned Value page 9
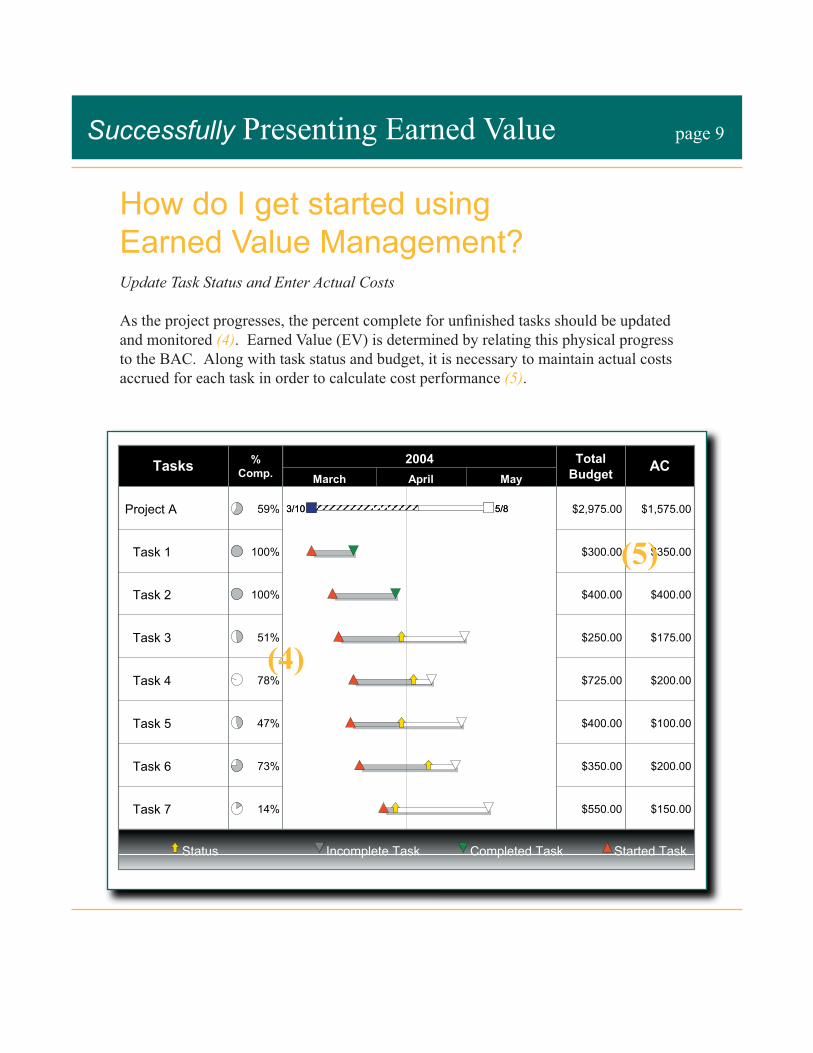
How do I get started using Earned Value Management?Update Task Status and Enter Actual Costs
As the project progresses, the percent complete for unfi nished tasks should be updated and monitored (4). Earned Value (EV) is determined by relating this physical progress to the BAC. Along with task status and budget, it is necessary to maintain actual costs accrued for each task in order to calculate cost performance (5).
2004March April May
Status Incomplete Task Completed Task Started Task
%Comp.Tasks Total
Budget AC
3/10 5/859% Project A $2,975.00 $1,575.00
100%Task 1 $300.00 $350.00
100%Task 2 $400.00 $400.00
51%Task 3 $250.00 $175.00
78%Task 4 $725.00 $200.00
47%Task 5 $400.00 $100.00
73%Task 6 $350.00 $200.00
14%Task 7 $550.00 $150.00
3/10 5/8
(5)
(4)
How do I get started using Earned Value Management?
Successfully Presenting Earned Value page 10
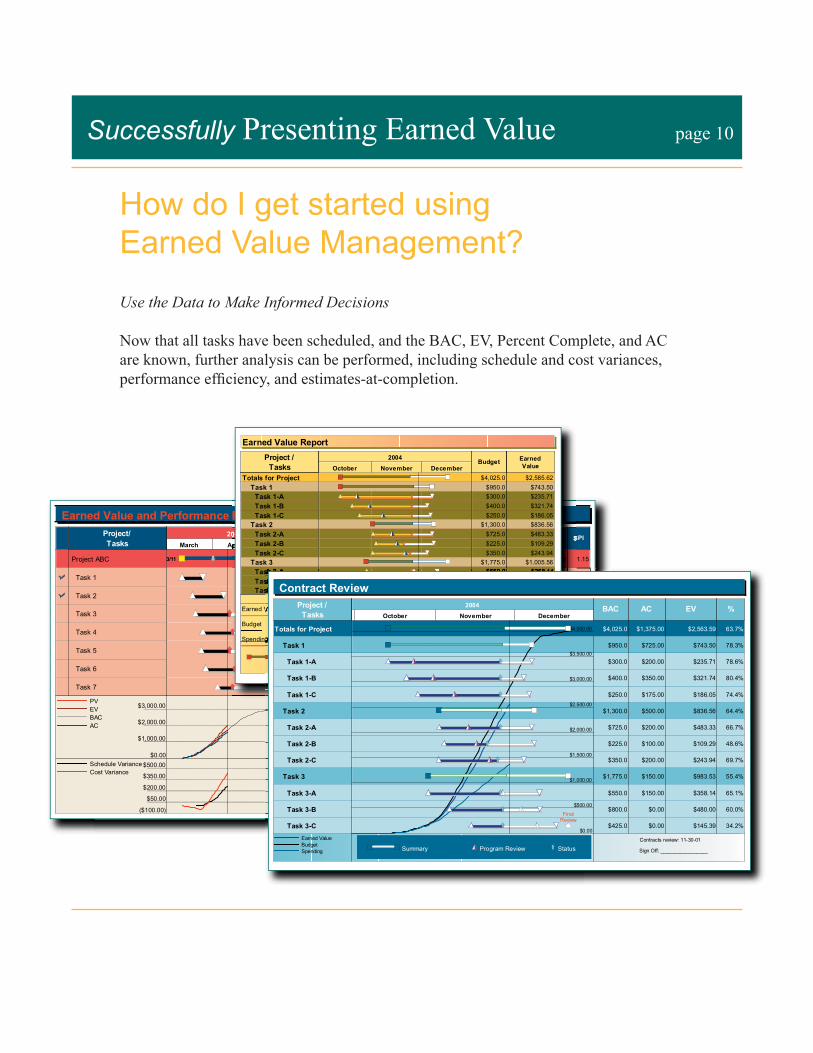
Use the Data to Make Informed Decisions
Now that all tasks have been scheduled, and the BAC, EV, Percent Complete, and AC are known, further analysis can be performed, including schedule and cost variances, performance effi ciency, and estimates-at-completion.
2002March April May
Summary Status
Completed Task CPI above 1.3
Incomplete Task CPI from 1 to 1.3
Program Review CPI below 1
$0.00
$1,000.00
$2,000.00
$3,000.00PVEVBACAC
($100.00)
$50.00
$200.00
$350.00
$500.00Schedule VarianceCost Variance
Earned Value and Performance ReviewProject/Tasks
TotalBudget
BCWS ACWPSpending
BCWPE Value
PRCNTCMPLT
SV CV CPI SPI
3/11 5/9 Project ABC $2,975.0 $1,739.90 $1,575.00 $2,004.73 67.4% $264.85 $429.74 1.27 1.15
Task 1 $300.0 $300.00 $350.00 $300.00 100.0% $0.00 ($50.00) 0.86 1.00
Task 2 $400.0 $400.00 $400.00 $400.00 100.0% $0.00 $0.00 1.00 1.00
Task 3 $250.0 $127.91 $175.00 $139.53 55.8% $11.62 ($35.47) 0.80 1.09
Task 4 $725.0 $456.48 $200.00 $563.89 77.8% $107.41 $363.89 2.82 1.24
Task 5 $400.0 $189.47 $100.00 $210.53 52.6% $21.06 $110.53 2.11 1.11
Task 6 $350.0 $159.09 $200.00 $222.73 63.6% $63.64 $22.73 1.11 1.40
Task 7 $550.0 $106.94 $150.00 $168.06 30.6% $61.12 $18.06 1.12 1.57
3/11 5/9
Summary Status
Completed Task CPI above 1.3
Incomplete Task CPI from 1 to 1.3
Program Review CPI below 1
2004
October November December
Summary Program Review Status
$0.00
$1,500.00
$3,000.00Earned Value
Budget
Spending
Earned Value ReportProject /
TasksBudget Earned
Value
Totals for Project $4,025.0 $2,585.62 Task 1 $950.0 $743.50
Task 1-A $300.0 $235.71Task 1-B $400.0 $321.74Task 1-C $250.0 $186.05
Task 2 $1,300.0 $836.56Task 2-A $725.0 $483.33Task 2-B $225.0 $109.29Task 2-C $350.0 $243.94
Task 3 $1,775.0 $1,005.56Task 3-A $550.0 $358.14Task 3-B $800.0 $480.00Task 3-C $425.0 $167.42
FinalReview
2004
October November December
Summary Program Review Status
$0.00
$500.00
$1,000.00
$1,500.00
$2,000.00
$2,500.00
$3,000.00
$3,500.00
$4,000.00
Earned ValueBudgetSpending
Contract ReviewProject /
TasksBAC AC EV %
Totals for Project $4,025.0 $1,375.00 $2,563.59 63.7%
Task 1 $950.0 $725.00 $743.50 78.3%
Task 1-A $300.0 $200.00 $235.71 78.6%
Task 1-B $400.0 $350.00 $321.74 80.4%
Task 1-C $250.0 $175.00 $186.05 74.4%
Task 2 $1,300.0 $500.00 $836.56 64.4%
Task 2-A $725.0 $200.00 $483.33 66.7%
Task 2-B $225.0 $100.00 $109.29 48.6%
Task 2-C $350.0 $200.00 $243.94 69.7%
Task 3 $1,775.0 $150.00 $983.53 55.4%
Task 3-A $550.0 $150.00 $358.14 65.1%
Task 3-B $800.0 $0.00 $480.00 60.0%
Task 3-C $425.0 $0.00 $145.39 34.2%
FinalReview
Summary Program Review StatusContracts review: 11-30-01
Sign Off: _________________

Successfully Presenting Earned Value page 11
Example Reports and Resources
On the following pages, several example Earned Value reports are shown. These examples, as well as the charts on the previous pages, were created in Milestones Professional 2004. Visit KIDASA.com to view these examples and more, or to download a trial version of Milestones Professional.
2005March April May
Status Incomplete Task Completed Task Started Task
$0.00
$500.00
$1,000.00
$1,500.00
$2,000.00
$2,500.00
$3,000.00
PVEVBACAC
Earned Value Calculations Project/Tasks
BAC PlannedValue
ActualCosts
EarnedValue
PRCNTCMPLT
3/10 5/8 Project ABC $2,975 $1,809 $1,575.0 $2,005 67.4%
Task 1 $300 $300 $350.0 $300 100.0%
Task 2 $400 $400 $400.0 $400 100.0%
Task 3 $250 $134 $175.0 $140 55.8%
Task 4 $725 $483 $200.0 $564 77.8%
Task 5 $400 $200 $100.0 $211 52.6%
Task 6 $350 $170 $200.0 $223 63.6%
3/10 5/8
AC Spending
Budget
Earned Value
Earned Value = Budget x % Complete Planned Value = Total Budget x % duration to the current date
PV

Successfully Presenting Earned Value page 12
2005March April May
Summary Status
Completed Task CPI above 1.3
Incomplete Task CPI from 1 to 1.3
Program Review CPI below 1
$0.00
$1,000.00
$2,000.00
$3,000.00PVEVBACAC
($100.00)
$50.00
$200.00
$350.00
$500.00SVCV
Earned Value and Performance Review Project/Tasks
TotalBudget
PlannedValue
ActualCosts
EarnedValue
PRCNTCMPLT
SV CV CPI SPI
3/10 5/8 Project ABC $2,975.00 $1,808.97 $1,575.00 $2,004.73 67.4% $195.77 $429.74 1.27 1.11
Task 1 $300.00 $300.00 $350.00 $300.00 100.0% $0.00 ($50.00) 0.86 1.00
Task 2 $400.00 $400.00 $400.00 $400.00 100.0% $0.00 $0.00 1.00 1.00
Task 3 $250.00 $133.72 $175.00 $139.53 55.8% $5.81 ($35.47) 0.80 1.04
Task 4 $725.00 $483.33 $200.00 $563.89 77.8% $80.56 $363.89 2.82 1.17
Task 5 $400.00 $200.00 $100.00 $210.53 52.6% $10.53 $110.53 2.11 1.05
Task 6 $350.00 $169.70 $200.00 $222.73 63.6% $53.03 $22.73 1.11 1.31
Task 7 $550.00 $122.22 $150.00 $168.06 30.6% $45.84 $18.06 1.12 1.38
3/10 5/8
Summary Status
Completed Task CPI above 1.3
Incomplete Task CPI from 1 to 1.3
Program Review CPI below 1
Schedule Variance = EV - PV Cost Variance = EV - AC Cost Performance Index = EV / AC Schedule Performance Index = EV / PV
2005
October November December
Summary Program Review Status
$0.00
$1,000.00$2,000.00$3,000.00$4,000.00
Earned Value
Budget
Spending
Earned Value ReportContract Review
Project /Tasks
Budget ActualCosts
EarnedValue
PRCNTCMPLT
Totals for Project $4,025.00 $1,375.00 $2,585.62 64.2%
Task 1 $950.00 $725.00 $743.50 78.3%
Task 1-A $300.00 $200.00 $235.71 78.6%
Task 1-B $400.00 $350.00 $321.74 80.4%
Task 1-C $250.00 $175.00 $186.05 74.4%
Task 2 $1,300.00 $500.00 $836.56 64.4%
Task 2-A $725.00 $200.00 $483.33 66.7%
Task 2-B $225.00 $100.00 $109.29 48.6%
Task 2-C $350.00 $200.00 $243.94 69.7%
Task 3 $1,775.00 $150.00 $1,005.56 56.7%
Task 3-A $550.00 $150.00 $358.14 65.1%
Task 3-B $800.00 $0.00 $480.00 60.0%
Task 3-C $425.00 $0.00 $167.42 39.4%
FinalReview
Summary Program Review Status
Contracts review: 11-30-02
Sign Off: _________________

Successfully Presenting Earned Value page 13
2005March April May
Summary Status Program Review CPI from 1 to 1.3
Completed Task Incomplete Task CPI above 1.3 CPI below 1
$0.00
$500.00
$1,000.00
$1,500.00
$2,000.00
$2,500.00
$3,000.00
PVEVBACAC
Performance ReviewProject/Tasks
TotalBudget
PlannedValue
ActualCosts
EarnedValue
PRCNTCMPLT
SV CV CPI SPI
Project ABC $2,975.0 $1,808.97 $1,575.00 $2,004.73 67.4% $195.77 $429.74 1.27 1.11
Task 1 $300.0 $300.00 $350.00 $300.00 100.0% $0.00 ($50.00) 0.86 1.00
Task 2 $400.0 $400.00 $400.00 $400.00 100.0% $0.00 $0.00 1.00 1.00
Task 3 $250.0 $133.72 $175.00 $139.53 55.8% $5.81 ($35.47) 0.80 1.04
Task 4 $725.0 $483.33 $200.00 $563.89 77.8% $80.56 $363.89 2.82 1.17
Task 5 $400.0 $200.00 $100.00 $210.53 52.6% $10.53 $110.53 2.11 1.05
Task 6 $350.0 $169.70 $200.00 $222.73 63.6% $53.03 $22.73 1.11 1.31
Task 7 $550.0 $122.22 $150.00 $168.06 30.6% $45.84 $18.06 1.12 1.38
Summary Status Program Review CPI from 1 to 1.3
Completed Task Incomplete Task CPI above 1.3 CPI below 1
Actual Cost
Budget
Earned Value
Schedule Variance = EV - PV Cost Variance = EV - AC Cost Performance Index = EV / AC Schedule Performance Index = EV / PV
Planned Value
Materials for further Earned Value Management research:
Fleming, Q., & Koppelman, J. (2000). Earned Value Project Management. 2nd Ed. Pennsylvania: Project Management Institute.
Lewis, J. (2000). The Project Manager’s Desk Reference. New York: McGraw-Hill.
Portny, S. (2001). Project Management for Dummies. New York: Hungry Minds, Inc.
KIDASA.com - Home of KIDASA Software, Inc., makers of Milestones Professional.
EarnedValueManagement.com - All about Earned Value. Defi nitions, examples, and more.
PMI.org - Home of the Project Management Institute, and a variety of PM resources.
Copyright ©2005 KIDASA Software, Inc. All rights reserved. www.kidasa.com. This publication may be distributed freely, as long as it is distributed in its entirety.