myelinationandaxonalelectricalactivitymodulatethe ... · pdf...
TRANSCRIPT

Cellular/Molecular
Myelination and Axonal Electrical Activity Modulate theDistribution and Motility of Mitochondria at CNS Nodes ofRanvier
Nobuhiko Ohno,1 Grahame J. Kidd,1 Don Mahad,1 Sumiko Kiryu-Seo,1 Amir Avishai,2 Hitoshi Komuro,1
and Bruce D. Trapp1
1Department of Neurosciences, Lerner Research Institute, Cleveland Clinic, Cleveland, Ohio 44195, and 2Department of Materials Science and Engineering,Case Western Reserve University, Cleveland, Ohio, 44106
Energy production presents a formidable challenge to axons as their mitochondria are synthesized and degraded in neuronal cell bodies.To meet the energy demands of nerve conduction, small mitochondria are transported to and enriched at mitochondrial stationary siteslocated throughout the axon. In this study, we investigated whether size and motility of mitochondria in small myelinated CNS axons aredifferentially regulated at nodes, and whether mitochondrial distribution and motility are modulated by axonal electrical activity. Thesize/volume of mitochondrial stationary sites was significantly larger in juxtaparanodal/internodal axoplasm than in nodal/paranodalaxoplasm. With three-dimensional electron microscopy, we observed that axonal mitochondrial stationary sites were composed ofmultiple mitochondria of varying length, except at nodes where mitochondria were uniformly short and frequently absent altogether.Mitochondrial transport speed was significantly reduced in nodal axoplasm compared with internodal axoplasm. Increased axonalelectrical activity decreased mitochondrial transport and increased the size of mitochondrial stationary sites in nodal/paranodalaxoplasm. Decreased axonal electrical activity had the opposite effect. In cerebellar axons of the myelin-deficient rat, whichcontain voltage-gated Na � channel clusters but lack paranodal specializations, axonal mitochondrial motility and stationary sitesize were similar at Na � channel clusters and other axonal regions. These results demonstrate juxtaparanodal/internodal enrich-ment of stationary mitochondria and neuronal activity-dependent dynamic modulation of mitochondrial distribution and trans-port in nodal axoplasm. In addition, the modulation of mitochondrial distribution and motility requires oligodendrocyte–axoninteractions at paranodal specializations.
IntroductionMyelination affects the function and morphology of axons. Byconfining voltage-gated Na� channels in the nodal axolemma,myelination facilitates rapid nerve conduction in an energy effi-cient manner (Ritchie, 1995; Waxman, 1995). Myelinated fiberscan be divided into four morphologically and biochemically dis-tinct segments (nodes, paranodes, juxtaparanodes, and inter-nodes) (Poliak and Peles, 2003; Trapp and Kidd, 2004). Nodes arethe short, unmyelinated axonal segments enriched for voltage-gated Na� channels, located between adjacent myelin inter-nodes. Nodes are flanked by paranodes, where adhesionmolecules form septate-like junctions that tether the myelin
sheath to the axon (Peles and Salzer, 2000; Bhat, 2003). Jux-taparanodal axolemma is the �15 �m region adjacent to theparanodes and is enriched for Na�/K� ATPases and voltage-gated K� channels (Mata et al., 1991; Waxman, 1995; Young etal., 2008). The remaining internodal region includes the majorityof the myelinated fiber and also contains Na�/K� ATPase. Fol-lowing activation of nodal Na� channels, the Na�/K� ATPasesrapidly exchange axoplasmic Na� for extracellular K� in anenergy-dependent manner to permit repetitive firing of axons.Based on the presence of Na�/K� ATPases and their close prox-imity to nodes (Young et al., 2008), juxtaparanodal regions ofCNS myelinated fibers appear to have the greatest potential forenergy utilization during saltatory nerve conduction.
Mitochondria are the major source of axonal ATP requiredfor repetitive propagation of action potentials by saltatory con-duction. Mammalian axons can extend a meter or more fromtheir neuronal cell bodies where the bulk of mitochondria areformed and degraded (Chang and Reynolds, 2006). The bulk ofaxonal mitochondria are located at stationary sites, axoplasmicareas occupied by single or multiple mitochondria that do notmove during the timeframe of imaging studies (Morris and Hol-lenbeck, 1995; Miller and Sheetz, 2004; Misgeld et al., 2007;Kiryu-Seo et al., 2010). The stationary sites are distributed
Received Jan. 6, 2011; revised March 28, 2011; accepted March 30, 2011.Author contributions: N.O., G.J.K., and B.D.T. designed research; N.O., G.J.K., D.M., S.K.S., and A.A. performed
research; H.K. contributed unpublished reagents/analytic tools; N.O., G.J.K., D.M., S.K.S., A.A., H.K., and B.D.T.analyzed data; N.O., G.J.K., and B.D.T. wrote the paper.
This work was supported by National Institutes of Health Grant NS38186 (to B.D.T.) and a National MultipleSclerosis Society Postdoctoral Fellowship (to N.O.). We thank Christopher Nelson for careful editorial assistance andAnsi Chang, Xinghua Yin, Danielle Klein, Erin Petrovic, and Nan Avishai for technical assistance. We also thank Dr.Loren L. Looger for information of GCaMP3.
Correspondence should be addressed to Bruce D. Trapp, Department of Neurosciences, Lerner Research Institute,Cleveland Clinic, 9500 Euclid Avenue, Cleveland, OH 44195. E-mail: [email protected].
DOI:10.1523/JNEUROSCI.0095-11.2011Copyright © 2011 the authors 0270-6474/11/317249-10$15.00/0
The Journal of Neuroscience, May 18, 2011 • 31(20):7249 –7258 • 7249

throughout the axon and are thought to be enriched at areas ofhigh energy consumption (Miller and Sheetz, 2004; Hollenbeckand Saxton, 2005; Chang and Reynolds, 2006). A less abundantpool of small motile mitochondria is transported to and from theneuronal cell body and stationary sites. Motile mitochondria mayfuse with stationary mitochondria and facilitate stationary mito-chondrial growth and/or turnover. Older dysfunctional segmentsof stationary mitochondria are removed by fission and degraded(Chang and Reynolds, 2006; Twig et al., 2008). To meet increasedenergy demands of nerve conduction, the size of stationary sitesand the speed of mitochondria transport are significantly in-creased following demyelination of axons (Kiryu-Seo et al.,2010). In addition, the speed of mitochondrial transport in am-phibian peripheral nervous system (PNS) nodal axoplasm is de-creased by neuronal activity in a Ca 2�-mediated manner (Zhanget al., 2010). However, knowledge of mitochondrial distribution,motility, and dynamics in myelinated axons is limited andwhether stationary mitochondria are enriched at nodes ofRanvier and/or modulated by electrical activity remains to beestablished.
We used mitochondria-targeted DsRed2 and confocal time-lapse imaging in organotypic slice cultures to examine mitochon-drial behavior in myelinated Purkinje cell axons under basal,enhanced, or inhibited neuronal activity. We also investigated thethree-dimensional distribution and ultrastructure of mitochon-dria in cerebellar and optic nerve myelinated axons in vivo. Ourresults establish a juxtaparanodal–internodal enrichment of mi-tochondrial stationary sites and a neuronal activity-dependentmodulation of mitochondrial distribution and transport in nodalaxoplasm. In addition, focal modulation of mitochondrial distri-bution and transport was absent from axons containing voltage-gated Na� channel clusters but lacking paranodal specializations.
Materials and MethodsSlice culture preparation, transfection of lentiviral vectors. Lentivirus withmitochondrial-targeted DsRed2 and GCaMP3 was prepared using apLenti6/V5 directional TOPO cloning kit (Invitrogen) according to themanufacturer’s protocol with slight modifications (Hirai, 2008). Briefly,293FT cells were transfected with pLentiV5/6 lentiviral vector includingMito-DsRed2 (Clontech) or GCaMP3 (Addgene) and packaging plas-mids. The medium was changed 4 h after the transfection. Viral super-natants were collected 24 h after the transfection, filtered with 0.22 �mPVDF membrane (Millipore), and centrifuged at 100,000 g for 2 h. Theviral pellet was resuspended in 1/100 volume of PBS. Cerebellar organo-typic slice cultures from male 10 d postnatal (P10) Sprague Dawley andmyelin-deficient (md) rats were cut at a thickness of 150 –200 �m, asdescribed previously (Stoppini et al., 1991). Slices from P10 pups werechosen because Purkinje cells survive and their axons undergo robustmyelination (Dusart et al., 1997). The slices were cultured on Millicellorganotypic culture inserts (Millipore) in six-well plates containing 50%minimal essential medium, 25% horse serum, 25% HBSS, 6 mg/mlD-glucose, 1� Glutamax (Invitrogen), and penicillin/streptomycin. Twohours after plating, the lentiviral vectors were injected into the Purkinjecell layer using a glass microinjection needle (Kasri et al., 2008).
Time-lapse imaging by confocal microscopy. Purkinje cell axons withDsRed2-positive mitochondria or cell bodies with GCaMP3 were imagedby confocal microscopy as reported previously (Kumada et al., 2006;Kiryu-Seo et al., 2010). Glass-bottom dishes with culture medium andpieces of Millicell membrane with attached slices were transferred intothe chamber of a micro-incubator (PDMI-2; Medical System) attachedto an inverted laser-scanning confocal microscope (TCS SP; Leica). Theslices were illuminated with 488 or 543 nm light through a 63� oil-immersion objective (NA, 1.32; Leica) and transmitted light and fluores-cence signals were detected. Images of mitochondria were collected at1024 � 1024 pixel resolution every 6 s. Imaging at 6 s intervals did notinduce mitochondrial fragmentation, acute mitochondrial swelling, or
cessation of axonal transport in �50 experiments and cell bodies andaxons remained healthy 3 d after imaging. We also restricted total obser-vation time to �20 min to minimize the possibility of phototoxic damageto the cells. In some experiments, bath application of 1 �M tetrodotoxin(TTX; Sigma) or 10 �M bicuculline methobromide (BCC; Alexis Bio-chemicals) was applied 15 min before live imaging.
Kymographs of mitochondria in time lapse images were producedusing ImageJ, as described previously (Miller and Sheetz, 2004). Motilemitochondria were identified as moving objects in movies and diagonallines in the kymographs. Mean velocity of motile mitochondria was mea-sured by dividing total displacement distance by total time in nodal (�10�m from nodes) and internodal (20-�40 �m from nodes) axoplasm.Within this 20-�m-long axoplasmic region, peak velocity of a mitochon-drion was defined as maximum velocity for specific 5-�m-long regions,and turn frequency was measured as described previously (Morris andHollenbeck, 1993; Wang and Schwarz, 2009). Stationary mitochondriawere identified as profiles without any displacement during the time-frame of our in vitro imaging studies and as vertical lines on the kymo-graphs. The pixel areas and lengths of DsRed2-positive profiles weremeasured with ImageJ software after thresholding. In measurements ofstationary mitochondria, one representative frame was used after exclud-ing out-of-focus regions and motile profiles. Variations in mitochondriastationary sites in nodal/paranodal, juxtaparanodal, and internodalaxoplasm were established for individual axons by normalizing mito-chondria size to the average mitochondria size for that axon. Casprimmunostaining established the location of the paranodal/nodalaxoplasm.
For GCaMP3 imaging analyses, the time-lapse changes of fluorescentintensity in Purkinje cell bodies before and after drug treatments weremeasured using ImageJ with Time Series Analyzer V2.0 (http://rsbweb.nih.gov/ij/plugins/time-series.html). The cell bodies were traced andmean fluorescent intensity in the cell bodies was measured. Frequency ofCa 2� transients was defined as the number of increase of fluorescentintensity (�F/F � 0.2), and amplitude of Ca 2� transients was defined aspeak �F/F of each Ca 2� transients.
Immunohistochemistry. For direct correlation of time-lapse imagesand immunostaining for nodal/paranodal markers, the observed sliceswere fixed with 4% paraformaldehyde in 0.1 M phosphate buffer for 3 himmediately after live imaging. The slices were immunostained as previ-ously described (Kiryu-Seo et al., 2010) with the following antibodies: ratanti-proteolipid protein (anti-PLP; Agmed), mouse anti-pan Nav(Sigma), mouse anti-Caspr1 (a gift from James S. Trimmer, University ofCalifornia, Davis, California). Immunostaining was visualized with sec-ondary antibodies conjugated with Alexa 488 or 647 (Invitrogen) and byconfocal microscopy (SP5; Leica).
Mitochondrial sizes in node–paranodal regions in fixed tissues. Slice cul-tures at 14 d in vitro (DIV) with DsRed-positive Purkinje cells weretreated with TTX, BCC, and BCC in combination with 10 �M BAPTA-AM, 5 mM EGTA, or 1 �M �-conotoxin MVIIC for 1 h, fixed with 4%paraformaldehyde for 3 h, and immunostained for Caspr and PLP asdescribed above. Caspr immunostaining defined the boundaries of theparanodal/nodal axoplasm and nodal–paranodal axoplasmic area andtheir DsRed profiles were measured in stacked images.
Serial ion ablation scanning electron microscopy. Tissue preparation andimaging were performed as previously described (Knott et al., 2008; Kiddet al., 2010). Rats and mice were perfused at postnatal day 30 withcacodylate-buffered 2.5% glutaraldehyde and 4% paraformaldehyde. Ratcerebellar white matter (three rats) was removed, postfixed with 1%tannic acid, and stained with buffered 0.4% OsO4 followed by aqueousuranyl acetate, then embedded in Durcupan resin. Mouse optic nerveswere treated with OsO4-ferricyanide, followed sequentially by thiocarbo-hydrazine, aqueous OsO4, aqueous uranyl acetate, and Walton’s leadaspartate stain, then embedded in Durcupan resin (Deerinck et al., 2010).Blocks were trimmed in a Leica ultramicrotome and longitudinally ori-ented white matter tracts were identified in 1-�m-thick sections. Sam-ples were imaged using either Nova-200 Nanolab or Helios 650 dualbeam FIB (FEI) systems using G2 or G3 Slice&View operating software,and serial images of the block face was generated by repeated cycles ofmilling (i.e., sample surface ablation) and imaging. Milling was per-
7250 • J. Neurosci., May 18, 2011 • 31(20):7249 –7258 Ohno et al. • Mitochondria in Myelinated Axons

formed with a 1 nA ion beam current. Images were acquired using a 2 kV(21– 84 pA) beam in high-resolution mode (immersion lens) using thethrough lens detector in backscattered electron mode. Sets of 250 –500images at �40 nm steps (i.e., milling depth) were obtained either at 6.5 or17 nm/pixel resolution, producing images �13 � 17 �m or 35 � 45 �mand 8 –20 �m deep. These imaging conditions were chosen to maximizeaxon sample length while still discerning individual mitochondria. At thelower resolution (17 nm/pixel), individual mitochondria were identifiedas oval or cigar-shaped organelles (�0.1 �m or greater in diameter) withstained matrix and unstained cristae cisternae. Each mitochondrion waspresent in several serial sections, which greatly enhanced their ultrastruc-tural identification. At high resolution (6.5 nm/pixel), classic mitochon-drial membranes and structure were evident in all sections. Images wereregistered, corrected for aspect ratio, and derivative stacks were gener-ated using ImageJ/FIJI software. Mitochondria and axons were tracedand analyzed using Reconstruct software (Fiala, 2005), with paranodaland nodal axoplasm traced separately to provide accurate volumes.
Where necessary, compensation for slice thick-ness disparity was made using the method ofFiala and Harris (2001). Distances and distri-butions were measured directly or calculatedusing 3D distance formulae. Axonal diameterswere calculated from length and volume dataassuming axons, nodal, and paranodal axoplasmwere cylinders, and mitochondria were cylinderswith a hemisphere at either end (cigar-shaped).Montage images were constructed from multiplesingle slices through the same axon (Kidd andHeath, 1988).
Statistical analysis. Statistical analysis wasperformed using SigmaStat (Aspire SoftwareInternational). Data were presented as mean �SEM or median with first and third quartile.Comparisons were made using the Mann–Whitney U test for rates of motile mitochon-dria, mitochondrial volume, mitochondrial/axonal volume ratio, and length of stationarymitochondria, and two-tailed Student’s t testfor number of motile mitochondria, sizes ofDsRed2 profiles, and percentage of nodal–paranodal axoplasm area occupied by DsRed.Multiple comparisons were made with Bonfer-roni correction. Time-lapse images were ob-tained from at least 10 slices from five rats foreach group. Data describing the percentage ofnodal–paranodal axoplasm area occupied byDsRed were obtained from at least five slicesfrom three rats for each group.
ResultsMitochondrial motility anddistribution in myelinated axonsMitochondrial distribution and motilitywere monitored in live myelinated rat Pur-kinje cell axons in cerebellar organotypicslice cultures obtained from P10 rat pups.The slices were transfected with lentiviralvectors carrying mitochondria-targetedDsRed2 and then maintained in vitro for14 d (Fig. 1a). Mito-DsRed2 is a soluble redfluorescent DsRed2 protein fused with acleavable mitochondria-targeting sequencefrom cytochrome c oxidase subunit VIIIand targeted to the mitochondrial ma-trix. DsRed2 was colocalized with all ax-onal mitochondria immunopositive forcytochrome c oxidase subunit I (data notshown). By 10 DIV, white matter tracts,
which contain myelinated Purkinje cell axons (Birgbauer et al.,2004), were macroscopically visible in the slice cultures (Fig. 1b). Thelentivirus specifically infected a small percentage of Purkinje cells(Fig. 1d, arrowhead), which project single DsRed2-positive axonsinto the white matter tracts (Fig. 1d, arrows). To identify the direc-tion of mitochondrial movement, we followed Purkinje cell axonsfrom the soma and time-lapse images of DsRed2 distribution andmotility were acquired. In these axons, 82% of the DsRed2-positivemitochondrial profiles were stationary. Motile mitochondrial move-ment was bidirectional and characterized by velocity changes andoccasional cessation of transport (Hollenbeck, 1996). The medianvelocity of mitochondrial movement was 0.25 �m/s (mean � SEM,0.36 � 0.4) in the anterograde direction and 0.23 �m/s (mean �SEM, 0.33 � 0.4) in the retrograde direction, comparable to axonaltransport rates reported previously in unmyelinated CNS axons
Figure 1. Time-lapse imaging of axonal mitochondria in cerebellar slice cultures. a, Schematic summary of experimentalapproach. b, c, P10 cerebellar slices are myelinated by 14DIV with microscopically apparent white matter (WM) and gray matter(GM). d, Purkinje cell soma are transfected with Mito-DsRed (arrowhead) and project DsRed-positive myelinated axons (arrows)into white matter. e, Time-lapse images of DsRed-labeled axonal mitochondria were obtained (d, box) and superimposed onimages of the same axon immunostained for the paranodal protein Caspr and the compact myelin protein PLP. f, g, A single framefrom the time-lapse imaging (f ) and a kymographic summary (g) of stationary (vertical black lines) and motile (diagonal lines)mitochondria within different regions of this myelinated axon. Paranodal loops are colored green in the kymograph (g). Scale bars:c, 50 �m; e, f, 10 �m. Antero, anterograde; Retro, retrograde.
Ohno et al. • Mitochondria in Myelinated Axons J. Neurosci., May 18, 2011 • 31(20):7249 –7258 • 7251
(Morris and Hollenbeck, 1993; Wang andSchwarz, 2009) and myelinated PNS axons(Kiryu-Seo et al., 2010). Multiple motile mi-tochondria often stopped or slowed at singleaxonal sites.
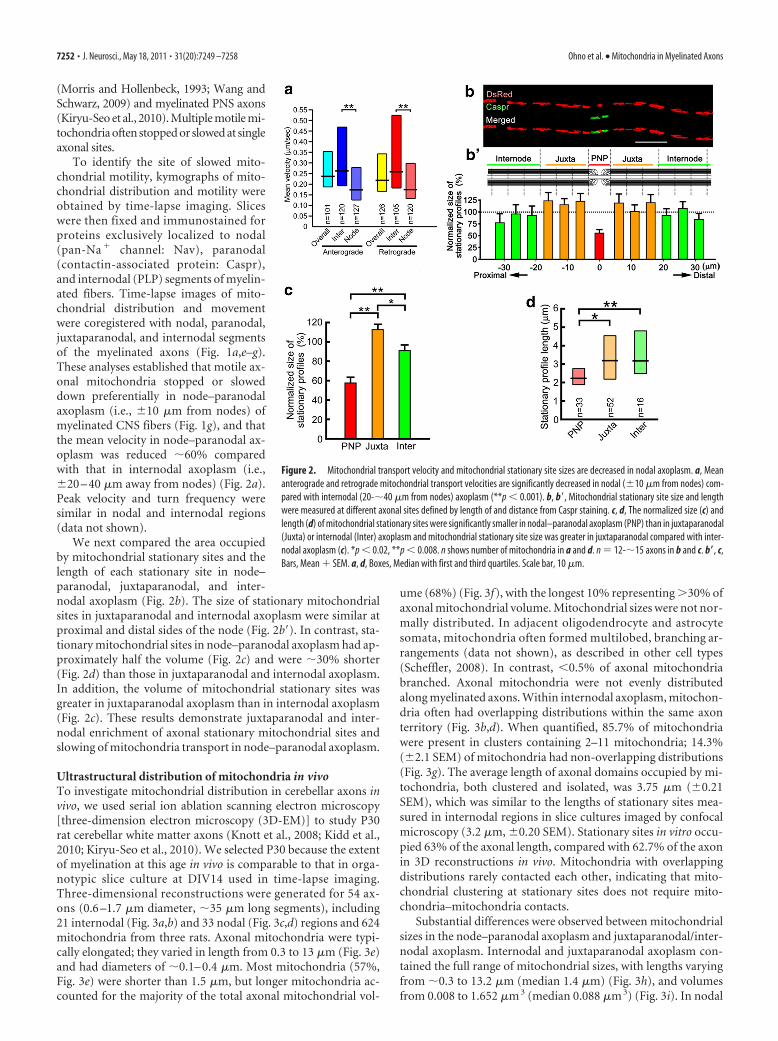
To identify the site of slowed mito-chondrial motility, kymographs of mito-chondrial distribution and motility wereobtained by time-lapse imaging. Sliceswere then fixed and immunostained forproteins exclusively localized to nodal(pan-Na � channel: Nav), paranodal(contactin-associated protein: Caspr),and internodal (PLP) segments of myelin-ated fibers. Time-lapse images of mito-chondrial distribution and movementwere coregistered with nodal, paranodal,juxtaparanodal, and internodal segmentsof the myelinated axons (Fig. 1a,e–g).These analyses established that motile ax-onal mitochondria stopped or sloweddown preferentially in node–paranodalaxoplasm (i.e., �10 �m from nodes) ofmyelinated CNS fibers (Fig. 1g), and thatthe mean velocity in node–paranodal ax-oplasm was reduced �60% comparedwith that in internodal axoplasm (i.e.,�20 – 40 �m away from nodes) (Fig. 2a).Peak velocity and turn frequency weresimilar in nodal and internodal regions(data not shown).
We next compared the area occupiedby mitochondrial stationary sites and thelength of each stationary site in node–paranodal, juxtaparanodal, and inter-nodal axoplasm (Fig. 2b). The size of stationary mitochondrialsites in juxtaparanodal and internodal axoplasm were similar atproximal and distal sides of the node (Fig. 2b�). In contrast, sta-tionary mitochondrial sites in node–paranodal axoplasm had ap-proximately half the volume (Fig. 2c) and were �30% shorter(Fig. 2d) than those in juxtaparanodal and internodal axoplasm.In addition, the volume of mitochondrial stationary sites wasgreater in juxtaparanodal axoplasm than in internodal axoplasm(Fig. 2c). These results demonstrate juxtaparanodal and inter-nodal enrichment of axonal stationary mitochondrial sites andslowing of mitochondria transport in node–paranodal axoplasm.
Ultrastructural distribution of mitochondria in vivoTo investigate mitochondrial distribution in cerebellar axons invivo, we used serial ion ablation scanning electron microscopy[three-dimension electron microscopy (3D-EM)] to study P30rat cerebellar white matter axons (Knott et al., 2008; Kidd et al.,2010; Kiryu-Seo et al., 2010). We selected P30 because the extentof myelination at this age in vivo is comparable to that in orga-notypic slice culture at DIV14 used in time-lapse imaging.Three-dimensional reconstructions were generated for 54 ax-ons (0.6 –1.7 �m diameter, �35 �m long segments), including21 internodal (Fig. 3a,b) and 33 nodal (Fig. 3c,d) regions and 624mitochondria from three rats. Axonal mitochondria were typi-cally elongated; they varied in length from 0.3 to 13 �m (Fig. 3e)and had diameters of �0.1– 0.4 �m. Most mitochondria (57%,Fig. 3e) were shorter than 1.5 �m, but longer mitochondria ac-counted for the majority of the total axonal mitochondrial vol-
ume (68%) (Fig. 3f), with the longest 10% representing �30% ofaxonal mitochondrial volume. Mitochondrial sizes were not nor-mally distributed. In adjacent oligodendrocyte and astrocytesomata, mitochondria often formed multilobed, branching ar-rangements (data not shown), as described in other cell types(Scheffler, 2008). In contrast, �0.5% of axonal mitochondriabranched. Axonal mitochondria were not evenly distributedalong myelinated axons. Within internodal axoplasm, mitochon-dria often had overlapping distributions within the same axonterritory (Fig. 3b,d). When quantified, 85.7% of mitochondriawere present in clusters containing 2–11 mitochondria; 14.3%(�2.1 SEM) of mitochondria had non-overlapping distributions(Fig. 3g). The average length of axonal domains occupied by mi-tochondria, both clustered and isolated, was 3.75 �m (�0.21SEM), which was similar to the lengths of stationary sites mea-sured in internodal regions in slice cultures imaged by confocalmicroscopy (3.2 �m, �0.20 SEM). Stationary sites in vitro occu-pied 63% of the axonal length, compared with 62.7% of the axonin 3D reconstructions in vivo. Mitochondria with overlappingdistributions rarely contacted each other, indicating that mito-chondrial clustering at stationary sites does not require mito-chondria–mitochondria contacts.
Substantial differences were observed between mitochondrialsizes in the node–paranodal axoplasm and juxtaparanodal/inter-nodal axoplasm. Internodal and juxtaparanodal axoplasm con-tained the full range of mitochondrial sizes, with lengths varyingfrom �0.3 to 13.2 �m (median 1.4 �m) (Fig. 3h), and volumesfrom 0.008 to 1.652 �m 3 (median 0.088 �m 3) (Fig. 3i). In nodal
Figure 2. Mitochondrial transport velocity and mitochondrial stationary site sizes are decreased in nodal axoplasm. a, Meananterograde and retrograde mitochondrial transport velocities are significantly decreased in nodal (�10 �m from nodes) com-pared with internodal (20-�40 �m from nodes) axoplasm (**p � 0.001). b, b�, Mitochondrial stationary site size and lengthwere measured at different axonal sites defined by length of and distance from Caspr staining. c, d, The normalized size (c) andlength (d) of mitochondrial stationary sites were significantly smaller in nodal–paranodal axoplasm (PNP) than in juxtaparanodal(Juxta) or internodal (Inter) axoplasm and mitochondrial stationary site size was greater in juxtaparanodal compared with inter-nodal axoplasm (c). *p � 0.02, **p � 0.008. n shows number of mitochondria in a and d. n 12-�15 axons in b and c. b�, c,Bars, Mean � SEM. a, d, Boxes, Median with first and third quartiles. Scale bar, 10 �m.
7252 • J. Neurosci., May 18, 2011 • 31(20):7249 –7258 Ohno et al. • Mitochondria in Myelinated Axons

axoplasm, the largest mitochondrion was only 1.9 �m long. Bothnodal and paranodal mitochondria were substantially shorterand smaller in volume than those in juxtaparanodal/internodalaxonal regions ( p � 0.001) (Figs. 3h,i). Nodal mitochondria werealso slightly smaller in diameter (median 0.21 �m in node vs 0.28in juxtanode/internode, p � 0.001 Mann–Whitney U test). Mi-tochondrial presence in nodal axoplasm was highly variable; 39%contained no mitochondria, 40% had a single mitochondrion,and 21% had 2–5 mitochondria (n 33 axons). Ratios of mito-chondrial volume (mVol) to axonal volume (aVol) have beenfrequently used to compare the concentration of mitochondria indifferent axonal regions. In P30 cerebellar nodal axoplasm, thepercentage of axonal volume occupied by mitochondria (mVol/aVol) values varied extensively (median 3.5%) (Fig. 3j), whichwas expected considering that 39% of nodes had no mitochon-
dria and 21% had multiple mitochondria. In addition, the re-duced axonal volume at the node skewed the ratios for the 61% ofnodes containing mitochondria toward higher mean values com-pare with juxtaparanodal and internodal axoplasm. Because ofthe large variability in nodal mVol/aVol values (median 3.5%),they were not significantly different from internodal values (Fig.3j). Paranodal axoplasm mVol/aVol values (median 3.3%), how-ever, showed less variation and were significantly reduced com-pared with juxtaparanodal (median, 7.4%) and internodal(median, 5.7%) regions ( p � 0.001, Mann–Whitney U test) (Fig.3j). These results indicate that mitochondrial size and presenceare differently regulated in nodal and paranodal axoplasm com-pared with juxtaparanodal and internodal axoplasm.
To test whether these results were due to species-specific ortract-specific properties of cerebellar white matter axons, we also
Figure 3. Mitochondria are not enriched in nodal axoplasm and stationary sites usually contain multiple mitochondria. a–l, The three-dimensional distribution of axonal mitochondrial wasdetermined by serial-section electron microscopy of rat cerebellar white matter (a–i) and mouse optic nerve (j–l ). a– d, Single sections (a, c) and 3D reconstructions of internodal (b) and nodal (d)regions of cerebellar myelinated axons (Ax). A node (c, N) is marked in the 3D reconstruction (d, box). e, f, Axonal mitochondrial lengths vary from �1 �m to �7 �m (e). Axonal mitochondrialonger than 4 �m represent �10% of the total axonal mitochondria (e), but �25% of the total axonal mitochondrial volume (f ). g, Internodal mitochondria (a, c, arrows; b, d, colored areas)frequently overlap and 86% are present in clusters of 2–11 mitochondria (Mito). h, i, Mitochondria in nodal and paranodal (PN) axoplasm are shorter (h) and smaller (i) than mitochondria injuxtaparanodal (Juxta) and internodal (Inter) axoplasm. j, The ratio of mitochondrial volume to axonal volume (mVol/aVol, expressed as a percentage) was highly variable in nodal axoplasm, andmany nodes (39%) lacked mitochondria. k, Mitochondria in mouse optic nerve axons were distributed similarly to those in myelinated cerebellar axons. l, Internodal mitochondria (arrows) wereabundant and 67% of nodes lacked mitochondria. g, Bars, Mean � SEM. h–j, Boxes, Median with first and third quartiles. *p � 0.001 Mann–Whitney U tests. a, c, Images montaged fromserial slices. Scale bars, 1 �m.
Ohno et al. • Mitochondria in Myelinated Axons J. Neurosci., May 18, 2011 • 31(20):7249 –7258 • 7253

examined P30 mouse optic nerve axons,using a staining regime that enhancesmembrane contrast. As illustrated in Fig-ure 3k, optic nerve axons at P30 were of asimilar dimension to those in cerebellarwhite matter (0.6 –1.6 �m diameter).Optic nerve mitochondria were longer(median length, 1.54 vs 1.27 �m in cer-ebellum; p � 0.016, n 173 vs 624) andlarger (median volume, 0.12 vs 0.08 �m 3;p � 0.003) than those in cerebellum, butthe differences in the two populationswere not extensive. Internodal mito-chondria had overlapping distributionsthat were similar in length to mitochon-drial clusters in cerebellar axons, indi-cating that stationary sites were alsocommon in optic nerve axons. A survey of21 optic nerve nodes indicated that only athird had mitochondria at nodal axo-plasm (Fig. 3l), which is consistent with aprevious stereological study that reporteda lack of mitochondria in the majority ofnodes in P60 mouse optic nerve (Edgar etal., 2008).
Neuronal activity modulatesmitochondria in nodal axoplasmPrevious studies suggested that neuronalactivation reduces mitochondrial motilityand recruits mitochondria to metaboli-cally active regions, such as presynapticterminals (Li et al., 2004; Macaskill et al.,2009). In addition, increased electricalactivity slows mitochondrial motility innodal axoplasm of amphibian myelinatedPNS axons (Zhang et al., 2010). To inves-tigate whether axonal electrical activitymodulates the distribution or motility ofmitochondria in myelinated CNS axons,we treated slice cultures with either TTX,which blocks voltage-dependent Na �
channels and eliminates axonal action po-tentials; or BCC, which blocks GABAA re-ceptors, suppresses IPSCs and increaseselectrical activity of Purkinje cells in slicecultures (Dupont et al., 2006; Gahwiler,1975). To confirm whether these drugs modulate Purkinje cellelectrical activity, we transfected Purkinje cells (DIV0) with alentiviral vector carrying the protein-based Ca 2� indicatorGCaMP3 (Tian et al., 2009) (Fig. 4a) and measured the frequencyand amplitude of Ca 2� transients (�F/F � 0.2) (Fig. 4b– d) be-fore and after treatment with TTX (Fig. 4e) or BCC (Fig. 4f) atDIV14. TTX treatment decreased and BCC treatment increasedthe frequency (Fig. 4g) and amplitude (data not shown) of Pur-kinje cell Ca 2� transients, confirming previous studies that re-ported decreased and increased axonal firing following thetreatment of cerebellar slices with TTX and BCC, respectively(Khaliq and Raman, 2005).
Following 15 min of TTX treatment, motile mitochondriastopped or slowed less frequently in node–paranodal axoplasm(Fig. 4h–h). As a result, the number of motile mitochondria innode–paranodal axoplasm increased and the mean mitochon-
drial speeds were significantly greater in electrically silent than inelectrically active control cultures (Fig. 4j,k). In addition, TTXtreatment significantly decreased the total size of mitochondriastationary sites in node–paranodal axoplasm (Fig. 4l). Con-versely, following 15 min of BCC treatment, the number of mo-tile mitochondria and the mean velocity of mitochondrialtransport were decreased in nodal axoplasm, but not in inter-nodal axoplasm (Fig. 4i–i,j,k). Furthermore, BCC treatmentincreased the total size of mitochondrial stationary sites in node–paranodal axoplasm, but not in juxtaparanodal (Fig. 4l) or inter-nodal axoplasm (data not shown). These studies support theconcept that increased axonal firing focally increases mitochon-drial stationary site size and decreases mitochondrial motility innode–paranodal axoplasm.
The recruitment and function of mitochondria at synapticterminals depends on Ca 2� (Li et al., 2004; Pardo et al., 2006;
Figure 4. Electrical activity and Ca 2� increase the size of mitochondrial stationary sites and decrease mitochondrial motility in nodalaxoplasm. Mitochondrial transport speed and distribution were investigated following TTX and BCC treatment. a– g, In a Purkinje cell bodyexpressing GCaMP3 (a), increase (b to c, arrowheads) and return (c to d, arrowheads) of fluorescent intensity show a Ca 2� transient. Thefrequency (and amplitude) of Ca 2� transients are decreased threefold by TTX (e) and increased twofold (f ) by BCC (g). h–j, Kymographs ofnodal axoplasm after TTX (h– h) and BCC (i–i) show the number of motile mitochondria is increased by TTX and unchanged by BCC (j).*p � 0.01; n 18 axons for each group. k, The speed of mitochondrial transport was significantly increased by TTX and significantlydecreased by BCC in nodal axoplasm but not in internodal axoplasm. *p0.03, **p�0.001; n, number of mitochondria marked on eachbar. l, TTX decreased and BCC increased mitochondrial stationary site size in nodal axoplasm, but not in juxtaparanodal axoplasm. *p 0.02, **p0.01, ***p�0.001. m, TTX also decreased and BCC increased the percentage nodal axoplasm area occupied by mitochondria.Ca 2� chelaters [EGTA, BAPTA-AM (BAP)] or a Ca 2� channel blocker [�-conotoxin MVIIC (OC)] eliminated the increase of nodal mitochon-dria size by BCC. #p � 0.05 compared with BCC alone, *p � 0.001; n number of fibers (l ) or nodes (m) examined. g, j,l, m, Bars, Mean � SEM. k, Boxes, Median with first and third quartiles. Cont, control; PNP, nodal–paranodal; Inter,internodal; Juxta, juxtaparanodal; Antero, anterograde; Retro, retrograde.
7254 • J. Neurosci., May 18, 2011 • 31(20):7249 –7258 Ohno et al. • Mitochondria in Myelinated Axons
Macaskill et al., 2009), which regulates the electrical activity-dependent decrease of mitochondrial motility in nodal axoplasmof amphibian PNS myelinated fibers (Zhang et al., 2010).Since it is most likely that stationary mitochondria are themajor source of axonal ATP, we examined whether neuronalactivity-dependent changes of mitochondrial stationary site sizein node–paranodal axoplasm are modulated by Ca 2�. In theseanalyses, we measured the percentage of axonal area occupied bymitochondria in node–paranodes to exclude the possibility thatthe differences of mitochondrial sizes are simply due to possiblevariance of node–paranodal axonal volume. Following TTXtreatment, the percentage of node–paranodal axonal area occu-pied by mitochondria was decreased (Fig. 4m). Conversely, fol-lowing BCC treatment, the percentage of node–paranodal axonalarea occupied by mitochondria was significantly increased (Fig.4m). When slices were treated with BCC in combination withBAPTA-AM (intracellular Ca 2� chelator), EGTA (Ca 2� chela-tor), or �-conotoxin MVIIC (P/Q- and N-type Ca 2� channelblocker), mitochondrial stationary site sizes in node–paranodalaxoplasm were significantly smaller compared with BCC treat-ment alone (Fig. 4m). The mitochondrial stationary site sizes innode–paranodal axoplasm following TTX and �-conotoxintreatment were similar to those following TTX treatment alone(data not shown). Given that voltage-dependent Ca 2� channelsare expressed in myelinated axons (Hillman et al., 1991; Alix etal., 2008), these results establish that increased axoplasmic Ca 2�
mediates increased stationary mitochondrial size in node–para-nodal axoplasm upon neuronal activation.
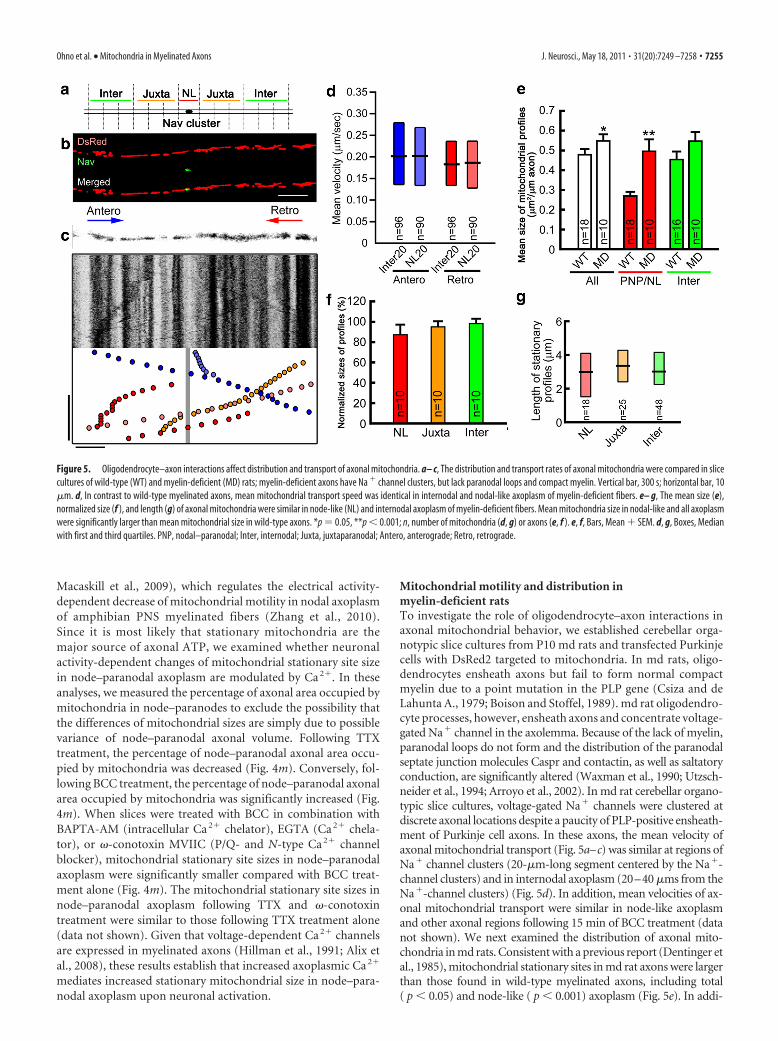
Mitochondrial motility and distribution inmyelin-deficient ratsTo investigate the role of oligodendrocyte–axon interactions inaxonal mitochondrial behavior, we established cerebellar orga-notypic slice cultures from P10 md rats and transfected Purkinjecells with DsRed2 targeted to mitochondria. In md rats, oligo-dendrocytes ensheath axons but fail to form normal compactmyelin due to a point mutation in the PLP gene (Csiza and deLahunta A., 1979; Boison and Stoffel, 1989). md rat oligodendro-cyte processes, however, ensheath axons and concentrate voltage-gated Na� channel in the axolemma. Because of the lack of myelin,paranodal loops do not form and the distribution of the paranodalseptate junction molecules Caspr and contactin, as well as saltatoryconduction, are significantly altered (Waxman et al., 1990; Utzsch-neider et al., 1994; Arroyo et al., 2002). In md rat cerebellar organo-typic slice cultures, voltage-gated Na� channels were clustered atdiscrete axonal locations despite a paucity of PLP-positive ensheath-ment of Purkinje cell axons. In these axons, the mean velocity ofaxonal mitochondrial transport (Fig. 5a–c) was similar at regions ofNa� channel clusters (20-�m-long segment centered by the Na�-channel clusters) and in internodal axoplasm (20–40 �ms from theNa�-channel clusters) (Fig. 5d). In addition, mean velocities of ax-onal mitochondrial transport were similar in node-like axoplasmand other axonal regions following 15 min of BCC treatment (datanot shown). We next examined the distribution of axonal mito-chondria in md rats. Consistent with a previous report (Dentinger etal., 1985), mitochondrial stationary sites in md rat axons were largerthan those found in wild-type myelinated axons, including total( p � 0.05) and node-like ( p � 0.001) axoplasm (Fig. 5e). In addi-
Figure 5. Oligodendrocyte–axon interactions affect distribution and transport of axonal mitochondria. a– c, The distribution and transport rates of axonal mitochondria were compared in slicecultures of wild-type (WT) and myelin-deficient (MD) rats; myelin-deficient axons have Na � channel clusters, but lack paranodal loops and compact myelin. Vertical bar, 300 s; horizontal bar, 10�m. d, In contrast to wild-type myelinated axons, mean mitochondrial transport speed was identical in internodal and nodal-like axoplasm of myelin-deficient fibers. e– g, The mean size (e),normalized size (f ), and length (g) of axonal mitochondria were similar in node-like (NL) and internodal axoplasm of myelin-deficient fibers. Mean mitochondria size in nodal-like and all axoplasmwere significantly larger than mean mitochondrial size in wild-type axons. *p 0.05, **p � 0.001; n, number of mitochondria (d, g) or axons (e, f ). e, f, Bars, Mean � SEM. d, g, Boxes, Medianwith first and third quartiles. PNP, nodal–paranodal; Inter, internodal; Juxta, juxtaparanodal; Antero, anterograde; Retro, retrograde.
Ohno et al. • Mitochondria in Myelinated Axons J. Neurosci., May 18, 2011 • 31(20):7249 –7258 • 7255

tion, stationary sites were similar in volume and length in node-likeand other axonal regions of md axons (Fig. 5f,g). The focal modula-tion of mitochondrial transport and distribution in node–paranodalaxoplasm appear to require oligodendrocyte–axon interaction atparanodal specializations.
DiscussionThe present study describes fundamental properties of mito-chondrial distribution and motility in myelinated CNS axons.Time-lapse imaging in vitro and three-dimensional ultrastruc-tural reconstructions in vivo establish that �90% of axonal mi-tochondrial are present in internodal stationary sites, whichconsist of multiple mitochondria that vary in length but not indiameter. In contrast, mitochondria in nodal and paranodal ax-oplasm were consistently small. In myelinated axons from ratcerebellum and mouse optic nerves, mitochondria were not en-riched in nodal axoplasm and were absent from 39% (cerebel-lum) and 66% (optic nerve) of nodes examined. Increased axonalfiring, however, increased mitochondrial stationary site size anddecreased the transport speed of mitochondrial transport in nod-al/paranodal but not internodal axoplasm. In these small diame-ter fibers, mitochondria are not enriched nor do they appear to bean absolute requirement for the nodal axoplasm. The presence ofmitochondria in nodal axoplasm, however, is dynamic and in-creases in response to axonal electrical activity coupled to in-creased axoplasmic Ca 2�.
Cerebellar organotypic slice cultures provide several advan-tages for investigating mitochondrial behavior in myelinated ax-ons. As described previously (Ross et al., 1962; Birgbauer et al.,2004), myelination is abundant; we show here that nodes of Ran-vier can be reliably coregistered in kymographs of living tissuesand immunostained fixed images. Purkinje cells can be selectivelytransfected with lentiviral vectors and their electrophysiologicalproperties, including their response to TTX and BCC, have beenpreviously described in detail (Gahwiler, 1975; Dupont et al.,2006; Kessler et al., 2008). The size and distribution of mitochon-drial stationary sites in myelinated axons were consistent withprevious studies (Morris and Hollenbeck, 1993; Hollenbeck,1996; Miller and Sheetz, 2004; Wang and Schwarz, 2009; Zhang etal., 2010) and stationary sites in myelinated axons in these slicecultures were comparable to those measured in vivo by 3D elec-tron microscopy and previously in PNS myelinated cultures(Kiryu-Seo et al., 2010). These results validate the cerebellar slicesystem for the examination of mitochondrial behavior in CNSmyelinated axons.
The juxtaparanodal–internodal enrichment of axonal mito-chondria was unexpected in light of the commonly stated viewthat mitochondria are enriched in nodal axoplasm (Hollenbeckand Saxton, 2005; Chang and Reynolds, 2006; Chen and Chan,2006). Based on our 3D-EM analysis, 39% of nodes in the cere-bellum and 68% of nodes in the optic nerve lacked axonal mito-chondria. Similar results have been reported previously: 36% (3of 8) of cat ventral root nodes and 44% (4 of 9) of dorsal rootnodes lacked mitochondria (Berthold et al., 1993); in rat spinalroots, “it was common to find nodes with no mitochondria pres-ent and just as common to observe nodes with several mitochon-dria in the compact axoplasmic region” (Perkins and Ellisman,2011); the majority of paranodal/nodal complexes in P60 mouseoptic nerve and spinal cord dorsal columns were devoid of mito-chondria (Edgar et al., 2008); and 30% (3 of 10) of nodes in thecat spinal cord lacked mitochondria (Fabricius et al., 1993). Col-lectively, all EM studies show that mitochondria are not obliga-tory or essential components of the nodal axoplasm. The concept
of nodal enrichment of mitochondria was largely based on com-parisons involving the ratio of mitochondrial volume to axonalvolume. Because axonal diameters are constricted at the node(i.e., nodal axoplasm volume is small), the mVol/aVol value ishigh for those fibers that contained nodal mitochondria and zerowhen nodal mitochondria are not present. Nodal mVol/aVol val-ues are thus are not normally distributed and, when averagedacross multiple axons, their mean values may be very misleading.For example, in the present study, the average nodal mVol/aVol(10.2%) was 1.3 times the internodal average, whereas the me-dian value (a more appropriate nonparametric measure of cen-trality) was 0.6 times that of internodal regions (Fig. 3j).Although mitochondria are not enriched in nodal axoplasm,many nodes do contain mitochondria. Their presence may de-pend on multiple factors, including electrical activity and fibertract location. As demonstrated by our cerebellum– optic nervecomparisons, the percentage of nodes containing mitochondriacan vary in different CNS fiber tracts and may also differ betweenCNS and PNS axons (Perkins and Ellisman, 2011).
The bulk of mitochondrial volume resides in the longer mito-chondrial stationary sites in internodes, suggesting that mostATP within axons is generated there. We have recently reportedthat axonal Na�-K�-ATPases are absent from nodal and paran-odal axolemmae and are enriched in juxtaparanodal and inter-nodal axolemmae (Young et al., 2008). The juxtaparanodalenrichment of mitochondrial stationary sites, therefore, is likelyto reflect the energy demands of saltatory conduction by myelin-ated axons. Since mitochondria are the major source of ATP, theinternodal enrichment of stationary mitochondria helps facilitateaxonal transport, which is also energy-dependent. Due to therapid repolarization of the axolemma, it is unlikely that inter-nodal Na�-K�-ATPases and mitochondria play a significant rolein repolarizing the axolemma during saltatory conduction. Insupport of this hypothesis, manipulation of axonal electrical ac-tivity in myelinated axons had no effect on stationary mitochon-drial site size or transport speed of motile mitochondria ininternodal segments of myelinated axons. This stands in contrastto demyelination, which increased both the speed of axonaltransport and the size of stationary mitochondrial sites in allregions of formerly myelinated axons (Kiryu-Seo et al., 2010).These mitochondrial changes are likely to result from the diffusedistribution of voltage-gated Na� channels on demyelinated ax-olemmae and the increased energy demands of nonsaltatory ax-onal conduction (Trapp and Stys, 2009).
Internodal stationary sites contained multiple and often largemitochondria, which collectively account for �90% of the mito-chondrial volume in axons. Larger axonal mitochondria were notmobile in our imaging studies. In contrast to internodal mito-chondria, our results demonstrate that mitochondria in nodalaxoplasm are dynamically regulated by voltage-gated Na� chan-nel activity. This is apparent at basal firing rates of Purkinje cellaxons in slice cultures as mitochondrial motility is significantlydecreased in nodal/paranodal axoplasm compared with jux-taparanodal/internodal axoplasm. It remains to be determinedwhether the decreased mean velocity in nodal/paranodal axo-plasm is caused by an actual decrease in transport speed and/or anincrease in transitory transport stops that cannot be detected byin vitro imaging at 6 s intervals. A similar decrease in mitochon-drial motility in nodal axoplasm was reported in amphibian PNSmyelinated internodes (Zhang et al., 2010). We confirm and ex-tend this observation by establishing that increased electrical ac-tivity not only decreases the speed of motile mitochondria, butalso increases the size of mitochondrial stationary sites in node–
7256 • J. Neurosci., May 18, 2011 • 31(20):7249 –7258 Ohno et al. • Mitochondria in Myelinated Axons

paranodal axoplasm, but not internodal axoplasm, of myelinatedCNS axons. Furthermore, we show that reduced or abolishedaxonal activity in TTX-treated cultures increases mitochondrialmotility and decreases the size of mitochondrial stationary sitesin node–paranodal axoplasm. Although these alterations shouldbe confirmed in vivo, our observations establish a connectionbetween transport rates of motile mitochondria and stationarymitochondrial site size in vitro. Increased electrical activity andNa� channel activation slows mitochondrial transport and in-creases mitochondrial stationary site size. It is likely, therefore,that Na� channel activity regulates mitochondrial transportand/or mitochondrial fusion/fission.
A possible link between mitochondrial transport and mito-chondrial stationary site size at nodes of Ranvier is increasedaxoplasmic Ca 2�, which has been implicated in activity-dependent mitochondrial recruitment to synaptic terminals inneurons (Li et al., 2004; Macaskill et al., 2009). A recent study infrog sciatic nerve correlated increased axonal firing, elevated axo-plasmic Ca 2�, and reduced mitochondrial transport in nodalaxoplasm of amphibian peripheral nerves (Zhang et al., 2010).We extend these observations by demonstrating that removal ofextracellular Ca 2� by EGTA or pharmacologically blocking P/Q-and N-type axonal Ca 2� channels mitigates the effects of in-creased axonal electrical activity in reducing mitochondrialtransport and increasing the size of mitochondrial stationary sitesin node–paranodal axoplasm. The functions of axoplasmic Ca 2�
are diverse, as it can directly modify mitochondrial-related pro-teins or indirectly affect mitochondria by activating kinases andphosphatases. Ca 2� can enhance mitochondrial energy produc-tion by modulating mitochondrial aspartate– glutamate carriersand multiple dehydrogenases, including �-ketoglutarate dehy-drogenase (Pardo et al., 2006; Gellerich et al., 2010). Ca 2� canreduce mitochondrial transport by binding to the mitochondrialRho GTPase (Miro) and regulating Miro’s interaction with themicrotubule motor kinesin-1 (Saotome et al., 2008; Macaskill etal., 2009; Wang and Schwarz, 2009). Ca 2� can also shorten mi-tochondria by augmenting fission (Han et al., 2008). It remains tobe determined whether mitochondria that accumulate in thenode–paranodal axoplasm in response to increased electrical ac-tivity fuse to form larger stationary mitochondria and/or repre-sent accumulation of motile mitochondria.
Axonal degeneration is the major cause of permanent neuro-logical disability in primary diseases of myelin (Trapp and Nave,2008). Myelination affects axons in many ways, including mod-ulation of axonal cytoskeleton. In addition, axonal pathologiesthat precede axonal degeneration in inherited diseases of myelinare manifested first and most abundantly in paranodal regions(Nave and Trapp, 2008). These paranodal pathologies includedecreased phosphorylation of neurofilaments and reduced ax-onal diameters in MAG-null mice (Yin et al., 1998) and alteredaxonal transport in CNP- and PLP-null mice (Lappe-Siefke et al.,2003; Edgar et al., 2004). It is likely, therefore, that mitochondrialtransport and distribution are modulated by oligodendrocyte–axon interactions at paranodal loops. In support of this hypoth-esis, mutations of the septate junction-specific protein Casprcause impaired paranodal junctions and abnormal distributionand morphology of mitochondria in paranodal axoplasm(Garcia-Fresco et al., 2006; Sun et al., 2009). Our studies of md ratcerebellar axons further support this hypothesis and establishthat voltage-gated Na� channel clusters are not sufficient to gen-erate node-like behavior of axonal mitochondrial transport ordistribution. The studies described in this report therefore set thestage for investigating posttranslational modifications of axonal
molecules that are modulated by paranodal loops and activity ofvoltage-gated Na� channels.
ReferencesAlix JJ, Dolphin AC, Fern R (2008) Vesicular apparatus, including func-
tional calcium channels, are present in developing rodent optic nerveaxons and are required for normal node of Ranvier formation. J Physiol586:4069 – 4089.
Arroyo EJ, Xu T, Grinspan J, Lambert S, Levinson SR, Brophy PJ, Peles E,Scherer SS (2002) Genetic dysmyelination alters the molecular architec-ture of the nodal region. J Neurosci 22:1726 –1737.
Berthold CH, Fabricius C, Rydmark M, Andersen B (1993) Axoplasmic or-ganelles at nodes of Ranvier. I. Occurrence and distribution in large my-elinated spinal root axons of the adult cat. J Neurocytol 22:925–940.
Bhat MA (2003) Molecular organization of axo-glial junctions. Curr OpinNeurobiol 13:552–559.
Birgbauer E, Rao TS, Webb M (2004) Lysolecithin induces demyelination invitro in a cerebellar slice culture system. J Neurosci Res 78:157–166.
Boison D, Stoffel W (1989) Myelin-deficient rat: a point mutation in exonIII (A—-C, Thr75—-Pro) of the myelin proteolipid protein causes dys-myelination and oligodendrocyte death. EMBO J 8:3295–3302.
Chang DT, Reynolds IJ (2006) Mitochondrial trafficking and morphologyin healthy and injured neurons. Prog Neurobiol 80:241–268.
Chen H, Chan DC (2006) Critical dependence of neurons on mitochondrialdynamics. Curr Opin Cell Biol 18:453– 459.
Csiza CK, de Lahunta A (1979) Myelin deficiency (md): a neurologic mu-tant in the Wistar rat. Am J Pathol 95:215–224.
Deerinck TJ, Bushong EA, Lev-Ram V, Shu X, Tsien RY, Ellisman MH(2010) Enhancing serial block-face scanning electron microscopy to en-able high resolution 3-D nanohistology of cells and tissues. Microsc Mi-croanal 16:1138 –1139.
Dentinger MP, Barron KD, Csiza CK (1985) Glial and axonal developmentin optic nerve of myelin deficient rat mutant. Brain Res 344:255–266.
Dupont JL, Fourcaudot E, Beekenkamp H, Poulain B, Bossu JL (2006) Syn-aptic organization of the mouse cerebellar cortex in organotypic slicecultures. Cerebellum 5:243–256.
Dusart I, Airaksinen MS, Sotelo C (1997) Purkinje cell survival and axonalregeneration are age dependent: an in vitro study. J Neurosci17:3710 –3726.
Edgar JM, McLaughlin M, Yool D, Zhang SC, Fowler JH, Montague P, BarrieJA, McCulloch MC, Duncan ID, Garbern J, Nave KA, Griffiths IR (2004)Oligodendroglial modulation of fast axonal transport in a mouse modelof hereditary spastic paraplegia. J Cell Biol 166:121–131.
Edgar JM, McCulloch MC, Thomson CE, Griffiths IR (2008) Distributionof mitochondria along small-diameter myelinated central nervous systemaxons. J Neurosci Res 86:2250 –2257.
Fabricius C, Berthold CH, Rydmark M (1993) Axoplasmic organelles atnodes of Ranvier. II. Occurrence and distribution in large myelinatedspinal cord axons of the adult cat. J Neurocytol 22:941–954.
Fiala JC (2005) Reconstruct: a free editor for serial section microscopy. JMicrosc 218:52– 61.
Fiala JC, Harris KM (2001) Extending unbiased stereology of brain ultra-structure to three-dimensional volumes. J Am Med Inform Assoc 8:1–16.
Gahwiler BH (1975) The effects of GABA, picrotoxin and bicuculline on thespontaneous bioelectric activity of cultured cerebellar Purkinje cells.Brain Res 99:85–95.
Garcia-Fresco GP, Sousa AD, Pillai AM, Moy SS, Crawley JN, Tessarollo L,Dupree JL, Bhat MA (2006) Disruption of axo-glial junctions causescytoskeletal disorganization and degeneration of Purkinje neuron axons.Proc Natl Acad Sci U S A 103:5137–5142.
Gellerich FN, Gizatullina Z, Trumbeckaite S, Nguyen HP, Pallas T, Arandar-cikaite O, Vielhaber S, Seppet E, Striggow F (2010) The regulation ofOXPHOS by extramitochondrial calcium. Biochim Biophys Acta1797:1018 –1027.
Han XJ, Lu YF, Li SA, Kaitsuka T, Sato Y, Tomizawa K, Nairn AC, Takei K,Matsui H, Matsushita M (2008) CaM kinase I alpha-induced phosphor-ylation of Drp1 regulates mitochondrial morphology. J Cell Biol182:573–585.
Hillman D, Chen S, Aung TT, Cherksey B, Sugimori M, Llinas RR (1991)Localization of P-type calcium channels in the central nervous system.Proc Natl Acad Sci U S A 88:7076 –7080.
Ohno et al. • Mitochondria in Myelinated Axons J. Neurosci., May 18, 2011 • 31(20):7249 –7258 • 7257
Hirai H (2008) Progress in transduction of cerebellar Purkinje cells in vivousing viral vectors. Cerebellum 7:273–278.
Hollenbeck PJ (1996) The pattern and mechanism of mitochondrial trans-port in axons. Front Biosci 1:d91–102.
Hollenbeck PJ, Saxton WM (2005) The axonal transport of mitochondria.J Cell Sci 118:5411–5419.
Kasri NN, Govek EE, Van Aelst L (2008) Characterization of oligophrenin-1, aRhoGAP lost in patients affected with mental retardation: lentiviral injectionin organotypic brain slice cultures. Methods Enzymol 439:255–266.
Kessler M, Kiliman B, Humes C, Arai AC (2008) Spontaneous activity inPurkinje cells: multi-electrode recording from organotypic cerebellarslice cultures. Brain Res 1218:54 – 69.
Khaliq ZM, Raman IM (2005) Axonal propagation of simple and complexspikes in cerebellar Purkinje neurons. J Neurosci 25:454 – 463.
Kidd GJ, Heath JW (1988) Double myelination of axons in the sympatheticnervous system of the mouse. II. Mechanisms of formation. J Neurocytol17:263–276.
Kidd GJ, Avishai A, Yin X, Trapp BD (2010) Three-dimensional analysis ofoptic nerve axons using a focused ion beam-based approach. MicroscopyToday 18:18 –22.
Kiryu-Seo S, Ohno N, Kidd GJ, Komuro H, Trapp BD (2010) Demyelina-tion increases axonal stationary mitochondrial size and the speed of ax-onal mitochondrial transport. J Neurosci 30:6658 – 6666.
Knott G, Marchman H, Wall D, Lich B (2008) Serial section scanning elec-tron microscopy of adult brain tissue using focused ion beam milling.J Neurosci 28:2959 –2964.
Kumada T, Lakshmana MK, Komuro H (2006) Reversal of neuronal migra-tion in a mouse model of fetal alcohol syndrome by controlling second-messenger signalings. J Neurosci 26:742–756.
Lappe-Siefke C, Goebbels S, Gravel M, Nicksch E, Lee J, Braun PE, GriffithsIR, Nave KA (2003) Disruption of Cnp1 uncouples oligodendroglialfunctions in axonal support and myelination. Nat Genet 33:366 –374.
Li Z, Okamoto K, Hayashi Y, Sheng M (2004) The importance of dendriticmitochondria in the morphogenesis and plasticity of spines and synapses.Cell 119:873– 887.
Macaskill AF, Rinholm JE, Twelvetrees AE, Arancibia-Carcamo IL, Muir J,Fransson A, Aspenstrom P, Attwell D, Kittler JT (2009) Miro1 is a cal-cium sensor for glutamate receptor-dependent localization of mitochon-dria at synapses. Neuron 61:541–555.
Mata M, Fink DJ, Ernst SA, Siegel GJ (1991) Immunocytochemical demon-stration of Na�,K(�)-ATPase in internodal axolemma of myelinatedfibers of rat sciatic and optic nerves. J Neurochem 57:184 –192.
Miller KE, Sheetz MP (2004) Axonal mitochondrial transport and potentialare correlated. J Cell Sci 117:2791–2804.
Misgeld T, Kerschensteiner M, Bareyre FM, Burgess RW, Lichtman JW(2007) Imaging axonal transport of mitochondria in vivo. Nat Methods4:559 –561.
Morris RL, Hollenbeck PJ (1993) The regulation of bidirectional mitochon-drial transport is coordinated with axonal outgrowth. J Cell Sci104:917–927.
Morris RL, Hollenbeck PJ (1995) Axonal transport of mitochondria alongmicrotubules and F-actin in living vertebrate neurons. J Cell Biol131:1315–1326.
Nave KA, Trapp BD (2008) Axon-glial signaling and the glial support ofaxon function. Annu Rev Neurosci 31:535–561.
Pardo B, Contreras L, Serrano A, Ramos M, Kobayashi K, Iijima M, Saheki T,Satrustegui J (2006) Essential role of aralar in the transduction of smallCa2� signals to neuronal mitochondria. J Biol Chem 281:1039 –1047.
Peles E, Salzer JL (2000) Molecular domains of myelinated axons. CurrOpin Neurobiol 10:558 –565.
Perkins GA, Ellisman MH (2011) Mitochondrial configurations in periph-eral nerve suggest differential ATP production. J Struct Biol 173:117–127.
Poliak S, Peles E (2003) The local differentiation of myelinated axons atnodes of Ranvier. Nat Rev Neurosci 4:968 –980.
Ritchie JM (1995) Physiology of axons. In: The axon (Waxman SG, KocsisJD, Stys PK, eds), pp 68 –96. New York: Oxford UP.
Ross LL, Bornstein MB, Lehrer GM (1962) Electron microscopic observa-tions of rat and mouse cerebellum in tissue culture. J Cell Biol 14:19 –30.
Saotome M, Safiulina D, Szabadkai G, Das S, Fransson A, Aspenstrom P,Rizzuto R, Hajnoczky G (2008) Bidirectional Ca2�-dependent controlof mitochondrial dynamics by the Miro GTPase. Proc Natl Acad Sci U S A105:20728 –20733.
Scheffler IE (2008) Mitochondria. Hoboken, NJ: Wiley.Stoppini L, Buchs PA, Muller D (1991) A simple method for organotypic
cultures of nervous tissue. J Neurosci Methods 37:173–182.Sun XY, Takagishi Y, Okabe E, Chishima Y, Kanou Y, Murase S, Mizumura K,
Inaba M, Komatsu Y, Hayashi Y, Peles E, Oda S, Murata Y (2009) Anovel Caspr mutation causes the shambling mouse phenotype by disrupt-ing axoglial interactions of myelinated nerves. J Neuropathol Exp Neurol68:1207–1218.
Tian L, Hires SA, Mao T, Huber D, Chiappe ME, Chalasani SH, Petreanu L,Akerboom J, McKinney SA, Schreiter ER, Bargmann CI, Jayaraman V,Svoboda K, Looger LL (2009) Imaging neural activity in worms, fliesand mice with improved GCaMP calcium indicators. Nat Methods6:875– 881.
Trapp BD, Kidd GJ (2004) Structure of the myelinated axon. In: Myelinbiology and disorders (Lazzarini R, ed), pp 3–25. San Diego: Elsevier.
Trapp BD, Nave KA (2008) Multiple sclerosis: an immune or neurodegen-erative disorder? Annu Rev Neurosci 31:247–269.
Trapp BD, Stys PK (2009) Virtual hypoxia and chronic necrosis of demyeli-nated axons in multiple sclerosis. Lancet Neurol 8:280 –291.
Twig G, Elorza A, Molina AJ, Mohamed H, Wikstrom JD, Walzer G, Stiles L,Haigh SE, Katz S, Las G, Alroy J, Wu M, Py BF, Yuan J, Deeney JT, CorkeyBE, Shirihai OS (2008) Fission and selective fusion govern mitochon-drial segregation and elimination by autophagy. EMBO J 27:433– 446.
Utzschneider DA, Archer DR, Kocsis JD, Waxman SG, Duncan ID (1994)Transplantation of glial cells enhances action potential conduction ofamyelinated spinal cord axons in the myelin-deficient rat. Proc Natl AcadSci U S A 91:53–57.
Wang X, Schwarz TL (2009) The mechanism of Ca2�-dependent regula-tion of kinesin-mediated mitochondrial motility. Cell 136:163–174.
Waxman SG (1995) Voltage-gated ion channels in axons: localization, func-tion, and development. In: The axon (Waxman SG, Kocsis JD, Stys PK,eds), pp 218 –243. New York: Oxford UP.
Waxman SG, Black JA, Duncan ID, Ransom BR (1990) Macromolecularstructure of axon membrane and action potential conduction in myelindeficient and myelin deficient heterozygote rat optic nerves. J Neurocytol19:11–28.
Yin X, Crawford TO, Griffin JW, Tu P, Lee VM, Li C, Roder J, Trapp BD(1998) Myelin-associated glycoprotein is a myelin signal that modulatesthe caliber of myelinated axons. J Neurosci 18:1953–1962.
Young EA, Fowler CD, Kidd GJ, Chang A, Rudick R, Fisher E, Trapp BD(2008) Imaging correlates of decreased axonal Na �/K � ATPase inchronic multiple sclerosis lesions. Ann Neurol 63:428 – 435.
Zhang CL, Ho PL, Kintner DB, Sun D, Chiu SY (2010) Activity-dependentregulation of mitochondrial motility by calcium and Na/K-ATPase atnodes of Ranvier of myelinated nerves. J Neurosci 30:3555–3566.
7258 • J. Neurosci., May 18, 2011 • 31(20):7249 –7258 Ohno et al. • Mitochondria in Myelinated Axons