mwwg presentation use of precipitation duration data from weather radar in leaf wetness duration...
TRANSCRIPT
MWWG Presentation
Use of Precipitation Duration Data from Weather Radar in Leaf
Wetness Duration Estimates for Plant Disease Management
MSc. Thesis, University of Guelph
Tracy RowlandsonIowa State University
MWWG Presentation
Outline• Introduction• Background• Study Objectives• Use of radar rainfall estimates in disease
management schemes• Radar indication of daily rainfall occurrence• Conclusions and future work
MWWG Presentation
Introduction• Decisions regarding fungicide spray timings
are often based on leaf wetness duration (LWD) and temperature during that period
• < 1 mm of rain will remain on a leaf
• Occurrence is more important than quantity
• Rain events are spatially diverse so data captured by a rain gauge is site-specific
MWWG Presentation
Background• Common disease management schemes include
TomCast and MelCast
• Require input of LWD and average temperature in order to estimate disease index values
• Empirical and physical models have been developed to predict LWD
• Physical models based on the concept of energy budgets
MWWG Presentation
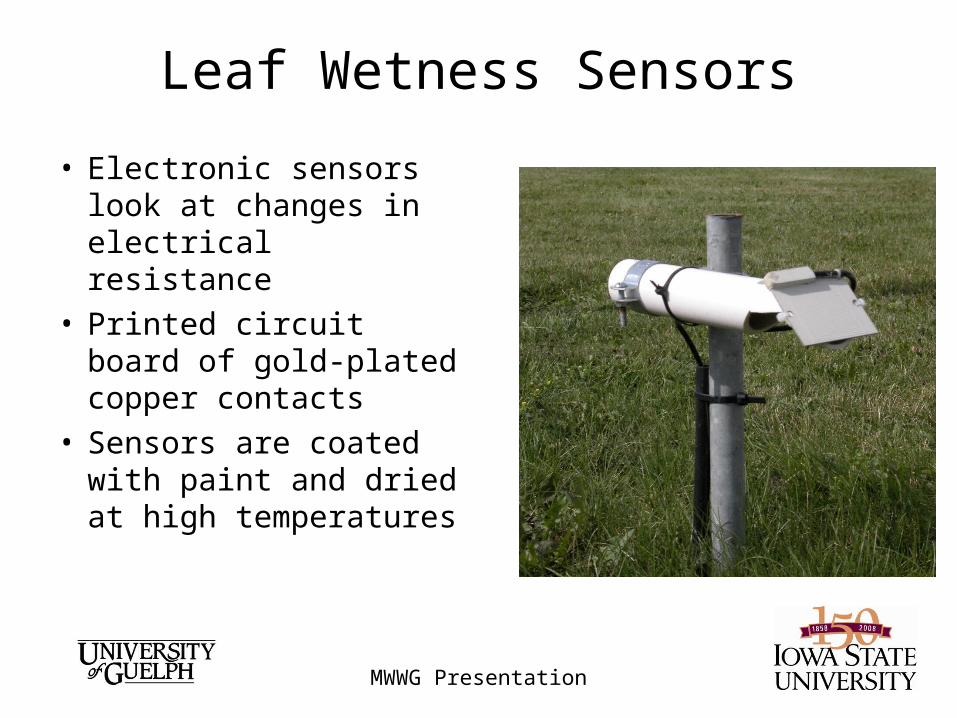
Leaf Wetness Sensors
• Electronic sensors look at changes in electrical resistance
• Printed circuit board of gold-plated copper contacts
• Sensors are coated with paint and dried at high temperatures
MWWG Presentation
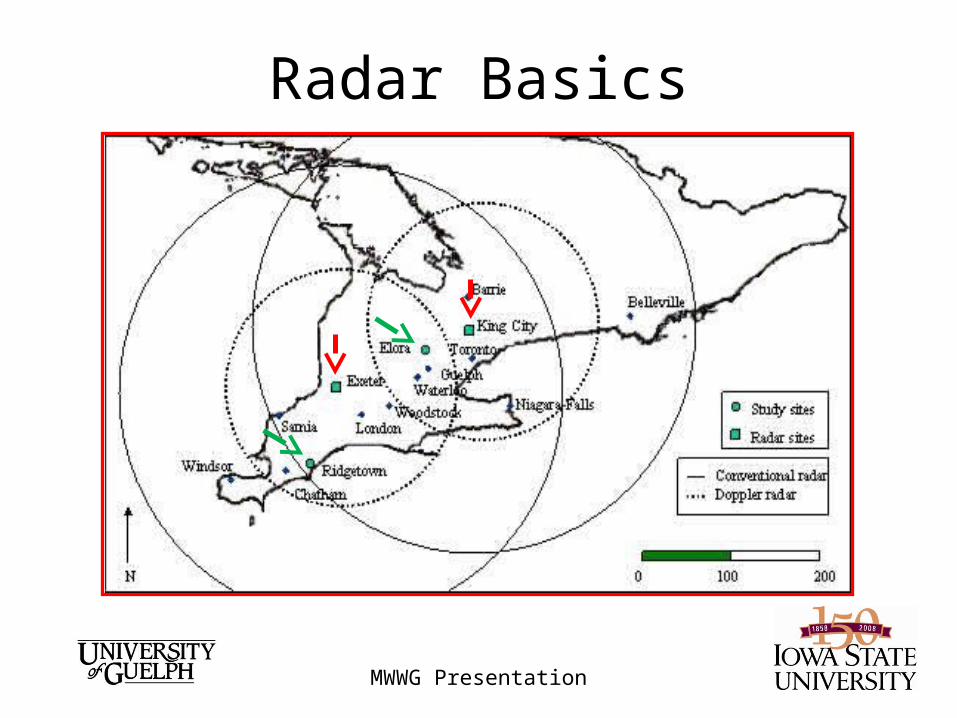
Radar Basics
MWWG Presentation
Study Objectives
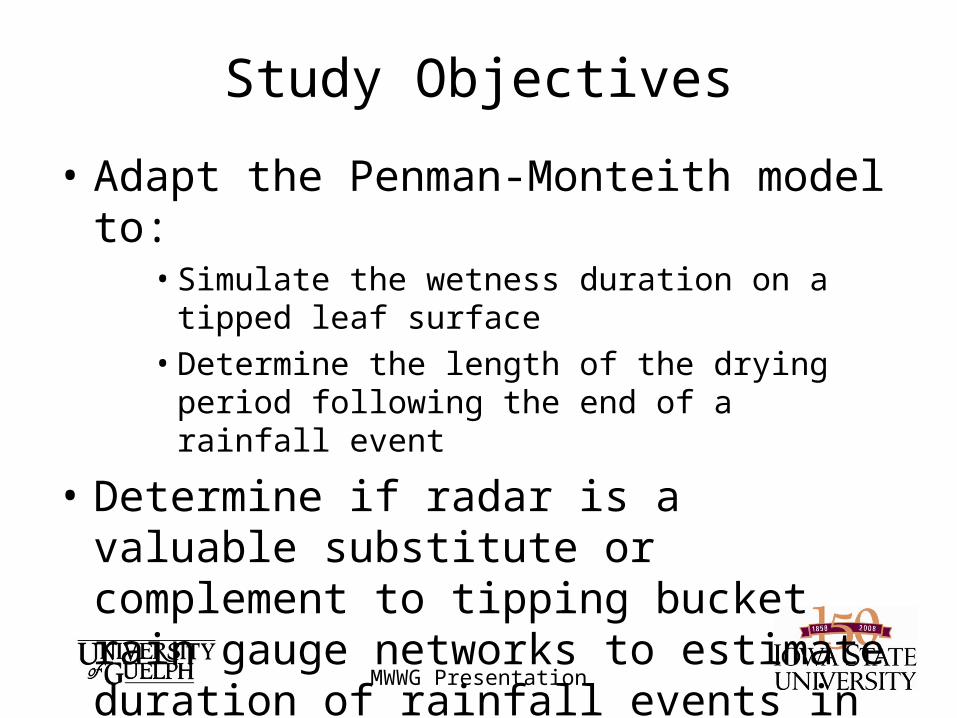
• Adapt the Penman-Monteith model to:• Simulate the wetness duration on a tipped leaf
surface• Determine the length of the drying period following
the end of a rainfall event
• Determine if radar is a valuable substitute or complement to tipping bucket rain gauge networks to estimate duration of rainfall events in disease management.
MWWG Presentation
Disease Index EstimationsMethodology
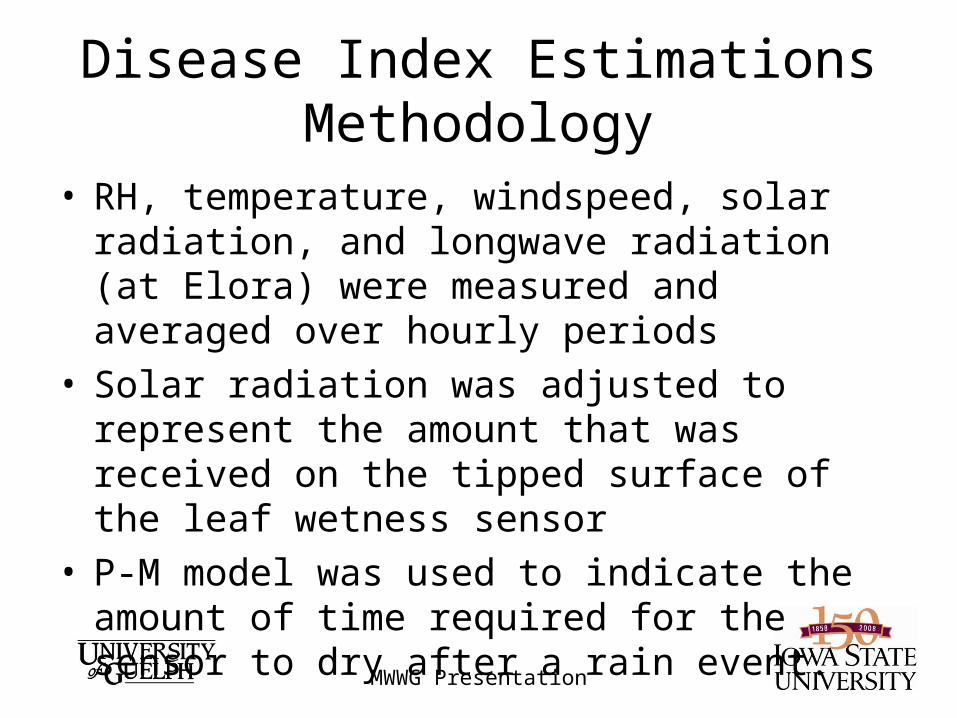
• RH, temperature, windspeed, solar radiation, and longwave radiation (at Elora) were measured and averaged over hourly periods
• Solar radiation was adjusted to represent the amount that was received on the tipped surface of the leaf wetness sensor
• P-M model was used to indicate the amount of time required for the sensor to dry after a rain event.
MWWG Presentation
Disease Index EstimationsMethodology
• Radar Duration = combination of rainfall duration indicated by the radar, and the drying time indicated by the P-M model
• TBRG Duration = combination of rainfall duration indicated by the TBRG, and the drying time indicated by the P-M model

MWWG Presentation
• When rain was indicated by the radar, the rain event was given a 0.6mm value in the rain reservoir the hour following the indicated rain
• The duration of the wetness period was determined
• Mean temperature during the wetness period was calculated
• If a break in the wetness period was 2 hours or greater, the wetness event was separated into two events
Disease Index EstimationsMethodology
MWWG Presentation
Disease Index EstimationsMethodology
• If the wetness event was longer than 24 hours, a break in the wetness event was enforced
• Disease severity values (DSV’s) and Environmental Favorability Indices (EFI’s) were calculated on a daily basis beginning at 1100 and ending 1100 the following day
• If a wetness event extends beyond 1100, the user can extend the period to 1400 (for a maximum wetness duration of 27 hours)
MWWG Presentation
Disease Index EstimationsMethodology
• DSV/EFI accumulations were made using both conventional and Doppler radars
• At Elora, estimations were made using all 4 radars
• At Ridgetown, range limitations of the King City Doppler radar prevented it from being used
• DSV’s/EFI’s were also calculated using rainfall from TBRG at Elora and Ridgetown
• Leaf wetness sensor was considered to be the best indicator of LWD and was used as the basis for comparison

MWWG Presentation
Radar Basics
MWWG Presentation
0 10 20 30 40 50 60 70
TBRG
KC
KD
EC
ED
Sensor
Duration (Hours)
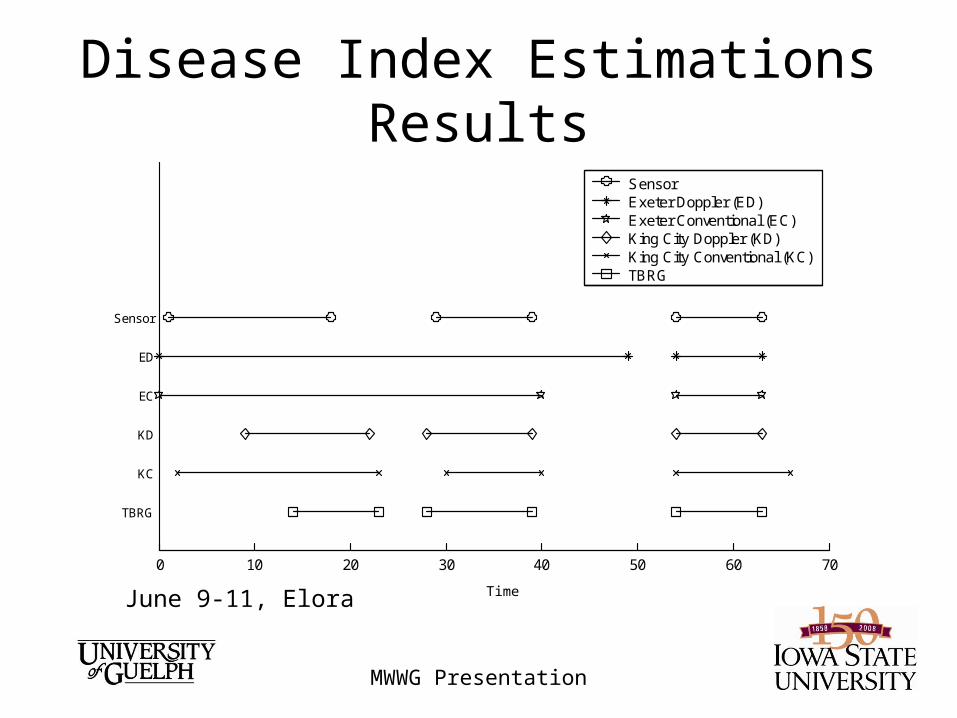
SensorExeter Doppler (ED)Exeter Conventional (EC)King City Doppler (KD)King City Conventional (KC)TBRG
Disease Index EstimationsResults
June 9-11, Elora Time

MWWG Presentation
Disease Index Estimations - Results
June 9Duration (hours)
Avg. Temp.TomCast
DSV
MelCast
EFI
Sensor 19 17.3 2 4
Exeter conventional
21 17.5 3 6
Exeter Doppler
21 17.5 3 6
King City conventional
22 16.4 3 4
King City Doppler
14 14.3 1 1
TBRG 7 13.1 1 1
DSV and EFI calculations at Elora
MWWG Presentation
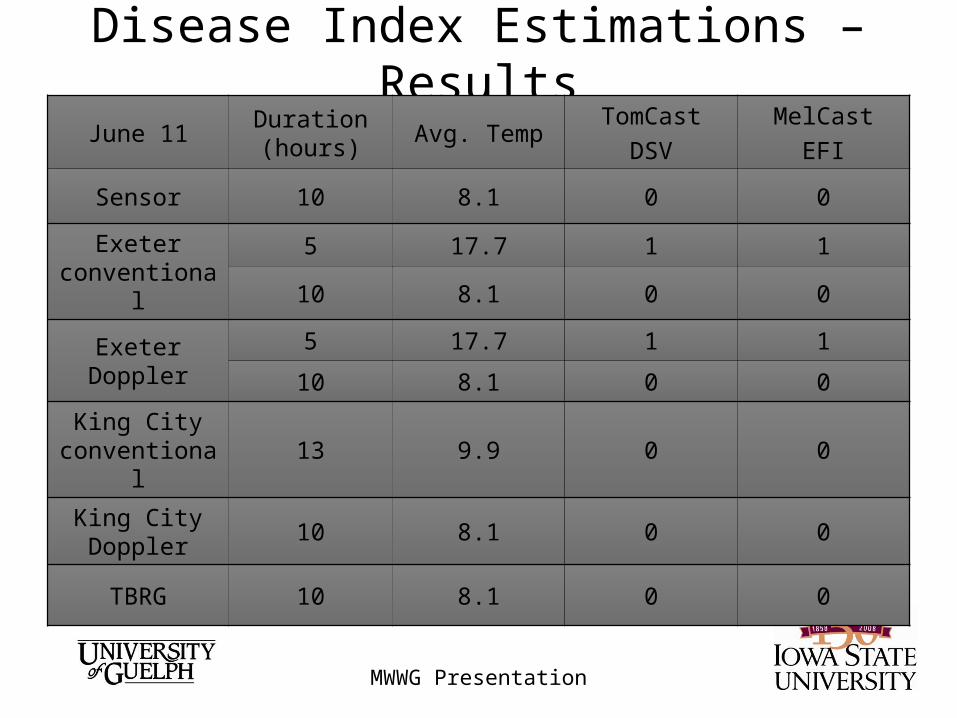
Disease Index Estimations – Results
June 11Duration (hours)
Avg. TempTomCast
DSV
MelCast
EFI
Sensor 10 8.1 0 0
Exeter conventional
5 17.7 1 1
10 8.1 0 0
Exeter Doppler5 17.7 1 1
10 8.1 0 0
King City conventional
13 9.9 0 0
King City Doppler
10 8.1 0 0
TBRG 10 8.1 0 0
MWWG Presentation
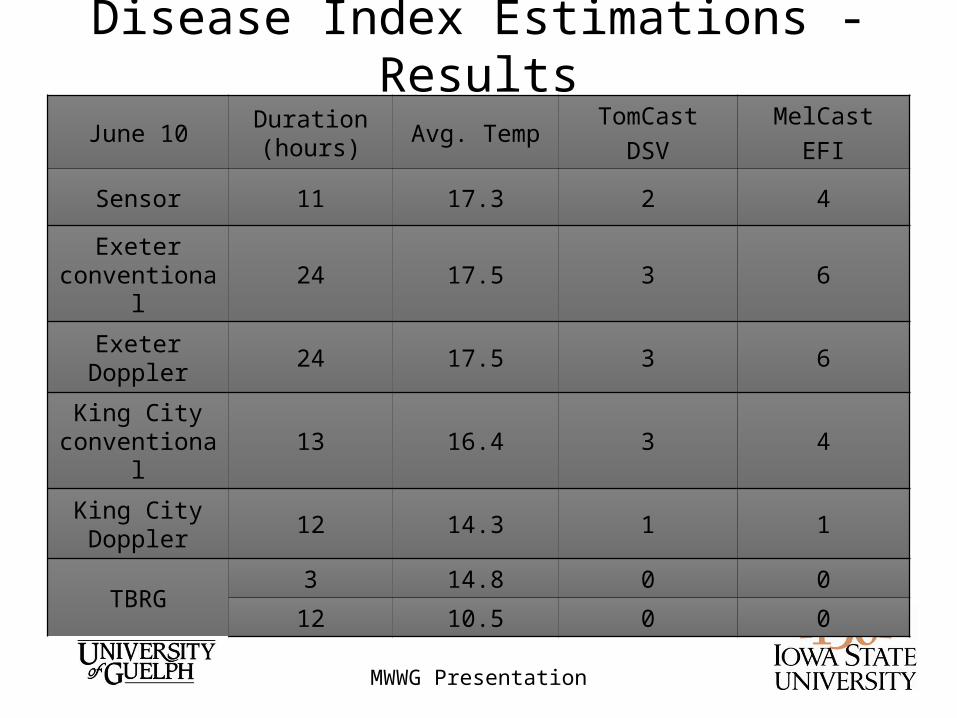
Disease Index Estimations - Results
June 10Duration (hours)
Avg. TempTomCast
DSV
MelCast
EFI
Sensor 11 17.3 2 4
Exeter conventional
24 17.5 3 6
Exeter Doppler 24 17.5 3 6
King City conventional
13 16.4 3 4
King City Doppler
12 14.3 1 1
TBRG3 14.8 0 0
12 10.5 0 0
MWWG Presentation
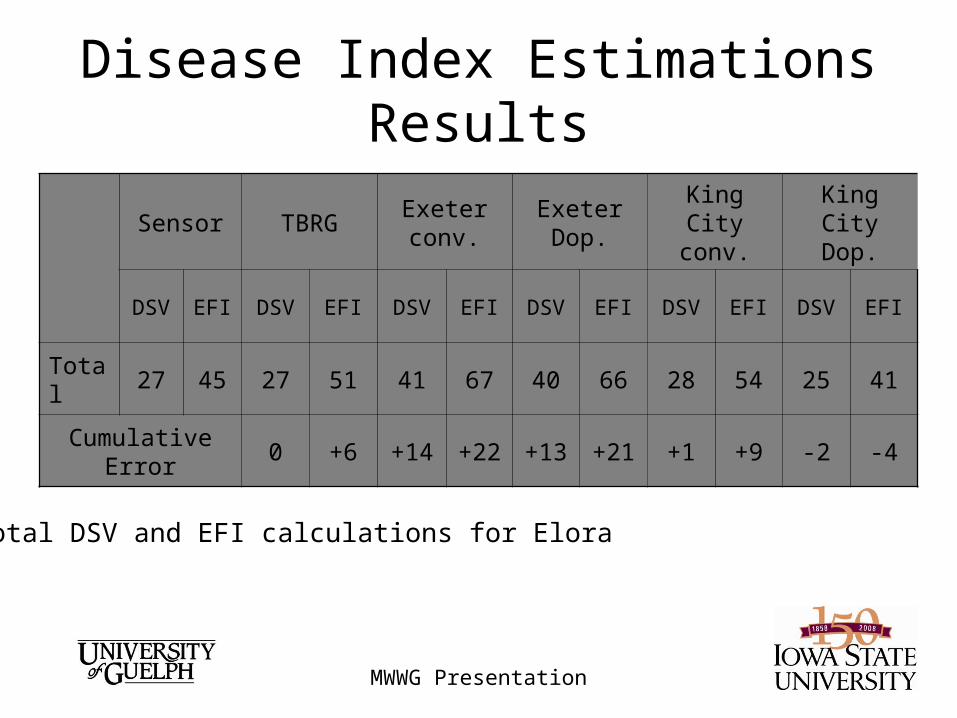
Disease Index EstimationsResults
Sensor TBRGExeter conv.
Exeter Dop.
King City conv.
King City Dop.
DSV EFI DSV EFI DSV EFI DSV EFI DSV EFI DSV EFI
Total 27 45 27 51 41 67 40 66 28 54 25 41
Cumulative Error 0 +6 +14 +22 +13 +21 +1 +9 -2 -4
Total DSV and EFI calculations for Elora
MWWG Presentation
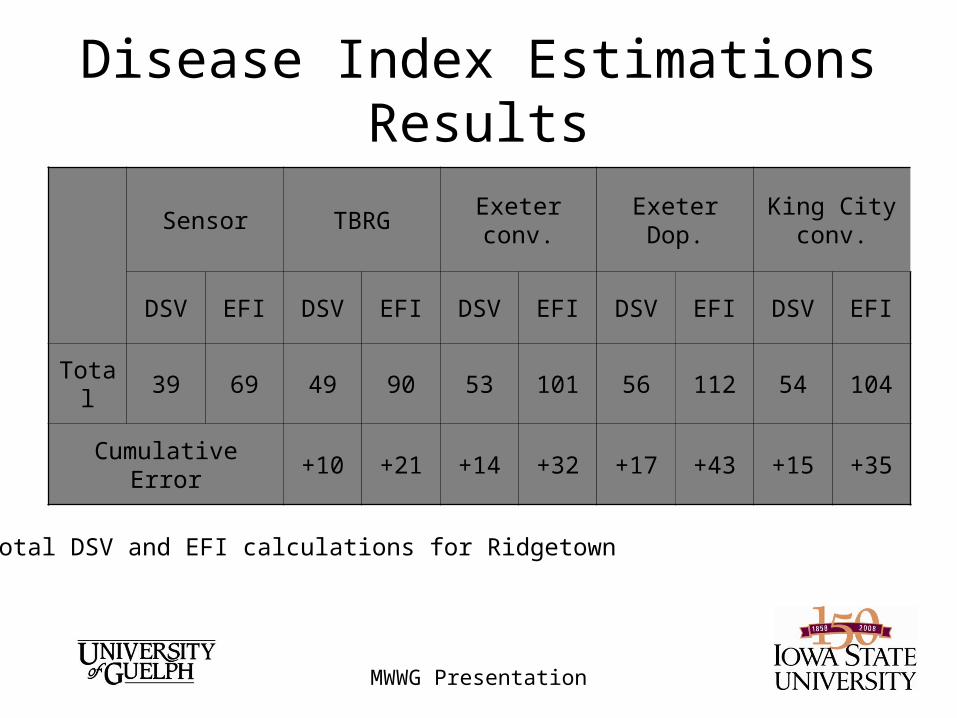
Disease Index EstimationsResults
Sensor TBRG Exeter conv. Exeter Dop.King City
conv.
DSV EFI DSV EFI DSV EFI DSV EFI DSV EFI
Total 39 69 49 90 53 101 56 112 54 104
Cumulative Error +10 +21 +14 +32 +17 +43 +15 +35
Total DSV and EFI calculations for Ridgetown
MWWG Presentation
Disease Index EstimationsConclusions
• Errors due to excessively long wet periods• Radar indicates rainfall for too long• Overestimation of the length of drying time when
radar indicates sporadic rainfall
• Rating of the radars• At Elora, the King City radars were the most
capable of mimicking the sensor• At Ridgetown, the Exteter conventional and King
City conventional radars faired the best
MWWG Presentation
Study Conclusions
• Study objective: Determine if radar is a valuable substitute or complement to tipping bucket rain gauge networks in plant disease management schemes
• Radar rainfall estimates should be used as a complement
• The allowable window for error in MelCast is too small for the use of radar rainfall estimates
• TBRG and P-M model mimicked sensor quite well• Use of radar for as a check for interpolation should
be done with caution
MWWG Presentation
Future Research Advancements• User could establish an automated system
that tests various threshold values for current weather conditions or daily estimate.
• Radar rainfall estimates could be used to determine if a TBRG is installed correctly, need calibration or maintenance or has been tampered with.
• Further investigation into the use of radar rainfall estimates in the timing of fungicides sprays.

MWWG Presentation
Questions?