(mw) satellite remote si fp iiisensing of precipitation -...
TRANSCRIPT

(MW) Satellite Remote S i f P i i iSensing of Precipitation
Ralph FerraroRalph Ferraro
NOAA/NESDISNOAA/NESDISCollege Park, MD USAg ,
Ralph R Ferraro@noaa [email protected]
11 October 2010 IPWG/EUMETSAT Satellite Training Workshop - Hamburg, Germany 1

11 October 2010 IPWG/EUMETSAT Satellite Training Workshop - Hamburg, Germany 2
O tliOutline
IR Methodsod Visible and near IR methods Passive Microwave Emission Methods
P i e Mi o e S tte ing Method Passive Microwave Scattering Methods Integrated Satellite Methods Integrated Satellite Methods References
11 October 2010 IPWG/EUMETSAT Satellite Training Workshop - Hamburg, Germany 3

fRemote Sensing of Precipitation Depends upon spectral response of precipitation to wavelength being
utilized Cloud tops motion changes – IR Cloud tops, motion, changes – IR Cloud texture - vis Cloud droplets and ice particles – vis, near IR, IR, MW
P i it ti h MW Precipitation phase - MW
Depends if passive or activep p Radiometer Radar
Depends on satellite type (POES or GOES) Spatial and temporal sampling
Depends on nature of system Tropical vs. high-latitude
11 October 2010 IPWG/EUMETSAT Satellite Training Workshop - Hamburg, Germany 4
p g Summer vs. winter

Satellites
Geostationary Satellites: are in orbit 22,238 miles above the equator which means they orbit at the sameabove the equator, which means they orbit at the same speed as the Earth's rotation, keeping them above the
E h U S i llisame spot on Earth. U.S. geostationary satellites are called "GOES" for Geostationary
•Polar (or Low Earth) Orbiting Satellites: orbit over th N th d S th l b t 530 il b ththe North and South poles about 530 miles above the Earth. Their lower orbits mean their view is more limited, but they have a more close-up view. Commonly referred to as “POES” or “LEO”
11 October 2010 IPWG/EUMETSAT Satellite Training Workshop - Hamburg, Germany 5

GOES Vi ibl IGOES Visible Imagery
11 October 2010 IPWG/EUMETSAT Satellite Training Workshop - Hamburg, Germany 6

GOES IR IGOES IR Imagery
11 October 2010 IPWG/EUMETSAT Satellite Training Workshop - Hamburg, Germany 7
Ad t f Vi /IR SAdvantages of Vis/IR Sensors High Temporal Sampling
15 60 min tes 15 – 60 minutes Storm evolution Storm movement Flash flood events Flash flood events
High Spatial Resolution 1-4 km (could be less, e.g., MODIS) Small scale features Small scale features
Stream/River basins for flash flood/hydrological models
11 October 2010 IPWG/EUMETSAT Satellite Training Workshop - Hamburg, Germany 8

IR M th dIR Methods Most simple approach is to use IR cloud top temperatures to infer rain
rate The higher the cloud top the heavier the rain is The higher the cloud top, the heavier the rain is
Not a bad assumption in convective systems with little horizontal shear (e.g., tropics)
GOES Precipitation Index (GPI) – Arkin and Meisner, 1987p ( ) , TB<235 K indicator of tropical rainfall
Shortfalls Non-convective systems (winter time); a lot of cirrus not associated with rainfall Strong shearing convective systems
Mislocation of precipitation Non-physical relationship between cloud top temperatures and surface rainfall
Th th d th t t t l k t There are methods that try to look at: Trends in the IR temperatures: NESDIS Auto-Estimator, Vicente et al, 1998,
BAMS Moisture environment (dry or moist): NESDIS AE Corrections using surface radar/gauges, topography, stability indicies, etc.:
NESDIS Hydro-Estimator, Scofield and Kuligowski, 2003
11 October 2010 IPWG/EUMETSAT Satellite Training Workshop - Hamburg, Germany 9

GOES 10 7 d i tGOES 10.7 µm and rain rate
R = 1.1183*10**(11) * exp [-3.6382 10**(-2) * T**(1.2)]
11 October 2010 IPWG/EUMETSAT Satellite Training Workshop - Hamburg, Germany 10

Vi ibl d IR th dVisible and near IR methods Precipitation clouds can be detected by textural
affects brightness evolution etc from visibleaffects, brightness, evolution, etc from visible imagery Difficulties in quantifying such approaches due to sun Difficulties in quantifying such approaches due to sun
angle variations, sensor changes, etc. Lead towards subjective, interpretative methodsLead towards subjective, interpretative methods
NIR channels Sensitive to cloud droplet sizes in absence of cirrus Sensitive to cloud droplet sizes in absence of cirrus
clouds Attractive for “warm rain” processes Attractive for warm rain processes
No ice phase Orographic rainfall
11 October 2010 IPWG/EUMETSAT Satellite Training Workshop - Hamburg, Germany 11
g p

d l hVis and IR Algorithms: GMSRA
GMSRA=GOES Multi-Spectral Rainfall AlgorithmUses Data from 4 Different Channels: Uses Data from 4 Different Channels: Visible (0.69 μm)—discriminate between thin
(nonraining) cirrus and thicker (raining) clouds(nonraining) cirrus and thicker (raining) clouds “Short” IR Window (3.9-μm)—use reflectivity to
identify clouds that are warm but have large particlesidentify clouds that are warm but have large particles near cloud-top and are thus producing rain
Water Vapor (6 7-μm)—warm signature above Water Vapor (6.7 μm) warm signature above overshooting cloud tops differentiates from cirrus
IR Window (10.7-μm)—texture screening of cirrus IR Window (10.7 μm) texture screening of cirrus clouds (low texture=cirrus; high texture=rain) and calculation of rainfall rate (but dependent only on
11 October 2010 IPWG/EUMETSAT Satellite Training Workshop - Hamburg, Germany 12
value at pixel of interest)

U f MODIS d t Ch t l (2007)Use of MODIS data: Chen et al. (2007)
MODIS=Moderate Resolution Imaging Spectroradiometer (MODIS) onboard NASA’s Terra and Aqua satellites 36 channel vis/NIR/IR sensor 36 channel vis/NIR/IR sensor EUMETSAT’s MSG-SEVERI contains many of these channels NOAA’s GOES-R ABI (Advanced Baseline Imager) will contain many of
MODIS channelsMODIS channels NIR channels are used during daytime to sense cloud droplet
reflectanceC t N i l d Caveat – No cirrus clouds
Drop effective radius (DER) Use 1.6 µm, 2.1 µm, and 3.7 µm
Various cloud absorption properties at these wavelengths allows for DER profiling 3.7 µm cloud top 1.6 µm cloud base
La ge d ops at bottom indicate d i le o light ain Larger drops at bottom indicate drizzle or light rain Important in certain climate regimes
11 October 2010 IPWG/EUMETSAT Satellite Training Workshop - Hamburg, Germany 13

mean std
0 08
0.12
ccur
renc
e
Raining 14.95 3.28Non-raining 11.48 2.78
0.04
0.08
obab
ility
of O
c
5 10 15 20 25 300
Pro
Droplet Effective Radius at Cloud Top(m)
0.12
0.16
nce
Raining 19.48 5.12Non-raining 12.50 3.46
mean std
0.08
0.12
lity
of O
ccur
re
0
0.04
Pro
babi
11 October 2010 IPWG/EUMETSAT Satellite Training Workshop - Hamburg, Germany 14
5 10 15 20 25 300
Droplet Effective Radius at Cloud Base(m)

Ad t f MW SAdvantages of MW Sensors
All Weather capability – can see through l d ( lik i ibl d IR)clouds (unlike visible and IR)
“Reasonable” data volume (but has poorer Reasonable data volume (but has poorer spatial resolution than VIS/IR)
Can fly on polar orbiters – global coverage (but not high temporal resolution like GOES(but not high temporal resolution like GOES satellites)
11 October 2010 IPWG/EUMETSAT Satellite Training Workshop - Hamburg, Germany 15

MW R i f ll Si tMW Rainfall Signatures
Over ocean low emissivity of ocean surface allows us to Over ocean, low emissivity of ocean surface allows us to utilize absorption/emission process by rain drops to retrieve rainfall intensityy Most direct physical connection of ANY technique Limitations due to unknown freezing level heights, drop size
di t ib ti d “b filli ”/ li TBdistributions and “beam filling”/non-linear TB response Over land, currently, can only rely on 85 GHz+ scattering
due to ice present in precipitation layer (fairly similar todue to ice present in precipitation layer (fairly similar to what a radar sees – bright band) Indirect relationship between ice in cloud and surface rainrate Indirect relationship between ice in cloud and surface rainrate Still, more direct than IR, since it sees through cirrus Emerging science starting to focus on emission signal over land…
11 October 2010 IPWG/EUMETSAT Satellite Training Workshop - Hamburg, Germany 16
g g g g

R i f ll Si t (M d l B d)Rainfall Signatures (Model Based)
11 October 2010 IPWG/EUMETSAT Satellite Training Workshop - Hamburg, Germany 17
Rainfall Over Ocean
Utilize both emission and scattering signatures of rainfall Utilize both emission and scattering signatures of rainfall Emission: 19-37 GHz/Scattering: 85+ GHz
Rain identification: Rain identification: Emission:
CLW (Q) cloud/rain threshold (0.2-0.3 mm) Function of freezing level, cloud base, DSD, etc.g , , ,
Scattering: Scattering “Index” (ice phase/falling snow) Scattering Index (ice phase/falling snow)
Remove sea-ice signature
11 October 2010 IPWG/EUMETSAT Satellite Training Workshop - Hamburg, Germany 18
Rainfall Over Ocean (con’t)Rainfall Over Ocean (con t)
Rain rate determination Empirical tuning to co-incident radar
Could be surface radars Could be from satellite radars like TRMM/PR or CloudSat
Physical tuning from cloud model simulationsy g RR=a Q b RR = a SI b
Accuracy and limitations Accuracy and limitations Instantaneous rain rate +/- 25%?
Q ti l d hi h d t Questions on low and high end rates Beam filling errors
11 October 2010 IPWG/EUMETSAT Satellite Training Workshop - Hamburg, Germany 19
Rain area fairly reliable

Rainfall Over Land At present, only utilize scattering signature:
Emission is difficult; it’s there but signal is smaller Emission is difficult; it s there but signal is smaller (high emissivity) AND emissivity highly variable, but….GPM is moving forward to utilize improved land
f i i it d lsurface emissivity models…. Less direct measure of rain
Mainl con ecti e & idesp ead st atifo m Mainly convective & widespread stratiform Special care to remove “false” signatures:
S ( lti k) d t Snow cover (melting snowpack), deserts Empirical “sceens”; decision tree approach
Moving towards ancillary data sets for better sfc identification Moving towards ancillary data sets for better sfc. identification Non-uniqueness of signatures conservative vs aggressive screening
11 October 2010 IPWG/EUMETSAT Satellite Training Workshop - Hamburg, Germany 20
conservative vs. aggressive screening

Rainfall Over Land (con’t)Rainfall Over Land (con t)
Rainfall detection via scattering 85/89 GHz: TB depressions indicate possible rain TB depressions indicate possible rain
Larger the depression, heavier rain Proper rain/no-rain threshold to minimize noise Proper rain/no rain threshold to minimize noise Scattering Index=f(TB19,TB22)-TB85
Rain Rate radar or CRM tuned; RR = a SI b Rain Rate - radar or CRM tuned; RR = a SI b Accuracy and limitations:
I t t t +/ 50% Instantaneous rate +/- 50% Summer season rain/no-rain most reliable
“W Coast” land systems problematic: W. Coast land systems problematic: maritime air mass/less ice/smaller precipitation particles?
Single SI-RR used (ie global “Z-R” relationship)
11 October 2010 IPWG/EUMETSAT Satellite Training Workshop - Hamburg, Germany 21
Single SI RR used (ie, global Z R relationship) Melting snow in winter and spring seasons

Use of high frequency measurements from AMSU and MHS
Physical retrieval of ice water path (IWP) and particle size (De) using AMSU-B 89 and 150 GHz:p ( ) g
•De ~ (89)/(150)
•IWP ~ De*(/(89 150))•IWP ~ De*(/(89,150))
Assumptions made on size-distribution & density
IWP to rain rate based on limited cloud model data and comparisons with in situ data:RR = A0 + A1*IWP +and comparisons with in situ data:RR = A0 + A1 IWP + A2*IWP2
Effects of surface misidentification (desert & snow)Effects of surface misidentification (desert & snow) reduced using 89 and 150 GHz
11 October 2010 IPWG/EUMETSAT Satellite Training Workshop - Hamburg, Germany 22

S O ti l Al ithSome Operational Algorithms
GOES-Hydroestimator DMSP/SSMI FNMOC
Goddard Profiling Algorithm (GPROF) Goddard Profiling Algorithm (GPROF) -TRMM, AMSR-E, SSMI
NOAA/POES AMSU-B/MHS
11 October 2010 IPWG/EUMETSAT Satellite Training Workshop - Hamburg, Germany 23

Operational Algorithm DevelopmentOperational Algorithm Development
What does operational mean? 24 hours/day 7 days/week 24 hours/day, 7 days/week
It’s like your cell phone, radio and TV stations; you expect it to be working ALL OF THE TIME!
It has to be easy to fix if it breaks You need to have full time support staff
Al i h id i Algorithm considerations: Complexity, processing, delivery “balance” Impact on other processing systems User requirements
Si lif h i l t i l h & tili i t Simplify physical retrieval schemes & utilize appropriate channels on sensor (these are always carefully selected when sensors are designed – radiative transfer models)!
11 October 2010 IPWG/EUMETSAT Satellite Training Workshop - Hamburg, Germany 24
when sensors are designed radiative transfer models)!

GOES H d E ti tGOES HydroEstimator Has its roots from early NESDIS work of Rod
Scofield and Satellite Applications Branch (SAB) pp ( )satellite analysts An interactive approach which looked at trends of GOES-
IR i fi ldIR temperatures, moisture fields, etc. To ease burden on analysts, an automated, more
bj ti th d d l dobjective method was developed The “AutoEstimator”; geared for convective systems
N t i f AE tili d d d t US t Next version of AE utilized ground data over US to better integrate satellite, NWP and in-situ data and work under all seasonswork under all seasons The “HydroEstimator”
11 October 2010 IPWG/EUMETSAT Satellite Training Workshop - Hamburg, Germany 25

Hydro EstimatorHydro-Estimator
Satellites: GOES Spectrum: IR Spatial Domain: Primarily CONUS, but is run in Mexico,
Central and South America Temporal Domain: Storm Scales Physical Basis/Empirical Coefficients:
IR cloud top temperature and trends related to rain rate Utilize in-situ data, NWP, topography to alter rain rates based on
local conditionslocal conditions Calibration: Ground Radar from U.S.
Refe ences Vincente et al (1998) Scofield and K ligo ski References: Vincente et al (1998), Scofield and Kuligowski (2003)
11 October 2010 IPWG/EUMETSAT Satellite Training Workshop - Hamburg, Germany 26

11 October 2010 IPWG/EUMETSAT Satellite Training Workshop - Hamburg, Germany 27

11 October 2010 IPWG/EUMETSAT Satellite Training Workshop - Hamburg, Germany 28

11 October 2010 IPWG/EUMETSAT Satellite Training Workshop - Hamburg, Germany 29
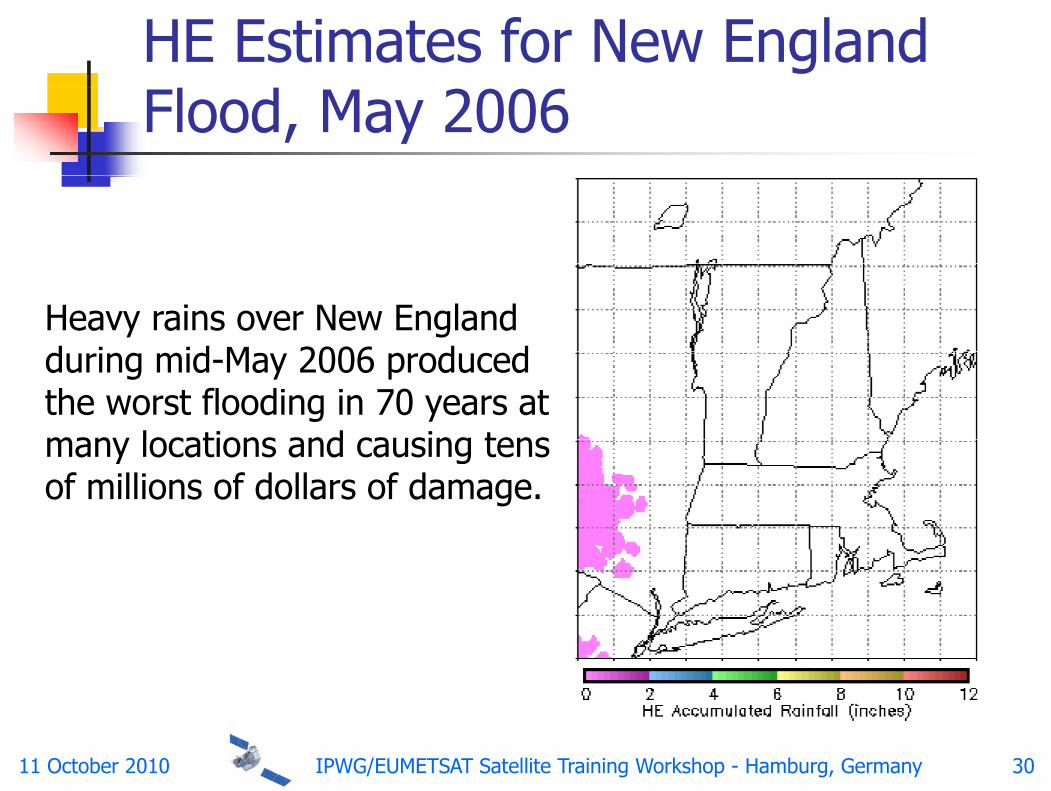
HE Estimates for New England l dFlood, May 2006
Heavy rains over New England d i id M 2006 d dduring mid-May 2006 produced the worst flooding in 70 years at many locations and causing tensmany locations and causing tens of millions of dollars of damage.
11 October 2010 IPWG/EUMETSAT Satellite Training Workshop - Hamburg, Germany 30

NESDIS/FNMOC Algorithm Satellites: SSM/I and SSMIS Spectrum: MWp Spatial Domain: Global
Temporal Domain: Storm & Climate Scales Temporal Domain: Storm & Climate Scales Physical Basis/Empirical Coefficients:
Grody 85 GHz “Scattering Index” Land/Ocean Scattering approach + Ocean emission/ g pp Screening for anomalous surfaces (snow, desert, ice)
Calibration: Ground Radar from U S Japan and U K Calibration: Ground Radar from U.S., Japan and U.K. References: Grody (1991), Ferraro and Marks
(1995) Ferraro (1997)11 October 2010 IPWG/EUMETSAT Satellite Training Workshop - Hamburg, Germany 31
(1995), Ferraro (1997)

11 October 2010 IPWG/EUMETSAT Satellite Training Workshop - Hamburg, Germany 32

SSM/I Rain Retrieval AlgorithmSSM/I Rain Retrieval Algorithm
11 October 2010 IPWG/EUMETSAT Satellite Training Workshop - Hamburg, Germany 33

11 October 2010 IPWG/EUMETSAT Satellite Training Workshop - Hamburg, Germany 34

GPROF (Goddard Profiling Algorithm)
Satellites: TRMM/TMI, AMSR-E, SSM/I (and GPM/GMI) Spectrum: MWp Spatial Domain: Global Temporal Domain: Storm & Climate Scales Physical
Couples CRM and RTE calculationsB i t i l Bayesian retrieval Matches actual satellite TB’s with database of hydrometeor profiles
and surface rain rate More recently, matching directly to TRMM PR profiles – more direct!
Same physical assumptions applied to any imager/sensorAdvantage – Unbiased retrievals across several sensors Advantage – Unbiased retrievals across several sensors
Calibration: Cloud Resolving Model (CRM) References: Kummerow et al (1996), Kummerow et al (2001), McCollum
& F (2003) W t l (2009) G l t l (2010)
11 October 2010 IPWG/EUMETSAT Satellite Training Workshop - Hamburg, Germany 35
& Ferraro (2003), Wang et al (2009), Gopalan et al (2010)

H GPROF kHow GPROF works Develop database of
precipitation systemsDi
GPROFDatabase
Diverse “Real” data better (TRMM PR!) Wide range of sensors Satellite
Simulator TB1 TB2 TBnWide range of sensors Match actual retrievals with
“best fit” from data base (Bayesian Inversion)
Hydrometeorprofiles
Simulator TB1, TB2, …TBn
GPROF(Bayesian Inversion) Retrieval of surface rain rate
and hydrometeor profiles
profiles GPROFDatabase
Limitations Diversity of database
Too many degrees of freedom
Atm. T, Q profile RR, Hydrometeorprofiles
Too many degrees of freedom GPM era data will greatly
improve!
11 October 2010 IPWG/EUMETSAT Satellite Training Workshop - Hamburg, Germany 36
Surface T, Є, RR, etc.Surface T, Є, RR, etc.

GPROF Retrieval
Aircraft RadiometerAircraft - Radiometer
Aircraft - Radar
11 October 2010 IPWG/EUMETSAT Satellite Training Workshop - Hamburg, Germany 37

11 October 2010 IPWG/EUMETSAT Satellite Training Workshop - Hamburg, Germany 38

TRMM TMI Version 7 Land R i f ll Al ithRainfall AlgorithmNai-Yu Wang, Kaushik Gopalan, and Ralph Ferraro
Cooperative Institute of Climate Studies,University of MarylandUniversity of Maryland
11 October 2010 IPWG/EUMETSAT Satellite Training Workshop - Hamburg, Germany 39

MotivationMotivation
Continuing support of the TRMM Microwave Imager (TMI) land precipitation algorithm to theImager (TMI) land precipitation algorithm to the science community
Empirical approach chosen due to fast-approaching TRMM v7 deadlinepp g
TMI rain rate (RR) found to have regional and seasonal biases; Precipitation radar rain ratesseasonal biases; Precipitation radar rain rates thought to be more physically realistic than TMI 6 RRv6 RR
Can we make the TMI “more like” PR?
11 October 2010 IPWG/EUMETSAT Satellite Training Workshop - Hamburg, Germany 40
Can we make the TMI more like PR?
OverviewOverview
A. TMI brightness temperature (Tb)- PR rain t (RR) i f diff t trate (RR) regressions for different storm
types using University of Utah PF database yp g yB. Identifying convective storms using TMI Tb
lvaluesC Comparison of regression fit RRs withC. Comparison of regression fit RRs with
current TMI v6
11 October 2010 IPWG/EUMETSAT Satellite Training Workshop - Hamburg, Germany 41

Part A : TMI Tb and PR RR f ti l fittifunctional fitting
11 October 2010 IPWG/EUMETSAT Satellite Training Workshop - Hamburg, Germany 42

TMI – PR collocations : Example
8.2TMI EFOV : 7 2 km x 4 6
The avg. of the 3 PR
8.16
8.187.2 km x 4.6 km
RRs is used as the “true” RR for this
8.12
8.14
de (d
eg) TMI pixel
8.1
8.12
Latit
ud
8.06
8.08
PR footprints : ~4.5 km at edge
-72.8 -72.78 -72.76 -72.74 -72.72 -72.7 -72.68 -72.668.04
Longitude (deg)
of scan
11 October 2010 IPWG/EUMETSAT Satellite Training Workshop - Hamburg, Germany 43

Separation of regression fits by storm type
Convective and Stratiform storms separated d i t i i i PR i t flduring training using PR rain type flag
Seasonal variations and differences between Seasonal variations and differences between storms in the tropics and sub-tropics (proxy f f ) i i dfor surface types) were investigated
11 October 2010 IPWG/EUMETSAT Satellite Training Workshop - Hamburg, Germany 44

Latitude and seasonal dependence
Analyzed using Sep 2002 - Aug 2008 data Separation of high latitudes (>20) and low
latitudes (<=20)latitudes (<=20) Clear differences in rain rate regressions for
the different cases
11 October 2010 IPWG/EUMETSAT Satellite Training Workshop - Hamburg, Germany 45

Filtering the Training setFiltering the Training set
Filter out pixels where there is surface tt i / t t i tiscattering/water contamination
Pixels where TMI RR >= 1.5 PR RR are excluded Pixels where TMI RR > 1.5 PR RR are excluded from the convective regressions
Filt t i l ith i h th Filter out pixels with warm rain where there is no corresponding depression in the 85V p g pTb
Pi l h TMI RR 0 5 PR RR Pixels where TMI RR <= 0.5 PR RR are excluded from the stratiform regressions
11 October 2010 IPWG/EUMETSAT Satellite Training Workshop - Hamburg, Germany 46

Effect of filtering (Convective)Effect of filtering (Convective)
50Convective Rain
Fal TrFal SubTr
40
45 Win TrWin SubTrSpr TrSpr SubTrSum Tr
30
35
(mm
/hr) Sum SubTr
25
30
PR R
R (
15
20
120 140 160 180 200 220 240 260 28010
TMI 85V Tb (K)
11 October 2010 IPWG/EUMETSAT Satellite Training Workshop - Hamburg, Germany 47

Effect of filtering (Stratiform)Effect of filtering (Stratiform)
5Stratiform Rain
Fal TrFal SubTr
4
4.5 Win TrWin SubTrSpr TrSpr SubTrSum Tr
3
3.5
(mm
/hr) Sum SubTr
2.5
3
PR R
R (
1.5
2
210 220 230 240 250 260 2701
TMI 85V Tb (K)
11 October 2010 IPWG/EUMETSAT Satellite Training Workshop - Hamburg, Germany 48

Final regressionsFinal regressions
45 StratiformConvective
35
40
Cubic fit
25
30
(mm
/hr)
15
20
PR R
R (
5
10
120 140 160 180 200 220 240 260 2800
TMI 85V Tb (K)
Linear fit
11 October 2010 IPWG/EUMETSAT Satellite Training Workshop - Hamburg, Germany 49

Part B : Identifying convective t f TMI Tb lstorms from TMI Tb values
11 October 2010 IPWG/EUMETSAT Satellite Training Workshop - Hamburg, Germany 50

Convective/Stratiform separation
The TMI rain-rate is a weighted sum of ti / t tif ti *convective/stratiform portion *
convective/stratiform rain-rate / RR = RR_conv*P(Conv) + RR_strat*(1-
P(C ))P(Conv)) P(Conv) is the estimated probability of the P(Conv) is the estimated probability of the
current pixel observing a convective storm
11 October 2010 IPWG/EUMETSAT Satellite Training Workshop - Hamburg, Germany 51

P(Conv) Convective ratioP(Conv) Convective ratio
Weighted average of seven Conv. Storm i di tindicators
PIWD PIWD Based on 85V Tb gradients in along-scan and
l k dalong track directions
Std Dev of 85V Tb in meso-scale Std. Dev. of 85V Tb in meso scale Npol
Normalized 85 GHz polarization
11 October 2010 IPWG/EUMETSAT Satellite Training Workshop - Hamburg, Germany 52

P(Conv)P(Conv)
v6 v7
0.7
0.8 TMI P(Conv)PR Convective ratio
0.7
0.8 TMI P(Conv)PR Convective ratio
v6 v7
0.5
0.6
0.5
0.6
0.3
0.4
0.3
0.4
0
0.1
0.2
0
0.1
0.2
0 0.1 0.2 0.3 0.4 0.5 0.6 0.7 0.8 0.9 10
P(Conv)
0 0.1 0.2 0.3 0.4 0.5 0.6 0.7 0.8 0.9 10
P(Conv)
11 October 2010 IPWG/EUMETSAT Satellite Training Workshop - Hamburg, Germany 53

Part C : Comparison with TRMM 2A12 6TRMM 2A12 v6
11 October 2010 IPWG/EUMETSAT Satellite Training Workshop - Hamburg, Germany 54
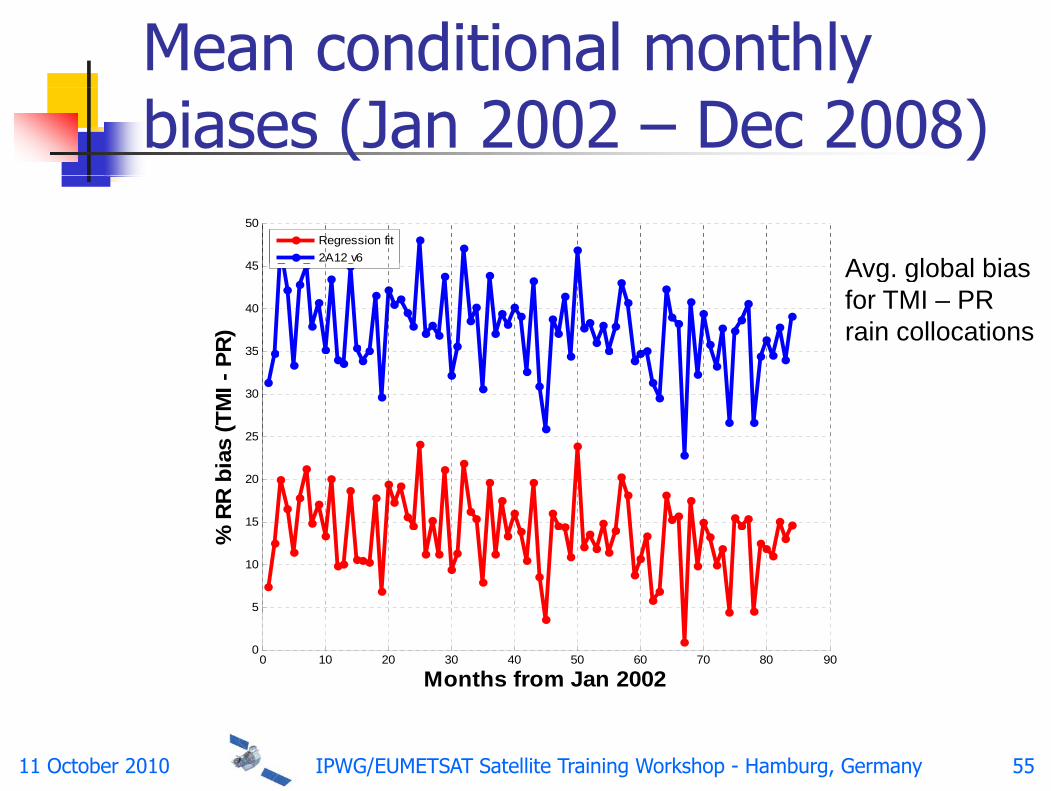
Mean conditional monthly biases (Jan 2002 – Dec 2008)
45
50 Regression fit2A12 v6 Avg global bias
35
40
45
R)
Avg. global bias for TMI – PR rain collocations
25
30
35
s (T
MI -
P
15
20
25
% R
R b
ias
5
10
%
0 10 20 30 40 50 60 70 80 900
Months from Jan 2002
11 October 2010 IPWG/EUMETSAT Satellite Training Workshop - Hamburg, Germany 55

Mean unconditional monthly biases (Jan 2002 – Dec 2008)
60 Regression fit2A12 v6 Includes non
40
50
%)
Includes non-raining pixels. Effect of
20
30
RR
bia
s (% screening
errors is seen here.
10
20
MI -
PR
R
-10
0TM
0 10 20 30 40 50 60 70 80 90-20
Months from Jan 2002
11 October 2010 IPWG/EUMETSAT Satellite Training Workshop - Hamburg, Germany 56

Global TMI - PR bias mapGlobal TMI - PR bias map
TMI v6 - PR bias (mm/month) 50
100
150
Lat (
deg)
0
-50
0
50
Longitude (deg)
L
-150 -100 -50 0 50 100 150
-50 -150
-100
g ( g)
g)
TMI regression - PR bias (mm/month) 50
100
150
Lat (
deg)
0
-50
0
50
Longitude (deg)
-150 -100 -50 0 50 100 150-50 -150
-100
11 October 2010 IPWG/EUMETSAT Satellite Training Workshop - Hamburg, Germany 57

Unconditional global rainfall mean (Jan 2002-Dec 2008)
RR Algorithm Mean RR (mm/d)
PR 2A25 2.20
TMI 2A12 v6 2.83
Regression 2.41
~66 % reduction in global TMI – PR RR biasbias
11 October 2010 IPWG/EUMETSAT Satellite Training Workshop - Hamburg, Germany 58

Global RR Prob. density function
Regressionv6
10-2
10-1 PR
10-3
df
5
10-4
Pd
10-6
10-5
10 20 30 40 50 60
RR (mm/hr)
11 October 2010 IPWG/EUMETSAT Satellite Training Workshop - Hamburg, Germany 59

Global RR Prob. density function
0.4
Regressionv6
0 3
0.35
PR
0.25
0.3
df
0.15
0.2Pd
0.05
0.1
2 4 6 8 10 120
RR (mm/hr)
11 October 2010 IPWG/EUMETSAT Satellite Training Workshop - Hamburg, Germany 60

Storm case : Orbit 34747 (over Argentina)
TMI v6 TMI RegressionRR saturates t 52
-27 60 -27 60
at ~52 mm/hr
eg)
-28.5
-28
-27.5
40
50
eg)
-28.5
-28
-27.5
40
50
Latit
ude
(de
-29.5
-29
28.5
20
30
Latit
ude
(de
-29.5
-29
28.5
20
30
31
-30.5
-30
0
10
31
-30.5
-30
0
10
Longitude (deg)
-61 -60 -59 -58 -57 -56 -55-31
Longitude (deg)
-61 -60 -59 -58 -57 -56 -55-31
Max RR : ~85 mm/hr. Better
11 October 2010 IPWG/EUMETSAT Satellite Training Workshop - Hamburg, Germany 61
contrast as compared to v6

Storm case : Orbit 34747 (over Argentina)
-27 60Max RR : ~122
-28
-27.550
mm/hr
de (d
eg)
-29
-28.5
30
40
Latit
ud
-29.5
29
20
-30.5
-30
10
Longitude (deg)
-61 -60 -59 -58 -57 -56 -55-31 0
11 October 2010 IPWG/EUMETSAT Satellite Training Workshop - Hamburg, Germany 62PR RR

ConclusionsConclusions
Overall bias between TMI and PR is reduced by >50% This algorithm is delivered to CSU for extensive testing; This algorithm is delivered to CSU for extensive testing;
The rain-rate product is scheduled to be released in early 2010 by the TRMM project officeearly 2010 by the TRMM project office.
Some persistent problems remain, they are mainly associated with rain detection and surface screeningassociated with rain detection and surface screening, e.g., seasonal variation in Rain/ No rain screening , false alarms over arid land and missed warm rainalarms over arid land and missed warm rain. Researchers at CICS are currently working on a new methodology of using surface- type climatology mapsmethodology of using surface type climatology maps (both static and dynamic), to replace the traditional surface screening method.
11 October 2010 IPWG/EUMETSAT Satellite Training Workshop - Hamburg, Germany 63
surface screening method.

AMSU-B Rain RatesAMSU-B Rain Rates
S t llit POES/AMSU M tOP/MHS Satellites: POES/AMSU, MetOP/MHS Spectrum: MWp Spatial Domain: Global Temporal Domain: Storm & Climate Temporal Domain: Storm & Climate Physical:
First algorithm to utilize 150 GHz measurements Dual-frequency (89 and 150 GHz) scattering algorithm:
Simultaneous retrieval of IWP and De Simultaneous retrieval of IWP and De Based on two-stream approximation to radiative transfer IWP converted to RR
Calibration: Cloud model References: Zhao & Weng (2002); Weng et al (2003); Ferraro et al
11 October 2010 IPWG/EUMETSAT Satellite Training Workshop - Hamburg, Germany 64
e e e ces ao & e g ( 00 ); e g et a ( 003); e a o et a(2005), Qiu et al (2005)

Ice Water Path & Rain Rate
11 October 2010 IPWG/EUMETSAT Satellite Training Workshop - Hamburg, Germany 65
11 October 2010 IPWG/EUMETSAT Satellite Training Workshop - Hamburg, Germany 66

11 October 2010 IPWG/EUMETSAT Satellite Training Workshop - Hamburg, Germany 67
11 October 2010 IPWG/EUMETSAT Satellite Training Workshop - Hamburg, Germany 68

11 October 2010 IPWG/EUMETSAT Satellite Training Workshop - Hamburg, Germany 69

The Rainfall ConumdrumThe Rainfall Conumdrum GOES IR brightness temperatures…
…provide excellent spatial resolution, refresh, and …provide excellent spatial resolution, refresh, and data latency
BUT are weakly related to rain rates—especially for …BUT are weakly related to rain rates especially for non-convective rainfall
Microwave brightness temperatures Microwave brightness temperatures… …are sensitive to cloud water / ice content—much
l i hi i f ll h IR l dstronger relationship to rainfall rates than IR cloud-top temperatures
…BUT, restriction to polar-orbiting platforms means degraded refresh rate and data latency with respect
d11 October 2010 IPWG/EUMETSAT Satellite Training Workshop - Hamburg, Germany 70
to geostationary data.

SCaMPR—a Solution (one of many)SCaMPR a Solution (one of many)
Self-Calibrating Multivariate Precipitation Retrieval [email protected] @ g Scofield, R. A. and Kuligowski, R.J., 2003. Status and Outlook of
Operational Satellite Precipitation Algorithms for Extreme-Precipitation Events Weather and Forecasting 18:1037 1051Precipitation Events. Weather and Forecasting, 18:1037--1051.
Calibrates infrared data from GOES to microwave rain rates in order to produce higher-quality rain rates withrates in order to produce higher quality rain rates with the space / time resolution and data latency of geostationary datag y
Four steps: Match GOES and microwave data Calibrate rain/no rain separation Calibrate rain rate
A l i d d d
11 October 2010 IPWG/EUMETSAT Satellite Training Workshop - Hamburg, Germany 71
Apply to independent data

SCaMPR Predictors SCaMPR Predictands
GOES T6.9 µm GOES T10.7 µm GOES T13.3 µm
T -TT -T
SSM/I Rain Rates
T10.7-T13.3
S = 0.568 (T10.7,min-217 K)
T10.7-T6.9AMSU Rain Rates
DerivedQuantities
Gt-S = (T10.7,avg-T10.7,min)-SQuantities
Aggregate to microwave footprint
M t h di t d di t d i lMatch predictor and predictand pixels(separate sets for raining and non-raining predictor pixels)
Calibrate rain/no rain discrimination Calibrate rain rate estimation
Raining pixelsDry pixels
Calibrate rain/no rain discriminationvia discriminant analysis
Calibrate rain rate estimationvia multiple regression
Apply to independent predictor
11 October 2010 IPWG/EUMETSAT Satellite Training Workshop - Hamburg, Germany 72
Apply to independent predictordata for rain rate retrievals

Comparison of h l d24-h totals ending
1200 UTC 241200 UTC 24 March 2006March 2006
11 October 2010 IPWG/EUMETSAT Satellite Training Workshop - Hamburg, Germany 73

IR MW Al ith CMORPHIR-MW Algorithms: CMORPH CMORPH=CPC MORPHing technique Developed by R. Joyce and colleagues at the Climate p y y g
Prediction Center (CPC) Uses IR imagery to interpolate the movement of rainfall
areas in MW imagery in between imagesareas in MW imagery in between images Also interpolates growth/decay of MW rainfall between
MW imagesMW images Produced globally at 0.727-degree resolution in near-real
time Contact: Bob Joyce at [email protected] Other similar algorithms:
TMPA – Adler and Huffman; NASA/GSFC PERSIANN – Sooroshian, Gou, Hsu; Univ. California-Irvine NRL Blended – Joe Turk; NRL and NASA/JPL
11 October 2010 IPWG/EUMETSAT Satellite Training Workshop - Hamburg, Germany 74
NRL Blended – Joe Turk; NRL and NASA/JPL

CMORPH E lCMORPH—Example
11 October 2010 IPWG/EUMETSAT Satellite Training Workshop - Hamburg, Germany 7524-h Totals ending 0000 UTC 8 October 2003

Precipitation Overview ReferencesPrecipitation Overview References
Arkin, P.A. and P.E. Ardanuy, 1989: Estimating climatic-scale precipitation fromi J Cli t 2 1229 1238space: a review. J. Climate, 2, 1229-1238.
Ebert, E.E., M.J. Manton, P.A. Arkin, R.E. Allam, and A. Gruber, 1996, Resultsf th GPCP l ith i t i B ll A M t Sfrom the GPCP algorithm intercomparison programme, Bull. Amer. Meteor. Soc,77, 2875-2887.
Eb t E J J i k d C Kidd 2007 C i f l ti Ebert, E., J. Janowiak, and C. Kidd, 2007: Comparison of near-real-time precipitation estimates from satellite observations and numerical models. Bull. Amer. Meteor. Soc., 88,47-64.
Smith, E.A. et al, 1998: Results of WetNet PIP-2 Project. J. Atmos. Sci., 55,1483 – 1536.
Kummerow, C. et al, 2000: The status of the Tropical Rainfall MeasuringMission (TRMM) after two years in orbit. J. Appl. Meteor., 39, 1965 -1982
11 October 2010 IPWG/EUMETSAT Satellite Training Workshop - Hamburg, Germany 76

SSMI ReferencesSSMI References
Ferraro, R.R., F. Weng, N.C. Grody, and A. Basist, 1996: An eightyear (1987-94) climatology of rainfall, clouds, water vapor,snowcover and sea-ice derived from SSM/I measurements Bull ofsnowcover, and sea ice derived from SSM/I measurements. Bull. ofAmer. Meteor. Soc., 77, 894-905.
Ferraro, R.R., 1997: SSM/I derived global rainfall estimates forclimatological applications. J. Geophys. Res., 102, 16,715-16,735.
Ferraro, R.R., E.A. Smith, W. Berg, and G. Huffman, 1998: A reviewof screening techniques for passive microwave precipitation retrievalalgorithms. J. Atmos. Sci., 55, 1583-1600.
Ferraro R R S J Kusselson and M Colton 1999: An introduction to Ferraro, R.R., S.J. Kusselson and M. Colton, 1999: An introduction topassive microwave remote sensing and its applications tometeorological analysis and forecasting. National Weather Digest,22 11 23
11 October 2010 IPWG/EUMETSAT Satellite Training Workshop - Hamburg, Germany 77
22, 11-23.

AMSU ReferencesAMSU References
Ferraro, R., S. Kusselson, S. Kidder, L. Zhao and H. Meng, 2010: Application of AMSU-Based Products to Support NOAA’s Mission Goals. pp ppNational Weather Digest., 34, 1-14.
Ferraro R R F Weng N Grody L Zhao H Meng C Kongoli P Ferraro, R.R., F. Weng, N. Grody, L. Zhao, H. Meng, C. Kongoli, P. Pellegrino, S. Qiu and C. Dean, 2005: NOAA operational hydrological products derived from the AMSU. IEEE Trans. Geo. Rem. Sens., 43, 1043-1056.1043 1056.
Kongoli, C., P. Pellegrino, R. Ferraro, N. Grody and H. Meng, 2003: A new snowfall detection algorithm over land using measurements fromnew snowfall detection algorithm over land using measurements from the Advanced Microwave Sounding Unit (AMSU). Geophys. Res. Let., 30, 1756-1759.
Weng, F., L. Zhao, G. Poe, R.R. Ferraro, X. Li and N. Grody, 2003: AMSU cloud and precipitation algorithms, Radio Science, 38(4), 8068-8079.
11 October 2010 IPWG/EUMETSAT Satellite Training Workshop - Hamburg, Germany 78

GPROF ReferencesGPROF References
Gopolan, K., N.Y. Wang, C. Liu and R. Ferraro, 2010: Version 7 of the TRMM 2A12 Land Precipitation Algorithm. In press, J. Atmos. Oceanic Tech.
Kummerow, C, Y. Hong, W. Olson, S. Yang, R. Adler, J. McCollum, R. Ferraro, G. Petty and T. Wilheit, 2001: The evolution of the Goddard Profiling Algorithm (GPROF) f i f ll ti ti f i i J A l M t(GPROF) for rainfall estimation from passive microwave sensors. J. Appl. Meteor., 40, 1801-1820.
M C ll J R d R R F 2003 Th t ti f NOAA/NESDIS McCollum, J.R. and R.R. Ferraro, 2003: The next generation of NOAA/NESDIS SSM/I, TMI and AMSR-E microwave land rainfall algorithms, J. Geophys. Res. 108, 8382-8404.
Wang, N., C. Liu, R. Ferraro, D. Wolff, E. Zipser and C. Kummerow, 2009: The TRMM 2A12 Land Precipitation Product – Status and Future Plans, J. of Meteor. Soc Of Japan 87 237 – 253Soc. Of Japan., 87, 237 253.
Wiheit, T., C. Kummerow and R. Ferraro, 2003: Rainfall algorithms for AMSR-E. IEEE Trans Geosci And Rem Sens 41 204-214
11 October 2010 IPWG/EUMETSAT Satellite Training Workshop - Hamburg, Germany 79
IEEE Trans. Geosci. And Rem.Sens., 41, 204 214.