municipal elections in california: turnout, timing, and
TRANSCRIPT

Municipal Electionsin California: Turnout, Timing, and Competition
• • •
Zoltan L. HajnalPaul G. LewisHugh Louch
2002
PUBLIC POLICY INSTITUTE OF CALIFORNIA

Library of Congress Cataloging-in-Publication DataHajnal, Zoltan, 1968–
Municipal elections in California : turnout, timing, and competition / Zoltan L. Hajnal, Paul G. Lewis, Hugh Louch.
p. cm.Includes bibliographical references.ISBN 1-58213-041-8
1. Local elections—California. I. Lewis, Paul George, 1966– II. Louch, Hugh, 1973– III. Title.
JS451.C25 H35 2002324.9794'053—dc21 2002017332
Research publications reflect the views of the authors and do notnecessarily reflect the views of the staff, officers, or Board ofDirectors of the Public Policy Institute of California.
Copyright © 2002 by Public Policy Institute of CaliforniaAll rights reservedSan Francisco, CA
Short sections of text, not to exceed three paragraphs, may be quotedwithout written permission provided that full attribution is given tothe source and the above copyright notice is included.

iii
Foreword
The PPIC Statewide Survey has shown time and again thatCalifornia voters distrust their government. The roots of that distrust aredeep and complex, but its policy effects are often quite clear. Forexample, California voters rely more heavily now on the initiative processto guide public policy, in part because they do not believe that theirelected representatives will address the problems they think areimportant. One can argue at length over the advantages anddisadvantages of specific initiatives, and one can do the same for theinitiative process generally. But it is more difficult to argue that thedistrust that has made the initiative process so important is itself salutary.
This distrust becomes even more difficult to celebrate when itmanifests itself as political apathy or even disgust. These reactions havekept large numbers of citizens from registering to vote in the first place.When we combine these unregistered citizens with the noncitizenpopulation living in California, and then add to this group the registeredvoters who do not go to the polls, we find that, in many cases, analarmingly small percentage of California residents decides a localelection. This pattern is especially pronounced in off-cycle localelections, when turnout rates typically lag those of local elections thatcoincide with statewide and national contests.
In a political system based on an informed and active citizenry, lowand declining participation rates are a great concern. Indeed, increasingthose rates may be the most important policy challenge of the early 21stcentury. But what are the most practical ways to meet that challenge? Inthis report, Zoltan Hajnal, Paul Lewis, and Hugh Louch offer a detaileddescription of local turnout patterns and analyze the factors associatedwith high and low participation rates. Their results indicate that abouthalf the difference in voter turnout across California cities can be tracedto a single factor—election timing. Noting that Progressive Erareformers instituted off-cycle local elections, and that one-third of

iv
California’s cities continue to hold them, the authors calculate how manymore citizens would vote in local elections that coincided with state andnational contests.
The policy solution in this case seems clear enough. If low turnoutfor local contests is the problem, concurrent elections are a big step in theright direction. This simple change is unlikely to banish political apathy,but it will significantly increase the likelihood that citizens will maketheir voices heard on local issues.
David W. LyonPresident and CEOPublic Policy Institute of California

v
Summary
The 2001 race for mayor of Los Angeles was one of the closest andmost exciting in decades. With incumbent mayor Richard Riordanleaving office because of term limits, several strong candidates fromvarious political and ethnic backgrounds ran for the office, and surveysindicated that the race was too close to call. It therefore came as asurprise to some that only 33.5 percent of the city’s registered voterscame to the polls to cast votes in the April primary nominating electionand only 36.2 percent voted in the June runoff election. Given thewidely perceived interest in the contest, why did nearly two of threeregistered voters stay home? Are Los Angeles voters unusual in theirdegree of civic disinterest?
This report finds that voter behavior in Los Angeles is far fromatypical. By documenting levels of voter involvement in municipalelections, it investigates factors that help account for differences inturnout across California cities. It also examines the degree ofcompetition for municipal offices as a related barometer of the vibrancyof the local political environment.
Most of the key evidence is drawn from a questionnaire mailed to allcity clerks in the state in 2000 asking about the most recent elections inthe community. Usable data were collected on 350 city councilelections, or 74 percent of the 474 municipalities then existing in thestate. Analogous information was available for 130 mayoral contests,since only one-third of cities provide for direct election of mayors. Cityclerks also provided a wealth of information on local electoral proceduresand institutional arrangements as well as the context of the particularelection. We supplemented this information with published data fromthe Census and state sources.

vi
Local Voter Turnout Rates: Generally Low, ButVaried
Observers of politics and community life have raised concerns aboutlow, and in many cases declining, levels of civic engagement in America.Exercising the right to vote is one of the most fundamental and cherishedforms of civic participation. Citizen participation in elections isimportant for several reasons. Low turnout levels may compromise thebasic legitimacy of a democratic system, and nonparticipation is relatedto a host of negative attitudes about government and politics. Votingalso serves as an important educational tool because voters learn moreabout policy issues and government by actively participating in theelectoral arena. Finally, low turnout may be linked to anunrepresentative electorate. Racial and ethnic minorities, the poor, andyounger Californians vote much less regularly than others in the state. Ifthese nonvoters have systematically different political preferences orneeds than voters, then the “voice of the people” will be distorted.
Although municipal governments can affect citizens in profound andimmediate ways, many Californians and other Americans ignore localelections. Information provided by the city clerks indicates that theaverage turnout rate in city council elections in California was 48 percentof registered voters and only 44 percent in mayoral races for cities thatdirectly elect the mayor. (Aggregate turnout of registered voters was evenlower—43 percent for council races and 39 percent for mayoralcontests—because cities with larger populations tended to have lowerparticipation rates.) Measured as a percentage of the voting-agepopulation, turnout was lower still: 32 percent in the average councilelection and 28 percent in the average mayoral elections.
These overall levels of turnout are important, but they concealimportant variations in voting rates across communities (Figure S.1).Turnout of registered voters ranges from a low of 10 percent to a high of89 percent. It is therefore important to consider which factors mightaccount for these major differences in voter participation.

vii
Num
ber
of c
ities
80
70
60
50
40
30
20
10
080–8970–7960–6950–5940–4930–3920–2910–190–9 90–100
Percentage of registered voters casting ballots
Figure S.1—Distribution of Voter Turnout Rates in City Council Elections
Why Do Local Turnout Rates Differ?To understand variation in voter turnout across cities, we examined
three sets of factors: election timing, the electoral and institutionalstructure of local government, and the specific context surrounding anygiven election. Although we also control for the demographic andsocioeconomic characteristics that are known to affect voter turnout, wefocus attention on these broad city-level factors for two reasons. First,anecdotal evidence and findings from other studies suggest that electiontiming and local institutions can significantly affect voter participation.Second, these city-level characteristics lend themselves more readily topractical policy interventions. Although it is difficult or impossible forcity policymakers to affect the demographic or socioeconomiccharacteristics of their localities, they often can and do alter theirelectoral institutions and governmental structure.
Our analysis indicates that about half of the differences in turnoutamong California cities can be explained by one simple factor—the

viii
timing of the local election. By scheduling local elections to occur on thedates of statewide general or primary elections (so called concurrent or on-cycle elections), localities make it easier for voters participating in thestatewide election to vote in local contests as well. Controlling for a hostof other factors, presidential elections are associated with turnouts ofregistered voters in city elections that are 36 percent higher than off-cycleelections (which are “local-only” elections typically held in the spring);gubernatorial elections and presidential primaries are associated withmunicipal turnouts of 21 to 26 percent more registered voters (FigureS.2). In short, participation in local elections depends critically on thetiming of those elections.
At least one local government institutional arrangement is alsorelated to turnout in municipal elections. Cities that provide moreservices with their own staff (as opposed to contracting out to firms ormaking service arrangements with other local governments) tend to drawa larger share of voters to the polls. This higher turnout may occurbecause city governments that provide services directly have more controlover some of the basic issues that affect city residents’ quality of life, or
Med
ian
perc
enta
ge tu
rnou
t
70
60
50
40
30
20
10
0PresidentialPresidential
primaryGubernatorialOdd-year
NovemberOff-cycle
Registered votersAdult residents
Figure S.2—Variation in Turnout by Election Timing(controlling for other factors)

ix
because municipal employees tend to be a well-mobilized segment of thelocal electorate. By contrast, the distinctions between charter cities andgeneral-law cities, and between cities with and without term limits forcouncil members or mayors, have no direct relationship with local voterturnout.
The context of the local election is also related to turnout. Wherethere are one or more propositions on the municipal ballot, cities tend todraw about 4 percent more registered voters to the polls. Similarly, thedegree of competition for the office (measured by the number ofcandidates) is positively related to turnout. Predictably, uncontestedelections draw especially few voters.
If we use a city’s adult residents, rather than registered voters, as ourreference group, these factors—timing, service provision, ballot measures,and candidate competition—likewise demonstrate importantrelationships to turnout. The effect of these factors is slightly diminishedbecause demographic factors and citizenship barriers take on additionalimportance, heavily influencing whether residents can and do register tovote in the first place.
Election Timing, Incumbent Success, andCompetition for Office
These results indicate that a move to concurrent elections has thegreatest potential to expand voter participation in California’s localpolitical arena. More than one-third of the cities responding to the cityclerk questionnaire held their elections on a date that was not in theelectoral “prime time” of a statewide election. Moreover, the timing oflocal elections is a subject of policy debate in California. More than 40percent of the city clerks responding indicated that their city has made achange in the timing of municipal elections in recent years. As the statehas changed the date of its primary election in an effort to have moreeffect on the national presidential primary season, numerouscommunities with nonconcurrent (stand-alone) spring elections haveconsolidated their elections with statewide contests, or have considereddoing so. The reason is often budgetary; city governments pay a smaller

x
share of the cost of holding an election if it is held concurrently withother contests.
In considering a timing change, however, policymakers may wish toweigh the benefits of increased participation against other, potentiallyunintended consequences of changes in election timing. For example,critics have argued that some voters in concurrent elections are unawareof and inattentive to local issues and candidates because the focus ofmedia coverage and popular attention is on the higher-profile state ornational races. If true, concurrent elections could provide increasedprotection for incumbent candidates, who have greater name recognitionon average than their challengers.
An analysis of the reelection success of incumbent city officeholdersprovides some mild support for this notion—although the vast majorityof incumbents win regardless of election timing. Whereas 80 percent ofincumbent council members and 86 percent of incumbent mayorsstanding for reelection succeeded overall in the cities responding to thequestionnaire, the reelection rate for incumbents was higher in cities thathave concurrent elections. Nonconcurrent city elections tend to placeincumbents in a more vulnerable position, perhaps because voters whocome to the polls for stand-alone elections are more motivated or arousedby the issues facing the community. Of course, increased incumbentsuccess in on-cycle elections could be a sign of something elsealtogether—perhaps greater trust or greater satisfaction resulting frommore widespread participation.
Our examination of competition for council and mayoral offices alsoreveals that incumbents have significantly lower reelection success rates incities with citizen initiatives on the ballot—a possible reflection ofcommunity controversy. Cities with larger populations tend to havehigher incumbent reelection rates—and lower voter turnout rates—indicating that voters are probably less likely to become engaged in civicissues in larger communities.
The presence of an incumbent strongly dissuades potentialcompetitors from entering local races. Competition for council ormayoral positions is lower where incumbents are standing for reelection.It is interesting to note that in cities where independent and third-partyvoters constitute a larger share of registered voters, there tend to be more

xi
competitors for office, even though local elections in California arenonpartisan (that is, party labels do not appear on the ballot). Inaddition, the number of candidates for mayor is greater where therewards of the office (full-time salary and length of the term) are greater.
Can Participation in Local Elections Be Increased inCalifornia?
The first and most important step to increase voter participation incity elections would be to shift their date to coincide with statewide ornational contests. We estimate that if all cities in the state that holdnonconcurrent elections switched their elections to a presidential electiondate, approximately 1.7 million more Californians would have cast aballot in their most recent city council contest.
Yet this step should only be considered a limited reform. Despitethe significant boost that concurrent elections could give to city turnouts,they would probably not increase turnout beyond the fairlydisappointing levels already found in statewide and national contests.And although voter participation is closely correlated with greater trust,efficacy, and satisfaction in government, increasing turnout would notguarantee improved civic engagement in local communities, along suchimportant dimensions as serving in neighborhood organizations orattending community meetings.
Still, in the end, the doctrine of “one person, one vote”—a bedrockof democratic theory—probably outweighs any potential negatives.Some might argue that participation in local contests be left to the mostengaged or interested voters. However, political equality and enhancedcitizen participation in city politics are important goals in an increasinglydiverse state with powerful local governments.


xiii
Contents
Foreword..................................... iiiSummary..................................... vFigures ...................................... xvTables....................................... xviiAcknowledgments ............................... xix
1. POLITICAL PARTICIPATION AND MUNICIPALELECTIONS ............................... 1Local Elections in the Context of Declining Voter
Participation ............................ 1Do Policymakers Have Any Potential Leverage over Local
Participation? ............................ 5Incumbent Reelection and Competition for Office ....... 10A Need for New Evidence: Examining Voter Turnout in
California Cities .......................... 11
2. VOTER TURNOUT AND LOCAL CONTEXTS:RESULTS FROM A SURVEY OF CITY CLERKS ...... 13Mail Survey Procedures and Response Rate ............ 13Ascertaining Voter Participation Rates: The Core of the
Survey ................................ 14Is Low Voter Turnout a Problem in California Cities? ..... 16Election Timing, Local Institutions, and Context ........ 17Election Timing: The First Key ................... 18Governmental Structure and Electoral Laws ............ 20
District Versus At-Large Elections................. 20Term Limits .............................. 21City Service Provision ........................ 22The Form of Government in Cities ................ 23Local Structure Summarized .................... 24
Electoral Context ............................. 25Local Direct Democracy....................... 25Competition .............................. 26

xiv
Incumbency............................... 28Electoral Competition Across Races or Ethnicities ...... 28
Supplementing the Survey: City DemographicCharacteristics ........................... 29
Summary .................................. 32
3. ACCOUNTING FOR DIFFERENCES IN VOTERTURNOUT ACROSS CITIES ................... 33Election Timing ............................. 35Institutional Factors ........................... 38Electoral Context ............................. 40City Demographics ........................... 44Summary .................................. 46
4. COMPETITION AND INCUMBENCY IN LOCALELECTORAL CONTESTS...................... 49Competition for Office ......................... 49The Success of Incumbents ...................... 55Summary .................................. 60
5. CONCLUSION ............................. 63
AppendixA. Survey of City Clerks .......................... 69B. Mail Survey Procedures and Data Issues .............. 81C. Voter Turnout Regressions....................... 87D. Candidate Competition Regression ................. 91
References .................................... 95
About the Authors ............................... 101
Other Related PPIC Publications ..................... 103

xv
Figures
S.1. Distribution of Voter Turnout Rates in City CouncilElections ............................... vii
S.2. Variation in Turnout by Election Timing (controllingfor other factors) .......................... viii
2.1. Service Provision by Type and Provider ............ 233.1. Distribution of Voter Turnout Rates in City Council
Elections ............................... 333.2. Variation in Turnout by Election Timing (with
controls)................................ 363.3. Variation in Turnout by City Service Provision (with
controls)................................ 393.4. Variation in Turnout by Number of City Ballot
Propositions (with controls) ................... 423.5. Variation in Turnout by City Population (with
controls)................................ 454.1. Incumbent Success and Election Concurrency........ 574.2. Success of Council Incumbents in Varying Electoral
Contexts................................ 584.3. Incumbent Success and City Population ........... 59


xvii
Tables
1.1. The Demographic Profiles of California’s Voters andNonvoters............................... 3
1.2. The Different Preferences of Voters and Nonvoters .... 52.1. Timing of California Municipal Elections .......... 192.2. Local Government Structure in California .......... 252.3. Race or Ethnicity of Mayoral Candidates ........... 29A.1. Number of Valid Responses for Individual Variables.... 70B.1. Comparing In-Sample and Out-of-Sample Cities ...... 82B.2. Geographic Distribution of Cities in Sample......... 83B.3. Important Missing Values..................... 83C.1. Turnout in City Elections: Regression Model........ 88C.2. Descriptive Statistics of Variables for Observations in the
Regression............................... 90D.1. Determinants of Competition for Office ........... 92


xix
Acknowledgments
We are indebted to the city clerks of California for giving their timeand providing much of the data on which this report is based. We wouldalso like to thank Peter Richardson and Patricia Bedrosian for theirexpert editorial advice. Amy Bridges, Christopher Hoene, ChristopherJepsen, Joyce Peterson, and Fred Silva all provided detailed comments onearlier drafts of the manuscript, and the report is much improved as aresult. Mark Baldassare offered a strong guiding hand throughout theproject. Angelina Reyes and Max Neiman provided useful feedback onthe survey instrument. Although this report reflects the contributions ofmany people, the authors are solely responsible for its content.


1
1. Political Participation andMunicipal Elections
Observers of municipal elections in California have often expressedconcern that only a small fraction of Californians actively participate inthese local contests. Yet no systematic studies of local voter turnout incontemporary California have been undertaken. In this report, wecalculate participation rates for municipal elections across the state andaddress a number of important related questions about the vitality ofthose elections. How does political participation vary across cities?1
What political structures and electoral laws are associated with lowturnout? What changes might promote higher turnout in local elections?Our data, drawn largely from a questionnaire mailed to all of the cityclerks in the state in 2000, also allow us to investigate related issues ofcompetition for local office and the role of incumbency in local elections.
Local Elections in the Context of Declining VoterParticipation
Voter participation at every level of government in California isdistressingly low and appears to be getting worse. In presidentialelections, almost half of all eligible voters in California do not vote(California Secretary of State, 2001). In midterm congressionalelections, over half of eligible voters fail to vote. The numbers are evenworse for statewide primaries, where turnout now hovers around one-third of eligible voters. If current trends continue, these rates will declinefurther. Between 1972 and 2000, statewide turnout dropped roughly 15percentage points in California (California Secretary of State, 2001).____________
1As is common in California, we use the term city as a synonym for municipality—inother words, a general-purpose, sub-county local government.

2
Without that decline, over 3 million more voters would cast ballots instatewide contests today.
Nowhere is the problem worse than at the local level. Despite thedirect effects that local government activities have on residents—forexample, in providing public safety and other essential services, buildinginfrastructure, and making land-use decisions—large numbers ofCalifornians and other Americans ignore local elections. Turnout inmunicipal elections around the country averages half that of nationalelections (Morlan, 1984), and local voter turnout often falls below one-quarter of the voting-age population (Bridges, 1997; Hampton and Tate,1996).2 Anecdotal evidence from several cities suggests that turnout inCalifornia is even lower than in the rest of the country (Bridges, 1997).At the local level, important public policy decisions are made withoutinput from most of California’s residents.
This civic disengagement raises serious concerns (Hill, 2000; Bennettand Resnick, 1990). First, it raises questions about the legitimacy ofdemocratic government. Democracy is supposed to operate at the will ofthe people. If a small minority of the population elects city, state, andnational leaders, political institutions and elected officials may lack thebroad support and confidence necessary to govern effectively. Second,low participation may reflect distrust of government (Bobo and Gilliam,1990), a reduced sense of civic duty (Wattenberg, 1998), and decreasedpolitical efficacy (Finkel, 1985). In California, evidence suggests thatthese conditions are already all too common.3
Third, voting serves as an important educational tool. Activeparticipation teaches citizens about the functioning of government andthe issues that are currently under debate (Bennett and Resnick, 1990).____________
2Moreover, trends over time suggest that voter turnout in local elections is decliningjust as rapidly as it is in national elections (Verba et al., 1995; Karnig and Walter, 1993).
3As Baldassare (2000, p. 26) summarizes Californians’ opinions about government,“It is clear that Californians don’t care much and are cynical about politics. . . . They seetheir governments as bloated bureaucracies and believe that their elected officials are inthe pockets of special interest groups. They don’t believe what candidates are tellingthem in television commercials. They think what they read in the newspapers aboutpolitics and government is probably slanted or biased.”

3
Without such participation, Californians may be less able to identifytheir best interests or to know how to protect those interests. Thus, lowparticipation may increase the likelihood that policy decisions reflect aninaccurate and incomplete understanding of the available policy optionsand may lead to inefficient outcomes that hurt Californians.
The very unequal distribution of voters and nonvoters amongdifferent segments of the population heightens each of these concerns.California residents who are highly educated, wealthy, old, and white aremuch more likely to participate than residents who are poor, young, lesseducated, and nonwhite (Table 1.1). These differences are especiallylarge across educational levels. Fewer than half of eligible, voting-ageCalifornians have a college degree or some college, yet these citizensconstitute nearly three-quarters of all voters. A similar story can be toldfor racial and ethnic differences. Although about half of California’stotal population is non-Hispanic white, some 72 percent of registeredvoters in 2000 were white. At the opposite end of the spectrum,
Table 1.1
The Demographic Profiles of California’s Voters and Nonvoters
Percentage ofVoters
Percentage ofUnregistered
ResidentsWhite 72 44Latino 16 40Asian American 4 9African American 6 5
Income under $40,000 49 63Income $40,000 or more 51 37
High school degree or less education 26 56Some college or more education 74 44
Age 18 to 34 27 49Age 35 to 54 42 39Age 55 and older 31 12
SOURCE: PPIC Statewide Surveys, 1998–2000.

4
Latinos made up only 16 percent of registered voters but accounted forfully 40 percent of the unregistered population.4
One major problem with an unrepresentative voting population isthat it may skew the outcomes of the democratic process (Verba et al.,1995; Guinier, 1994; Casel, 1986). If, for example, a largely whiteelectorate determines policy with little input from nonwhite voters, theremay be reason to suspect that minority interests will be short-changed.More generally, if the interests of nonvoters diverge in important waysfrom those of voters, the candidates who are elected and ultimately thetypes of policies that are enacted may well favor one group over theother. Put simply, only a few will be speaking for the interests ofnonvoters.
In presidential elections, where turnout is relatively high, thepolitical preferences of voters and nonvoters are not that dissimilar(Teixeira, 1992; Wolfinger and Rosenstone, 1980). However,differences in policy preferences are likely to be much greater in localcontests where turnout is substantially lower and often more skewedalong the lines of race and socioeconomic status (Wattenberg, 1998;Alford and Lee, 1968). In California, statewide surveys suggest that theviews of registrants do differ from those of unregistered Californians insystematic and sometimes important ways (Table 1.2).5
A sample of voting intentions on recent California propositionssuggests that Californians who are registered are significantly moreconservative than unregistered Californians across an array of issuesincluding labor union contributions to political campaigns (Proposition226), bilingual education (Proposition 227), and school bond initiatives(Proposition 1A). However, the differences between registered votersand unregistered residents are not found across all issues. On issues suchas defining marriage as a union between a man and a woman____________
4In this report, “white” refers to persons who identify as white and not Hispanic.The terms Hispanic and Latino are used interchangeably, as are the terms AfricanAmerican and black, reflecting the manner they are listed in the 2000 Censusquestionnaire.
5Survey respondents often claim to have voted when they did not, making thisanalysis suggestive rather than definitive.

5
Table 1.2
The Different Preferences of Voters and Nonvoters
Percentage in FavorRegistered
VotersUnregistered
ResidentsProposition 22 (limit on marriages) 61 63Proposition 1A (education bond) 73 85Proposition 227 (bilingual education) 71 62Proposition 226 (political contributions by unions) 61 49
SOURCE: PPIC Statewide Surveys, 1998–2000.
(Proposition 22), differences between the registered and unregistered areless stark. In the end, it is unknown whether the divergent views of thosewho participate and those who do not participate translate into distortedpolicy outcomes, but given the large differences found between votersand nonvoters in California, the relatively low turnout in local electionsmerits attention.
For all of these reasons, low turnout in local elections poses apotentially serious problem. In a political arena that touches regularlyand deeply on the daily lives of residents, nonparticipation by a largeshare of eligible voters is worrisome. Failing to vote may be a sign notonly of political disengagement but also of distrust, division, andcynicism. Where participation is low, government outcomes may be lessequitable or responsive. Thus we seek to understand which factors affectvoting levels in California’s municipal elections and what steps might betaken to try to encourage broader participation.
Do Policymakers Have Any Potential Leverage overLocal Participation?
Can anything be done about this low rate of voter turnout inmunicipal elections? This report examines four sets of variables to helpdetermine which factors are associated with higher or lower turnout:election timing, the structure of electoral and political institutions, the

6
context of the particular elections, and the demographic attributes of thecities in which they take place.6
Most research on political participation has focused on demographicfactors related to voting. 7 We focus most of our attention on timing,institutional structure, and context. Although these three features oflocal elections have been less well studied, they are potentially significantfor policymakers interested in increasing local voter participation.Unlike demographic attributes, which are either impossible or extremelydifficult for city policymakers to alter, the three features that we focus oncan often be manipulated by local governments. Californiamunicipalities (particularly charter cities) generally have the ability toalter the way they conduct elections and can in many cases reform theirinstitutional structure, although in some cases state legislative action maybe necessary. Thus, if it turns out that voter participation is related toany of these three features of the local electoral context, changes could beenacted to broaden political participation.
To fully understand the role that timing, institutional arrangements,and context might play, it is necessary to outline a series of changesenacted in response to the Progressive movement roughly a century ago(Bridges, 1997; Welch and Bledsoe, 1988). These institutional changeswere, according to the Progressives, crucial to the functioning of “goodgovernment” at the municipal level. Opponents and subsequent criticshave viewed the institutional changes pushed by the Progressives asefforts to limit the participation of the working class and of ethnic groupsand to usurp power at the local level (Bridges, 1997). Whatever the truemotives of the Progressives, the result of their efforts is that many citiesin California and across the country fundamentally altered their basicgoverning structure. New cities that have since formed in growing____________
6Mobilization by parties and campaigns and individual attitudes toward the politicalarena can also have an effect on voter turnout (Rosenstone and Hansen, 1993; Dennis,1991). However, study of these factors is beyond the scope of this report.
7Our data relate to municipal political systems rather than to individual voters.Therefore, we will refrain from drawing inferences about individual-level attributes thatmay affect city-level participation, although we do take account of these demographicfactors as “controls.”

7
western states such as California have also typically incorporated most orall of the institutions that were advocated by the Progressives.
One change supported by the Progressives was a move from on-cycleor concurrent elections—elections that coincide with statewide ornational contests—to off-cycle or nonconcurrent elections. Progressivesclaimed that this change in election timing would mean that localcontests would be decided by the most interested and knowledgeablevoters. Critics countered that nonconcurrent elections were pursued as ameans to limit participation to those segments of the population mostlikely to support Progressive candidates. Whatever the initial motivation,many cities across the state have set the timing of their elections so thatthey do not coincide with state or national contests. Election timing isespecially important for our purposes because studies at the national levelhave revealed a strong relationship between on-cycle elections and higherturnout (Espino, 2001; Hampton and Tate, 1996).
The second institutional feature of local elections that we focus on isthe electoral mechanism used for the city council. In an attempt topurportedly reduce “narrow” neighborhood interests in favor of citywideconcerns, Progressives favored at-large elections over district- or ward-based contests.8 Evidence nationally suggests that this change may havereduced voter interest and participation by distancing leaders from theirconstituencies (Bullock, 1990).
One reform sought by Progressives, direct democracy, may haveincreased voter turnout (Hahn and Kamieniecki, 1987; but see Magleby,1994). By giving more decisionmaking power to the people in the formof initiatives, referenda, and recall, Progressives hoped to take poweraway from entrenched local politicians and interest groups who were, intheir view, corrupt.9 In the process, these changes may have increasedvoter participation by increasing citizen interest in local elections.____________
8Critics have seen the move to at-large elections simply as a way for the Progressivesto usurp power for their own “narrow” interests and reduce the influence of ethnicneighborhoods.
9Critics have countered that direct democracy was a way for Progressives to pursuetheir own agenda, and that the initiative process is itself often wielded by special-interestgroups.

8
These reforms have not been pursued (or in the case of local voterinitiatives, used) uniformly across the state. Chapter 2 provides greaterdetail on just how widespread change has been. For now, the importantpoint to note is that variation in these institutions and the frequency oflocal initiative use make it possible to analyze the effects of such electoraland governance arrangements on voter turnout. By studying therelationship between cities’ turnout and their institutional structure, weshould be able to determine what, if any, institutional changes might bepursued to increase the participation of Californians in local electoralpolitics.
The effects of two other institutional changes pursued by theProgressives—nonpartisan local elections and the council-manager formof government—cannot be evaluated in California because they exist invirtually every city in the state. There is reason to suspect that both haveaffected turnout.10 Nonpartisan elections—those in which party labelsare not included on the official ballot and parties do not have controlover nominating procedures—are mandated for local elections statewideand are thus not included as a variable in our analysis. Similarly, almostall cities in California have chosen a council-manager system in whichthe day-to-day operations of the city are overseen by an unelectedprofessional city manager or administrator, who is appointed by thecouncil. By contrast, the earlier tradition of the mayor-council plan ofgovernment gives stronger executive powers to a directly elected mayorwho does not sit as part of the city council. In practice, variation withinthe two forms of government (council-manager and mayor-council) maynow be as important as the distinction between the two plans.11 For thisreason we focus more on measures of mayoral strength, where available,____________
10Nationwide, nonpartisan elections have reduced voter turnout—perhaps bylimiting the efforts of parties to mobilize voters (Schaffner, Wright, and Streb, 2001;Espino, 2001). Similarly, national studies have found that the move to the council-manager system has reduced voter participation—perhaps by providing for a weakerelected executive and a more insulated administration than its predecessor, the mayor-council system of government (Karnig and Walter 1983; Espino 2001).
11Cain, Mullin, and Peele (2001) have detected a number of hybrid forms and haveillustrated cases in California where, despite the presence of the council-manager system,mayors have extensive managerial and agenda-setting powers.

9
than on the traditional distinction between council-manager and mayor-council forms of government.
Several facets of local institutions and elections for which theProgressive movement is not responsible are also of interest. Forexample, one important consideration concerns local service provision.Although the norm in earlier periods of municipal government was forthe city to provide the full array of municipal services, a host ofalternative service arrangements have evolved in recent decades. Thesearrangements range from provision of municipal services by specialdistrict governments or county departments to efforts to contract outservice provision to private firms. In some “contract cities,” particularlyprevalent in Southern California, few local public services are actuallydirectly carried out by city employees. Under these circumstances, somemeasure of direct influence is removed from the hands of city electedofficials, potentially reducing interest in municipal politics anddepressing turnout.
Term limits are a more recent electoral reform that might alsoinfluence local voter turnout. Many cities in California have sought tocurb the powers of incumbents, encourage more candidates to run foroffice, and ultimately increase competition for office by limiting thenumber of terms that mayors or council members may serve. At thispoint, however, it is unclear just what effects term limits have had oneither competition or turnout (Thompson and Moncrief, 1993).
Finally, we also examine the distinction between charter cities andgeneral-law cities as an institutional factor potentially affecting localresidents’ participation in politics. About one-fifth of California citiesare organized under charters, or local constitutions, in which local votersconsent to a specific set of organizational arrangements and powers forthe municipality. The rest derive their authority from and operate underthe provisions of state law relating generally to local government.Historically, charter cities retained more autonomy from the whims ofthe state than general-law cities, although in recent decades legislativechanges and court decisions have eroded the distinction between the twotypes of municipalities. In general, all California municipalities have arelatively broad grant of home-rule authority. Charter cities arepermitted to adopt a “strong mayor” form of government, alter the

10
number of council members (from the otherwise prescribed five), andhave somewhat greater leeway regarding purchasing arrangements andpersonnel.12 Whether charter status reflects these modest additionalpowers or a more activist tradition of municipal home rule in the city’spast, some might expect that charter cities would experience more voterinterest in local politics and thus perhaps higher turnout.
In addition to our strong interest regarding the potential effects oflocal institutions on turnout, we also focus on a number of contextualfeatures of local elections that may influence voter participation. Forexample, one important factor that has the potential to drive turnout atany level in politics is the degree of competition among candidates foroffice (Cox and Munger, 1989). Similarly, the well-known electoraladvantages that incumbent officeholders have may reduce the chances ofpotential challengers (Jacobson, 1983), thereby possibly making electionsless interesting to voters.
Incumbent Reelection and Competition for OfficeIn this report, we also examine two of the potential pitfalls that
might be associated with increased turnout and, specifically, with on-cycle elections: reduced competition for office and greater protection forincumbents. A number of observers of local politics suggest thatconcurrent elections deter challenges to incumbents by reducing theprominence of local elections (Johnson, 1994). With popular attentionfocused mainly on national and state contests (and in California,statewide initiative elections), local challengers might find it hard to gainattention, garner media coverage, and raise enough money to warrantentering the race.
A move to concurrent elections might also conceivably helpincumbents by incorporating voters with little interest in or knowledge oflocal affairs, many of whom might thus vote for incumbents by default.Already, some scholars argue that voters seldom have the necessaryknowledge to make informed decisions (Campbell et al., 1980). In this____________
12Charter cities, unlike general-law cities, are also allowed to adopt zoning codesthat are not strictly consistent with the local general plan. On charter status, see Sokolowand Detwiler (2001); Curtin (2000, p. 18).

11
way, higher turnout and concurrent elections might potentially lead toless competitive elections. Analyzing the level of competition inmunicipal elections and the success rates of incumbents thus providesadditional insight into the political vibrancy of cities around the state.
A Need for New Evidence: Examining VoterTurnout in California Cities
There is at least anecdotal evidence indicating that each potentialinstitutional and contextual factor we have outlined above may affectvoter turnout in America’s municipalities. Yet few of these factors havebeen tested systematically across a wide range of cases, largely because ofa lack of suitable data. The last major published study of municipalelection turnout appeared more than 30 years ago (Alford and Lee,1968). This study is intended to fill this gap.
Much of the analysis relies on data from a questionnaireadministered to city clerks. In Chapter 2 we describe this fact-gatheringsurvey and provide an overview of the institutional structures andelectoral laws in place in the state’s municipalities, as disclosed by thesurvey respondents. Chapter 3 summarizes our statistical analysis of thefactors that influence voter turnout, detailing the role of institutional,contextual, and demographic factors. Chapter 4 turns to other issuesrelated to engagement in city electoral politics, examining competitionfor office and the success of incumbents. The report concludes inChapter 5 with a discussion of the implications of these results forunderstanding citizen participation in California’s local elections and thepolicy implications of the study’s findings.

13
2. Voter Turnout and LocalContexts: Results from aSurvey of City Clerks
To gather the data necessary for our central research questions, wedevised and distributed a mail questionnaire to each Californiamunicipality. This chapter describes the survey, the resulting sample,and the information gathered regarding voter turnout patterns,institutional structure, and the context of city elections. The mostimportant finding from the simple survey results is that turnout is quitelow in California municipal elections, averaging well below half ofregistered voters.
Mail Survey Procedures and Response RateThe questionnaire was mailed to every city clerk in the state in late
2000. City clerks are designated as the chief municipal elections officials,although the actual task of administering the election and tallying votesrests with the county government. City clerks, furthermore, often haveunique, first-hand knowledge about the political life of theircommunities.1 Of the 474 cities in existence at the time of the survey, atotal of 397 clerks (84 percent) returned surveys with at least some of thenecessary responses; however, complete and usable data for calculatingvoter turnout rates themselves were available for a smaller number—350cities. The 350 responses allow us to report turnout data for 79 percentof the cities in the state, a solid rate of response.
Our sample of cities is generally representative of all cities in thestate. Comparing cities that responded to those that did not revealed fewsignificant differences. Cities in and out of the sample were similar in____________
1For a study that relies on city clerks as informants regarding local politics seeSchneider and Teske (1995).

14
terms of regional location (Southern California, San Francisco Bay Area,Central Valley, or other) and in terms of the percentage that were centralcities, suburbs, or rural communities. Our sample was also representativein terms of racial demographics, percentage of residents unemployed,median household income, and home ownership rates. There weremarginal differences between cities in and out of the sample in theaverage size of the population, the average household size, and thepoverty rate. Compared to other city clerks, those in larger communitieswere more likely to respond. A random sample of responses wasvalidated using municipal web pages and a variety of other sources.Errors were minimal, and any errors that were found were corrected.Appendix B provides a more detailed discussion of the survey procedure,the representativeness of the sample, and response validation.
We asked each city clerk a series of questions about his or hercommunity’s most recent city council election and mayoral election.Every city holds council elections, but only one-third of cities thatresponded directly elect their mayor, yielding a total of 130 mayoralelections. In subsequent chapters, we analyze a dataset that combinesboth council and mayoral elections. When we examined each type ofcontest separately, the results were generally quite similar to thosepresented in this report.
Ascertaining Voter Participation Rates: The Coreof the Survey
The key variable in this report is voter turnout. For each election,we asked city clerks to report the total number of residents who castballots, as well as the total number of registered voters at that time in thecity (or in the relevant districts if only certain city council district seatswere up for election). In addition, we estimated the size of the voting-age population for each city at the time of the election. The CensusBureau publishes the voting-age population of every city but only fordecennial Census years. Thus, the measure we use is an interpolation

15
(for the particular year of the election) between the voting-agepopulation in the city in 1990 and in 2000.2
In the analysis that follows, we focus on two dependent variables:the percentage of registered voters who cast ballots for local office in agiven election and the percentage of voting-age residents who cast ballots.We focus heavily on turnout of registered voters because we believe thatit is likely to be the measure most directly affected by changes in the localinstitutional and electoral context. Registered voters have already clearedthe major entry barrier to political participation (registration) and thuswhether or not they vote is likely to be closely related to conditions at thetime of the election. Also, our data on registered voters are moreaccurate than our interpolated estimate of voting-age residents.
At the same time, if we want to know how likely the population atlarge is to participate in local elections, it is important to examineturnout of the voting-age population as well. By focusing on the voting-age population and not the registered population, we can take account ofthe intermediate step of voter registration, which has at times in the pastbeen used to exclude certain segments of the electorate (Parker, 1990;Davidson and Grofman, 1994).3
Although registration procedures are set by state and federal laws,they are typically administered by county officials, who historically havehad a fair amount of latitude in carrying out these procedures. Althoughthe average city in our sample had an (estimated) registration rate of 63.8percent, there was a wide degree of variation in this rate acrosscommunities.4 Thus, differences in registration rates across cities couldhave a number of different causes other than simply the level of interest____________
2Obviously, this measure is more precise for those cities that reported on electionsheld in 2000.
3One could also specifically examine the process of registration. For example,Mitchell (1992) demonstrated how voter rolls have at times been purged, seemingly forarbitrary reasons, such that certain segments of the population were disenfranchised.However, despite the fact that the percentage of residents registered, turnout of voting-age population, and turnout of registered voters measure somewhat different aspects ofparticipation, they are often fairly highly correlated (Hampton and Tate, 1996).
4The standard deviation for the percentage of adults registered was 16.2 percent.

16
in elections. As a result, higher turnout of registered voters may notnecessarily indicate broader participation but might instead be a sign thatbarriers to registration at the local level have reduced the number ofregistered voters.
For these reasons, we undertake all subsequent analyses for bothturnout of registered voters and turnout of the (estimated) voting-agepopulation. In practice, turnout of registered voters and turnout of thevoting-age population are very highly correlated among California cities(r = 0.85), and the factors that lead to increased turnout of registeredvoters also tend to increase turnout of the adult population.
Is Low Voter Turnout a Problem in CaliforniaCities?
Compared to voter turnout in statewide and national contests, localvoter turnout is low. In the last presidential election, 71 percent ofCalifornia’s registered voters participated. Recent statewide contests forgovernor have attracted roughly 60 percent of registered voters(California Secretary of State, 2001). Our data indicate that voterturnout in municipal elections falls well below these levels. Of the 130cities reporting directly elected mayors, only 44 percent of registeredvoters showed up at the polls and cast a vote in the average contest. Incity council elections, where we have complete turnout data for 350municipalities, the mean turnout was similar—48 percent. Measured asa percentage of the voting-age population, turnout looks even worse.Turnout in mayoral contests averaged only 28 percent of the voting-agepopulation. In council elections, the average was 32 percent of thevoting-age population.
It is also possible to calculate the overall participation rate amongthese cities—the number of voters who cast ballots in all of the cityelections for which we have data, divided by the total number ofregistered voters in those cities at election time. We found that theoverall participation rate in council elections was 43 percent of registeredvoters; only 3.7 million voters out of 8.6 million registered in thesecommunities cast ballots in their most recent city council contest. Theaggregate turnout rate for mayoral elections was even lower: 39 percent.

17
These low levels of turnout are disturbing. Important policydecisions are being made by local officials chosen by a relatively smallgroup of citizens who may differ in important ways from the nonvotingpopulation.
Election Timing, Local Institutions, and ContextWhy are so many Californians not voting in local contests? What is
it about California’s municipal elections that leads to low turnout? Tohelp answer these questions, we endeavored to ask city clerks about asmany potentially relevant factors as possible. In particular, we askedseveral questions about three sets of factors that one might expect to havean effect on voter turnout rates: the timing of mayoral and councilelections, the set of political and electoral institutions found in each city,and the political context of the specific election of interest. In thesections that follow, we discuss the motivations behind these questionsand describe the city clerks’ responses.
Most of our discussion of possible solutions to the problem of lowvoter turnout focuses on election timing and local institutions, for threereasons. First, election timing and institutional structure have beenhighlighted as potentially important contributors to low voter turnoutacross the country (Espino, 2001; Hampton and Tate, 1996).5 Second,it is relatively easy to alter these institutions. In some cases, only a localordinance would need to be changed; other changes would requirealterations to city charters or state law. Third, changes in theseinstitutions and electoral laws are not unprecedented. Throughout thelast century, numerous alterations were made to the basic governingstructure of cities in the United States and changes are still routinelyconsidered for a variety of reasons.
Although our primary purpose in conducting the mail survey was totry to understand voter turnout in municipal elections, we believe thatthe data we present on the electoral procedures and institutionalstructures of California’s cities are important in and of themselves.____________
5Other electoral laws considered relevant to voter turnout, but not examined here,are the types of registration requirements and the ease of registration (Powell, 1986),along with nonpartisanship (Schaffner, Wright, and Streb, 2001).

18
Given the fluid nature of the electoral procedures and institutionalstructure of California’s cities, it is important to provide some basic factson what California’s city governments look like. To date, few systematicdata have been collected on the distribution of electoral institutions andgoverning structures across California’s cities. The following sectionsshould begin to fill in these gaps.
Election Timing: The First KeyAmong the structural factors related to voter turnout, we are most
interested in the timing of elections. Scheduling local elections on thesame date as statewide primaries or general elections may increase localturnout to levels almost on par with voting in national elections. Havingthe dates of local elections coincide with the dates of statewide primaryor general elections (often referred to as “on-cycle,” “consolidated,” or“concurrent” elections) makes participation in local elections easier.Voters need only check off names further down the ballot to participatein the local political contest. Given the significantly higher turnout ratesfor national and state elections, gains in turnout could be substantial.
Moreover, cities have other incentives besides increased voterparticipation to switch to concurrent elections. In fact, the primarymotivation for this move has usually been cost savings. Becausemunicipalities generally pay the entire cost of holding nonconcurrentelections and only a fraction of the costs of concurrent elections, localofficials tend to view this move as a way to cut the costs of administeringelections. For example, the city of Concord recently estimated that itscost for running a stand-alone election would be $58,000—more thantwice as much as the $25,000 estimate for running a consolidatedelection (Simerman, 1998). However, local elected officials could havemotivations for opposing a move to concurrent elections. By staggeringlocal and statewide contests, local officials often have the opportunity torun for positions in state government without giving up their localpositions. On-cycle local elections would limit that ability.
Numerous local governments have already moved the dates of theirelections to coincide with statewide elections, and many others haveconsidered the change (Rohrs, 2000; Simerman, 1998). In Contra CostaCounty, for example, 55 cities, school districts, and special districts (out

19
of 73 total local governments) were running consolidated elections as of2000—up from just 36 in 1996 (Rohrs, 2000). Our survey data indicatethat at least 134 cities in California have changed the timing of localelections in recent years, with the vast majority of those switching fromstand-alone elections to elections concurrent with statewide contests.6
We asked survey respondents to record the date of their most recentcouncil and mayoral elections (if applicable).7 These election dates canbe classified as falling into one of the following five categories:presidential election, presidential primary, gubernatorial election, odd-year November election, or completely off-cycle election (Table 2.1).
A large fraction of the cities that responded to our questionnaire (20percent) hold off-cycle city council elections, usually in the spring. Ofthe cities that directly elect their mayor, a similar percentage (17 percent)hold off-cycle elections. Roughly one in six cities hold mayoral orcouncil elections in November of odd-years. In total then, about one-
Table 2.1
Timing of California Municipal Elections
Percentageof CouncilElections
Percentageof MayoralElections
Election Timing (N=397) (N=134)Presidential 12.6 8.2Presidential primary 5.8 6.7Gubernatorial 44.6 52.2Odd-year November 16.6 15.7Off-cycle 20.4 17.2
NOTE: Data refer to the most recent election, orin some cases to the most recent contested election.
____________ 6Specifically, of the 308 clerks answering the relevant survey question, 94 (30.5
percent) indicated a change from nonconcurrent to concurrent elections, 3 (1 percent)switched from concurrent to nonconcurrent dates, 37 (12 percent) indicated a changefrom one nonconcurrent date to another, and 137 (56.5 percent) indicated no change.This calculation excludes 94 cities, or about one-quarter of the total number ofrespondents, who did not answer this question. Most likely these cities did not change thetiming of their elections.
7Several cities whose last election was uncontested—that is, where the number ofcandidates equaled the number of seats—chose, helpfully, to report instead on their lastcontested election.

20
third of all the local elections that city clerks identified werenonconcurrent in one form or another (odd-year November or off-cycle).Thus, if election timing does matter and nonconcurrent elections areassociated with particularly low turnout, there is clearly room forimprovement.
Another important question about election timing is whethermayoral and council elections are held simultaneously with other localcontests, including those for other citywide offices (such as city attorneyor treasurer) or for other governing bodies (such as school boards orcounty boards of supervisors). The presence of these other local electionsmight also serve to spur turnout. With this in mind, we asked city clerkswhether a number of other local offices were being voted upon on thatsame day.
In just over half (53 percent) of the cities responding to the survey,voters were casting ballots for at least one other local office. The officesmost commonly elected on the same day as city offices were school board(31 percent) or county supervisor (17 percent). In response to a relatedquestion, 96 percent of the cities that directly elect their mayors heldcouncil elections at the same time; 25 percent of the council contestsreported by the clerks had a mayoral election on the same day.
Governmental Structure and Electoral LawsIn addition to election timing, four factors identified by past research
have the potential to affect turnout and are to some extent controlled bypolicymakers or voters. They are the method of electing councilmembers, the use of term limits, the provision of services by the city, andthe general form of government.
District Versus At-Large ElectionsAs part of their institutional reform agenda a century ago,
Progressives sought to create at-large or citywide elections to choosemembers of the city council. Reformers of the time maintained thatreplacing district elections with at-large elections would weakenneighborhood and partisan interests in favor of less parochial citywideinterests. Recent critics of the move, however, have suggested that at-large districts not only decrease participation by distancing leaders from

21
their local constituencies (Bullock, 1990) but also may hurt the interestsof geographically clustered racial and ethnic minorities who may beoverwhelmed by a white voting plurality (Engstrom and McDonald,1982; Welch, 1990; but see Bullock and MacManus, 1990).
Our survey indicates that district elections are not widespread inCalifornia. Only 21 cities (5 percent) used the district form at the timeof our survey. Another nine cities used some hybrid form that typicallyinvolved each district voting to nominate two candidates, with a citywiderunoff between each pair.8 The vast majority of California cities (93percent) use a simple at-large system of electing council members.
Term LimitsTerm limits are a more recent electoral reform that may influence
local voter turnout. One motive for term-limit proponents is to increasethe competitiveness of elections. Term limits are seen as a tool to levelthe playing field, encourage more candidates to run for office, andultimately make elections more dynamic (Copeland, 1997). However,an unintended consequence of term limits may be to increase voterconfusion and disinterest by introducing a greater number of “unknown”nonincumbents into electoral contests (Rosales, 2000). At this point, itis unclear what effect term limits have had on either competition orturnout (Thompson and Moncrief, 1993).
Californians favor term limits for many of their elective offices, atleast at the statewide level.9 Term limits at the local level are far lesscommon, however. Nationwide, about 10 percent of cities place limitson the number of times city council members or mayors can run forreelection (ICMA, 1996). In California, these proportions are somewhathigher. Our data indicate that nearly one in five city councils faces term____________
8Since these mixed systems have strong elements of district-level selection, weclassify them with the district cities in the analysis in the chapters below.
9Californians voted in a bare majority (52 percent) in 1990 to support Proposition140, which established term limits for state offices including the state assembly andsenate. State voters were much more responsive to a state amendment to requirecongressional term limits—Proposition 163 passed with 64 percent of the vote in 1994—although this law was later ruled unconstitutional.

22
limits. Of mayors who are directly elected, 27 percent (36 cities) areterm-limited.
City Service ProvisionOne of the most controversial issues in municipal governance is the
question of whether city services should be directly provided bymunicipal employees or by some other entity. In an effort to reducecosts and provide more efficient services, numerous cities in Californiaand elsewhere have chosen alternative arrangements for providing localservices such as police protection or garbage collection. Often theseservices are performed by private firms, special districts, the countygovernment, or other nearby local governments.
Whether such arrangements ultimately reduce costs and improveservice quality has been widely debated. However, it is likely that localelected officials in cities that do not provide such services with in-housestaff have somewhat less direct influence; if nothing else, they have fewercity jobs to control. The reduced role for city staff and elected officialsmay have the unintended consequences of reducing interest in municipalpolitics and depressing voter turnout.
To investigate this issue, we asked city clerks to indicate their cities’arrangements for five common municipal services: police, fire, library,sewerage, and garbage collection. Clerks were asked to indicate whethereach service was “mainly carried out by city government personnel, bycounty personnel, by a special district government, or by a privatecompany under contract with the city.”
Cities varied widely in terms of the number and type of services thatwere provided by other governments or private companies. The meannumber of city-provided services was 2.4—roughly half of the five weasked about—indicating that contracting and alternative servicearrangements are quite common among the state’s municipalities.However, 13 percent of cities indicated that city staff provided none ofthe services in question and 25 percent responded that they providedfour or five of the services with their own staffs. Police, fire, andsewerage were the functions most likely to be carried out by citygovernment personnel (Figure 2.1). At the other extreme, trashcollection was rarely performed by city staff.

23
Per
cent
age
of c
ities
90
70
60
50
40
30
20
10
0GarbageSewerLibraryFirePolice
Service
80
CityOther governmentPrivateNot provided
Figure 2.1—Service Provision by Type and Provider
The Form of Government in CitiesHistorically, California’s cities have been classified into two
categories: charter cities and general-law cities. Although the distinctionbetween the two categories has diminished over time (as noted inChapter 1), charter cities (which tend to be the larger cities in the state)still have somewhat greater autonomy than general-law cities. Forexample, charter cities can revise certain aspects of their electoralinstitutions—such as the number of city council members—more easilyand have slightly more discretion regarding procurement and personnelarrangements. This greater autonomy suggests that voters in chartercities have more at stake in local elections. Thus, we might expect voterturnout to be slightly greater in charter cities.
Although we did not ask specifically about this distinction in thequestionnaire, we were able to obtain data on the basic form ofgovernment for each city from the California Secretary of State’s office.Most of the cities (79 percent) responding to our questionnaire aregeneral-law municipalities. Some 98 cities (or 21 percent of the sample)are charter cities.
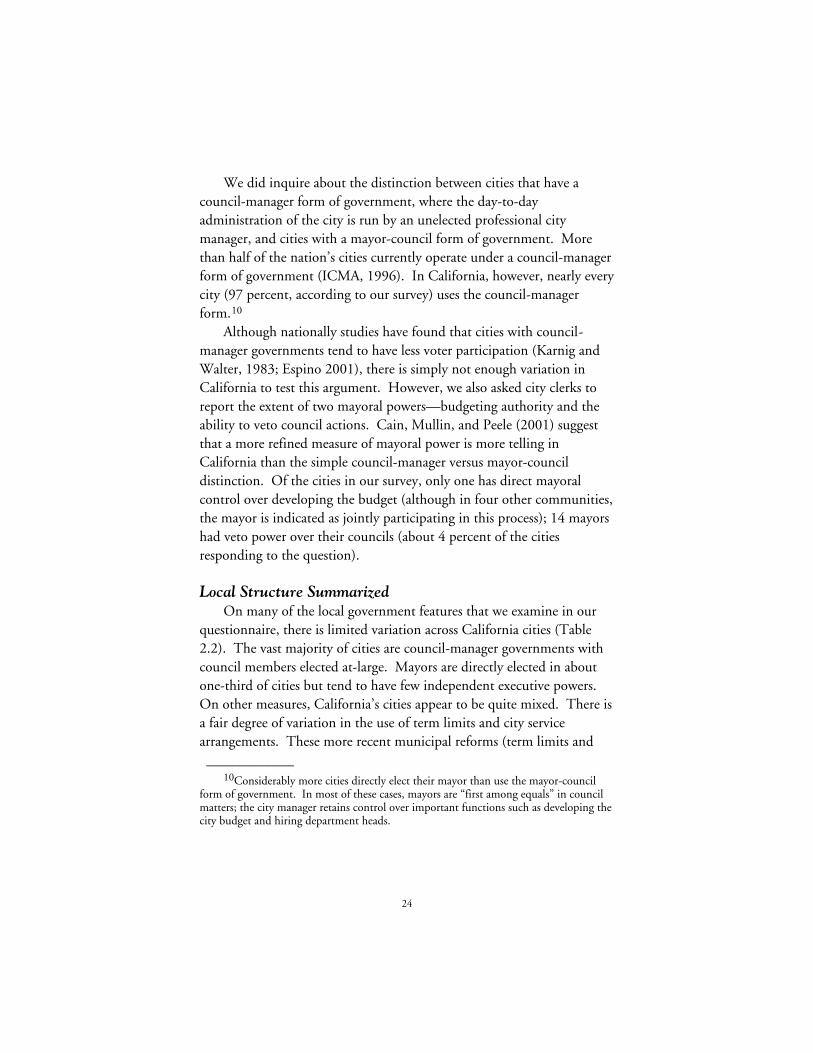
24
We did inquire about the distinction between cities that have acouncil-manager form of government, where the day-to-dayadministration of the city is run by an unelected professional citymanager, and cities with a mayor-council form of government. Morethan half of the nation’s cities currently operate under a council-managerform of government (ICMA, 1996). In California, however, nearly everycity (97 percent, according to our survey) uses the council-managerform.10
Although nationally studies have found that cities with council-manager governments tend to have less voter participation (Karnig andWalter, 1983; Espino 2001), there is simply not enough variation inCalifornia to test this argument. However, we also asked city clerks toreport the extent of two mayoral powers—budgeting authority and theability to veto council actions. Cain, Mullin, and Peele (2001) suggestthat a more refined measure of mayoral power is more telling inCalifornia than the simple council-manager versus mayor-councildistinction. Of the cities in our survey, only one has direct mayoralcontrol over developing the budget (although in four other communities,the mayor is indicated as jointly participating in this process); 14 mayorshad veto power over their councils (about 4 percent of the citiesresponding to the question).
Local Structure SummarizedOn many of the local government features that we examine in our
questionnaire, there is limited variation across California cities (Table2.2). The vast majority of cities are council-manager governments withcouncil members elected at-large. Mayors are directly elected in aboutone-third of cities but tend to have few independent executive powers.On other measures, California’s cities appear to be quite mixed. There isa fair degree of variation in the use of term limits and city servicearrangements. These more recent municipal reforms (term limits and____________
10Considerably more cities directly elect their mayor than use the mayor-councilform of government. In most of these cases, mayors are “first among equals” in councilmatters; the city manager retains control over important functions such as developing thecity budget and hiring department heads.

25
Table 2.2
Local Government Structure in California
Percentage ofCities (Number)
At-large council elections 93 (362)District method 5 (21)Combination 2 (9)
Term limits—council members 18 (71)Term limits—mayor (of directly elected mayors) 27 (36)
Provide none of five city services with own staff 14 (54)Provide all five 8 (30)
General law 79 (309)Charter 21 (83)
Council-manager form 97 (384)Mayor-council form 3 (10)
Mayor develops (or jointly develops) the budget 1 (5)Mayor has veto power 4 (14)
NOTE: Percentages are of the number of cities answering each question.
contracting) are less well established, thus far, than the ones initiated byProgressives a century ago.
Electoral ContextWe also asked city clerks about several aspects of the context of
specific local elections. Although not as amenable to legislative change asthe structures of city government, the political context of city electionsmight also be expected to play a major role in influencing voter interestand participation. Here we consider various central elements of the localcontext: the presence of local ballot propositions, the degree ofcompetition for office, the presence of incumbents, and the race orethnicity of the candidates.
Local Direct DemocracyAlthough direct democracy has both proponents and critics, the
initiative process does offer the potential to increase turnout (Hahn and

26
Kamieniecki, 1987; but see Magleby, 1994).11 Certain statewideinitiatives such as Proposition 187, which sought to eliminate services toillegal immigrants and their children, have sparked greater participationby at least some sectors of the electorate, such as Latinos (Pantoja andSegura, 2000). These gains could also occur at the local level, given thatthe initiative process can also be employed in California’s cities andcounties. Use of the initiative has grown rapidly at the state level, and itis now fairly common to see more than ten propositions on the statewideballot.
We asked cities to identify the number of local propositions put onthe ballot, either by the city council or through the popular initiativesystem, in which citizen activists qualify a measure for the ballot bygathering voter signatures. According to the questionnaire responses,only 43 of the 387 cities (11 percent) had at least one municipal-levelcitizen initiative on their most recent ballot—indicating that despite thepress attention they gather, citizen initiatives occur in relatively few citieseach year. By contrast, 98 cities (25 percent) had a question placed onthe ballot by the council.12 We also asked city clerks to identify the totalnumber of citizen initiatives placed on their ballots from 1997 through1999 to get a longer-term perspective on the use of direct democracy inlocal elections. About 27 percent of cities had citizen initiatives over thisperiod, more than twice as many than in the single election we askedabout.
CompetitionOne key factor that can influence turnout at any level of government
is the degree of competition among candidates for office (Cox andMunger, 1989). Research has generally shown that the more competitivethe race for a particular office, the higher voter turnout is likely to be.What is not entirely clear at the local level is whether it is the closeness of____________
11For accounts of many of the criticisms of direct democracy see Gerber (1999),Schrag (1998), and Rose (1990).
12Respondents were instructed to report only city-level ballot questions, not, forexample, school district or county-level measures.

27
the contest that affects turnout or the sheer number of candidates vyingfor office. More candidates may be a sign of competing interests andgreater divisions that could in turn increase (or conceivably even depress)turnout.
Given the necessary brevity of a mail questionnaire, we were able toask clerks only a limited number of questions about competition. Clerksreported the number of candidates running for office and the presence ofincumbents. Because of the variety of methods used in selecting councilmembers, we could ask about the margin of victory only for mayoralelections.
The results indicate that elections in California municipalities arenot strikingly competitive. Council elections average 2.5 candidates foreach seat available; mayoral races attract slightly more but still fewer thanthree candidates on average. Perhaps more surprisingly, numerous citiesin California have uncontested elections—15 council races (or 4 percentof all cities) and 23 mayoral contests (18 percent of all mayoral elections)were reported as having the same number of candidates as seats available.These figures may overstate the actual amount of competition andunderstate uncontested races by an unknown amount, because a handfulof cities reported data for their most recent contested election, omitting asubsequent uncontested election. Indeed, cities with stand-aloneelections sometimes choose to cancel elections that are uncontested andsimply certify the lone candidate as the winner.
For mayoral elections, we asked city clerks to identify the portion ofthe vote captured by each of the top two finishers.13 Close races indicatea competitive election that might spur turnout, although it is unclear thatvoters would know in advance that the outcome is likely to be close. Asit so happens, mayoral races are rarely very close. In contested races, theaverage margin of victory was 24 percent. Only 13 percent of contestedmayoral contests were decided by a margin of 5 percent or less.However, a few elections might lead one to recall the 2000 presidential____________
13For more than half of the mayoral contests, there were fewer than threecandidates.

28
contest; three mayoral races, or 2.9 percent of the contested elections,were decided by 1 percent of the vote or less.14
IncumbencyAlthough term limits might influence turnout rates by limiting the
presence of incumbents, we also addressed the incumbency issue directly.Some have argued that because incumbents generally have widespreadname recognition, can “scare away” quality opponents, and can use theresources of elected office to raise large sums of money, their presence inan election may depress turnout.
The survey asked city clerks whether mayoral or council incumbentsran for reelection. For mayoral contests, we used a simple yes-or-noquery. For council elections, we asked for the number of council seats upfor election and the number of incumbents running. The results showthat incumbents are present in most elections. Two-thirds (66 percent)of the council seats available in city elections had an incumbent councilmember running. Of the mayoral races, 72 percent featured anincumbent mayor defending his or her seat. As might be expected, citieswith term limits had lower rates of incumbency, at least for council seats(55 percent). Oddly, the cities with mayoral term limits were slightlymore likely to have an incumbent mayor running (77 percent), but thismay be an aberration resulting from the low sample size (only 36 citiesdirectly elect mayors and have mayoral term limits).
Electoral Competition Across Races or EthnicitiesIn a diverse state with rapidly changing demographics, one might
expect contests for local office to draw more attention or seem moresalient if the contestants were from different ethnic or racial____________
14 The survey questions queried city clerks about the general mayoral election, not arunoff election. However, runoffs are quite rare, with only eight cities (6 percent)holding runoffs, of the 134 who directly elect the mayor. Even among those cities wherethe top candidate for mayor received less than 50 percent of the vote (because there weremultiple candidates), only a quarter held a runoff. Nearly all of the communities withprovisions for runoff elections are large central cities. Given the sizeable number of citiesthat elect a mayor with less than a majority of the vote, it is perhaps surprising that citieshave not considered adopting preference voting schemes, which provide for an “instantrunoff.”

29
backgrounds. For this reason, we asked the city clerks to identify therace or ethnicity of the first- and second-place mayoral candidates.15
Although not all respondents were willing or able to identify thecandidates in this way, we collected such information for 122 victors and97 second-place contestants (Table 2.3).
As the table indicates, more than three-quarters of winners andrunners-up were non-Hispanic whites. In most cases, the top twofinishers in a city were of the same race or ethnicity. However, in one-third of the contested elections for which we have race/ethnicityidentifiers for both candidates (32 of the 97 elections), the contest wasbetween candidates of different ethnic or racial backgrounds. Most ofthese cases (21 of 32) involved a race between a Latino candidate and awhite candidate.16
Table 2.3
Race or Ethnicity of Mayoral Candidates
Winner 2nd-Place FinisherNumber Percent Number Percent
White, not Hispanic 97 79.5 75 77.3Black, not Hispanic 5 4.1 7 7.2Asian, not Hispanic 1 0.8 2 2.1Hispanic, of any race 19 15.6 12 12.4Other 0 0.0 1 1.0
Total 122 100 97 100
Supplementing the Survey: City DemographicCharacteristics
As we noted earlier, local institutional characteristics and electioncontext are not the only factors that can influence turnout. Individualdemographic characteristics can also affect voter participation. Indeed,____________
15The large number of council candidates on a given ballot made it impossible toask city clerks about the race of council candidates on the questionnaire.
16In addition, there were six black/white contests, three Asian/white contests, oneLatino/black contest, and one white/other race contest.

30
the bulk of the existing research on voter participation has focused onsuch topics as socioeconomic status, age, mobility, and race. Wetherefore supplement our survey data with other data on localdemographic characteristics derived mainly from the 2000 Census.17
It is clear from existing research that individuals with highersocioeconomic status participate in politics at significantly higher ratesthan those with less education or income (Verba et al., 1995; Wolfingerand Rosenstone, 1980). Higher socioeconomic status implies a host ofresources such as time and cognitive ability that are important forparticipation. Several studies have also shown a strong relationshipbetween age, or stage in the lifecycle, and propensity to vote (Rosenstoneand Hansen, 1993). In general, younger residents are often not yetpolitically engaged and tend to be inactive voters. Elderly voters maysuffer from physical infirmities, but some studies indicate they are aslikely to vote, controlling for other factors (Wolfinger and Rosenstone,1980), and perhaps to be more involved in community civic affairs thanyounger generations (Putnam, 2000).
Race and ethnicity have also been tied to voter participation.Specifically, Latinos and Asian Americans have participated at lower ratesthan either whites or African Americans (Hajnal and Baldassare, 2001;Uhlaner et al., 1989). For Latinos, most if not all of this difference isaccounted for by socioeconomic status and citizenship factors, but thereasons for lower participation rates among Asian Americans remainsomething of a mystery (Lien, 1994). Another individual demographiccharacteristic associated with turnout is residential mobility. Because ofthe various time and information costs associated with registration andvoting, people who have moved recently are much less likely to vote thanthose who are longtime residents of a community (Squire and Wolfinger,1987).____________
17City population size, however, is measured with state Department of Financeestimates for 1998, rather than 2000 Census data. This is because the largest number oflocal elections in our dataset (47 percent of council elections) took place in 1998; another27 percent in 1999, compared to 22 percent who reported on 2000 elections and 4percent reporting on various pre-1998 elections. In any event, the Department ofFinance estimate is very highly correlated with the Census count (r = 0.9998).

31
Along with individual characteristics, some aggregate city-levelcharacteristics can also play a role in voter turnout. Although there isdisagreement about the size and the direction of the effect, citypopulation size has been shown to influence turnout. In most cases, alarger population has been associated with less social interaction andlower political participation. Oliver (2000) has argued that as city sizegrows, citizens are both less interested in participating in local politicsand less apt to be mobilized by local campaigns.
In our study of city-level voter turnout, we are not specificallyinterested in any of these demographic factors because they cannot bereadily manipulated to increase voter participation. However, to ensurethat our analysis of city-level institutions and electoral context is notbiased by differences in demographic characteristics across cities, weinclude controls for each potentially relevant local demographiccharacteristic. In each of the statistical models investigating voterturnout reported in Chapter 3, we include a specially constructedsummary variable representing the socioeconomic status (SES) of the citypopulation,18 along with controls for the percentage of the populationage 18 to 24, percentage age 65 or over; percentages of AfricanAmericans, Latinos, and Asians in the population; percentage who livedin the same house for five years (residential stability); percentageinstitutionalized; and the city population size.19 However, because weare examining aggregate turnout rates and aggregate city-level____________
18Measuring SES creates difficult statistical modeling issues, because the variousmeasures of status we are interested in (income, educational attainment, home ownership,etc.) are very closely correlated at the city level in California. Thus, we decided to usefactor analysis to reduce four important variables that are highly related to one another—median household income, poverty rate, percentage of college graduates among adultresidents, and percentage owner-occupancy of housing—into a single summary measure.The resulting factor score is the city’s principal factor loading for these four variables,with higher scores representing higher status. The SES score ranges from a low of –2.0(city of Huron) to a high of 4.6 (Rolling Hills), with a mean of 0. The SES score ishighly correlated with each of its component measures: income (0.98), education (0.84),poverty (–0.79), and home ownership (0.68).
19Because of extremely high collinearity (with percentage Asian and percentageLatino), we could not simultaneously include a measure of percentage immigrant in themodel.

32
characteristics, we will not be able to infer any causal relationship aboutindividual behavior from these measures.
SummaryIt is apparent from the questionnaire results that fewer than half of
all registered voters bother to come to the polls in municipal elections inCalifornia. Measured as a percentage of the voting-age population,turnout looks even more bleak. Just under one-third of voting-ageresidents turned out in these contests.
However, because turnout rates do vary across cities, it is importantto determine the timing, institutional, and contextual factors that mightshape local participation. We have highlighted several of those factors inthis chapter, showing for example that a sizeable number of city electionsare held on nonconcurrent or “off-peak” election dates, and that otherProgressive Era reforms such as at-large elections are the norm amongCalifornia cities. Electoral context also varies widely across the cityelections we examine. In the next chapter, we analyze the relationshipsbetween voter turnout and the structural and contextual factorsidentified here.

33
3. Accounting for Differencesin Voter Turnout AcrossCities
Voting gives Californians of all races, classes, and beliefs a voice.Through the vote, Californians communicate information about theirinterests and needs and make important decisions about who should holdoffice. Yet, as we showed in the last chapter, voter turnout in cityelections is low. Well below half of registered voters—possibly anonrepresentative sample of Californians—are deciding the outcome ofpolitical contests at the municipal level. These overall levels of voterturnout are important but they obscure as much as they reveal. Everycity is different, and turnout rates vary dramatically across communities(Figure 3.1).
Num
ber
of c
ities
80
70
60
50
40
30
20
10
080–8970–7960–6950–5940–4930–3920–2910–190–9 90–100
Percentage of registered voters casting ballots
Figure 3.1—Distribution of Voter Turnout Rates in City Council Elections

34
Some cities attract many voters to the polls. At one extreme, 89percent of registered voters in San Marcos turned out for that city’sNovember 1998 council election. Milpitas was just behind, with 88percent voter turnout for an election that same day. In sharp contrast,other cities in the state are plagued by extremely low turnout. Lawndalesaw only 10 percent of the city’s registered voters participating in itsApril 2000 election. Even in some major central cities where localpolitics is much more visible, the story is not much better. Only 20percent of registered voters in Los Angeles turned out for the April 1999city council election. What is it about cities like Lawndale and LosAngeles that leads to such low voter participation? Is there anythingunique about cities like San Marcos and Milpitas that explains theirability to involve large majorities of the registered population in localelections? If so, can those explanations help increase citizen participationin other local elections?
In this chapter, we explore some of the possible systemic factors thatunderlie this variation and help account for voter turnout rates. We firstexamine the issue of election timing, which we expect to be of centralimportance in accounting for variation in voter turnout. Next weexamine local governmental institutional arrangements, such as termlimits and the degree of city service provision. We then turn to a set ofcontextual factors, including the presence of propositions on the ballotand the degree of competition for office. Finally, we discuss a series ofindividual- and city-level demographic characteristics.
Throughout the chapter, we analyze a dataset that combines bothcouncil and mayoral elections across the state. We combine the twotypes of elections because of the small number of mayoral contests forwhich we have sufficient data and because we believe that the dynamicsof turnout are nearly identical for mayoral and council contests. Of the134 respondents indicating that their cities elect mayors directly, wereceived usable mayoral voter turnout data from 130, but additionalmissing data (because of other items on the questionnaire being leftblank by a few respondents) dropped the analysis down to 122observations, limiting the statistical power available. When we examinedmayoral and council elections separately, results were generally quitesimilar to those presented here. The same factors that influenced turnout

35
in council elections tended to affect turnout in mayoral elections.However, the small number of mayoral elections did lead to less stableand less robust estimations for these contests. Thus, the discussionfocuses on the combined mayoral and council election dataset, for whichwe have 421 usable observations in the turnout model.1 In eachregression, we include a binary variable to estimate differences betweenmayoral and council contests.2
The regression analysis technique used here allows us to focus on therelationship between various specific factors and voter turnout rates,while holding constant the effects of each of the other variables in themodel. We ran two parallel estimations, one geared at explaining theturnout of registered voters and one geared at explaining the turnout ofadult residents. The registered-voter model is able to account for 61percent of the variation in turnout levels across city elections, whereas themodel relating to adult-resident turnout accounts for 67 percent ofvariation. (For complete regression results, as well as summary statisticsfor all independent variables, see Appendix C.)
Election TimingOne notable factor in the comparison between San Marcos and
Milpitas on the one hand and Lawndale and Los Angeles on the other isthat the former pair of cities held elections on a statewide gubernatorialelection day, whereas the latter two held nonconcurrent, or off-cycleelections in the spring. As it turns out, our statistical analysis indicatesthat election timing is, in fact, the most important factor influencing city____________
1We were able to calculate council election turnout rates for 350 cities, but somehad to be dropped because certain questionnaire items on electoral context that are usedin the regression (questions 17 and 18) pertained to the most recent mayoral election, forthose cities with directly elected mayors. Fortunately, three-quarters of respondentsreported on mayoral and council elections that took place on the same day, and thus theircouncil elections could be retained in the regression analysis. Other cities had to bedropped because of nonresponse to other survey items or because the city wasincorporated after 1990 and therefore lacked data for a few variables derived from the1990 Census.
2When we ran a model that clustered, or grouped, the observations by city, signsand significance levels did not change.

36
turnout (see Figure 3.2).3 Compared to off-cycle elections, andcontrolling for a host of other factors, presidential elections are associatedwith almost 36 percent greater turnout among registered voters and 23percent greater turnout among adult residents. Presidential primariesand gubernatorial elections are associated with an increased turnout of 21to 26 percent among the registered and 11 to 15 percent among adults.4
When we examined mayoral and council elections separately, theserelationships held true for both types of elections, although theassociation was somewhat stronger for council contests.
Another important aspect of city election timing that couldpotentially affect turnout is whether city elections are consolidated withelections for other local offices. More than half of all the council and
Med
ian
perc
enta
ge tu
rnou
t
70
60
50
40
30
20
10
0PresidentialPresidential
primaryGubernatorialOdd-year
NovemberOff-cycle
Registered votersAdult residents
Figure 3.2—Variation in Turnout by Election Timing (with controls)
____________ 3Figure 3.2 and the other bar graphs in this chapter show the relationship between
voter turnout rates and the variables of interest, controlling for all other variables in theregression. Specifically, continuous control variables are set at their medians (to representa typical city), and categorical control variables are set at their modal value.
4Across the two different types of nonconcurrent elections, there is little differencein turnout. That is, with controls, odd-year November elections do not have significantlyhigher levels of turnout than other off-cycle elections, which are generally held in thespring.

37
mayoral elections we examined were held alongside elections for localofficials such as city treasurer, school board members, or countysupervisors. Does this have any effect on turnout? It appears that theanswer is no. Furthermore, holding the mayoral and council election onthe same day does not seem to spur significantly higher turnout. Inshort, consolidating local elections with statewide elections—as opposedto consolidating various categories of local elections—is the step mostlikely to yield local turnout gains.5
Taken as a whole, concurrency has a huge influence on whetherregistered voters will participate in municipal elections. Election timingalone accounts for about half of the variation among cities in turnout ofregistered voters; for turnout of adult residents, timing accounts forabout one-third of the variation across cities.6 In fact, using some simplecalculations involving a number of reasonable assumptions, we estimatethat if all cities in the state that hold nonconcurrent elections switchedtheir elections to a presidential election date, approximately 1.7 millionmore Californians would have voted in their most recent city councilcontest. The estimated turnout increase would be smaller, but still verysubstantial, if the spring and November off-year elections were moved tothe same date as a gubernatorial or presidential primary election.7
____________ 5Among these timing variables, we have also included a variable indicating whether
the election in question was mayoral or council. Notably, mayoral elections tend to drawlower turnouts (with about 3 percent fewer voters casting ballots) than council elections,at least among registered voters. This finding may seem somewhat counterintuitive, sincethe mayoralty is generally a more visible and important office than individual councilseats. However, it does accord with our finding in the last chapter that, overall, councilelections in California have higher turnouts. It is conceivable that there is somesystematic, unobserved difference between cities that have a separately elected mayor andthose that do not—a factor that may be associated with turnout. Given the wide varietyof variables that we control for in the regression model, however (notably including thesocioeconomic status of the city and the degree of competition for office), it is difficult toimagine what this unaccounted-for factor might be.
6A regression explaining turnout rates and using only the timing dummy variablesexplains 51 percent of variation for turnout of registrants and 32 percent for turnout ofadults. The coefficients of the timing variables are comparable to those in the full model.
7We estimate a turnout increase of about 1.2 million if all nonconcurrent electionswere switched to gubernatorial election dates, and about 940,000 if switched topresidential primary dates. We had to make a number of assumptions in theseestimations, the most important of which are: that the percentage of city residents whoare registered voters is the same in cities that did not respond to our survey as in the cities

38
Nonconcurrent elections clearly are much less inclusive thanconcurrent elections, on average. Closer examination of the data,however, indicates that there is substantial variation within each election-day category, particularly for nonconcurrent elections and those held onpresidential primary days. For example, despite the generally abysmalturnout rates for cities on off-cycle dates, two municipalities withnonconcurrent elections had turnouts of over 70 percent. It is thereforeimportant to move beyond election dates to examine other factors thatmay influence voter participation rates.
Institutional FactorsAre the electoral laws and governmental structure of a city related to
local voter turnout? According to our estimates, at least oneinstitutional feature of the local government—the degree of city serviceprovision—has an important connection to turnout.8
Many cities in California, particularly in the Los Angeles area,provide only minimal services with their own staff. Instead, they makearrangements with other governments or private firms to provide suchfunctions. Cities that provide these services themselves may find thatresidents have more at stake in municipal politics. When services arecontracted out or provided by other governments, city officials have lessdirect control over some of the issues that affect city residents’ quality oflife the most. The results indicate that a city’s role in service provisioninfluences turnout, if modestly. Each additional service provided by city________________________________________________________ for which we have data; that the shares of registered voters living in cities havingspringtime and off-year November elections, respectively, are the same as those sharesamong the cities in our dataset; and that the factors influencing turnout are the same incities that are not in our dataset. We estimated that there are just over 12 millionregistered voters living in municipalities in California, of whom about one-fifth live incities holding off-cycle spring elections and one-fifth in cities holding off-year Novemberelections. We then calculated how the number of voters casting ballots for city council inthese nonconcurrent-election cities would be likely to change based on election timing,using the estimated turnout rates for each type of city shown in Figure 3.2.
8We did not use the institutional variables relating to form of government (mayor-council versus council-manager plan), mayoral veto power, or mayoral budgetingauthority, because of the lack of variation among California cities on these characteristics.Also, all local California elections are nonpartisan, eliminating another potentiallyimportant institutional variable. The district election variable used in this analysispertains only to council elections, since all directly elected mayors are chosen at-large.

39
staff, of the five services asked about in the survey (fire, police, library,sewerage, and garbage), is associated with approximately 1 percent higherturnout among registered voters (Figure 3.3).
This relationship is weaker and statistically insignificant for turnoutof adult residents. However, when we substituted a binary variableindicating whether the city provides any of the five services, it waspositive and statistically significant for turnout among adult residents aswell as registered voters. This finding indicates that there is a particular“turnout penalty” for minimal-service cities—those whose in-houseemployees provide none of the five services asked about. It is possiblethat voters find municipal elections in such cities to be less important tothem, thus accounting for reduced turnout levels. It is also important tonote that municipal employees are often among the most likely residentsto participate in local politics, and this pattern may also help account forthe lower turnout among cities with fewer in-house staff.
A somewhat anomalous relationship is apparent between districtcouncil elections and voter turnout, but only in the estimation of turnoutamong adult residents. We suspected that district elections might drawslightly higher turnout, because district council members might be more
Med
ian
perc
enta
ge tu
rnou
t
70
60
30
20
10
0
Number of services provided by city staff
FiveThreeNone
50
40
Registered votersAdult residents
Figure 3.3—Variation in Turnout by City Service Provision (with controls)

40
closely involved in neighborhood-level issues that are more salient toresidents, and voters might thus feel a stronger bond with theirrepresentative. However, the estimation indicates a significant negativerelationship between district council elections and turnout of adultresidents. It appears, however, that this outcome is something of astatistical artifact. The relatively small number of cities in Californiawith district elections have substantially lower rates of voter registrationthan cities with at-large council elections.9 If we control for theregistration rate of the city, district elections are not significantly relatedto the turnout of adult residents. Thus, we see no strong evidence of acausal connection between the method of council election and voterturnout per se.
Two other institutional features of local government had nosignificant association with voter turnout. Whether a city is chartered oris covered under the state’s general-law provisions for municipalgovernment appears to have no relationship with the share of votersgoing to the polls. Perhaps surprisingly, we also found no connectionbetween term limits and turnout.10 We hypothesized that term limitswould make elections more interesting to residents and therefore increaseturnout, but it is also possible that the effect of term limits depends onwhether or not an incumbent runs. When an incumbent can no longerrun for a seat because of term limits, the election may become morecompetitive and attract additional interest. We turn to this and otherelectoral context variables in the next section.
Electoral ContextWhether voters participate in local elections may be related to the
specific context of the elections. How many candidates are running? Is____________
9For the 17 cases we observe of a district council election, the estimated registrationrate of adults in the city averages 54 percent, compared to 71 percent in the overallsample. This is probably because several of the district cities have very high shares ofimmigrants in the population, many of whom are ineligible to vote. Examples includeSanta Ana, Watsonville, Salinas, and Downey.
10The term-limits variable is specific to the contest examined; that is, the variablemeasures the influence of council term limits for council-election turnout, and of mayoralterm limits for mayoral-election turnout.

41
there an incumbent or is the contest for an open seat? Are there ballotmeasures to decide? Although it is difficult to influence most of thesefactors through policy efforts, it is nevertheless important to know whatrole they play in the local political arena.
For example, one of the most controversial elements of California’selectoral system is direct democracy. Despite some criticism,policymaking in California has relied increasingly on initiatives, at leastat the statewide level. In some cases, these initiatives have spurred voterinterest and participation (Pantoja and Segura, 2000). At the municipallevel, as noted in Chapter 2, ballot measures are actually far lessprevalent. Moreover, most city propositions reach the ballot throughcouncil action, not as the result of citizen initiatives. Although notwidespread, local ballot propositions have a significant positiverelationship with city turnout rates (Figure 3.4). Cities with at least onecitizen initiative or council-placed measure tended to have about a 4percent higher turnout than those without either. This is true forturnout of both registered voters and adults.11
Another contextual issue to consider is competition for office. Thenumber of candidates competing for a seat is one rough indication of thelevel of competition and perhaps the level of media and other interest ina given contest. At one extreme, uncontested elections (those with thesame number of candidates as seats to be filled) may draw especially lowinterest. We measure competition with two variables: a binary variablesignifying uncontested elections and the number of candidates per seat.For mayoral elections, the latter variable is simply the number ofcandidates on the ballot; because we do not have information on eachspecific council contest, we use the number of total candidates runningfor any council seat divided by the number of seats up for election.____________
11Oddly, if entered into the equation separately, only council-placed ballotquestions are significantly related to election turnout. The presence of citizen initiativeshas a positive relationship to turnout but is statistically insignificant. Despite theextensive attention given to local citizen initiatives, it appears that some measures placedon the ballot by the governing body may be more provocative to voters.

42
Med
ian
perc
enta
ge tu
rnou
t
70
60
30
20
10
0Adult residentsRegistered voters
50
40
NoneOne or more
Figure 3.4—Variation in Turnout by Number of City Ballot Propositions(with controls)
The results clearly show that uncontested elections are bad news forvoter participation in city elections. Uncontested elections draw to thepolls about 4 percent fewer adult residents, and about 5 percent fewerregistered voters. (Further analysis indicated that this effect was strongestin mayoral elections.) Moreover, for contested elections, the number ofcandidates appears to be associated with a slightly higher turnout rate.One additional candidate per seat is associated with about 0.7 to 0.9percent higher turnout. It is possible that each aspirant mobilizes his orher core supporters to come to the polls; therefore, a larger number ofcombatants would be associated with more voter participation overall.Regardless of the explanation, these results hint that one dimension oflocal civic vibrancy—competition for office—is connected with anotherdimension—voter participation.
Incumbents at all levels of the political process are extremely likely towin reelection, and one might expect turnout to decrease whenincumbents are running. We measure incumbency as the number ofincumbents running divided by the number of seats. This variableranges from zero (no incumbents running) to one (all seats haveincumbents); in mayoral elections, of course, the resulting value can only

43
be zero or one since there is only one mayoral seat. Surprisingly,incumbency proved not to be related to turnout at all.12
Also of interest were two other factors that could not be included inthe analysis because of high rates of nonresponse: the margin of victoryin the election and the issue of whether the top two candidates for officewere of different racial or ethnic backgrounds (as discussed in Chapter2). Although neither variable is included in the final regression modelspresented here, no significant associations were found between thesevariables and turnout rates. Unfortunately, these data could feasibly becollected only for mayoral elections, and nonresponse to these questionssubstantially reduced the number of potential observations. Thus this“nonfinding” cannot be considered definitive.
One additional electoral context variable was included in our modelof turnout among registered voters as a statistical control: the (estimated)percentage of voting-age residents in the city who are registered to vote.13
This share of potential voters who are registered could be importantbecause it provides some indication of the efforts made to involveresidents in electoral politics and helps define the pool of citizens amongwhom voting will or will not occur. We do not include this variable inthe regression for turnout of voting-age residents; in that case, the act ofregistration is itself a large part of the phenomenon we seek to explain.
In cities where a very high share of residents are registered, it ispossible that some “low-propensity” voters have been registered, perhapsthrough especially active outreach efforts by community groups orcandidates. Another possibility is simply that the local voter rolls havenot been “purged” recently, meaning that there may be a fair number ofcitizens listed as registered who have died or moved out of thecommunity. In either situation, one might expect that the turnout ofregistered voters will be lower where the registration rate is higher. This____________
12We tried other specifications for the council incumbency variable, such as binaryvariables for situations where any incumbents were running or where all seats hadincumbents, but this did not influence the results. Even when we looked at mayoralelections separately, incumbency had no significant effect on turnout.
13As noted in previous chapters, the variable used is an estimate based on aninterpolation (for the particular year of the election) of the voting-age population of thecity between 1990 and 2000.

44
is indeed the case, although the relationship is a weak one. Whereregistration rates are 10 percent higher (all other things equal), turnout isabout 1.4 percent lower.14
City DemographicsThe final set of factors we assess are demographic. Other studies
have shown such characteristics to be very important for voter turnoutwhen measured at the individual level. Here we examine their role inCalifornia’s municipal elections, viewing them primarily as statisticalcontrols. The model includes several variables of interest to turnout, asdescribed in Chapter 2: city population size, a summary measure of thesocioeconomic status of the city, measures of the racial and ethnicmakeup of the city, two measures of the age distribution of the localpopulation, residential stability, and (for turnout of adult residents) theproportion of the city population that is institutionalized.
One clear-cut finding is that larger cities tended to have lowerturnout rates. This generalization is supported by research at theindividual level, which finds that residents of more populous jurisdictionsgenerally participate less (Oliver, 2000). Furthermore, the relationshipbetween larger city populations and lower voter turnouts is apparent evenwhen controlling for other factors that may differ between large andsmall communities. Nevertheless, the magnitude of the relationship isfairly modest (Figure 3.5).
Cities with residents of higher socioeconomic status tended to havesignificantly higher turnout; this result is also consistent with individual-level research. This pattern is particularly clear for the turnout rates ofadult residents, but it is also readily apparent even when the focus isnarrowed to those residents who have already been registered to vote.
Race and ethnicity appear to be related to turnout in more complexways. In accordance with past research suggesting that African____________
14We also investigated the effects of party registration—the percentage of cityresidents registered as Democrats, Republicans, or neither—on turnout. This element ofelectoral context proved to have no influence on turnout.
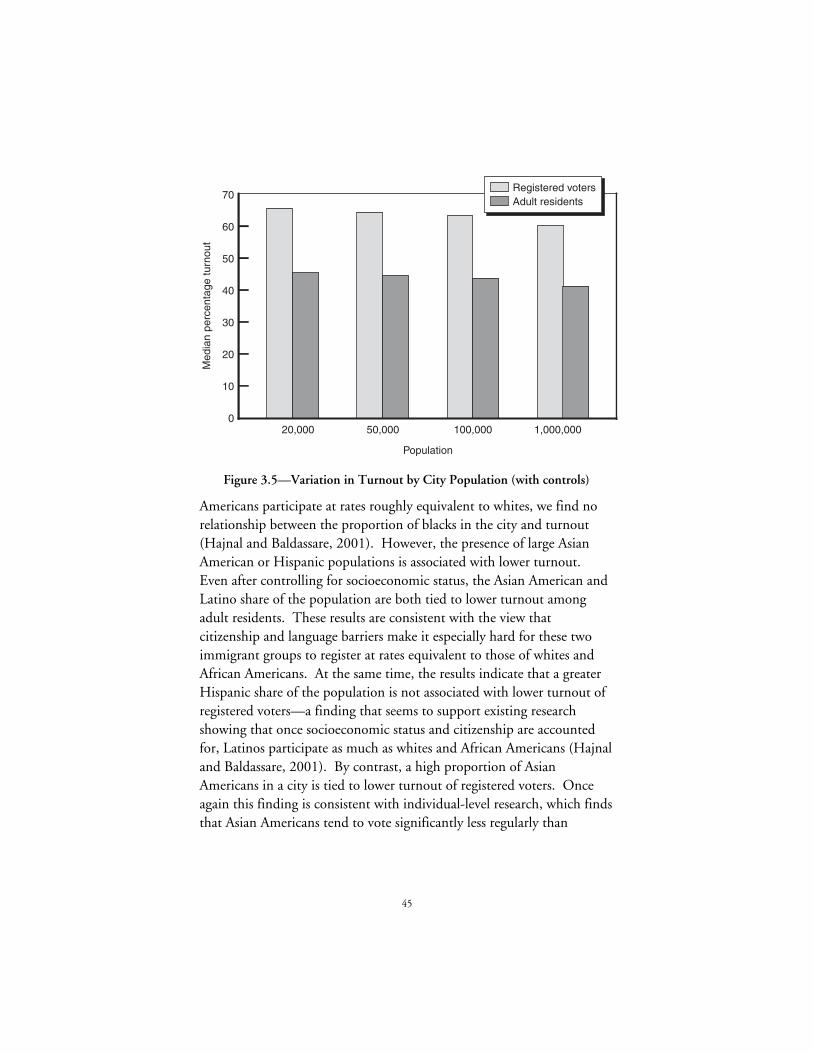
45
Med
ian
perc
enta
ge tu
rnou
t70
60
50
40
30
20
10
0
Population
1,000,000100,00050,00020,000
Registered votersAdult residents
Figure 3.5—Variation in Turnout by City Population (with controls)
Americans participate at rates roughly equivalent to whites, we find norelationship between the proportion of blacks in the city and turnout(Hajnal and Baldassare, 2001). However, the presence of large AsianAmerican or Hispanic populations is associated with lower turnout.Even after controlling for socioeconomic status, the Asian American andLatino share of the population are both tied to lower turnout amongadult residents. These results are consistent with the view thatcitizenship and language barriers make it especially hard for these twoimmigrant groups to register at rates equivalent to those of whites andAfrican Americans. At the same time, the results indicate that a greaterHispanic share of the population is not associated with lower turnout ofregistered voters—a finding that seems to support existing researchshowing that once socioeconomic status and citizenship are accountedfor, Latinos participate as much as whites and African Americans (Hajnaland Baldassare, 2001). By contrast, a high proportion of AsianAmericans in a city is tied to lower turnout of registered voters. Onceagain this finding is consistent with individual-level research, which findsthat Asian Americans tend to vote significantly less regularly than

46
members of other racial and ethnic groups when controls for citizenshipand socioeconomic status are introduced (Lien, 1994).
Turnout is also clearly correlated with both the age distribution ofthe population and household mobility. Cities with higher shares ofsenior citizens have higher turnout rates. The proportion of youngadults in the population, however, appears unrelated to city turnoutrates. Household mobility—that is, the proportion of residents whohave changed addresses in the past five years—is connected to turnout,with cities of more household stability showing higher turnout amongthe adult population. Among registered voters, however, mobility levelsof the city population are unrelated to turnout. Registration itself seemsto be the main hurdle for people who move frequently.
Finally, in estimating the turnout of all adults, we draw upon the2000 Census to measure the proportion of the city population thatresides in institutional settings. Our intuition here was that cities withvery high institutionalized proportions of the population tend to be thesites of prisons, the inmates of which generally are ineligible to vote. Thefindings confirm that the institutionalization rate is negatively associatedwith turnout.15
SummaryAlthough turnout in local elections in California is generally low,
there is, in fact, wide variation across cities. Some localities manage toattract the vast majority of registered voters to the polls; others areplagued by extremely low turnout. Our statistical model was designed toascertain which factors play a significant role in accounting for thesubstantial variation in voter turnout across California cities. The resultsshow that the largest part of this variation can be explained by timing—the date on which the election is held. Concurrent elections—that is,city elections held on the same day as a presidential or gubernatorialelection or a presidential primary—had turnouts that are substantiallyhigher than off-cycle, or nonconcurrent, city elections. The turnoutboost for cities holding concurrent elections was 11 to 23 percent among____________
15Such individuals would not generally be registered to vote locally, making theissue moot for the turnout of registered voters.

47
all adults, and 21 to 36 percent among registered voters (depending onwhether the concurrent election was presidential, gubernatorial, or astatewide primary).
Beyond timing, there are a handful of other interesting correlates ofturnout. Cities that provide only a minimal number of services withtheir own staff drew a smaller share of voters than those that providemore services with in-house personnel. Direct democracy plays a role,too; cities with local ballot questions placed before the voters tended tohave higher turnout. City elections with a greater number ofcompetitors had slightly higher turnout. All of these factors, however,pale in comparison to the dramatic role played by election timing.
Although competition for office and incumbency did not appear toplay a decisive role in influencing local turnout, these factors are worthyof additional study in and of themselves. Potential candidates for officeare likely to know that turnout is much higher in concurrent elections,and this knowledge may affect their decisions about running for office.And do incumbents fare better in concurrent or nonconcurrent elections?If policymakers consider rescheduling local elections to enhance turnout,they may wish to bear in mind these other potential dynamics of electoralcompetition. The next chapter addresses these issues.


49
4. Competition and Incumbencyin Local Electoral Contests
Thus far, our discussion of municipal elections in California hasmainly been concerned with voter turnout. However, there are otherinteresting measures of the vibrancy of local electoral contests. Thischapter addresses two such issues: the level of competition for mayoraland council races and the success of incumbents who are seekingreelection. Who runs for city office—and who wins—are differentconcerns from the level of voter participation, but as we have noted, theissues are linked, since more competition tends to increase turnout.Moreover, as we shall indicate, the question of election scheduling—concurrent as opposed to nonconcurrent elections—may haveimplications for local candidacies.
Competition for OfficeLocal government is the starting point for many political careers—
that is, it is the level at which people tend to be recruited into electivepolitics. As such, the degree of competition for local offices may havebroader implications for the quality of democracy. Competition formayoral and council seats provides a barometer of how much interestand perceived opportunity local politics generates among one type ofcitizen—those who might consider serving in elective office.
Our measure of competition for office is simple: for mayor, thenumber of candidates whose names appeared on the ballot, and forcouncil, the total number of candidates divided by the number of seatsavailable.1 To estimate a more robust model, we once again merged the____________
1Respondents were asked to report on the most recent regular election, not a runoffelection or a special election to fill a vacancy.

50
council and mayoral elections, distinguishing between the two whereappropriate.
The average mayoral contest in California for which we have datahad 2.9 candidates running, although just over one-sixth of theseelections were uncontested. Among city council elections, each seatattracted an average of 2.5 candidates; less than 4 percent of citiesreported that all their council races were uncontested. However, there iswide variation in the number of candidates, with some cities having asmany as eight candidates per council seat.
It is impossible to capture in a statistical model all the nuances of thelocal political environment that might motivate individuals to seek cityoffice. Nevertheless, many of the factors we explored above might alsoinfluence the vibrancy of electoral competition in cities. Thus, we onceagain investigate issues of election timing, the institutional arrangementsof local government, the electoral context, and the demographiccharacteristics of the municipality. However, we alter some of thespecific variables used in an effort to select measures that are moremeaningful in influencing whether city residents will seek to run foroffice.
In estimating the relationship of election timing to competition, weuse a simple binary indicator of whether the city election was concurrentwith a statewide election day (i.e., a presidential, presidential primary, orgubernatorial election) as opposed to cases where the city held anonconcurrent election. We suspect that potential candidates will notmake fine-grained distinctions about their chances in a gubernatorialversus a presidential election, for example, but they may evaluate theircandidacy based on whether the city election will be in electoral “primetime”—and thereby draw a much larger voter turnout, as we have seen.We also use variables indicating whether the mayoral and councilelections were held on the same day, and whether other local elections,such as for school board, were held that day.
In the case of some of the institutional factors, there may be less of aclear link to competition than to turnout. We do expect term limits toaffect competition, in two possible ways. On one hand, term limits mayincrease competition by providing a clear indication to potentialcandidates that a seat will be available once an incumbent has been

51
“termed out.” Conversely, the presence of term limits conceivably mightreduce the attractiveness of public office and make officeholding a lessdesirable goal, thereby reducing electoral competition. Along these lines,we very strongly expect the presence of an incumbent to reducecompetition, because challengers are well aware of the electoral benefitsknown to accrue to incumbents, such as name recognition and fund-raising potential. The degree of city service provision could affect thesalience of city politics for potential candidates, just as it appears to forvoters. And two additional features of the mayoralty—whether theposition of mayor is considered a full- or part-time job, and the length ofthe mayor’s term of office—may shape its attractiveness as a goal forpotential candidates.2 Charter city status, which provides somenominally increased discretion to city officials, might also potentiallyaffect the number of candidates.
Some of the electoral context factors have a less direct, butnevertheless potentially important, link to electoral competition. Weinclude our estimate of the percentage of voting-age residents registeredto vote, as this may be an indication of the degree of politicalengagement in the city, which could also affect competition for office.Simultaneous elections for other local offices may provide alternativeoutlets for individuals interested in entering local politics, thereforeperhaps drawing fewer council or mayoral candidates. The presence oflocal ballot measures may indicate a degree of community conflict thatcould motivate more competitors to seek office. Because we areinterested in the general level of political interest or rancor within a givencommunity, we turn to broader measures of political engagement.Instead of election-specific indicators of ballot measures, we use a generalmeasure of the number of voter initiatives across a three-year period____________
2Regarding the first issue, city clerks were asked, “Is the mayoralty in your cityconsidered a full-time or part-time position? (Generally, the office is considered full-timeonly if it carries a full-time salary.)” The office was identified as full-time in only 13cities. In the regression analysis below, the variable used is an interaction variabledenoting only mayoral elections in cities with full-time mayors. It is worth bearing inmind that only 2.5 percent of the observations in the regression are of mayoral electionsfor full-time mayors. Regarding the second issue, about half (49 percent) of directlyelected mayors were said to hold a four-year term, whereas the other half held two-yearterms of office.

52
(1997–1999) and a subjective response by city clerks indicating thegeneral level of electoral controversy over the past five years.
We also include a measure of the percentage of registered voters inthe city who are third-party adherents or who decline to state their partyaffiliations. Even though California city elections are officiallynonpartisan (that is, candidates are not identified on the ballot by partyaffiliation), cities with a more independent electorate may be morecritical of the political status quo and have a more nonconformistpolitical style. Moreover, a high percentage of independents mayindicate that local party organizations—which often are important inrecruiting and screening potential candidates—are weak. Under suchcircumstances, local parties may be less capable of signaling who theleading candidates are through endorsements or financial contributions.In such a wide-open political arena, more candidates may seek office,believing they have a credible chance at swaying voters and winning.
Finally, we explore the relationship between selected localdemographic factors and candidate competition. Here our analysis takesus into fairly uncharted waters. Although a city’s population size willalmost surely be related to the number of candidates who choose to run,it is not clear from extant theory that the racial or ethnic compositionand socioeconomic status of the residents of a city should influenceelectoral competition—but there is no way to find out for sure withouttesting. Preliminary analyses confirmed that there were no noticeableeffects from socioeconomic status variables, which are therefore omittedfrom the model; race variables were retained. We also include themeasure of residential stability in the city—the proportion of residentswho lived in the same dwelling unit from 1985 to 1990—on the thoughtthat more transient communities may present different patterns ofcandidate recruitment and mobilization from more settled communities.Variables relating to the proportion of senior citizens and young adults inthe community were also employed. Retired residents might have moretime and interest in local politics, thus increasing the pool of potentialcandidates. If young adults are especially disengaged politically, citieswith many of them may have fewer electoral candidates.
We used a regression analysis to estimate which factors are related tocompetition for office. Detailed results of the model are shown in

53
Appendix D.3 The first finding of note is that mayoral elections drawsignificantly fewer competitors than council seats, all other things beingequal. (Without controls, as we have noted, mayoral races draw slightlymore candidates than do council races.) This may reflect the higher costin time and campaign funds often required for serious mayoral bids.Novice candidates are probably more likely to give politics a try at thecouncil level.
The second finding to stress is the lack of a relationship betweenelection timing and competition for office. That is, the number ofcandidates is not influenced by whether the election is concurrent with astatewide election. Another type of election concurrency does make adifference, however. The presence of other local offices up for election(such as city clerk, school board, or county supervisor) is associated witha significant reduction in the number of aspirants for council seats ormayor. In such circumstances, some potential candidates are possiblybeing siphoned off into other local contests. An election that deals onlywith the council and mayor, on the other hand, offers ambitious localcampaigners the opportunity to run for those offices and then try againlater for a different local position if they lose the council or mayoral race.
Certain institutional factors also influence electoral competition inCalifornia cities. Neither district elections nor the number of servicesprovided by city government staff produces discernible differences incompetition.4 However, a full-time mayoralty is associated with morecompetition for that office, as is a longer term of office. In short, wherethe rewards of mayoral office-holding are greater (or where mayoralelections are less frequent), the number of candidates for mayor isgreater. In addition, term limits—perhaps by making the office seemless desirable—seem to reduce the level of competition (although thestatistical significance is not high).
It is likely that term limits also indirectly affect competition byrestricting the number of races featuring incumbents—an electoral____________
3The dependent variable in the regression (candidates per seat) is expressed inlogarithmic form, because of the extreme skewness of the distribution (i.e., many smallvalues and only a few quite large values).
4The district-elections variable applies only to council elections.

54
context variable. Indeed, the presence of an incumbent running foroffice substantially reduces the number of candidates for mayor andcouncil elections. This finding is consistent with research oncongressional elections, which shows that the presence of an incumbentdiscourages potential opponents from running; candidates for open seats(those with no incumbent) tend to be of “higher quality” (i.e., have moreexperience in government and politics) than challengers who run againstincumbents (Jacobson, 1983, pp. 37–41).
Certain other electoral context variables are also related to the levelof competition. As one might expect, controversy and a more engagedpublic appear to be related to greater levels of competition for office.First, general electoral controversy in a city (as judged by the city clerk)has a significant positive association with the number of candidates perseat.5 Second, cities that have had more citizen initiative elections inrecent years produce more candidates, perhaps indicating an electorallycharged atmosphere with salient issues facing voters and politicians. Thepercentage of adults registered to vote, another potential indicator of aninterested and engaged public, has a positive relationship to competition,but does not attain standard levels of statistical significance.
The results also indicate that cities with larger proportions ofindependent or third-party voters have significantly more competition.(Further analysis showed that this pattern is apparent both for councilseats and for the mayoralty.) This finding may reflect the fact that localDemocratic and Republican party organizations help winnow the field ofcandidates in many cities—even in California’s officially nonpartisanelectoral system—through their endorsements and campaign support.Major-party organizations generally wish to avoid having their loyalistssplit their votes among multiple competitors. Where the major partiesare weaker (as indicated by a higher proportion declining to state andthird-party voters), they may be less effective as “gatekeepers” to office.Potential aspirants to local office also may be encouraged by the presenceof a larger share of “free agent” independents among the voting public.____________
5It is perhaps unclear whether greater controversy spurs more candidates into actionor is itself a function of the clashing views of a large number of candidates. Nevertheless,the questionnaire asked respondents to judge the level of controversy over the past fiveyears, not the controversy level of the specific election for which we have data.

55
Turning to demographic factors, the city characteristic that has thegreatest association with competition is the size of its population. Largecities tend to have more candidates, as one would expect.6 Residentialstability is associated with fewer council aspirants, perhaps indicating amore consensual, less competitive politics in cities that have a stable, lesstransient population. Municipalities with higher proportions of blacksand Hispanics in the population have slightly more competition foroffice. Although we are only speculating, political elites within these tworacial/ethnic groups may see a particularly important link between theirgroup interests and the actions of local governments; this link, in turn,may lead more citizens to run for office. There is no such relationshipbetween the size of the Asian population in a city and competition foroffice. Finally, although the shares of young adults and elderly persons inthe population have the expected relationship with electoral competition,neither factor proves statistically significant.
The Success of IncumbentsIncumbency is a key factor in shaping the degree of competition for
office. Indeed, one of the best-documented regularities in electoralpolitics is the advantage of incumbency. At the federal level, forexample, most congressional elections since 1952 have returned over 90percent of incumbent members of the House of Representatives andabout 80 percent of incumbent senators (Squire et al., 1995, pp. 280–281). At the mayoral level, available evidence suggests that nationwide,85 percent of incumbents win their reelection bids (Wolman et al.,1990). Whether the power of incumbency extends to the city councillevel is less well known (but see Krebs, 1998). Also not well known arethe factors that lead to incumbent success at the local level.____________
6However, the number of candidates does not increase proportionally with thepopulation. That is, there are fewer candidates per thousand city residents in large citiesthan in smaller communities. As with the lower turnout among large cities noted inChapter 3, this finding may indicate somewhat lower levels of civic vibrancy injurisdictions with large populations. (Volunteering and social trust are also behaviors thatare less common in large communities, according to Putnam, 2000.) However, lowerlevels of competition for office in large cities may also be a reflection of the higherfinancial costs involved in campaigning there, as paid media advertising and direct mailoften supplant yard signs and door-to-door campaigning.

56
Our California data indicate that 80 percent of council members and86 percent of mayors who stood for reelection won their contests. Thisresult underscores the tremendous value of incumbency to politicalcandidates at all levels of politics. Incumbency increases namerecognition among voters, deters potential challengers, and very likelyenhances perceptions of a candidate’s experience and accomplishment.
Nevertheless, some incumbents do lose, and one might ask underwhat circumstances this outcome is likely. Is incumbent success relatedto voter turnout? Perhaps more important, is incumbent success linkedto the timing of elections? Some local election officials and city residentshave expressed concern that concurrent elections might favor incumbents(Simerman, 1998). These critics believe that holding municipal electionson the same day as a statewide contest could create a situation in whichsome voters who come to the polls are unaware of and inattentive to localissues. Such voters, it is argued, have a tendency to vote for incumbents,who are better known, on average, than their challengers. In contrast, byattracting a higher proportion of purportedly better-informed voters,nonconcurrent elections might make incumbents less secure andultimately make council members and mayors more responsive to theresidents of their city.
We cannot directly test the responsiveness of mayors and councilmembers with the available data, but we can analyze the success ofincumbents standing for reelection in California. Only contestedelections are examined because unopposed incumbents winautomatically. We analyze the aggregate number of incumbents who winreelection in various circumstances, rather than engaging in ourcustomary statistical analysis that treats each city as an equally importantunit of analysis. Because many cities have multiple incumbents runningfor reelection and we lack data on the specific attributes of those contests,our remarks are necessarily limited to the city-level factors related toincumbent success.7 Again, we examine the four sets of factors—election____________
7The text and charts in this section present the results of simple cross-tabulations ofincumbent success and the city characteristics of interest. These relationships wereconfirmed with a logistic regression analysis of the grouped data. The results of thatregression conformed closely to the results presented here.

57
timing, institutional structure, contextual factors, and the demography ofthe city—for their relationship with incumbent success rates.
In line with the views of some proponents of off-cycle elections,concurrent elections are associated with greater success of incumbents inCalifornia municipal elections (Figure 4.1). City council incumbentsrunning during gubernatorial, presidential primary, or presidentialelection dates have about 4 percent greater success rates than incumbentsin nonconcurrent contests. Mayoral incumbents win reelection 12percent more frequently, although this result is not statisticallysignificant, given the limited number of contested mayoral racesfeaturing incumbents.8 We can only speculate whether the greatersuccess of incumbents in concurrent elections indicates that voters “tuneout” local issues during statewide elections, since we lack individual-leveldata on voters. Possibly, the voters who are motivated enough to go to
Per
cent
age
reel
ecte
d
100
80
70
60
50MayorsCouncil members
90
Concurrent electionsNonconcurrent elections
Figure 4.1—Incumbent Success and Election Concurrency
____________ 8The council-election differences are statistically significant at the p < 0.10 level.
For contested mayoral races, the number of observations is only 78, which renders thedifference in incumbent success (marginally) statistically insignificant, despite its largermagnitude.

58
the polls for off-peak, local-only elections tend to be more attentive tocommunity issues or more critical of incumbent council members.9
Local political institutions appear to have little bearing onincumbent success. Term limits and the degree of city service provisionhad no relationship with incumbent reelection rates. Cities that usedistrict elections were somewhat more likely to have council memberswin reelection, although the result did not hold up using more rigorousstatistical analyses. Charter cities have higher incumbent reelection ratesthan general-law cities, but any explanation for this relationship is notreadily apparent.
The electoral context of a council election, however, appears to playa significant role in incumbent reelection success, and here the findingsare very plausible (Figure 4.2). For instance, the existence of citizeninitiatives has a substantial negative relationship with incumbent success.
Per
cent
age
reel
ecte
d
100
90
80
70
60
50
Number of council seats being filled
4 or more31 to 2
No citizen initiativesCitizen initiatives on ballot
Figure 4.2—Success of Council Incumbents in Varying Electoral Contexts____________
9We do not include the turnout rate itself as an independent variable regardingincumbent success because the causation could be interpreted as running in the oppositedirection—that is, the turnout rate might be affected by the presence of a weak orunpopular incumbent or the expectation of a close race. Moreover, election timing(which is included in the model) is correlated with voter turnout rates at a high level (r =0.71).
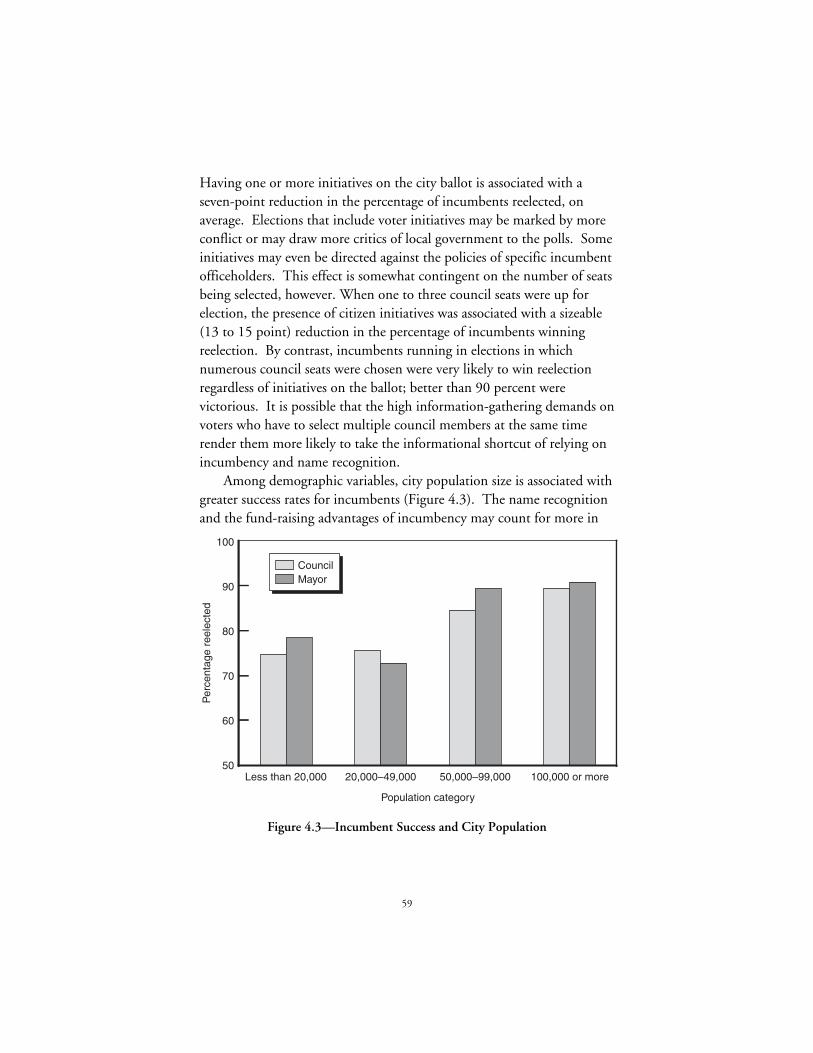
59
Having one or more initiatives on the city ballot is associated with aseven-point reduction in the percentage of incumbents reelected, onaverage. Elections that include voter initiatives may be marked by moreconflict or may draw more critics of local government to the polls. Someinitiatives may even be directed against the policies of specific incumbentofficeholders. This effect is somewhat contingent on the number of seatsbeing selected, however. When one to three council seats were up forelection, the presence of citizen initiatives was associated with a sizeable(13 to 15 point) reduction in the percentage of incumbents winningreelection. By contrast, incumbents running in elections in whichnumerous council seats were chosen were very likely to win reelectionregardless of initiatives on the ballot; better than 90 percent werevictorious. It is possible that the high information-gathering demands onvoters who have to select multiple council members at the same timerender them more likely to take the informational shortcut of relying onincumbency and name recognition.
Among demographic variables, city population size is associated withgreater success rates for incumbents (Figure 4.3). The name recognitionand the fund-raising advantages of incumbency may count for more in
Per
cent
age
reel
ecte
d
100
90
80
70
60
50
Population category
100,000 or more50,000–99,00020,000–49,000Less than 20,000
CouncilMayor
Figure 4.3—Incumbent Success and City Population

60
large jurisdictions, where constituents are less likely to be intimatelyfamiliar with City Hall. Residential stability among the city populationalso has a positive relationship with the success rate of incumbents. It ispossible that more “settled” communities with less population turnoverexperience more consensus and a quieter, status quo political style.
SummaryAs seen in Chapter 3, the timing of city elections affects turnout.
But is timing also related to the competitive dynamics of local contests?Although the level of competition for office is not associated withelection timing, incumbents do seem to find some slight additionaldegree of protection in concurrent elections. This finding brings us fullcircle to the question of the merits and disadvantages of holdingmunicipal elections simultaneously with elections that attract moreattention. The incumbency advantage is a somewhat greater hurdle forchallengers to overcome in concurrent elections—whether because localelections during the statewide cycle draw less careful scrutiny andinformation gathering, or because the much larger number of voterscasting ballots in such elections are more inclined to vote for familiarfaces. We have raised one possible explanation—that the voters whocome to the polls in nonconcurrent elections tend to be more motivatedor discontented about local issues, and this spells more trouble forincumbents. Whether this finding provides definitive support for thecritics of concurrent scheduling of elections is an issue we will defer toour concluding chapter.
Several other interesting patterns emerge from our analysis ofcompetition for office and incumbent success. For example, citiesundergoing substantial community controversy (indicated by a largenumber of voter initiatives) are likely to see more candidates enter thering and are more likely to send incumbents packing. High-populationcommunities generate more candidates per seat but are nevertheless morelikely to reelect incumbents. Towns with a greater proportion of voterswho do not identify with one of the two major parties experience morecompetition for office. Longer mayoral terms and full-time mayoraltiesalso draw more candidates for the job. This finding indicates that

61
institutional choices (such as the powers of the mayor) that were made toaddress the operations or efficiency of a municipality may have otherconsequences relating to who runs for office and whether they succeed.


63
5. Conclusion
Most Californians do not vote in municipal elections. Evencompared to statewide and national contests, participation in localcontests is disappointing. Because only a fraction of the adultpopulation is participating in the local electoral arena, relatively fewvoters are determining the outcome of local elections and presumablyaffecting policy decisions while the majority of Californians stand on thesidelines. Given that most of the elected officials in the state are electedlocally, and given that most of the policies that affect our daily lives areimplemented at the local level, this lack of participation is clearly aproblem. If the characteristics of those who do vote are different fromthe makeup of the larger population that does not vote, outcomes may beboth biased and inefficient, as not everyone’s preferences will be takeninto account. Limited voter participation does not necessarily mean thatlocal democracy is failing but it is surely enough of a red flag to warrantcareful examination.
Although it is clear that most adult Californians do not vote in theaverage local contest, it is also clear that there really is no “average”contest. Across cities there is tremendous variation in voter turnout.There are cities where almost all of the registered voters participated inthe last city election, there are cities where only 10 percent of allregistered voters showed up at the polls, and there is virtually everythingin between.
Analysis of this variation across cities indicates that one factor has thepotential to dramatically alter voter turnout rates in local contests. By farthe largest part of this variation can be explained by election timing.City elections held on the same day as statewide contests (that is, on thesame day as a presidential or gubernatorial election or a presidentialprimary) tend to have voter turnout rates almost double those ofnonconcurrent city elections. Even if we control for a host of otherfactors associated with turnout, holding an on-cycle election still

64
increases the turnout of registered voters by an average of 26 to 36percent above turnout for off-cycle elections.
Although timing is clearly the most important factor affectingturnout, this report reveals other important aspects of the local electoralarena that appear to influence voter participation. Whether a cityprovides its own public services is related to voter turnout. Cities thateither do not offer services or contract or arrange with other entities tocarry out the bulk of municipal services draw a smaller share of votersthan those that provide more services with their own staff. This findingsuggests that when the stakes of contest are higher, more voters willparticipate. Direct democracy also plays a role, as cities with local ballotquestions placed before the voters tend to have significantly higherturnout. Although there is much debate about the overall value of directdemocracy, placing propositions on the ballot seems to spark greaterinterest and participation in the municipal political arena.
We should also note the factors that do not affect voter participationin local contests. Our analysis suggests that consolidating mayoral andcouncil elections with other local contests (such as school boardelections) would have no significant effect on turnout. Similarly, chartercities are no more prone to higher turnout than are general-law cities.Term limits have no direct effect on voter participation. Contrary toexpectations, district elections do not generally increase turnout over at-large elections and may, in fact, marginally decrease turnout (althoughthe unusual characteristics of California’s handful of districted citiescomplicates this interpretation). Finally, the degree of competition foroffice has only a limited association with voter turnout rates.
What does all of this mean for policymakers? For voter turnout, theimplications are clear: If there is a desire to increase voter involvement inmunicipal electoral contests, the best tool for the job is schedulingconcurrent elections. Moving a city’s election from a nonconcurrentdate to the date of a presidential election could well mean a doubling ofvoter turnout. Overall, we estimate that by moving all nonconcurrentelections to coincide with presidential elections, California could havedrawn 1.7 million more voters to city council elections statewide(roughly a 31 percent increase in participation in municipal contests).By contrast, altering institutional factors such as city service provision

65
and increasing our reliance on direct democracy at the local level mightreasonably be expected to increase turnout rates by about 5 to 10percent. Unlike any other factor we examine, election timing coulddramatically alter the size of the local voter population.
Concurrent elections are even more appealing as a policy leverbecause they would probably produce some modest financial savings forcities. Municipalities often pay the entire cost of stand-alone electionsand only a fraction of the cost of concurrent elections.1 The otheradvantage of concurrent elections is that they are fairly easy toimplement. In many cases, city councils need only pass an ordinance.No new structure or agencies would be required.
Already the cost savings associated with on-cycle elections and theease with which election dates can be changed have led a considerablenumber of municipalities across the state to align their local electionswith statewide contests. Encouraging more cities to move in the samedirection would presumably not be very difficult—although it is possiblethat local elected officials would oppose a move to on-cycle electionsbecause it would make it more difficult to retain their local offices whilerunning for positions in state government. As California policymakersreconsider the timing of the statewide primary, in connection withpresidential or gubernatorial selection, they might consider whether localgovernments that still hold stand-alone springtime elections should beencouraged to consolidate these elections with the primary.
However, a move to concurrent elections would not fully address thebroader dilemma of limited citizen participation in municipal affairs.First, on-cycle local elections would surely lead to greater voter turnoutbut would not necessarily ensure greater civic engagement. Althoughgreater turnout tends to be coupled with increased political knowledge,trust, and efficacy, it is not yet clear how aligning local elections withstatewide elections would affect each of these other measures. Second,____________
1Evaluated on the basis of a city’s administrative costs per vote cast, the fiscaladvantages of concurrent elections are even clearer. For example, San Francisco electionofficials recently estimated that the December 2001 runoff for city attorney cost the city$29 per ballot cast. Turnout was only 15.4 percent. This has led city officials toseriously debate the merits of an “instant runoff” voting system so that the Novemberelection would be decisive and no runoff would be required (Lelchuk, 2001).
66
although concurrent elections should have a dramatic effect on turnout,in the end local turnout is unlikely to exceed the fairly disappointinglevels currently experienced in statewide and national contests. Voterparticipation is a nationwide problem, and election timing changes formunicipal elections would be only an incremental improvement.Ultimately, broader reforms such as extended voting hours, 100 percentmail-in elections, or Internet voting might be more fundamental.
Third, a move to concurrent elections raises, for some observers,several concerns about voter attentiveness and knowledge, which may inturn affect the competitiveness and outcomes of city elections. Thecoupling of local elections with national or statewide contests would leadto longer, more complex ballots that might increase voter confusion.Another worry is that on-cycle elections would draw attention away fromlocal politics. Local contests might simply be overshadowed by moreimportant statewide or national contests. Moving to concurrentelections could also alter the competitive dynamics of elections. AsChapter 4 shows, incumbents win more regularly in cities withconcurrent elections. Given that incumbents already win 80 percent ormore of their city council and mayoral reelection bids, a widespreadmove to on-cycle elections might make the outcomes of local contestsalmost a foregone conclusion. Indeed, some observers have raisedconcerns that concurrent elections would make it harder for challengersto raise campaign funds, which would mean that municipal incumbentsmight find it easier to ignore voters and their concerns. Still, thestatistical relationship between timing and incumbent success is relativelymild, especially in comparison with more important factors such as citypopulation size.
Overall, these concerns are solid arguments for civic education, voteroutreach campaigns, higher-quality media coverage of local races, andintensive campaigning by candidates for mayor and council. They are, inour view, not good arguments for scheduling local elections so as toknowingly reduce public participation. Being asked to cast a vote on agiven matter may itself spur an educational and information-gathering

67
effort in many citizens.2 Ultimately, which approach Californiapolicymakers choose to pursue will depend on how much they valuedifferent aspects of the democratic process.
There are real reasons to be concerned about low rates of voterparticipation. Indeed it is difficult to argue with the claim that movingtoward full participation of all citizens should be a goal of everydemocracy. As such, we have tried to identify tools that could encouragevoter turnout and expand participation in the local electoral arena.____________
2As Lupia (1994) shows, voters need not be experts on a given topic to be able tofind informational cues (such as endorsements) that help them determine how theyshould vote.


69
Appendix A
Survey of City Clerks
This appendix consists of a copy of the survey administered to cityclerks in the fall of 2000 and spring of 2001. For all categorical and “yesor no” questions, we also show the distribution of responses.
On several follow-up questionnaires sent to nonrespondents or torespondents with incomplete or unusable responses, we changed thewording of question 11 to read, “Please enter the date of the most recentcontested city council election.”
The response rate varied widely across questions (Table A.1). Somequestions did not apply in some cases or were difficult for city clerks toanswer. Only cities with a directly elected mayor answered questions 2through 10. The maximum number of possible responses for these itemsis 134 cities. Several questions required an answer only if the previousquestion was answered in the affirmative. These will naturally have fewerresponses.

70
Table A.1
Number of Valid Responses for Individual Variables
SurveyItem
Numberof Cities
SurveyItem
Number ofCities
q1 391 q18a 387q2 134 q18b 387q3 130 q19 376q4 133 q20 353q5 133 q21 386q6 133 q21a 31q6a 96 q22 378q7a 124 q23 383q7b 104 q24 401q8 134 q25 385q9(1st) 122 q26a 374q9(2nd) 97 q26b 384q10 134 q27 393q11 396 q28a 388q12 396 q28b 388q12a 389 q28c 388q12b 396 q28d 388q13 354 q29 391q14 393 q30a 395q15 390 q30b 395q15a 362 q30c 389q16 301 q30d 383q17a 277 q30e 395q17b 277 q31a 307q17c 274 q31b 125q17d 273 q32a 394q17e 274 q32b 393

71
Voter Turnout inMunicipal Elections:
A Survey of California City Clerks
Thank you for assisting us in our research on voterparticipation in California municipal elections. Pleasecomplete the brief questionnaire below and return it inthe enclosed postage-paid envelope. If you are unable toanswer certain questions, please answer all of the otherquestions and return the survey. Your information is stillvery important to us. The data you provide will be thebasis of important research on voter turnout in citiesacross the state. Please do not hesitate to contact us ifyou have any questions.
Project Directors:Paul Lewis ([email protected]),
Zoltan Hajnal ([email protected])Hugh Louch ([email protected])
Public Policy Institute of California500 Washington Street, Suite 800
San Francisco, CA 94111(415) 291-4400 phone
(415) 291-4401 fax
City:Code:

72
Q-1. How is your mayor (chief elected official) selected? (Check the mostappropriate response.)
33.4% Voters elect the mayor directly54.7% Council selects the mayor from among its members 1.5% Council member receiving most votes in the election
becomes the mayor 9.5% Council members rotate into the position of mayor 0.0% Other (please specify) ________________________
If voters DO NOT elect the mayor directly,please skip ahead to question Q-11. Your responses to the other questions are very important to us.
Q-2. What was the date of the most recent election for mayor held inyour city? (Please enter the date of the general mayoral election, NOTthe runoff, if any.)
_________ ______ , ________ month day year
Q-3. How many voters in your city cast ballots for mayor in thatelection?
_____________
Q-4. How many registered voters were there in your city at the time ofthat election?
_____________
Q-5. How many mayoral candidates were listed on the ballot of thatelection?
_____________
Q-6. Was there an incumbent standing for reelection?72.2% yes 27.8% noA. If yes, did the incumbent win the election?86.5% yes 13.5% no

73
Q-7. What percentage of the vote for mayor was captured by the top twocandidates in that election?
a. 1st Place _______% b. 2nd Place _______%
Q-8. Was there a subsequent runoff election? 6.0% yes 94.0 % no
Q-9. What is the race/ethnicity of the first and second place finishers inthe mayoral election referred to in question Q-2? (Check the mostappropriate response.)
1st Place 2nd Placea. White, not Hispanic 79.5% 77.3%b. Black, not Hispanic 4.1 7.2c. Asian, not Hispanic 0.8 2.1d. Hispanic, of any race 15.6 12.4e. Other (please specify) 0.0 1.0
Q-10. Was there also an election for one or more council seats on thatday?
95.5% yes 4.5% no
All respondents, please answer the following questions.
Q-11. Please enter the date of the most recent city council election.(Please use the most recent regular election, not a special election to fill avacated seat, etc.)
_________ ______ , ________ month day year
Q-12. How many city council seats were chosen in that election?_____________
A. How many total candidates appeared on the ballot?_____________
B. How many total seats are there on the city council?_____________

74
Q-13. How many voters in your city cast ballots for city council races inthat election? (If council is elected by district please indicate the totalnumber of ballots cast citywide. If council seats are elected at large, pleaseindicate the total number of ballots cast in the council race with the greatestturnout.)
____________
Q-14. How many registered voters were there in your city at the time ofthat election?
_____________Q-15. How many incumbents ran for reelection to council in thatelection?
_____________A. How many of those incumbents were reelected?
_____________
For the following questions (Q-16 through Q-22), pleaserefer to the most recent mayoral election if the mayor isdirectly elected by the voters. If not, please refer to themost recent city council election.
Q-16. To the best of your knowledge, were there any organized attemptsto purge the registered voter roll (removing voters who had died, moved,etc.) in the three years prior to that election?
47.8% yes 52.2% no
Q-17. Were voters in your city selecting any other local officials in theelection held on that day? (Please check all applicable offices.)
17.7% City attorney or city treasurer23.8 Other city office(s)25.5 County supervisor(s)15.0 County treasurer or sheriff or other county office(s)45.6 School board member(s)

75
Q-18. How many city-level propositions were on the ballot in thatelection? (Please indicate the number of each type.)
________ citizen-sponsored initiatives________ propositions placed by council
Q-19. In your judgment, how much popular interest or controversyamong voters was generated by the city-level ballot questions in thatelection? (Check the most appropriate response.)
14.6% More interest/controversy than most elections in this city
10.9 About the same as most other elections in this city4.3 Less interest/controversy than in most elections in this
city70.2 There were no municipal ballot questions in that
election
Q-20. How many citizen-sponsored initiatives were on the ballot in theyears 1997, 1998, and 1999 (all elections)? Again, please consider onlycity-level ballot questions.
Total number of initiatives 1997–99: ___________
Q-21. Over the years from 1997 through 1999, were any recallinitiatives filed against the mayor and/or council members?
8.0% Yes 92.0% NoA. If yes, were any successful?
67.7% Yes 32.3% No
Q-22. Recognizing how complex a community’s affairs are, please reviewthe following general statements and select the one that best describeselections in your city in the last five years, compared to othermunicipalities in your region:
35.4% Our elections are low-key affairs with no major controversies
51.1 Elections are generally low-key, but there have been some notable controversies
13.5 Our city often has controversial elections

76
We conclude the survey by asking several basic questionsabout the structure of government in your city. PLEASENOTE: In answering these questions, refer to theconditions in your city at the time of the mayoral or citycouncil election you answered questions about above, notthe current conditions, if different.
Q-23. What is the length of the mayor’s term of office? (Important: Ifthe chief elected official is a member of the council, specify the term forthe position of mayor, not of council member.)
_______ years
Q-24. Is the mayoralty in your city considered a full-time or part-timeoffice? (Generally, the office is considered full-time only if it carries afull-time salary.)
3.2% Full-time 92.8% Part-time 4.0% Don’t know
Q-25. Does the mayor in your city have the authority to veto actions ofthe city council?
3.6% yes 96.4% no
Q-26. Does your city limit the number of terms either the mayor or citycouncil members can hold?
Mayor*: 27.3% yes 72.7% noCity Council: 18.5% yes 81.5% no(*Responses for directly-elected mayoralties only.)
Q-27. Which of the following statements best describes the structure ofgovernance in your city?
2.5% MAYOR-COUNCIL Elected council or board serves as the legislative body. The chief elected official is the head of government, generally elected separately from the council, with powers that may range from limited duties to full-scale authority for the daily operation of the government.

77
97.0 COUNCIL-MANAGER Elected council or board is responsible for making policy. A professional administrator or manager appointed by the board or council has full responsibility for the day-to-day operations of the government.
0.5 Other (please specify:___________________________)0.0 Not sure
Q-28. What methods are used to elect council members in your city? Fillin the number of seats elected by each method.
a. At-large, elected citywide 92.5%b. Elected from districts 5.4c. Members represent districts, but 2.1
are elected citywided. Other method 0.0
(please specify: _________________________________)
Q-29. Who has the overall responsibility for developing the budgetsubmitted to the council? (check one)
0.3% Mayor92.1 Chief Administrative Officer (city manager or
equivalent) 1.0 Mayor and CAO are jointly responsible 6.6 Other (please specify:__________________________)
Q-30. Regarding each of the following services in your city, are theymainly carried out by city government personnel, by county personnel,by a special district government, or by a private company undercontract with the city? (Please check the appropriate response for eachservice. Leave item blank if the particular service is not provided within yourcity.)

78
City Staff CountySpecialDistrict
PrivateFirm
Police Services 72.1% 26.6% 0.8% 0.5%
Fire Services* 54.9 26.8 14.9 0.5
Library Services 30.1 64.8 4.9 0.3
Sewer Services 65.0 10.7 18.0 6.3
Garbage Collection 16.2 0.8 1.0 82.0
Q-31. Has your city switched the timing of mayor/council elections atany time in recent years?
30.6% Yes, switched from “stand-alone” city elections toelections consolidated with statewide primary orgeneral elections
1.0 Yes, switched from consolidated elections to stand-alone elections
68.4 Other type of change or no change in election timingB. If your city switched, when was the last election using the
previous format?_________ ______ , ________
month day year
Q-32. A. Has your city made any changes in the structure of citygovernment (mayor-council, council-manager, etc.) in recent years?
4.3% yes 95.7% noB. Has your city made any changes in the way council members
are elected (district, at-large, etc.) in recent years?4.1% yes 95.9% no
If the answer to either Q-32A or Q-32B is yes, please describe the change,and list the date it took effect, on the back of this questionnaire.
Q-33. Please indicate your job title: _____________________
*An additional 2.8 percent of cities indicated volunteer fire departments.

79
Thank you very much for your participation. Your response is crucial tohelp inform policymakers and citizens about voter turnout in Californiacities. Please return the survey in the enclosed postage-paid envelope.
You will receive a future mailing that will discuss the results of thissurvey.
We welcome your comments on these topics, as well as commentsregarding the questionnaire itself, or clarifications of your responses. Youmay include any written comments below, or on a separate sheet.
The Public Policy Institute of California is a private, nonprofit organizationdedicated to independent, nonpartisan research on economic, social, andpolitical issues that affect the lives of Californians. For further information,including the full text of PPIC research reports, please visit our World WideWeb site at www.ppic.org.


81
Appendix B
Mail Survey Procedures and DataIssues
The analyses presented in this report are based on a survey ofCalifornia city clerks conducted from October 2000 through January2001. We purchased a mailing list of city clerks for the 474 cities then inexistence from the League of California Cities. Where the contactinformation was incomplete, we used city web pages for guidance. Aquestionnaire was sent to each city clerk on the list, accompanied by anexplanatory cover letter and a postage-paid return envelope. Follow-upcontacts were made to maximize the response rate.
Ultimately, respondents from 401 cities returned their surveys. Fourcities’ responses were completely unusable because they were eitherunwilling or unable to answer the survey. One of these had not had acontested election in over a decade. Another 28 cities provided us withinformation for an uncontested election. We followed up with a secondsurvey for these cities and received new responses from 18 of them, 16 ofwhich were usable. Four cities left significant portions of the surveyblank and were contacted with a second survey. Two responded with theadditional information. A total of 375 cities returned surveys withenough responses to be useable for some portion of the analyses.
Validity of the SampleWe compared cities that responded to our survey to those that did
not on several characteristics, using census data (Table B.1). There werefew statistically significant differences between cities in the sample andthose outside of it. Notably, the population of cities in the sample was20,000 persons larger on average than cities that did not respond, butthis difference was not statistically significant. (In part, this is a result ofnearly all the state’s largest cities completing the questionnaire.) Onmost other measures, both the magnitude and the significance of

82
Table B.1
Comparing In-Sample and Out-of-Sample Cities
In SampleNot inSample
P-Value ofDifference
Population 55,543 30,306 0.294Percentage black 3.9 3.7 0.812Percentage Hispanic 24.4 28.4 0.188Percentage in poverty 11.7 13.9 0.029Real median income $45,501 $46,831 0.662Percentage unemployed 7.2 7.9 0.194Percentage home owner 58.8 61.0 0.242Average household size 2.8 3.0 0.047
differences were negligible. Cities in and out of the sample had similarpercentages of Hispanics and blacks, unemployed persons, and homeowners, as well as similar average incomes. Two factors—poverty andhousehold size—were significantly different, but the magnitude of thosedifferences was minimal. Cities not in the sample had an average povertyrate 2 percent higher than those in the sample. The average householdsize was also 0.2 persons greater on average. Neither of these numbersraises concerns about the value of the sample.
We also compared the distribution of cities across the regions of thestate and across city types (central city, suburb, rural), but found nosignificant differences (Table B.2). Slightly fewer cities from the CentralValley and slightly more cities from outside the three major regions (LosAngeles area, Bay Area, and the Central Valley) responded to our survey,but the differences were quite small. Among the different types of cities,we achieved the best response rate from central cities (95 percent),although they represent the smallest proportion of cities in California(only 10 percent).
Cleaning the DataSeveral changes were made to fix data errors and minimize missing
data. In general, we took respondents’ entries at face value and assumedthat they answered questions correctly. If we had substantial concreteevidence contradicting a particular response, we used that information.

83
Table B.2
Geographic Distribution of Cities in Sample
Region
PercentageRespondingto Survey
Greater Los Angeles 84.5Bay Area 84.7Central Valley 83.0Other 88.2
City typeCentral city 95.9Suburb 84.3Rural 83.0
NOTE: significance = 0.763 forregion, 0.075 for city type.
Such evidence included published newspaper reports, vote tallies listedon official election websites, or phone conversations with city clerks ortheir staff.
The major change we undertook was to minimize the extent ofmissing data. A substantial minority of respondents did not answer oneor more crucial survey questions that would have made their responseseffectively unusable. Table B.3 lists the number of missing values forquestions regarding the number of voters, registered voters, and
Table B.3
Important Missing Values
Question Description Missing
Mayoral Election
q3 Number of voters 9q4 Registered voters 5q5 Number of candidates 4
Council Election
q12a Number of candidates 25q13 Number of voters 41q14 Registered voters 30

84
candidates for mayoral and council elections. These questions providethe core information for establishing turnout and competitiveness of agiven election.
To fix missing voter registration tallies, we turned to the Report ofRegistration published by the California Secretary of State. Although notcompleted each month, a report is available within two months of anyelection date, providing an accurate assessment of voter registration forevery city in California for a given election.
To remedy missing data issues for the number of voters andcandidates, we conducted a newspaper search of voting results for eachcity missing any piece of information. Major newspapers in Californiapublish election returns for both concurrent and nonconcurrent electionsand can be easily accessed on-line. This search considerably narrowedthe number of missing values for voters and candidates listed. For severalcities, we were unable to use this information for council electionsbecause of the method of election used in many California cities. Citiesin California often elect more than one council member for a givenelection. When these elections are conducted at-large, voters are typicallyasked to select multiple candidates. Because many voters cast ballots forfewer candidates than they are permitted, we cannot obtain an accurateassessment of total turnout for these cities.
The newspaper check also allowed us to replace missing values forseveral other variables:
• The number and success of incumbents—questions 6 and 15,• Other offices up for election—question 17,• City propositions on a given ballot—question 18, and• Recall elections—question 21.
In general we made very few additions to the data for thesequestions. Typically, respondents left questions blank when there wereno other offices, no recall, no city measures on the ballot, or noincumbents up for reelection. For the handful of cases for which this wasnot the case, we input information from the newspaper sources.

85
Correcting Specific Data ProblemsEach survey question was checked for impossible values where
necessary. In particular, questions 2 and 11 were checked to see thatresponses conformed to an actual election date. Questions 7a and 7bwere checked to be sure that totals did not add up to more than 100percent and that 7b was not greater than 50 percent. Questions 6a, 15a,and 21a were made to be missing if respondent indicated a “no” answeron Questions 6, 15, or 21, respectively. These second-part questionsshould not have been answered if the first part was answered in thenegative. We assume that if a respondent answered either question 18aor 18b, but not both, that they intended for the other part to be zero.Also, if a respondent left question 19 blank but wrote in a zero for both18a and 18b we know that 19 should be coded to indicate that therewere no propositions on the ballot. If a respondent incorrectly answeredquestion 19 when both 18a and 18b were zero, we assume that this wasan honest misreading of the question and alter their answer to indicatethat there were no propositions on the ballot.
Another major issue is discrepancies between questions 12b and 28.In both cases respondents were asked to indicate the number of councilseats. Twenty respondents answered both questions and indicateddifferent numbers of total seats. All 20 of these were cities that directlyelected their mayor. For these cities we assume that the lower number iscorrect and that the mayor sits as part of the city council. For general-law cities, this is necessarily true, as they are limited in the number ofcouncil members they can have and the mayor, if directly elected, serveson the council. For the five charter cities that had inconsistent responses,we examined city websites to make sure this was the most appropriatestrategy. In one case, a city had just changed to a directly elected mayorwith the current election. Here we use the number of seats at the timethe council was elected to appropriately fit with the other responses.Finally, a small number of cities entered the number of seats in theelection for question 12b instead of the number of seats on the council.In these cases we changed the response to correspond to question 28.

86
One smaller problem came because cities entered check marks inresponse to questions 18a or 18b instead of a number. Although wecannot appropriately include these values for the raw versions of thesequestions, the analyses presented in this report use only binary versions ofthese variables (i.e., the presence of any city-level ballot propositions),making it possible to include these cases in our analysis.
For tabulated responses to question 30, county refers to servicesprovided either by a county or by another city. We also include aseparate code for volunteer fire departments for question 30 when thisinformation was volunteered by the respondent. There were 11 cases ofthis.

87
Appendix C
Voter Turnout Regressions
This appendix provides information regarding the voter turnoutregressions discussed in Chapter 3. Table C.1 shows the results ofestimations for two dependent variables: the percentage of registeredvoters casting ballots and the estimated percentage of all adults castingballots. As noted in Chapter 3, city council elections and mayoralelections (for those cities that have a separately elected mayor) are mergedin this dataset. The “mayoral election” variable is used to denote themayoral elections in the sample. Finally, for the 421 observations ofcouncil or mayoral elections included in the regressions, Table C.2provides the mean, high value, and low value for each variable.

88
Table C.1
Turnout in City Elections: Regression Model
Percentage CastingBallots
RegisteredVoters
AdultResidents
Timing variablesPresidential (compared to off-cycle) 35.72*** 23.39***
(14.60) (13.07)Presidential primary (compared to off-cycle) 20.66*** 11.19***
(6.74) (5.00)Gubernatorial (compared to off-cycle) 26.02*** 15.37***
(14.70) (11.85)Odd-year November (compared to off-cycle) 1.97 –0.82
(0.96) (0.54)Mayor and council election held same day 1.43 1.13
(0.92) (0.99)Other local elections held same day 0.27 0.25
(0.22) (0.27)Mayoral election (compared to council election) –3.33** –1.79
(2.01) (1.47)Institutional variablesCharter (compared to general-law) city 0.55 0.64
(0.33) (0.52)District (compared to at-large) council election –1.03 –8.44***
(0.30) (3.64)Number of services provided by city staff 0.98** 0.37
(2.02) (1.04)Office has term limits 0.80 0.64
(0.47) (0.51)Electoral context variablesOne or more propositions on city ballot 4.11*** 3.52***
(3.26) (3.79)Election uncontested –5.48** –4.28**
(2.09) (2.22)Candidates per seat 0.93* 0.69*
(1.86) (1.87)Incumbents per seat 0.41 0.13
(0.24) (0.11)Percentage of voting-age residents registered (est.) –0.14** n/i
(1.98)

89
Table C.1 (continued)
Percentage CastingBallots
RegisteredVoters
AdultResidents
City population characteristicsCity population (natural log) –3.28*** –2.45***
(5.31) (5.44)Socioeconomic status (factor score) 3.65*** 3.94***
(3.12) (4.79)Percentage black –0.04 –0.00
(0.38) (0.01)Percentage Hispanic –0.07 –0.20***
(1.43) (6.66)Percentage Asian –0.25*** –0.34***
(3.34) (6.48)Percentage age 18 to 24 0.09 0.04
(0.41) (0.23)Percentage age 65 or older 0.31** 0.26**
(2.06) (2.32)Percentage lived in same house for 5 years 0.02 0.12**
(0.29) (1.98)Percentage institutionalized n/i –0.31***
(2.91)Constant 65.01*** 42.14***
(6.79) (7.40)Observations 421 421Adjusted R-squared 0.61 0.67
NOTES: *p < 0.10, **p < 0.05, ***p < 0.01. n/i indicates variableis not included in regression. Absolute values of t-values are inparentheses.

90
Table C.2
Descriptive Statistics of Variables for Observations in the Regression
Mean Value Low Value High ValueDependent variablesTurnout of registered voters 47.16 7.32 88.64Turnout of adult residents 30.04 4.46 78.79
Timing variablesPresidential 0.10 0 1Presidential primary 0.05 0 1Gubernatorial 0.49 0 1Odd-year November 0.18 0 1Mayor and council election held same day 0.49 0 1Other local elections held same day 0.54 0 1
Institutional variablesCharter city 0.24 0 1District council election 0.04 0 1Number of services provided by city staff 2.57 0 5Office has term limits 0.22 0 1
Electoral context variablesAny ballot measures 0.34 0 1Uncontested election 0.07 0 1Candidates per seat 2.60 1 14Incumbents per seat 0.69 0 1Percentage registered, of voting-age
residents (est.)63.00 12.47 97.64
Type of electionMayoral 0.30 0 1
City population characteristicsCity population (natural log) 10.27 5.25 15.13Socioeconomic status (factor score) 0.01 –2.02 4.62Percentage black 4.23 0 46.42Percentage Hispanic 30.57 2.15 98.27Percentage Asian 9.09 0 61.51Percentage age 18 to 24 9.28 2.36 33.56Percentage age 65 or older 11.61 3.65 45.06Percentage lived in same house for 5 years 43.70 11.35 70.81Percentage institutionalized 1.49 0 39.98

91
Appendix D
Candidate Competition Regression
Table D.1 displays results for the regression described in Chapter 4.This model attempts to account for the number of candidates runningfor office (whose names are listed on the ballot). The dependent variableis the natural logarithm of the number of candidates (for mayoralelections) or of the number of total candidates divided by the number ofseats (for council elections). Mayoral and council elections are merged inthe regression. The “mayoral election” variable is an indicator used todifferentiate between mayoral and council elections in the sample.

92
Table D.1
Determinants of Competition for Office
Mayoral election (compared to council election) –0.21***(3.48)
Concurrent with statewide election (compared to nonconcurrent) 0.03(0.69)
Mayoral and council election held same day 0.02(0.49)
Other local offices elected same day –0.08**(2.20)
District council elections (compared to at-large) –0.12(1.07)
Full-time mayor (compared to part-time) 0.35**(2.57)
Four-year mayoral term (compared to two-year term) 0.27***(3.68)
Charter (compared to general-law) city 0.05(0.86)
Number of services provided by city staff –0.00(0.27)
Office has term limits –0.10*(1.77)
Percentage voting-age citizens registered (est.) 0.00(1.52)
Number of voter initiatives, 1997–1999 0.03**(2.40)
Typical degree of controversy of city elections (3-point scale) 0.08**(2.45)
Incumbents per seat –0.28***(5.47)
Percentage independent/third party (of registered voters, 1999) 0.03***(4.02)
City population (natural log) 0.12***(6.43)
Residential stability –0.01**(2.25)
Percentage black 0.01**(2.22)
Percentage Hispanic 0.00***(3.32)

93
Table D.1 (continued)
Percentage Asian –0.00(0.13)
Percentage age 18 to 24 –0.01(1.45)
Percentage age 65 or older 0.01(1.21)
Constant –0.90**(2.54)
Observations 400Adjusted R-squared 0.40
NOTE: *p < 0.1, **p < 0.05, ***p < 0.01. Absolute values of t-valuesare in parentheses. Dependent variable is the log of the number ofcandidates per available council seat (for council elections) and the log ofthe number of candidates for mayor (for mayoral elections).
A potential statistical issue with the regression in Table D.1 is that ittreats mayoral and council elections from the same city as independentobservations. However, running the model with the observationsgrouped, or clustered, by city yields the same results and significancelevels, with one exception: The percentage of young adults is negativeand significant at the 0.05 significance level.
We also tried running the competition model with uncontestedelections omitted, resulting in 370 observations rather than 400, and anadjusted R-squared of 0.39. Results were again basically the same, withthe following exceptions: District council elections had a slightlysignificant, negative relationship to council competition, as did thepercentage of young adults in the city. More interesting, the differencein competition levels between mayoral and council elections vanished.This indicates that the lower level of competition for mayoralties isprimarily attributable to the substantial number of uncontested mayoralelections. As noted in Chapter 4, 17 percent of mayoral elections in ourdata were uncontested, compared to 4 percent of council elections.


95
References
Alford, Robert R., and Eugene C. Lee, “Voting Turnout in AmericanCities,” American Political Science Review, Vol. 62, 1968, pp. 796–813.
Baldassare, Mark, California in the New Millennium: The ChangingSocial and Political Landscape, University of California Press,Berkeley, California, 2000.
Bennett, Stephen Earl, and David Resnick, “The Implications ofNonvoting for Democracy in the United States,” American Journalof Political Science, Vol. 34, No. 3, 1990, pp. 771–802.
Bobo, Lawrence, and Franklin D. Gilliam, Jr., “Race, SociopoliticalParticipation, and Black Empowerment,” American PoliticalScience Review, Vol. 84, No. 2, 1990, pp. 377–393.
Bridges, Amy, Morning Glories: Municipal Reform in the Southwest,Princeton University Press, Princeton, New Jersey, 1997.
Bullock, Charles S., “Turnout in Municipal Elections,” Policy StudiesReview, Vol. 9, No. 3, 1990, pp. 539–549.
Bullock, Charles S., and Susan A. MacManus, “Structural Features ofMunicipalities and the Incidence of Hispanic Councilmembers,”Social Science Quarterly, Vol. 71, No. 4, 1990, pp. 665–681.
Cain, Bruce E., Megan Mullin, and Gillian Peele, “City Caesars? AnExamination of Mayoral Power in California,” paper presented atthe Annual Meeting of the American Political Science Association,San Francisco, California, 2001.
California Secretary of State, “Registration and Participation, November7, 2000,” 2001, available at http://www.ss.ca.gov/elections/elections.htm.

96
Campbell, Angus, Philip E. Converse, Warren E. Miller, and Donald E.Stokes, The American Voter: The Unabridged Edition, Universityof Chicago Press, Chicago, Illinois, 1980 (orig. 1960).
Casel, Carol A., “The Nonpartisan Ballot in the United States,” inBernard Grofman and Arend Lijphart (eds.), Electoral Laws andTheir Political Consequences, Agathon Press, New York, 1986, pp.226–241.
Copeland, Gary W., “Term Limits for Urban Settings: One Size FitsAll?” Urban News, Vol. 11, No. 1, 1997, pp. 1–10.
Cox, Gary, and Michael C. Munger, “Closeness, Expenditures andTurnout in the 1982 House Elections,” American Political ScienceReview, Vol. 83, 1989, pp. 217–231.
Curtin, Daniel J., Jr., Curtin’s California Land Use and Planning Law,20th ed., Solano Press Books, Point Arena, California, 2000.
Davidson, Chandler, and Bernard Grofman (eds.), Quiet Revolution inthe South: The Impact of the Voting Rights Act, 1965–1990,Princeton University Press, Princeton, New Jersey, 1994.
Dennis, Jack, “Theories of Turnout: An Empirical Comparison ofAlienationist and Rationalist Perspectives,” in William Crotty(ed.), Political Participation and American Democracy, GreenwoodPress, New York, 1991, pp. 23–65.
Engstrom, Richard L., and Michael D. McDonald, “TheUnderrepresentation of Blacks on City Councils: Comparing theStructural and Socioeconomic Explanations for South/Non-SouthDifferences,” Journal of Politics, Vol. 44, 1982, pp. 1088–1099.
Espino, Rodolfo, “The Political Legacy of Municipal Reform,” paperpresented at the Annual Meeting of the Midwestern PoliticalScience Association, Chicago, Illinois, 2001.
Finkel, Steven E., “Reciprocal Effects of Participation and PoliticalEfficacy: A Panel Analysis,” American Journal of Political Science,Vol. 29, 1985, pp. 891–913.
Gerber, Elisabeth R., Prospects for Reforming the Initiative Process, reportprepared for the University of Virginia Project on Initiatives,1999.

97
Guinier, Lani, The Tyranny of the Majority: Fundamental Fairness inRepresentative Democracy, Free Press, New York, 1994.
Hahn, Harlan, and Sheldon Kamieniecki, Referenda Voting: Social Statusand Policy Preferences, Greenwood Press, New York, 1987.
Hajnal, Zoltan L., and Mark Baldassare, Finding Common Ground:Racial and Ethnic Attitudes in California, Public Policy Institute ofCalifornia, San Francisco, California, 2001.
Hampton, Gloria J., and Katherine Tate, “Political Participation inUrban Elections: The SES Baseline Model Reexamined,” paperpresented at the Annual Meeting of the Midwest Political ScienceAssociation, Chicago, Illinois, 1996.
Hill, John, “Voter Turnout Falling in Both U.S. and State,” SacramentoBee, December 22, 2000.
International City/County Management Association (ICMA), TheMunicipal Year Book, International City/County ManagementAssociation, Chicago, Illinois, 1996.
Jacobson, Gary C., The Politics of Congressional Elections, Little, Brown,Boston, Massachusetts, 1983.
Johnson, Ted, “Cities Delay Elections to Avoid 1996 Primary Conflict,”Los Angeles Times, December 22, 1994.
Karnig, Albert K., and B. Oliver Walter, “Decline in Municipal VoterTurnout: A Function of Changing Structure,” American PoliticsQuarterly, Vol. 11, No. 4, 1983, pp. 491–505.
Karnig, Albert K., and B. Oliver Walter, “Municipal Voter TurnoutDuring the 1980s: The Case of Continued Decline,” in Harry A.Bailey and Jay M. Shafritz (eds.), State and Local Government andPolitics: Essential Reading, F. E. Peacock Publishers, Itasca,Illinois, 1993.
Krebs, Timothy B., “The Determinants of Candidates’ Vote Share andthe Advantages of Incumbency in City Council Elections,”American Journal of Political Science, Vol. 42, No. 3, 1998, pp.921–935.

98
Lelchuk, Irene, “Record-Low Vote Came at High Price,” San FranciscoChronicle, December 13, 2001.
Lien, Pei-te, “Ethnicity and Political Participation: A ComparisonBetween Asian and Mexican Americans,” Political Behavior, Vol.16, 1994, pp. 237–264.
Lupia, Arthur, “Shortcuts Versus Encyclopedias: Information andVoting Behavior in California Insurance Reform Elections,”American Political Science Review, Vol. 88, No. 1, 1994, pp. 63–76.
Magleby, David B., “Direct Legislation in the American States,” inDavid Butler and Austin Ranney (eds.), Referendums Around theWorld, AEI Press, Washington, D.C., 1994.
Mitchell, Greg, The Campaign of the Century: Upton Sinclair’s Race forGovernor of California and the Birth of Media Politics, RandomHouse, New York, 1992.
Morlan, Robert L., “Municipal Versus National Election Voter Turnout:Europe and the United States,” Political Science Quarterly, Vol. 99,No. 3, 1984, pp. 457–470.
Oliver, J. Eric, “City Size and Civic Involvement in MetropolitanAmerica,” American Political Science Review, Vol. 94, No. 2, 2000,pp. 361–372.
Pantoja, Adrian D., and Gary M. Segura, “Citizens by Choice, Voters byNecessity: Patterns in Political Mobilization by NaturalizedLatinos,” paper presented at the Annual Meeting of the MidwestPolitical Science Association, Chicago, Illinois, 2000.
Parker, Frank R., Black Votes Count: Political Empowerment in MississippiAfter 1965, University of North Carolina Press, Chapel Hill,North Carolina, 1990.
Powell, G. Bingham, “American Voter Turnout in ComparativePerspective,” American Political Science Review, Vol. 81, 1986, pp.45–65.
Putnam, Robert D., Bowling Alone: The Collapse and Revival of AmericanCommunity, Simon & Schuster, New York, 2000.

99
Rohrs, Sarah, “Growing Numbers Voting Through Mail Instead ofBooth,” San Jose Mercury News, October 20, 2000.
Rosales, Rodolfo, The Illusion of Inclusion: The Untold Political Story ofSan Antonio, University of Texas Press, Austin, Texas, 2000.
Rose, Roger (ed.), The California Initiative Process: Current Controversiesand Prescriptions, California Policy Seminar, University ofCalifornia, Berkeley, California, 1990.
Rosenstone, Steven J., and John Mark Hansen, Mobilization,Participation, and Democracy in America, Macmillan PublishingCompany, New York, 1993.
Schaffner, Brian F., Gerald Wright, and Matthew Streb, “TeamsWithout Uniforms: The Nonpartisan Ballot in State and LocalElections,” Political Research Quarterly, Vol. 54, 2001, pp. 7–30.
Schneider, Mark, and Paul Teske, Public Entrepreneurs: Agents forChange in American Government, Princeton University Press,Princeton, New Jersey, 1995.
Schrag, Peter, Paradise Lost: California’s Experience, America’s Future .New Press, New York, 1998.
Simerman, John, “Debate Surrounds Plan to Move Local Elections,”Contra Costa Times, June 8, 1998.
Sokolow, Alvin D., and Peter M. Detwiler, “California,” in Dale Krane,Platon Rigos, and Melvin Hill (eds.), Home Rule in America: AFifty-State Handbook, CQ Press, Washington, D.C., 2001, pp.58–68.
Squire, Peverill, et al., Dynamics of Democracy, Brown & Benchmark,Madison, Wisconsin, 1995.
Squire, Peverill, and Raymond E. Wolfinger, “Residential Mobility andVoter Turnout,” American Political Science Review, Vol. 81, 1987,pp. 45–65.
Teixeira, Ruy, The Disappearing American Voter, Brookings InstitutionPress, Washington, D.C., 1992.

100
Thompson, Joel A., and Gary F. Moncrief, “The Implications of TermLimits for Women and Minorities: Some Evidence from theStates,” Social Science Quarterly, Vol. 74, 1993, pp. 300–309.
Uhlaner, Carole Jean, Bruce E. Cain, and D. Roderick Kiewiet, “PoliticalParticipation of Ethnic Minorities in the 1980s,” PoliticalBehavior, Vol. 11, 1989, pp. 195–221.
Verba, Sidney, Kay Lehman Schlozman, and Henry E. Brady, Voice andEquality: Civic Voluntarism in American Politics, HarvardUniversity Press, Cambridge, Massachusetts, 1995.
Wattenberg, Martin P., Turnout Decline in the U.S. and Other AdvancedIndustrial Democracies, Center for the Study of Democracy,University of California, Irvine, California, 1998.
Welch, Susan, “The Impact of At-Large Elections on the Representationof Blacks and Hispanics,” Journal of Politics, Vol. 52, 1990, pp.1050–1076.
Welch, Susan, and Timothy Bledsoe, Urban Reform and Its Consequences:A Study in Representation, University of Chicago Press, Chicago,Illinois, 1988.
Wolfinger, Raymond E., and Steven J. Rosenstone, Who Votes? YaleUniversity Press, New Haven, Connecticut, 1980.
Wolman, Harold, Edward Page, and Martha Reauley, “Mayors andMayoral Careers,” Urban Affairs Quarterly, Vol. 25, No. 3, 1990,pp. 500–513.

101
About the Authors
ZOLTAN L. HAJNAL
Zoltan L. Hajnal is an assistant professor of political science at theUniversity of California, San Diego. Before joining UCSD, he was aresearch fellow at the Public Policy Institute of California and a MellonPostdoctoral Fellow at Brandeis University. His research interestsinclude racial and ethnic relations, urban politics, and direct democracy.He holds a B.S. in geophysics and a B.A. in political science from YaleUniversity and an M.A. and Ph.D. in political science from theUniversity of Chicago.
PAUL G. LEWIS
Paul G. Lewis is a research fellow at the Public Policy Institute ofCalifornia, where he studies local government and urban policy issues.He has authored or co-authored publications on local governmentstructure, local sales taxes, urban development, transportation policy, andregional governance, and has made presentations on such topics to avariety of governmental bodies and civic organizations. He holds an A.B.in political science from Indiana University and an M.A. and Ph.D. inpolitics from Princeton.
HUGH LOUCH
Hugh Louch is an analyst at Cambridge Systematics and a formerresearch associate at the Public Policy Institute of California. Hisresearch interests include urban transportation, housing, and planning.He received a B.A. in sociology from the University of California, SantaBarbara, and an M.A. in sociology from Princeton University.


103
Other Related PPIC Publications
The Effect of Minority Districts and Minority Representation on PoliticalParticipation in CaliforniaClaudine Gay
Interest Group Influence in the California Initiative ProcessElisabeth R. Gerber
Are There Winners and Losers? Race, Ethnicity, and California’s InitiativeProcessZoltan Hajnal, Hugh Louch
PPIC publications may be ordered by phone or from our website(800) 232-5343 [mainland U.S.]
(415) 291-4400 [Canada, Hawaii, overseas]www.ppic.org
