municipal bond monthly newsletter - morgan stanley
TRANSCRIPT

PORTFOLIO STRATEGY & RESEARCH GROUP DECEMBER 5, 2013
Morgan Stanley Wealth Management is the trade name of Morgan Stanley Smith Barney LLC, a registered broker-dealer in the United States. This material has been prepared for informational purposes only and is not an offer to buy or sell or a solicitation of any offer to buy or sell any security or other financial instrument or to participate in any trading strategy. Past performance is not necessarily a guide to future performance. Please refer to important information, disclosures and qualifications at the end of this material.
Municipal Bond Monthly Fixed Income Strategy
JOHN M DILLON Chief Municipal Bond Strategist Managing Director Morgan Stanley Wealth Management [email protected] +1 914 225-4609 MATTHEW GASTALL Municipal Bond Strategist Vice President Morgan Stanley Wealth Management [email protected] +1 914 225-9612 INVESTMENT THESIS Investors should lock in short to intermediate maturity tax- exempt income (we advocate 4- to 9-year maturities). While credit spreads remain distended and credit fundamentals are improving, we advocate mild credit curve extensions to mid-tier A rated (and higher) for GOs and mid-tier BBB (and higher) for essential service revenue bonds. We are currently in the midst of a robust tax-loss swaps season. We think such actions should be completed or well underway at this point. We continue to advocate premium (5%) coupon structure and recommend periodic portfolio reviews to monitor both credit and interest rate exposures.
Figure 1. Timeline of 10-Yr AAA MMD & 10-Yr UST Yields
Source: Municipal Strategy & TM3 MMD as of 12/4/13
Year-End Review & 2014 Outlook Although 2014 may open with the familiar look and feel of late 2013, the trajectory of interest rates and investor demand could be quite different. We anticipate further interest rate volatility in the coming months that would pressure municipal bonds (especially longer maturities) as the US economy grows. Opportunities to prepare remain. Curve positioning and coupon structure have already helped mitigate some of the pain this year and credit spread opportunities may reward in the coming months/years. We believe investors are being given a second chance to prepare accordingly.
Morgan Stanley Wealth Management’s operating range for the 10-year UST is 2.50% to 3.25%. While Morgan Stanley & Co. expects just 1.6% real GDP growth this year, a “sustained pickup” to 2.6% is the forecast for 2014, followed by 2.7% in 2015. Morgan Stanley & Co. expects the 10-year UST to reach 3.05% by April, 3.25% by the end of the second quarter, 3.40% by the close of 3Q14 and a mild drift higher to 3.45% by year-end 2014. The end result of a challenging 2013 is that value appears unlocked and/or overlooked in municipals. There will likely be a time to extend maturities, but we’re just not there yet. The US economy has been moving forward, but its vigor is debatable. Credit spread tightening stalled this year and tax reform threats have kept relative value elevated despite both the new 39.6% tax rate and the exemption from the 3.8% Medicare Surtax. The case for tax-exempt municipal bonds remains strong.
In this issue we discuss:
• The prospect of rising rates
• Economic and interest rate forecasts
• Market Review of 2013
• Market Outlook for 2014
1.4
1.6
1.8
2
2.2
2.4
2.6
2.8
3
3.2
Yiel
d (%
)
10-Yr AAA MMD Yield 10-Yr UST Yield

FIXED INCOME STRATEGY DECEMBER 5, 2013
Please refer to important information, disclosures and qualifications at the end of this material.
2
Year-End Review & 2014 Outlook 2013 was obviously a difficult year for bonds generally and municipals specifically, the likes of which we have not seen since 2008. Although 2014 may open with the familiar look and feel of late 2013, it is possible that the trajectory of interest rates and investor demand could be quite different. Despite the advent of an arguably more dovish Yellen Fed, separating tapering from tightening in investors’ minds has proven elusive. With Street expectations building for a March taper, we anticipate further interest rate volatility in the coming months that will likely continue to pressure the municipal bond market (especially longer maturities) as the US economy grows slowly.
Meanwhile, there remain multiple opportunities for investors to prepare for the road ahead. Prudent curve positioning and coupon structure have already helped savvy investors mitigate some of the pain from rising rates this year, while current credit spread opportunities may serve municipal bond investors well in the coming months and/or years. Although the bond market seems locked in a near-term holding pattern, we believe the current climate offers investors a second chance to prepare municipal bond portfolios accordingly.
Municipal credit quality is likely to continue to improve (yes, continue) along with US housing and the general economy despite select legacy credit challenges for certain high-profile issuers such as Detroit, Puerto Rico and a handful of others. This reality supports our preference for mild extensions on the credit curve to bolster portfolio yield over simply adding or maintaining outsized interest rate risk.
With state tax revenues having risen for 14 consecutive quarters and local revenues beginning to respond favorably to an improving US housing market against a backdrop of continued state and local government fiscal austerity, the presence of inordinately wide credit spreads for A and BBB rated municipal bonds seems out of place versus the longstanding trend of spread tightening in the US corporate bond sector. While a few additional muni defaults may surface in the coming year(s), we view these as important, but rather isolated, events in a broadly improving landscape. In fact, the number of first-time defaults has declined in each of the last three years, with both the number of issues and par amount of bonds affected remaining minimal in a $3.7 trillion marketplace comprised of over 60,000 unique issuers.
While preparing this note, two credit-related developments were announced that have broad implications for the municipal bond market. The first was that the federal court judge overseeing the Detroit bankruptcy filing ruled that the city is eligible for protection (as widely expected), but more importantly, also ruled that pension liabilities can be reduced via the bankruptcy process. The second development was that Illinois arrived at a pension reform agreement and Governor Quinn is expected to sign it.
Both of these events appear generally positive for municipal credit. If pension liabilities can be reduced through the bankruptcy based on the ruling that federal bankruptcy law supersedes state law, the political cost of a bankruptcy filing just increased substantially. This development also strengthens the motivation of all parties to come to the negotiating table earlier and before a filing is needed. In fact, even the very definition of “needed” becomes debatable once all parties are at risk. From a market perspective, this ruling, if upheld, should make subsequent filings less likely. It also means that related recoveries for bondholders should be marginally better (better than what being the bigger question) when the pain is shared by a larger group of creditors.
On the subject of Illinois pension reform, relatively few market participants expected progress even a few weeks ago. That said, any deal would be a win and will likely be viewed as such by the marketplace, as reform should help to mitigate the risk of further credit rating downgrades. As for broader market implications, an agreement after such political gridlock implies that there is hope for other states in the nation to begin to address their respective pension underfunding (where applicable) before a crisis sets in. As we have stated repeatedly for many years (including during California’s challenges), we remain comfortable with state level general obligation bonds throughout the nation. Illinois is no exception, but prospective buyers may need to be patient regarding market volatility while waiting for this “show me” story to play out.
The tax-exempt market has also been enduring a stubbornly consistent string of municipal bond mutual fund outflows. After experiencing inflows during the vast majority of 2012, this year brought the opposite, an almost uninterrupted string of outflows since early March that included +$1 billion redemption weeks. Interestingly, the outflows continued beyond the period when net asset values (NAVs) stabilized in the fall, whereas prior outflow trends followed NAV pricing more closely (losses prompting more selling and gains prompting more buying). This suggests that investors are still seeking to limit duration in their municipal bond investments after the unpleasant ride toward a 3% 10-year UST, with negative credit headlines exacerbating the trend.
With this concept in mind, we expect outflows to continue into 2014 and possibly until interest rates rise to a level where value is generally perceived. This comfort level may be in the 3% to 3.25% range with a potential overshoot toward 3.50%. As an aside, Morgan Stanley Wealth Management currently sees the operating range for the 10-year UST between 2.50% and 3.25%. While Morgan Stanley & Co. expects just 1.6% real GDP growth this year, a “sustained pickup” to 2.6% growth is the forecast for 2014, followed by 2.7% in 2015. Translating this into UST forecasts, Morgan Stanley & Co. expects the 10-year to reach 3.05% by April, 3.25% by the end of the second quarter, 3.40% by the close of 3Q14 and a mild drift higher to 3.45% by year-end 2014.

FIXED INCOME STRATEGY DECEMBER 5, 2013
Please refer to important information, disclosures and qualifications at the end of this material.
3
Stepping back to survey the landscape, we appear to be in a holding pattern until the next taper talk or economic data provides a reason to break out, one way or another. The municipal market has truly taken a beating in 2013 and the end result is that value has been unlocked and/or overlooked. We have already seen more than a glimpse of what rising rates can do to portfolios and it is a worthwhile effort to play defense for those unwilling to withstand the potential volatility and selective offense for those with the patience to see it through. There will likely come a day when it’s time to venture further out on the yield curve, but we’re just not there yet (in fact, we’ve moved further away in the last two months). In the interim, and in the spirit of turning lemons into lemonade, we are in the midst of a robust tax loss swaps season (actions that should either be complete or well underway at this point). While it is clear that the US economy has been moving forward, its vigor is open to debate.
This uncertainty suggests that investors should seek to lock in short to intermediate maturity tax-exempt income (we advocate 4- to 9-year maturities) in order to capture significant calendar roll
(yield declines as maturities move closer) prior to the first Fed funds rate hike estimated for at least 2015 (or beyond). Credit spreads had been tightening until interrupted this year by a confluence of factors, few of which had anything to do with broad-based fundamental credit quality, much of which had to do with the perception of risks. The nagging prospect of tax reform, however unlikely, is something that municipal investors have been navigating in recent years and this will likely continue. We place the probability of an adverse development (the 28% cap being the front-runner) for the muni market at no more than 20%. The higher probability is that tax exempts will be unable to outperform USTs, and thus remain relatively attractive on a sustained basis, despite declines in new-issue volume (declines we expect to continue in 2014), until tax reform is removed from the conversation. Meanwhile, the top federal tax rate reverted back to 39.6%, many states have increased tax rates in recent years and municipal bonds are not subject to the 3.8% Medicare Surtax. The case for tax-exempt municipal bonds remains strong.
(Absolute Yield begins on the next page)
Figure 2. Historical Timeline of 10-Yr Ratios (2010-Present)
Source: Municipal Strategy & TM3 MMD as of 12/4/13
70
75
80
85
90
95
100
105
110
115
120
125
130
135
10-Y
r Rel
ativ
e-Va
lue
Ratio
(Mun
i Yie
ld %
of U
ST)
10-Yr Ratios AVG (Jobs Act) AVG (Historical)
- American Jobs Act- 28% Exemption Cap Proposal
- FOMC: "Significant Downside Risks to Economic Outlook" - USTs Rally- Muni Supply Accelerates, Munis Underperform
- USTs Rally On Greece & Spain - Munis Significantly Underperform
- Threats to Tax-Exemption Surface Frequently- 10-Yr Ratios Average 102% Since Sept 2011

FIXED INCOME STRATEGY DECEMBER 5, 2013
Please refer to important information, disclosures and qualifications at the end of this material.
4
Absolute Yield Figure 3. 2013 Timeline of 10-Yr AAA MMD & 10-Yr UST Yield Levels
Source: Municipal Strategy & TM3 MMD as of 12/4/13
Absolute Yield It was what some investors had been waiting for and, in 2013, it finally arrived (we believe)…the rising interest rate environment. Although expected by some, the timing and speed of the upward yield adjustment was nonetheless a surprise to many. In fact, 2013 actually began with what many market participants would consider to be “much of the same,” with broad economic and political concerns throughout both the domestic and international arena, coupled with massive policy intervention from central banks around the globe. As many will recall, 2013’s New Year’s Celebrations were marked by contentious debates throughout Washington D.C. over the fiscal cliff, with the world left wondering whether a last-minute deal would be completed before midnight. Although 2013 was off to a rough start, it would conclude in a notably different fashion (sort of), one that had a profoundly negative impact on pricing in the municipal bond marketplace. As is always the case with our Year-End Review & Outlook publications, please follow the timelines throughout each section to see how developments during the year impacted the market.
Municipal prices advanced at the onset of this year amid a seasonally constructive period of new year technicals, which included heavy bond redemptions and manageable supply. Market strength in January was further bolstered by the recent passage of the American Taxpayer Relief Act of 2012, which subsequently raised taxes on the nation’s highest earners to 39.6% (constructive for tax-exempt bond demand). Relative-value ratios (municipal yield divided by the corresponding UST yield) in the 10-year sector of the yield curve subsequently plummeted to as low 89% on January 17. This ratio would then rise as the year progressed. Both tax-exempts and US Treasuries traded in a relatively narrow range until May, as fixed income markets rallied on the release of weak/alarming international news, such as Italy’s election turmoil and the Cypriot Banking Crisis, and sold off on positive developments, such as the Dow Jones Industrial Average (DJIA) circling 14,000, the temporary extension of the US debt ceiling, and the massive Euro-bank payment to the European Central Bank (ECB).
On June 3, 2013, global financial markets were first exposed to the word “taper,” and… we were off (literally). Financial markets
1.2
1.4
1.6
1.8
2
2.2
2.4
2.6
2.8
3
3.2
Yiel
d (%
)
10-Yr AAA MMD Yield 10-Yr UST Yield- European Concerns (Cyprus), USTs Advance- Low Redemptions, Heavy Issuance- Puerto Rico Downgrade - Muni Fund Outflows - April 15th Tax Deadline- Munis Underperform
-Strong April Jobs Report-DJIA 15,000
- "Taper Talks"- Substantial Weakness
- Munis "Decouple"- Fund Outflows - Supply Uptick
Detroit Bankruptcy
- Taper Anticipated- Puerto Rico Headlines- Summer Illiquidity- Fund Outflows Continue
- Weak Aug Jobs Report- "No-Taper" Rally - Low Muni Issuance- Munis Outperform
- Highest Tax-Bracket Raised - Heavy Redemptions - Manageable Supply - Low Muni Rel-Val Ratios
- Contentious Election in Italy- Munis Manage Supply - USTs Firm, Munis Underperform
- Debt Ceiling Extended- DJIA Rounds 14,000- USTs Weaken, Munis Follow
- Strong Oct Jobs Report- FOMC Minutes- Taper Possibilities Again - USTs and Munis Weaken

FIXED INCOME STRATEGY DECEMBER 5, 2013
Please refer to important information, disclosures and qualifications at the end of this material.
5
confronted the possibility that the Fed would begin to reduce its $85 billion per month asset purchase plan. Both US Treasuries and tax-exempts had already encountered weakness as a result of soaring equity valuations and the release of stronger-than-anticipated April employment data (in May). Consequently, bond prices declined dramatically and yields spiked; the yield on the 10-year UST would eventually climb to as high as 2.98% on September 5. Consistent with historical municipal market price action, tax-exempts slowly followed USTs, and outperformed in the interim. The asset class would eventually follow suit, and would decline even further on persistent bond fund outflows, summer illiquidity, the Detroit bankruptcy filing and isolated periods of heavy issuance. The 10-year AAA MMD would climb to as high as 3.04%.
Fixed income markets exhibited some signs of stability in autumn, as both USTs and municipals rallied on the release of weak economic data (weak payroll reports for August and September), the surprising no-taper announcement from the Fed, and Janet Yellen’s nomination to Chair the Federal Reserve. Tax-exempts outperformed, as new-issue volume dipped well below market expectations due to a steep decline in refunding issuance. Fixed income markets have remained buoyant since, especially following what many interpreted as a “dovish” testimony from Janet Yellen at her Federal Reserve nomination hearing. Some weakness has been observed more recently following the release of a strong October ISM, Jobs Report and FOMC Minutes.
Figure 4. Market Performance
12/31/2012 12/4/2013 Change (bps)
12/31/2012-12/4/2013 AAA
5 Year 0.81 1.20 0.39
10 Year 1.72 2.73 1.01
20 Year 2.43 3.84 1.41
30 Year 2.83 4.19 1.36 AA
5 Year 0.99 1.30 0.31
10 Year 1.95 2.97 1.02
20 Year 2.68 4.08 1.40
30 Year 3.08 4.42 1.34 A
5 Year 1.35 1.64 0.29
10 Year 2.44 3.54 1.10
20 Year 3.15 4.66 1.51
30 Year 3.50 4.99 1.49 BBB 5 Year 2.24 2.37 0.13 10 Year 3.23 4.27 1.04 20 Year 3.92 5.28 1.36 30 Year 4.14 5.54 1.40
Source: Thomson Reuters Municipal Market Data as of 12/4/13
2014 Absolute Yield Outlook Morgan Stanley Wealth Management currently sees the operating range for the 10-year UST between 2.50% and 3.25%. While Morgan Stanley & Co. expects just 1.6% real GDP growth this year, a “sustained pickup” to 2.6% growth is the forecast for 2014, followed by 2.7% in 2015.
Morgan Stanley & Co. expects the 10-year UST to reach 3.05% by April, 3.25% by the end of the second quarter, 3.40% by the close of 3Q14 and a mild drift higher to 3.45% by year-end 2014. Regarding benchmark municipal yields for 2014, we expect 10-year tax-exempts to essentially track the directional momentum of USTs, with applicable relative-value ratios generally ranging from 93% to 103%, despite our expectations for continued lower year-over-year new-issue volume in 2014 (which would normally support stronger, lower relative-value ratios). The lingering prospect of tax reform (however unlikely) and continued mutual fund outflows will likely play major roles in the coming year. The removal of these two factors would likely support a drive toward percentage ratios in the low 90s to high 80s. The long-term average since 1990 is approximately 85%. For perspective, the lowest (strongest munis) ratio during that period was a steamy 72% in October 1994 and the highest (weakest) was a chilly 186% in December 2008.
(Relative Value begins on the next page)

FIXED INCOME STRATEGY DECEMBER 5, 2013
Please refer to important information, disclosures and qualifications at the end of this material.
6
Relative Value Figure 5. 2013 Timeline of 10-Yr Relative-Value Ratios
Source: Municipal Strategy & TM3 MMD as of 12/4/13
Relative Value As we mentioned earlier, the 10-year relative-value ratio plummeted to as low as 89% on technicals. To be sure, using the word “plummeted” in conjunction with a 10-yr relative-value ratio of 89% seems odd considering the market’s long-term average resides closer to 85%. In other words, this ratio is normally significantly lower, indicating that tax-exempt yields have frequently eclipsed taxable US Treasury yields in recent years. What has been driving this underperformance? As discussed in many of our past publications, we believe ratios have remained elevated since the end of 2011, when the first threats to the longevity of the federal municipal tax exemption surfaced throughout the market. The initiative most frequently discussed throughout Washington D.C. has been the Obama Administrations “28% cap” to the federal exemption. Although the aforementioned topic was only a proposal (and various others have surfaced since), we still need to remain aware that these threats exist and need to be monitored.
As discussed, ratios in the 10-year sector of the yield curve declined early in the year, as the American Taxpayer Relief Act of 2012 raised income taxes on the nation’s highest earners amid constructive seasonal technicals. This dynamic changed at the conclusion of the first quarter, as municipals appropriately lagged the strength of the broader US Treasury market on concerns regarding Cyprus and Italy. Meanwhile, tax-exempts encountered their own headwinds (driving ratios higher), which included increased new-issue supply, declining bond redemptions, bond fund outflows, the April 15 tax deadline, Puerto Rico’s downgrade and continued rhetoric over eliminating/limiting the tax exemption. Accordingly, ratios ascended to as high as 110% on June 24. Other than a very brief period of outperformance in May, ratios would remain elevated until the fall on continued fund outflows, summer illiquidity and credit concerns (due to Detroit’s Chapter 9 bankruptcy filing as well as continued headlines over Puerto Rico).
80
83
86
89
92
95
98
101
104
107
110
10-Y
r Rel
ativ
e-Va
lue
Ratio
(Mun
i Yie
ld %
of U
ST)
10-Yr AAA MMD Rel-Value Ratio
- Income Tax Increases- Heavy Redemptions - Manageable Supply- Ratios Decline
- Influx of Supply- Threats to Exemption- Munis Underperform
- Euro Concerns, USTs Strong- Low Muni Redemptions, Heavy Supply- Puerto Rico Downgrade- Muni Bond Fund Outflows - April 15th Tax-Filing Deadline- Munis Underperform
- USTs Weaken On Strong Data - DJIA Now 15,000- Munis Slower, Outperform- Ratios Decline
- Munis "Decouple," Underperform- Isolated Periods of Heavy Supply- Detroit Bankruptcy- Puerto Rico Headlines- Fund Outflows Continue- Summer Illiquidity
- No Taper Rally- Munis Follow USTs- Low Muni Issuance- Munis Outperform
- Strong Oct Jobs Report- FOMC Minutes - USTs and Munis Weaken- Munis Outperform

FIXED INCOME STRATEGY DECEMBER 5, 2013
Please refer to important information, disclosures and qualifications at the end of this material.
7
As summer ended, market participants prepared for a seasonal acceleration in new-issue supply, but the spring/summer weakness had left its mark on the municipal primary market, pushing many potential refunding candidates “out of the money” and prompting some issuers to cancel deals due to higher borrowing costs. Despite a brief seasonal acceleration, monthly new-issue supply remained well below historical averages, which was constructive for market pricing. Consequently, relative-value ratios declined. Further intensifying this outperformance, nominal yield levels declined as USTs rallied after the Fed’s no-taper announcement, the release of positive domestic economic data, and Janet Yellen’s rather “dovish” comments. Ratios currently reside at 96% of USTs.
2014 Relative-Value Outlook The municipal asset class itself remains attractive on a relative-value basis. Despite the re-appearance of the 39.6% marginal tax rate following the fiscal cliff and the exemption for municipal bonds from the new 3.8% Medicare Surtax, municipals were unable to consistently outperform USTs during 2013. In fact, benchmark municipal yields that eclipse those of corresponding maturity USTs have become a common occurrence in today’s marketplace.
While elevated relative-value ratios may have been explained away in 2012 and early 2013 by extraordinarily low UST yields (munis just couldn’t keep up), the continued weakness amid sharply higher yields (versus 2012 levels) suggests that it’s more than just low rates dampening muni outperformance. Indeed, the specter of tax reform continues to haunt the tax-exempt market. Although the shot clock has all but run out for 2013 and prospects for tax reform are limited in 2014 by mid-term elections, there is still the potential for legislation to be introduced regardless of the chances for passage. Given the current configuration of Congress, tax reform crossing the finish line in 2014 seems rather unlikely, which means the issue will likely shadow the muni market into 2015. That said, benchmark municipal yields that are “cheap” on a relative-value basis may be with us for a while and investors should not consider these elevated ratios as a reason to disregard interest rate risk, as a substantial move in rates could easily overwhelm potential gains from outsized relative value (we’ve seen this movie before and it didn’t end well).
(New-Issue Supply begins on the next page)

FIXED INCOME STRATEGY DECEMBER 5, 2013
Please refer to important information, disclosures and qualifications at the end of this material.
8
New-Issue Supply Figure 6. 2013 New-Issue Supply & Historical Averages
Source: Municipal Strategy & The Bond Buyer as of 12/4/13
New-Issue Supply New-issue supply told two different stories during the first and second halves of this year. Primary market activity started strong, but faded considerably. New-issue volume was robust at the beginning of the year, as new money, refundings and taxable offerings all posted stronger numbers vs. historical averages. New-money issuance remained elevated as state and local government austerity eased and initiatives surfaced to address deferred maintenance. Meanwhile, low nominal interest rates bolstered refunding deals. In fact, many issuers even turned to taxable debt to refund existing securities a second time, while still clipping savings. Issuance remained elevated and near historical averages as the market moved into the spring.
The second half of the year, on the other hand, told a very different story. In a word, “taper” was the reason for the difference. Primary-market volume declined as issuers postponed deals due to market volatility. As interest rates rose, many potential refunding deals fell out of the money. Consequently, the summer’s normal deceleration in issuance
intensified. As discussed, there was a brief seasonal acceleration in autumn, though primary market volume remained well below historical averages. In fact, monthly levels of issuance posted negative YOY numbers in nearly every month since May, except for July when volume was aided by the postponed “supply overhang” of June’s postponed deals. The aforementioned modest levels of volume were constructive for market pricing and relative-value ratios. As of this publication, total new-issue municipal bond supply through November stands at $301.1 billion (-15% year-over-year); refundings are currently lower by 35% while new-money issuance continues at its slow, but steady pace, currently higher by 11% YTD YOY.
Bond insurance penetration remains low, wrapping approximately 3.5% of the primary market this year. It is important to note that the market did observe some spread tightening on insured municipal bonds following the reemergence of some headline-grabbing credit challenges, specifically Detroit’s Chapter 9 Bankruptcy Filing as well as
0
5
10
15
20
25
30
35
40
Jan Feb Mar Apr May Jun Jul Aug Sep Oct Nov Dec
2013 Supply 2000-2012 Average
Par-
Valu
e (B
illio
ns)
-Strong Start -Elevated Taxable
& New-Money Deals
-Religious Holidays-Higher Yields
-Below AVG Supply
March Issuance Falls Into April
-Bond Market Weakness -Heavy Volatility
-Issuance Postponed
- Summer Decline- Higher Rates Intensify Decline
-Minor Seasonal Acceleration-Supply Remains Below AVGs

FIXED INCOME STRATEGY DECEMBER 5, 2013
Please refer to important information, disclosures and qualifications at the end of this material.
9
investor anxiety regarding Puerto Rico debt. While we do believe such developments may increase the utilization of bond insurance, underlying ratings still command a priority focus.
2014 New-Issue Supply Outlook The decline in new-issue volume is positive from a pricing standpoint, which has recently helped the marketplace adapt to consistent mutual fund outflows. With November’s data now on the books and what appears to be only one “big” week of issuance (next week’s $10 billion to $12 billion) before the year end, we expect year-over-year volume to register a decline of approximately 15% for 2013. Looking forward, we anticipate additional volume declines of 8% to 12% in 2014. Should this trend materialize, we would be revisiting issuance levels of 2011. Like this year, the primary driver of volume declines would be rising rates and thus, fewer refundings. There is also a lower amount of refunding candidates in 2014, versus 2013 and 2015. Also similar to this year, we again expect new-money issuance to remain positive in 2014, as fiscal headwinds continue to ease and deferred projects and/or maintenance become politically palatable.
(Credit Spreads begins on the next page)

FIXED INCOME STRATEGY DECEMBER 5, 2013
Please refer to important information, disclosures and qualifications at the end of this material.
10
Credit Spreads Figure 7. 2013 Timeline of 10-Yr A Rated Credit Spreads
Source: Municipal Strategy & TM3 MMD as of 12/4/13
Credit Spreads Despite the fact that A and BBB rated credit spreads have slowly and steadily tightened since 2008, this trend stalled and even reversed course in 2013. The year began with mild compression for both rating categories. Spreads compressed on A and BBB rated securities to 60 from 72 and to 131 from 151 basis points (bps), respectively. As primary market activity remained elevated into May, spreads began to widen. This momentum intensified in the spring. Many investors began to shun lower-rated credits as interest rates rose and higher yields became available on securities of stronger credit quality. This trend continued in the summer, as a long string of municipal bond mutual fund outflows and subsequent illiquidity coincided with the Detroit bankruptcy filing and headlines regarding the credit challenges of Puerto Rico.
It is noteworthy that during a period of comparative stability in autumn, A rated paper exhibited a tendency to compress, while yields on BBB municipal bonds stalled. From our perspective, this is due to the market’s perceived comfort with investing in A rated paper over BBB rated securities (which may be due, in part, to a
substantial portion of Puerto Rico’s debt currently residing in the BBB space). In fact, the recent widening observed between yield levels of BBB and A rated bonds was the most significant movement observed between these credit bands within two years.
For the year, spreads on A rated securities are currently wider by 9 bps, at 81 in comparison to 72 basis points at the beginning of the year, while yields on BBB vs. AAA rated bonds are higher by 3bps, at 154 vs. 151 bps at the start of the year.
2014 Credit Spread Outlook Interestingly, a review of credit spreads during 2013 shows a lack of improvement despite the improving fundamental landscape. Although we view the absence of a robust municipal bond insurance industry as the key driver of these stubbornly distended credit spreads (much of the A and BBB issuance was insured prior to the financial crisis), investor anxieties this year halted and mildly reversed the trend of spread tightening in place since mid-2011.
55
58
61
64
67
70
73
76
79
82
85
88
Basis
Poi
nts A
bove
"AAA
" Rat
ed
A Rated Spreads
Gradual Compression Continues
Spreads Widen As Supply Remains Heavy
- "Taper Talks" Surface- Higher Yields Available On Stronger Credit Quality- Investors No Longer Need to "Dip Down" For Yield- Fund Outflows Continue- "A" Rated Spreads Widen
- "A" Rated Spreads Exhibit Tendencies to Compress- "BBB"s Remain Wide
- Debt-Ceiling/ Govt Shutdown- Heavy Calendar - Spreads Widen Temporarily
- FOMC Minutes- Taper Possibilities Surface Again

FIXED INCOME STRATEGY DECEMBER 5, 2013
Please refer to important information, disclosures and qualifications at the end of this material.
11
Figure 8. 2013 Timeline of 10-Yr BBB Rated Spreads
Source: Municipal Strategy & TM3 MMD as of 12/4/13
While the opportunity presented by wide credit spreads for A and BBB municipals didn’t reward investors during 2013, our expectation for continued economic recovery and the ensuing improvement in rating trends from Moody’s and Fitch (S&P is already generally constructive) suggests positive momentum may resume in late 2014. Further, the higher purchase yields (combined with subsequent spread tightening) for A and BBB rated bonds could help offset or mitigate the negative price impact of rising interest rates (which would likely be driven by continued positive economic performance).
To provide context, consider that municipal spreads remain almost four times mid-2007 levels for A rated GOs and almost five times for BBBs. We attribute much of the spread (gap) to a mismatch between new-issue inventory (mostly uninsured) and historical individual investor rating preferences (AAA insured for decades), as bond insurance penetration of the new-issue market topped 50% pre-financial crisis and now stands at approximately 3.5%.
(Yield Curve begins on the next page)
125
128
131
134
137
140
143
146
149
152
155
Basis
Poi
nts A
bove
"AAA
" Rat
ed S
ecur
ities
BBB Spreads
Same As "A," "BBB" Compression Gradually Continues
- "Taper Talks"- Fund Outflows- Investors No Longer Need to "Dip Down Credit Curve" - "BBB" Rated Spreads Widen
BBB"s Remain Wide (Most Likely Influenced By Puerto Rico)
Puerto Rico
- Summer Illiquidity - Fund Outflows Continue- Syria

FIXED INCOME STRATEGY DECEMBER 5, 2013
Please refer to important information, disclosures and qualifications at the end of this material.
12
Yield Curve Figure 9. 2013 Yield Curve Timeline
Source: Municipal Strategy & TM3 MMD as of 12/4/13
Yield Curve Similar to our other segments, changes in the slope of the municipal bond yield curve were uneventful through the first four months of this year, as the curve’s trajectory steepened with USTs during weakness at the beginning of the year (as the DJIA circled 14,000 and the US debt ceiling was temporarily extended) and flattened during rallies over domestic and international concerns, including the Cypriot banking crisis. Once again, much of this year’s action was experienced throughout the spring and the summer, as the yield curve steepened substantially on the Fed’s taper talk. The aforementioned steepening intensified further throughout the tax-exempt marketplace, as municipals encountered continued muni bond fund outflows and isolated periods of heavy issuance. The slope flattened mildly in the fall, as USTs advanced on the no-taper rally and tax-exempts encountered lower-than-anticipated levels of autumn issuance.
2014 Yield Curve Outlook The presence of a positively sloped and historically steep municipal yield curve means that investors are being compensated for extending maturities along the 1- to 30-year maturity spectrum.
While much of the rationale behind our current target maturity range of 4 to 9 years is grounded in the expectation of rising rates, another primary driver is the trajectory of the yield curve in that range. Despite the slope of the entire 30-year yield curve being over 50% steeper than the long-term average, breaking it down into 6 different 5-year bands shows that each slope is far from equal.
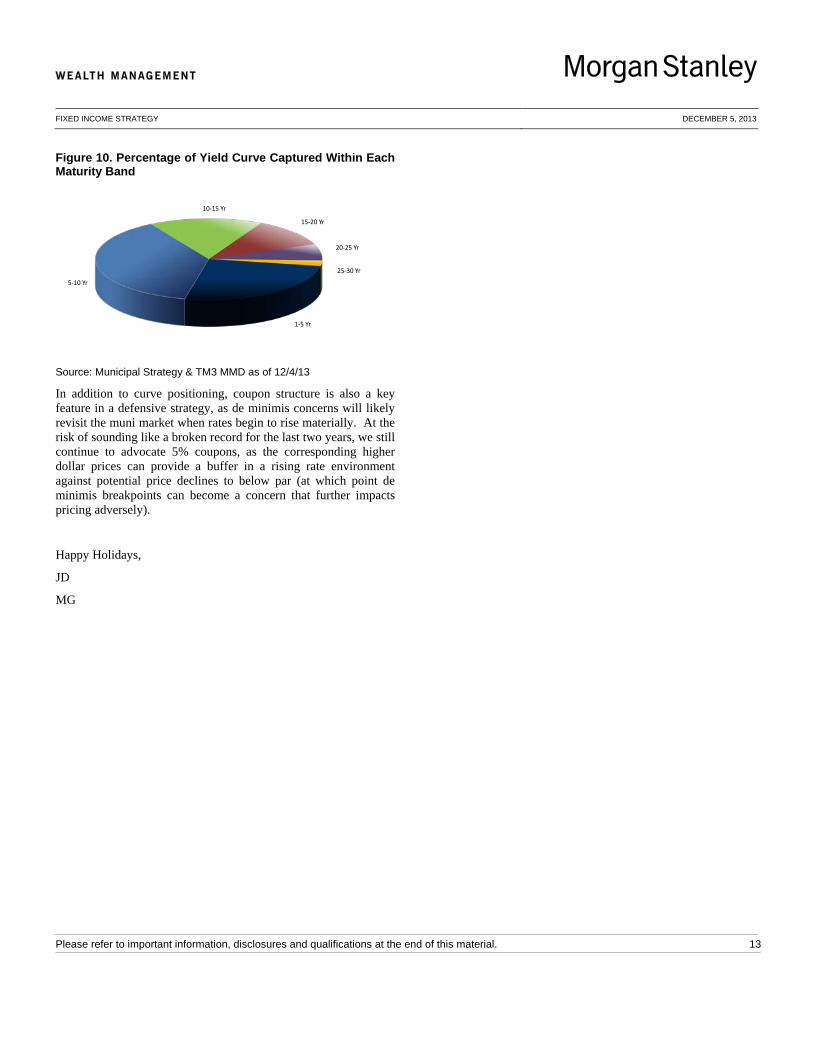
For example, the 5- to 10-year band, which approximates our 4- to 9-year focus, captures the lion’s share (153 basis points) of total available slope (402 basis points) and is more than double the long-term average (representing 38% of the curve). By comparison, the slope of the 1- to 5-year band is just slightly above average and offers 103 basis points of incremental yield (26% of the curve); the 10- to 15-year and 15- to 20-year ranges offer 65 and 46 basis points, respectively, and are both 50% above average (16% and 11% of the curve, respectively); and the last two bands, 20 to 25 years and 25 to 30 years, offer 26 and 9 basis points, respectively, while both being approximately twice the long-term average (6% and 2% of the curve, respectively). Figure 10 illustrates the slopes of each 5-year band along the yield curve.
240
265
290
315
340
365
390
415
440
Basis
Poi
nts
Yield-Curve Slope- American Taxpayer Relief Act of 2012- New-Year Technicals- Heavy Redemptions / Manageable Supply- Slope Flattens
- Cypriot Banking Crisis- Munis Follow USTs Stronger
- "Taper Talks"- Yield-Curve Steepens On Concerns of "QE" Infinity Reduction
- Munis "Decouple"- Fund Outflows Continue- Isolated Periods of Supply
- "No Taper" Rally- Yield-Curve Flattens
- Strong Economic Data- Taper Possibilities Resurface- Minor Seasonal Supply Acceleration- Yield-Curve Steepens
FIXED INCOME STRATEGY DECEMBER 5, 2013
Please refer to important information, disclosures and qualifications at the end of this material.
13
Figure 10. Percentage of Yield Curve Captured Within Each Maturity Band
Source: Municipal Strategy & TM3 MMD as of 12/4/13
In addition to curve positioning, coupon structure is also a key feature in a defensive strategy, as de minimis concerns will likely revisit the muni market when rates begin to rise materially. At the risk of sounding like a broken record for the last two years, we still continue to advocate 5% coupons, as the corresponding higher dollar prices can provide a buffer in a rising rate environment against potential price declines to below par (at which point de minimis breakpoints can become a concern that further impacts pricing adversely).
Happy Holidays,
JD
MG
1-5 Yr
5-10 Yr
10-15 Yr
15-20 Yr
20-25 Yr
25-30 Yr

FIXED INCOME STRATEGY DECEMBER 5, 2013
Please refer to important information, disclosures and qualifications at the end of this material.
14
Disclosures
The author(s) (if any authors are noted) principally responsible for the preparation of this material receive compensation based upon various factors, including quality and accuracy of their work, firm revenues (including trading and capital markets revenues), client feedback and competitive factors. Morgan Stanley Wealth Management is involved in many businesses that may relate to companies, securities or instruments mentioned in this material. This material has been prepared for informational purposes only and is not an offer to buy or sell or a solicitation of any offer to buy or sell any security/instrument, or to participate in any trading strategy. Any such offer would be made only after a prospective investor had completed its own independent investigation of the securities, instruments or transactions, and received all information it required to make its own investment decision, including, where applicable, a review of any offering circular or memorandum describing such security or instrument. That information would contain material information not contained herein and to which prospective participants are referred. This material is based on public information as of the specified date, and may be stale thereafter. We have no obligation to tell you when information herein may change. We make no representation or warranty with respect to the accuracy or completeness of this material. Morgan Stanley Wealth Management has no obligation to provide updated information on the securities/instruments mentioned herein. The securities/instruments discussed in this material may not be suitable for all investors. The appropriateness of a particular investment or strategy will depend on an investor’s individual circumstances and objectives. Morgan Stanley Wealth Management recommends that investors independently evaluate specific investments and strategies, and encourages investors to seek the advice of a financial advisor. The value of and income from investments may vary because of changes in interest rates, foreign exchange rates, default rates, prepayment rates, securities/instruments prices, market indexes, operational or financial conditions of companies and other issuers or other factors. Estimates of future performance are based on assumptions that may not be realized. Actual events may differ from those assumed and changes to any assumptions may have a material impact on any projections or estimates. Other events not taken into account may occur and may significantly affect the projections or estimates. Certain assumptions may have been made for modeling purposes only to simplify the presentation and/or calculation of any projections or estimates, and Morgan Stanley Wealth Management does not represent that any such assumptions will reflect actual future events. Accordingly, there can be no assurance that estimated returns or projections will be realized or that actual returns or performance results will not materially differ from those estimated herein. This material should not be viewed as advice or recommendations with respect to asset allocation or any particular investment. This information is not intended to, and should not, form a primary basis for any investment decisions that you may make. Morgan Stanley Wealth Management is not acting as a fiduciary under either the Employee Retirement Income Security Act of 1974, as amended or under section 4975 of the Internal Revenue Code of 1986 as amended in providing this material. Morgan Stanley Wealth Management and its affiliates do not render advice on tax and tax accounting matters to clients. This material was not intended or written to be used, and it cannot be used or relied upon by any recipient, for any purpose, including the purpose of avoiding penalties that may be imposed on the taxpayer under U.S. federal tax laws. Each client should consult his/her personal tax and/or legal advisor to learn about any potential tax or other implications that may result from acting on a particular recommendation. Bonds are subject to interest rate risk. When interest rates rise, bond prices fall; generally the longer a bond's maturity, the more sensitive it is to this risk. Bonds may also be subject to call risk, which is the risk that the issuer will redeem the debt at its option, fully or partially, before the scheduled maturity date. The market value of debt instruments may fluctuate, and proceeds from sales prior to maturity may be more or less than the amount originally invested or the maturity value due to changes in market conditions or changes in the credit quality of the issuer. Bonds are subject to the credit risk of the issuer. This is the risk that the issuer might be unable to make interest and/or principal payments on a timely basis. Bonds are also subject to reinvestment risk, which is the risk that principal and/or interest payments from a given investment may be reinvested at a lower interest rate. Bonds rated below investment grade may have speculative characteristics and present significant risks beyond those of other securities, including greater credit risk and price volatility in the secondary market. Investors should be careful to consider these risks alongside their individual circumstances, objectives and risk tolerance before investing in high-yield bonds. High yield bonds should comprise only a limited portion of a balanced portfolio. Interest on municipal bonds is generally exempt from federal income tax; however, some bonds may be subject to the alternative minimum tax (AMT). Typically, state tax-exemption applies if securities are issued within one's state of residence and, if applicable, local tax-exemption applies if securities are issued within one's city of residence. A taxable equivalent yield is only one of many factors that should be considered when making an investment decision. Morgan Stanley Wealth Management and its Financial Advisors do not offer tax advice; investors should consult their tax advisors before making any tax-related investment decisions. Yields are subject to change with economic conditions. Yield is only one factor that should be considered when making an investment decision.

FIXED INCOME STRATEGY DECEMBER 5, 2013
Please refer to important information, disclosures and qualifications at the end of this material.
15
Credit ratings are subject to change. This material is disseminated in Australia to “retail clients” within the meaning of the Australian Corporations Act by Morgan Stanley Wealth Management Australia Pty Ltd (A.B.N. 19 009 145 555, holder of Australian financial services license No. 240813). Morgan Stanley Wealth Management is not incorporated under the People's Republic of China ("PRC") law and the research in relation to this report is conducted outside the PRC. This report will be distributed only upon request of a specific recipient. This report does not constitute an offer to sell or the solicitation of an offer to buy any securities in the PRC. PRC investors must have the relevant qualifications to invest in such securities and must be responsible for obtaining all relevant approvals, licenses, verifications and or registrations from PRC's relevant governmental authorities. Morgan Stanley Private Wealth Management Ltd, authorized by the Prudential Regulatory Authority and regulated by the Financial Conduct Authority and the Prudential Regulatory Authority, approves for the purpose of section 21 of the Financial Services and Markets Act 2000, research for distribution in the United Kingdom. Morgan Stanley Wealth Management is not acting as a municipal advisor and the opinions or views contained herein are not intended to be, and do not constitute, advice within the meaning of Section 975 of the Dodd-Frank Wall Street Reform and Consumer Protection Act. This material is disseminated in the United States of America by Morgan Stanley Smith Barney LLC. Third-party data providers make no warranties or representations of any kind relating to the accuracy, completeness, or timeliness of the data they provide and shall not have liability for any damages of any kind relating to such data. Morgan Stanley Wealth Management research, or any portion thereof, may not be reprinted, sold or redistributed without the written consent of Morgan Stanley Smith Barney LLC. © 2013 Morgan Stanley Smith Barney LLC. Member SIPC.