mumbai fsi
TRANSCRIPT
Study on the assessment of FSI for Greater Mumbai
1
By:
Architect Hafeez Contractor&
Pankaj Kapoor

2
Agenda for the Presentation
Fact About Mumbai
Why Mumbai should have higher FSI
What should be Mumbai’s FSI
3
4
Mumbai should be a high-rise city.
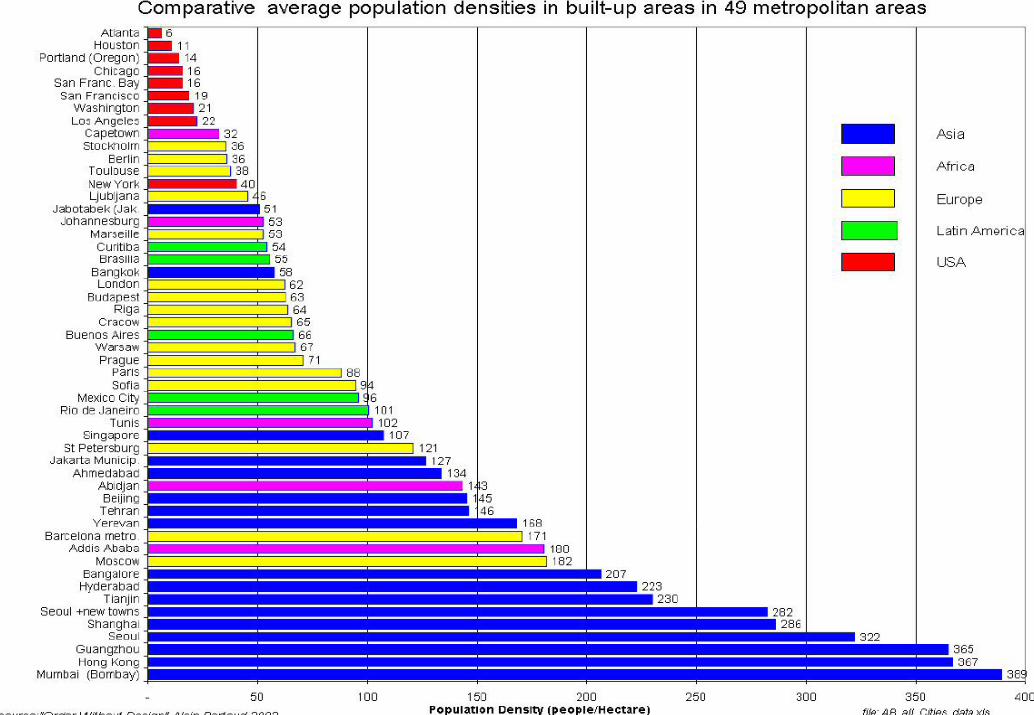
Mumbai has maximum built-up area density in the world. It should be high rise city.
Our regulation of FSI limits the floor space that can be produced per unit of land.
So Mumbai is instead a city of medium and low-rise buildings.

5
Agenda for the Presentation
Fact About Mumbai
Why Mumbai should have higher FSI
What should be Mumbai’s FSI
6
Supply reduction caused by low FSI has Resulted into:
Higher Prices per square foot
Lower consumption of floor space (slums)
Excessive spatial expansion of city and longer trips
7
It also prevents redevelopment of obsolete buildings
Without higher FSI, projects are usually not financially feasible.
As a consequence, few buildings get renovated and the city is saddled with inefficient, obsolete space
8
Low FSI hampers the growth of business activities
Recent economic research has shown that high business densities are critical to generating synergies among firms.
Low FSI harms the city’s economic vitality.

9
Agenda for the Presentation
Fact About Mumbai
Why Mumbai should have higher FSI
What should be Mumbai’s FSI
10
11
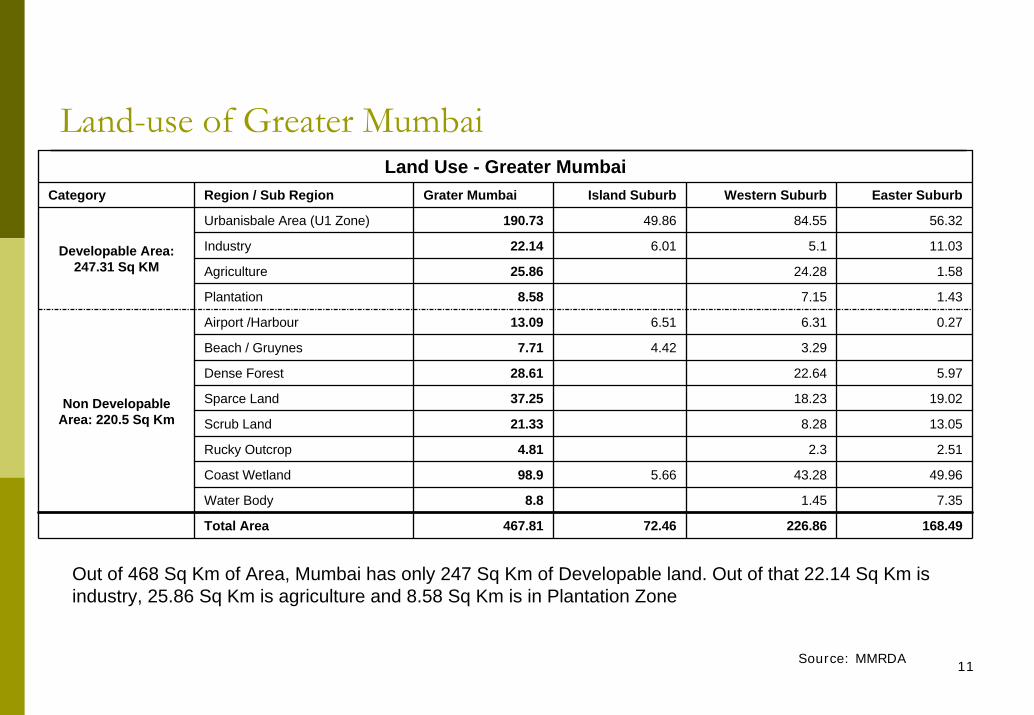
Land-use of Greater MumbaiLand Use - Greater Mumbai
Category Region / Sub Region Grater Mumbai Island Suburb Western Suburb Easter Suburb
Urbanisbale Area (U1 Zone) 190.73 49.86 84.55 56.32
Industry 22.14 6.01 5.1 11.03
Agriculture 25.86 24.28 1.58
Plantation 8.58 7.15 1.43
Airport /Harbour 13.09 6.51 6.31 0.27
Beach / Gruynes 7.71 4.42 3.29
Dense Forest 28.61 22.64 5.97
Sparce Land 37.25 18.23 19.02
Scrub Land 21.33 8.28 13.05
Rucky Outcrop 4.81 2.3 2.51
Coast Wetland 98.9 5.66 43.28 49.96
Water Body 8.8 1.45 7.35
Total Area 467.81 72.46 226.86 168.49
Non Developable Area: 220.5 Sq Km
Developable Area: 247.31 Sq KM
Out of 468 Sq Km of Area, Mumbai has only 247 Sq Km of Developable land. Out of that 22.14 Sq Km is industry, 25.86 Sq Km is agriculture and 8.58 Sq Km is in Plantation Zone
Source: MMRDA

12
What is the net developable area for Residential Development
Assumption% of Industry, Agricultural and Plantation Area to convert into Development 10% 15% 25%
Developable Area 2001 2011 2021
A Urbanisable Area (U1 Zone) 191sqkm 191sqkm 191sqkm
B Industry 2sqkm 3sqkm 6sqkm
C Agriculture 3sqkm 4sqkm 6sqkm
D Plantation 1sqkm 1sqkm 2sqkm
E Total 196sqkm 199sqkm 205sqkm
F Less Area Under Slat Pan 22sqkm 22sqkm 22sqkm
G Less Area Under Slum 27sqkm 27sqkm 27sqkm
H Less 20% Area under Road & Rail 39sqkm 40sqkm 41sqkm
J Less 15% Area under DP Reservation 29sqkm 30sqkm 31sqkm
K Balance Developable Area (BDA) 79sqkm 80sqkm 84sqkm
L Less Area Under Commercial Development 4.70sqkm 6.50sqkm 7.02sqkm
M Net Area Available for Residential Development 74sqkm 74sqkm 77sqkm
Area under CRZ (69 Sq Km) has not been deducted from developable area. It isalso assumed that 15% & 25% of the area under industry, agriculture and plantationwill come in for development by 2015 & 2021 respectively.
13
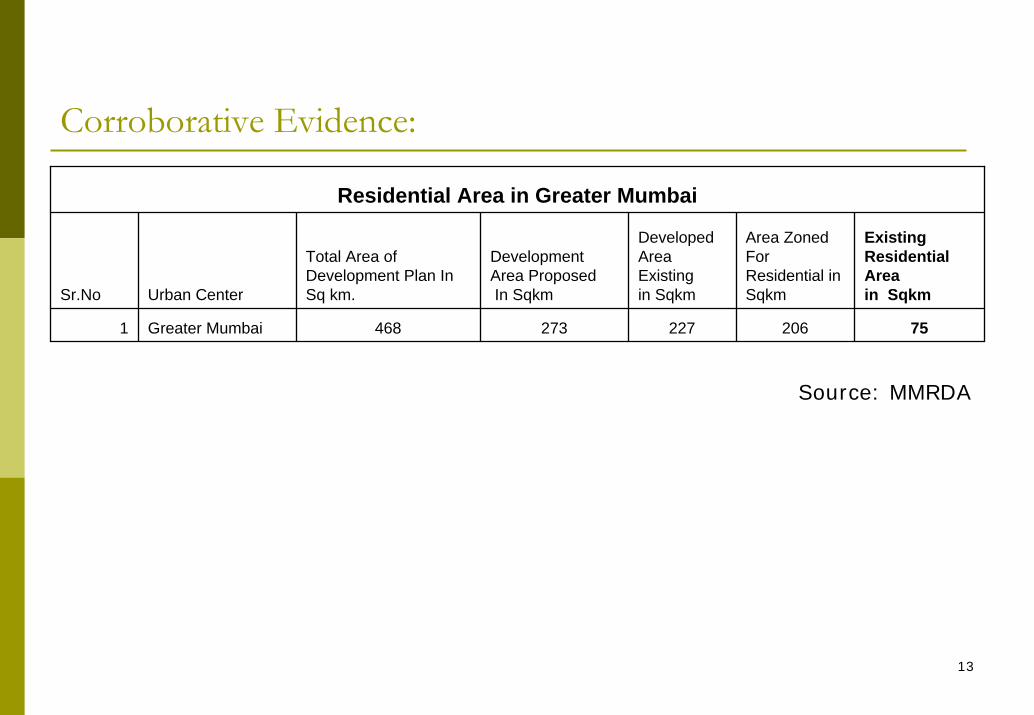
Corroborative Evidence:
Residential Area in Greater Mumbai
Sr.No Urban Center
Total Area of Development Plan In Sq km.
Development Area ProposedIn Sqkm
Developed Area Existing in Sqkm
Area ZonedFor Residential in Sqkm
Existing Residential Area in Sqkm
1 Greater Mumbai 468 273 227 206 75
Source: MMRDA

14
What should be Mumbai FSI – Approach -1
Distribution of Population
Units Sizes % of Population Population 2001 Population 2011 Population 2021
11,914,398 13,407,658 15,213,734
350 Sq FT 30% 3,574,319 4,022,297 4,564,120
600 Sq FT 30% 3,574,319 4,022,297 4,564,120
1,500 Sq FT 30% 3,574,319 4,022,297 4,564,120
2,500 Sq FT 10% 1,191,440 1,340,766 1,521,373
15
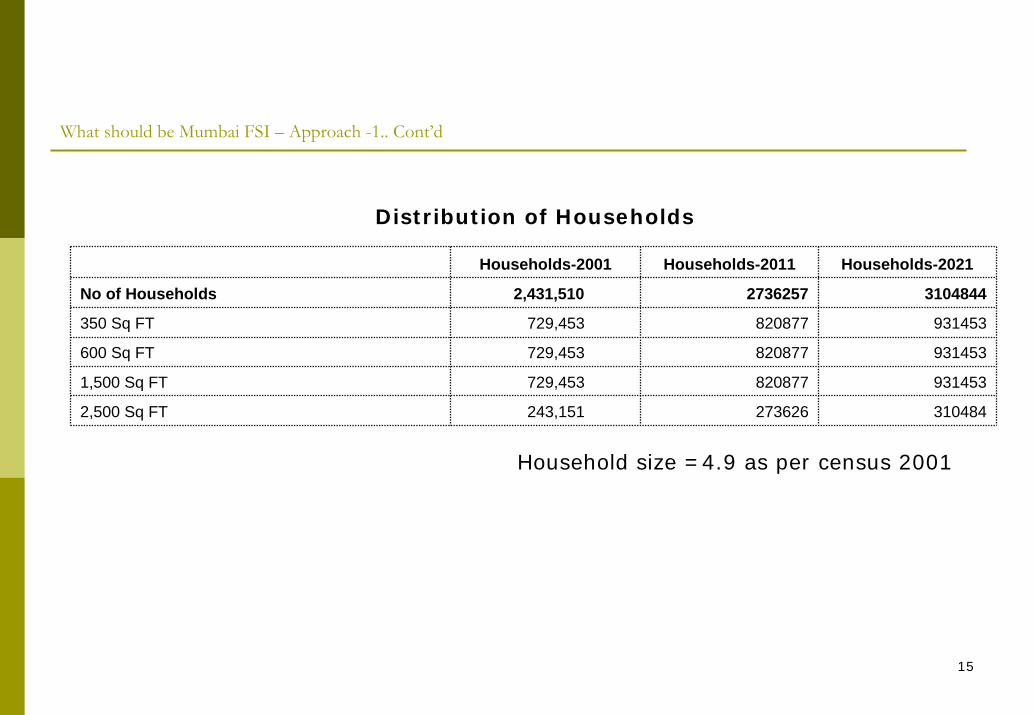
What should be Mumbai FSI – Approach -1.. Cont’d
Distribution of Households
Households-2001 Households-2011 Households-2021
No of Households 2,431,510 2736257 3104844
350 Sq FT 729,453 820877 931453
600 Sq FT 729,453 820877 931453
1,500 Sq FT 729,453 820877 931453
2,500 Sq FT 243,151 273626 310484
Household size =4.9 as per census 2001
16
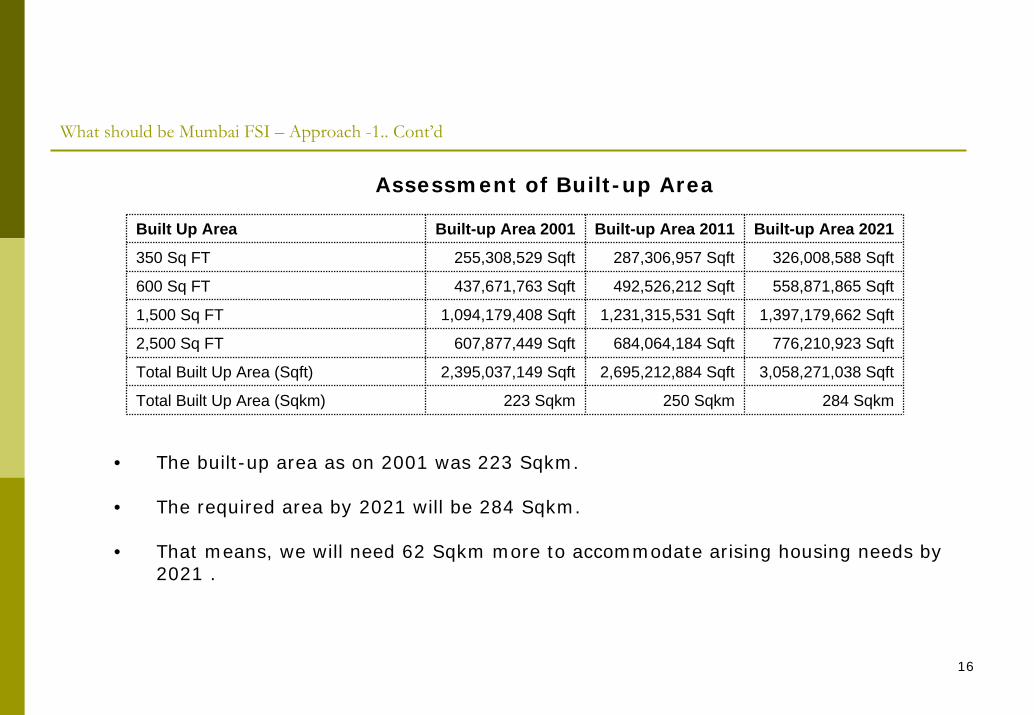
What should be Mumbai FSI – Approach -1.. Cont’d
Assessment of Built-up Area
Built Up Area Built-up Area 2001 Built-up Area 2011 Built-up Area 2021
350 Sq FT 255,308,529 Sqft 287,306,957 Sqft 326,008,588 Sqft
600 Sq FT 437,671,763 Sqft 492,526,212 Sqft 558,871,865 Sqft
1,500 Sq FT 1,094,179,408 Sqft 1,231,315,531 Sqft 1,397,179,662 Sqft
2,500 Sq FT 607,877,449 Sqft 684,064,184 Sqft 776,210,923 Sqft
Total Built Up Area (Sqft) 2,395,037,149 Sqft 2,695,212,884 Sqft 3,058,271,038 Sqft
Total Built Up Area (Sqkm) 223 Sqkm 250 Sqkm 284 Sqkm
• The built-up area as on 2001 was 223 Sqkm.
• The required area by 2021 will be 284 Sqkm.
• That means, we will need 62 Sqkm more to accommodate arising housing needs by 2021 .
17
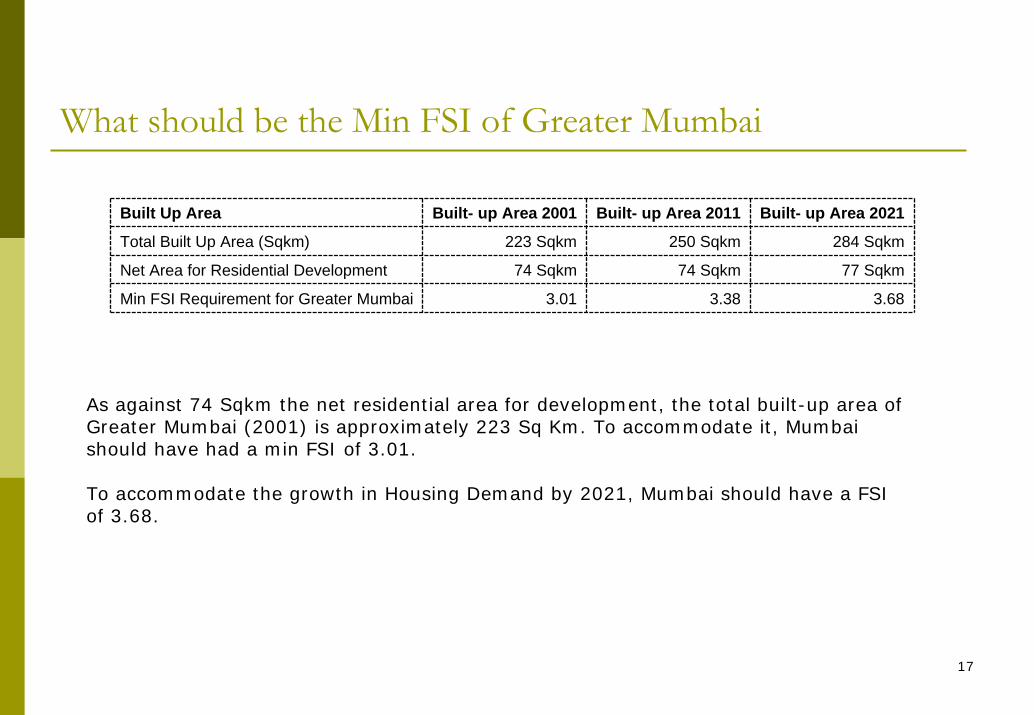
What should be the Min FSI of Greater Mumbai
Built Up Area Built- up Area 2001 Built- up Area 2011 Built- up Area 2021
Total Built Up Area (Sqkm) 223 Sqkm 250 Sqkm 284 Sqkm
Net Area for Residential Development 74 Sqkm 74 Sqkm 77 Sqkm
Min FSI Requirement for Greater Mumbai 3.01 3.38 3.68
As against 74 Sqkm the net residential area for development, the total built-up area of Greater Mumbai (2001) is approximately 223 Sq Km. To accommodate it, Mumbai should have had a min FSI of 3.01.
To accommodate the growth in Housing Demand by 2021, Mumbai should have a FSI of 3.68.
18
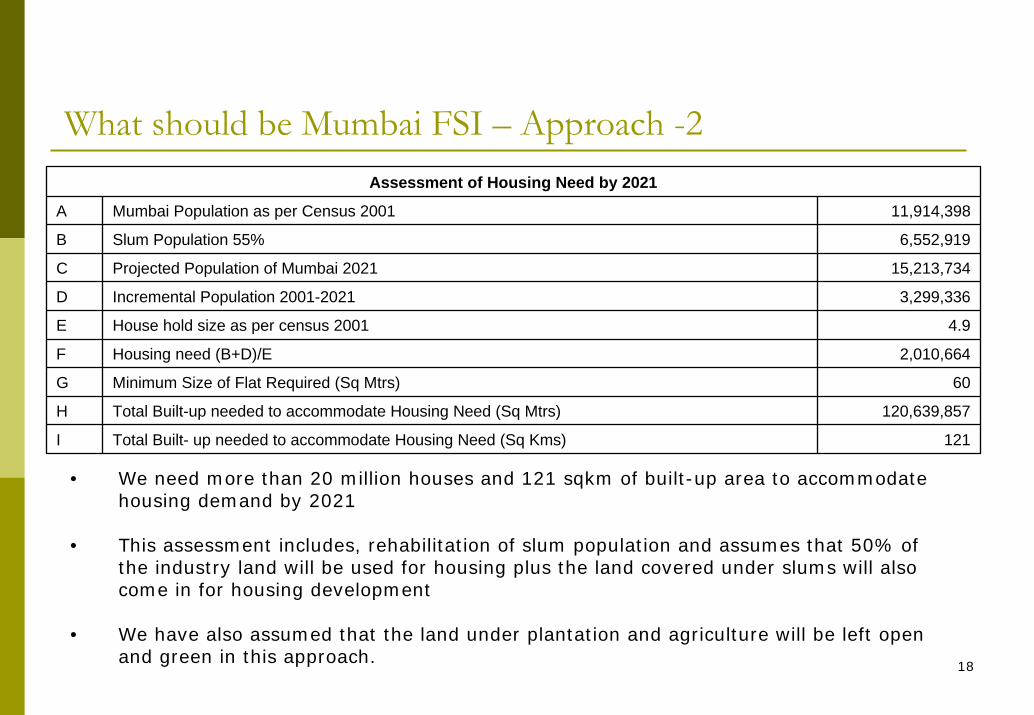
What should be Mumbai FSI – Approach -2Assessment of Housing Need by 2021
A Mumbai Population as per Census 2001 11,914,398
B Slum Population 55% 6,552,919
C Projected Population of Mumbai 2021 15,213,734
D Incremental Population 2001-2021 3,299,336
E House hold size as per census 2001 4.9
F Housing need (B+D)/E 2,010,664
G Minimum Size of Flat Required (Sq Mtrs) 60
H Total Built-up needed to accommodate Housing Need (Sq Mtrs) 120,639,857
I Total Built- up needed to accommodate Housing Need (Sq Kms) 121
• We need more than 20 million houses and 121 sqkm of built-up area to accommodate housing demand by 2021
• This assessment includes, rehabilitation of slum population and assumes that 50% of the industry land will be used for housing plus the land covered under slums will also come in for housing development
• We have also assumed that the land under plantation and agriculture will be left open and green in this approach.
19
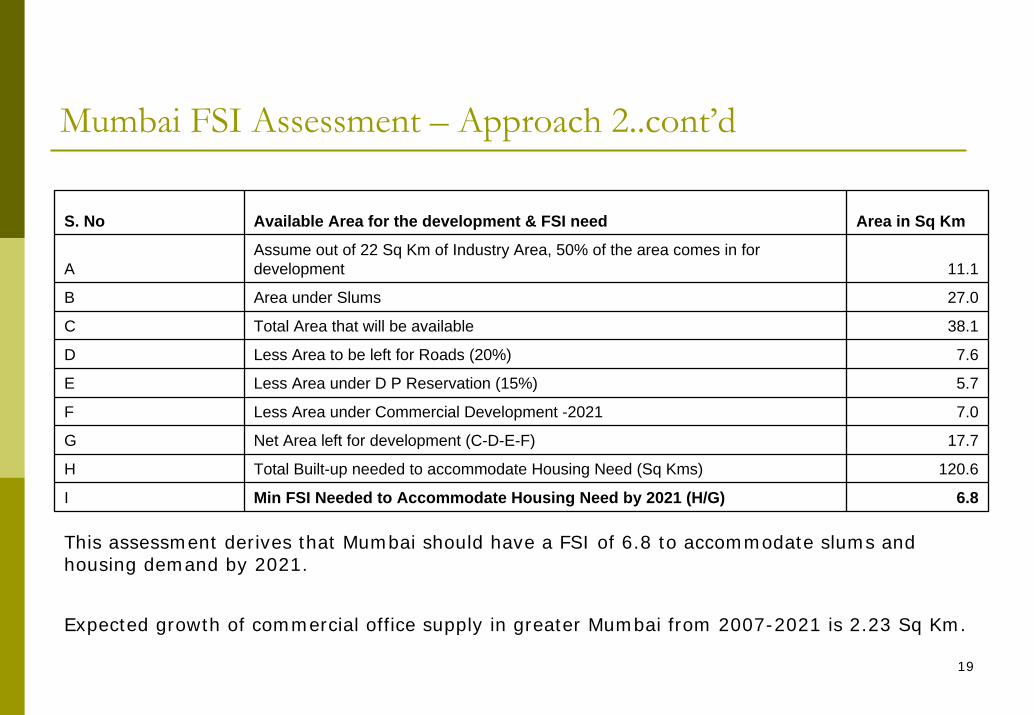
Mumbai FSI Assessment – Approach 2..cont’d
S. No Available Area for the development & FSI need Area in Sq Km
AAssume out of 22 Sq Km of Industry Area, 50% of the area comes in for development 11.1
B Area under Slums 27.0
C Total Area that will be available 38.1
D Less Area to be left for Roads (20%) 7.6
E Less Area under D P Reservation (15%) 5.7
F Less Area under Commercial Development -2021 7.0
G Net Area left for development (C-D-E-F) 17.7
H Total Built-up needed to accommodate Housing Need (Sq Kms) 120.6
I Min FSI Needed to Accommodate Housing Need by 2021 (H/G) 6.8
This assessment derives that Mumbai should have a FSI of 6.8 to accommodate slums and housing demand by 2021.
Expected growth of commercial office supply in greater Mumbai from 2007-2021 is 2.23 Sq Km.

Thank you
20