multipoint angle of attack sensing for avoidance of loss
TRANSCRIPT

1
Multi-point Angle of Attack Sensing for Avoidance of Loss of
Control in Flight
Thomas O. Milward1, Michael A. Bromfield2, Nadjim Horri3, Rashid Ali4, Steve Scott5
Institute for Future Transport and Cities, Coventry University Coventry, CV1 2JH, United Kingdom
Abstract
Recent Federal Aviation Administration (FAA) promotion of Angle of Attack (AOA)
systems for stall prevention to reduce Loss of Control In-flight (LoC-I) accidents in the
General Aviation sector has resulted in a proliferation of affordable AOA systems. Most
systems consist of a multi-hole differential pressure sensor or a rotating vane sensor for
estimation of AOA, some also require additional data from an Air Data Computer. This paper
examines an alternative method for multi-point AOA sensing using COTS MEMS pressure
transducers. The method employed multiple chord-wise sensors to measure local pressure and
this was used to estimate local AOA for improved stall awareness. The results suggest that the
multi-point method is feasible for AOA sensing and can provide local stall warning relative to
a local chord airfoil. Expanding the system to span-wise has the potential to improve total stall
awareness.
1Ph.D. Research Student, Institute of Future Cities and Transport 2Senior Lecturer in Aerospace Engineering- Flight Safety Researcher, Institute for Future Transport and Cities,
AIAA Member 3Senior Lecturer in Aerospace Engineering, AIAA Member 4Senior Lecturer in Aerodynamics, AIAA Member 5Senior Lecturer in Human Factors in Aviation, AIAA Member

2
Nomenclature
αb = Body Angle of Attack (degrees)
AOA = Angle of Attack (degrees)
AR = Aspect Ratio
CLmax = Maximum Lift Coefficient at a Critical AOA
COTS = Commercial Off the Shelf
CP = Pressure Coefficient
FAA = Federal Aviation Admiration
𝑙 = Chord Length (m)
LOC-I = Loss of Control – Inflight
P = Surface Pressure (Pa)
P∞ = Freestream Static Pressure (Pa)
POH = Pilot Operating Handbook
SCK = Serial Clock
SCTBV = Standard Control Test Box Volume
SS = Slave Select
T∞ = Freestream Temperature (K)
TR = Taper Ratio
UAS = Unmanned Aerial System
V∞ = Freestream Dynamic Velocity (m/s)
VLM = Vortex Lattice Method
x/c = Chord-wise position expressed as a fraction of the
p∞ = Freestream Air Density (kg/m3)
𝑣 = Fluid Velocity (m/s)
𝜇 = Dynamic Viscosity (Ns/m2)
𝜌 = Fluid Density (kg/m3)
I. Introduction
Loss of Control – Inflight (LOC-I) is the primary category of fatal aviation accidents for all types of aircraft, with
accidents often resulting in upsets and/or stall/spin events [1]. The use of Angle of Attack systems has long been
identified as a possible method for increasing awareness of proximity to stall and avoiding LOC-I accidents. In the
linear region of the lift curve, AOA is directly proportional to an aircraft lift coefficient (CL) and once CLmax has been
exceeded an aircraft stalls. This CL max can be indicated by a critical AOA. [2]
With respect to Commercial aircraft fitted with AOA sensors (Figure 1), there are normally three AOA vanes and
these are generally located on the nose of the aircraft - pilot, first officer and standby providing redundancy. This can
result in issues in calibration as recorded AOA can be different to the aircraft body AOA [3 - 5]. There have been a
number of fatal accidents attributed to the failure of AOA sensors with little development since the1950s. These
include XL Airways 888T or the more recent preliminary report for the 2018 Lion Air JT 610 accident suggesting
AOA sensor failures [6 - 8].

3
For General Aviation (GA) aircraft, the FAAs is promoting the use of AOA and simplifying the legislation for
retrofitting AOA systems [10 - 12]. This has been partly responsible for the increased popularity of retrofitting
affordable AOA system on to GA aircraft in the USA. However, there has been minimal development of new Angle
of Attack sensing methods [13]. The more recent developments of AOA sensing technology consist of deriving AOA
utilizing inertial sensor technology. However, these systems require a large number of inputs and have complicated
calibration procedures [14].
Whilst AOA sensing within General Aviation has become more popular with a number of manufacturers now
offering AOA systems, the majority of these systems are differential pressure probes for AOA sensing. These systems
are designed for General Aviation they are relatively low cost, with manufacturers offering system in the price range
of approximately $2000, therefore an alternative system would also need to be competitive in terms of cost to be viable
for the General Aviation market.
Developing an alternative system to current existing methods utilizing modern technology has the possibility to
improve AOA sensing, accuracy, reliability and redundancy. This requires evaluating the current AOA theory to
identify the limitations of the current methods.
For current AOA systems, AOA is represented as a single value with reference to an aircraft’s longitudinal axis
(alpha body, αb). This single value is then calibrated during flight tests to indicate different flight conditions including
the margin from a critical AOA [15]. However, on actual aircraft, the exact critical AOA cannot be defined as a single
critical AOA, as different areas of an aircraft wings stall at different local angles of attacks due to varying geometry
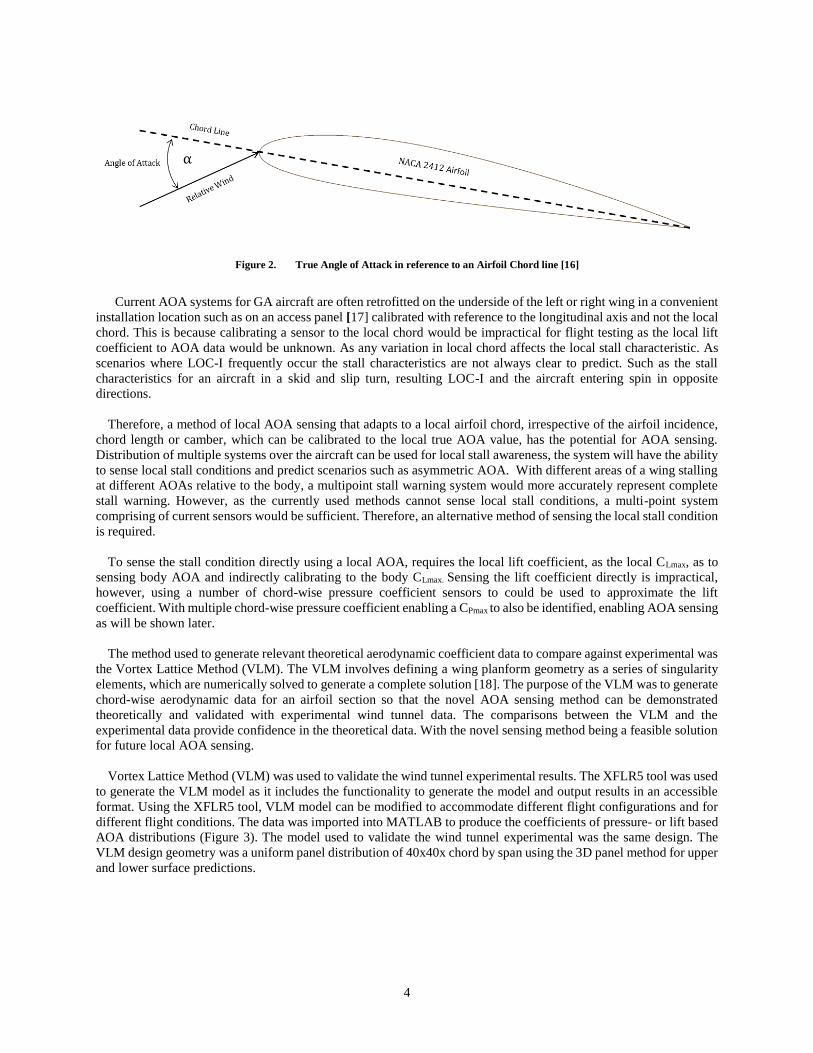
and the aerodynamic effects [16]. True angle of attack is defined in reference to local chord (Figure 2), and not the
longitudinal axis, and a local airfoil will have a different CLmax than the αb in reference to a longitudinal axis.
Figure 1. Boeing B737-800 Max nose mounted Angle of Attack vane [9]
4
Current AOA systems for GA aircraft are often retrofitted on the underside of the left or right wing in a convenient
installation location such as on an access panel [17] calibrated with reference to the longitudinal axis and not the local
chord. This is because calibrating a sensor to the local chord would be impractical for flight testing as the local lift
coefficient to AOA data would be unknown. As any variation in local chord affects the local stall characteristic. As
scenarios where LOC-I frequently occur the stall characteristics are not always clear to predict. Such as the stall
characteristics for an aircraft in a skid and slip turn, resulting LOC-I and the aircraft entering spin in opposite
directions.
Therefore, a method of local AOA sensing that adapts to a local airfoil chord, irrespective of the airfoil incidence,
chord length or camber, which can be calibrated to the local true AOA value, has the potential for AOA sensing.
Distribution of multiple systems over the aircraft can be used for local stall awareness, the system will have the ability
to sense local stall conditions and predict scenarios such as asymmetric AOA. With different areas of a wing stalling
at different AOAs relative to the body, a multipoint stall warning system would more accurately represent complete
stall warning. However, as the currently used methods cannot sense local stall conditions, a multi-point system
comprising of current sensors would be sufficient. Therefore, an alternative method of sensing the local stall condition
is required.
To sense the stall condition directly using a local AOA, requires the local lift coefficient, as the local CLmax, as to
sensing body AOA and indirectly calibrating to the body CLmax. Sensing the lift coefficient directly is impractical,
however, using a number of chord-wise pressure coefficient sensors to could be used to approximate the lift
coefficient. With multiple chord-wise pressure coefficient enabling a CPmax to also be identified, enabling AOA sensing
as will be shown later.
The method used to generate relevant theoretical aerodynamic coefficient data to compare against experimental was
the Vortex Lattice Method (VLM). The VLM involves defining a wing planform geometry as a series of singularity
elements, which are numerically solved to generate a complete solution [18]. The purpose of the VLM was to generate
chord-wise aerodynamic data for an airfoil section so that the novel AOA sensing method can be demonstrated
theoretically and validated with experimental wind tunnel data. The comparisons between the VLM and the
experimental data provide confidence in the theoretical data. With the novel sensing method being a feasible solution
for future local AOA sensing.
Vortex Lattice Method (VLM) was used to validate the wind tunnel experimental results. The XFLR5 tool was used
to generate the VLM model as it includes the functionality to generate the model and output results in an accessible
format. Using the XFLR5 tool, VLM model can be modified to accommodate different flight configurations and for
different flight conditions. The data was imported into MATLAB to produce the coefficients of pressure- or lift based
AOA distributions (Figure 3). The model used to validate the wind tunnel experimental was the same design. The
VLM design geometry was a uniform panel distribution of 40x40x chord by span using the 3D panel method for upper
and lower surface predictions.
Figure 2. True Angle of Attack in reference to an Airfoil Chord line [16]

5
Analyzing the feasibility for AOA sensing is the initial research required for a future stall warning system with
full local awareness. A system sensing pressure coefficient for stall warning will require multiple chord wise sensors
to approximate similar coefficients to the local lift, as chord-wise pressure variations vary with AOA, with peak
pressure moving forward with increased higher AOA [16]. This multi-point pressure sensing would then be combined
to achieve a sufficient local AOA sensing.
II. Wind Tunnel Experiments
In order to validate the method presented, a series of wind tunnel experiments were performed. Traditional pressure
sensors require pressure tubes embedded in the wing or fuselage. These would have been impractical for a feasible
system on a future aircraft therefore low-cost Commercial off the Shelf (COTS), Micro-Electro-Mechanical Systems
(MEMS) ‘surface mounted’ pressure transducers where used.
The wind tunnel used in the experimental was a bespoke wind tunnel designed by Mercedes AMG F1 and is a closed
single return tunnel with an open-jet working section. The working section had a 2.5m length, 1.3m nozzle width 1.0m
nozzle height. The resulting Standard Control Test Box Volume (SCTBV) of 0.3m x 0.4m x 1.0m, with a maximum
air velocity of 45m/s.
1. Model Design
A simple experimental design was chosen as the wind tunnel design limited the possibility for span-wise
experimentation at a scale so that the conditions are comparable with a full-scale aircraft and within sensing
performance of the sensors used. The model was based on a common airfoil, NACA 2412.
Achieving sufficient Reynolds (Re) Numbers was an important aspect of the experimental as it is required to
achieve similar pressure variations and effects to a full-scale aircraft. To achieve a Re Number comparable to a full-
scale aircraft the model scale needed to be large, or the air velocity needed to be high. Therefore, to maximize the Re
the model was made as large as practically possible for the available wind tunnel resources, with the Re number
calculated based on the local chord length using Eq. (1) [19].
𝑅𝑒 = 𝜌𝑣𝑙
𝜇
Eq. (1)
It was decided a 0.8m chord length was an appropriate and safe chord length. The resultant Reynolds number using
the ISA air density of 1.225 kg/m3 and a kinematic viscosity at 1.47905x10⁻⁵ at 15˚C with the wind tunnels maximum
airspeed of 45m/s producing a Re number of 2.53x10⁶.
Figure 3. NACA 2412 Airfoil Pressure Coefficient Distribution at α = 4°, Re 1.7x10⁶ [18]

6
The mounting structure constructed from 10mm mild steel plates supporting the model securely on each side with
a 0.8m span. An evaluation of the flow conditions during pre-testing, no span-wise flow or turbulence at -5° to 20°
was observed. For the experimentation, the sensor locations were on the center chord of the model reducing impact
from any boundary conditions within the SCBTV (Figure 4).
Since the model was hand constructed from rib templates, the excess thickness from the carbon and glass fiber
covering increased the relative size of the model. The resultant measured chord length was a 0.81m chord. The size
of the model and mount also produced in a large blockage ratio which impacted the performance of the wind tunnel.
The maximum air velocity what could be achieved at maximum AOA was 42m/s, therefore all tests were also
conducted at this velocity. The highest Re that could be achieved the final model was 2.391x10⁶.
2. Pressure Coefficient Sensing
The calculations for the novel AOA system rely on sensing the pressure coefficient. The surface pressure was
sensed by BMP280 MEMS sensors installed under the model surface. Additional sensors were required, including the
local static/freestream pressure airspeed and air density to calculate the local pressure coefficient using Eq. (1), the
majority of which remained constant during testing (Table 1) [20]. The initial focus was on the surface pressure sensors
as it these sensors were considered the primary sensor required and since the majority of the other variables are already
present on current aircraft.
𝐶𝑝 = 𝑃 − 𝑃∞
12
∙ 𝜌∞𝑉2∞
Eq. (2)
Variable Sensor Location Comments
𝑃, Surface Pressure, Pa BMP280 Model Upper Surface Primary Sensors
𝑃∞, Freestream Static Pressure, Pa Static Port sensor Wind Tunnel Mounted Gathered During Test
𝑉∞, Freestream Dynamic Velocity, m/s Pilot Tube Wind Tunnel Mounted Gathered During Test
𝑝∞, Freestream Air Density, kg/m3 Wind Tunnel
Output Data
Wind Tunnel Mounted Gathered During Test
Table 1. Pressure Coefficient Variables Source
Pressure coefficient sensing is a common aerodynamic experimental method, therefore there was confidence the
method could be proven feasible for a method of AOA sensing.
Figure 4. Wind Tunnel Model and Mount Pre-Testing

7
3. Sensor Hardware
The experimental sensor hardware comprised of Arduino based controller connected to a series of COTS MEMS
BMP280 pressure sensors, connected via the Serial Peripheral Interconnect (SPI) bus. Limiting the number of sensors
to a maximum number of available Save Select (SS) pins, which was 15 for the Arduino master controller. The
BMP280 manufactured by Bosch uses piezo-resistive pressure sensor technology allowing hermetic sealing of the
cavity in all silicon processes [21]. The BMP280 works in the frequency range from DC to 157Hz. The data was
acquired at a baud rate of 57,600 bits per second, which gave an effective sample rate of 42Hz across all channels.
The BMP280s were factory calibrated, giving each their own calibration parameter which is programmed into the
non-volatile memory read-only memory, in registers 0xA1 and 0x88. The BMP280 sensors have an initial absolute
accuracy of ±100Pa with a precision of 0.16 Pa. For the final system having sensors with ±100Pa variation were not
sufficient and therefore each sensor was calibrated with an offset so that they all give the same pressure value. The
sensors were re-calibrated against known pressures with a Druck DPI 611 Portable Pressure Calibrator, using a gauge
pressure in reference to 1000hPa [22]. There were 12 sensors tested, with the majority of the tests having a variation
less than 22Pa. This demonstrated the calibration of giving each sensor offsets were sufficient to maintain accuracy
over the pressure range for multiple sensors. The maximum full-scale error observed was 0.18% (12.4pa) from
+1000pa to -1000pa gauge pressure.
4. Sensor Location
The wind tunnel testing involved using the BMP280 sensors to sense the upper surface pressure of the model at
different Angles of Attack. There was a total of 12 BMP280 installed on the model center span location (Figure 5).
The chord-wise sensor distributions were not linear for increased sensor density on the leading edge, however, there
was a limitation to mount sensors forward of 0.05 x/c. The spacing of the sensors was a 5% chord spacing from 0.05
x/c to 0.3 x/c, then 10% chord spacing from 0.3 x/c to 0.9 x/c.
Only the upper surface was used as the theory was based on upper surface pressure distribution. This is because
the upper surface has a larger pressure variation, which is maintained chord-wise. Whilst the lower surface only has a
large positive ram pressure variation, towards the leading-edge section.
Figure 5. NACA 2412 Chord-Wise Sensor Locations and Spacing

8
III. Results Analysis
The NACA2412 airfoil model was tested at 7 different AOAs (0°, 5°, 10°, 12.5°, 15°, 17.5°, 20°) at a maximum
Mach of 0.127 (42 m/s) and a resultant Re of 2.39x10⁶ . The 12-upper surface BMP280 pressure transducers sensed
the only local upper surface pressure between 0.05 x/c and 0.9 x/c to assess the feasibility for a practical AOA system.
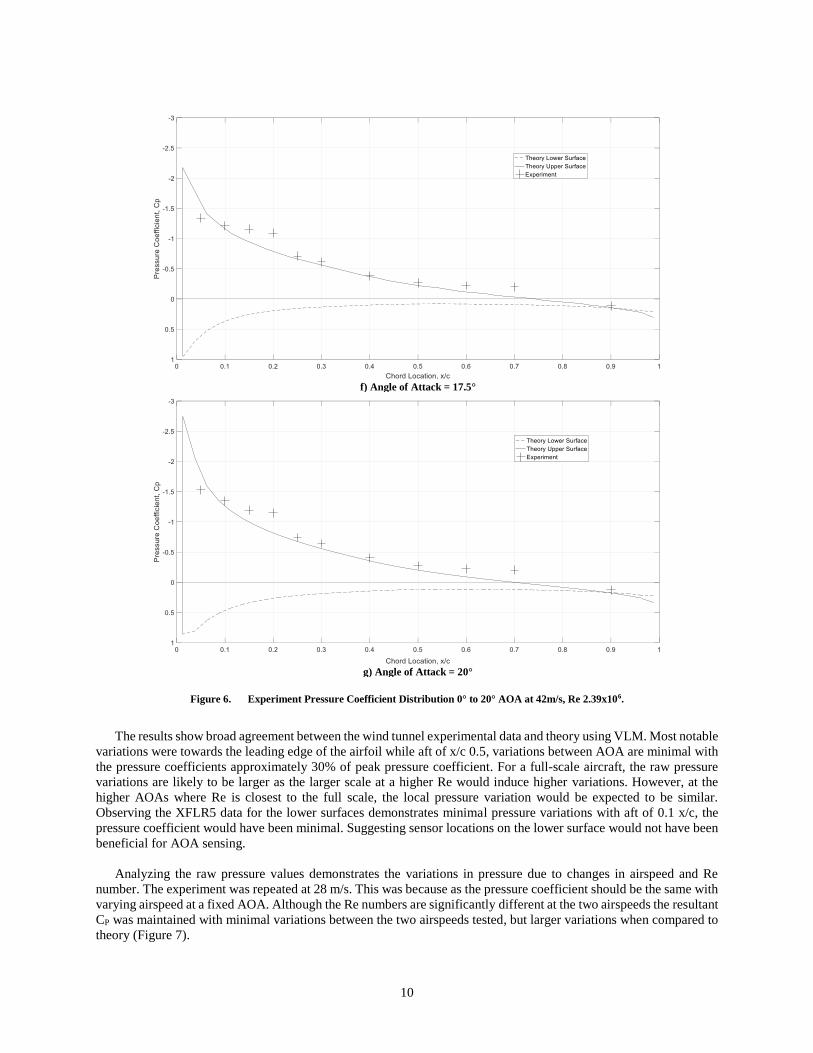
Experimental data was compared with the theory for the NACA 2412 using VLM (Figure 6).
Experiment Conditions Angle of Attack, 0° to 20°
Airfoil, NACA 2412
Aspect Ratio, 0.9788 Airspeed, 42m/s
Reynolds Number, 2.39x10⁶
a) Angle of Attack = 0°
b) Angle of Attack = 5°

9
c) Angle of Attack = 10°
d) Angle of Attack = 12.5°
e) Angle of Attack = 15°
10
The results show broad agreement between the wind tunnel experimental data and theory using VLM. Most notable
variations were towards the leading edge of the airfoil while aft of x/c 0.5, variations between AOA are minimal with
the pressure coefficients approximately 30% of peak pressure coefficient. For a full-scale aircraft, the raw pressure
variations are likely to be larger as the larger scale at a higher Re would induce higher variations. However, at the
higher AOAs where Re is closest to the full scale, the local pressure variation would be expected to be similar.
Observing the XFLR5 data for the lower surfaces demonstrates minimal pressure variations with aft of 0.1 x/c, the
pressure coefficient would have been minimal. Suggesting sensor locations on the lower surface would not have been
beneficial for AOA sensing.
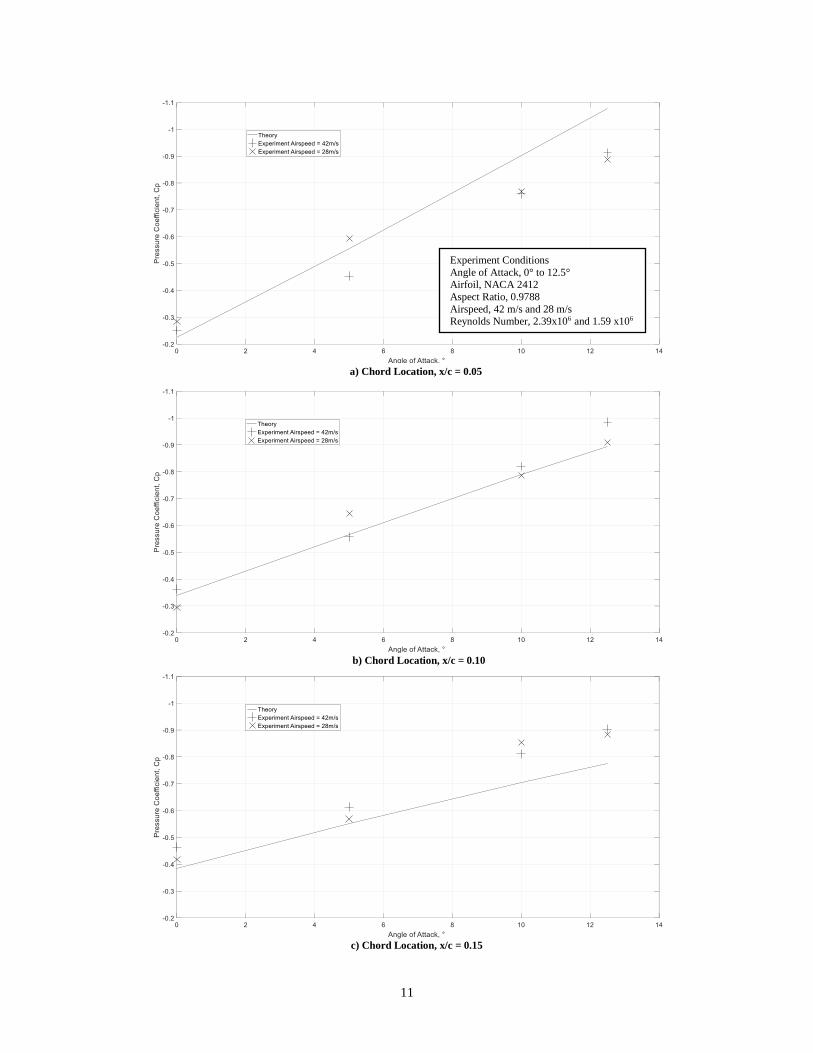
Analyzing the raw pressure values demonstrates the variations in pressure due to changes in airspeed and Re
number. The experiment was repeated at 28 m/s. This was because as the pressure coefficient should be the same with
varying airspeed at a fixed AOA. Although the Re numbers are significantly different at the two airspeeds the resultant
CP was maintained with minimal variations between the two airspeeds tested, but larger variations when compared to
theory (Figure 7).
Figure 6. Experiment Pressure Coefficient Distribution 0° to 20° AOA at 42m/s, Re 2.39x10⁶.
f) Angle of Attack = 17.5°
g) Angle of Attack = 20°
11
Experiment Conditions
Angle of Attack, 0° to 12.5° Airfoil, NACA 2412
Aspect Ratio, 0.9788
Airspeed, 42 m/s and 28 m/s Reynolds Number, 2.39x10⁶ and 1.59 x10⁶
a) Chord Location, x/c = 0.05
b) Chord Location, x/c = 0.10
c) Chord Location, x/c = 0.15

12
Figure 7. Pressure Coefficient vs AOA for Chord Location Comparison
d) Chord Location, x/c = 0.20
e) Chord Location, x/c = 0.25
f) Chord Location, x/c = 0.30

13
There where slight differences between the theoretical model and the experimental model. But the accuracy of
experimental test data was consistent between the repeated tests suggesting variations are due to experimental
imperfections or theoretical assumptions especially as the VLM is a linear model and at higher AOAs prevalence of
flow detachment and the turbulent boundary layer is likely of to affect the accuracy.
The variations at the two airspeeds demonstrate the pressure variations reduce significantly with Re. A smaller
scale model would have also produced a much lower pressure variation. The difference in raw pressure impacts the
relative accuracy of the method, as the performance of the sensor is finite. However, the resultant pressure coefficients
remained consistent between tests, as which can be clearly observed at the higher-pressure region for x/c 0.05 to 0.3
where variations are most significant. For a full-scale aircraft, the raw pressure variations would vary as airspeed also
tends to vary with AOA. With aircraft flying at lower AOAs airspeed will be higher, increasing the local raw pressure
variations to maintain pressure coefficient. Due to the maximum airspeed limit in the wind tunnel, this could not be
demonstrated, therefore the lower airspeed tested demonstrated the effect, but it does not represent the performance
of full-scale aircraft.
The raw pressure range was from 1300Pa+ at 20° AOA, using BMP280 on 5% chord. The larger Pa on the leading-
edge range allows the possibility of increased AOA sensing accuracy relative to the accuracy of the sensor. With the
sensor accuracy of ±11pa, the equivalent CP variation is 0.0205. However, the multi-point system needs to use a
combine the chord-wise data to get the accurate representation of the lift coefficient. This can be done by integrating
the experimental upper surface pressure coefficient data. When comparing with the same integrated pressure
coefficient theory data for different comparisons between the theory and experimental are shown. Also, integrating
the whole theory pressure coefficient distribution highlights the higher variations from not sensing less than 0.05 x/c
and from not sensing the lower surface. This can also be compared with the theory data lift coefficient (Table 2).
Angle of
Attack, °
Experimental
Integration
XFLR5 Upper
Surface
Integration (0.05
to 0.9 x/c)
XFLR5 Upper
Surface Only
Integration
XFLR5
Complete
Integration
XFLR5 Lift
Coefficient
0° -0.1924 -0.2080 -0.2000 -0.0848 0.0829
5° -0.2198 -0.2525 -0.2636 -0.2237 0.2393
10° -0.3000 -0.2837 -0.3160 -0.3579 0.3898
12.5° -0.3277 0.2939 -0.3374 -0.4219 0.4613
Table 2 Multi-Point System Theory and Experimental Integration Comparison
Comparing the integration of the experimental and theory for the same chord area (0.05 to 0.9 x/c) show
consistency at the lower AOAs within the linear region. The variations are minimal when comparing the same data
set from 0.05 to 0.9 x/c and are larger when the whole upper surface theory distribution data is integrated. Comparing
with total upper and lower surface data and the lift coefficient demonstrate larger variations as expected. However,
the variation is not linear with less variation at the lower AOAs than higher AOAs.
14
IV. Discussion of Results
The initial theory and experiments were based on General Aviation aircraft as LOC-I accidents are common and
the Reynolds Number range in which GA aircraft operate, is reproducible in wind tunnel. For a similar system to be
feasible in transonic flight conditions high-speed wind tunnel, and additional research and development would be
required, due to the compressibility effects and flow conditions. Not only is the incorporation of AOA sensors
important in GA but Integrating a multi-point AOA system into Civil Aviation is also important, as current AOA
system failures on Civil Aviation aircraft have been directly responsible for fatal accidents in the past [7, 8].
Aerodynamic theory influenced the sensing method and experimental design, as from known theory the expected
chord-wise pressure variations are large. The upper surfaced produces a low-pressure coefficient which gradually
reduced chord-wise while, the lower surface only has a large positive pressure near the leading edge. This limited the
practicality of being able to feasibly sense the pressure coefficient at any chord-wise location. As variations would not
be sufficient for sufficient system accuracy. Therefore, only the upper surface was considered as a practical location
for surface pressure sensors due to the larger pressure variations which are also partially maintained chord-wise. While
the lower surface apart from the leading 10% chord would be minimal, as shown in the XFLR5 VLM model. This
influenced the sensor technology used, as low pressure was expected on the upper surface. Therefore, low-cost
barometric type sensors commonly used for altitude sensing were used.
The results from the wind tunnel demonstrated that the upper surface pressure of an airfoil can be sensed with
sufficient accuracy, with the low-cost COTS BMP280 sensors. The performance of the BMP280 demonstrated the
±12pa sensor variations equated to approximately 0.0208 pressure coefficient, approximatily1.4% at x/c, 0.05 for α,
20°. The experiments were performed at a constant airspeed while on a full-scale aircraft airspeed will be higher at
lower AOAs and lower at higher AOAs. The higher AOAs in the experiments are most comparable with full-scale
aircraft as Re would be similar, while at lower AOAs a full-scale aircraft would have higher airspeed. This would still
result in the same pressure coefficient, but to do so the local raw pressure would also be lower (larger variation) than
shown in the experimental. Therefore, the experimental accuracy at the lower AOAs would not be equivalent to full-
scale aircraft as the flight conditions would not be the same. Therefore, future experiments are required to investigate
the true performance of the AOA system on a full-scale aircraft, where the AOA sensing accuracy can be evaluated
for all flight conditions.
Calculating the pressure coefficient required minimal additional variables, resulting in the method being a practical
solution for AOA sensing. The sensors themselves being 1mm in height mean their interference with the surface
aerodynamics would be minimal if mounted directly onto an aircraft surface. This would be required for a system that
would be retrofitted onto existing aircraft. As pressure tapping holes which are used in pressure coefficient sensing
experimental research would be too intrusive and impractical to implement. However, current technology is available
which could allow for surface mounted sensors with a minimal profile as to not impact airflow. However, future
research would still be required to evaluate the full impact of the surface mounted sensors airflow.
The results in the experimental compared to theoretical data for the same airfoil were accurate to within 0.03 CP up
to 12.5°, beyond which reliability on the theory being accurate reduces as AOA reaches un-linear region. The
experimental results also provided the initial foundation for future research on sensor location and distribution. With
the Pressure Coefficient and raw surface pressure variations reducing aft chord-wise, the relative accuracy of also
reduces. This is a factor that would be considered in future sensor location optimization research. The results suggest
there is minimal variation in pressure aft of 0.5 x/c with less than 30% of the maximum coefficient remaining aft of
0.5 x/c. Therefore, there would be minimal benefit in additional sensors located aft of 0.5 x/c as the AOA sensing
accuracy would reduce. However, an ideal system would consist of large numbers of sensors around the whole of a
chords circumference to most accurately represent the lift coefficient. However, the reduction in accuracy would result
in there’s a point at which the reduction in local accuracy from minimal pressure variations won’t be beneficial to
increase the AOA sensing accuracy of the whole system.
The full stall was not observed in experimental or theoretical data because the VLM is a linear approach and cannot
accurately model the un-liner flight conditions. Also, the model aspect ratio was 0.9877 and low aspect ratio models
result in a delayed and lower peak coefficient values [16]. Potential sources of inaccuracies could have been a result
of imperfections in the model or inaccuracies within the VLM theory model. However, the sensors and setup still

15
produced a pressure distribution which varied with AOA, demonstrating the feasibility of sensing the pressure
coefficient required for an AOA system.
The experimental results showed that increasing the number of sensors would increase the accuracy of the CP
estimation. As peak coefficients before 0.05 x/c had significant effects on the total integrated coefficients when
compared to the XFLR5. This would require installing more sensors ahead of the 0.05 x/c location. This would
involve using pressure taps connected to feed tubes connected to the sensors.
Comparing to the XFLR5s lift coefficient the total integration was most similar. However, the relationship between
the lift and pressure coefficient has less variation at lower AOAs. This could be a result of the VLM theory data only
being linear resulting in the higher coefficients seen in the theoretical data when compared to actual coefficients
however these will have a negligible effect on overall stall warning. Increasing the number of sensor locations would
improve accuracy when compared to the lift coefficient but the benefits are questionable and maybe impractical.
V. Conclusions
A novel multi-point method for Angle of Attack sensing with initial feasibility experimental has been demonstrated,
with a multi-point chord-wise AOA system that can provide increased local AOA sensing AOA relative to local chord
conditions as compared to current AOA systems relative to an aircraft’s longitudinal axis. Sensing the local
coefficients directly is required for local stall warning using AOA as an alternative system calibrated to sense
geometric AOA would still not be able to adapt to varying airfoil, camber or chord length.
The pressure coefficient sensing itself is not a new concept as it is a common technique used in aerodynamic
experimentation however, it is not being currently used for any existing commercial flight systems. Adapting pressure
coefficient sensing for AOA sensing is novel and the wind tunnel experimental results demonstrate its feasibility
utilizing low-cost COTS MEMS pressure sensors.
The theory and experimental evidence shows that using only upper surface sensing, reasonable estimates of local
chord AOA are possible. Extension of this method to a multi-point system has the potential for improved redundancy
and aid in LOC-I avoidance. The method described in this paper and the extension of this to multi-point, span-wise
locations is the subject of a patent application, currently in progress.
References
[1] Belcastro, C. M., Foster, J. V., Gautam, S. H., Gregory, I. M., Cox, D. E., Crider, D. A., Groff, L., Newman, R. L., and
Klyde, D. H., "Aircraft Loss of Control Problem Analysis and Research Toward a Holistic Solution," Journal of Guidance,
Control, and Dynamics, Vol. 40, No. 4, July 2017, pp. 149-162. Doi. 10.2514/1.G002815.
[2] Barnard, R. H., and Philpott, D. R., Aircraft Flight, A description of the physical principles of aircraft flight. 4th ed, Pearson
Education, London, 2010, Chap. 2. ISBN, 0273730983.
[3] Bennett, C. J., Lawson, N. J., Gautrey, J. E., and Cooke, A,. “CFD simulation of flow around angle of attack and sideslip
angle names on a Bae Jetstream 3102 – Part 1,” Aerospace Science and Technology, Vol. 68 Sep. 2017, pp. 561-576.
[4] Bennett, C. J., Lawson, N. J., Gautrey, J. E., and Cooke, A,. “CFD simulation of flow around angle of attack and sideslip
angle names on a Bae Jetstream 3102 – Part 2,” Aerospace Science and Technology, Vol. 68 Sep. 2017, pp. 577-587.
[5] Luo, A. and Katz, J., 'Study of the Flowfield Near the Angle-of-Attack Sensor of an A320 Aircraft'. Journal of Aircraft, Vol.
54, No. 1, 2017, pp. 36-39.
[6] “Accident on 27 November 2008 off the Coast of CanetPlage (66) to the Airbus A320-232 registered D-AXLA operated by
AL Airways Germany,”BEA, Paris, 2010. ISBN: 978-2-11-099128-7
[7] “Preliminary Aircraft Accident Investigation Report,” Komite Nasional Keselamatan Transportasi, Indonesia, Oct. 2018.

16
[8] William, G., "Summary of Methods of Measuring Angle of Attack on Aircraft," NASA TN 4351, Washington, Aug. 1958.
[9] Gates, D., and Siegel, M., “Boeing unveils the first 737 MAX — and its new production line”. Seattle Times, Seattle, 2015
[10] "Installation, Training, and Use of Non-required/Supplemental Angle-of-Attack (AOA) Based Systems for General
Aviation (GA) Airplanes," U.S. Department of Transportation, FAA InFO 14010, Washington, Feb. 2014.
[11] Bromfield, M, A., "Re-defining Loss of Control In Flight”, EASA European Operators Flight Data Monitoring Conference,
Cologne, Germany. Jun. 2017.
[12] Bromfield, M., A., and Dillman, B., "The Effects of Using an Angle of Attack System on Pilot Performance and Workload
during Selected Phases of Flight," International Conference on Applied Human Factors and Ergonomics, Vol. 3, Elsevier
B.V, Las Vegas, 2015, pp. 3222-3229. Doi. 10.1016/j.promfg.2015.07.873
[13] Zalovcik, J. A., "Summary of stall-warning devices", NACA TN 2676, Washington, May. 1952.
[14] E. Bruce Jackson and Keith D. Hoffler , “Flight Test Results Of Direct-Measure and Derived Angle-Of-Attack Systems For
General Aviation Airplanes”, DOT/FAA/TC-16/52, U.S. Department of Transportation Federal Aviation Administration,
Nov. 2017
[15] Martos, B., and Rogers, D. F., "Low-Cost Accurate Angle-of-Attack System," Journal of Aircraft, Vol. 55, No. 2, 2018, pp.
660-665. Doi. 10.2514/1.C034417.
[16] Sadraey, M. H., Aircraft Design A Systems Engineering Approach, 1st ed., John Wiley & Sons, New Jersey, 2012, Chap. 5.
[17] “Eagle Installation Manual,” Alpha Systems AOA, May. 2015. Chap. 2. pp. 2- 4.
[18] Reynolds. O., “An Experimental Investigation of the Circumstances Which Determine Whether the Motion of Water Shall
Be Direct or Sinuous, and of the Law of Resistance in Parallel Channels,” Royal Society of London, Vol. 174. 1889, pp. 935-
982.
[19] XFLR5, Airfoils Analysis Tool, Software Package, Ver. 6.42, May 2018,
[20] Reis, C. Filho, F. Basso, E. and Caldas, V., "Pressure coefficient evaluation on the surface of the SONDA III model tested in
the TTP Pilot Transonic Wind Tunnel," Journal of Physics, Vol. 588. Sep. 2015. Doi. 10.1088/17426596/588/1/012003.
[21] “ BMP280 Digital Pressure Sensor Data Sheet,” Bosch Sensortech, BST-BMP280-DS001-11, Germany, May. 2015.
[22] “Druck DPI611 Portable Pressure Calibrator User Manual - K0571,” General Electric, Aug. 2014.