multiple antenna terminals in realistic environments a
TRANSCRIPT

LUND UNIVERSITY
PO Box 117221 00 Lund+46 46-222 00 00
Multiple Antenna Terminals in Realistic Environments - A Composite ChannelModeling Approach
Harrysson, Fredrik
2012
Link to publication
Citation for published version (APA):Harrysson, F. (2012). Multiple Antenna Terminals in Realistic Environments - A Composite Channel ModelingApproach. Lund University.
Total number of authors:1
General rightsUnless other specific re-use rights are stated the following general rights apply:Copyright and moral rights for the publications made accessible in the public portal are retained by the authorsand/or other copyright owners and it is a condition of accessing publications that users recognise and abide by thelegal requirements associated with these rights. • Users may download and print one copy of any publication from the public portal for the purpose of private studyor research. • You may not further distribute the material or use it for any profit-making activity or commercial gain • You may freely distribute the URL identifying the publication in the public portal
Read more about Creative commons licenses: https://creativecommons.org/licenses/Take down policyIf you believe that this document breaches copyright please contact us providing details, and we will removeaccess to the work immediately and investigate your claim.

Multiple Antenna Terminals in
Realistic Environments
A Composite Channel Modeling Approach
Doctoral Thesis
Fredrik Harrysson
Lund UniversityLund, Sweden
2012

Department of Electrical and Information TechnologyLund UniversityBox 118, SE-221 00 LUNDSWEDEN
This thesis is set in Computer Modern 10ptwith the LATEX Documentation System
Series of licentiate and doctoral thesesISSN 1654-790X; No. 41ISBN 978-91-7473-322-8
c© Fredrik Harrysson 2012Printed in Sweden by Tryckeriet i E-huset, Lund University, Lund.May 2012.

to my family and parents

Abstract
For evaluation of specific antenna arrangements in wireless communication sys-tems we need physical channel models that take into account also the directionaldomain of the propagation channel. In this thesis we investigate, validate andpropose a practical approach to wireless channel modeling and, particularly,to mobile communication systems. For this we make the assumption that thechannel can be divided into separate parts, or regions that can be treated andmodeled separately. The basic idea is that the antenna parts of the channelis the parts considered in the design of base station antennas and user equip-ments and can be characterized by a single measurement of each design, whilethe propagation part of the channel can be characterized separately, indepen-dent of the specific installed base station antenna or the user equipment, butbased on generic channel sounder measurements with, as far as possible, openareas around the transmitter and the receiver antennas. For more complexantenna environments we may imagine intermediate scattering regions of thechannel model between the antenna parts and the propagation part, that canor cannot be handled separately, e.g., the body of a mobile phone user, an officedesk, a vehicle, surroundings of base station antennas in dense deployments,etc.
A first step in evaluating such a composite channel modeling approach isto verify the validity of communication link simulations were the mobile phoneantennas together with the user can be treated as a super-antenna with itsaggregate far-field pattern to be combined with a directional channel model ina classical way. This is first presented in Paper II, and the method is in itsextensible form here referred to as a composite channel method. It is found thatthis method, as we expected, work well for statistical performance evaluationof diversity and spatial multiplexing.
An extension of the composite approach is outlined with an attempt tofind a simple yet accurate directional scattering model for, firstly, the userbody, and, secondly, a car environment with the user inside. A simple modelthat still catch the proper influence of antenna efficiency, fading statistics, and
v

vi Abstract
correlation at the mobile side.In Paper I a first investigation of user influence on an indoor 2×2 multiple-
input multiple-output (MIMO) link is performed based on a narrowband mea-surement setup and the diversity performance is evaluated. In Paper II, the firststep of the composite channel approach is evaluated with respect to MIMO bychannel measurements including user influence in two static outdoor-to-indoorand indoor-to-indoor scenarios. The approach is verified for statistical prop-erties such as antenna correlation and MIMO eigenvalue distributions. It isfound, with extended detail given in Paper III that the presence of the user,apart from introducing hand and body absorption and mismatch that increasesthe path loss, also increases the correlation between the antenna branch signalsand, thus, slightly decreases potential MIMO capacity. In Paper IV and Pa-per V the investigation is extended to the scenario were the user is located insidea family car (station wagon). In Paper IV a first analysis of an outdoor MIMOmeasurements campaign with the user outside and inside the car is presented.The results show an increased scattering inside the car that improves mainlythe potential diversity gain, and to some extent also the potential MIMO ca-pacity gain, to the cost of higher path loss (lower SNR) due to car penetrationloss. An important observation is the dependency of this penetration loss onthe directional properties of the outer propagation channel, which indicates apossible need for scenario dependent penetration loss in general channel mod-eling. In Paper V this is further verified with directional estimation of thepropagation channel both outside and inside the car. We also find that thecomposite channel method with the inherit assumption of plane-waves imping-ing on the mobile terminal, actually does produce good results even in thisclose near-field environment inside the car with the nearby scatterers withinthe far-field (Rayleigh) distance of the probe antenna array.

Preface
After a Master of Science degree in electrical engineering, with a tint of semi-conductor and microwave technology, and ten years of industrial research workthat took me from airborne radar antennas to mobile communication radiopropagation modeling and antennas, I got the fantastic opportunity to do anindustrial doctoral thesis work. An opportunity that gave me the chance torecapture and deepen my knowledge in the fields of probability theory and ran-dom processes, signal processing, communication and information theory, andmuch more, during my graduate studies.
The practical research work was set up to fit my present research with focuson channel modeling at the mobile or user side of cellular mobile systems. Atthis time, the promising potential of multiple antennas for diversity and spatialmultiplexing, or MIMO, was theoretically well established and had been shownpossible also in practice by various channel measurement campaigns. Resultsthat lead to the development of MIMO channel models, e.g., the COST 259directional channel model (DCM). However, there still remained some doubts orquestions about how reliable these performance results were, and what shouldone expect if truly realistic environments were considered, like the hands andbody of users, indoors with nearby furniture, or inside vehicles? Do we still getthe high spatial multiplexing gain using MIMO that we have seen in simulationsand more idealized channel measurement scenarios, how is the communicationchannel affected, better or worse? And, if this is important, how do we analyzeit, and is it possible to model such specific environments in a simple mannerthat can be combined with existing directional channel models? At the timewhen this work started these questions were still mainly unanswered, and thus,with a little help from colleagues and supervisors, I set off a journey with thegoal to find tools and answers to at least some of these questions.
The results and findings of this research journey are presented in this doc-torate thesis that is comprised of two parts. The first part gives a brief intro-duction to the field of research, our research approach, and a summary of ourscientific contributions. The second part contains three published conference
vii

viii Preface
papers and two journal papers (one not yet published at the writing of thisthesis). The papers included in the thesis are:
[1] F. Harrysson, H. Asplund, M. Riback, and A. Derneryd, “Dual antennaterminals in an indoor scenario,” in IEEE Veh. Technol. Conf. VTC 2006-Spring, vol. 6, pp. 2737–2741, Melbourne, Australia, May 2006.
[2] F. Harrysson, J. Medbo, A. F. Molisch, A. J. Johansson, and F. Tufvesson,“Efficient experimental evaluation of a MIMO handset with user influence,”in IEEE Trans. Wireless Commun., vol. 9, no. 2, pp. 853–863, Feb. 2010.
[3] F. Harrysson, A. Derneryd, and F. Tufvesson, “Evaluation of user handand body impact on multiple antenna handset performance,” in IEEE Int.Symp. on Antennas and Propagation AP-S 2010, Toronto, Canada, July2010.
[4] F. Harrysson, T. Hult, and F. Tufvesson, “Evaluation of an outdoor-to-in-car radio channel with a four-antenna handset and a user phantom,” inIEEE Veh. Technol. Conf. VTC 2011-Fall, San Francisco, CA, Sept. 2011.
[5] F. Harrysson, J. Medbo, T. Hult, and F. Tufvesson, “Experimental investi-gation of the directional outdoor-to-in-car propagation channel,” (Submit-ted to IEEE Trans. Veh. Technol., April 2012).
Before and during my graduate studies, I have also contributed to the followingpublications, though they are not included in the thesis:
[7] F. Harrysson, “Analysis of a large array antenna with circular waveguideelements,” in IEEE Int. Symp. on Antennas and Propagation AP-S 1998,vol. 2, pp. 1016-1019, Atlanta, GA, June 1998.
[8] F. Harrysson and J.-E. Berg, “Propagation prediction at 2.5 GHz close toa roof mounted antenna in an urban environment,” in Proc. IEEE Veh.Technol. Conf. VTC 2001-Fall, vol. 3, pp. 1261–1263, Atlantic City, NJ,Oct. 2001.
[9] F. Harrysson, “A simple directional path loss model for a terminal insidea car,” in Proc. IEEE Veh. Technol. Conf. VTC 2003-Fall, vol. 1, pp. 119–122, Boston, MA, Oct. 2003.
[10] J. Medbo, F. Harrysson, H. Asplund, and J.-E. Berg, “Measurements andanalysis of a MIMO macrocell outdoor-indoor scenario at 1947 MHz,” inProc. IEEE Veh. Technol. Conf. VTC 2004-Spring, vol. 1, pp. 261–265,Milan, Italy, May 2004.

ix
[11] J. Medbo, J.-E. Berg, and F. Harrysson, “Temporal radio channel varia-tions with stationary terminal,” in Proc. IEEE Veh. Technol. Conf. VTC2004-Fall, vol. 1, pp. 91–95 Vol. 1, Los Angeles, CA, Sept. 2004.
[12] M. Riback, J. Medbo, J.-E. Berg, F. Harrysson, and H. Asplund, “Carrierfrequency effects on path loss,” in Proc. IEEE Veh. Technol. Conf. VTC2006-Spring, vol. 6, pp. 2717–2721, Melbourne, Australia, May 2006.
[13] F. Harrysson, L. Manholm, H. Asplund, M. Riback, and A. Derneryd,“Performance of two test terminals with dual antennas in an office en-vironment,” in Antenn 06-The Nordic Antenna Symposium, Linkoping,Sweden, May 30 – June 1 2006.
[14] F. Harrysson, J. Medbo, and A. F. Molisch, “Performance of a MIMOterminal including a user phantom in a stationary micro-cell scenario withcomparison between a ray-based method and direct measurements,” TD(07) 379, COST 2100, Duisburg, Germany, Sept. 2007.
[15] H. Asplund, J.-E. Berg, F. Harrysson, J. Medbo, and M. Riback, “Prop-agation characteristics of polarized radio waves in cellular communica-tions,” in Proc. IEEE Veh. Technol. Conf. VTC 2007-Fall, pp. 839–843,Baltimore, MD, Sept. 2007.
[16] F. Harrysson, J. Medbo, A. F. Molisch, A. J. Johansson, and F. Tufves-son, “The composite channel method: Efficient experimental evaluationof a realistic MIMO terminal in the presence of a human body,” in Veh.Technol. Conf. VTC 2008-Spring, pp. 473–477, Singapore, May 2008.
[17] F. Harrysson, J. Medbo, and A. F. Molisch, “Indoor performance of aMIMO handset including user influence by comparing a composite chan-nel method with direct measurements,” TD (08) 661, COST 2100, Lille,France, Oct. 2008.
[18] F. Harrysson, A. Derneryd, and F. Tufvesson, “Evaluation of user handand body impact on multiple antenna handset performance,” TD (10)12035, COST 2100, Bologna, Italy, Nov. 2010.
[19] J. Medbo, and F. Harrysson, “Efficiency and accuracy enhanced superresolved channel estimation,” Proceedings of the 6th European Conferenceon Antennas and Propagation (EuCAP), Prague, Czech Republic, March2012.


Acknowledgments
I would like to express my deepest gratitude to a number of people of greatimportance for this work.
First of all my main advisor Dr. Fredrik Tufvesson and my former mainadvisor Prof. Andreas F. Molisch for giving me the opportunity to work undertheir supervision. Their wide knowledge of wireless communication providesgreat inspiration. You have taught me a great deal about scientific work and notleast about scientific writing. I am also grateful to my co-advisors Dr. Anders J.Johansson and Prof. Ove Edfors, who has provided vital support in scientificmatters and also in numerous administrative issues.
I also would like to specifically recognize my co-advisor and colleague atEricsson Research, Prof. Anders Derneryd who encouraged me to embark thisjourney and always seem to have time for support and discussions, and mymanager Bjorn Johannisson together with Jan-Erik Berg, who both supportedthe idea. Anders and Jan-Erik has through my years at Ericsson been greatsources of inspiration and motivation.
Thanks also to my other colleagues at Ericsson Research; Dr. Jonas Medbowho put in a lot of effort into the channel measurements and channel analyses,Henrik Asplund and Mathias Riback who also helped with channel measure-ments, Dr. Jonas Friden, Dr. Anders Stjernman, Lars Manholm, Dr. FredrikAthley, Dr. Martin Johansson, Martin Siegbahn and many more, and at the uni-versity; Dr. Shurjeel Wyne, Dr. Johan Karedal, Dr. Tommy Hult, Dr. Vanja Pli-canic Samuelsson, Dr. Buon Kiong Lau, Dr. Andres Alayon Glazunov, Dr. Pe-ter Almers, Gunnar Eriksson, Dr Ruiyuan Tien, and many more, for help andmany discussions from which I have gained a lot. A special thanks also toLars Hedenstjerna for the excellent measurement fixtures, Martin Nilsson forelectronic masterpieces, and to Birgitta Holmgren, Pia Bruhn, and Doris Glockfor help with administrative matters.
I would also like to express my gratitude to Thomas Bolin, Zhinong Yingand Dmytro Pugachov at Sony-Ericsson Mobile Communications AB who helpedme with the terminal antenna measurements and let me use their measurementrange, and to Thomas Kornback at RUAG Space AB for help with the mea-
xi

xii Acknowledgments
surement of the cylindrical array antenna. Thanks also to professors and PhDstudents of the Institution for Signals and Systems at Chalmers University forletting me take some of my courses there.
Furthermore, I would like to thank Dr Tim Brown for taking the time tobe the faculty opponent at my thesis defence, Prof. Alain Sibille, Prof. JanCarlsson, and Prof. Anders Sunesson for agreeing to be the members of theexamination board.
This work has been financed within my employment at Ericsson AB, andwas supported by a grant from the Swedish Science Council (Vetenskapsradet).
Finally, I am also eternally grateful for the support and patience of myfamily - my wife Katarina, and our two boys Oskar and William.
Fredrik Harrysson
Lund, May 2012

List of Acronyms andAbbreviations
3GPP 3rd Generation Partnership Project
ASD angular spectral domain
BS base station
CENELEC European Committee for Electrotechnical Standardization
COST European Cooperation in Science and Technology
D2D direction-to-direction
DCM directional channel model
DDPC double-directional propagation channel
DFT discrete Fourier transform
DGBE diethylene glycol butyl ether
DOA direction-of-arrival
DOD direction-of-departure
DRA dielectric resonator antenna
EMCAD electromagnetic computer aided design
FCC Federal Communications Commission
FDTD finite difference time domain
FFT fast Fourier transform
xiii

xiv Acronyms
GO geometrical optics
GSCM geometry-based stochastic channel model
GTD geometrical theory of diffraction
I2I indoor to indoor
ICNIRP International Commission on Non-Ionizing Radiation Protection
IEEE Institute of Electrical and Electronics Engineers
IF intermediate frequency
IMT International Mobile Telecommunications
ISC ideal selection combining
ITU International Telecommunication Union
LNA low-noise amplifier
LOS line-of-sight
LTE Long Term Evolution
MEG mean effective gain
MIMO multiple-input multiple-output
ML maximum likelihood
MPC multi-path component
MRC maximum ratio combining
MS mobile station
MUX multiplexer
O2I outdoor to indoor
OFDM orthogonal frequency division multiplexing
P2D point-to-direction
P2P point-to-point
PDA personal digital assistant

xv
PIFA planar inverted-F antenna
RF radio frequency
RMS root mean square
RX receiver
RxPUCA Rx patch uniform cylindrical array
SAGE Space Alternating Generalized Expectation Maximization
SAM Specific Anthropomorphic Mannequin
SAR Specific Absorption Rate
SCM spatial channel model
SISO single-input single-output
SM spatial multiplexing
SNR signal-to-noise ratio
SVD singular value decomposition
SVM spherical vector modes
TX transmitter
TxPURA Tx patch uniform rectangular array
UE user equipment
ULA uniform linear array
UTD uniform theory of diffraction
V2I vehicle to infrastructure
V2V vehicle to vehicle
VNA vector network analyzer
WINNER Wireless World Initiative New Radio
WLAN wireless local area network


Contents
Abstract v
Preface vii
Acknowledgments xi
List of Acronyms and Abbreviations xiii
Contents xvii
I Overview of Research Field and Problem Approach 1
1 Introduction 3
2 Multiple Antenna Techniques 7
2.1 Diversity . . . . . . . . . . . . . . . . . . . . . . . . . . . . 8
2.2 Adaptive Beam-forming . . . . . . . . . . . . . . . . . . . . 9
2.3 Spatial Multiplexing . . . . . . . . . . . . . . . . . . . . . . 9
3 Wireless Channel Modeling 11
3.1 Physical Channel Modeling . . . . . . . . . . . . . . . . . . 11
3.2 The Double-Directional Propagation Channel . . . . . . . . 13
3.3 The MIMO Channel . . . . . . . . . . . . . . . . . . . . . . 13
xvii
xviii Contents
3.4 MIMO Channel Measurements . . . . . . . . . . . . . . . . 15
4 Antenna Environments in Mobile Communication 21
4.1 Field Regions of the Antenna . . . . . . . . . . . . . . . . . 21
4.2 Installed Base Station Antenna . . . . . . . . . . . . . . . . 22
4.3 Human Interaction . . . . . . . . . . . . . . . . . . . . . . . 23
4.4 Confined Scattering Environments . . . . . . . . . . . . . . 25
5 A Composite Channel Approach 27
5.1 Separation of Channel Regions . . . . . . . . . . . . . . . . 27
5.2 Representative Models and Interfaces . . . . . . . . . . . . 29
6 Contributions and Conclusions 45
6.1 Research Contributions . . . . . . . . . . . . . . . . . . . . 45
6.2 Conclusions and Future Work . . . . . . . . . . . . . . . . . 49
References 51
II Included Research Papers 63
Paper I – Dual Antenna Terminals in an Indoor Scenario 66
1 Introduction . . . . . . . . . . . . . . . . . . . . . . . . . . 69
2 Test Antennas . . . . . . . . . . . . . . . . . . . . . . . . . 69
3 Measurements . . . . . . . . . . . . . . . . . . . . . . . . . 70
4 Experimental Results and Analyses . . . . . . . . . . . . . 71
5 Summary and Discussion . . . . . . . . . . . . . . . . . . . 82
6 Conclusions . . . . . . . . . . . . . . . . . . . . . . . . . . . 84
References . . . . . . . . . . . . . . . . . . . . . . . . . . . . . . 85
Paper II – Efficient Experimental Evaluation of a MIMO Hand-set with User Influence 88
1 Introduction . . . . . . . . . . . . . . . . . . . . . . . . . . 91
2 The Composite Channel Method . . . . . . . . . . . . . . . 93
3 Test Equipment and Setup . . . . . . . . . . . . . . . . . . 96
4 Antenna Characterization . . . . . . . . . . . . . . . . . . . 98
5 Channel Measurements and Characterization . . . . . . . . 101
6 Evaluation of the Composite Channel Method . . . . . . . 105

Contents xix
7 User Impact on System Performance . . . . . . . . . . . . . 109
8 Conclusions . . . . . . . . . . . . . . . . . . . . . . . . . . . 112
References . . . . . . . . . . . . . . . . . . . . . . . . . . . . . . 115
Paper III – Evaluation of User Hand and Body Impact onMultiple Antenna Handset Performance 118
1 Introduction . . . . . . . . . . . . . . . . . . . . . . . . . . 121
2 Handset and User Phantom Setup . . . . . . . . . . . . . . 121
3 User Impact on Radiation Efficiency and Pattern . . . . . . 122
4 Diversity and MIMO Capacity Performance . . . . . . . . . 123
5 Conclusions . . . . . . . . . . . . . . . . . . . . . . . . . . . 126
References . . . . . . . . . . . . . . . . . . . . . . . . . . . . . . 128
Paper IV – Evaluation of an Outdoor-to-In-Car Radio Channelwith a Four-Antenna Handset and a User Phantom 130
1 Introduction . . . . . . . . . . . . . . . . . . . . . . . . . . 133
2 Measurement Setup . . . . . . . . . . . . . . . . . . . . . . 134
3 Penetration Loss and Fading Statistics . . . . . . . . . . . . 134
4 Time Domain Properties . . . . . . . . . . . . . . . . . . . 135
5 Antenna Correlation . . . . . . . . . . . . . . . . . . . . . . 137
6 Diversity and Spatial Multiplexing . . . . . . . . . . . . . . 139
7 Conclusions . . . . . . . . . . . . . . . . . . . . . . . . . . . 141
References . . . . . . . . . . . . . . . . . . . . . . . . . . . . . . 146
Paper V – Experimental Investigation of the Directional Outdoor-to-In-Car Propagation Channel 148
1 Introduction . . . . . . . . . . . . . . . . . . . . . . . . . . 151
2 The Channel Matrix . . . . . . . . . . . . . . . . . . . . . . 153
3 Measurement Equipment and Setup . . . . . . . . . . . . . 154
4 Channel Characterization . . . . . . . . . . . . . . . . . . . 157
5 Comparison Between Model and Measurements . . . . . . . 163
6 How the User and the Car Affect System Performance . . . 170
7 Conclusions . . . . . . . . . . . . . . . . . . . . . . . . . . . 173
References . . . . . . . . . . . . . . . . . . . . . . . . . . . . . . 176

xx Contents

Part I
Overview of Research Fieldand Problem Approach
1


Chapter 1
Introduction
Electromagnetic wave propagation is, of course, the most essential propertyof most radio and microwave systems for, e.g., wireless communication, radar,radio astronomy etc. Thanks to the 19th century physicists and experimental-ists like James Clerk Maxwell, Heinrich Rudolf Hertz, Nikola Tesla, GuiglielmoMarconi and Stepanovich Popov et al., we know in principle how radio wavespropagate, how they are generated, how to transmit and receive them, andhow to utilize them to communicate information. Later, in the 20th cen-tury, thanks to information, communication and signal processing scientistslike Claude Shannon et al., we learned how to communicate more efficientlyusing improved modulation, digital communication and coding techniques, alsoover a channel with large receiver noise and/or interference.
However, radio waves would be completely useless for transferring infor-mation without the antennas to radiate and receive the energy they carry. Insome situations we need only one antenna, e.g., in a microwave oven we onlyneed one radiating unit to heat the food by absorbed radio waves, and in radioastronomy we only need one receiving unit to identify the emitted radio wavesfrom distant astronomical objects. However, in a wireless communication sys-tem we always need at least two antennas that are separated in space, one atthe transmitter and one at the receiver side.
An antenna may be used for both transmitting and receiving signals, e.g., asin most radar and cellular applications. It is often assumed that the antenna is alinear passive component that contains isotropic materials, making it by defaultreciprocal. This means that the characteristics of the antenna are independentof whether it is transmitting or receiving. Thus, for simplicity, it is commonpractice for antenna engineers to always refer to an antenna as a transmittingunit. If nothing else is stated, this is also the practice in this thesis.
3

4 Overview of Research Field and Problem Approach
The main property of the antenna is to provide efficient transition of radiowaves from a transmission line into open-space propagation or vice versa. Thisquality is quantified by the radiation efficiency1. The second but equally im-portant property of the antenna, and perhaps the property that to most radioengineers actually define the antenna, is that it radiates or receives radio waveswith some distribution in direction and polarization. The latter is referred toas the antenna pattern or radiation pattern2 and is often considered in thefar-field region3.
Between the two antennas we have the (wireless) propagation channel, re-ferring to the propagating radio waves, generated at the transmitter (TX) sideantenna and impinging towards the receiver (RX) antenna. The simplest formof a wireless propagation channel is the line-of-sight (LOS) channel where aradio wave propagate in free space (often assumed to be identical to vacuum),expanding spherically, from the TX to the RX antenna. A more complicatedsituation occurs if the radio waves are obstructed by an object causing shadowfading or find several paths through a complex environment with a varietyof several scattering obstacles. The latter case is called a multi-path channeland the components of the channel that constitutes the multiply propagatedwave-fronts are referred to as the multi-path components (MPCs). Temporalconstructive and destructive addition of such complex MPCs (the phase de-pend on the path length) give rise to small-scale fading while the much slowershadow fading is termed large-scale fading.
The TX and RX antennas together with the propagation channel form theradio channel. By incorporating up/down-converting of frequency to baseband,modulation/demodulation, coding and detection, etc., we get the information-theoretic channel. However, in this thesis we mainly deal with the radio channeland use information theoretic entities like the channel capacity only for eval-uation of potential system performances. The channel is considered by time-harmonic field propagation (i.e., we neglect time transient effects) and is thuscharacterized by the analog complex vector properties amplitude, phase andpolarization. We also refer to a few different types of channels depending on ifthere is movement in the channel or not. In a static radio channel the anten-nas and all obstacles in the propagation channel are completely still relative toeach other, while in a dynamic radio channel one of or both the antennas aremoving relative the environment, or the environment is changing with time.
1“The ratio of the total power radiated by an antenna to the net power accepted by theantenna from the connected transmitter.” [42]
2“The spatial distribution of a quantity that characterizes the electromagnetic field gen-erated by an antenna.” [42]
3“That region of the field of an antenna where the angular field distribution is essentiallyindependent of the distance from a specified point in the antenna region.” [42]

Chapter 1. Introduction 5
There are a variety of methods to model the radio channel for wireless com-munications, and the appropriate choice depends on the situation. Simple sta-tistical fading models like the Rayleigh and Rice distributions for single antennaor single-input single-output (SISO) channels and the correlation-based mod-els like the Kronecker model for multiple antenna or multiple-input multiple-output (MIMO) systems, are very popular due to the simplicity and speedwhen it comes to system simulations. Nevertheless, for evaluation of specificantenna arrangements we need physical channel models that describe the di-rectional domain, e.g., the COST 259 directional channel model (DCM) [10,66]and the 3GPP SCM [1] that combine a plane-wave multi-path cluster model forthe propagation channel with the possibility to insert antenna patterns for testantennas of interest. These models use the classical assumption that a far-fieldantenna pattern can readily be combined with a directional multi-path propa-gation channel characterized by its plane-wave spectrum. Such an assumptionrely on that all obstacles in the propagation channel can be considered to bein the far-field region of the antennas. But what if this is not true? A mobilephone in the hand of a user that sits at the office desk indoor with the basestation (BS) at the roof-top of a house a few blocks away in a dense urbanenvironment should be a quite common scenario in todays cellular networks.
When people talk about “antennas” in mobile devices, such as mobilephones or lap-top computers, they often refer to the little piece of dielectricmaterial in combination with some bent metal piece, a PIFA (planar invertedF-antenna) or a DRA (dielectric resonator antenna) etc., positioned at the edgeof a ground plane inside the device, e.g., as in [105]. In fact, this little piece isonly part of the antenna, serving as a feed and matching unit. The antenna, ascharacterized by its far-field, is really the whole structure since currents mayflow all over the ground plane of the phone4.
In the case of a mobile phone in cellular communication systems, the userhand and body absorbs radiated energy and the fingers induce impedance mis-match as they may touch very close to the antenna elements. In fact, we canjust as well call the whole body an antenna – a super-antenna. And what aboutother obstacles in the environment very close to the mobile phone antenna, likewhen the user enters a car or another vehicle like a buss or a train, or in indoorscenarios with furniture and other objects very close to the mobile?
The questions are: “What is the antenna part and what is the propagationpart of the channel?”, “Is it possible and/or necessary to separate the channelinto parts in channel modeling?”, “How do we deal with the interfaces betweenthe components?”. These questions are exactly the questions we would liketo answer or at least stress in this thesis and to some extent discuss based on
4Which, to be precise, is not really a ground plane since it is not necessarily connected toa ground. Instead this is sometimes referred to as a counterpoise.

6 Overview of Research Field and Problem Approach
some prior results and some recent research. Especially, we concentrate on theMIMO case where we study multiple antenna terminals in, what we consider,realistic scenarios.
We also test and evaluate a simple practical approach to channel model-ing in, particularly, mobile communication systems by an assumption that thechannel can be divided into separate parts or regions that can be treated andmodeled individually. In short the idea is that the antenna part can be the partconsidered in design of the user equipment (UE) and can be characterized bysingle measurements, while the propagation channel can be characterized by,e.g., measurements with open areas around the BS and mobile station (MS) po-sitions. The intermediate regions would encounter the scattering environmentsto the BS and MS, e.g., obstructing building structures, the office desk or avehicle. Such a model approach is here termed a composite channel approach.
The subsequent chapters of Part I are organized as follows; Chapter 2 con-tains an overview of multiple antenna techniques, Chapter 3 give the back-ground to physical channel modeling and the multi-path propagation channel,Chapter 5 presents a composite channel approach to channel modeling, andChapter 6 wraps up Part I with brief presentations of the included papers andsome general conclusions. Part II of the thesis contains the included papers.

Chapter 2
Multiple AntennaTechniques
Multiple element antennas, or antenna arrays, were originally used in, e.g.,mobile communication systems at the base station side, providing mainly anefficient and flexible design process where the antennas can be configured withrespect to gain, beam-width, and electrical beam tilt. However, in this sensean array antenna is still a single antenna function with only one feed/receiveport.
With the use of multiple antennas with a multiple amount of individuallyaccessible feed/receive ports, system capacity can be improved in fading multi-path channels by the use of spatial diversity techniques, adaptive beam-forming,and spatial multiplexing [7]. The latter is often the beneficial characteristicthat is referred to by using the term MIMO but is more specific since the termMIMO could account for any system or channel with multiple ports at bothends of the link. In fact all these techniques can be considered as beam-formingif one may accept a generalization of the term beam to represent an arbitrary(but specific) array antenna radiation pattern related to a complex antennaarray element weight vector (or steering vector). Spatial, directional and/orpolarization diversity is equivalent to single-sided TX or RX beam-forming,with selection combining by binary weights, equal gain combining by phase-only weights, and maximum ratio combining (MRC) by complex weights. Inthe same manner, certain forms of spatial multiplexing (SM) can be consid-ered as superimposed multiple layers joint TX and RX beam-forming, e.g., byusing the complex MIMO channel singular vectors, found from singular valuedecomposition of the channel matrix, as steering or precoding vectors. This
7

8 Overview of Research Field and Problem Approach
physical point-of-view on MIMO and particularly on SM are very appealingto radio frequency (RF) antenna and propagation engineers with experience inarray antenna technology.
2.1 Diversity
In a multi-path radio channel the signal at the RX is composed of individuallyattenuated and phase-shifted replicas of the transmitted signal, arriving fromdifferent directions. The replicas may add up in a constructive or a destructivemanner as a function of time, giving rise to fluctuations in the received signal.These fluctuations, or rather when we observe the dips in the fluctuations, iswhat we refer to as signal fading. Fading may cause severe instantaneous dips(fades) in the signal level at the receiver that reduce the information throughputof the system. However, due to the statistical nature of a mobile channel, wecan utilize the fact that the probability that the signal level is low at more thanone signal port at the same time is very low. This technique to combat fadingis termed diversity.
Diversity can be applied in a number of domains; e.g., the frequency domainas in frequency-hopping and coded orthogonal frequency division multiplexing(OFDM), the time domain as in repetitive coding, or the spatial (space) do-main by using multiple antennas. In this context we focus on multiple antennatechniques that utilize the spatial and polarization domains of the radio chan-nel. Several identical antennas can be spread out in space so that the fadingat each antenna location is independent, or the antennas may have orthogonalradiation patterns or polarization providing diversity [26, 58]. For antennas ina limited volume such as the casing of a mobile phone these properties getindistinguishable [17].
A spatial diversity system can consist of a sensor system that; with someinterval detect and switch to the antenna with the highest signal level (selec-tion diversity), or at a drop below a certain threshold switch antenna port bysome predefined pattern (switch diversity). An even more sophisticated spatialdiversity system combines the antenna signals with appropriate phase weights(equal gain combining) or, optimally, with amplitude and phase weights (maxi-mum ratio combining) to maximize the signal strength. An early overview andanalysis of space diversity methods can be found in [16].
With channel state information at the TX, all these diversity techniquescan be utilized in the same way also at the transmitter side providing dual-sidediversity.

Chapter 2. Multiple Antenna Techniques 9
2.2 Adaptive Beam-forming
With adaptive beam-forming we address the case of accessible multiple antennaarray feed or receive port signals that can be individually weighted with respectto amplitude and phase. The benefit of such arrays is often quantified bythe array gain which is the amplification of the signal arriving or departingfrom/in a certain direction due to coherent (in-phase) combination over thearray element signals which increase the channel signal-to-noise ratio (SNR) [8].In a general sense, considering a beam as just any spatial filter or radiationpattern corresponding to the element signal weights of an array antenna, thediversity technique “maximal ratio combining” is a beam-forming techniquewhere the beam is chosen to compensate for the phase-shifts (and magnitudedifferences) in the arriving waves. Also the other previously mentioned diversitytechniques are in a general sense beam-forming, e.g., selection diversity thatcorrespond to a weight vector with a single one and all other zero, and equalgain combining that is the same as phase-only beam-forming. Beam-formingat the transmitter and receiver is in principle the same thing, but with theimportant distinction that at the transmitter it determines the directions ofthe radiated power.
2.3 Spatial Multiplexing
The capacity of a SISO channel (wired or flat fading wireless) with limitedfrequency bandwidth (W ) and in the presence of white Gaussian noise is de-termined by the logarithm of the receiver SNR (γ) as [21, (9.62)]
C = W log2 (1 + γ) (2.1)
This is the channel capacity that defines the theoretical upper limit of theinformation rate in a communication channel. Now, if the available power atthe TX can be allocated to several parallel channels, i.e., a MIMO system, thecapacity on each sub-channel will decrease logarithmically as the signal poweris divided onto several transmitters. At the same time the total capacity willincrease linearly as the sum over the number of sub-channels. If the powerallocation is chosen carefully in relation to the quality of the channel branches,the MIMO system will always beat (or equal) the SISO system capacity. Theoptimum power allocation technique is done by water filling [21, pp. 274–277].
In a wireless communication system the MIMO technique is explored byusing multiple antennas at both the TX and the RX side of the link. In this casethe transmitted radio signals are not in general separated by transmission linesor by a large distance in space, but may be subject to multi-path propagation

10 Overview of Research Field and Problem Approach
through complex environments. Nevertheless, by using the spatial filteringproperty of antenna arrays together with the concept of super-position, it ispossible to find multiple channel branches in such an environment, and theMIMO capacity can be explored. This technique to utilize the available signalpower in an optimum way by utilizing the multiple parallel channels availablein a multi-path environment is called spatial multiplexing (SM) and the greatbenefits regarding channel capacity was originally shown for Gaussian channelsin [31,91,100].

Chapter 3
Wireless Channel Modeling
A channel model is a function that maps the signal from the TX to the RXin a sufficiently accurate way. This function may be a stochastic process, adeterministic function or even a set of empirical or directly recorded data.
The two main applications of a channel model in mobile communication arewireless system simulations and optimization of a specific wireless network. Insystem simulations location independent stochastic or semi-stochastic modelsare often preferred since the simulations aim at optimizing systems performancein general, while location dependent, site-specific, or empirical models, arerequired for network planning and deployments. Channel models is also dividedinto narrowband or wideband models, stationary or non-stationary models,directional models (or not), single or multipath models, and single or multipleantenna (MIMO) models [65]. Comprehensive overviews of MIMO channelmodels can be found in [5, 99].
3.1 Physical Channel Modeling
Depending on the complexity of the channel model, a certain amount of detailsin the channel phenomena are considered, such as time and space clustering,Doppler frequency shift, etc. Models that encounter such physical propertiesare called physical channel models since they may capture the specific propa-gation phenomena of a certain site-specific or typical environment.
Furthermore, for evaluation of antenna properties in general and for antennaarrays in particular, directional propagation models are essential since the greatbenefit of multiple antennas is the ability to exploit the spatial domain.
11

12 Overview of Research Field and Problem Approach
3.1.1 Deterministic Propagation Models
The most detailed class of physical channel models are the electro-magnetic full-wave models with comprehensive geometrical and material descriptions of theantennas, and the scattering and propagation environments. Such a model is adeterministic model for site-specific evaluations that uses a specific geometricaldescription of the environment. The propagation part may be handled by,e.g., high-frequency approximation methods such as ray-tracing [96] and ray-launching [54] techniques utilizing the laws of geometrical optics (GO) anddiffraction techniques such as the geometrical theory of diffraction (GTD) [45]and the uniform theory of diffraction (UTD) [47, 56]. The UTD method fordielectric wedges has been shown to be able to accurately model real buildingcorner diffraction [9], rough edges [25], and combined with GO it is foundin [39] to be able to also quite accurately predict the path-loss in an urbanenvironment nearby the BS.
A problem with the UTD model is its inability to model multiple diffractionswhich is important when the distance between the BS and the MS increasesand there are many obstructing buildings in between. There are extensions tothe UTD method that tries to solve this problem [6, 95]. Others methods usesimplified heuristic knife-edge models that are computer efficient and well suitedfor path loss calculations in network planning when the distance between basestation are large and the channel include many obstructing buildings betweenthe BS and the MS, e.g., [12, 13]. An overview of various models can be findin, e.g., [97].
3.1.2 Empirical Propagation Models
Another type of physical channel models are the models based on measure-ment records. These models are truly site-specific, but an ensemble of suchmeasurements may be used to extract typical channel parameters that can beused in cell-planning tools (e.g., the popular Okumura-Hata model [41]) or inthe geometry-based stochastic models COST 273 DCM and the semi-stochastic3GPP SCM.
In contrast to the full-wave models that include all the interaction of a prop-agating wave traveling from the TX to the RX, the directional empirical modelonly account for what is seen from the TX and the RX antennas, respectively.To capture the directional properties the propagation measurements has to be;i) measured with rotating highly directional probe antennas, or ii) measuredwith array antennas in an omni-directional fashion or, if the channel is static,with a (wide-beam) antenna and positioning robots. In the latter case thedirectional properties of the channel is extracted by signal post-processing.
Chapter 3. Wireless Channel Modeling 13
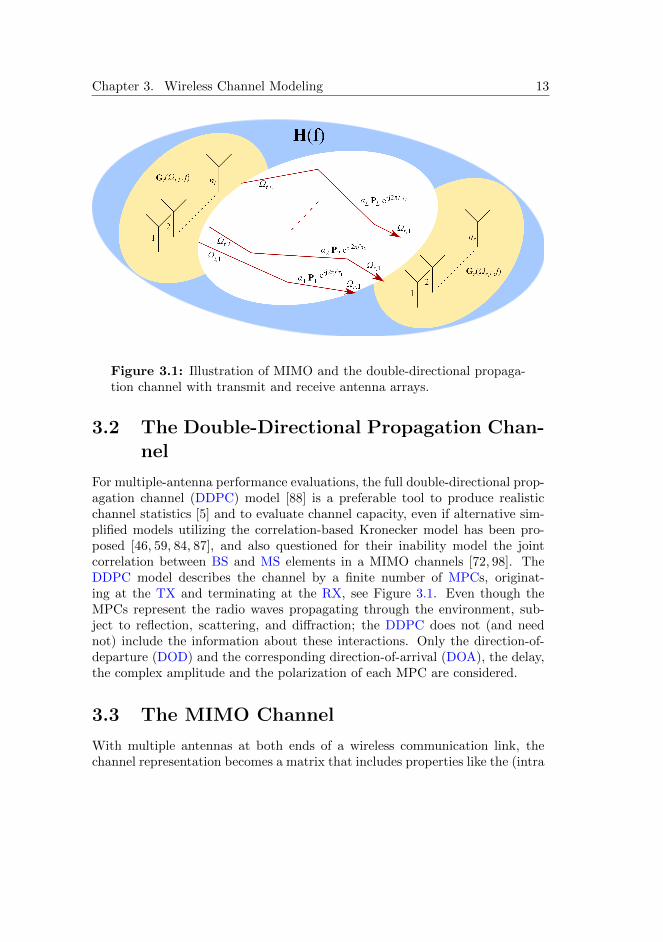
Figure 3.1: Illustration of MIMO and the double-directional propaga-tion channel with transmit and receive antenna arrays.
3.2 The Double-Directional Propagation Chan-nel
For multiple-antenna performance evaluations, the full double-directional prop-agation channel (DDPC) model [88] is a preferable tool to produce realisticchannel statistics [5] and to evaluate channel capacity, even if alternative sim-plified models utilizing the correlation-based Kronecker model has been pro-posed [46, 59, 84, 87], and also questioned for their inability model the jointcorrelation between BS and MS elements in a MIMO channels [72, 98]. TheDDPC model describes the channel by a finite number of MPCs, originat-ing at the TX and terminating at the RX, see Figure 3.1. Even though theMPCs represent the radio waves propagating through the environment, sub-ject to reflection, scattering, and diffraction; the DDPC does not (and neednot) include the information about these interactions. Only the direction-of-departure (DOD) and the corresponding direction-of-arrival (DOA), the delay,the complex amplitude and the polarization of each MPC are considered.
3.3 The MIMO Channel
With multiple antennas at both ends of a wireless communication link, thechannel representation becomes a matrix that includes properties like the (intra

14 Overview of Research Field and Problem Approach
and inter) correlation between the TX and RX antenna elements, and thepossibility to resolve parallel sub-channels for spatial multiplexing by singularvalue decomposition (SVD). With a directional channel representation, like afull-wave ray tracing solution or the DDPC model, the antenna independentpropagation channel is completely characterized as seen from the antennas.Thus, the full channel transfer matrix for arbitrary TX and RX antenna arrays(once characterized by their radiation patterns) can be found. Since many fullwave propagation solutions as well as many measured MIMO channels, canapproximately be represented by the DDPC model, we can in general write thefrequency-domain multi-path MIMO channel transfer matrix as
H(f) =
L∑l=1
αlGTr (Ωr,l, f)PlGt(Ωt,l, f)e−j2πfτl , (3.1)
whose elements Hij(f) describe the transfer function from the j-th transmitto the i-th receive antenna element. The expression (3.1) includes a sum overthe L MPCs, with the TX and RX antenna far-field matrices in Gt and Gr
and the polarimetric transfer matrix Pl. Here Gt and Gr have to contain thearray location vector phase term for each element in the columns, and for thepolarization component (θ, φ) in the rows, i.e., 2× nr,t.
The MPCs in (3.1) are independent of the Tx and Rx antennas, and thel-th one has the following DDPC parameters:
αl amplitude and phase
Ωt,l direction of departure (DOD)
Ωr,l direction of arrival (DOA)
τl path delay.
The polarimetric transfer matrix of the l-th MPC can be written as
Pl =
[Pθ,θ Pθ,φPφ,θ Pφ,φ
]which is normalized in relation to the complex amplitude αl, e.g., to have unitFrobenius norm. In the DDPC model the frequency dependency is taken intoaccount only in the phase factors representing the plane-wave path distancese−j2πfτl .
The expression in (3.1) seems general since it combines any antenna arraywith a directional channel model. However, the model in (3.1) assumes that the

Chapter 3. Wireless Channel Modeling 15
arriving signal1 can be represented by a finite spectrum of plane waves. Thisis only true if we consider interacting obstacles (scatterers) at large enoughdistance from the RX antennas, i.e., if the obstacles are in the far-field of theantennas array.
3.4 MIMO Channel Measurements
Channel models usually depend on measurements in some way, or “any chan-nel model is based on channel measurement data” [65]. Even the most simplestatistic channel model with only a few model parameters needs input or ver-ification from measured scenarios to be valid. Different measurement setups(disregarding the vast amount of possible measurements scenarios) are used de-pending on the parameters to be investigated, from the simplest non-coherentnarrowband setups for path loss and fading statistics measurements, to complexwideband systems with multiple array antennas for delay and direction esti-mation, or even with multiple radio chains for direct fast time-variant MIMOchannel measurements.
In the work presented in the included papers, we have used three differ-ent setups: a coherent narrowband vector network analyzer (VNA) setup fordirect 2 × 2-MIMO channel measurements (Paper I), a wideband VNA setupwith virtual arrays for DDPC parameter estimation and 8× 4-MIMO channelmeasurements (Paper II and Paper III), and the RUSK Lund MIMO channelsounder from Medav (Paper IV and Paper V). The three different setups aredescribed below.
3.4.1 Narrowband 2-Port Vector Network Analyzer Mea-surements with Frequency Offset
A VNA is commonly used in different channel measurement setups, mainlysince it is available in many radio labs and, hence, easily accessible. TheVNA is a versatile equipment with many possibilities and features that may beutilized depending on the scenario and channel characteristics of interest. In themeasurements described in Paper I the VNA is set up for coherent detection oftwo simultaneous narrowband signals generated by two signal generators witha frequency separation of 500 Hz with no phase reference between TX and RX,Figure 3.2. The frequency is swept very fast compared to the movements inthe channel and registered over time by a computer.
1The same apply at the transmitter side.

16 Overview of Research Field and Problem Approach
BS MSf_0
f_0+500Hz
SG H+V−pol.
SG
H
VNA
PC
Figure 3.2: 2 × 2 channel measurement setup using two narrowbandsignal generators with a frequency offset and a 2-port VNA for coherentdetection of the RX signal at the dual-antenna terminal.
3.4.2 Vector Network Analyzer and Virtual Array Posi-tioners
In the channel measurements referred to in Paper II and Paper III the VNAis used together with one linear, see Figure 3.3, and one three-dimensionalpositioning and rotation robot, see Figure 3.4, at the BS and the MS sidesof the channel, respectively, to form virtual array antennas for truly coherentwideband measurements. Appealing features of this measurement system arethat it is, (i) accurate, (ii) easily adjustable with respect to frequency, outputpower, IF bandwidth etc., and (iii) simple to use. However, especially forwideband measurements with virtual array antennas for direction estimation,the disadvantages are (i) low measurement speed due to the positioning systemthat require static channels, (ii) phase reference between TX and RX limitthe measurement distance due to the synchronization requirement via a longcable or a separate steady radio link. The measurement system described inPaper II and Paper III utilize a long optical fiber in combination with RF-optoconverters.

Chapter 3. Wireless Channel Modeling 17
Figure 3.3: Linear positioning robot with TX probe antenna.
Figure 3.4: 3-D positioning robot with rotational RX probe antenna.

18 Overview of Research Field and Problem Approach
Figure 3.5: RUSK Lund MIMO channel sounder RX unit with cylin-drical probe array antenna.
3.4.3 RUSK Lund MIMO Channel Sounder and Switch-ing Antenna Arrays
For dynamic time-variant MIMO channel measurements where the channelchanges rapidly compared to the sweep time of a VNA, a fast wideband mea-surement system is needed. Such a system is the RUSK Lund channel sounderthat uses multi-tone frequency domain correlation processing [92] similar toOFDM, Figure 3.5. This system provides a very fast measurement systemthat, when combined with fast RF switches and large antenna arrays, can beused to record up to 32 × 128 MIMO channel matrices with a bandwidth of240 MHz (in for example the 2.2–2.7 GHz band), a sampling rate of 640 MHz,and an impulse response sample interval of Ts = 1.6 ns. Thus, a full MIMOsnapshot with nT transmit antennas and nR receive antennas, and with an ex-tra Ts cycle to avoid switching transients, takes 2 Ts nT nR ≈ 13.2 µs in whichthe channel must be essentially invariant. It is then possible to do DDPC es-timation for each snapshot. This system is primarily designed for tests witha moving Rx unit in cellular or vehicle to infrastructure (V2I) channels, andpossibly also with a moving Tx unit for vehicular-to-vehicular channels vehicleto vehicle (V2V).
In the measurements presented in the papers included in this thesis wehave used only stationary TX and RX units. The fast measurement systemis, however, still very important for outdoor channel measurements were wind-swept trees and other moving object in the surrounding neighborhood, inducednon-stationarity in the channel that reduces the performance of channel esti-

Chapter 3. Wireless Channel Modeling 19
mation. This was experienced in the first outdoor-to-indoor measurement cam-paign where we used the VNA system with positioning robots as is describedin Paper II and in [40].

20 Overview of Research Field and Problem Approach
Chapter 4
Antenna Environments inMobile Communication
In many practical wireless communication scenarios the antenna is surroundedby more or less close objects that interact with the antenna in different ways.Not only the shape, size and material of the interacting objects affect theantenna performance; also the distance to the antenna is of great importance.A very close object may affect the antenna radiation impedance match, whileobjects at a somewhat larger distance mainly distort the radiation pattern byabsorption and scattering of radiated energy.
4.1 Field Regions of the Antenna
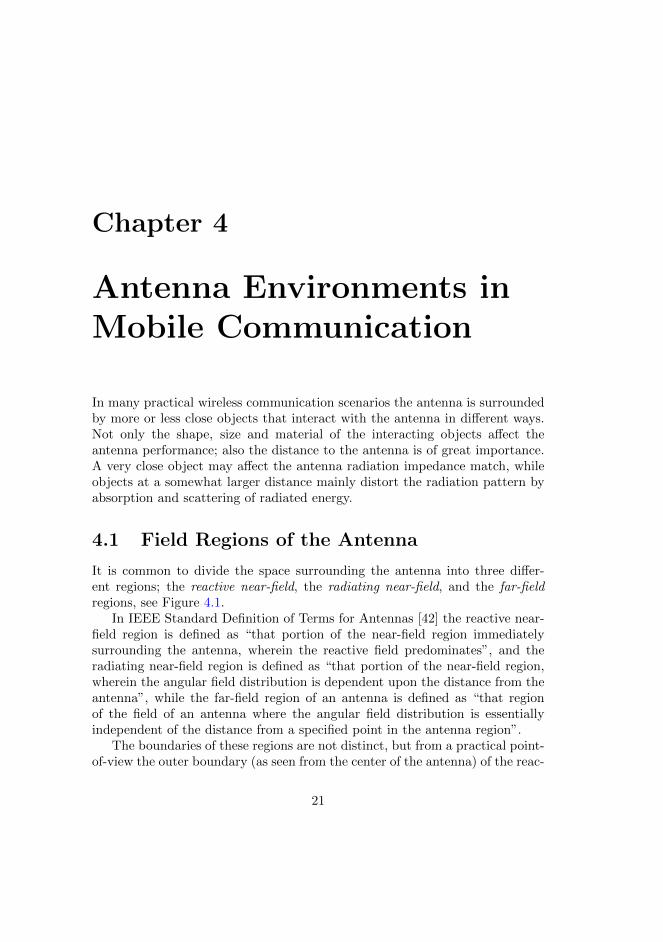
It is common to divide the space surrounding the antenna into three differ-ent regions; the reactive near-field, the radiating near-field, and the far-fieldregions, see Figure 4.1.
In IEEE Standard Definition of Terms for Antennas [42] the reactive near-field region is defined as “that portion of the near-field region immediatelysurrounding the antenna, wherein the reactive field predominates”, and theradiating near-field region is defined as “that portion of the near-field region,wherein the angular field distribution is dependent upon the distance from theantenna”, while the far-field region of an antenna is defined as “that regionof the field of an antenna where the angular field distribution is essentiallyindependent of the distance from a specified point in the antenna region”.
The boundaries of these regions are not distinct, but from a practical point-of-view the outer boundary (as seen from the center of the antenna) of the reac-
21

22 Overview of Research Field and Problem Approach
D
R1
R2
Radiating near-field
Far-field
Reactive near-field
Figure 4.1: Field regions of an antenna [11].
tive near-field region is the region surrounding the antenna wherein interferingobstacles affect the radiation impedance of the antenna, and the far-field regionis the region where the antenna can be regarded as a (directive) point source.The boundaries of the regions are commonly assumed to be R1 = 0.62
√D3/λ
and R2 = 2D2/λ, respectively, where D is the largest dimension of the antennaand λ is the wavelength, with the requirement that D is large compared toλ [11,42]. For small antennas where D λ the radiation near-field region de-creases and the outer boundary of the reactive near-field region ”is commonlytaken to exist at a distance λ/2π from the antenna surface” [42].
4.2 Installed Base Station Antenna
In the case of a BS antenna, the placement is in general chosen so that interac-tion with scattering objects is avoided. However, there are situations in denseurban environments or indoor deployments where it is impossible, unpracticalor non-affordable to avoid interference from high-rise buildings or obstacles onthe roof-tops, influence from wall-mounting or other indoor obstacles.
For simple geometric objects and buildings found in the far-field of the an-tennas where a geometric model is available, methods like UTD is accurateand effective for prediction as is shown in [39]. In the case of large array an-

Chapter 4. Antenna Environments in Mobile Communication 23
tennas common in BS implementations and having objects within the nearfieldof these antennas, the method can be utilized by coherent superposition of so-lutions for each array element. In more complicated situations we may needelectromagnetic computer aided design (EMCAD) such as finite difference timedomain (FDTD) tools, at the price of extensive computing power and time.
If the aim is to evaluate performance of installed single or multiple elementantenna arrays in typical realistic BS environments, e.g., with respect to an-tenna separation for MIMO performance as in [101] but with obstructive struc-tures in the close vicinity of the antenna, a statistical approach is needed. Thestatistical basis for such an approach can be hard to find by measurements sinceit may require extensive measurement campaigns to get statistical confidence.In this thesis we mainly focus on the MS side of a wireless communication linkand leave the BS side to future research.
4.3 Human Interaction
The human operator of a hand-held mobile device is a typical unavoidablenear-field interaction problem of MS antennas. Different parts of the bodyinteract with the antennas in different ways; the hand and the fingers are usuallyplaced very close above the antenna feed structure and even the head when thedevice is operated in talk position. The presence of the hand may cause severedegradation of the radiation performance due to both impedance mismatch(reflection) and absorption, while the body in general mainly causes shadowing.These effects has been investigated by many [4,34,55,70,73,75,93]. Within thisthesis the impact on multiple antenna system performance measures such ascorrelation and diversity is investigated in Paper I, Paper II, and Paper III. Theindoor diversity measurements with human interaction in Paper I is similar tothe investigation by Bolin et al. [14].
When modeling the user influence in a cellular system, different approachesare possible. Simplified geometrical models of the user body, e.g., by an absorb-ing infinitely long vertical plane or cylinder as in [60], can mimic directionaleffects when the body can be considered being in the far-field of the antenna.However, in cases including the user hand or when the antenna is very close tothe user body, the problem becomes more difficult to simplify and must possiblybe treated in a statistical manner, where the expected value, the distributionand the correlation of the radiation efficiency is estimated [86]. These statisticscan be gathered by the use of antenna measurements with a real human handor with a realistic hand phantom [27] or, alternatively, by EMCAD simulationsas in [15,43], and can also be extended into statistical human hand grip studiesas in [74].

24 Overview of Research Field and Problem Approach
4.3.1 User Phantom
To perform measurements of the impact of a human body in a mobile radiochannel, regardless of whether we target the impact of the operator (user) orby-passing interfering people, either we need live test persons or we can use aphantom. A large and representative amount of live human operators naturallygive the most trustworthy results in an evaluation of equipment or a system. Forevaluation of a method where we need high accuracy regarding repeatability,however, a model of some kind, a user phantom, is a better choice.
The body phantom has historically been basically anything that resem-bles a human operator with reasonably similar electro-magnetic characteristics(permittivity and conductivity) [33], e.g., simple dielectric cylinder or sphere(massive or liquid filled with a sugar-salt-water mixture) [4], etc.
However, nowadays in the case of SAR (Specific Absorption Ratio) mea-surements where the field strength and radiated power absorption inside theuser body is tested thoroughly and consumer products are certified with re-spect to human exposure, the quality of the phantom is very important. Boththe phantom properties and the test procedures are restricted by standardsfrom the IEEE, FCC, CENELEC, ICNIRP etc. Manufacturers are, e.g., re-quired to use the SAM (Specific Anthropomorphic Mannequin) body phan-tom for conformance tests, e.g., as in [49]. SAM is based on the 90th per-centile of a survey of American male military service personnel and representsa large male body. Standard phantoms are being developed also to encounterthe hand, and quite recent publications presents very sophisticated and de-tailed EMCAD hand models [53] and sophisticated user phantoms includinghead and hand has been used in channel measurements by Nielsen and Ya-mamoto et al. [69,102]. Also multiple antenna terminal performance and chan-nel simulations with simplified yet full upper body phantom EMCAD modelshave been reported by Ogawa et al. [71]. Furthermore, in-channel performanceevaluations by measurements of a generic versus a realistic phantom in browsemode, Yamamoto et al. [103] shows that a realistic phantom actually are im-portant for accurate channel performance investigations.
In our investigations of user influence described in [40] and in Paper II, weused an upper body full scale user phantom including the head, the upper torso,the right arm and hand, see Figure 4.2. The body part of the phantom aremade up by a 60 cm high glass-fiber shell filled with tissue simulant liquid madeby a mixture of 45% diethylene glycol butyl ether (DGBE) and 55% distilledwater to be in compliance with the recommendations of the IEEE Std. 1528for 2.6 GHz, with a relative permittivity εr = 39.7 and conductivity σ = 2.14.The hand/arm part is a massive full-scale right hand model from IndexSARwith the arm extension tailor-made. The body and arm parts are mounted

Chapter 4. Antenna Environments in Mobile Communication 25
Figure 4.2: User phantom in browse mode.
on a plywood board; the arm via a plastic joint providing the possibility toorient the hand and handset to different operation positions. This joint was inour investigations fixed to two positions, one talk mode and one browse modeposition.
4.4 Confined Scattering Environments
If the human body from a modeling perspective is considered as a scatterer thatobstruct a fraction of the directional space as seen from the antenna, a confinedscattering environment, on the other hand, is the situation where the radiationas seen from the antenna is mainly obstructed in the directional domain. Aconfined scattering environment is, e.g., a vehicle or an office room where theuser equipment with the antenna(s) is placed inside.
Such an environment may change the channel properties from the outsideto the inside severely, depending on the openings (amount and sizes), the re-flectivity and penetration loss of the walls and windows, and the scattering andabsorbing objects inside. Questions like; “Where does the radio waves enterthe confined volume?”, “Is the scattering due to inside multiple reflections anddiffractions increased compared to outside giving rise to Rayleigh fading inside

26 Overview of Research Field and Problem Approach
even if we have LOS outside?”, “Or, on the contrary, does the openings, i.e., thewindows, in combination with heavy absorption inside, e.g., due to passengersin a car, decrease the richness of the channel?”, “Do we get a keyhole effectstill providing diversity performance but no spatial multiplexing gain?”, etc.
Many of these questions are still to be investigated and answered. However,a first measurement of the directional attenuation of a car is found in [38]. Inaddition, a simplified high-frequency diffraction model is proposed for path lossmodeling. The investigation mainly supports this simple model and proposes adirectional approach to outdoor-to-in-car path loss modeling, in the case whenthe car is not loaded with passengers. In this case, since the investigation ismade for only two static single antenna positions inside the car, we can notdraw any general conclusions about how the statistical distribution of the fadingchanges when the antenna is moved from the outside to the inside of the car.This is investigated for a test car in Paper IV and with directional estimationin Paper V.

Chapter 5
A Composite ChannelApproach
For an idealized wireless communication link with antenna arrays in free spaceat both the TX and RX, connected by a finite number of plane waves, thedouble-directional MIMO channel model in (3.1) is completely adequate. How-ever, in a mobile communication scenario we may have, e.g., a user interferingwith the antennas at the MS side. In this case, is the user body a part of theantenna or of the channel? And what if the user is sitting in a car? Thesequestions lead us into an idea of separating the channel into several layers.Such a layered channel model is here referred to as a composite channel model.
5.1 Separation of Channel Regions
In a composite channel a key issue is how and where to divide the channelmodel. A full-wave propagation calculation tool in combination with a full ge-ometric data base could give all information needed for calculating the channelbehavior in any scenario. This is the full channel representation where all thechannel parts, i.e., every interacting physical object from TX to RX, are char-acterized. However, even very detailed geometry data may not include enoughscattering details to be realistic. Instead, we often in link simulations rely onmeasured channels from scenarios we find typical enough, or from empirical,sometimes geometry-based, stochastic or semi-stochastic channel models.
Thus, in the case where different configurations or realizations of TX or RXantennas are to be tested and the performance in a realistic channel is to beevaluated, we rely on the channel model in (3.1). With the DDPC parame-
27

28 Overview of Research Field and Problem Approach
ters extracted from measurements or simulations in “typical” scenarios, severaltest antennas can be evaluated in identical environments by their measured orsimulated far-field antenna patterns inserted, and therefore avoiding extensivemeasurement campaigns for each test antenna. Thus, the composite channelseparation is simply the separation of the antenna and the multi-path propaga-tion channel at both the TX and RX under the assumption that the scatterersof the channel are in the far-field of the antennas. This approach was pioneeredby Suvikunnas et al. in [89,90].
Considering, e.g., a cellular system where the mobile phone (MS) is in thevicinity of a user, the channel can be separated either between the phone andthe user, i.e., the user is a part of the channel, or the channel can be separatedbetween the user and the propagation channel, i.e., the user is a part of theMS. The first alternative is hardly practical since it would require channelmeasurements for each configuration of the user body, and the far-field re-quirement with the MS in a user hand is not fulfilled. The second alternative,with the user being a part of the MS antenna forming a new super-antennais, however, useful and has been shown to produce good statistical agreementin an outdoor-to-indoor and an indoor-to-indoor scenario as shown in [40] andPaper II. The far-field antenna pattern for the test mobile in combination witha user phantom or a human user can readily be measured in an antenna range.
The technique in the example above does unavoidably require an increasedamount of test patterns to be evaluated due to several possible user operationpositions or modes (talk mode, browse mode, position of arm, mobile in handetc.). To avoid this we need a third composite channel interface between themobile antennas and the user body. Since the hand is very close to the mobileit seems impossible to put the interface there where the far-field assumptiondefinitely does not hold. Furthermore, since the hand connects continuouslywith the body, there seems to be no natural choice. From experiments it isseen that the hand does indeed induce absorption, loss of radiated or receivedenergy, and may cause antenna mismatch for the handset antennas [73,76] andintroduces decorrelation of the antenna signals [77, 86]. However, it does notseem to influence the radiation pattern in a predictable way like the body does,as is shown in Paper II Section 4 Figure 2. Thus, a possible approach would beto model the directional properties of the body as a separate forward scatteringlayer or a directional filter. This idea will be explained below.
The same approach as is described for the user body example above may beapplicable to other similar possible scattering environments as well. In the caseof an antenna inside a car, a simplified directional forward scattering model isproposed in [38] with the option of at least one additional mirror source tohandle first order reflection. The same model could be applicable also for otherscenarios with antennas inside vehicles, such as buses, trains or aircrafts, since

Chapter 5. A Composite Channel Approach 29
they are built up by similar confined metal structures with windows. This ideamay also apply for other similar urban scenarios like the outdoor-to-indoorcase, etc.
With such an approach to channel modeling, it is possible to evaluate e.g.,different test mobile phones in different user scenarios, in a car etc., with the useof only a few “typical” propagation channel scenarios that again are identicalfor all test devices and therefore completely fair.
If the similar approach also apply for non-confined scattering environments,e.g., unavoidable scattering object in the vicinity of a BS antenna array (in aMIMO scenario), the composite channel approach can be extended also to theBS side in a cellular system or to the access point in a wireless local areanetwork (WLAN) system. Thus, the composite channel model may have 5-6separate layers.
5.2 Representative Models and Interfaces
With a composite channel model with several physical regions, there is a needfor defining the interfaces and choosing the appropriate channel representationin each region. A model that describes the signal transition from one positionin space to another one can be referred to as a point-to-point (P2P) model.However, within the channel regions the signal transition will be representedby point-to-direction (P2D) and direction-to-direction (D2D) models.
5.2.1 Antenna Region
In general there are many ways to define and characterize an antenna. In chan-nel modeling we normally put the interface between the antenna region and thepropagation region at some radius from the center of the antenna excitationport, i.e., the point where the transition between transmission line and open-space propagation occur. The corresponding region that is circumventing allthe structures that is fixed to the antenna (or to the excitation port) is insertedinto the channel as one unit, which may be referred to as the actual antennaitself, or alternatively as a super-antenna. This means that the antenna regionmay include, e.g., the mobile phone with casing in a cellular system, or a lap-top computer in a WLAN system. If it can be assumed that all surroundingstructures outside the antenna region is in the far-field, the antenna can be rep-resented by the polarized complex electric far-field found by measurements orelectromagnetic theory, i.e., by a P2D model. The far-field of a certain antennais a deterministic property, but could be turned into a statistical representa-tion that include small-scale uncertainties by adding a stochastic component

30 Overview of Research Field and Problem Approach
as proposed in [85].An antenna far-field may also be stored and handled in different ways.
There are different pros and cons for the choice of method:
Closed-form expression is of course the most convenient model for simula-tions of antennas but are only available in practice for simple structureslike idealized dipoles, etc.
Sampled field data is normally what would come out of antenna range mea-surements or EMCAD tools. A disadvantage is the discrete frequencyand angular samples which require interpolation to fit with a directionalpropagation channel.
Basis function representation is an alternative mathematical representa-tion of full sphere field data often derived from either a closed-form rep-resentation, or sampled full sphere field data with sufficient samplingdensity. The field is represented by a linear combination of a set of basisfunctions (preferably orthonormal) with different properties dependingon application.
The basis function representation is commonly used in the included papersof this thesis. The far-field data originates in most cases from measured fullsphere data and once the transform or modal expansion is made in combi-nation with the measurements, the file size becomes compact since only thecomplex basis function weights are stored. Furthermore, with the closed-formbasis functions we avoid numerical complex interpolation in the angular do-main. Another useful feature of basis function representation is the physicalinterpretation of the basis functions where higher order modes mainly repre-sent radiating parts of objects with a larger size or at a larger distance fromthe actual antenna (if centered at the origin of the coordinate system of themeasurement range). This means that it is possible to identify error sources inmeasured data that originate from objects outside of the actual antenna, e.g.,from the anechoic chamber positioning system, etc.
One set of basis functions that is commonly used is the vector sphericalharmonics or spherical vector modes (SVM) as described in [3]. This repre-sentation gives compact data storage and nice physical truncation properties.Another very useful representation of especially far field data is the angularspectral domain (ASD) or 2-D Fourier decomposition [20]. To do this we needto use the trick of extending the spherical vector coordinate system to map atorus geometry such that the field (over-)representation gets periodic in bothθ and φ over (−π : π). Now a 2-D discrete Fourier transform (DFT) give theangular spectral domain decomposition (referred to as the EADF in [20, 51]).
Chapter 5. A Composite Channel Approach 31
With periodic (equidistant) field data samples in (θ, φ) we may utilize the ef-ficient fast Fourier transform (FFT) algorithm. The transition between ASDand SVM is easily derived making it possible to switch very fast between therepresentations [37, (A1.35a)]. Thus, we can utilize the advantages of minimalstorage and physical truncation methods of the SVM but switch to ASD toperform fast field calculations.
For an antenna region radius of a few wavelengths the SVM expansion is avery efficient antenna representation since the number of required modes willbe moderate. There is a rule-of-thumb that the maximum longitudinal andazimuthal mode numbers (l,m) has to be larger than approximately 2π timesthe electrical antenna radius r/λ plus 10 [37, (2.31)], i.e., if n = lmax = mmax
thenn & kr + 10 = 2π
r
λ+ 10 (5.1)
Since the mode numbers are defined so that l = 1, 2, . . . n andm = −mmax,−mmax+1, . . . ,mmax − 1,mmax the total number of modes nmodes required becomes
nmodes = 2(l2max + 2 ∗ lmax) (5.2)
where the first 2 account for the TE plus the TM modes, and mmax = lmax.Thus, for a large antenna radius of many wavelengths the number of modesmay become too large to be an efficient representation, compared to directsampled field data. This may also be the case if the antenna radius expandsinto the scattering region.
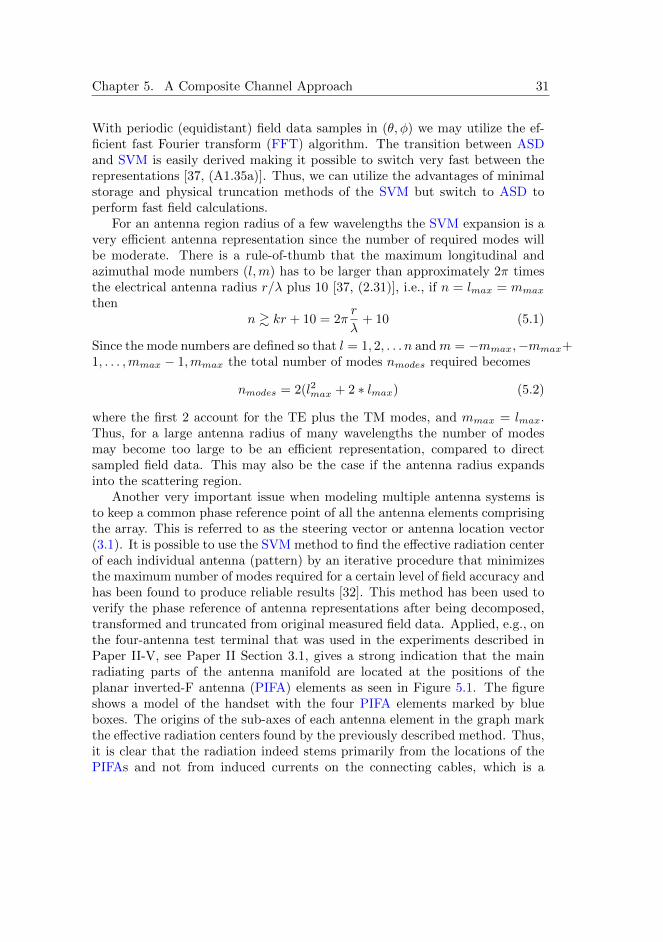
Another very important issue when modeling multiple antenna systems isto keep a common phase reference point of all the antenna elements comprisingthe array. This is referred to as the steering vector or antenna location vector(3.1). It is possible to use the SVM method to find the effective radiation centerof each individual antenna (pattern) by an iterative procedure that minimizesthe maximum number of modes required for a certain level of field accuracy andhas been found to produce reliable results [32]. This method has been used toverify the phase reference of antenna representations after being decomposed,transformed and truncated from original measured field data. Applied, e.g., onthe four-antenna test terminal that was used in the experiments described inPaper II-V, see Paper II Section 3.1, gives a strong indication that the mainradiating parts of the antenna manifold are located at the positions of theplanar inverted-F antenna (PIFA) elements as seen in Figure 5.1. The figureshows a model of the handset with the four PIFA elements marked by blueboxes. The origins of the sub-axes of each antenna element in the graph markthe effective radiation centers found by the previously described method. Thus,it is clear that the radiation indeed stems primarily from the locations of thePIFAs and not from induced currents on the connecting cables, which is a

32 Overview of Research Field and Problem Approach
Figure 5.1: Geometry of a four-antenna handset (PDA) with superim-posed 3-D measured antenna patterns with the origins at the effectiveradiation centers.
potential problem especially for small terminal antenna evaluations. A way toavoid this potential problem would be to use the technique with optical feedcables and RF-opto converters [67,104].
5.2.2 Scattering Regions
The scattering regions, at either the TX and RX side of the channel, may bedefined as the regions outside of the antenna region that include all scatteringobjects, preferably in the far-field of the antenna. These objects shall stillbe distinguishable from the large-scale propagating environment, i.e., the userbody at the MS or obstacles on a building roof in the vicinity of a roof-mountedBS antenna in a cellular scenario, the office desk environment in an indoorWLAN scenario, or a vehicle in an outdoor scenario, etc.
To model the scattering region in a composite channel model, such as theuser body or a vehicle, is a delicate matter and may be treated in different ways.A fully detailed user model requires measurements or EMCAD calculationswith 3-D geometry data and realistic material parameters, see e.g., [34, 75].In physical channel modeling we generally consider simplified models of the

Chapter 5. A Composite Channel Approach 33
electromagnetic wave propagation that in a statistical sense take into accountthe basic properties of the channel. An example is the so called geometry-based stochastic channel model (GSCM) [65, Sect. 7.4.5] were the contributionsof the main interacting objects in the directional and the delay domains aresurrounded by clusters to account for non-predictable MPCs. Thus, antenna-plus-user far-field measurements or EMCAD calculations may be used to forma predefined “super-antenna” pattern to be used in a reference channel model,i.e., with the user included in the previously defined antenna region. Thisapproach is tested and verified for measured super-antenna patterns in Paper II.
An alternative method is to find a simplified generic model of the impactof a user that can be added “on the fly” as a component of the (composite)channel model on top of an arbitrary antenna far-field pattern. This modelmay be extracted from statistics of empirical or simulated data, or may bedeveloped by simplified theoretical means.
In [60] a moving person is modeled by a infinitely tall cylinder. Here thechannel interaction is modeled by two components, one that account for theshadowing of the cylinder shaped person, and a second that also take intoaccount also the reflection and scattering1 of the person. The shadowed andthe scattered components are combined coherently to reflect the influence ofDoppler spread. In this paper, the model uses an heuristic approximation tocylinder scattering that give a smooth scalar function for the shadow and edgediffractions without the ripple caused by coherent addition of the incident andthe diffracted field components as in GO and UTD models. A rigorous calcu-lation of the electro-magnetic scattering of a cylinder can be found in [28], butsince the cylinder is only a rough model of the body of a person in movement,such advanced mathematical treatment is pointless. Instead, this smooth shad-owing function is assumed to approximate a local averaging of the shadow withrespect to the angle of incidence. This is often preferred in path loss model-ing [12] and provides a good shadow loss model for the body. In Figure 5.2 thismodel is compared to the measured average user body loss from the browsemode case in Paper II, Figure 2. Here the average radiated power normalizedwith respect to directivity of the four handset antenna elements, is plotted inthe horizontal plane (azimuth) with and without the phantom present. Theshadow of the phantom body is obvious in the graph towards the azimuth angle−90 degrees, and is well caught by the model.
Thus, it seems feasible to model the shadow effect of a user by simplemeans in a realistic way. In this example, the two contributions of diffractionfrom each side of the cylinder (i.e., the user body) combined by non-coherentaddition of powers. Thus, the model only account for the path loss of the user,
1were the term “scattering” differ from the definition of the scattered field in, e.g., [18]
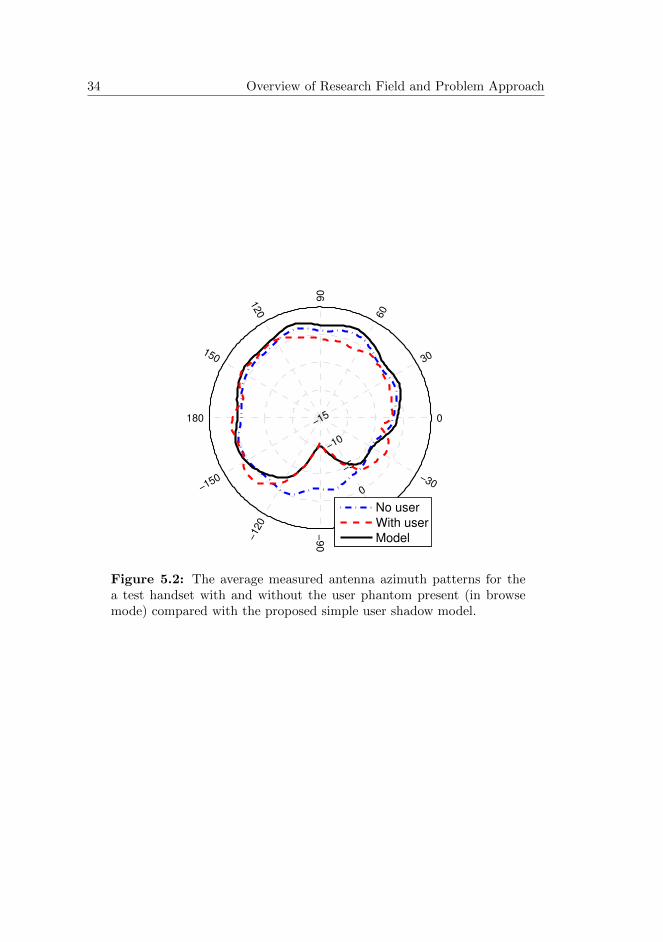
34 Overview of Research Field and Problem Approach
−15
−10
−5
0
5
−150
−120
−90
−60
−30
30
60
120
150
180 0
90
No user
With user
Model
Figure 5.2: The average measured antenna azimuth patterns for thea test handset with and without the user phantom present (in browsemode) compared with the proposed simple user shadow model.

Chapter 5. A Composite Channel Approach 35
ignoring phase and polarization. By true physical coherent combination of thediffraction components we would observe deep frequency dependent fading inthe shadow region which, in turn, could decrease the correlation between thesignals received by multiple antennas on a handset. In our investigations of userinfluence in realistic indoor and outdoor channels presented in Paper II and Vwe find, however, that the presence of the user in the channel increases thecorrelation between antenna branches. This is assumed to be a consequenceof shadowing since it has a potential to reduce the channel spatial richness.Thus, it seems as the user hand and body may affect antenna correlation inboth ways depending on the channel. In a highly correlated channel such as aline-of-sight channel the correlation may decrease due to the user body, while ina rich scattering environment it is likely to increase. From the investigations inPaper II and V we also find that the change in correlation has little impact onimportant multiple antenna channel properties like diversity gain and MIMOcapacity. Thus, we may assume that a directional (body) path loss model suchas the one proposed above is an interesting candidate for composite channelmodeling. This proposal is, however, yet to be verified in a statistical senseand may be a topic for further research.
A similar simplified modeling approach has been proposed in [38] for anantenna inside a car. Here, the proposed simple directional path loss modelis compared to directional path loss measurements and a more detailed ray-tracing model, the latter using first and second order ray-tracing (based on GOand UTD) for a geometric model of the car. This analysis shows the importanceof multiple reflections inside the car, an observation that can be made alsofrom the directional estimations in Paper V, Figure 2. Therefore extra caremust be taken when considering a scattering model for a car suitable for acomposite channel model regarding multiple interactions inside. These effectsmay be handled as in [38] by image theory or, alternatively, by a semi-statisticalapproach similar to the GSCM.
Furthermore, we find in Paper IV that the inner scattering of a car havethe potential to alter the fading statistics which means that also the statisticalproperties of the channel is affected. However, as was found also in the caseof user interaction, this change in statistical distribution seems to have verylittle effect on properties like diversity gain and MIMO capacity as is shown inPaper V. Thus, we may assume that the important impact of the outdoor-to-in-car part of the channel in channel modeling is caught mainly by a directionalpath loss model.
Again, this is an observation that still needs to be established statisticallyby further investigations and is not verified by the work in this thesis. Themodeling of the scattering region, together with the composite combination ofseveral models in multiple antenna and scattering regions, is a very interesting

36 Overview of Research Field and Problem Approach
topic that is proposed for future research.
5.2.3 Propagation Region
Finally, the region that is left between the TX and RX is termed the prop-agation region. This is what would be simulated by ray-tracing and/or ray-launching techniques [23, 24, 54, 82] or measured by a channel sounder witharray antennas at both ends, deliberately chosen to be well separated fromscatterers, i.e., on the roof of a measurement van, on a trolley in a office orcorridor etc., and that can be represented by the DDPC. It is also the D2Drepresentation of geometry-based stochastic reference channel models like theCOST 259, 273, 2100 models [10, 19, 22, 66, 78], the 3GPP SCM [1], and theWINNER II model [50], for the rural and urban macro/micro-cell scenarioswith the antenna patterns extracted. A good overview of propagation modelscan be found in [5].
The propagation channel is in general characterized by the DDPC model,i.e., by a limited set of MPCs that represents plane waves or rays. This is adouble-sided spectral domain representation that fits an electrically large envi-ronment well and can be found experimentally for a certain environment fromMIMO channel sounder measurements and high-resolution parameter estima-tion as described below.
Plane-Wave Spectrum Parameter Estimation
The propagation region as represented by the double-directional (plane-wavespectrum) propagation channel (DDPC model) constitutes the antenna inde-pendent radio channel, and can be modeled by theoretical means (models) orfrom parameter estimates extracted from channel sounder measurements withdedicated probe antenna arrays. The latter method is the one that we mainlyaddress in this thesis and also the one utilized in the included papers. FullDDPC parameter estimation [79, 80, 88] combines previously developed meth-ods of DOA and delay estimation [48, 57] and is a research field of its ownin signal processing. There are many algorithms proposed for high-resolutionmulti-dimensional parameter estimation of channel parameters where the mostpopular relies on maximum likelihood (ML) estimation, like the well knownSAGE algorithm and its proposed extensions [29,30,94] that perform the max-imization of the likelihood for one parameter at a time, or the gradient-basedmulti-dimensional methods like RIMAX [52, Section 5.2] or the similar methodby Medbo et al. [62–64] that increases the convergence rate for coherent prop-agation paths.

Chapter 5. A Composite Channel Approach 37
Common for these methods is the estimation of the DDPC channel parame-ters from the channel model in (3.1). The parameters θ = Ωt,l,Ωr,l, τl, αl,Pl,representing the measured channel of interest, are found as a solution to themaximization problem
θ , arg maxθ
p(x,θ) (5.3)
of the likelihood function p(x,θ), where x is a realization of the stochasticchannel matrix data x = vec(H).
It can be shown that the log-likelihood function log p(x,θ) in (5.3) can bewritten as (e.g., [81, Section 5])
− log p(x,θ) = NrNtNf log (πσ2) +1
σ2
Nf∑k=1
||Hk − Hk||2F (5.4)
were k is the sample frequency index, H is the channel model from (3.1), andH is a measurement realization. Here we assume stationary white Gaussiannoise (σ2I), non-moving TX and RX (zero Doppler), and that the channel canbe represented by specular plane waves2.
Enhanced Super Resolved Channel Estimation
The channel parameter estimates utilized for the analysis in [40] and in theincluded Papers II–V of this thesis, are just briefly described in the papers. Amore comprehensive description is outlined in [63]. This ML estimation methodutilizes a novel approach to improve the efficiency and the accuracy of ML basedsuper resolution channel estimation. ML estimation methods may suffer fromconsiderable computational complexity as hundreds of coupled discrete wavesmay have to be estimated simultaneously. Standard methods are either veryslow in convergence when parameters are correlated (e.g., SAGE [81]) or sufferfrom estimation errors as waves are not sufficiently decoupled. The problemcan be solved by a modification of the original likelihood function by intro-ducing windowing of both measurement data and the corresponding channelmodel [63]. In this way, waves are effectively decoupled for fairly small separa-tions in parameter space, making local maximization of corresponding modifiedlikelihood possible. Moreover, as the waves are decoupled a corresponding re-duction of complexity is possible by clipping (gating in delay domain) of datawhich is outside the coupling distance of the waves subject to parameter esti-mation. These new approaches have shown to substantially improve both theaccuracy and the efficiency of the estimation process.
2In [81] additional non-specular components referred to as dense multipath components(DMC) is considered as separate possibly correlated components of the channel.

38 Overview of Research Field and Problem Approach
Estimation Process
The typical estimation process is illustrated in Figure 5.3. First the maximumin the windowed power delay/angle profile is found. In this step the data isaveraged over the non-windowed degrees of freedom. The data in the vicinityof the maximum is kept while the rest is removed. In order to keep high compu-tational efficiency, a good estimate of the initial parameter values is desirable.For this purpose beamforming, which corresponds to a DFT from the antennaelement locations of the array to the angular domain, is performed providinga power function of delay/direction. Each local maximum of this function,which is above the noise level, corresponds to an initial wave. In this step themeasured channel is windowed also for the domains (space and/or frequency)which are not clipped in order to avoid fake initial waves. However, this win-dowing is not applied in any other step. The initial values are then used in themaximization of the modified likelihood step (block 1 in Figure 5.3). When themaximum is found, rays having too large parameter errors are removed. Maxi-mization and removal of rays with large errors are repeated until the parametererrors are acceptable.
In the next step the modeled channel which corresponds to the estimatedrays is subtracted from the measurement data. If the residual is above thenoise threshold, additional maxima are identified and added to the alreadyidentified ones. Then the maximization is repeated keeping the window aroundthe already identified power maximum. If the residual measurement data isclose to the noise level and/or no new rays have been added, a search for newpeaks in delay is performed. For any new peaks, the previous procedure isrepeated. When there are no remaining new peaks, the estimation process isfinished.
Nearfield and Non-Spherical Model Errors
The validity of the model in (3.1) assume plane wave fronts emanating from theTX and impinging on the RX, a model that may not be valid when scatteringobjects are close to the antennas. In Paper II this assumption is challengedby the indoor measurements with many obstructive and scattering objects notin the far-field (Rayleigh distance) of neither the RX synthetic antenna probearray, nor the user-phantom-plus-handset location. In this case no problemswith the estimation process were found and the channel model data showedvery good results utilizing the estimated parameters and comparing to directmeasured data.
In Paper V, however, the plane wave estimation is further challenged by acourageous attempt to perform parameter estimation inside a car at 2.6 GHz

Chapter 5. A Composite Channel Approach 39
Find maximum in power delay profile
y
n
Find maxima in angle, at that delay, by beamforming
Remove rays with large errors
Subtract estimated rays from measurement data
Residual close to noise or no new rays
survived?
Any new maximum in residual power delay
profile?
Ready!
1)
Find additional maxima in angle by beamforming and add to existing rays
Maximize windowed likelihood for those rays
Any parameter error too large?
n
y
y
n
y
n
Perform sequential maximization for parameters
one by one
Perform simultaneous maximization for all parameters
Slow convergence or Lmod increased?
1)
Figure 5.3: Flow chart of estimation process [63]. The lower dashedbox (1) is a magnification of the third box in the top flow chart.

40 Overview of Research Field and Problem Approach
which is a very close environment well within the Rayleigh distance of the an-tenna at this frequency. As expected, the estimation process now shows muchless accuracy with possible artifact scatterers as a result of close obstacles. Nev-ertheless, the average channel behavior still showed reasonable accuracy whencomparing channel model data based on the estimated parameters, to directmeasured data. This shows that channel estimation based on channel soundermeasurements with properly calibrated array antennas, even in complicatedclose scenarios can serve as a practical tool for statistical multiple antennasystem evaluations.
The errors due to non-planar wave fronts and the relation to antenna cal-ibration distance are examined in [52]. A possible solution to the problem ofnon-planar wave fronts would, of course, be to introduce also the curvatureradius or scattering source distance in the estimation process, extending theparameter space θ [35, 36]. This method has been considered as a candidatesolution to the in-car channel estimation problem but was never implemented.This is, however, an interesting topic for future work.
Channel Sounder Probe Antenna Calibration
The quality of the calibration of probe antennas for channel sounder measure-ments ultimately sets the accuracy of the channel parameter estimates. Herewe only consider fully characterized antennas, i.e., the measured full spherefar-field antenna patterns with amplitude and phase for two orthogonal po-larization components3. In Section 3.4.2 and Section 3.4.3, the two channelsounder setups used in the scope of this thesis are described.
With the first setup, using a VNA with positioning robots, the probe an-tenna is a two-port dual polarized single patch antenna element that is trans-lated and rotated at the measurement location (using a SP2T switch to togglebetween antenna ports). This antenna was measured in a SATIMO SG 64 com-pact measurement range at Sony Ericsson Mobile Communications AB, Lund,Sweden, with high measurement accuracy except in a sector in the backplaneof the antenna downwards towards the mast of the measurement range.
The positioning accuracy of the channel measurement robots is better thana millimeter (< 0.01λ), while the pointing error of the patch is within a fewdegrees which is negligible in this case since the half-power beamwidth of thepatch is about 90 degrees. Thus, this measurement system provides very highaccuracy of the antenna array models which results in high quality channelparameter estimations subject to plane-wave propagation [61, 64]. The disad-vantage with this method is the possible phase instability due to unavoidable
3A comprehensive overview of incomplete array antenna models and their consequencescan be found in [52, Section 7.2]

Chapter 5. A Composite Channel Approach 41
Figure 5.4: The RxPUCA antenna.
movements and bending of cables during robot movements which results inmeasurement errors. It is advisory to minimize this by carefully tied cableattachment, or, preferably, by fix cables and rotary joints.
The cable problem is to some extent avoided by using the channel soundersetup in Section 3.4.3 with fix probe array antennas combined with largeswitches, besides the obvious advantage of much faster possible measurementspeed. This setup, however, put even higher demands on the quality of theantenna calibration measurements. The array antennas used in this work (Pa-per IV and V) is a planar patch array at the TX side, Tx patch uniformrectangular array (TxPURA), and a cylindrical patch array at the RX side,Rx patch uniform cylindrical array (RxPUCA), both with λ/2 element sep-aration. The TxPURA has 4 rows and 8 columns of dual polarized squarepatch antenna elements where only the two middle rows are used (the oth-ers are terminated). The 32 ports in the two middle rows are connected to a1-to-32 switch multiplexer (MUX) and an amplifier. The calibration of this an-tenna was never used in the work presented here since only RX side directionalestimation was performed.
The RxPUCA has 4 rows and 16 columns of dual polarized square patchantenna elements, see Figure 5.4. In this case all 128 ports are connected to

42 Overview of Research Field and Problem Approach
a 1-to-128 switch MUX and an low-noise amplifier (LNA). This antenna wasfully characterized including the MUX, and the LNA, at a 6 meter high qualityindoor anechoic chamber with a rotation-over-azimuth turntable unit4.
A very important issue with the antenna array characterization to be usedfor directional estimation, is a correct phase reference of the array elements sothat the phase in the antenna pattern data model as a function of angle withhigh accuracy reflects the individual antenna array element location. This wasdiscussed in Section 5.2.1 for the test terminal characterization and here wecan use the same method to find estimates of the effective phase centers totest that the measurements are correct. This is shown in Figure 5.5 where theestimated effective phase centers for vertically and horizontally polarized patchantenna ports are marked on the true patch array geometry. The maximumdeviation between true values and estimated effective phase centers are foundto be 26.2 mm and the rms deviation is 8.4 mm, which would put a limit tothe estimation accuracy of the array. However, since we do not yet know theaccuracy of the method used it is hard to quantify this error but we get anindication that the antenna model is good.
Ray Tracing and Other Propagation Modeling Tools
There are of course many other ways to model directional radio propagation be-sides channel parameter estimation from array antenna channel measurements.Purely theoretical deterministic models as was mentioned in Section 3.1.1 thatis based on ray tracing or ray launching (shooting and bouncing rays) have beenused to produce reliable multipath directional propagation models in many pub-lications [2,24,39,44,82,83,96,99,106]. The problems with these types of modelsis often a lack of quality or sufficient detail in building data bases together withthe enormous computer resources that these details require. However, build-ing databases seem to become more and more available both with respect tocoverage and cost, and computer power is still increasing while computers getcheaper.
4At RUAG Space AB, Molndal, Sweden

Chapter 5. A Composite Channel Approach 43
Figure 5.5: The RxPUCA geometry with marked phase centers esti-mated from measured patterns.

44 Overview of Research Field and Problem Approach

Chapter 6
Contributions andConclusions
This chapter summarizes the main research contributions of the included pa-pers. Some general conclusions regarding the research area are also providedas a separate section.
6.1 Research Contributions
The work was supervised by Dr. Fredrik Tufvesson, in an initial phase togetherwith Prof. Andreas F. Molisch. Co-supervisors were Dr. Anders J. Johansson,Prof. Ove Edfors, and Prof. Anders Derneryd. I am the main contributor tothe scientific work presented in the included papers, and the contributions ofmy co-authors are mentioned below for each paper.
6.1.1 Paper I: “Dual Antenna Terminals in an Indoor Sce-nario”
This conference paper investigates the performance of dual-antenna test ter-minals in an indoor scenario including user influence. The paper specificallytargets the diversity and MIMO performance impact of (i) the channel correla-tion and (ii) the user influence, with two different user operation modes. At thetime of the writing of the paper, publications that addressed these effects wererare in the literature. Later it has been well established that even high antennabranch correlation (complex correlation magnitude above 0.7) in a channel maystill provide significant diversity gain, a result that is supported by our results.
45
46 Overview of Research Field and Problem Approach
Regarding the operation modes of a user, the data mode or browsing modewhere the user holds the mobile phone (or a laptop) in a position as to watchthe screen, is perhaps the most interesting scenario nowadays for investigationof user effects on MIMO performance, since it is in this position we expect thehighest data transfer rates.
As a feature, the paper also investigated the possibility to explore the sin-gular vectors of the MIMO channel matrix as a tool to find the antenna signalweights and, thus, the individual importance or performance of the antennas.This technique was not known to the authors to have been published prior tothe writing of this paper.
The work was done in cooperation with Sony Ericsson Mobile Communi-cations AB, who provided the test terminals. I did the analysis and wrote themanuscript. The measurements were done together with Henrik Asplund andMathias Riback. The work was supervised by Prof. Anders Derneryd.
6.1.2 Paper II: “Efficient Experimental Evaluation of aMIMO Handset with User Influence”
This paper extends and improves the evaluation of the composite channelmethod that was first published in a conference paper [40]. Here, the methodis verified for both an outdoor-to-indoor and an indoor-to-indoor scenario, andvery good agreement is found between the statistics of the synthetically foundchannel matrix and direct measurements. The results support the validity ofthis useful concept for channel modeling with the specific focus to target theimportant user effects in evaluating realistic MIMO performance of hand-heldmobile devices and provide a tool to improve multiple-antenna design on ter-minals.
Novel contributions of this paper are the final validation of the compositechannel method with a full phantom user model including hand, arm, uppertorso and head. We also reevaluated the impact of different hand positionsand usage positions of the handset, i.e., holding it in the browsing position vs.the standard talk position. Furthermore, we reanalyzed the MIMO capacityas well as the eigenvalue distributions and diversity performance for a realisticfour antenna handset mock-up in the presence of a user phantom.
I wrote the manuscript together with Prof. Andreas F. Molisch, and I didthe analysis and modeling, except for the double-directional channel estima-tion, to which Dr. Jonas Medbo has contributed. I and Dr. Medbo did themeasurements and Dr. Anders J. Johansson contributed to the preparationsof the user phantom. Prof. Molisch and Dr. Fredrik Tufvesson supervised thework. The antenna range measurements were done in cooperation with SonyEricsson Mobile Communications AB.

Chapter 6. Contributions and Conclusions 47
6.1.3 Paper III: Evaluation of User Hand and Body Im-pact on Multiple Antenna Handset Performance
This conference paper evaluates the performance of a multiple antenna hand-set in realistic radio channels. Specifically, we utilize the previously establishedapproach where the radiation pattern of the user-plus-antenna, is considered asone radiating unit (a super-antenna), and evaluates the performance impact ofthe user body and hand on properties like the antenna efficiency, performanceof different diversity combining approaches, and potential MIMO channel per-formance. It is found that apart from efficiency loss due to the user hand, themutual efficiency impact on the antenna elements and the directional impactof the user body shadowing, have small influence on the diversity and capacityperformance. We also find that the top and bottom placements of antennas arethe most efficient to be used with up to two antenna elements, and that signifi-cant diversity and capacity gain can be explored by using up to four distributedantennas, also with only two radio chains by the use of hybrid selection andcombining schemes.
I wrote the manuscript and I did the analysis and modeling with valu-able support by Prof. Anders Derneryd. Dr. Jonas Medbo has contributed toboth measurements and channel estimations, and Dr. Anders J. Johansson hascontributed to the preparations of the user phantom. Dr. Fredrik Tufvesson su-pervised the work. The antenna range measurements were done in cooperationwith Sony Ericsson Mobile Communications AB.
6.1.4 Paper IV: Evaluation of an Outdoor-to-In-Car Ra-dio Channel with a Four-Antenna Handset and aUser Phantom
This conference paper evaluates the influence of a car on the MIMO radiochannel, from a base station antenna array, to a multiple antenna handset inthe hand of a user placed inside. A measurement campaigns is performed thatmimic a 2.6 GHz micro-cell urban or rural scenario with two different locationsand orientations of the car. The analysis includes important observables likethe car penetration loss, impact on fading statistics, terminal antenna branchcorrelation, eigenvalue distributions, as well as the performance of various hy-brid diversity combining and spatial multiplexing schemes, with and withoutthe vehicle present in the channel. It is found that the car, in general, makesthe channel statistics become closer to Rayleigh-distributed by increased innerscattering, increases multipath channel richness, improving the potential of di-versity gain and, to some extent, spatial multiplexing. The overall impact ofthese effects is found to depend substantially on the orientation of the car and

48 Overview of Research Field and Problem Approach
the outer channel scenario.I wrote the manuscript and I did the analysis and modeling. The mea-
surements were done together with Dr. Tommy Hult. Dr. Jonas Medbo hascontributed to both measurements and channel estimations, and Dr. Anders J.Johansson has contributed to the preparations of the user phantom. Dr. FredrikTufvesson supervised the work.
6.1.5 Paper V: Experimental Investigation of the Direc-tional Outdoor-to-In-Car Propagation Channel
This submitted journal paper evaluates the possibility to accurately enoughperform channel estimation inside a car in an outdoor-to-in-car environment,despite the violation of the required “rule-of-thumb” Rayleigh distance to thesurrounding channel scatterers. The investigation is based on 32 × 128 andMIMO channel measurements with probe array antennas for channel charac-terization, and 32 × 4 MIMO reference channel measurements with an upperbody phantom and a four-antenna handset mock-up located outside and in-side of a standard family car. It investigates whether the combination of aplane-wave spectrum propagation representation combined with arbitrary butrealistic multiple antenna representations, in the presence of a difficult confinedscattering environment, can appropriately account for and model importantstatistics of the channel. In both cases the results of this investigation showthat this is possible with high accuracy. The main specular components of thechannel seem to account for the important statistical properties.
The novel contributions of the paper are the test of the composite channelmodel with a body phantom that includes hand and upper body placed insideand outside a car, the impact of a car environment (outdoor-to-in-car), and theinvestigation of the possibility to perform directional channel estimation insidethe car. Furthermore, we test the accuracy of the synthetic channel based onthe estimated channel in the presence of a user inside and outside the car,regarding MIMO channel statistics, diversity and capacity gain.
I wrote the manuscript and I did the analysis and most of the modeling.The measurements were done together with Dr. Tommy Hult. Dr. Jonas Medbohas assisted with the channel estimations, and Dr. Anders J. Johansson hascontributed to the preparations of the user phantom. Dr. Fredrik Tufvessonsupervised the work.

Chapter 6. Contributions and Conclusions 49
6.2 Conclusions and Future Work
Proper physical channel modeling including all parts of realistic yet typicalwireless channel is, indeed, a tricky task. Realistic channel properties suchas scattering around and close to base stations, and near-by interactions withclose environments at the mobile user side, such as the hand and body, vehicles,etc., tend to make channel modeling very complex.
The trade off between complexity and simplicity of a channel model is cru-cial. Simply, if the channel model is too complicated it will not be implementedand used by link or system simulators. Still, for evaluation of a specific sin-gle or multiple antenna arrangement, the model has to catch realistic channelcharacteristics that may strongly affect the benefits of such an arrangement.For example, it is well established that MIMO may provide extensive capacitygain in rich propagation environments, a property that is precious in mobilecommunication systems. However, it is also extremely expensive for manufac-turers of mobile phones and other terminals to extend existing single antennamobile platforms into devices with multiple antennas and multiple radio chains,e.g., to support at least two layers MIMO in LTE and possibly up to 8 layersin future cellular standard evolutions. Therefore, the possibility to evaluatethe performance in an efficient and simple manner of such specific multipleantenna arrangements in truly reliable realistic scenarios, including the humanhand and body at the mobile side, together with scattering environments likevehicles, etc., is something that save tremendous efforts and money. These con-siderations also apply for future macro, pico and femto base stations, relays, orWLAN access points where very dense outdoor and indoor deployments mayintroduce similar obstructive and/or scattering problems at the BS side of theradio access link.
A first step in the direction of realistic channel modeling is to verify thevalidity of link simulations were the immediate surrounding environment tomobile phone antennas, here a mobile phone user, can be handled as a super-antenna with its aggregate far-field pattern to be combined with a directionalchannel model in a standard procedure. This is presented in Paper II and themethod is in its extensible form referred to as the Composite Channel Method.It is found that this method, as we expected, work well for statistical perfor-mance evaluation of such multiple antenna techniques as diversity and MIMOspatial multiplexing. In addition we may conclude, based on our observations,that the main influence of the user body, apart from the possibly critical im-pact of the hand and fingers touching nearby the antenna conductive parts [68],is the shadowing in the multipath channel that statistically increases antennacorrelation and, thus, impacts negatively on potential diversity and spatialmultiplexing gains.

50 Overview of Research Field and Problem Approach
In the next step of this research we extend the investigation of realistic userenvironments into vehicles, specifically a standard family car. This environ-ment has previously been investigated with respect to directional penetrationloss [38] and is in Paper V extended to also include statistical properties, aswell as an attempt to estimate the directional propagation channel in order tofurther challenge and possibly verify the composite channel modeling principle.Our observations show an increase in inner scattering inside the car (with onlya driver present) that provide additional multipath richness. This increasedmultipath richness however, together with observed penetration loss, stronglydepends on the outer scenario, i.e., the outer propagation circumstances andthe orientation of the car. We also find that despite the close confined environ-ment inside the car, where we deliberately violate the rule-of-thumb Rayleighdistance requirement when estimating channel parameters using a plane-wavechannel model, we get reasonable results both regarding the directional proper-ties of the car and the channel calculations using the composite channel method.
Furthermore, in this thesis we present an overview of a composite channelmodeling concept with definitions of the separate channel parts, divided into;antennas, scattering and propagation regions. We address these definitionsfrom our view point and discuss some basic principles without claiming to becomprehensive. Simple and accurate models of realistic environments that mapon these definitions are necessary for composite channel modeling in the waywe propose here. Some effort has been done on this matter, e.g., the proposeduser body shadowing model, or the simple directional car model presentedand discussed, but there is much more research left for the future. A properdesign and evaluation of such models with the extension to other terminals,the confined or open scattering environments, as well as propagation models,e.g., based on different ray tracing methods, enhanced channel measurementsand channel parameter estimations perhaps with non-planar wave fronts, semi-statistical physical propagation models, etc., is research to be continued.

References
[1] 3GPP, “Spatial channel model for MIMO simulations,” 3GPP, Tech. Rep.TR 25.996, december 2008. [Online]. Available: http://www.3gpp.org
[2] F. A. Agelet, A. Formella, J. M. H. Rabanos, F. I. de Vicente, and F. P.Fontan, “Efficient ray-tracing acceleration techniques for radio propaga-tion modeling,” IEEE Trans. Veh. Technol., vol. 49, no. 6, pp. 2089–2104,Nov 2000.
[3] A. Alayon Glazunov, “On the antenna-channel interactions: A sphericalvector wave expansion approach,” Ph.D. dissertation, Dept. Electricaland Information Technology, Lund University, Sweden, Feb. 2009.
[4] A. Alexiou, P. S. Kostarakis, V. N. Christofilakis, T. Zervos, A. A.Alexandridis, K. Dangakis, C. Soras, V. V. Petrovic, B. M. Kolundz-ija, and A. R. Dordevic, “Interaction between GSM handset helical an-tenna and user’s head: Theoretical analysis and experimental results,”Environmentalist, vol. 25, no. 2, pp. 215–221, 2005.
[5] P. S. Almers, E. Bonek, A. Burr, N. Czink, M. Debbah, V. Degli-Esposti,H. Hofstetter, P. S. Kyosti, D. Laurenson, G. Matz, A. F. Molisch,C. Oestges, and H. Ozcelik, “Survey of channel and radio propagationmodels for wireless MIMO systems,” EURASIP Journal on WirelessCommunications and Networking, 2007.
[6] J. B. Andersen, “UTD multiple-edge transition zone diffraction,” IEEETrans. Antennas Propagat., vol. 45, pp. 1093–1097, July 1997.
[7] ——, “Antenna arrays in mobile communications: Gain, diversity, andchannel capacity,” IEEE Antennas Propagat. Mag., vol. 42, no. 2, pp.12–16, April 2000.
51

52 Overview of Research Field and Problem Approach
[8] ——, “Array gain and capacity for known random channels with multipleelements at both ends,” IEEE J. Select. Areas Commun., vol. 18, no. 11,pp. 2172–2178, Nov 2000.
[9] H. R. Anderson, “Building corner diffraction measurements and predic-tions using UTD,” IEEE Trans. Antennas Propagat., vol. 46, no. 2, pp.292–293, Feb 1998.
[10] H. Asplund, A. A. Glazunov, A. F. Molisch, K. I. Pedersen, and M. Stein-bauer, “The COST 259 directional channel model-Part II: Macrocells,”IEEE Trans. Wireless Commun., vol. 5, no. 12, pp. 3434–3450, 2006.
[11] C. A. Balanis, Antenna Theory: Analysis and Design, 2nd ed. JohnWiley & Sons, Inc., 1997.
[12] J.-E. Berg, “A macrocell model based on the parabolic diffusion differen-tial equation,” in Proc. Wireless Personal Comm., Virginia Tech, Blacks-burg, VA, USA, June 1994, pp. 131–140.
[13] ——, “A recursive method for street microcell path loss calculations,” inPIMRC’95, vol. 1. IEEE, New York, NY, USA, 1995.
[14] T. Bolin, A. Derneryd, G. Kristensson, V. Plicanic, and Z. Ying, “Two-antenna receive diversity performance in indoor environment,” IEE Elec-tronics Letters, vol. 41, no. 22, pp. 1205–6, Oct 2005.
[15] K. R. Boyle, Y. Yuan, and L. P. S. Ligthart, “Analysis of mobile phoneantenna impedance variations with user proximity,” IEEE Trans. Anten-nas Propagat., vol. 55, no. 2, pp. 364–72, Feb 2007.
[16] D. G. Brennan, “Linear diversity combining techniques,” Proceedings ofthe IRE, vol. 47, no. 6, pp. 1075–1102, 1959.
[17] T. W. C. Brown, S. R. Saunders, S. Stavrou, and M. Fiacco, “Char-acterization of polarization diversity at the mobile,” IEEE Trans. Veh.Technol., vol. 56, no. 5, pp. 2440 –2447, Sept. 2007.
[18] S. K. Cho, Electromagnetic scattering (with 24 illustrations), 1st ed.Springer - Verlag, 1990.
[19] L. M. Correia, Mobile Broadband Multimedia Networks - Techniques,Models and Tools for 4G, L. M. Correia, Ed. Elsevier, Oxford, UK,2006.

References 53
[20] M. Costa, A. Richter, and V. Koivunen, “Unified array manifold de-composition based on spherical harmonics and 2-D fourier basis,” IEEETrans. Signal Processing, vol. 58, no. 9, pp. 4634 –4645, sept. 2010.
[21] T. M. Cover and J. A. Thomas, Elements of information theory (2. ed.).Wiley, 2006.
[22] N. Czink and C. Oestges, “The COST 273 MIMO channel model: Threekinds of clusters,” in IEEE 10th International Symposium on Spread Spec-trum Techniques and Applications (ISSSTA ’08)., Aug. 2008, pp. 282–286.
[23] K. R. Dandekar and R. W. Heath, Jr., “Modeling realistic electromag-netic effects on MIMO system capacity,” IEE Electronics Letters, vol. 38,no. 25, pp. 1624–1625, Dec. 2002.
[24] K. R. Dandekar, G. Xu, and H. Ling, “Computational electromagneticsimulation of smart antenna systems in urban microcellular environ-ments,” IEEE Trans. Veh. Technol., vol. 52, no. 4, pp. 733–742, 2003.
[25] B. A. Davis and G. S. Brown, “Diffraction by a randomly rough knifeedge,” IEEE Trans. Antennas Propagat., vol. 50, no. 12, pp. 1769–1778,Dec 2002.
[26] C. B. Dietrich Jr., K. Dietze, J. R. Nealy, and W. L. Stutzman, “Spa-tial, polarization, and pattern diversity for wireless handheld terminals,”IEEE Trans. Antennas Propagat., vol. 49, no. 9, pp. 1271–1281, Sept2001.
[27] P. S. Eratuuli and E. Bonek, “Diversity arrangements for internal handsetantennas,” in IEEE International Symposium on Personal, Indoor andMobile Radio Communications, PIMRC ’97, vol. 2, Helsinki, Finland,Sept. 1997, pp. 589–593.
[28] L. B. Felsen and N. Marcuvitz, Radiation and scattering of waves, ser.electromagnetic waves. IEEE Press, 1994.
[29] J. A. Fessler and A. O. Hero, “Space-alternating generalized expectation-maximization algorithm,” IEEE Trans. Signal Processing, vol. 42, no. 10,pp. 2664–2677, Oct. 1994.
[30] B. H. Fleury, M. Tschudin, R. Heddergott, D. Dahlhaus, and K. I. Peder-sen, “Channel parameter estimation in mobile radio environments usingthe SAGE algorithm,” IEEE J. Select. Areas Commun., vol. 17, no. 3,pp. 434–450, 1999.

54 Overview of Research Field and Problem Approach
[31] G. J. Foschini and M. J. Gans, “On limits of wireless communications ina fading environment when using multiple antennas,” Wireless PersonalCommunications, vol. 6, no. 3, pp. 311–335, 1998.
[32] J. Friden, “Calculation of antenna radiation center using angular momen-tum,” April 2012, personal communication (to be published).
[33] C. Gabriel, S. Gabriel, and E. Corthout, “The dielectric properties ofbiological tissues. I. Literature survey,” Physics in Medicine and Biology,vol. 41(11), pp. 2231–49, 1996.
[34] J. Guterman, A. Moreira, C. Peixeiro, and Y. Rahmat-Samii, “Wrappedmicrostrip antennas for laptop computers,” IEEE Antennas Propagat.Mag., vol. 51, no. 4, pp. 12 –39, Aug. 2009.
[35] K. Haneda, J.-I. Takada, and T. Kobayashi, “Experimental evaluation ofa SAGE algorithm for ultra wideband channel sounding in an anechoicchamber,” in International Workshop on Ultra Wideband Systems, JointUWBST IWUWBS, Kyoto, Japan, May 2004, pp. 66–70.
[36] ——, “A parametric UWB propagation channel estimation and its per-formance validation in an anechoic chamber,” IEEE Trans. MicrowaveTheory Tech., vol. 54, no. 4, pp. 1802 – 1811, June 2006.
[37] J. Hansen, Ed., Spherical Near-Field Antenna Measurements, ser. IEEelectromagnetic waves series. Peter Peregrinus Ltd., 1998, vol. 26.
[38] F. Harrysson, “A simple directional path loss model for a terminal insidea car,” in IEEE Veh. Technol. Conf. VTC 2003-Fall, vol. 1, Boston, MA,Oct. 2003, pp. 119–122.
[39] F. Harrysson and J.-E. Berg, “Propagation prediction at 2.5 GHz closeto a roof mounted antenna in an urban environment,” in IEEE Veh.Technol. Conf. VTC 2001-Fall, vol. 3, Atlantic City, NJ, Oct. 2001, pp.1261–1263.
[40] F. Harrysson, J. Medbo, A. F. Molisch, A. J. Johansson, and F. Tufves-son, “The composite channel method: Efficient experimental evaluationof a realistic MIMO terminal in the presence of a human body,” in IEEEVeh. Technol. Conf. VTC 2008-Spring, Singapore, May 2008, pp. 473–477.
[41] M. Hata, “Empirical formula for propagation loss in land mobile radioservices,” IEEE Trans. Veh. Technol., vol. 29, no. 3, pp. 317–325, 1980.

References 55
[42] IEEE Std 145-1993, “IEEE standard definition of terms for antennas,”Antenna Standards Committee of the IEEE Antennas and PropagationSociety, IEEE, March 1993.
[43] M. A. Jensen and Y. Rahmat-Samii, “EM interaction of handset antennasand a human in personal communications,” Proc. IEEE, vol. 83, no. 1,pp. 7–17, 1995.
[44] Z. Ji, B.-H. Li, H.-X. Wang, H.-Y. Chen, and T. K. Sarkar, “Efficientray-tracing methods for propagation prediction for indoor wireless com-munications,” IEEE Antennas Propagat. Mag., vol. 43, no. 2, pp. 41–49,April 2001.
[45] J. B. Keller, “Geometrical theory of diffraction,” J. Opt. Soc. Amer.,vol. 52, no. 2, pp. 116–130, Feb 1962.
[46] J. P. Kermoal, L. Schumacher, K. I. Pedersen, P. E. Mogensen, andF. Frederiksen, “A stochastic MIMO radio channel model with experi-mental validation,” IEEE J. Select. Areas Commun., vol. 20, no. 6, pp.1211–1221, Aug. 2002.
[47] R. G. Kouyoumjian and P. S. H. Pathak, “A uniform geometric theoryof diffraction for an edge in a perfectly conducting surface, UTD,” Proc.IEEE, vol. 62, no. 11, pp. 1448–1461, Nov. 1974.
[48] H. Krim and M. Viberg, “Two decades of array signal processing research:the parametric approach,” IEEE Signal Processing Mag., vol. 13, no. 4,pp. 67–94, 1996.
[49] J. Krogerus, C. Icheln, and P. S. Vainikainen, “Dependence of mean effec-tive gain of mobile terminal antennas on side of head,” in 2005 EuropeanMicrowave Conference, Paris, France, Oct. 2005.
[50] P. Kyosti, J. Meinila, L. Hentila, X. Zhao, T. Jamsa, C. Schneider,M. Narandzic, M. Milojevic, A. Hong, J. Ylitalo, V.-M. Holappa,M. Alatossava, R. Bultitude, Y. de Jong, and T. Rautiainen, “WINNERII channel models,” IST-WINNER, Tech. Rep. D1.1.2 V1.1, September2007. [Online]. Available: http://www.ist-winner.org
[51] M. Landmann, M. Kaske, and R. S. Thoma, “Impact of incompleteand inaccurate data models on high resolution parameter estimation inmultidimensional channel sounding,” IEEE Trans. Antennas Propagat.,vol. 60, no. 2, pp. 557 –573, Feb. 2012.

56 Overview of Research Field and Problem Approach
[52] M. Landmann, “Limitations of experimental channel characterisation,”Ph.D. dissertation, TU Ilmenau, Ilmenau, Germany, May 2008.
[53] C.-H. Li, E. Ofli, N. Chavannes, H. U. Cherubini, E. andGerber, andN. Kuster, “Effects of hand phantom and different use patterns on mobilephone antenna radiation performance,” in IEEE Antennas and Propaga-tion Society International Symposium, AP-S 2008, San Diego, CA, July2008.
[54] G. Liang and H. L. Bertoni, “A new approach to 3-D ray tracing for prop-agation prediction in cities,” IEEE Trans. Antennas Propagat., vol. 46,no. 6, pp. 853–863, June 1998.
[55] P. Lindberg, A. Kaikkonen, and B. Kochali, “Body loss measurements ofinternal terminal antennas in talk position using real human operator,”in iWAT, Chiba, Japan, 2008, pp. 358–361.
[56] Y. Liu and I. R. Ciric, “Improved formulas for the diffraction by a wedge,”Radio Science, vol. 28, no. 5, pp. 859–863, Sep.-Oct. 1993.
[57] U. Martin, “Echo estimation-deriving simulation models for the mobileradio channel,” in Vehicular Technology Conference, 1995 IEEE 45th,vol. 1, Chicago, IL, July 1995, pp. 231–235.
[58] P. S. Mattheijssen, M. H. A. J. Herben, G. Dolmans, and L. Leyten,“Antenna-pattern diversity versus space diversity for use at handhelds,”IEEE Trans. Veh. Technol., vol. 53(4), pp. 1035–42, 2004.
[59] D. McNamara, M. Beach, and P. Fletcher, “Spatial correlation in indoorMIMO channels,” in Personal, Indoor and Mobile Radio Communica-tions, 2002. The 13th IEEE International Symposium on, vol. 1, Sept.2002, pp. 290–294.
[60] J. Medbo, J. E. Berg, and F. Harrysson, “Temporal radio channel varia-tions with stationary terminal,” in IEEE Veh. Technol. Conf. VTC 2004-Fall, vol. 1, Los Angeles, CA, Sept. 2004, pp. 91–95.
[61] J. Medbo, F. Harrysson, H. Asplund, and J. E. Berg, “Measurements andanalysis of a MIMO macrocell outdoor-indoor scenario at 1947 MHz,” inIEEE Veh. Technol. Conf. VTC 2004-Spring, vol. 1, Milan, Italy, May2004, pp. 261–265.
[62] J. Medbo, H. Asplund, J.-E. Berg, and N. Jalden, “Directional chan-nel characteristics in elevation and azimuth at an urban macrocell base

References 57
station,” in Antennas and Propagation (EuCAP), Proceedings of the 6thEuropean Conference on, Prague, Czech Republic, March 2012.
[63] J. Medbo and F. Harrysson, “Efficiency and accuracy enhanced superresolved channel estimation,” in Antennas and Propagation (EuCAP),Proceedings of the 6th European Conference on, Prague, Czech Republic,March 2012.
[64] J. Medbo, M. Riback, H. Asplund, and J.-E. Berg, “MIMO channel char-acteristics in a small macrocell measured at 5.25 GHz and 200 MHz band-width,” in IEEE Veh. Technol. Conf. VTC 2005-Fall, vol. 1, Dallas, TX,Sept. 2005, pp. 372–376.
[65] A. F. Molisch, Wireless Communications. Chichester, U.K.: IEEE Press- Wiley, 2005.
[66] A. F. Molisch, H. Asplund, R. Heddergott, M. Steinbauer, and T. Zwick,“The COST 259 directional channel model-Part I: Overview and method-ology,” IEEE Trans. Wireless Commun., vol. 5, no. 12, pp. 3421–3433,2006.
[67] J. Ø. Nielsen, B. Yanakiev, I. B. Bonev, M. Christensen, and G. F. Ped-ersen, “User influence on MIMO channel capacity for handsets in datamode operation,” IEEE Trans. Antennas Propagat., vol. 60, no. 2, pp.633–643, Feb. 2012.
[68] J. Nielsen, “Is the iPhone 4 born with antenna problems?” IDG DenmarkA/S, Hørkær 18, 2730 Herlev, June 2010. [Online]. Available: http://www.comon.dk/nyheder/Er-iPhone-4-foedt-med-antenne-problemer-1.362104.html
[69] J. Ø. Nielsen and G. F. Pedersen, “In-network performance of handheldmobile terminals,” IEEE Trans. Veh. Technol., vol. 55, no. 3, pp. 903–916, May 2006.
[70] J. Ø. Nielsen, G. F. Pedersen, K. Olesen, and I. Z. Kovacs, “Statistics ofmeasured body loss for mobile phones,” IEEE Trans. Antennas Propa-gat., vol. 49, no. 9, pp. 1351–1353, Sept. 2001.
[71] K. Ogawa, A. Yamamoto, and J.-I. Takada, “Multipath performance ofhandset adaptive array antennas in the vicinity of a human operator,”IEEE Trans. Antennas Propagat., vol. 53, no. 8, pp. 2422–2436, 2005.

58 Overview of Research Field and Problem Approach
[72] H. Ozcelik, M. Herdin, W. Weichselberger, J. Wallace, and E. Bonek,“Deficiencies of ’Kronecker’ MIMO radio channel model,” ElectronicsLetters, vol. 39, no. 16, pp. 1209 – 1210, Aug. 2003.
[73] G. F. Pedersen, K. Olesen, and S. L. Larsen, “Bodyloss for handheldphones,” in IEEE Veh. Technol. Conf. VTC 1999-Spring, Houston, TX,May 1999, pp. 1580–1584.
[74] M. Pelosi, O. Franek, M. B. Knudsen, M. Christensen, and G. F. Ped-ersen, “A grip study for talk and data modes in mobile phones,” IEEETrans. Antennas Propagat., vol. 57, no. 4, pp. 856–865, April 2009.
[75] M. Pelosi, O. Franek, M. B. Knudsen, G. F. Pedersen, and J. B. Andersen,“Antenna proximity effects for talk and data modes in mobile phones,”IEEE Antennas Propagat. Mag., vol. 52, no. 3, pp. 15–27, June 2010.
[76] M. Pelosi, G. F. Pedersen, and M. B. Knudsen, “Influence of human handon mobile phone radiation,” COST 2100, Lisbon, Portugal, Tech. Rep.TD (07)036, Feb. 2007.
[77] V. Plicanic, B. K. Lau, A. Derneryd, and Z. Ying, “Actual diversity per-formance of a multiband diversity antenna with hand and head effects,”IEEE Trans. Antennas Propagat., vol. 57, no. 5, pp. 1547–1556, May2009.
[78] J. Poutanen, K. Haneda, L. Liu, C. Oestges, F. Tufvesson, andP. Vainikainen, “Parameterization of the COST 2100 MIMO channelmodel in indoor scenarios,” in Antennas and Propagation (EUCAP), Pro-ceedings of the 5th European Conference on, April 2011, pp. 3606–3610.
[79] A. Richter, D. Hampicke, G. Sommerkorn, and R. S. Thoma, “Joint esti-mation of DoD, time-delay, and DoA for high-resolution channel sound-ing,” in IEEE Veh. Technol. Conf. VTC 2000-Spring, vol. 2, Tokyo,Japan, May 2000, pp. 1045–1049.
[80] ——, “MIMO measurement and joint M-D parameter estimation of mo-bile radio channels,” in IEEE Veh. Technol. Conf. VTC 2001-Spring,vol. 1, Rhodes, Greece, May 2001, pp. 214–218.
[81] A. Richter, “Estimation of radio channel parameters: Models and algo-rithms,” Ph.D. dissertation, TU Ilmenau, Ilmenau, Germany, May 2005.
[82] J.-P. Rossi and Y. Gabillet, “A mixed ray launching/tracing methodfor full 3-D UHF propagation modeling and comparison with wide-band

References 59
measurements,” IEEE Trans. Antennas Propagat., vol. 50, no. 4, pp.517–523, April 2002.
[83] T. M. Schafer and W. Wiesbeck, “Simulation of radiowave propagationin hospitals based on FDTD and ray-optical methods,” IEEE Trans.Antennas Propagat., vol. 53, no. 8, pp. 2381–2388, Aug. 2005.
[84] M. Shafi, M. Zhang, A. L. Moustakas, P. J. Smith, A. F. Molisch,F. Tufvesson, and S. H. Simon, “Polarized MIMO channels in 3-D: mod-els, measurements and mutual information,” IEEE J. Select. Areas Com-mun., vol. 24, no. 3, pp. 514 – 527, March 2006.
[85] A. Sibille, “A small signal analysis of statistical antenna modelling,” inProceedings of the 3rd European Conference on Antennas and Propaga-tion (EuCAP), 2009, March 2009, pp. 2102–2106.
[86] A. Sibille and M. A. Mellah, “A statistical model of handsets effective gainaccounting for user influence and local propagation,” in Proceedings of theFourth European Conference on Antennas and Propagation (EuCAP),2010, April 2010, pp. 1 –4.
[87] K. Sivasondhivat, J.-I. Takada, I. Ida, and Y. Oishi, “Polarimetric Kro-necker separability of site-specific double-directional channel in an urbanmacrocellular environment,” EURASIP Journal on Wireless Communi-cations and Networking, 2009.
[88] M. Steinbauer, A. F. Molisch, and E. Bonek, “The double-directionalradio channel,” IEEE Antennas Propagat. Mag., vol. 43, no. 4, pp. 51–63, Aug. 2001.
[89] P. S. Suvikunnas, K. Sulonen, J. Villanen, C. Icheln, J. Ollikainen, andP. S. Vainikainen, “Evaluation of performance of multi-antenna termi-nals using two approaches,” in IEEE Instrumentation and MeasurementTechnology Conference, IMTC 2004, vol. 2, Lake Como, Italy, May 2004,pp. 1091–1096.
[90] P. S. Suvikunnas, J. Villanen, K. Sulonen, C. Icheln, J. Ollikainen, andP. S. Vainikainen, “Evaluation of the performance of multi-antenna ter-minals using a new approach,” IEEE Trans. Instrum. Meas., vol. 55,no. 5, pp. 1804–1813, Oct. 2006.
[91] I. E. Telatar, “Capacity of multi-antenna gaussian channels,” Euro-pean Transactions on Telecommunications, vol. 10, no. 6, pp. 585–595,Nov/Dec 1999.

60 Overview of Research Field and Problem Approach
[92] R. S. Thoma, D. Hampicke, A. Richter, G. Sommerkorn, A. Schneider,U. Trautwein, and W. Wirnitzer, “Identification of time-variant direc-tional mobile radio channels,” IEEE Trans. Instrum. Meas., vol. 49, no. 2,pp. 357–364, 2000.
[93] J. Toftgard, S. N. Hornsleth, and J. B. Andersen, “Effects on portableantennas of the presence of a person,” IEEE Trans. Antennas Propagat.,vol. 41, no. 6, pp. 739–746, 1993.
[94] N. Tyler, B. Allen, and A. H. Aghvami, “Robust DoA estimation by ex-tension of the SAGE algorithm: algorithm description and trails results,”Microwaves, Antennas and Propagation, IEE Proceedings, vol. 153, no. 6,pp. 568–572, Dec. 2006.
[95] C. Tzaras and S. R. Saunders, “An improved heuristic UTD solution formultiple-edge transition zone diffraction,” IEEE Trans. Antennas Prop-agat., vol. 49, no. 12, pp. 1678–1682, Dec 2001.
[96] R. Valenzuela, “A ray tracing approach to predicting indoor wirelesstransmission,” in Proceedings of 1993 IEEE Vehicular Technology Con-ference (VTC), Secaucus, NJ, May 1993, pp. 214–218.
[97] R. Vaughan and J. B. Andersen, Channels, Propagation and Antennasfor Mobile Communications, IEE Electromagnetic Waves Series, no. 50,London, UK, 2003.
[98] W. Weichselberger, M. Herdin, H. Ozcelik, and E. Bonek, “A stochasticMIMO channel model with joint correlation of both link ends,” IEEETrans. Wireless Commun., vol. 5, no. 1, pp. 90–100, Jan. 2006.
[99] W. Wiesbeck, T. Fugen, M. Porebska, and W. Sorgel, “Channel charac-terization and modeling for MIMO and other recent wireless technolo-gies,” in Proceedings of the European Conference on Antennas and Prop-agation: EuCAP 2006, Nice, France, Nov. 2006.
[100] J. H. Winters, “On the capacity of radio communication systems withdiversity in a rayleigh fading environment,” IEEE J. Select. Areas Com-mun., vol. 5, no. 5, pp. 871–878, June 1987.
[101] A. Yamamoto, T. Hayashi, K. Ogawa, K. Olesen, J. Ø. Nielsen, andG. F. Pedersen, “Cellular MIMO system performance versus base sta-tion element spacing,” in 2008 IEEE Antennas and Propagation SocietyInternational Symposium, Chicago, IL, July 2008, pp. 1–4.

References 61
[102] A. Yamamoto, T. Hayashi, K. Ogawa, K. Olesen, J. Ø. Nielsen, N. Zheng,and G. F. Pedersen, “Outdoor urban propagation experiment of a handsetMIMO antenna with a human phantom located in a browsing stance,” inIEEE Veh. Technol. Conf. VTC 2007-Fall, Baltimore, MD, Sept. 2007,pp. 849–853.
[103] A. Yamamoto, H. Toshiteru, O. Koichi, K. Olesen, J. Ø. Nielsen,N. Zheng, and G. F. Pedersen, “Comparison of phantoms for browsingposition by a NLOS outdoor MIMO propagation test,” in Proceedings ofISAP2007, Niigata, Japan, Aug. 2007, pp. 1342–1345.
[104] B. Yanakiev, J. O. Nielsen, M. Christensen, and G. Frolund Pedersen,“Small device for short-range antenna measurements using optics,” IEEEAntennas Propagat. Mag., vol. 53, no. 6, pp. 148 –152, Dec. 2011.
[105] S. B. Yeap, X. Chen, J. A. Dupuy, C. C. Chiau, and C. G. Parini, “In-tegrated diversity antenna for laptop and PDA terminal in a MIMO sys-tem,” IEE Proc. Microw. Antennas and Propagat., vol. 152, no. 6, pp.495–504, 2005.
[106] Z. Zhang, Z. Yun, and M. F. Iskander, “Ray tracing method for propaga-tion models in wireless communication systems,” IEE Electronics Letters,vol. 49, no. 6, pp. 2350–2358, Nov. 2000.

62 Overview of Research Field and Problem Approach

Part II
Included Research Papers
63

64 Overview of Research Field and Problem Approach


Dual Antenna Terminals in an Indoor
Scenario
Abstract
The performance of two different dual antenna hand-held test mobile terminals has
been investigated in a realistic indoor office environment and scenario, with respect
to antenna performance, diversity combining and Shannon MIMO channel capacity.
Measurements of a 2×2 MIMO channel at 1877.5 MHz (narrowband) were performed
using a dual-polarized base station antenna. Analyses show that diversity gains, using
ideal selection combining and maximum ratio combining, between 0.7 and 4.6 dB was
achieved at the 10% outage probability level. Ideal dual-side beamforming (single
branch) gives up to 3.3 dB capacity gain compared to single antenna systems at SNR
less than 10 dB, however, decreases with rising SNR. Dual branch MIMO capacity
gain is only significant at higher SNR above 10 dB. In addition, horizontal polarization
at the base station was found to outperform vertical polarization in this scenario.
c©2006 IEEE. Reprinted with permission from
F. Harrysson, H. Asplund, M. Riback and A. Derneryd,
“Dual Antenna Terminals in an Indoor Scenario,”
in IEEE Vehicular Technology Conference, VTC 2006-Spring, Melbourne, Australia,
May 2006, pp. 2737–2741.


Dual Antenna Terminals in an Indoor Scenario 69
1 Introduction
Multiple antenna systems at the base station and in the mobile terminal arealready being developed to improve system capacity in mobile communicationsystems. The system gain may either be reached by tackling multipath fad-ing, using antenna diversity (diversity gain), improve link gain using antennabeam-forming (directivity gain) or by taking full advantage of the multipathchannel and increase throughput by spatial multiplexing using parallel prop-agation channels (MIMO). Several investigations have been published dealingwith spatial and/or the polarization properties of multiple antennas in variousindoor scenarios, using dipole antenna arrays or similar at the terminal side,e.g., [1] [2]. Colburn et al. [3] evaluated diversity for a set of realistic dual an-tenna terminal implementations at 900 MHz, but without the influence of users.Recently a strategic approach to combine measured channels with antenna sim-ulations is proposed [4]. However, it is still an important and interesting issue,how to accomplish good multiple antenna performance in practice in a hand-held mobile terminal, taking into account the restrictions on size, the antennaelement design and the influence of the hand and the head of a user.
Addressing this issue, a simple experimental investigation is presented herewhere the performance with respect to diversity and Shannon MIMO capacity(i.e., maximum mutual information) of a couple of test dual-antenna terminalsis evaluated in a realistic propagation environment and user scenario. Theenvironment is a single floor office corridor with rooms at both sides. A dualpolarized (horizontal and vertical) base station sector antenna was placed at theend of the corridor, and a test person was carrying the test terminal, walkingalong the corridor and taking turns into the neighboring office rooms. Themeasurements were set-up for 2x2 forward link MIMO channel measurementsat 1877.5 MHz (narrowband). The experimental results are presented heretogether with analyses of diversity and potential capacity.
2 Test Antennas
At the mobile station (MS) two dual antenna test terminals with the sameground plane size were used. One solution with spatially separated orthogonalλ/4 slot antennas (DSA), and one with two co-located antennas, a bent PIFAtogether with a slot antenna (PSA), see Figure 1. A summary of antenna char-acteristics gathered from laboratory measurement of antenna loss and antennafarfield patterns, together with calculated dual-antenna pattern correlations(over the full sphere), can be found in Table 1. The test antennas were poorlymatched yielding significant reflection losses. This is because the measurement

70 PAPER I
Figure 1: The dual antenna test terminals.
Table 1: Reflection loss and antenna pattern correlation at the frequency1877.5 MHz for the test antennas.
TerminalLoss (dB)
Port 1Loss (dB)
Port 2Loss Diff.|∆1,2|(dB)
Corr.|ρ12|
DSA 2.6 1.5 1.1 0.2PSA 6.6 2.7 3.9 0.4
frequency was chosen somewhat outside the design frequency bands of the ter-minals, in particular in the PSA slot antenna case (Port 1). The DSA terminalantenna pattern cross-correlation is low (0.2), while it is higher (0.4) for thePSA.
3 Measurements
3.1 Measurement Setup
The measurement setup is shown in Figure 2. A dual-polarized (0/90), sectorbase station antenna (BS) with 14 dBi gain and 60 half-power azimuth beam-width, was used at the Tx side. Each of the two BS antenna ports (horizontaland vertical polarization) was fed by a signal generator (SG) with a CW signalat 1877.5 GHz, separated by 500 Hz. At the receiver the antenna ports wereconnected to a vector network analyzer (VNA) with sample frequency set to1600 Hz. The measurement time for each antenna test run was about 200 s.The two signals were separated by windowing in the frequency domain. Duringall measurements the minimum SNR was found to be 29 dB.

Dual Antenna Terminals in an Indoor Scenario 71
BS MSf_0
f_0+500Hz
SG H+V−pol.
SG
H
VNA
PC
Figure 2: The measurement setup.
3.2 Measurement Scenario
The measurements took place at a single floor in an office environment, with acorridor about 40 m long and rooms at both sides, of an Ericsson building inStockholm, Sweden. A test user was gently holding one of the test terminalsat a time, with one hand in two different user modes, data mode and talkmode. With data mode means that the terminal was held in front of the userin a position typical for viewing a terminal screen, e.g., a video call or webbrowsing and with talk mode means that the terminal was held at the rightear a few centimeters from the head, see Figure 3. During the measurements(about 4 minutes each), the test user was walking one turn back and forth alongthe corridor making turns into several rooms that were passed along the way.An additional measurement operator, not entering the rooms but unavoidablyinfluencing the channel, was following a few meters from the test user with atrolley carrying the VNA and the data recording PC.
4 Experimental Results and Analyses
4.1 Channel Matrix
From the four channel measurements of each test terminal the 2x2 channelmatrix H was formed over measured time, as
H(t) =
[hV 1(t) hH1(t)hV 2(t) hH2(t)
](1)

72 PAPER I
(a) Talk mode (b) Data mode
Figure 3: User modes in this investigation.
where the indices represent the horizontal (H) and vertical (V) polarizationports of the BS antenna and the antenna ports numbered 1 and 2 of the MS.The channel data was normalized to unit maximum gain of the BS antenna forboth polarization ports separately, and includes the antenna efficiency of theMS test antennas.
In Figure 4 the sliding average of the measured channel components areshown for the DSA terminal in data mode. In this case the sliding averageis taken by convolution of the complex channel data, i.e., the channel matrixcomponents, over time, with a Kaiser window (Matlab) of width 2 s (3200samples). It is seen that the signal decreases roughly 20 dB as the MS ismoved away from the BS through the office corridor.
4.2 Path Loss
To show the channel behavior the path loss distance dependency is plotted forthe case of a vertical dipole test antenna measurement in Figure 5. The distanceis a rough estimate based on the length of the corridor with no considerationtaken to the turns into the rooms. The dots show the mean over 1600 samplesor 1 sec. In average the path loss follows a distance dependency (L ∼ dn) witha path loss exponent of n = 3, which is typical for NLOS corridor propagation,when the MS antenna is inside office rooms. The lower dips seem to have apath loss exponent around n = 2 which is similar to free-space propagation, oreven less at some locations, which indicate a “wave-guide” effect of the corridor.

Dual Antenna Terminals in an Indoor Scenario 73
0 50 100 150 200−110
−100
−90
−80
−70
−60
−50DSA data mode: Kaiser 4 s
Slid
ing
av. p
ow. [
dB]
Time (s)
V1V2H1H2
Figure 4: Sliding average of the measured channel for the DSA in datamode over 2 s (3200 samples) vs. measured time.
The results are similar to what has been previously found at the same locationat 5 GHz [5].
4.3 Antenna Correlation
The observable signal correlation between adjacent antennas elements in anenvironment may be either the magnitude of the complex correlation coefficientcalculated from the complex channel measurements or the correlation coefficientof the envelope of the channel measurements, i.e., the envelope correlation. Ina Rayleigh channel these two are supposed to be equal. In this investigationwe have chosen to consider only complex channel correlation since this seemsto be the most robust treatment [2]. The complex correlation coefficient ρxybetween two simultaneous measured signal branches x and y, provided by thedual antennas in the terminals, is calculated as
ρxy =σ2xy√σ2xσ
2y
(2)
where σ2xy is the covariance, i.e.,
σ2xy =
1
N − 1
∑n
(xn − µx)(yn − µy) (3)

74 PAPER I
Figure 5: Local average path loss for a test measurement with a verticalλ/2-dipole at the MS, with vertical (triangles) and horizontal (crosses)polarization at the BS.
The mean of the complex correlation coefficients magnitude, |ρ12|, is plotted inFigure 6 as a function of time bin size N . As can be seen, the mean correlationcoefficient approaches about 0.3 for the DSA and 0.8 for the PSA terminal(almost independent of user modes), to be compared to the free space isotropicchannel correlation in Table 1 where the correlation was 0.2 and 0.4 respec-tively. The difference is due to the directional and polarization properties ofthe channel. At time bins shorter than about 2 s the autocorrelaton of themeasurement is apparent and the number of fades to average over diminish.
4.4 Diversity Combining
To investigate potential diversity performance of the two terminal solutions,two common diversity combining techniques are studied,
ISC Ideal selection combining, rc = max(r1, r2)
MRC Maximum ratio combining, rc =√
(r21 + r2
2)
where r1 and r2 are the envelopes (or absolute values) of the channel matrixelements at MS ports 1 and 2, respectively, for either V or H polarizationat the BS. For comparison simultaneous Tx and Rx selection combining (2x2ISC) is also studied where the channel is assumed to be known at all timeat both transmitter and receiver. The results for the DSA and the PSA in

Dual Antenna Terminals in an Indoor Scenario 75
Figure 6: The mean magnitude of the complex correlation coefficientsas a function of time bin.
talk and data mode, are shown in Figure 7 for vertical polarization at the BS.The graphs show the cumulative distribution of the path gain, i.e., the pathloss times the terminal antenna gain. From the graphs the diversity gain andthe path gain difference can be found at a certain system dependent outagelevel (typically 10%). The diversity gain is defined as the ratio between thecombined solution and the strongest branch and the path gain difference is thedifference between the path gain of the two branches. Both theese enteties arein this paper observed at an outage level of 10%.
4.5 Capacity
The theoretical Shannon capacity or maximum mutual information throughputof a MIMO channel is calculated as the sum of the individual capacities of eachparallel channel branch i, with corresponding branch output power providingthe receiver SNR’s Pi, as
C =∑i log2(1 + λiPi) [bits/s/Hz] (4)
where λi is the i:th non-zero eigenvalue of the normalized correlation matrixHHH . The eigenvalues were found as the square of the singular values bysingular value decomposition of the channel matrix
[U, S, V ] = svd(H). (5)

76 PAPER I
−110 −105 −100 −95 −90 −85 −80 −75 −7010
−2
10−1
100
DSA data mode
CD
F
Path gain (dB)
V1V2ISCMRCISC 2x2
−110 −105 −100 −95 −90 −85 −80 −75 −7010
−2
10−1
100
DSA talk mode
CD
F
Path gain (dB)
V1V2ISCMRCISC 2x2
−110 −105 −100 −95 −90 −85 −80 −75 −7010
−2
10−1
100
PSA data mode
CD
F
Path gain (dB)
V1V2ISCMRCISC 2x2
−110 −105 −100 −95 −90 −85 −80 −75 −7010
−2
10−1
100
PSA talk mode
CD
F
Path gain (dB)
V1V2ISCMRCISC 2x2
Figure 7: Path gain distribution for single MS antennas, with MS di-versity (ISC and MRC) and with double sided 2x2 ISC, for vertical BSpolarization. The results for the DSA are shown in the upper graphsand for the PSA in the lower graphs with data mode to the left and talkmode to the right.

Dual Antenna Terminals in an Indoor Scenario 77
where S is a diagonal matrix with the singular values in the diagonal
S = σ1 00 σ2
(6)
The transformation matrices U and V contain the singular vectors which canbe interpreted as the complex antenna steering vectors, i.e., the pair-wise corre-sponding beamforming vectors for each channel branch, for the MS and BS, re-spectively. The cumulative distribution of the eigenvalues is shown in Figure 8.The eigenvalues are calculated for the 2x2 (unnormalized) channel matrix Hformed at each time sample from the four channel measurements. The graphsshow that one branch is overall dominating with between 10-20 dB over thesecond branch.
For a known channel, the maximum capacity is reached by “water filling”,see for example [6], page 651. Each available branch power Pi for a fix averagereceiver SNR, are filled up to a common level D on the parallel channel branchesso that
1
λ1+ P1 =
1
λ2+ P2 = · · · = D (7)
Thus, the best branch receives the largest amount of power. The sum of thepowers Pi is constrained to the average receiver SNR P by∑
i
Pi = P (8)
which gives the common level D as
D =1
N(P +
N∑i
1
λi) (9)
For a branch where 1/λi ≥ D, the corresponding power is set to zero.The channel matrix H was in the capacity analysis, at each time sample,
normalized with the uniform sliding mean of the channel matrix elements foundfor each terminal as
H(n) =H(n)
1W+1
∑n+W/2i=n−W/2
√1
MN ||H(i)||2f(10)
where M,N is the number of ports at the BS and MS (MN = 4), W + 1is the length of the averaging window and ||Hi||f is the Frobenius norm ofH at sample i. The measurement traces were not exactly similar betweenthe terminal measurements so the performance could not be compared to a

78 PAPER I
−110 −105 −100 −95 −90 −85 −80 −75 −7010
−2
10−1
100
Pro
b.λ
< a
bsci
ssa
λ (dB)
λmax
λmin
λmax
+λmin
−110 −105 −100 −95 −90 −85 −80 −75 −7010
−2
10−1
100
Pro
b.λ
< a
bsci
ssa
λ (dB)
λmax
λmin
λmax
+λmin
−110 −105 −100 −95 −90 −85 −80 −75 −7010
−2
10−1
100
Pro
b.λ
< a
bsci
ssa
λ (dB)
λmax
λmin
λmax
+λmin
−110 −105 −100 −95 −90 −85 −80 −75 −7010
−2
10−1
100
Pro
b.λ
< a
bsci
ssa
λ (dB)
λmax
λmin
λmax
+λmin
Figure 8: Cumulative probability distribution of the eigenvalues fordifferent terminal scenarios taken over the whole measurement route.The results for the DSA are shown in the upper graphs and for the PSAin the lower graphs with data mode to the left and talk mode to theright.
Dual Antenna Terminals in an Indoor Scenario 79
common reference which is the preferred choice if true terminal performancesare to be compared. Thus, the difference in mean efficiency of each terminal inthe scenario is omitted in the capacity evaluation.
The mean capacity over the measurement route, for different antenna con-figurations is plotted in Figure 9 as a function of mean receiver SNR. With-out significant lack of precision the channel matrix was resampled with 16 Hz(1600/100) to save simulation time. Thus the sampling rate was 2.4/λ (i.e.,well within the Nyqvist theorem) assuming a measurement speed of 1 m/s.The sliding mean window was set to 1 s, i.e., W = 16.
The circles show a mean over the four possible SISO configurations, V1, V2,H1 and H2. The triangles show the mean capacity over the two 1x2 configura-tions H1H2, V1V2, which is the same as instantaneous MRC or beamformingat the MS. The diamonds show the mean capacity for a full 2x2 antenna con-figuration using only the channel branch with the strongest singular value (i.e.,double-sided MRC or beamforming at the BS and MS), while the crosses showthe mean capacity for full MIMO using water filling.
In Figure 10 the capacity gain over SISO is shown for the same cases as inFigure 9. Similar performance is found for all terminal solutions with a slightlybetter result for the DSA. From this graph it is obvious that the capacity gainusing full MIMO is insignificant, compared to using MRC at both BS and MS,at an SNR level below 10 dB. However, substantial capacity gain is reachedusing 2x2 diversity (assuming a known channel). At high SNR (larger than10 dB) the 2x2 capacity gain narrows down towards the MS diversity case,while full MIMO with two signal chains seems to level off at a gain of almosta factor of 2 (3 dB).
The matrices U and V from (5) contain the singular vectors, i.e., the idealcomplex antenna steering vectors or beamforming vectors for each channelbranch, for the MS and BS, respectively. In Figure 11 the cumulative distribu-tion of the square magnitudes of the corresponding singular vector elements ofthe branch with the strongest singular value, are presented (in linear scale). Inall cases the horizontal polarization port antenna was quite highly dominatingat the BS side. At the MS side, the PSA Port 1 (the slot antenna) was thebest choice, while in the DSA case the difference between the antenna elementsin performance was small. In the DSA case, the Port 1 antenna was slightlythe better one in data mode, and the Port 2 antenna was slightly the betterone in talk mode. The latter could be explained by the 90 tilt of the termi-nal in talk mode, see Figure 3. In this case the Port 2 slot antenna patternis mainly horizontally polarized which matches the BS polarization. In datamode, however, both antennas are almost horizontally oriented. As expectedthe user mode severely influences the performance of a certain antenna solutionat the BS. At the BS the H-polarization seems to be the best choice for the

80 PAPER I
0 5 10 15 200
2
4
6
8
10
12
SNR (dB)
Mea
n ca
paci
ty (
bits
/s/H
z)
DSA data mode
SISOBf@MSBf@BS&MSMIMO
0 5 10 15 200
2
4
6
8
10
12
SNR (dB)
Mea
n ca
paci
ty (
bits
/s/H
z)
DSA talk mode
SISOBf@MSBf@BS&MSMIMO
0 5 10 15 200
2
4
6
8
10
12
SNR (dB)
Mea
n ca
paci
ty (
bits
/s/H
z)
PSA data mode
SISOBf@MSBf@BS&MSMIMO
0 5 10 15 200
2
4
6
8
10
12
SNR (dB)
Mea
n ca
paci
ty (
bits
/s/H
z)
PSA talk mode
SISOBf@MSBf@BS&MSMIMO
Figure 9: Mean Shannon capacity for SISO, MS MRC diversity, singlebranch MIMO, and full MIMO with water filling. The results for theDSA are shown in the upper graphs and for the PSA in the lower graphswith data mode to the left and talk mode to the right.

Dual Antenna Terminals in an Indoor Scenario 81
0 5 10 15 201.2
1.4
1.6
1.8
2
2.2
2.4
2.6
SNR (dB)
Mea
n ca
paci
ty g
ain
(rel
. SIS
O)
DSA data mode
Bf@MSBf@BS&MSMIMO
0 5 10 15 201.2
1.4
1.6
1.8
2
2.2
2.4
2.6
SNR (dB)
Mea
n ca
paci
ty g
ain
(rel
. SIS
O)
DSA talk mode
Bf@MSBf@BS&MSMIMO
0 5 10 15 201.2
1.4
1.6
1.8
2
2.2
2.4
2.6
SNR (dB)
Mea
n ca
paci
ty g
ain
(rel
. SIS
O)
PSA data mode
Bf@MSBf@BS&MSMIMO
0 5 10 15 201.2
1.4
1.6
1.8
2
2.2
2.4
2.6
SNR (dB)
Mea
n ca
paci
ty g
ain
(rel
. SIS
O)
PSA talk mode
Bf@MSBf@BS&MSMIMO
Figure 10: Capacity gain relative the mean SISO capacity. The resultsfor the DSA are shown in the upper graphs and for the PSA in the lowergraphs with data mode to the left and talk mode to the right.

82 PAPER I
0 0.2 0.4 0.6 0.8 10
0.1
0.2
0.3
0.4
0.5
0.6
0.7
0.8
0.9
1
Rel. antenna weight
Pro
b.P
ower
frac
tion
< a
bsci
ssa
DSA data mode
MS port 1MS port 2BS V−pol.BS H−pol.
0 0.2 0.4 0.6 0.8 10
0.1
0.2
0.3
0.4
0.5
0.6
0.7
0.8
0.9
1
Rel. antenna weight
Pro
b.P
ower
frac
tion
< a
bsci
ssa
DSA talk mode
MS port 1MS port 2BS V−pol.BS H−pol.
0 0.2 0.4 0.6 0.8 10
0.1
0.2
0.3
0.4
0.5
0.6
0.7
0.8
0.9
1
Rel. antenna weight
Pro
b.P
ower
frac
tion
< a
bsci
ssa
PSA data mode
MS port 1MS port 2BS V−pol.BS H−pol.
0 0.2 0.4 0.6 0.8 10
0.1
0.2
0.3
0.4
0.5
0.6
0.7
0.8
0.9
1
Rel. antenna weight
Pro
b.P
ower
frac
tion
< a
bsci
ssa
PSA talk mode
MS port 1MS port 2BS V−pol.BS H−pol.
Figure 11: Antenna weight distribution for the MIMO channel branchwith maximum singular value. The results for the DSA are shown in theupper graphs and for the PSA in the lower graphs with data mode tothe left and talk mode to the right.
data user mode, while in talk mode, both H- and V-polarization have almostequal weight probability.
5 Summary and Discussion
Two different dual-antenna test terminals have been evaluated with respectto path gain difference, diversity gain and MIMO capacity in an indoor officescenario with influence of the hand and body of a user. The results are sum-marized in Tab. 2. It can be noticed that the selection diversity gain differsbetween 0.7 and 4.6 dB at 10% outage. With MRC (or singular vector beam-forming) at the MS) the diversity gain differs between 1.9 and 5.9 dB, i.e., an

Dual Antenna Terminals in an Indoor Scenario 83
Table 2: Summary of results for path gain difference (∆), diversity gain andpotential mean capacity gain for 10 dB mean SNR . “Best in class” values aremarked with bold face.
DSA DSA PSA PSAdata talk data talk
∆dB at 10%
0.6-1.3 8.4-10.6 5.8-7.3 3.9-4.0
ISC gaindB at 10%
3.6-4.6 2.3-3.1 0.7-0.8 1.4-1.7
MRC gaindB at 10%
5.0-5.9 3.3-4.2 1.9-2.1 2.9-3.1
Cap. gainMRC@MS
1.7 2.1 1.6 1.4
Cap. gainMRC@BS&MS
2.9 3.3 2.8 2.8
Cap. gainMIMO (wf)
3.2 3.4 2.9 2.8
additional 1.2-1.3 dB.Furthermore, substantial capacity gain can be reached using antenna signal
combining at either the BS or the MS, or even better using MRC at boththe BS and the MS (i.e., the strongest single branch MIMO or best dual-side beamforming). However, MIMO gain using 2x2 parallel channels andwaterfilling is only significant at high SNR (>15 dB). The overall “best inclass” terminal solution was found to be the DSA.
Looking at the graphs of Figure 11, apparently, horizontal polarization isin overall the better choice of a single BS antenna polarization in this scenario.This, however, may depend on the configuration of the antennas on the ter-minal, the antenna elements radiation patterns and the influence of the usershand and head, i.e., the effective radiation pattern. For example, the resultfor the DSA in this case, the one terminal with two antennas that have almostequal performance with respect to the reflection loss and antenna pattern cor-relation (Table 1), is not clear due to the hand holding the terminal that mayinfluence the Port 2 slot severely, i.e., the slot that would couple the most tothe V-polarization of the BS. To be sure about this conclusion, the polarizationcharacteristics of both antennas must be taken into consideration. This maybe an issue for future investigations.

84 PAPER I
6 Conclusions
The results from the investigation presented here pose the following conclusions.
• Dual antennas in a mobile give a diversity gain in average from 0.7 upto 4.6 dB at the 10% outage level in an office scenario. Even thoughantenna signals are strongly correlated (median>0.8 for the PSA) thediversity gain at 10% outage may reach 3 dB (MRC).
• High path gain difference decreases the diversity gain. This is, in additionto the difference in inherent antenna gain, introduced depending on howthe terminal is oriented and positioned (relative the user body and thechannel). In general the minimum path gain difference is found to beclose to the difference in previously measured antenna loss (within lessthan 0.5 dB). From this study, however, the relation between path gaindifference and diversity gain can not be quantified.
• The investigated 2x2 MIMO channel have in average one eigenvalue 10-20 dB stronger than the second eigenvalue. Thus, 2x2 MIMO using bothbranches by water filling add up to 3 dB capacity gain at SNR above10 dB, compared to SISO. At SNR below 10 dB single branch MIMO (ordual side beamforming) is the most effective solution.
• The user mode influences the performance of the terminals tested severely,due to body (hand and head) loss and terminal orientation (or effectiveantenna pattern polarization).
• In the chosen environment, horizontal polarization was found to be thebetter choice of a single BS antenna polarization for all the tested terminalantenna configurations.
Acknowledgment
The authors wish to thank Sony Ericsson Mobile Communications AB, Lund,Sweden, for providing the test terminals.

Dual Antenna Terminals in an Indoor Scenario 85
References
[1] J. P. Kermoal, L. Schumacher, F. Frederiksen, and P. Mogensen, “Experi-mental investigation of the joint spatial and polarisation diversity for MIMOradio channel,” in Proceedings of the 4th International Symposium on Wire-less Personal Multimedia Communications (WPMC), Aalborg, Denmark,Sept. 2001, pp. 147–152.
[2] R. M. Narayanan, K. Atanassov, V. Stoiljkovic, and G. R. Kadambi, “Po-larization diversity measurements and analysis for antenna configurationsat 1800 MHz,” IEEE Trans. Antennas Propagat., Vol. 52(7), pp. 1795–1810,2004.
[3] J. S. Colburn, Y. Rahmat-Samii, M. A. Jensen, and G. J. Pottie, “Eval-uation of personal communications dual-antenna handset diversity perfor-mance,” IEEE Trans. Veh. Technol., Vol. 47(3), pp. 737–746, 1998.
[4] P. Suvikunnas, J. Salo, J. Kivinen, and P. Vainikainen, “Empirical com-parison of MIMO antenna configurations,” IEEE Veh. Technol. Conf. VTC2005-Spring, Stockholm, Sweden, May 2005.
[5] J. Medbo and J.-E. Berg, “Simple and accurate path loss modeling at 5 GHzin indoor environments with corridors,” IEEE Veh. Technol. Conf. VTC2000-Fall, Boston, MA, Sept. 2000.
[6] R. Vaughan and J. Bach Andersen, Channels, Propagation and Antennasfor Mobile Communications, IEE Electromagnetic Waves Series, No. 50,pp. 650–652, 2003.

86 PAPER I


Efficient Experimental Evaluation of a
MIMO Handset with User Influence
Abstract
The immediate environment of handset antennas, including the casings and the users
holding the handsets, has a strong impact on the radio channel in mobile communi-
cation. In this paper we investigate a composite channel method that synthetically
combines double-directional measurements of the user-less propagation channel with
measured super-antenna patterns, i.e., patterns of the combined antenna-casing-user
arrangement. We experimentally evaluate the method by comparing results (power,
capacity, and eigenvalue distribution) obtained from this composite method with di-
rect measurements in the same environment. The measurements were done in two
static 8 × 4 MIMO scenarios at 2.6 GHz, with the user indoors and the base sta-
tion located outdoors and indoors, respectively. A realistic user phantom together
with a “smart-phone” handset mock-up with four antenna elements was used, and
different configurations and orientations were tested. The method gives statistical
distributions of the MIMO eigenvalues, that are close to the measured. By using the
composite method, we found that the user, apart from introducing hand and body
loss that mainly decreases the SNR of the channel, slightly increases the correlation
between the fading at the antenna elements.
c©2010 IEEE. Reprinted with permission from
F. Harrysson, J. Medbo, A. F. Molisch, A. F. Johansson and F. Tufvesson,
“Efficient Experimental Evaluation of a MIMO Handset with User Influence,”
in IEEE Transactions on Wireless Communications, Vol. 9, No. 2, pp. 853-863, Feb.
2010.


Efficient Experimental Evaluation of a MIMO Handset with User ... 91
1 Introduction
User body impact and the choice of antenna configurations in user equipmentsare essential when implementing new mobile communication systems utilizingMIMO (multiple-input multiple-output). However, channel models incorporat-ing the user interaction in a realistic way are rare.
While there is an abundance of MIMO channel measurements (for an overview,see, e.g., [1]) especially in indoor scenarios, those seldom include (and actuallyoften explicitly avoid) the influence of a human being near the antennas. Onthe other hand, measurements of antennas in the presence of human beings areusually restricted to determining quantities such as radiation efficiency, specificabsorption rate, mean effective gain, etc.
In a more detailed empirical channel model, the decision has to be madewhether to include the user in the antenna or in the channel characteriza-tion. If the user is considered a part of the channel, we need to perform newchannel measurements for each user operation configuration. In this paper,we investigate an approach where the user together with the antenna, is con-sidered as one radiating unit or a super-antenna. Thus, the number of userconfigurations only affects the number of superantenna measurements at theantenna test range; whereas the channel is obtained from a single channelsounder measurement (without user), with the results of the measurement rep-resented by the double-directional propagation channel (DDPC), i.e., a sum ofmulti-path components (MPCs); each characterized by its direction-of-arrival(DoA), direction-of-departure (DoD), path delay, and complex amplitude [2].
The method of calculating the channel transfer matrix by combining theDDPC with far-field radiation patterns of both transmit (Tx) and receive (Rx)superantennas, here referred to as a composite channel method (CCM), is basedon two assumptions; (i) the DDPC describes only the multi-path propagationitself and is thus free of any influence of the antennas, and (ii) the user (in-cluding its head, hand, and torso) together with the actual handset (antennasas well as casing) can be interpreted as a superantenna that can be charac-terized by its frequency dependent far-field radiation pattern that weights andadds up the MPCs. Thus, a DDPC measurement can be combined with anysuperantenna pattern measurement to describe the combined effect of channel,user, and antenna. This in particular allows a completely fair and reproduciblecomparison of different antenna arrangements in the chosen propagation en-vironment. Now, the question is to what extent this composite method withthe far-field assumption inherent both in the double-directional tapped delay-line model and in the large aperture superantenna radiation pattern, is valid forMIMO performance prediction, and how much it suffers from the (unavoidable)measurement inaccuracies.

92 PAPER II
Several published papers describe the principle of combining double-directionalchannel characterization with antenna radiation patterns. Molisch et al. [3]used the method with simple antenna arrangements to generate multiple chan-nel realizations; Dandekar et al. [4] used ray tracing and Method-of-Momentsimulations in a similar fashion, and Suvikunnas et al. [5,6] pioneered the com-bination of channel measurements with antenna patterns of realistic handsetantenna configurations and compared the results to direct measurements. Theuse of a directional propagation channel model combined with simulated ormeasured radiation patterns for different mobile terminal antennas and userconfigurations, was found to work well for multi-antenna terminals in talk po-sition beside a phantom head. However, to our knowledge, no work exists thatinvestigates a composite method in the presence of user body as well as hand.A measurement campaign using a realistic upper-body phantom, including thearm and hand, has been presented by Yamamoto et al. [7], where it was shownthat the difference in gain and potential MIMO capacity for a realistic userphantom compared to simplified models were significant. Furthermore, theuser hand and the terminal position inside the hand may have a severe impacton the antenna efficiency, as, e.g., shown by simulations by Li et al. [8] andPelosi et al. [9]. Thus, a realistic user phantom including the hand togetherwith realistic test terminals are important when evaluating potential MIMOperformance.
The goal of the present paper is to investigate to what extent the compos-ite channel method can appropriately account for the presence of the user inrealistic scenarios. The novel contributions of the paper are the following:
1. we test the composite channel model with a body phantom that includeshand and upper torso as well as head.
2. we test the impact of different hand positions on the results.
3. we investigate the influence of different usage positions of the handset(i.e., holding it in browsing mode vs. standard talk mode).
4. we analyze the MIMO capacity as well as eigenvalue distribution anddiversity performance for a four antenna handset in the presence of auser.
The investigation is based on channel measurements in two static scenarios withan upper body phantom and a four-antenna handset mock-up, in the LTE band2.5–2.7 GHz for a synthetic 8x4 MIMO arrangement. Previously, we presentedsome results for the first scenario in a conference paper [10].
The remainder of the paper is organized as follows: Section 2 outlines thebasic principle of the composite method, Section 3 describes the details of the

Efficient Experimental Evaluation of a MIMO Handset with User ... 93
equipment and the test setup, and Section 4 the measurements of the antennapatterns. Section 5 elaborates on the measurement of the propagation channeland the resulting double-directional characterization. Next, the comparisonprocedure between direct measurements and composite results is described inSection 6, with the comparison of eigenvalue distributions as the key experi-mental results of our campaign. Finally, diversity and capacity performanceare investigated in Section 7, and a summary and conclusions in Section 8 wrapup the paper.
2 The Composite Channel Method
2.1 Super-Antenna Characterization
We assume, that the base station (BS) as well as the mobile station (MS)antennas, with or without a user present, can be characterized by their farfieldpatterns, i.e., the far-zone radiating complex vector fields, written as
g(Ω, f) = θgθ(Ω, f) + φgφ(Ω, f) (1)
where Ω = θ, φ is the space angle, f is the frequency and gθ,φ are the complex
field amplitudes with the unit vectors θ and φ defining the polarization. Withthe measurements performed using a common phase reference (at the MS side),the array factors or location vector phase factors e−jk(Ω)·ri of the antennaarray (with antenna element i at location ri) are incorporated in the measuredradiation patterns. Now, the multiple i = 1, 2, · · · , nr antenna field vectorsfor each frequency and DoA (at Rx), gi(Ω, f) = [gθ,i(Ω, f) gφ,i(Ω, f)]T , can bearranged into a 2× nr matrix as
G(Ω, f) =[g1(Ω, f) g2(Ω, f) · · · gnr
(Ω, f)]
(2)
allowing a compact matrix formulation of the channel calculations (see below).The field representation in (1) requires complex interpolation when used incombination with DoAs and DoDs that can take on arbitrary values. A niceway of avoid this interpolation is to expand the measured sample farfield ontospherical vector harmonics or modes as
g(Ω, f) =
Q∑q=1
ψq(f)Ψq(Ω) (3)
where ψq(f) are the complex mode amplitudes, Ψq(θ, φ) are the complex spher-ical vector mode functions, and q is a compound index representing the TE/TM
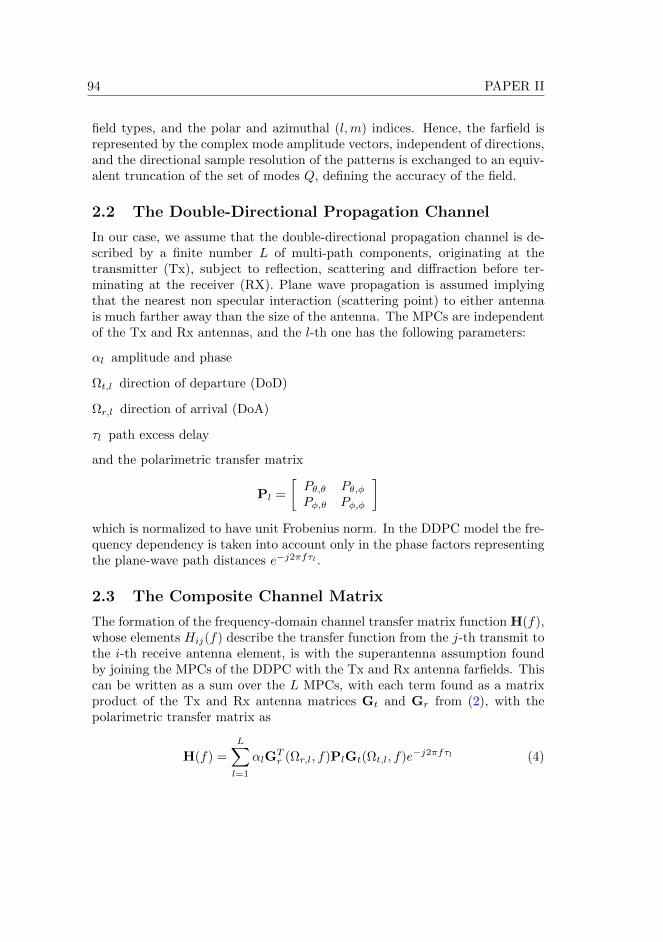
94 PAPER II
field types, and the polar and azimuthal (l,m) indices. Hence, the farfield isrepresented by the complex mode amplitude vectors, independent of directions,and the directional sample resolution of the patterns is exchanged to an equiv-alent truncation of the set of modes Q, defining the accuracy of the field.
2.2 The Double-Directional Propagation Channel
In our case, we assume that the double-directional propagation channel is de-scribed by a finite number L of multi-path components, originating at thetransmitter (Tx), subject to reflection, scattering and diffraction before ter-minating at the receiver (RX). Plane wave propagation is assumed implyingthat the nearest non specular interaction (scattering point) to either antennais much farther away than the size of the antenna. The MPCs are independentof the Tx and Rx antennas, and the l-th one has the following parameters:
αl amplitude and phase
Ωt,l direction of departure (DoD)
Ωr,l direction of arrival (DoA)
τl path excess delay
and the polarimetric transfer matrix
Pl =
[Pθ,θ Pθ,φPφ,θ Pφ,φ
]which is normalized to have unit Frobenius norm. In the DDPC model the fre-quency dependency is taken into account only in the phase factors representingthe plane-wave path distances e−j2πfτl .
2.3 The Composite Channel Matrix
The formation of the frequency-domain channel transfer matrix function H(f),whose elements Hij(f) describe the transfer function from the j-th transmit tothe i-th receive antenna element, is with the superantenna assumption foundby joining the MPCs of the DDPC with the Tx and Rx antenna farfields. Thiscan be written as a sum over the L MPCs, with each term found as a matrixproduct of the Tx and Rx antenna matrices Gt and Gr from (2), with thepolarimetric transfer matrix as
H(f) =
L∑l=1
αlGTr (Ωr,l, f)PlGt(Ωt,l, f)e−j2πfτl (4)

Efficient Experimental Evaluation of a MIMO Handset with User ... 95
where Gt and Gr contain the complex farfield and array location vector phaseterm for each element in the columns, and for the polarization component (θ, φ)in the rows, i.e., 2× nr,t.
2.4 Channel Estimation and Calculation
To be able to compute (4) for a certain test antenna or AUT (antenna undertest), the channel has to be characterized. Using dual polarized probe antennasat the Tx and Rx, with antenna field vectors Gp,t and Gp,r, a channel soundersamples the channel matrix at discrete positions and frequencies within a fre-quency band. Next, a channel estimator extracts the parameters of the MPCsby, e.g., the Maximum Likelihood (ML) method described in [11]. After thisstep, the estimated MPC complex amplitude and polarimetric matrix (in ourcase) include the antenna patterns and gains of the probe antenna elements as
αlPl = αlGTp,r(Ωr,l)PlGp,t(Ωt,l). (5)
This means that when computing the channel transfer matrix for an arbitraryreceive AUT pattern Gaut, the influence of the probe pattern at the MS sideis removed by a multiplication with the inverted probe antenna matrix. Atthe BS side, however, this operation is not necessary in our case since the BSantenna remained unchanged during all measurements. Solving αlPl from (5),and inserting into (4) gives
H(f) =
L∑l=1
αl(G−1p,r(Ωr,l, f)Gaut(Ωr,l, f)
)TPlIte
−j2πfτl
It =[e−jk·rt,1 , e−jk·rt,2 , · · · , e−jk·rt,nt
]⊗ I2×2
(6)
where k is the directional wave number vector and rt is the location vector atTx.
An efficient way of performing the channel computations in (6) is to use thespherical vector mode expansion from (3). Thus, the antenna array patternmatrix (at the receiver) can be written as
Gl(f) = ΨlW(f) (7)
where the antenna array pattern matrix Gl(f) (for each l) is a (2 × nr), themode matrix Ψl is (2×Q), and the array modal coefficient matrix
W(f) = [w1(f),w2(f), · · · ,wnr (f)]
is (Q× nr). Here, the vectors
wi(f) = [ψ1(f), ψ2(f), · · · , ψQ(f)]T

96 PAPER II
represent the modal coefficient vectors for antenna i. Now, using (7) in (6)yields
H(f) =
L∑l=1
αl
(G−1p,l (f)ΨlW(f)
)TPlIt(rt, f)e−j2πfτl
= WT (f)
L∑l=1
αl
(G−1p,l (f)Ψl
)TPlIte
−j2πfτl
= WT (f)M(f)
(8)
The matrix function M(f) is the AUT-independent modal channel transfermatrix function, i.e. the channel matrix related to the spherical vector modesfor a specific propagation channel realization [12]. Now, the calculation of thechannel matrix for a specific AUT is done simply by the last matrix multipli-cation in (8) with the spherical vector mode coefficients. This is a fast andconvenient operation even if the number of AUT’s is large.
3 Test Equipment and Setup
3.1 Handset and User Phantom
The test handset used in the experiments is a 7x11x2 cm3 PDA-type mock-up, (Figure 1 or [10] Fig. 1 with lid open). It is equipped with four planarinverted F-antenna (PIFA) elements, with different placements and orientationson one side of a ground plane (antenna side). During both pattern and channelmeasurements, a semi-conductor switch was used to select the active port, whilethe other antenna ports were terminated by matched loads. The user phantomconsist of two separate parts, a liquid filled upper body phantom (torso andhead) and a solid hand/lower arm phantom1.
3.2 User Operation Modes
Two different user operation situations or modes were investigated, talk modeand browse mode, (Figure 1). Talk mode represents the scenario where the userholds the handset in the right hand, towards the right ear, with the antennaside opposite to the head, whereas browse mode represents the scenario wherethe user hold the handset in the right hand as if to watch the screen. In browsemode the handset was tested both with the antenna side turned downwards
1Head tissue simulant liquid in compliance with IEEE Std. 1528 at 2.6 GHz, with εr = 39.7and σ = 2.14. Hand and lower arm piece from IndexSAR (www.indexsar.com)

Efficient Experimental Evaluation of a MIMO Handset with User ... 97
(a) Talk mode (b) Browse mode
(c) Handset in phantom hand
Figure 1: The user phantom in talk mode and in browse mode, andthe four-antenna handset mock-up at one position inside the phantomhand.

98 PAPER II
and upwards. Furthermore, since the individual performance of the antennaelements may depend strongly on the precise positioning of the handset intothe hand phantom, e.g., due to the finger positions which are hard to reproducewith high accuracy, the measurements were repeated for three positions insidethe hand that are offset 10 mm with respect to each other. The choice ofhand phantom and the placement of the handset was made for availabilityand practical reasons. Recently published rigorous user grip investigations byPelosi et al. [9] support the grip choice in talk mode, while in browse mode thevariability was found to be very large.
4 Antenna Characterization
The radiation patterns and efficiencies of the handset with and without thephantom present in the different user modes, have been measured at two sep-arate occasions, at a Satimo nearfield range. The first occasion was performedin connection to a first publication in [10]. For testing repeatability and tofind possible measurement errors, these measurements have since then beenrepeated at the same measurement range, though it had been recalibrated inthe meantime.
4.1 Radiation Pattern Measurements
In our case the antenna measurement range provided the realized gain 2 whichmeans that the efficiency calculated from the radiation pattern as
η =
∫4π
g(Ω, f) · ndΩ (9)
also includes the loss due to impedance mismatch. A separate measurementof the reflection coefficient (Γ) was done with and without the hand phan-tom present. In the free space case, the four antennas were very similar with20 log |Γ| < −10 dB within 2.53–2.63 GHz, corresponding to an insertion loss(−10 log(1 − |Γ|2)) of less than 0.5 dB. With the hand present, however, themismatch increased significantly with insertion loss up to 2 dB; similar resultswere found for live test persons by Pedersen et al. [13].
The total loss (including the reflection loss, as well as the conduction anddielectric losses of the connector, integrated feed cable, PIFA element, groundplane and casing) was also found to be quite similar in free space for thefour antennas (2.8–3.7 dB) but increased in the presence of the phantom (3.2–10.2 dB). The talk mode case showed the highest loss figures (5.9–10.2 dB),
2IEEE Std 145-1993, “Standard Terms of Antennas”

Efficient Experimental Evaluation of a MIMO Handset with User ... 99
whereas the loss in browse mode with the antennas upwards was lower (3.2–5.9 dB). Hence, the head in talk mode seems to absorb more radiated energythan the body in browse mode. The difference of the loss (mean over handsetantennas and different in-hand positions) to the free space case, was found to be4.8, 3.6 and 1.4 dB, for talk mode, and browse mode with antennas down/up,respectively. The values for talk mode are, again, close to those reported in [13](patch antenna case).
Allowing a rough reasoning the results from above can be used to give anestimate of the actual average body, head and hand losses for this phantom.In browse mode with the antennas turned upwards the handset antennas arealmost free from hand influence (Figure 1) and we can assume that the lossis mainly due to the phantom body, i.e., the body loss is 1.4 dB. With theantennas downwards towards the palm the main loss is the hand loss (with asoft hand/finger touch) estimated as the difference between antenna-up andantenna-down cases, i.e., 3.6−1.4 = 2.2 dB. Now, in a similar manner the headloss may be roughly estimated as the talk case with the hand loss subtracted,i.e., 4.8− 2.2 = 2.6 dB.
It was also found that the efficiencies and thus the realized gains were wellrepeatable between separate antenna range measurements, even with the phan-tom present. The results from the first measurement campaign were in closeagreement with those from the second. The difference in radiation efficiency,averaged over antenna ports, positions and orientations, was found to be about1.4 dB for the phantom measurements. This is mainly due to the additionalfeed cables, which were different during the two measurement campaigns.
Figure 2 shows the realized gain in the horizontal plane at 2.6 GHz, averagedover the four handset antennas in each direction, with and without the phantompresent. The phantom was oriented with the nose pointing towards 90 withthe handset in the right hand. It is obvious how the phantom head and bodyshadow the handset antennas in predictable directions. In the talk mode casethe attenuation is strongest in the direction of the head, i.e., to the left andsomewhat backwards, whereas in the browse cases the attenuation is strongestbackwards towards the body. Typically a shadow loss of up to 10 dB is found,with a -3 dB angular spread of approximately 120 in talk mode, and about60 in browse mode. The average gain is based on the four antenna elements,separate measurement occasions, the three in-hand positions, and the frequencysamples.
4.2 Pattern Correlation
A requirement for antenna diversity and MIMO capacity is that the complexfarfield antenna patterns (including the phase factor due to location of the el-

100 PAPER II
−20
−15
−10
−5
0
−150
−120 −
90
−60
−30
30
60
120
150
180 0
90
Ave
rage
gai
n (d
Bi)
Talk pos. (Free)Talk pos. (Phantom)Browse pos. (Free)Browse pos. (Phantom)
Figure 2: Average realized gain in the horizontal plane for the handsetwith and without (Free) the phantom present in talk mode and browsemode positions.
ements) are not identical. The normalized scalar product of pair-wise farfieldpatterns of the antennas, here referred to as the pattern cross-correlation coef-ficient, is calculated for antenna i and j as
ρij =< gi, gj >√
< gi, gi >< gj , gj >(10)
with
< gi, gj >=
∫4π
gθ,i(Ω)g∗θ,j(Ω) + gφ,i(Ω)g∗φ,j(Ω)
dΩ (11)
or using the spherical vector mode expansions from (7) simply as
ρij = wHi wj (12)
since the mode functions are orthonormal3. The pattern cross-correlation forany two antenna elements of the handset was found to be in average well below0.2 (max 0.4) and below 0.3 (max 0.5) without and with the phantom present,respectively. Here, the user presence increased the pattern correlation (making
3For an isotropic i.i.d. channel with an infinite number of MPCs, the pattern cross-correlation coefficient is also the open circuit correlation coefficient as defined in [14].

Efficient Experimental Evaluation of a MIMO Handset with User ... 101
the patterns less orthogonal). This indicate a possible increase of channelcorrelation and a decrease in diversity or MIMO capacity.
One of the key questions concerning the radiation pattern measurements isto what extent the results are repeatable after a disassembly and reassemblyof the phantom and the handset. Thus, the pattern correlation was calculatedbetween the same antenna elements as measured in the first and second pat-tern measurement campaigns. Ideally, those correlations should be unity, sincethe patterns should not change; deviation from unity indicate loss of repeata-bility w.r.t. the directional properties of the radiation pattern. For the casewithout phantom the correlation was found to be in average 0.87, and between0.68–0.76 for the different phantom modes. The deviation in the case with nophantom present may seem a bit high since this is just a remeasurement ofa simple deterministic antenna structure. The most likely explanation lies inthe bending of the feed cables and perhaps to some extent recalibration of themeasurement range. In the phantom cases the deviation from unity is less sur-prising since there are more uncertain factors, such as exact finger position inthe hand phantom etc. However, at the first measurement occasion, a remea-surement of the phantom pattern before and after a disassembly-reassemblyof the handset in the phantom hand, showed a correlation of 0.85 in averagefor the phantom modes. Thus, we cannot exclude that part of the deviationsin pattern correlation between separate measurement occasions is due to therecalibration of the measurement range.
5 Channel Measurements and Characterization
The RF-cable attenuation is typically about 1 dB/m around 5 GHz, whichrestricts the maximum measurement distance to about 50 m. By use of a lowloss optical fiber equipped with RF-to-opto converters it was possible to extendthe range to more than 300 m. A laptop was used for control Two separatechannel measurement campaigns were performed at an Ericsson office buildingin Kista, Sweden, in the frequency bands 2530–2550 and 2610–2690 MHz:
Scenario 1 A stationary outdoor-to-indoor micro-cell scenario.
Scenario 2 A stationary indoor-to-indoor scenario.
For all combinations of the transmit and receive antenna elements, the complexchannel frequency response was measured with an vector network analyzer(VNA) using RF-opto converters and optical fiber cables [11], at a total of 401equidistant discrete frequencies. In both campaigns the mobile station array(MS) was located at the same position in a lab at the 3rd floor with windows

102 PAPER II
Figure 3: Site map of channel measurements with the BS locations forScenario 1 (BS 1) and Scenario 2 (BS 2), and the common MS location(MS), illustrated with a few (typical) MPCs.
towards the street. The base station (BS) was located in a skywalk crossingabove the street at about 30 m from the MS resembling an outdoor microcellplacement (Scenario 1), and in an indoor placement down the corridor at about13 m distance from the MS (Scenario 2), Figure 3.
To enable MIMO measurements, at the BS location, a linear robot was usedto move a probe antenna to 8 positions with 4 cm separation. The antennawas a vertically polarized square patch antenna, with 9 dBi gain and about60 beamwidth, and its radiation pattern was measured in a similar fashion asthe one described in Section 4. At the MS, two setups were used to enable twodifferent types of measurements.
Firstly, a virtual array channel sounding measurement was performed toenable a double-directional characterization of the channel alone, using a 3Dpositioning robot and a dual-polarized square patch antenna (similar to the BSantenna) at the MS (Figure 3). The robot moved the antenna to form a verticalsynthetic square 8 × 8-array with 4 cm element distance. This was rotated inazimuth in steps of 90 so that all directions were covered.
Secondly, direct measurements of the channel transfer functions were donewith the robot and probe antenna replaced by the (static) 4-antenna terminaland the user phantom. In each setup, the phantom was rotated in azimuth insteps of 90 to four directions. The Tx power was chosen so that the SNR atthe receiver was better than 50 dB, and the measurements were done late in theevening when very few people were present, to minimize time variations of thechannel. However, in the outdoor-indoor campaign time-variant components

Efficient Experimental Evaluation of a MIMO Handset with User ... 103
of the channel due to windswept trees were present. These components weresuppressed by averaging over 10 repeated channel measurements. The resultingaverage ratio of the power in the static components, compared to those in thetime-varying components, was estimated to be 20 dB with a worst case figureof 16 dB. In the second indoor measurement no such problems were observed,but we cannot exclude the possibility that movements from temporary visitorsin neighboring rooms may have caused some interference.
5.1 Directional Channel Estimation
Based on the channel sounding measurements, the plane-wave spectrum formore than 2800 MPCs was resolved, using a successive double-directional max-imum likelihood (ML) estimation method described in [11]. Some example raysfor the two scenarios are illustrated in Figure 3. In the outdoor-indoor scenario(Scenario 1) the azimuth spreading at the BS is divided to two clusters, thestrongest towards the MS location and the other towards the opposite building.For the indoor-indoor case (Scenario 2), the spectral model shows basically asingle cluster seen from the BS in the direction of the corridor towards the MSlocation.
The mean delay and RMS delay spread was 127 ns and 38 ns in Scenario 1,and 74 ns and 21 ns in Scenario 2, respectively, and the related coherence band-width was found to be in average 9 and 14 MHz for 0.5 correlation threshold.The latter means that within the 100 MHz channel bandwidth we have at leastabout 10 independent channels. The azimuthal spread at the BS and MS lo-cations where basically the same in both scenarios (23 and 26 at the BS and51 and 50 at the MS), whereas the elevation spread at the MS location islarger in Scenario 2 (14 vs. 7 in Scenario 1).
5.2 Channel Measurement and Estimation Accuracy
The accuracy of the channel estimate is determined by the channel sounderSNR and other error sources like non-static components in the channel andghost components caused by the fact that the plane wave assumption is notfulfilled. In Figure 4 the power delay profile (averaged squared magnitude ofthe impulse response) of the channel sounder measurements is shown, takenas the average over all channel sounder probe antenna positions of the Fouriertransformed (IFFT and a Hanning filter) channel transfer function over theupper frequency band with 321 samples within 2610–2690 MHz. This is alsoshown for the average over the phantom/handset direct channel measurements(dashed). In both cases the channel sounder SNR is above 50 dB and is not alimiting factor in our investigation. In the channel estimation process, the ML

104 PAPER II
0 50 100 150 200−80
−75
−70
−65
−60
−55
−50
−45
−40
−35
−30
Path distance (m)
Pat
h ga
in (
dB)
Ray model (L=2910)Ray model (L=500)Channel meas.Phantom meas.
Figure 4: Average time response for the channel sounder measurementsand direct measurements (Scenario 1), compared to the estimated multi-path plane-wave model.
estimator was terminated for rays with a path distance of about 220 m and180 m in Scenario 1 and Scenario 2, respectively, giving an accuracy limit ofabout 50 dB.
5.3 Truncation of MPCs and Test of Method for the ProbeAntennas
The accuracy of the channel matrix in (4) depends among all on L, i.e., the num-ber of MPCs used in the model. In our estimation, more than 2800 MPCs whereresolved by the ML method. The sum over all the MPC powers (
∑Ll=1 |αl|2)
accounts for about 96% of the average channel power. This was found from thechannel sounding data using the probe antennas alone. Now, to verify our im-plementation of the CCM from (6) and the channel estimation process, we setup a calculation where we “positioned” the probe antenna (by the phase center)in all the positions corresponding to the channel sounder (synthetic) arrays atboth the BS and MS sides. From this large channel matrix, we simulate a 4×4MIMO system by making a selection of four elements at the BS side (verticalpolarization) and four at the MS side (two vertical and two horizontal).
By looking at the sorted eigenvalue distributions (as described in Sec-tion 6.3, (16)) of these channel matrices and comparing with direct (channelsounder) measurements, we found that the model agreed almost perfectly with

Efficient Experimental Evaluation of a MIMO Handset with User ... 105
the direct measured results for the full L = 2825 model4. With a truncationL = 500 the model accounts for about 87% and 79% of the total energy inScenario 1 and 2, respectively, and in this case the eigenvalue distributions dif-fered about 2 dB at the median of the weakest (fourth) eigenvalue found. Thisshowed that taking into account a very large number of MPCs may actuallyimprove the accuracy of the CCM.
6 Evaluation of the Composite Channel Method
6.1 Average Received Power Magnitudes
The performance of the composite channel method (CCM) is first evaluatedby looking at the average received powers for individual MS antennas. Thisis done by comparing the squared magnitudes of the elements in the syntheticchannel matrix H found using (6), to direct measurements of the channel. Theaverage magnitude for each MS antenna i is taken as the mean w.r.t. BS (Tx)antennas nt, in-hand positions nh, and frequency samples nf as
P avi =1
ntnfnh
nt∑j=1
nf∑k=1
nh∑m=1
|H(m)ij (fk)|2 (13)
assuming ergodicity in frequency and time (i.e., averaging over the ensemble isequivalent to averaging over time- and frequency-samples) [15]. Figure 5 showsreceived power levels at each terminal antenna 1–4 for the three user modes(subplot rows) and the four user rotations (subsequent in each row). The figureshows the result in Scenario 2 for CCM with L = 500 and with the antennameasurement files from the two separate antenna measurement, compared tothe direct measurements. Error bars show the min/max interval for eightlinear handset/phantom λ/2-translations in the channel at the MS location,i.e., the calculations were repeated with the AUT synthetically translated toeight locations. In the calculations the data were compensated for the loss ofenergy due to truncation of MPCs, as well as the measurement cable differences.
In most cases the average received power is well within ±1 dB, which isalso roughly the span of the max/min value error bars. However, there arecases where the discrepancies are up to 3 dB. Also, we notice that especiallyfor the antenna no. 3 in talk mode, there is a large deviation of the first antennameasurement (probably due to a loose antenna connector). Table 1 shows a
4This test was done for the indoor Scenario 2 case where we did not have the problemwith non-static components.

106 PAPER II
1 2 3 4 1 2 3 4 1 2 3 4 1 2 3 4−90
−85
−80
−75
0° 90° 180° 270°
1 2 3 4 1 2 3 4 1 2 3 4 1 2 3 4−90
−85
−80
−75
Pav i
(dB
)
0° 90° 180° 270°
1 2 3 4 1 2 3 4 1 2 3 4 1 2 3 4−90
−85
−80
−75
MS ant. (i) and rotation
0° 90° 180° 270°
CCM1CCM2DM
Browse mode (down)
Browse mode (up)
Talk mode
Figure 5: Average received signal powers of individual antenna elements(in Scenario 2), compared for the first and second radiation patterncalibration (CCM 1 and 2) to direct measurements (DM); at differentuser modes, rotations and antenna elements. The error bars show maxand min of 8 λ/2 MS translations in the channel.
summary of the mean channel matrix gains for directly measured channels andCCM, the differences, and the variance of the model-to-measurement ratio, withthe outlier element no. 3 omitted. The difference (error) was within 0.9 dB,and the variance was within 0.2 dB in all cases.
6.2 Antenna Correlation in Channel
The (receive) antenna correlation matrix, whose entries Ri,j denote the corre-lation between signals at receive antenna ports i and j, can be estimated as themean over frequency samples (again assuming ergodic fading) of the samplecovariance matrix
R =1
nfnt
nf∑k=1
H(fk)HH(fk) (14)
giving the estimated complex correlation coefficient with the proper normal-ization as
ρi,j =Ri,j√RiiRj,j
(15)
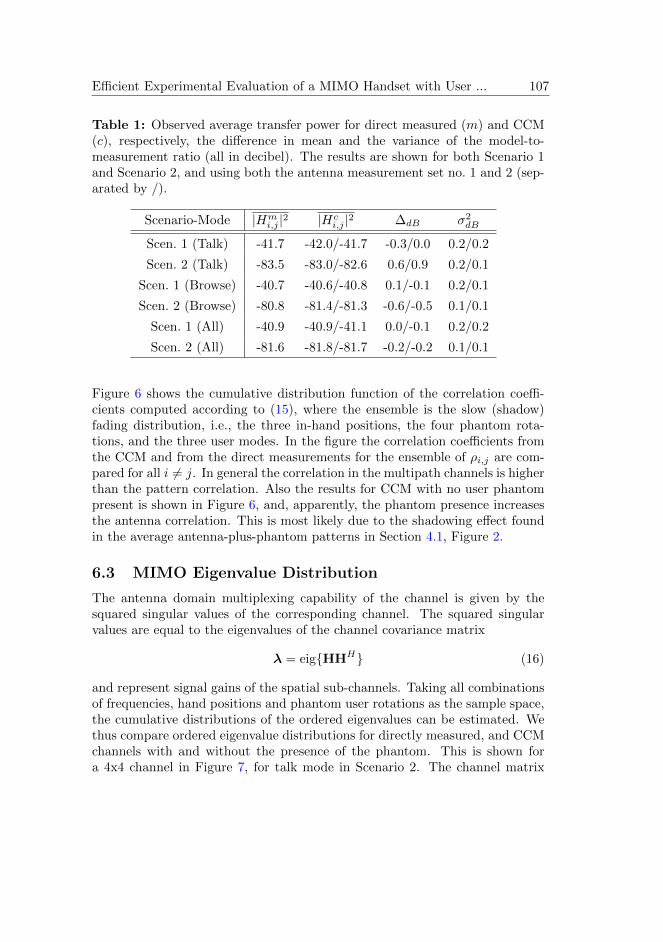
Efficient Experimental Evaluation of a MIMO Handset with User ... 107
Table 1: Observed average transfer power for direct measured (m) and CCM(c), respectively, the difference in mean and the variance of the model-to-measurement ratio (all in decibel). The results are shown for both Scenario 1and Scenario 2, and using both the antenna measurement set no. 1 and 2 (sep-arated by /).
Scenario-Mode |Hmi,j |2 |Hc
i,j |2 ∆dB σ2dB
Scen. 1 (Talk) -41.7 -42.0/-41.7 -0.3/0.0 0.2/0.2
Scen. 2 (Talk) -83.5 -83.0/-82.6 0.6/0.9 0.2/0.1
Scen. 1 (Browse) -40.7 -40.6/-40.8 0.1/-0.1 0.2/0.1
Scen. 2 (Browse) -80.8 -81.4/-81.3 -0.6/-0.5 0.1/0.1
Scen. 1 (All) -40.9 -40.9/-41.1 0.0/-0.1 0.2/0.2
Scen. 2 (All) -81.6 -81.8/-81.7 -0.2/-0.2 0.1/0.1
Figure 6 shows the cumulative distribution function of the correlation coeffi-cients computed according to (15), where the ensemble is the slow (shadow)fading distribution, i.e., the three in-hand positions, the four phantom rota-tions, and the three user modes. In the figure the correlation coefficients fromthe CCM and from the direct measurements for the ensemble of ρi,j are com-pared for all i 6= j. In general the correlation in the multipath channels is higherthan the pattern correlation. Also the results for CCM with no user phantompresent is shown in Figure 6, and, apparently, the phantom presence increasesthe antenna correlation. This is most likely due to the shadowing effect foundin the average antenna-plus-phantom patterns in Section 4.1, Figure 2.
6.3 MIMO Eigenvalue Distribution
The antenna domain multiplexing capability of the channel is given by thesquared singular values of the corresponding channel. The squared singularvalues are equal to the eigenvalues of the channel covariance matrix
λ = eigHHH (16)
and represent signal gains of the spatial sub-channels. Taking all combinationsof frequencies, hand positions and phantom user rotations as the sample space,the cumulative distributions of the ordered eigenvalues can be estimated. Wethus compare ordered eigenvalue distributions for directly measured, and CCMchannels with and without the presence of the phantom. This is shown fora 4x4 channel in Figure 7, for talk mode in Scenario 2. The channel matrix

108 PAPER II
0 0.2 0.4 0.6 0.8 10
0.1
0.2
0.3
0.4
0.5
0.6
0.7
0.8
0.9
1
Correlation
Pro
b. |ρ
ij| < a
bsci
ssa
DMCCMCCM no user
Figure 6: MS antenna correlation coefficient for model (CCM) com-pared to direct measurements (DM) in talk mode, and to the case withno user phantom present (CCM no user).
eigenvalues were normalized to an ergodic “sliding mean”, equal to the squaredFrobenius-norm (‖H‖2F ) averaged over frequency samples. The match betweenDM and CCM is very good, with a median agreement within 1 dB even forthe weakest eigenvalue. In this case the number of MPCs in CCM was set toL = 500.
The influence of the MPC truncation L on the weakest eigenvalue for CCMcompared to the direct measurements is shown in Figure 8. The figure showthe difference (in dB) at the median of the weakest eigenvalue distributionbetween model and measurements, for talk mode and browse mode (with an-tennas downwards) in both scenarios. The model has been compensated forthe truncated power in two different ways; a gain compensation done by nor-malizing the eigenvalues to their sum, and a “diffuse MPCs” compensation byadditive white Gaussian noise (AWGN) as
H′ =PLP0
H +P0 − PLP0
Hw (17)
where, PL is the average power of the channel matrix elements for L MPCs,P0 is for all estimated MPCs, and Hw is a zero mean unit variance complexGaussian matrix. In both cases the eigenvalue difference converge towards zero,but from different sides. The effect is stronger in Scenario 1 than in Scenario 2,with an increasing accuracy up to 1000 MPCs. The compensation methods

Efficient Experimental Evaluation of a MIMO Handset with User ... 109
−40 −35 −30 −25 −20 −15 −10 −5 0 5
0.1
0.2
0.3
0.4
0.5
0.6
0.7
0.8
0.9
1
Pro
b. λ
i < a
bsci
ssa
DMCCMCCM no userIID
λ1
λ4
λ3 λ
2
Figure 7: Ordered eigenvalue distribution of a 4× 4 channel for directmeasured (DM), and CCM with and without phantom in talk mode(Scenario 2). For comparison the distribution for an i.i.d. complexGaussian channel is shown.
seem to work equally good, but still a larger amount of MPCs are requiredfor increased accuracy. In Scenario 2 the models perform with high accuracyalready with 100 estimated MPCs. Nevertheless, an increasing amount of es-timated MPCs seem to improve the accuracy in both cases. This indicatesthat the the truncated low power MPCs can not completely be modeled asAWGN. Furthermore, the ML estimation process was found to perform verywell statistically, even down to -30 dB eigenvalue levels.
7 User Impact on System Performance
Since the CCM seems to work well predicting statistical properties of the MIMOchannel, we now use this tool to extract and evaluate the user impact on systemperformance. Here, we take a look at diversity combining and potential linkcapacity.
7.1 Diversity Combining
From the channel matrices the statistical distributions of the overall signalpowers Pi for individual MS antenna elements and their (receive) diversitycombinations can be evaluated. We investigate the cumulative distribution,

110 PAPER II
101
102
103
−20
−15
−10
−5
0
5
10
15
No. of MPCs (L)
Dev
iatio
n of
λm
in a
t mea
dian
Scen.1 TalkScen.1 BrowseScen.2 TalkScen.2 Browse
Noise filled
Gain compensated
Figure 8: Difference in (weakest) eigenvalue (at the median) vs. numberof MPCs for CCM compared to the direct measurements.
where the statistics are taken over BS antenna positions, phantom rotations,and in-hand positions. Figure 9 shows the impact of maximal-ratio combining(MRC) and hybrid selection/MRC (H-S/MRC) [16] as
any 2MRC Power sum of two random antennas (out of four).
best 2MRC Power sum of the two (fixed) antennas with the strongest averagesignal powers (out of four).
best 2/4MRC Power sum of the two antennas (of four) with the strongestsignal powers at each channel sample.
4MRC Power sum of all four antennas (one receiver per antenna).
The plot shows the results for talk mode in Scenario 2 by using the CCM withL = 500. These results were found to be almost identical to the results foundfrom direct measured matrices (not shown). Results for diversity combiningperformance were found to be almost identical for the two channels and thethree user configurations. It is seen that the top antenna (Ant 1) of the handsetis clearly the best one. This antenna is not obstructed by the phantom handand quite free from the head5. In general (also in browse mode) the top one or
5This is also the most common antenna placement used in todays single antenna mobilephones

Efficient Experimental Evaluation of a MIMO Handset with User ... 111
−110 −105 −100 −95 −90 −85 −80 −75 −7010
−2
10−1
100
Power [dB]
Pro
b. P
i < a
bsci
ssa
Ant 1Ant 2Ant 3Ant 4any 2MRCbest 2MRCbest 2/4 MRC4MRC
.
Figure 9: Rx antenna signal power distributions by CCM of separateantennas and ideal MRC diversity for the talk mode scenario (Scenario 2)
two antennas (relative the phantom), which are less obstructed by the phantom,did perform a few dB’s better than the others. Looking at the diversity gain(defined as the difference between the strongest single antenna branch powerand the combined power at a certain outage level), best 2/4MRC is less than2 dB below 4MRC. This indicates that a clever selection scheme in combinationwith 2MRC has the potential to give high benefits out of four terminal antennaseven if only two radio chains are available in the system [17,18].
From a test of 4MRC diversity with and without the phantom present (us-ing CCM), it was found that the diversity performance was slightly reduced dueto the phantom, both due to antenna mismatch, i.e., reduced efficiency of indi-vidual elements due to the hand, and increased correlation. In talk mode theloss of diversity performance was about 0.7 dB at 1% outage and insignificantin browse mode.
7.2 Capacity
The ergodic capacity of the channel (bits/s/Hz) is the expected value over allrealizations of the channel. Taking the realizations of the channel matrix H asthe samples over frequencies (nf ), hand positions (nh), and the four phantom

112 PAPER II
orientations; the ergodic capacity can be estimated as
C = E
n∑i=1
log2(1 + γiλiPref
)
(18)
where n is the number of sub-channels (max(nt, nr)); each with power alloca-tion γi, and corresponding normalized eigenvalue λi. The normalization factorPref is taken as the mean channel gain calculated as
Pref = E
1
ntnr||H(f)||2F
(19)
(with expectation as in (18)) for the case with no phantom present. Hence, werefer the capacity to the user-free SNR γ with a common reference for all AUT’sso that λi/Pref will reflect the effect of antenna mismatch and absorption loss.Since the factor Pref is a constant for all channel matrix samples, the capacityestimate will also include the user shadowing which is interpreted as “long-term fading”. Figure 10 shows C(γ) for a 4x4 system using the two possiblesets of every second of the eight BS antenna positions. The results are forthe CCM matrix which was found to give almost identical results compared todirect measured matrices, but with the possibility to compare results with andwithout a user present. Notable is the loss in capacity due to the decrease ofSNR when the user is present. At γ=10 dB this is 3–4 bits/s/Hz for browsemode with antennas down, and 1-2 bits/s/Hz with antennas up. This showsthe importance of careful placements of the antennas on a multimedia handset.
8 Conclusions
This paper has two main goals: i) to show the validity of the composite chan-nel method to form MIMO channel models. In particular, the method can beapplied for merging ”user-free” double-directional channel models with farfieldpatterns of large objects such as handsets including a user, together forming asuperantenna. ii) to investigate the user impact on mobile MIMO communi-cation with a realistic channel and multiple-antenna handset setup. The goalshave been achieved by two measurement campaigns, using a realistic upper-body user phantom (including hand and arm) and a realistic handset mock-upwith four antenna elements. A number of different configurations and orien-tations were tested, such as user orientation, talk and browse position, andterminal position in the phantom hand. It must be noted that the super-antenna has much larger dimensions than a conventional handset, and thus

Efficient Experimental Evaluation of a MIMO Handset with User ... 113
−5 0 5 10 15 200
5
10
15
20
25
SNR (dB)
Erg
odic
cap
acity
(bi
ts/s
/Hz)
IIDNo user (Talk)No user (Browse down)No user (Browse up)TalkBrowse (down)Browse (up)
Figure 10: Ergodic capacity for a 4 × 4 system, with waterfilling forScenario 2. Results with and without phantom present are shown forthe three user modes.
a larger Rayleigh (or Fraunhofer) distance. As a consequence, the vital as-sumption that all MPCs are originating from objects in the farfield might notalways be fulfilled. The differences between the model and measurements forthe strongest eigenvalue is well within 1 dB, which is similar to or better thanother results presented in the literature. Not surprisingly, weaker eigenvaluesshow a larger deviation between composite method and direct measurements;but even for the weakest eigenvalue at levels 30 dB below the strongest, thediscrepancy is less than 2–3 dB, depending on the number of MPCs used. Thus,we conclude that the composite approach seems to be a highly valuable and ac-curate tool for the evaluation of multiple-antenna configurations, even indoorsand in the presence of user head, torso, and hand.
The most important effect of the user is the efficiency loss due to the ab-sorption of the hand and head/body, as well as the impedance mismatch lossdue to the hand close to the antennas. It is found that the total average lossis between 1.4–4.8 dB depending on user operation and the antenna positions,compared to a free space handset. In an attempt to separate the effects, wefound that the “hand influence” accounted for a loss in average of about 2.2 dBif the antennas were located towards the palm. Bear in mind that the handphantom used together with the PDA-type handset only accounts for a softtouch of the device at the edges. A much larger efficiency loss is expected if the
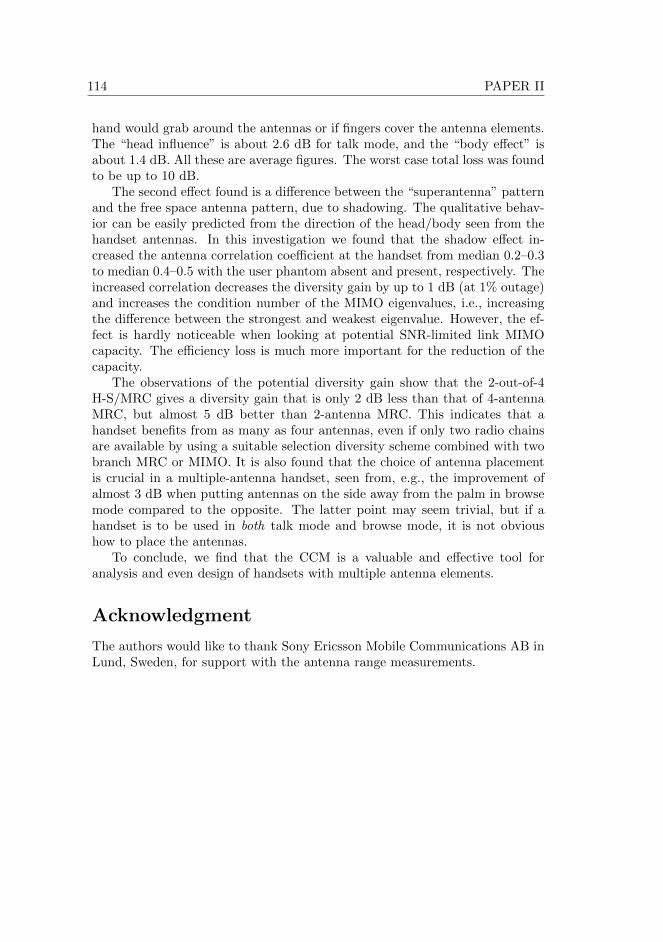
114 PAPER II
hand would grab around the antennas or if fingers cover the antenna elements.The “head influence” is about 2.6 dB for talk mode, and the “body effect” isabout 1.4 dB. All these are average figures. The worst case total loss was foundto be up to 10 dB.
The second effect found is a difference between the “superantenna” patternand the free space antenna pattern, due to shadowing. The qualitative behav-ior can be easily predicted from the direction of the head/body seen from thehandset antennas. In this investigation we found that the shadow effect in-creased the antenna correlation coefficient at the handset from median 0.2–0.3to median 0.4–0.5 with the user phantom absent and present, respectively. Theincreased correlation decreases the diversity gain by up to 1 dB (at 1% outage)and increases the condition number of the MIMO eigenvalues, i.e., increasingthe difference between the strongest and weakest eigenvalue. However, the ef-fect is hardly noticeable when looking at potential SNR-limited link MIMOcapacity. The efficiency loss is much more important for the reduction of thecapacity.
The observations of the potential diversity gain show that the 2-out-of-4H-S/MRC gives a diversity gain that is only 2 dB less than that of 4-antennaMRC, but almost 5 dB better than 2-antenna MRC. This indicates that ahandset benefits from as many as four antennas, even if only two radio chainsare available by using a suitable selection diversity scheme combined with twobranch MRC or MIMO. It is also found that the choice of antenna placementis crucial in a multiple-antenna handset, seen from, e.g., the improvement ofalmost 3 dB when putting antennas on the side away from the palm in browsemode compared to the opposite. The latter point may seem trivial, but if ahandset is to be used in both talk mode and browse mode, it is not obvioushow to place the antennas.
To conclude, we find that the CCM is a valuable and effective tool foranalysis and even design of handsets with multiple antenna elements.
Acknowledgment
The authors would like to thank Sony Ericsson Mobile Communications AB inLund, Sweden, for support with the antenna range measurements.

Efficient Experimental Evaluation of a MIMO Handset with User ... 115
References
[1] A. F. Molisch and F. Tufvesson, “Multipath propagation models for broad-band wireless systems,” in Digital Signal Processing for Wireless Communi-cations Handbook, M. Ibnkahla, Ed. CRC Press, 2004, ch. 2, pp. 2.1–2.43.
[2] M. Steinbauer, A. F. Molisch, and E. Bonek, “The double-directional radiochannel,” IEEE Antennas Propagat. Mag., vol. 43, no. 4, pp. 51–63, 2001.
[3] A. F. Molisch, M. Steinbauer, M. Toeltsch, E. Bonek, and R. S. Thoma,“Capacity of MIMO systems based on measured wireless channels,” IEEEJ. Select. Areas Commun., vol. 20, no. 3, pp. 561–569, 2002.
[4] K. R. Dandekar and R. W. Heath, Jr., “Modelling realistic electromagneticeffects on MIMO system capacity,” IEE Electronics Letters, vol. 38, no. 25,pp. 1624–1625, 2002.
[5] P. Suvikunnas, K. Sulonen, J. Villanen, C. Icheln, J. Ollikainen, andP. Vainikainen, “Evaluation of performance of multi-antenna terminals us-ing two approaches,” in IEEE Instrumentation and Measurement Tech-nology Conference, IMTC 2004, vol. 2, Lake Como, Italy, May 2004, pp.1091–1096.
[6] P. Suvikunnas, J. Villanen, K. Sulonen, C. Icheln, J. Ollikainen, andP. Vainikainen, “Evaluation of the performance of multiantenna terminalsusing a new approach,” IEEE Trans. Instrum. Meas., vol. 55, no. 5, pp.1804–1813, 2006.
[7] A. Yamamoto, H. Toshiteru, O. Koichi, K. Olesen, J. Ø. Nielsen, N. Zheng,and G. F. Pedersen, “Comparison of phantoms for browsing position bya NLOS outdoor MIMO propagation test,” in Proceedings of ISAP2007,Niigata, Japan, 2007, pp. 1342–1345.
[8] C.-H. Li, E. Ofli, N. Chavannes, E. Cherubini, H. Gerber, and N. Kuster,“Effects of hand phantom and different use patterns on mobile phone an-tenna radiation performance,” in IEEE Antennas and Propagation SocietyInternational Symposium, AP-S 2008, San Diego, CA, July 2008.
[9] M. Pelosi, O. Franek, M. Knudsen, M. Christensen, and G. F. Pedersen,“A grip study for talk and data modes in mobile phones,” IEEE Trans.Antennas Propagat., vol. 57, no. 4, pp. 856–865, 2009.
[10] F. Harrysson, J. Medbo, A. F. Molisch, A. J. Johansson, and F. Tufvesson,“The composite channel method: Efficient experimental evaluation of a

116 PAPER II
realistic MIMO terminal in the presence of a human body,” in IEEE Veh.Technol. Conf. VTC 2008-Spring, Singapore, May 2008, pp. 473–477.
[11] J. Medbo, M. Riback, H. Asplund, and J.-E. Berg, “MIMO channel char-acteristics in a small macrocell measured at 5.25 GHz and 200 MHz band-width,” in IEEE Veh. Technol. Conf. VTC 2005-Fall, Dallas, TX, Sept.2005, pp. 372–376.
[12] A. Alayon Glazunov, “On the antenna-channel interactions: A sphericalvector wave expansion approach,” Ph.D. dissertation, Dept. Electrical andInformation Technology, Lund University, Sweden, 2009.
[13] G. F. Pedersen, K. Olesen, and S. L. Larsen, “Bodyloss for handheldphones,” in IEEE Veh. Technol. Conf. VTC 1999-Spring, Houston, TX,May 1999, pp. 1580–1584.
[14] R. G. Vaughan and J. B. Andersen, “Antenna diversity in mobile commu-nications,” IEEE Trans. Veh. Technol., vol. 36, no. 4, pp. 149–172, 1987.
[15] R. Kattenbach, “Characterization of time-variant indoor radio channelsby means of their system and correlation functions,” Ph.D. dissertation,Univ. GhK Kassel, Shaker Verlag, Aachen, Germany, 1997, (in German).
[16] M. Z. Win and J. H. Winters, “Analysis of hybrid selection/maximal-ratiocombining in rayleigh fading,” IEEE Trans. Commun., vol. 47, no. 12, pp.1773–1776, 1999.
[17] A. F. Molisch and M. Z. Win, “MIMO systems with antenna selection,”IEEE Microwave, vol. 5, no. 1, pp. 46–56, 2004.
[18] P. Almers, T. Santos, F. Tufvesson, A. F. Molisch, J. Karedal, and A. J.Johansson, “Antenna subset selection in measured indoor channels,” IETMicrowaves, Antennas & Propagation, vol. 1, no. 5, pp. 1092–1100, 2007.


Evaluation of User Hand and Body
Impact on Multiple Antenna Handset
Performance
Abstract
We evaluate the user impact on antenna performance based on measurements using
a realistic setup with a full (one-armed) upper body user phantom in combination
with a four antenna PDA mock-up handset in realistic indoor office environment.
We utilize an approach where the radiation pattern of the user together with the an-
tenna, is considered as one radiating unit, and evaluate the performance impact of the
user body and hand on such properties as the antenna efficiency, diversity combining
approaches, and potential MIMO (multiple-input multiple-output) channel perfor-
mance. From our investigation it is found that apart from the important efficiency
loss due to the user hand, the mutual efficiency impact on the antenna elements and
the directional impact of the user body shadowing have quite small influence on the
diversity and capacity performance. We also find that the top and bottom placements
of antennas are the most efficient to be used with up to two antenna elements. How-
ever, there are significant diversity and capacity gain that can be explored by using
four distributed antennas even if only two radio chains are available through hybrid
selection and combining schemes.
c©2010 IEEE. Reprinted (with corrections of Figure 2 and 4) with permission from
F. Harrysson, A. Derneryd and F. Tufvesson,
“Evaluation of User Hand and Body Impact on Multiple Antenna Handset Perfor-
mance,”
in IEEE Antennas and Propagation Symposium, AP-S 2011, Toronto, Canada, July
2010.


Evaluation of User Hand and Body Impact on Multiple Antenna ... 121
1 Introduction
The impact of the user in mobile communication systems may strongly affectthe design and placements of antennas on terminals, as well as performanceand reliability of system simulations, when utilizing multiple antenna tech-niques such as diversity and MIMO (multiple-input multiple-output). In thispaper we evaluate the user impact on antenna performance based on measure-ments using a realistic setup with a full (one-armed) upper body user phantomin combination with a four antenna handset mock-up in a realistic indoor of-fice environment at 2.5-2.7 GHz. We utilize an approach where the radiationpattern of the user together with the antenna is considered as one radiatingunit, and evaluate the performance impact of the user body and hand of suchproperties as antenna efficiency, diversity combining approaches, and poten-tial MIMO channel performance. In combination with radiation pattern mea-surements, the handset-plus-phantom radiation patterns are combined with aDDPC (double-directional propagation channel) representation of measured in-door channels by utilizing a composite channel method as described in [1, 2].Previously the impact of the user in the mobile radio channel has been ana-lyzed, e.g., by Yamamoto et al. [3] who showed by channel measurements thatthe impact of a realistic user phantom compared to simplified models may notbe negligible in evaluation of diversity and MIMO capacity. Li et al. [4] andPelosi et al. [5] showed that the user hand and the terminal position inside thehand may have a severe impact on the antenna efficiency.
2 Handset and User Phantom Setup
In the experiments we use a handset mock-up (7x11x2 cm3) with four planarinverted F-antenna (PIFA) elements placed at the edges on one side of a groundplane. During both radiation pattern and channel measurements, a switch wasused to select the active port, while the other antenna ports were terminated bymatched loads. The user phantom consists of two separate parts, a liquid filledupper body phantom (torso and head) and a solid hand/lower arm phantom.Two different user operation situations or modes were investigated, talk modeand browse mode. Talk mode represents the scenario where the user holdsthe handset in the right hand, towards the right ear, with the antenna sideopposite to the head; browse mode represents the scenario where the userholds the handset in the right hand as if to watch the screen. In browsemode the handset was tested both with the antenna side turned downwardsand upwards. Furthermore, since the individual performance of the antennaelements may depend strongly on the precise positioning of the handset into

122 PAPER III
(a) Talk mode (b) Browse mode (down)
(c) Browse mode (up)
Figure 1: The average excess efficiency loss due to the user phantomfor individual antenna elements (1-4 bars) at the three positions insidethe phantom hand for talk mode (a), and browse mode with antennasdown (b) and up (c).
the hand phantom due to finger positions, the measurements were repeatedfor three positions inside the hand that are offset 10 mm with respect to eachother. For further details and pictures on handset, phantom and measurements,see [1, 2].
3 User Impact on Radiation Efficiency and Pat-tern
Radiation efficiency is undoubtly the most important feature of antennas forhandheld mobile devices directly affecting the link budget and, hence, the bat-

Evaluation of User Hand and Body Impact on Multiple Antenna ... 123
tery power consumption. For our handset mock-up the radiation efficiency ofthe four individual antenna elements in free space (no user phantom present)is within (−3.1± 0.4 dB). When placed in the hand of the phantom, however,the efficiency is reduced due to reflection (impedance mismatch) and absorp-tion. This excess loss averaged over the frequency band 2.5-2.7 GHz is shownin Figure 1 for the three user configurations and the three hand positions. Wefind that both the user mode and the hand positions significantly affect theindividual efficiencies of the antenna elements, so that the performance of oneelement compared to the other is changing. This effect is most significant whenthe handset is turned over in browse mode, i.e., compare graphs b and c. How-ever, despite these differences, in our case antennas no. 1 and no. 3 seem toretain the best overall efficiency.
The individual radiation efficiency of the antennas depends on the handsetplacement in the hand. In Figure 2 the directional properties of the azimuthalradiation pattern is shown. The antenna gain is averaged over the used fre-quency band for handset antenna no. 1, in free space and in the presence ofthe phantom for the three hand positions. The directivity of the radiationpattern show low dependency on the hand positions and the gain difference isdue to the efficiency impact. However, evidently is the shadowing effect of thephantom, showing as an absorbing sector towards about −160 in talk modeand towards −90 in browse mode (phantom nose points towards 90 with thehandset at the right ear (talk) and in front of body (browse).
4 Diversity and MIMO Capacity Performance
From the channel matrices found by the combination of measured radiationpatterns with the estimated DDPC based on the indoor channel sounder mea-surements, the statistical distributions of the individual signal powers Pi of thehandset antennas and their (receive) diversity combinations are evaluated. Weinvestigate the cumulative distribution, where the statistics are taken over fre-quency samples (utilizing the ergodic assumption that the small-scale fading isstatistically similar over frequency and small-scale movement in the channel),simulated small-scale phantom translations, phantom rotations, base stationside antenna locations, and in-hand offset positions. Figure 3 shows the im-pact of maximal-ratio combining (MRC) and hybrid selection/MRC [6] foundas the power sum of: two random antennas (any 2MRC), two antennas withthe strongest overall average signal powers (best 2MRC), two antennas of fourwith the strongest signal powers at each channel sample (best 2/4MRC), andall four antennas (4MRC). We note that the user presence does decrease thepath gain but does not change the diversity peformance significantly, other

124 PAPER III
(a) Talk mode (b) Browse mode (down)
(c) Browse mode (up)
Figure 2: Average antenna gain pattern for handset (antenna no. 1) infree space (dashed) and for the three positions inside the phantom hand(solid), in talk mode, browse mode with antennas downwards, and withantennas upwards.
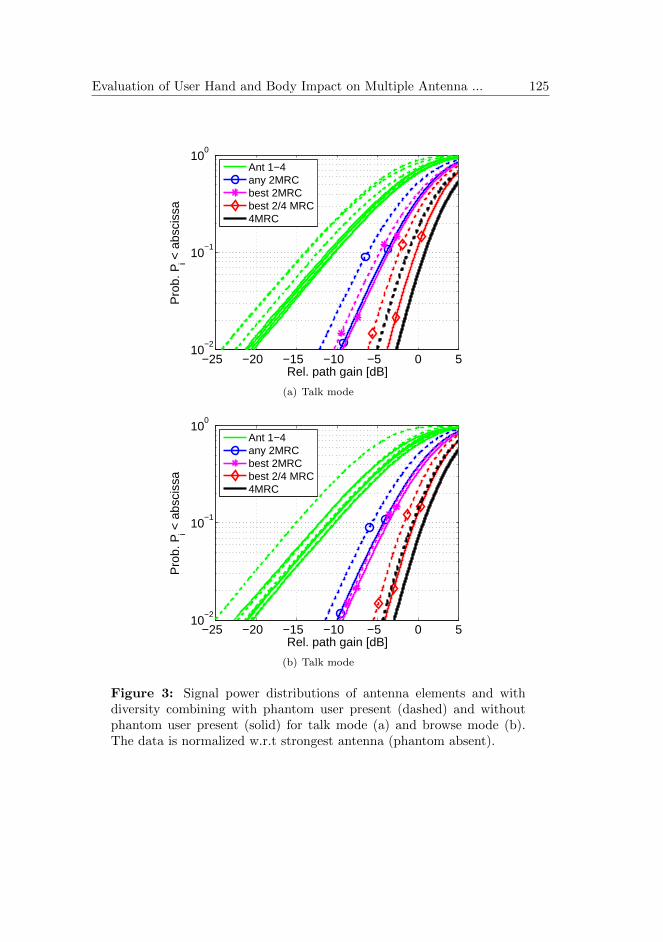
Evaluation of User Hand and Body Impact on Multiple Antenna ... 125
−25 −20 −15 −10 −5 0 510
−2
10−1
100
Rel. path gain [dB]
Pro
b. P
i < a
bsci
ssa
Ant 1−4any 2MRCbest 2MRCbest 2/4 MRC4MRC
(a) Talk mode
−25 −20 −15 −10 −5 0 510
−2
10−1
100
Rel. path gain [dB]
Pro
b. P
i < a
bsci
ssa
Ant 1−4any 2MRCbest 2MRCbest 2/4 MRC4MRC
(b) Talk mode
Figure 3: Signal power distributions of antenna elements and withdiversity combining with phantom user present (dashed) and withoutphantom user present (solid) for talk mode (a) and browse mode (b).The data is normalized w.r.t strongest antenna (phantom absent).

126 PAPER III
than in choosing the two best antennas. We also see the great benefit of fourdiversity antennas even if there is only two radio chains in the handset. Thehybrid method (best 2/4MRC) increases diversity gain with about 6 dB (at1% outage) compared to two antenna methods and is only about 1 dB belowfull 4MRC. Regarding performance with respect to MIMO capacity (spectralefficiency) as seen in Figure 4 similar conclusions about the user influence andsub-array selection methods as for diversity combining can be made. The pres-ence of the user seems to increase path loss only, making SNR decrease. In thefigure the channel matrices are normalized to the case with the phantom userabsent (free space handset) so the difference in capacity is mainly due to theloss in SNR due to the user. We also find that hybrid 2x4 MIMO methods uti-lizing switching of 4 antennas for only 2 radio chains may significantly improvecapacity compared to fix 2 antenna (2x4) systems. We find that the choiceof antenna pairs based on strongest SNR (pow 2/4x4) performs very closelyto the optimal choice based on capacity (best 2/4x4), which agrees with theresults in [7].
5 Conclusions
From our experimental investigation of multiple-antenna performance and userimpact of a realistic mobile terminal setup, we find that apart from the im-portant loss of efficiency due to the user hand, the impact on the individualantennna elements and the directional impact of the user body shadowing havequite small influence on the diversity and capacity performance. It is foundthat the top and bottom placement of antennas within the handset case arethe most efficient to be used with up to two antenna elements. There are,however, significant diversity and capacity gain that can be explored by usingfour distributed antennas even if only two radio chains are available throughhybrid selection and combining schemes. It was also found that the practicalmethod of choosing antennas based on signal power for 2 branch MIMO with4 available handset antennas, performs well compared to the optimal solution.

Evaluation of User Hand and Body Impact on Multiple Antenna ... 127
0 5 10 15 200
5
10
15
20
SNR (dB)
Erg
od
ic c
ap
acity (
bits/s
/Hz)
4x4
Mean 2x4
Best 2x4Pow. 2/4x4
Best 2/4x4
Mean 1x4
0 5 10 150
0.2
0.4
0.6
0.8
1
Rate (bps/Hz)
Pro
b. capacity <
abscis
sa
4x4
Mean 2x4
Best 2x4
Pow. 2/4x4
Best 2/4x4
Mean 1x4
Figure 4: Ergodic capacity vs. SNR (top) and outage capacity distribu-tion (bottom) at SNR=10dB for different MIMO systems with (dashed)and without (solid) user phantom present.

128 PAPER III
References
[1] F. Harrysson, J. Medbo, A. F. Molisch, A. J. Johansson, and F. Tufvesson,“The composite channel method: Efficient experimental evaluation of arealistic MIMO terminal in the presence of a human body,” in IEEE Veh.Technol. Conf. VTC 2008-Spring, Singapore, May, 2008, pp. 473–477.
[2] F. Harrysson, J. Medbo, A. F. Molisch, A. J. Johansson, and F. Tufvesson,“Efficient experimental evaluation of a MIMO handset with user influence,”IEEE Trans. Wireless Commun., vol. 9, no. 2, pp. 853–863, May 2010.
[3] A. Yamamoto, H. Toshiteru, O. Koichi, K. Olesen, J. Ø. Nielsen, N. Zheng,and G. F. Pedersen, “Comparison of phantoms for browsing position bya NLOS outdoor MIMO propagation test,” in Proceedings of ISAP2007,(Niigata, Japan), pp. 1342–1345, 2007.
[4] C.-H. Li, E. Ofli, N. Chavannes, E. Cherubini, H. Gerber, and N. Kuster,“Effects of hand phantom and different use patterns on mobile phone an-tenna radiation performance,” in IEEE Antennas and Propagation SocietyInternational Symposium, AP-S 2008, (San Diego, CA), July 2008.
[5] M. Pelosi, O. Franek, M. Knudsen, M. Christensen, and G. F. Pedersen,“A grip study for talk and data modes in mobile phones,” IEEE Trans.Antennas Propagat., vol. 57, pp. 856–865, Apr. 2009.
[6] M. Z. Win and J. H. Winters, “Analysis of hybrid selection/maximal-ratiocombining in Rayleigh fading,” IEEE Trans. Commun., vol. 47, pp. 1773–1776, Dec. 1999.
[7] A. F. Molisch, M. Z. Win, Y.-S. Choi, and J. H. Winters, “Capacity ofMIMO systems with antenna selection,” IEEE Trans. Wireless Commun.,vol. 4, no. 4, pp. 1759–1772, 2005.


Evaluation of an Outdoor-to-In-Car
Radio Channel with a Four-Antenna
Handset and a User Phantom
Abstract
Based on static outdoor channel measurements we evaluate the influence of a vehicle
on the MIMO radio channel, from a base station antenna array, to a multiple antenna
handset in the hand of a user placed inside a test car. The measurement scenario is
chosen to mimic a 2.6 GHz (LTE) macro-cell urban or rural scenario with two loca-
tions and orientations of the car, one at an open parking lot with a strong line-of-sight
component, and one between buildings with no line-of-sight. The measurements are
repeated several times with the user phantom plus handset positioned at the same
spot within the car and with the car absent. Figures of the penetration loss, impact
on fading statistics, mean delay, delay spread, terminal antenna correlation, eigen-
value distributions, as well as the performance of various hybrid diversity combining
and spatial multiplexing schemes, are evaluated and compared with and without the
vehicle present. It is found that the car make the channel statistics become more
Rayleigh like and increases multipath channel richness, improving the potential of
diversity gain and, to some extent, spatial multiplexing.
c©2011 IEEE. Reprinted (with corrections of Section 4, Figure 4, and Table 1) with
permission from
F. Harrysson, T. Hult and F. Tufvesson,
“Evaluation of an Outdoor-to-In-Car Radio Channel with a Four-Antenna Handset
and a User Phantom,”
in IEEE Vehicular Technology Conference, VTC 2011-Fall, San Francisco, CA, Sept.
2011.


Evaluation of an Outdoor-to-In-Car Radio Channel with a Four-Ant ... 133
1 Introduction
In a real mobile radio channel setting the situation is seldom as simple as oftenassumed in channel modeling. Often, for a link budget analysis a combinationof a propagation model, e.g. a path loss model, plus statistical fading outageis used, whereas for more complex multiple antenna system analysis a dou-ble directional propagation channel (DDPC) in combination with transmitting(Tx) and receiving (Rx) antenna patterns can be utilized. However, in realitythe interface between the propagating radio waves (often assumed plane) andthe antenna (often characterized by its farfield) is not so obvious. The effec-tive antenna in a mobile phone includes also the casing. The hand of the userstrongly affects the radiation performance of the individual antennas and theuser body induces shadow fading. Furthermore, the surrounding of the usersmay be very complex with many close scatterers, e.g., in office environments,in crowded shopping malls, or inside vehicles. In this paper we continue ourprevious work on realistic terminal environments [2,3] to include the case whenthe user is located inside a car. The main question is the influence of thecar on the multiple-input-multiple-output (MIMO) radio channel and, partic-ularly, the performance of multiple antenna techniques, such as diversity andspatial multiplexing (SM). There is some previous work presented on penetra-tion loss [5, 6] and directional properties and in-car fading statistics [1, 4], butnot w.r.t. multiple antenna terminals. It is still unclear whether the presence ofthe car mainly provides increased scattering and, in-turn, improve the potentialof multiple antenna diversity and MIMO capacity performance, or mainly causeattenuation of certain angular sections that induce shadow fading, increase an-tenna correlation, and thus, have a negative influence on diversity gain andMIMO capacity. These are questions we address in this investigation. Specifi-cally, we investigate the potential performance of multiple antenna techniquesat the mobile.
The novel contributions of the paper are the following:
1. we compare the radio channels with the test terminal at the same outdoorlocation with the car present (antenna inside), and without the vehiclepresent.
2. we use a realistic user setup with a four-antenna handset mock-up inbrowsing position, and a full scale user body phantom that includes hand,arm, upper torso and head, in combination with the test vehicle.
3. we analyze the vehicle impact on fading statistics, time delay properties,diversity performance, 4×4 MIMO eigenvalue distributions and capacity,with the test terminal in the presence of a user.
134 PAPER IV
2 Measurement Setup
In the experiments we use two different Rx antenna configurations at the mobileside (MS). One was a uniform cylindrical 64 elements (4 rows, 16 columns)dual-polarized square patch antenna array (UCA) to be used for directionalestimation of the channel (in this paper these measurements are only usedfor the time domain analysis). The second was a handset mock-up with fourantennas placed at the edges. This was used in combination with an upperbody user phantom. The user operation mode, browse mode, represents thesmart-phone mobile broadband scenario where the user holds the handset asto watch the screen. Further details and pictures on handset and phantom canbe found in [2].
The car was a regular middle to large size station wagon (Volvo V70) andthe MS was placed in the center of the car at the location of the rear seat(the rear seats were down-folded). At the Tx base station antenna side (BS),a uniform rectangular 32 elements (4x8) dual-polarized square patch antennaarray (URA) was positioned on the roof of one protruding wing of a building atthe University campus at about 13 meters above the ground, resembling a mi-crocell scenario. Two different locations were chosen for the MS, one at about87 meters distance in an open area at a parking lot with line-of-sight (LOS)somewhat obstructed at the BS by a large tree (here denoted by “LOS” thoughit is not quite true!), and a second at about 37 meters distance in between twoneighboring parallel protruding wings of the building, i.e., non-LOS due to theintermediate wing (denoted by “NLOS”). For the measurements we used theMedav RUSK Lund channel sounder in the frequency band 2570–2630 MHz,and the signal-to-noise ratio (SNR) was about 20 dB in both scenarios. To eval-uate the impact of the car, the measurements were repeated with and withoutthe car present at the same location for both the UCA and the phantom-plus-handset. In the latter case the measurements were repeated at nine offset (λ/2)positions to improve on statistics, and with four 90 horizontal rotations in eachposition.
3 Penetration Loss and Fading Statistics
The car penetration loss or the excess path loss due to the presence of thecar can be found by comparing the empirical cumulative distribution of thereceived signal. The path loss was averaged over the 60 MHz frequency bandusing, as sample space, the switched Tx and Rx channels (of individual BS andMS antenna elements), the four phantom orientations, and the nine local offsetpositions. The resulting sample cumulative distribution function (CDF) of the

Evaluation of an Outdoor-to-In-Car Radio Channel with a Four-Ant ... 135
MS positions (Rx)37 m
87 m
NLOS
LOS
BS position (Tx)
Figure 1: Illustration of the two measurements scenarios.
average signal power is shown in Figure 2.The fading statistics in Figure 2 include statistics of both sides of the link
so we do not directly see how the car influence the fading statistics around theMS. Actually, since the LOS case is rather an obstructed line-of-sight with richscattering at the BS side and additional multi-path, even the distribution withthe car absent is not completely Ricean. However, if we consider the 32× 128SISO channels with the (narrowband) statistics over MS antennas only, i.e.,local MS offset positions and frequency samples; and select the channels thatactually show a more Ricean-like distribution outside the car (the 7% that showk > 1), and compare to the corresponding case when the MS is located insidethe car, the average maximum likelihood estimate (MLE) of the k-factor forthe (so called) LOS case change from 1.4 to 0.3. Hence, the effect of the caron fading statistics seem to be (as expected) an increase of scattering aroundthe MS making the channel become closer to Rayleigh distributed. One ofthe more notable examples of how the channel turn from Ricean outside toRayleigh inside the car is shown in Figure 3.
4 Time Domain Properties
The impulse response of the channel is investigated by the average power delayprofile (PDP) shown in Figure 4. The PDP is calculated as the squared absolutevalue of the inverse Fourier transform (IFFT) of the measured channel matrixusing a Hann window. The average PDP is taken over the 32 × 128 antennaelements. From the graphs we hardly see that a significant difference betweenthe channels with and without the car present since our 60 MHz bandwidthis to small to fully resolve multiple reflections inside the car. Calculations of

136 PAPER IV
−20 −15 −10 −5 0 5 100
0.1
0.2
0.3
0.4
0.5
0.6
0.7
0.8
0.9
1
Relative power (dB)
Sam
ple
CD
F
LOS outsideLOS in car
(a) LOS scenario
−20 −15 −10 −5 0 5 100
0.1
0.2
0.3
0.4
0.5
0.6
0.7
0.8
0.9
1
Relative power (dB)
Sam
ple
CD
F
NLOS outsideNLOS in car
(b) NLOS scenario
Figure 2: Cumulative distribution of the average received signal powerfor the phantom+handset outside (solid) with the car absent, and inside(dashed) the car at same locations. The data has been normalized w.r.tthe outside case.

Evaluation of an Outdoor-to-In-Car Radio Channel with a Four-Ant ... 137
0 0.5 1 1.5 2 2.5 30
0.2
0.4
0.6
0.8
1
1.2
1.4
|H|/µrms
Sam
ple
PD
F
outsideRice σ=0.7, k=1.6in carRice σ=0.7, k=0.0
Figure 3: Example of probability density of the received signal for a casewith notable change from outside to in-car. The Ricean distributionswith the MLE parameters are shown for comparison.
mean delay and rms delay spread is presented in Table 1. As expected delayspread is larger in the NLOS scenario.
5 Antenna Correlation
An investigation of how the car body influence the statistical complex cor-relation between pair-wise MS antenna elements may give a hint on how thedirectional properties of the channel change when the MS is moved into the car,since the directional properties of the channel are in general connected to thechannel covariance. The pair-wise MS antenna small-scale complex correlationcoefficient can be estimated with respect to the nt BS antenna elements, thenx MS local offset positions, and by utilizing the ergodic assumption that thenf frequency samples account for (narrowband) small-scale fading as
cij =1
ntnfnx
ntnfnx∑k=1
hikh∗jk (1)
ρi,j =cij√ciicjj

138 PAPER IV
0 50 100 150 200 250−130
−120
−110
−100
−90
Delay distance (m)
Avera
ge p
ow
er
(dB
)
OLOS outside
OLOS in car
(a) LOS scenario
0 50 100 150 200 250−130
−120
−110
−100
−90
Delay distance (m)
Avera
ge p
ow
er
(dB
)
NLOS outside
NLOS in car
(b) NLOS scenario
Figure 4: Average PDP of the two scenarios with the UCA at the MSside with and without the car present.

Evaluation of an Outdoor-to-In-Car Radio Channel with a Four-Ant ... 139
Table 1: Mean delay and RMS delay spread in nanoseconds for the channelmeasurements with the UCA in the two scenarios with and without the carpresent.
Mean delay RMS delay spread
LOS outside 313 50LOS in car 316 47NLOS outside 174 78NLOS in car 173 59
Here hi is the measured channel response at MS antenna i. The result is shownin Figure 5. The correlation is clearly lower inside the car than outside indi-cating an enriched inner scattering, thus improving the possible diversity gainby using multiple MS antennas. If we compare the results from [2] were it wasfound that the user (phantom) body increases antenna correlation, we mayassume that increased local scattering inside the car compensate for the shad-owing of the user body, and thus, lowering the correlation such that diversitygain by multiple MS antennas is recovered.
6 Diversity and Spatial Multiplexing
To investigate the potential gain of diversity combining and MIMO capacity,and the influence of the car, we utilize the same method as was used in [3] forthe user influence. In Section 5 we found that the car environment decreasesantenna correlation at the MS, which would increase potential diversity gain.Figure 6 shows the impact of maximal-ratio combining (MRC) and hybridselection/MRC [7] found as the power sum of; two antennas with the strongestoverall average signal powers (Best 2MRC), two antennas of four with thestrongest signal powers at each channel sample (2/4 HS-MRC), and all fourantennas (4MRC). We notice that the car presence, apart from increasing pathloss as was shown previously, improves the diversity performance in almost allcases. The increase in diversity gain due to the car is found to be about 1–1.5 dB. We also see the great benefit of four diversity antennas, providing full4th order diversity, even with a limitation of two radio chains in the handset.The hybrid method (2/4 HS-MRC) increases diversity gain in our results about3–4 dB (at 1% outage) compared to two-antenna methods.
The local scattering within the car that provides diversity gain does notimply MIMO spatial multiplexing (SM) gain. The car influence on SM is

140 PAPER IV
0 0.2 0.4 0.6 0.8 10
0.2
0.4
0.6
0.8
1
Correlation
Pro
b. |ρ
ij| < a
bsci
ssa
outsidein car
(a) LOS scenario
0 0.2 0.4 0.6 0.8 10
0.2
0.4
0.6
0.8
1
Correlation
Pro
b. |ρ
ij| < a
bsci
ssa
outsidein car
(b) NLOS scenario
Figure 5: Cumulative distribution of the estimated MS antenna cor-relation coefficient for the phantom+handset outside (solid) and inside(dashed) the car.

Evaluation of an Outdoor-to-In-Car Radio Channel with a Four-Ant ... 141
illustrated in Figure 7 by a comparison of the eigenvalue distributions for aselected set of four BS antennas (vertical polarization, separated by 1 λ), withthe car present and not. The graphs show the sorted eigenvalues of HHH
calculated from a 4× 4 sample matrix H = H(i) as
λ(i) =1
Paveig
H(i)H(i)H
(2)
where the normalization factor Pav is the sum of eigenvalues averaged over thesample space, i.e., the i’s (here the frequency samples and MS local transla-tions). In (2) we consider the distribution of the eigenvalues over an ensemblecontaining all combinations of frequency samples, MS translations and phan-tom user rotations. The car body surrounding the MS has the effect of de-creasing the eigenvalue spread by enriched multipath and, thus, increasing thepotential of SM gain. Other BS antenna configurations were tested, showingdifferent performance, but with almost the same car dependency. was alsotested However, looking at MIMO capacity with penetration loss omitted, asseen in Figure 8, we find that the car only has a small effect in some cases.Here the ergodic or mean spectral efficiency (bit/s/Hz) is plotted against theaverage SISO signal to noise ratio in each of the cases with and without the carpresent in the channel, i.e., the car penetration loss is removed. However, thepresence of the car seems to slightly increase 4x4 MIMO capacity in the LOScase and 4x2 MIMO in the NLOS.
We also find that hybrid 4x2/4 MIMO method (HS-MIMO) with instanta-neous selection of two out of four antennas at the MS and utilizing 4x2 MIMO,improve capacity compared to a fixed two antenna (4x2) handset.
7 Conclusions
The goal with this investigation was to get insight into how a regular vehicle,such as a standard station wagon, affect the radio channel from a macro-cellbase station to a mobile phone operated inside. It is found in our measurementsthat the penetration loss, or excess path loss, due to the test vehicle was inaverage between 1.6–7.9 dB. These figures strongly depend on the outer chan-nel, i.e., the scenario and orientation of the car relative the base station andcan probably be even smaller and significantly larger. In our case we believethat the difference between the penetration loss in the two scenarios is mainlydue to the elevation angle of the impinging radio waves which, if generalized,would indicate that the average car penetration loss could differ between urbanand rural scenarios. However, much more extensive measurements are neededto provide valid statistics to, e.g., set parameters in a channel model. Further-more, we find that the car increase inner local scattering around the mobile

142 PAPER IV
−20 −10 0 1010
−2
10−1
100
Power [dB]
Pro
b. P
i < a
bsci
ssa
Ant 1−4Best 2MRC2/4 HS−MRC4MRC
(a) LOS scenario
−20 −10 0 1010
−2
10−1
100
Power [dB]
Pro
b. P
i < a
bsci
ssa
Ant 1−4Best 2MRC2/4 HS−MRC4MRC
(b) NLOS scenario
Figure 6: Received signal power distributions for individual antennaelements (SISO) and with various diversity combining schemes (SIMO)for the user-plus-handset at the same location with the car absent (solid)and inside the car (dashed). The data is normalized to the average SISOchannel power.

Evaluation of an Outdoor-to-In-Car Radio Channel with a Four-Ant ... 143
−40 −30 −20 −10 0
0.1
0.2
0.3
0.4
0.5
0.6
0.7
0.8
0.9
Rel. power [dB]
Pro
b. λ
i < a
bsci
ssa
outsidein carRayleigh
(a) LOS scenario
−40 −30 −20 −10 0
0.1
0.2
0.3
0.4
0.5
0.6
0.7
0.8
0.9
Rel. power [dB]
Pro
b. λ
i < a
bsci
ssa
outsidein carRayleigh
(b) NLOS scenario
Figure 7: Cumulative distributions of eigenvalues for a 4x4 MIMO con-figuration. The eigenvalues are normalized with the total power averagedover frequency points and translations.

144 PAPER IV
0 5 10 15 200
5
10
15
20
SNR (dB)
Erg
odic
cap
acity
(bi
ts/s
/Hz)
4x4 MIMO4x2 MIMO4x2/4 HS−MIMO4x1 MISO
(a) LOS scenario
0 5 10 15 200
5
10
15
20
SNR (dB)
Erg
odic
cap
acity
(bi
ts/s
/Hz)
4x4 MIMO4x2 MIMO4x2/4 HS−MIMO4x1 MISO
(b) NLOS scenario
Figure 8: Ergodic capacity vs. SNR for different MIMO systems withthe car absent (solid) and present (dashed).

Evaluation of an Outdoor-to-In-Car Radio Channel with a Four-Ant ... 145
user which makes the fading statistics become closer to Rayleigh distributed.Regarding terminal multiple antenna properties, our measurements show a de-crease in pair-wise antenna correlation at the mobile side when placed insidethe car compared to outside. An observation that explains the increase in po-tential diversity gain of various diversity combining schemes of about 1–1.5 dBat 1% outage level inside the car. Also when looking at eigenvalue distribu-tions for a 4 × 4 MIMO system, we find that the richness increases inside thecar, making the eigenvalue distribution less spread. This, in turn, provides apotential for improved spatial multiplexing gain, which we also find when welook at the theoretical capacity, even though the gain seems rather small.
Acknowledgment
This work is supported by a grant from the Swedish Research Council.

146 PAPER IV
References
[1] F. Harrysson, “A simple directional path loss model for a terminal inside acar,” in IEEE Veh. Technol. Conf. VTC 2003-Fall, vol. 1, 2003, pp. 119–122.
[2] F. Harrysson, J. Medbo, A. Molisch, A. Johansson, and F. Tufvesson, “Ef-ficient experimental evaluation of a MIMO handset with user influence,”IEEE Trans. Wireless Commun., vol. 9, no. 2, pp. 853–863, Feb. 2010.
[3] F. Harrysson, A. Derneryd, and F. Tufvesson, “Evaluation of user handand body impact on multiple antenna handset performance,” in IEEE In-ternational Symposium on Antennas and Propagation, AP-S 2010, Toronto,Canada, July 2010.
[4] C. Hill and T. Kneisel, “Portable radio antenna performance in the 150,450, 800, and 900 MHz bands ’outside’ and in-vehicle,” IEEE Trans. Veh.Technol., vol. 40, no. 4, pp. 750–756, 1991.
[5] I. Kostanic, C. Hall, and J. McCarthy, “Measurements of the vehicle pen-etration loss characteristics at 800 MHz,” in IEEE Veh. Technol. Conf.VTC’98, vol. 1, May 1998.
[6] E. Tanghe, W. Joseph, L. Verloock, and L. Martens, “Evaluation of vehiclepenetration loss at wireless communication frequencies,” IEEE Trans. Veh.Technol., vol. 57, no. 4, pp. 2036–2041, 2008.
[7] M. Z. Win and J. H. Winters, “Analysis of hybrid selection/maximal-ratiocombining in Rayleigh fading,” IEEE Trans. Commun., vol. 47, no. 12, pp.1773–1776, Dec. 1999.


Experimental Investigation of the
Directional Outdoor-to-In-Car
Propagation Channel
Abstract
The demand for wireless channel models including realistic user environments is in-
creasing. This motivates work on more detailed models that are reasonably simple
and tractable but with adequate statistical performance. In this paper, we present
an investigation of the spatial outdoor-to-in-car radio channel at 2.6 GHz. Specif-
ically, we investigate the performance of a multiple antenna smartphone mock-up
in the hand of a user. We evaluate and utilize a composite channel approach to
combine measured antenna radiation patterns with an estimated spectral represen-
tation of the multipath channel outside and inside the car in two different scenarios.
The performance of the method is investigated and comparisons with direct channel
measurements are performed. Statistical and directional properties of the outdoor-
to-in-car channel are presented and analyzed. It is found that the composite method,
despite nearfield problems when estimating plane-wave channel parameters in a very
narrow environment, constitutes a tool that provides reasonably viable statistical re-
sults. In addition, we have found that the introduction of the car in the propagation
environment increases scattering and eigenvalue dispersion while it decreases pairwise
antenna signal correlation. These statistical properties are found to slightly increase
the possible diversity and the spatial multiplexing gains of multiple antenna termi-
nals when located inside cars. This positive effect, however, is small compared to the
negative effect of car penetration loss.
Submitted to IEEE Transactions on Vehicular Technology, April 2012, as
F. Harrysson, J. Medbo, T. Hult and F. Tufvesson,
“Experimental Investigation of the Directional Outdoor-to-In-Car Propagation Chan-
nel”


Experimental Investigation of the Directional Outdoor-to-In-Car ... 151
1 Introduction
Communication from vehicles have today become a prevalent scenario for hand-held mobile terminals, such as smartphones, that may be in the hands of pas-sengers using high data rate cellular services. This scenario will affect thetuning of the cellular networks and the quality-of-service of the cellular sys-tems serving the users, and may also affect terminal technology. In addition,a car may also serve as a relevant example of an immediate confined scatter-ing environment, representative also for other similar surroundings like indoorparts of buildings, other vehicles, trains, sub-ways, etc, that are common sur-roundings in the everyday life of mobile terminal users. Thus, in ubiquitouscellular systems, like LTE (long-term evolution) and future LTE-Advanced,it is of great interest to know in detail also the impact of such environmentswith respect to performance (power consumption, data rate, reliability etc.)of multiple antenna terminals such as MIMO (multiple-input multiple-output)smartphones. The car environment will have impact not only on the path losswhich affects power consumption and coverage, but also on the fading statis-tics of the radio channel. Multiple antenna techniques such as diversity andspatial multiplexing, which are essential to combat fading and to boost channelcapacity are also highly affected. However, channel models that, in a realisticway, incorporate these confined environments in the immediate neighborhoodof the user are rare. Such channel models are of particular importance for thedevelopment of vehicular-to-infrastructure (V2I) solutions.
In the development of an empirical channel model that includes nearby scat-tering objects and surroundings it is possible to include the objects either in therepresentation of the antenna or in the propagation channel characterization.However, if these objects, e.g. a car, are included in the channel we need toperform new channel measurements for each configuration (terminal antenna,user orientation, car type, car orientation, location, etc.). Instead, by measur-ing the much more rigid outer channel once (at a representative location) wecan produce a model that is represented by the double-directional propagationchannel (DDPC), i.e., a sum of multi-path components (MPCs); each char-acterized by its direction-of-arrival (DoA), direction-of-departure (DoD), pathdelay, and complex amplitude [1]. The DDPC can be estimated from good qual-ity MIMO channel measurements by methods like SAGE [2]. With the DDPCat hand, the outer channel can easily be combined with measured or simulatedradiation patterns. This composite channel modeling (CCM) methodology isverified in [3,4] wherein it is also utilized to evaluate the influence of the bodyof the user. In the case of, e.g., an object large as a car, the method is stillpossible but perhaps not feasible or practical.
In this paper, we present an investigation of the influence of a standard

152 PAPER V
family car on the spatial radio channel at 2.6 GHz, and specifically on theperformance of a multiple antenna smartphone mock-up terminal in browsemode position in the hand of a user phantom. We utilize the composite chan-nel approach where the user together with the antenna, is considered as oneradiating unit or a super-antenna with the propagation channel representedboth with the car absent and inside the car. The environment inside a normalsized car does not, however, provide enough space to reach the far-field of aseveral wavelengths sized array antenna necessary for directional channel char-acterization, of a user phantom super-antenna, at relevant frequencies around2.6 GHz. Thus, we have to violate the far-field requirement to use the in-carcomposite channel approach. Hence, the question is to what extent the com-posite method with the far-field assumption inherent both in the DDPC andin the super-antenna radiation pattern, is valid for MIMO performance pre-diction inside a car, and how much it suffers from the violation of the far-fieldassumption and (unavoidable) measurement inaccuracies.
Several published papers describe investigations of cars and other vehi-cles. Several papers also describe and evaluate the principle of combining adirectional propagation characterization with antenna radiation patterns (herereferred to as a composite channel modeling), e.g., [4–6], but to our best knowl-edge no work exists that investigates and validates this composite channel mod-eling approach in a narrow confined scenario where, e.g. a mobile handset, inthe presence of a user (phantom), is located inside a vehicle, e.g. a car.
The goal of the paper is to investigate to what extent the plane-wave spec-trum composite channel method can appropriately account for a car environ-ment with the mobile user inside. The novel contributions of the paper are thefollowing:
1. We test the impact of a car environment (outdoor-to-in-car) with a bodyphantom that includes hand and upper torso as well as head.
2. We investigate the possibility of performing directional channel estima-tion inside a car.
3. We analyze the performance of the synthetic channel based on the esti-mated channel in the presence of a user inside and outside a car, w.r.t.singular value distributions and antenna signal correlation.
The investigation is based on channel measurements in two different staticscenarios with an upper body phantom and a four-antenna handset mock-uplocated outside and inside a common type family car (station wagon), in theLTE band 2.5–2.7 GHz for a synthetic 4× 4 MIMO arrangement.
The paper is organized as follows: Section 2 outlines the basic principleof the composite method, Section 3 describes the details of the equipment,

Experimental Investigation of the Directional Outdoor-to-In-Car ... 153
the test setup and the measurement scenarios, and Section 4 elaborates on themeasured channel properties and the directional characterization of the channelfrom inside the car. Next, the comparison procedure between direct measure-ments and composite results is described in Section 5, with the comparison ofeigenvalue distributions and antenna signal correlation as the key experimen-tal results of the campaign. In Section 6 we evaluate the impact of the caron channel properties like correlation, diversity and capacity gain in differentcases, and use the composite channel model to separate the user and the carinfluences. Finally, the paper is summed up and concluded in Section 7.
2 The Channel Matrix
2.1 Channel Model
It is assumed that the radio channel can be modeled by a finite number Lof multi-path components (plane waves), originating at the transmitter (Tx)antenna propagating towards the angle Ωt,l (direction of departure), subjectto reflection, scattering and diffraction, before terminating at the receiver (Rx)antenna impinging from angle Ωr,l (direction-of-arrival). This means that thefrequency domain MIMO channel transfer function (matrix) can be written as
H(f) =
L∑l=1
αlGTr (Ωr,l, f)PlGt(Ωt,l, f)e−j2πfτl , (1)
where αl denotes the complex MPC amplitude, τl the path excess delay, andPl] the 2×2 normalized polarimetric transfer matrix. In (1) the assumptions ismade that the antennas can be characterized by their far-field characteristics,i.e., that the closest MPC scatterer is outside the near-zone of the antenna.The antenna matrices Gt and Gr include also the complex array location vectorphase term for each element in the columns, and for the polarization component(θ, φ) in the rows, i.e., 2 × nr,t. Here we assume a static Rx unit which canbe generalized to a dynamic case with the addition of the Doppler frequencyf = (1 + v
c )f0 in (1), where v = kr,l · v is the Rx velocity relative the direction
of each individual MPC kr,l.
2.2 Channel Estimation and Calculation
With the channel model in (1) it is possible to calculate the channel matrixsynthetically for any array antenna characterized by its farfield matrix G aslong as the farfield assumption is not violated. When the channel model isused to represent an observation from a channel measurement, the channel
154 PAPER V
parameters (DDPC parameters) θ = Ωt,l,Ωr,l, τl, αl,Pl can be estimated byusing a maximum-likelihood (ML) estimator that performs the operation
θ , arg maxθ
p(x;θ), (2)
where p(x,θ) is the probability distribution function of the observed channelx = vec(H) and the parameter vector. It can be shown that the log-likelihoodfunction can be written as
− log p(x;θ) = NrNtNf log (πσ2) +1
σ2
Nf∑k=1
||Hk −Hk||2F , (3)
were k is the sample frequency index, σ2 the noise variance, H is the channelmodel in (1), and H is a measurement realization.
The estimator used in this investigation is described in [7] (with reversenotation) and is here only described briefly. It starts by a search for the maxi-mum in the power delay profile, followed by time-domain gating and dual-sidebeamforming to find initial parameter values (Ωt,l,Ωr,l and τl) of the (multiple)MPC’s within the selected delay slot. Next a binary search algorithm performsa binary tree search maximization to improve the parameter estimates one-by-one as in SAGE [2]. In a second step the estimation procedure performsan analytical gradient calculation, utilizing the multivariate quadratic Taylorexpansion of the likelihood, to find the local maximum. In this step the Jaco-bian and the Hessian of the likelihood is calculated analytically. This step isvery sensitive to model errors, e.g., due to non-planar wave fronts (while as-suming planar wave fronts) when scatterers are to close to the sensor antennaarray [8–10]. In Section 4.2 this problem is further discussed.
These steps in the estimation procedure are iterated and combined witha linear estimation of αlPl, and with possible birth of new MPC’s, until anaccuracy threshold is reached and until the extraction of MPC’s in the delaydomain reaches the noise floor of the data. The estimation method is alsomentioned in [11] and was used in [4, 12].
3 Measurement Equipment and Setup
3.1 Array antenna, Handset and User Phantom
In the experiments two different antenna configurations at the mobile side (MS)were used. One was a uniform cylindrical 64 element (4 rows, 16 columns) dualpolarized square patch antenna array (receiving patch uniform cylindrical array,RxPUCA) to be used for directional estimation of the channel. The second was

Experimental Investigation of the Directional Outdoor-to-In-Car ... 155
a handset mock-up with four (PIFA) antennas placed at the edges, connectedby coaxial cables to a 1-to-4 switch. The handset is placed in the hand of a userphantom consisting of a liquid filled head-plus-torso and one solid (right) arm-plus-hand in browse mode. The user operation mode (browse mode) representsa smartphone mobile broadband scenario where the user watches the handsetscreen. Further details and pictures on handset and phantom can be foundin [3, 4]. At the base station antenna side (BS), a uniform rectangular 4 × 8dual polarized square patch antenna array (TxPURA) was used.
3.2 Car
The car is a 2005 model Volvo V70 station wagon with standard glazing andwith the rear seats down-folded to make place for the antennas. The maininvestigation is made with the car empty from driver and passengers. Someadditional measurements were done with a driver behind the wheel and withside windows open, but no significant effect due to the driver and the windowswas found.
The orientation of the car in the two scenarios is shown in Figure 1 with thedefinition of the azimuth angle at the MS (AzMS). The direction towards theTX is marked in both cases (about 250 degrees in Scenario A and 270 degreesin Scenario B). Also the geometry of the car and the placement of the channelsounder array antenna and the user phantom (inside the car) is shown.
3.3 Channel Sounder
The channel sounder used was the RUSK Lund channel sounder from Medav.The characteristics of the sounder setup are summarized in Table 1.
3.4 Antenna Characterization
The radiation patterns and efficiencies of the handset, with and without thephantom present, have been measured previously [3, 4]. For the directionalestimation we also needed a full characterization of the RxPUCA antenna.The calibration of the measurement array antenna is very important for theaccuracy of the directional estimation [13, 14]. This was measured in a highquality anechoic chamber with six meter separation between the transmittingdual polarized reference horn antenna, and the rotation center of the roll-over-azimuth positioning system.
In all channel measurements used in this paper the same Tx antenna (Tx-PURA) was used. Thus, since this antenna was unchanged in the channels thatis being compared, directional estimations were only required at the MS side.

156 PAPER V
Y Y
4.5 m 1.5 m
0.8 m1.4 m
1.2 m 2.0 m 1.3 m
TX
AzMS
TX
AzMSA) B)
Figure 1: Orientation of the car in the two scenarios, and the cargeometry with the location of the test antennas when inside the car.
Table 1: Channel sounder parameter configuration during measurements.
Center frequency, fc 2.6 GHzMeasurement bandwidth, B 60 MHzDelay resolution, ∆τ = 1/B 16.7 nsTransmit power, Pt 27 dBmTest signal length, τmax 1.6 µsNumber of TxPURA antenna ports, Nt 32Number of RxPUCA antenna ports, Nr 128Number of Rx handset antenna elements, Nr′ 4Snapshot time, tsnap = 2 ∗Nt ∗Nr ∗ τmax 13.1 msNumber of snapshots at each recording 100Number of frequency samples 97Tx antenna height over ground, ht ca 9 mRx antenna height over ground, hr 1.1-1.3 m
Experimental Investigation of the Directional Outdoor-to-In-Car ... 157
3.5 Channel Measurement Scenarios
Two measurement campaigns with two different MS location and orientationwere performed at the Lund University Campus (E-building of LTH), Lund,Sweden:
Scenario A: Parked car outdoor microcell scenario with line-of-sight (LOS)obstructed by a tree. The direction to the Tx is towards the rear-leftof the car with low elevation angle. Almost free sight through the rearwindow.
Scenario B: Parked car outdoor microcell non line-of-sight (NLOS). The di-rection towards the Tx is to the front-right of the car with buildingssurrounding the car at three sides and obstructing the LOS.
In both scenarios the BS antenna was located at the same location (roof topof a two story building) with bore-sight towards the MS. In each scenario, twomain configurations at the MS side were used. Firstly, the channel was recordedwith the RxPUCA once for the purpose of directional channel characterization.Secondly, the channel was measured with the user phantom at the MS (userphantom plus handset) rotated in 90 steps to four orientations and translatedto nine offset positions with λ/2 separation, i.e., 4 × 9 channel measurementsin the latter case. These measurements were repeated twice in each scenario,once with the car absent but with the RxPUCA/phantom on a trolley at theMS location, and once with the RxPUCA/phantom placed inside the car at thenine MS locations. The measurements and scenarios are described with moredetails in [15].
The average receiver SNR (signal-to-noise ratio) for a single antenna to an-tenna (SISO) channel was between 0–17 dB in all measurements, which wasimproved almost 20 dB after coherent averaging over 100 channel snapshotsrecorded at each measurement. The measurements were taken during after-noons at a parking lot with almost no people and cars moving at the site.However, we cannot exclude that movements from a few passing pedestriansand cars in surrounding areas may have caused some interference.
4 Channel Characterization
4.1 Channel Characteristics and Estimated Parameters
With a bandwidth of 60 MHz corresponding to a standard resolution in delayof 5 meters we are not likely to resolve with good accuracy the possible impacton delay spread from the car presence by studying the power delay profile

158 PAPER V
Table 2: Channel parameters, delay spread στ , azimuth spread σφ and ele-vation spread σθ, in the measurement scenarios, based on the estimated MPCparameters.
Scenario στ (ns) σφ (deg.) σθ (deg.)
A outside 54.9 24.6 7.1A in car 63.3 39.1 13.6B outside 45.1 33.4 29.2B in car 51.2 45.4 27.4
alone. However, by the high-resolution method described in Section 2.2 we canimprove the result. Having performed the channel parameter estimation westudied the results in the delay and directional domains, separately. Based onthese estimates we calculated the corresponding channel properties, e.g., therms delay spread στ [16, Chapter 6] and the angular spread [17] in azimuthand elevation, Sφ and Sθ, respectively. These results are found in Table 2 andin Figure 2 where the graphs show the directional distributions of estimatedMPC parameters at the MS side for the different cases.
From Table 2 we find that the delay spread increases slightly (about 6-8 ns)and that the azimuth spread increases significantly (about 12-15 degrees) whenthe antenna is located inside instead of outside the car in both scenarios. Thevertical elevation spread, however, increases to some extent in Scenario A (theobstructed LOS case) while it is almost unchanged in Scenario B (the NLOScase). These observations of the angular spread are apparent by looking at theangular distributions in Figure 2.
4.2 Channel Estimation Accuracy
An extensive number of uncertainties and possible error sources do inevitablyaffect the result of these evaluations. While some of these uncertainties areknown and can be estimated, others are assumed to be negligible or small1.Below we discuss some of the most important error sources. Specifically, weillustrate with a few examples the consistency/in-consistency of doing plane-wave estimation in a propagation channel with near-field scattering sources, atopic that is central in this evaluation were we try to model a confined envi-ronment like the car.
1A comprehensive investigation of experimental channel estimation limitations and variouserror sources can be found in [14]

Experimental Investigation of the Directional Outdoor-to-In-Car ... 159
0 50 100 150 200 250 300 350
−50
0
50
Ele
vation a
t M
S (
deg.)
Azimuth at MS (deg.)
−30
−25
−20
−15
−10
−5
0
(a) Scen. A outside
0 50 100 150 200 250 300 350
−50
0
50
Ele
vation a
t M
S (
deg.)
Azimuth at MS (deg.)
−30
−25
−20
−15
−10
−5
0
(b) Scen. A in car
0 50 100 150 200 250 300 350
−50
0
50
Ele
vation a
t M
S (
deg.)
Azimuth at MS (deg.)
−30
−25
−20
−15
−10
−5
0
(c) Scen. B outside
0 50 100 150 200 250 300 350
−50
0
50
Ele
vation a
t M
S (
deg.)
Azimuth at MS (deg.)
−30
−25
−20
−15
−10
−5
0
(d) Scen. B in car
Figure 2: Estimated MPC power vs. elevation and azimuth at the MS(DoA) in the different scenarios. The color of the circles represent therelative total power of the MPCs.

160 PAPER V
4.3 Error sources and noise
The most important practical error sources in this investigation are most cer-tainly the limited signal power strength (SNR) and limited antenna calibra-tion (both arrays and phantom-plus-handset) measurement accuracy. Duringthe channel measurements with the RxPUCA the internal LNA provides theSNRIR of up to 50 dB after averaging over 100 coherent snapshots which is thepeak-to-noise level of the input channel data to the channel estimation processin the outdoor cases, and about 42 dB inside the car in Scenario B.
The antenna measurement ranges used have a potential accuracy limitwell below 25 dB, but due to practical compromises with switching, bend-ing of cables, impedance mismatch, scattering in turntables, reconfigurabilityof phantom-plus-handset, etc., this error level is roughly about 20 dB below thepeak for the RxPUCA used for directional channel estimation, and minimumabout 10 dB for the phantom-plus-handset antennas. The expected minimumaccuracy level of the estimated MPCs is somewhere between 20-30 dB.
4.4 Nearfield estimation effects
Inside the car the closest obstacles or sources of scattering are within about40 cm distance from the sounder array antenna center, see the car geometryin Figure 1. However, if we neglect the car ceiling in the direction of elevationangles above 60 deg, were this antenna is unlikely to detect MPCs, the closestobstacles are at distances beyond 60 cm. Thus, we would like to be able toestimate MPCs at least at this distance with reasonable angular and distanceaccuracy. To test this, we performed directional estimation with the plane-wave estimator on a synthetic test channel with a single vertically polarizedpoint-source at zero elevation and distances between 0.3–10 meters. The resultis shown in Figure 3. Here we used a theoretical model of the RxPUCA withHuygens sources and no mutual coupling.
As seen from the graph the single source estimation degrade as the sourcedistance decreases, with artificial sources appearing in directions correspondingto a spherical wave-front expansion on a plane-wave spectrum. We also observean apparent source distance slightly larger than the actual one as the sourceapproaches. The face colors of the MPC circles in the graph show the estimated(apparent) additional distance to the source.
However, by looking at Figure 3 we also find that the ML estimation al-gorithm performs pretty good down to distances as low as 0.6 meters. Thiscan be compared to the Rayleigh distance2 (2D2/λ where D is the largest sizeof the antenna), which in our case is approximately 1.5 meters as marked in
2far-field or Fraunhofer region [18]

Experimental Investigation of the Directional Outdoor-to-In-Car ... 161
10−1
100
101
102
−40
−20
0
20
40
Azim
uth
(deg.)
Distance (m)
0
0.05
0.1
Figure 3: Estimated MPC azimuth angle to a single point source vsdistance. The area of each circle is proportional to the MPC fractionalpower. The face colors of the circles show the estimated source distanceminus the true test distance.
the graph. Thus, it does not seem impossible to estimate single sources withreasonable accuracy in our scenario, i.e., with a 0.3 m wide cylindrical arrayinside a common family car.
Now, what about angular resolution? To test this we add another sourceat the same distance as our first one but at a different angle. Since these twosources are at the same distance and we do not utilize the directional domain atTx, the resolution in the far-field is simply the array beamwidth, i.e., roughlyλ/D (rad.) or about 22 degrees. This effect is illustrated in Figure 4. Fromthe graphs it is apparent that when the angular difference gets close to theresolution limit, the estimation is valid only at source distances beyond thefar-field distance, but at 45 degrees angular difference the estimation resolvesthe two sources even somewhat closer than the far-field distance but with anincreased estimation error.
4.5 Estimation residual
The residual or remaining part of the channel after subtraction of the estimatedMPCs, represents antenna calibration and channel model mismatch errors thatare not possible to resolve3. This level relative to the peak level of the impulseresponse is referred to as the estimation accuracy. With the MS array outdoorsthis level was about 20 dB after channel parameter estimation in both scenarios,but with the MS inside the car it was less than 10 dB. The latter depends (mostcertainly) on the channel model mismatch, and the question is whether these
3Non-resolvable MPC’s are sometimes referred to as non-specular or diffuse multipathcomponents (DMC) [13, 14]. In this work we make no distinction between specular andnon-specular MPCs.

162 PAPER V
10−1
100
101
102
−40
−20
0
20
40
60
Azim
uth
(d
eg
.)
Distance (m)
0
0.05
0.1
0.15
0.2
0.25
(a) ∆φ = 25
10−1
100
101
102
−40
−20
0
20
40
60
80
Azim
uth
(deg.)
Distance (m)
0
0.1
0.2
0.3
(b) ∆φ = 45
Figure 4: Two estimated MPCs with different azimuthal separation ∆φvs true test source distance. The area of the circles is proportional tothe fractional power. The colorbar show the estimated source distancerelative the true test distance.

Experimental Investigation of the Directional Outdoor-to-In-Car ... 163
results are useful nevertheless. This is discussed below.
5 Comparison Between Model and Measurements
Based on the measured channels and the estimated directional channel param-eters, the specific impact of the car presence in the outdoor-to-in-car channelcan now be evaluated. But first we need to validate the method to be used.
5.1 Channel Matrix Element Magnitudes
A first step in the validation of both the direct measurements themselves, andthe performance of the composite channel method (CCM), using the channelparameter estimations outside and inside the car, is to look at and comparethe average received powers of individual antenna elements at the mobile (Rx)side. Here we let the average received power level for individual elements Pi atthe receiver side be represented by the squared magnitude of the elements ofthe channel matrix H averaged over the TX antennas and the frequency as
Pi =1
nt, nf
nt∑j=1
nf∑k=1
|Hi,j,k|2 (4)
In Table 3 the average power Pcol at two selected columns of the RxPUCAis compared for the direct channel measurements Pmcol and the CCM calcula-tions P ccol. In general the differences between the CCM and the direct mea-sured (DM) results are due to the truncation by the ray estimation process notcatching all the measured channel energy, the limited estimation accuracy dueto model errors (especially inside the car where a higher degree of cylindricaland/or spherical wave propagation are likely), and the limited antenna calibra-tion accuracy. The preserved energies by the model were here found to be 92,74, 83, and 59 percent in the four cases, respectively, i.e., in Scenario A outsideand inside the car, and in Scenario B outside and inside the car4. This wasfound as the fraction between the synthetic and the measured overall averagechannel gains P c/Pm where
P (m,c) =1
nr, nt, nf
nr∑i=1
nt∑j=1
nf∑k=1
|H(m,c)i,j,k |
2
=1
nf
nf∑k=1
||H(m,c)k ||2F
(5)
4These figures depend to some extent on the parameter setting in the estimation process

164 PAPER V
where Hk = H(fk). Since we test the channel model with the same arrayantenna model (measurement data) that was used in the channel estimationprocess, the lost energy must be due to the estimation loss or residual if theantenna characterization is at least approximately correct and span the samedimensions (polarizations, number of elements and position). From Table 3we find that the difference in average power level between the model and themeasurements differs quite a bit for different test antenna columns in differentchannels. Naturally the error gets larger as the signal gets weaker. In the highlydirective channels, i.e., A outside, A in car, and B outside, the difference is aslow as 0.2 dB for co-polarized antennas when the antenna column are directedtowards the main DoA (strongest signal), and as high as 3.8 dB in the worstcase (cross polarization in A in car) when the column is turned away from themain DoA. In the NLOS case (B) inside the car, the difference is somewhathigher (and the signal weaker).
From these data we also observe that the cross polarization seems to increasesignificantly from outside to inside the car. This effect is underestimated bythe model due to the inability (truncation) to estimate the weak cross polarizedsignals from opposite the main DoA.
In the next step this validation of the CCM is done also for the case withthe phantom user and the four-antenna handset. In this case we also utilize thenine offset positions and the four horizontal rotations of the phantom outsideand inside the car to improve statistics. The result is shown graphically inFigure 5 with the average power levels compared between the measured andthe synthetic data on the ordinate for vertical polarization at the TX side, andwith the four handset antennas and the four phantom rotations on the abscissa.Here the average power of the synthetic channels was normalized with respectto the directly measured channels outside the car. Thus, no power loss due totruncation of estimated MPC’s are present.
Also here we find a good match between CCM and the direct measureddata. The differences are, again, due to limited estimation accuracy, and herealso the limited accuracy of the phantom-plus-handset antenna patterns due toreassembly of the user phantom and handset setup with non-identical bendingof cables and positioning of the handset in the phantom hand. The meanreceived power, the difference, and the root-mean-square (rms) of the relativeerror are summed in Table 4 were the difference in mean is mainly due to thetruncation loss and an additional cable loss of 2 dB from the antenna rangemeasurement setup. The relative error is here taken as
εi =P ci − PmiPmi
, (6)
where i represents a compound antenna element and phantom rotation index.

Experimental Investigation of the Directional Outdoor-to-In-Car ... 165
Table 3: Comparison of average received signal power between measurementsand model for two array columns (weakest and strongest signal) of the testarray (RxPUCA) in the four channels with separation w.r.t. co- and crosspolarization of TX and RX antennas.
Scenario φcol Pol. Pmcol (dB) P ccol (dB) Diff. (dB)
A outside max co -74.3 -74.5 0.2cx -91.2 -93.4 2.2
min co -80.7 -81.2 0.5cx -93.2 -96.3 3.1
A in car max co -79.1 -79.3 0.2cx -88.4 -91.7 3.3
min co -83.2 -83.9 0.7cx -89.3 -93.1 3.8
B outside max co -76.6 -76.8 0.2cx -87.1 -88.8 1.7
min co -80.2 -81.0 0.8cx -89.8 -92.2 2.4
B in car max co -83.4 -84.6 1.2cx -86.6 -90.0 3.3
min co -84.3 -86.2 1.8cx -88.3 -91.5 3.3
1 2 3 4 1 2 3 4 1 2 3 4 1 2 3 4
−110
−100
−90
Pav
i (
dB
)
1 2 3 4 1 2 3 4 1 2 3 4 1 2 3 4
−110
−100
−90
Pav
i (
dB
)
MS ant. (i) and rotation
0°
90°
180°
270°
CCM outside
CCM in car
DM outside
DM in car
Figure 5: Average received signal powers of individual antenna ele-ments of the phantom user with the smartphone mock-up for verticalpolarization at the BS. The upper graph show the result in Scenario Aand the lower in Scenario B.

166 PAPER V
Table 4: Average received power for the measurements and the model, dif-ferences, and the rms errors for the phantom-plus-handset case in the fourscenarios.
Scen. |Hmi,j |2 (dB) |Hc
i,j |2 (dB) ∆dB σ2dB
A outside -97.5 -101.8 4.3 0.15A in car -99.1 -104.5 5.4 0.06B outside -93.1 -98.9 5.8 0.04B in car -101.0 -107.1 6.1 0.01
The mean and the rms are calculated as
ε =1
nrnrot
nrnrot∑i
εi (7)
σ2ε =
√√√√ 1
nrnrot
nrnrot∑i
(εi − ε)2, (8)
and the transform to decibel is done as σ2dB = 10 log10 |1 + σ2
ε |. This is foundto be very small which indicates a very good model match w.r.t average powerof the synthetic channel, even though this apparent accuracy is partly an effectof the average power being not so sensitive to the antenna pattern and thephantom rotation. To a large extent it is still the efficiency of the individualantennas at the handset that sets the received power levels.
5.2 MIMO Eigenvalue Distribution
The most important statistical properties of a MIMO channel matrix regardingcapacity performance are given by the singular values of the correspondingchannel matrix. The squared singular values are equal to the eigenvalues of thechannel covariance matrix
λ = eigHHH (9)
and represent signal gains of the spatial sub-channels. Again, to validate thedirectional channel parameter estimations and the composite channel approach,outside as well as inside the car, the sorted singular value distributions for two32 × 32 test channels are plotted in Figure 6. These test matrices each arrayring, 32 antenna ports of the 128 elements RxPUCA, is treated separately asfour samples of the same channel. The singular value distributions are shownfor both directly measured channels, and composite channel models with andwithout the presence of the car, in both cases with normalization to unit channel

Experimental Investigation of the Directional Outdoor-to-In-Car ... 167
gain (squared Frobenius norm). Naturally the composite channel data based onthe estimated channel parameters are somewhat more “synthetic” with largereigenvalue dispersion or, equivalently, less channel richness.
Apparently, there is a pretty good statistical match between the modeland the measurements also inside the car for the stronger eigenvalues. Theweaker eigenvalues are very unreliable and reflect measurement noise as well asmeasurement and model (estimation) errors. The number of estimated MPCswas here maximum L = 100.
In the next step this validation of the CCM is done also for the case withthe phantom user holding a smartphone mock-up handset. In this case weutilize the nine offset positions and the four horizontal rotations of the phantomoutside and inside the car to improve statistics. Here we allow ourselves to addan i.i.d. noise matrix Hw ∼ CN (0, σ2
wI) to the synthetic channel matrix as
H′c = Hc + Hw. (10)
By this procedure we compensate for inevitable receiver noise in the measure-ment system inherit in the direct measured data and indirect present in thesynthetic channel by setting the lower limit of MPCs to be estimated. The noisepower used in (10) was found from the channel measurements by comparingsuccessive snapshots, resulting in σ2
w = [18.5 16.9 26.9 19.0] dB below the av-erage power of the direct measured SISO channels, i.e., ||Hm||2F /(nrntσ2
w). Inthe delay domain this corresponds to a peak-to-noise floor level of the impulseresponse SNRIR ≈ 40 dB.
The result is shown in Figure 7. At the Tx side a selection of four verticallypolarized antenna elements with λ/2 spacing was chosen from one row of theTxPURA. The match between the synthetic channel and the measured is closefor all four singular values in all four scenarios. Especially inside the car thematch is almost perfect in the NLOS case (Scenario B). This may partially bea consequence of that estimation errors provide an apparent realistic spatiallyrich channel in this specific case, the one with most rich scattering, see Fig-ure 2. Otherwise, the additive noise has a minor effect on the result so themain difference between the synthetic and the measured channels is the lackof richness in the synthetic channel that stems from the inability to estimateenough MPCs due to limited SNR and error level. To improve these results weneed higher SNR in the measurements and perhaps also higher accuracy in theantenna characterization and system calibration including cables etc.
The addition of the noise matrix Hw in this context shall not be mistakenas an additive part of the channel model. The improved match with the directmeasured channel is merely a consequence of the imperfect measurement system(receiver noise), but may also compensate for error sources like antenna array

168 PAPER V
−20 −18 −16 −14 −12 −10 −8 −6 −4 −2 00
0.2
0.4
0.6
0.8
1
Rel. power [dB]
Pro
b. λ
i < a
bscis
sa
DM
CCM
(a) Scen. A outside
−20 −18 −16 −14 −12 −10 −8 −6 −4 −2 00
0.2
0.4
0.6
0.8
1
Rel. power [dB]
Pro
b. λ
i < a
bscis
sa
DM
CCM
(b) Scen. B in car
Figure 6: Ordered squared singular value distributions of 32×32 chan-nels for direct measured (solid), and CCM (dashed) with the RxPUCAin the two most different scenarios. Note that only the strongest singularvalues are visible.

Experimental Investigation of the Directional Outdoor-to-In-Car ... 169
−40 −30 −20 −10 010
−2
10−1
100
Rel. power [dB]
Pro
b. λ
i < a
bscis
sa
Hm
4× 4
Hc
4× 4
Hc’
4× 4
Hw
4× 4
(a) A outside
−40 −30 −20 −10 010
−2
10−1
100
Rel. power [dB]
Pro
b. λ
i < a
bscis
sa
Hm
4× 4
Hc
4× 4
Hc’
4× 4
Hw
4× 4
(b) A in car
−40 −30 −20 −10 010
−2
10−1
100
Rel. power [dB]
Pro
b. λ
i < a
bscis
sa
Hm
4× 4
Hc
4× 4
Hc’
4× 4
Hw
4× 4
(c) B outside
−40 −30 −20 −10 010
−2
10−1
100
Rel. power [dB]
Pro
b. λ
i < a
bscis
sa
Hm
4× 4
Hc
4× 4
Hc’
4× 4
Hw
4× 4
(d) B in car
Figure 7: Ordered squared singular value distributions of 4×4 channelsfor direct measured (m), and synthetic with the phantom-plus-handset(c and c′), in both scenarios outside and inside the car. For comparisonthe distribution of a complex Gaussian channel is shown (w).

170 PAPER V
characterization and cable calibration errors, as well as for non-resolvable spa-tially white channel components. In [13,14] the channel model itself is dividedinto a specular and a non-specular part, where the latter part (dense multi-path) encounters possibly correlated non-specular channel components that areestimated separately. Here we persist in using the spectral channel model in (1)built up by classical independent specular components that may be resolvableor not depending on the quality of the measurement setup and the estimatoralgorithm. In [4] higher precision in similar measurements provided the possi-bility to extract a higher amount of specular channel components which showedan increased match between the synthetic and the direct measured channels asthe number of specular components increased. This effect was not reached byadding spatially white noise.
6 How the User and the Car Affect System Per-formance
Since the composite channel model based on the MPC estimations work wellin predicting the statistical properties of the MIMO channel, the tool can beused to extract and evaluate specifically how the user and the car affect systemperformance without further measurements. Some of these results were pre-sented in [15], but now by utilizing the channel modeling tool it is also possibleto separate the user and the car effects by comparing the synthetic channelsfor the handset plus user phantom with new channel calculations with previ-ously measured handset only antenna patterns (as was done in [4] in an officeenvironment). The handset patterns are first translated and rotated to thesame position as if they were in the hand of the user phantom. In a previousinvestigation of user effects it was found that one of the main characteristics ofthe user body was an increase in correlation between received signals from thehandset antennas [4], in turn affecting system properties such as diversity andchannel capacity.
6.1 Antenna Correlation in Channel
The antenna (signal) correlation can be found directly from the direct measure-ments and was presented in [15], but here we also want to compare with theresults found by CCM. The correlation matrix with entries Ri,j denotes the cor-relation between signals at receive antenna ports i and j and can be estimated

Experimental Investigation of the Directional Outdoor-to-In-Car ... 171
as the mean over frequency samples5 of the sample covariance matrix
R =1
nfnt
nf∑k=1
H(fk)HH(fk) (11)
giving the estimated complex correlation coefficient with the proper normal-ization as
ρi,j =Ri,j√RiiRj,j
(12)
Figure 8 shows the cumulative distribution of the magnitude of the complexcorrelation coefficients computed according to (12), where the ensemble is theslow (shadow) fading distribution, i.e., the four phantom rotations, and thenine offset locations. In the figure the correlation coefficients from the model(“CCM´´), with and without the noise compensations from (10), and from thedirect measurements for the ensemble of ρi,j are compared for all i 6= j. Thepresence of the car decreases the antenna correlation in the test channels, mostlikely due to increased scattering “richness” inside the car [15]. This effect isalso reflected by the synthetic CCM data even though these data show highercorrelation in general. Nevertheless, we may conclude that the effect of the caris well caught by the model. The maximum difference in average received powerbetween antenna elements was here about 2.5 dB, a figure sometimes referredto as antenna mismatch (not to be confused with impedance mismatch).
6.2 Diversity and Capacity Gain
A summary of the maximum-ratio combining (MRC) diversity gains and thecapacity (or spatial multiplexing) gains are presented in Table 5. Here thediversity gain (DG) is taken as the ratio of the combined signal power of thetwo strongest (DG2) and all four (DG4) antennas, to the strongest branchsingle antenna signal power at the 1% outage level. This diversity gain is alsoreferred to as the apparent diversity gain [20] and seem to slightly overestimatethe actual diversity gain [21, Fig. 11], were the latter definition refers the gainto a reference case with a truly isolated single antenna and, thus, omits theinfluence of mutual coupling by the surrounding terminated elements in ourcase. This effect is here neglected.
The channel capacity is calculated from the eigenvalues of the normalizedchannel matrix as
C =
r∑i=1
log2(1 + γiλi) (13)
5assuming ergodicity in frequency and time, i.e., averaging over the ensemble is equivalentto averaging over time- and frequency-samples [19]

172 PAPER V
0 0.2 0.4 0.6 0.8 10
0.1
0.2
0.3
0.4
0.5
0.6
0.7
0.8
0.9
1
Correlation
Pro
b.
|ρij|
< a
bscis
sa
DM outside
DM in car
CCM outsideCCM in car
CCM+noise outside
CCM+noise in car
Figure 8: Cumulative distribution of the estimated MS antenna cor-relation coefficient for the phantom-plus-handset outside and inside thecar in Scenario B (NLOS) for direct measurements (DM) and synthetic(CCM) results.

Experimental Investigation of the Directional Outdoor-to-In-Car ... 173
Table 5: Summary of diversity gain (dB) and capacity gain (bits/s/Hz) forthe different scenarios and configurations.
Scen. A/BOutsideno user
Outsidewith user
In carno user
In carwith user
DG2 (1%) 10.1/10.7 9.2/9.7 9.9/10.3 9.6/10.2DG4 (1%) 16.0/17.3 14.4/15.2 16.5/17.2 14.8/16.8ECG 4× 2 2.0/2.4 1.7/2.4 2.4/2.7 2.1/2.6OCG 4× 2 2.3/2.1 1.8/1.6 2.5/2.1 1.8/2.1ECG 4× 4 4.1/4.7 3.5/4.6 4.7/5.5 4.4/5.2OCG 4× 4 3.6/4.3 3.3/4.0 4.4/4.9 4.2/4.7
where r is the rank of H, and γi is the SNR after power allocation (by waterfill-ing assuming channel knowledge at the Tx) to the sub-channel correspondingto λi and with SNR=
∑ri=1 γi. The channel matrix is normalized with the
square-root of the SISO channel power averaged over the sample space (herethe frequency samples, rotations and small-scale translations) in each scenarioand handset/user/car configuration. Thus, the average user efficiency and carpenetration loss is omitted and only statistical and individual antenna proper-ties of the channel are considered.
From the distribution of C over the sample space, the ergodic capacitygain (ECG) is taken as the difference between the mean MIMO capacity andthe mean of the best SIMO capacity, while the outage capacity gain (OCG) istaken at 10% outage level. The 4×4 channel matrix is formed by selecting fourvertically polarized antenna elements in the bottom row with one wavelengthspacing at the Tx, and in the 4×2 case the two single Rx antennas that providethe highest overall capacity is selected. The SNR was set to 10 dB.
The diversity and capacity results in Table 5 show only minor effects of theuser and the car environments when the impact of body loss and car penetrationloss are absent. Both the diversity gain and the capacity gain are somewhathigher in Scenario (B) compared to the Scenario (A). The user presence seemsto have a negative impact on both these measures which were also found in [4],while the car environment increases the performance of spatial multiplexing upto 1.1 bits/s/Hz for the 4× 4 system.
7 Conclusions
The purpose of this investigation of an outdoor-to-in-car radio channel at2.6 GHz has mainly been two-fold: i) to investigate the validity of a MIMOcomposite channel model (CCM) formed by a combination of a the directional

174 PAPER V
propagation channel and the far-field radiation patterns of array antennas, withrespect to MIMO performance, and ii) to evaluate the possibility to (accuratelyenough) perform directional channel estimation in the close confined car envi-ronment.
Two outdoor measurement campaigns have been performed where, specifi-cally, the influence of a car is considered at the mobile side.
From the measurements with a cylindrical array antenna, directional chan-nel parameter estimation was performed to form the propagation channel modelas a part of the composite channel model. Combined with measured antennapatterns of the handset-plus-user it is found that this channel model produceschannel properties such as path loss and channel statistics very similar to whatare found by the direct measurements with the handset-plus-user in the chan-nel. The composite channel model shows lower eigenvalue dispersion and higherantenna branch correlation as compared to the direct measurements. This isassumed to be an effect of the limited channel parameter resolution due tomeasurement noise and calibration errors.
The main challenge with the investigation was the directional estimationinside the car where parts of the car and, thus, possible sources of interaction(scattering) are within the far-field or Rayleigh distance of the antenna. Testsof the estimation algorithm on a single point source and two separated (inangle) point sources at a certain distance with a representative theoretic arrayantenna (to avoid antenna array calibration errors) show potential problemsas the sources get within distances from the antenna about the size of the car.Despite this violation we find that the directional estimation inside the carproduces reliable results, both regarding the angular distribution of the MPCs,as well as the singular value distributions of the composite channel. Thus, weconclude that the main specular components of the channel seem to accountalso for the most important statistical properties, and that the CCM can beused to model the outdoor-to-in-car channel.
Finally, with the CCM at hand, the specific influence of the car and the userwas evaluated both separatly and in combination. Apart from the penetrationloss of the car (in average between 2-8 dB) or in an interference-limited scenario,our results show little influence of the user and the car on the channel. Bothdiversity gain and capacity gain are found to be slightly higher in Scenario Bcompared to Scenario A, the user seems to decrease these measures, while thecar environment increases the capacity (at fixed SNR) by up to 1.1 bits/s/Hzfor the 4× 4 system.

Experimental Investigation of the Directional Outdoor-to-In-Car ... 175
Acknowledgment
The authors would like to thank Sony Ericsson Mobile Communications AB inLund, Sweden, for support with antenna range measurements. The work wassupported by a grant from the Swedish Research Council.

176 PAPER V
References
[1] M. Steinbauer, A. F. Molisch, and E. Bonek, “The double-directional radiochannel,” IEEE Antennas Propagat. Mag., vol. 43, no. 4, pp. 51–63, Aug.2001.
[2] J. A. Fessler and A. O. Hero, “Space-alternating generalized expectation-maximization algorithm,” IEEE Trans. Signal Processing, vol. 42, no. 10,pp. 2664–2677, Oct. 1994.
[3] F. Harrysson, J. Medbo, A. F. Molisch, A. J. Johansson, and F. Tufvesson,“The composite channel method: Efficient experimental evaluation of arealistic MIMO terminal in the presence of a human body,” in IEEE Veh.Technol. Conf. VTC 2008-Spring, Singapore, pp. 473–477, May 2008.
[4] ——, “Efficient experimental evaluation of a MIMO handset with userinfluence,” IEEE Trans. Wireless Commun., vol. 9, no. 2, pp. 853–863,Feb. 2010.
[5] A. F. Molisch, M. Steinbauer, M. Toeltsch, E. Bonek, and R. S. Thoma,“Capacity of MIMO systems based on measured wireless channels,” IEEEJ. Select. Areas Commun., vol. 20, no. 3, pp. 561–569, April 2002.
[6] P. S. Suvikunnas, J. Villanen, K. Sulonen, C. Icheln, J. Ollikainen, andP. S. Vainikainen, “Evaluation of the performance of multi-antenna termi-nals using a new approach,” IEEE Trans. Instrum. Meas., vol. 55, no. 5,pp. 1804–1813, Oct. 2006.
[7] J. Medbo and F. Harrysson, “Efficiency and accuracy enhanced super re-solved channel estimation,” in Proceedings of the 6th European Conferenceon Antennas and Propagation (EuCAP), Prague, Czech Republic, March2012.
[8] K. Haneda, J.-I. Takada, and T. Kobayashi, “Experimental evaluation ofa SAGE algorithm for ultra wideband channel sounding in an anechoicchamber,” in Ultra Wideband Systems, 2004. Joint UWBST IWUWBS.2004 International Workshop on, Kyoto, Japan, pp. 66–70, May 2004.
[9] M. Landmann and T. Jun-Ichi, “On the plane wave assumption in indoorchannel modelling,” in IEICE Society Conference, Sapporo, Japan, Sept.2005.
[10] K. Haneda, J.-I. Takada, and T. Kobayashi, “A parametric UWB propa-gation channel estimation and its performance validation in an anechoic
Experimental Investigation of the Directional Outdoor-to-In-Car ... 177
chamber,” IEEE Trans. Microwave Theory Tech., vol. 54, no. 4, pp. 1802–1811, June 2006.
[11] J. Medbo, M. Riback, H. Asplund, and J.-E. Berg, “MIMO channel char-acteristics in a small macrocell measured at 5.25 GHz and 200 MHz band-width,” in IEEE Veh. Technol. Conf. VTC 2005-Fall, vol. 1, Dallas, TX,pp. 372–376, Sept. 2005.
[12] J. Medbo, H. Asplund, J.-E. Berg, and N. Jalden, “Directional channelcharacteristics in elevation and azimuth at an urban macrocell base sta-tion,” in Antennas and Propagation (EuCAP), Proceedings of the 6th Eu-ropean Conference on, Prague, Czech Republic, March 2012.
[13] A. Richter, “Estimation of radio channel parameters: Models and algo-rithms,” Ph.D. dissertation, TU Ilmenau, Ilmenau, Germany, May 2005.
[14] M. Landmann, “Limitations of experimental channel characterisation,”Ph.D. dissertation, TU Ilmenau, Ilmenau, Germany, May 2008.
[15] F. Harrysson, T. Hult, and F. Tufvesson, “Evaluation of an outdoor-to-in-car radio channel with a four-antenna handset and a user phantom,” inIEEE Veh. Technol. Conf. VTC 2011-Fall, San Francisco, CA, Sept. 2011.
[16] A. F. Molisch, Wireless Communications. Chichester, U.K.: IEEE Press- Wiley, 2005.
[17] B. H. Fleury, “First- and second-order characterization of direction dis-persion and space selectivity in the radio channel,” IEEE Trans. Inform.Theory, vol. 46, no. 6, pp. 2027–2044, 2000.
[18] IEEE Std 145-1993, “IEEE standard definition of terms for antennas,”Antenna Standards Committee of the IEEE Antennas and PropagationSociety, IEEE, March 1993.
[19] R. Kattenbach, “Characterization of time-variant indoor radio channelsby means of their system and correlation functions,” Ph.D. dissertation,Univ. GhK Kassel, Shaker Verlag, Aachen, Germany, 1997, (in German).
[20] P.-S. Kildal and K. Rosengren, “Correlation and capacity of MIMO sys-tems and mutual coupling, radiation efficiency, and diversity of their an-tennas: Simulations and measurements in a reverberation chamber,” IEEECommun. Mag., vol. 42, pp. 104–112, Dec. 2004.

178 PAPER V
[21] V. Plicanic, B. K. Lau, A. Derneryd, and Z. Ying, “Actual diversity per-formance of a multiband diversity antenna with hand and head effects,”IEEE Trans. Antennas Propagat., vol. 57, no. 5, pp. 1547 –1556, May2009.