multiphase flow and transport through fractured heterogeneous porous media
TRANSCRIPT

www.elsevier.com/locate/jconhyd
Journal of Contaminant Hydrology 71 (2004) 89–110
Multiphase flow and transport through fractured
heterogeneous porous media
David A. Reynolds a,*, Bernard H. Kueperb
aCentre for Water Research, University of Western Australia, 35 Stirling Highway, Crawley, WA 6009, AustraliabDepartment of Civil Engineering, Queen’s University, Kingston, Ontario, Canada
Received 8 November 2001; received in revised form 14 August 2003; accepted 12 September 2003
Abstract
The migration of Dense, Non-Aqueous Phase Liquid (DNAPL) and dissolved phase
contamination through a fractured heterogeneous porous medium has been investigated through
the use of a multiphase compositional model. The sensitivity of the timescales of migration and the
distribution of contaminant in the subsurface to the mean permeability, the variance of the
permeability, and the degree of fracturing of the domain were examined. It was found that increasing
the mean permeability of the domain allowed the DNAPL to penetrate deeper into the subsurface,
while decreasing the mean permeability caused the DNAPL to pool at shallower depths. The
presence of fractures within the system was found to control the infiltration only in the most
fractured domain. Moment analysis of the nonwetting phase showed that large-scale movement had
ceased after approximately 9 years (maximum duration of the source-on condition was
approximately 4.5 years). This tended to be due to a redistribution of the DNAPL towards a
residual configuration, as was evidenced by the gradual trending of average nonwetting phase
saturations within the domain to a static value. The dissolved phase plume was found to migrate at
essentially the same rate as the nonwetting phase, due to the reduced relative permeability of lenses
containing DNAPL, and due to diffusive losses of mass to the matrix of fractured clay and silty-clay
lenses. Some exceptions to this were found when the DNAPL could not overcome the displacement
pressure of a lens, and could not by-pass the lens due to the lack of available driving force after the
source had been shut off.
D 2003 Elsevier B.V. All rights reserved.
Keywords: DNAPLs; Fractures; Porous media; Heterogeneous materials; Contaminant transport
0169-7722/$ - see front matter D 2003 Elsevier B.V. All rights reserved.
doi:10.1016/j.jconhyd.2003.09.008
* Corresponding author. Formerly at Department of Civil Engineering, Queen’s University, Kingston,
Ontario, Canada. Tel.: +61-8-9380-2408; fax: +61-8-9380-1015.
E-mail address: [email protected] (D.A. Reynolds).

D.A. Reynolds, B.H. Kueper / Journal of Contaminant Hydrology 71 (2004) 89–11090
1. Introduction
The presence of Dense, Non-Aqueous Phase Liquid (DNAPL) in the subsurface is
recognized as a significant source of long-term groundwater contamination at many sites
throughout North America and Europe (Cherry et al., 1996; Freeze and McWhorter, 1997).
DNAPLs of environmental concern include PCB oils, chlorinated solvents, coal tar, and
creosote. The migration of DNAPL through the subsurface will depend upon many factors,
such as the permeability of the porous medium, the physical and chemical properties of the
DNAPL (density, viscosity, etc.), and the volume and intensity of the release itself.
Schwille (1988), for example, performed extensive laboratory studies examining the
migration of several DNAPLs through a variety of porous media, showing that they may
pool above lower permeability layers below the watertable, and may also become trapped
as immobile residual. Field experiments have shown that DNAPL migration pathways
through the subsurface can be strongly influenced by even minor variations in perme-
ability (Poulsen and Kueper, 1992; Kueper et al., 1993).
Several authors have investigated the effects of subsurface heterogeneity on the
migration of DNAPL through the subsurface with the use of numerical models (e.g.
Kueper and Frind, 1991a,b; Kueper and Gerhard, 1995; Dekker and Abriola, 2000).
Dekker and Abriola (2000) performed a modelling study investigating the effects of spill
release rate, hydraulic gradient, and the statistical descriptions of the permeability field in
multiple realization studies incorporating random spatially correlated fields. Results
showed that the mean, variance, and vertical correlation length of the permeability field,
along with the spill rate, exerted the most influence on the distribution of the DNAPL in
the subsurface. Gerhard and Kueper (1995) investigated the influence of source strength
and size on the infiltration rate and lateral spreading of DNAPL in a water saturated
heterogeneous porous medium. The infiltration rates in 25 realizations of a spatially
correlated random field were found to be log-normally distributed and with a variance that
mimicked the underlying variation in the permeability field. Gerhard and Kueper (1995)
also found that increasing the size of the source in relation to the horizontal correlation
length decreased the variability of the infiltration rate. Neither the degree of lateral
spreading of the DNAPL body, nor the infiltration rate showed any tendency to converge
to an ensemble average. Bradford et al. (1998) used a numerical approach similar to that of
Dekker and Abriola (2000) to show that, if the wettability characteristics of a porous
medium are correlated with permeability, spatial variations in wettability can have a
dramatic impact on DNAPL distributions, resulting in higher nonwetting phase saturations
and increased lateral spreading.
Significant work has also been undertaken involving the numerical simulation of the
migration of DNAPL in fractured environments, based on the conceptual model of Kueper
and McWhorter (1991) which showed that the underlying physics controlling DNAPL
migration in porous media are identical to that for fractures. The majority of studies to date
(Murphy and Thomson, 1993; Slough et al., 1999a) have only dealt with the migration of
DNAPL through a single fracture, or through a fractured clay aquitard overlying a higher
permeability aquifer. Reynolds and Kueper (in press) studied the migration of Trichloro-
ethylene (TCE) through an idealized layered system consisting of 30 m of fractured clay
containing two thin interbedded sand lenses. It was found that the presence of the sand

D.A. Reynolds, B.H. Kueper / Journal of Contaminant Hydrology 71 (2004) 89–110 91
lenses retarded the migration rate of the DNAPL through the system by orders of
magnitude, as compared to a 30-m sequence of fractured clay without interspersed sand
beds. In addition, Reynolds and Kueper (in press) found that the presence of vertical
hydraulic gradients and the ratio of displacement pressures between the fractures and the
sand lenses also affected the migration rate. Slough et al. (1999b) found that the magnitude
of the displacement pressure of the rock matrix surrounding a fracture network exerted
significant control on the migration pattern of a DNAPL release.
The presence of fractures in clay environments has been well documented (e.g. McKay
et al., 1993), and evidence has pointed to the existence of fractures in silts and silty-clays
(e.g. Johnson, 1984). McKay and Fredericia (1995) found hydraulically active vertical
fractures to a depth of 15 m in a clayey till deposit in Sarnia, Canada. IT (1995)
determined that sub-vertical fractures exist in clay-rich deposits along the Gulf Coast of
North America to a depth of 40 m. Based on this evidence it is logical to assume that in
extremely heterogeneous environments, where the permeability ranges over several orders
of magnitude, fractures may exist across low permeability lenses linking higher perme-
ability lenses, resulting in a combination of fracture and porous media flow within the
system. To date, no investigation has focused on the role of fractures in the migration of
DNAPL in heterogeneous porous media. The objective of this study, therefore, is to
investigate the migration and entrapment of DNAPL in a heterogeneous permeability
environment, containing fractures in the lowest permeability lenses. To this end, a series of
multiphase flow and transport simulations are undertaken to investigate the importance of
various key parameters in the distribution of the DNAPL in the subsurface. The influence
of the mean and variance of the random permeability field, as well as the degree of
fracturing within the simulation domain, are studied.
2. Model and domain development
The numerical model used in this study (QUMPFS), developed by Reynolds and
Kueper (in press), has been tested against analytical solutions for multiphase flow and
mass transport under advection and dispersion. In addition, the model has been verified
against other published numerical simulators (Kueper and Frind, 1991a,b; Gerhard and
Kueper, 1995). QUMPFS is a three-dimensional multiphase compositional simulator, with
the capabilities of modeling advection, dispersive and diffusive fluxes, equilibrium and
non-equilibrium phase partitioning, and capillary hysteresis. The model utilizes a finite
volume approach to solve the partial differential equations governing isothermal multi-
phase flow and multicomponent transport in porous media (Abriola and Pinder, 1985):
B
Btðctb/SbxibÞ þj � ðctbxibmbÞ �j � ½/Sb
!DibjðctbxibÞ� � qib � Iib ¼ 0
b ¼ 1 . . . np; i ¼ 1 . . . nc
ð1Þ
where np is the number of phases, nc is the number of components, b is the particular phase
of interest, ctb is the molar density of phase b, / is the porosity of the medium, Sb is the

D.A. Reynolds, B.H. Kueper / Journal of Contaminant Hydrology 71 (2004) 89–11092
saturation of phase b, xib is the mole fraction of component i in phase b, mb is the Darcy
flux of phase b, D!
ib is the dispersion tensor for component i in phase b, qib is the source/
sink term for component i in phase b, Iib represents the inter-phase mass transfer of
component i to or from phase b, and t is time.
Equation set (1) is closed by assuming the phase saturations and the mole fractions of
each component comprising a phase both sum to unity. The model employs the
constitutive relationships of Brooks and Corey (1964) relating capillary pressure, satura-
tion, and relative permeability, with the modifications proposed by Gerhard et al. (1998) to
simulate hysteresis. The use of Brooks–Corey functions to represent two-phase flow in
fractures is supported by the work of Reitsma and Kueper (1994). The model is formulated
using a fully implicit approach, and utilizes full Newton–Raphson iteration with upstream
weighting of the relative permeabilities.
All simulations conducted in this study are carried out in a two-dimensional, vertical
section 120 m wide by 40 m high. The upper boundary is specified as the watertable
producing an initially water saturated domain. The wetting phase pressure along the
bottom of the domain is specified to produce an upward gradient of 0.05 (resulting in
downward wetting phase flow). Side boundaries are also modelled as fixed wetting phase
pressure and vary linearly between the top and bottom of the domain. The nonwetting
phase is introduced into the domain at a constant capillary pressure of 7158.4 Pa (equal to
0.5 m of TCE pooled above the watertable) along a 20 m wide patch centred along the top
of the domain. The sides and bottom of the domain have free-exit non-wetting phase and
dissolved NAPL phase boundary conditions applied to them. The domain is discretized
into 38,400 regularly spaced control volumes comprising 240 nodes in the horizontal
direction by 160 nodes in the vertical direction. A horizontal nodal spacing of 0.5 m and a
vertical spacing of 0.25 m is employed in all cases. A spatially correlated random
permeability field was generated assuming an exponential autocorrelation function. The
variance of the correlated permeability fields was set high (>5.5) to assure that the
generated permeabilities encompassed values ranging from a coarse sand (1.0 10� 9 m2)
to a lacustrine clay (1.0 10� 18 m2). The horizontal and vertical correlation lengths were
assigned values of 10 m and 1 m, respectively. The nodal discretization ensured that 12
and 40 correlation lengths were included in the horizontal and vertical directions,
respectively. The wide range in permeabilities is indicative of the thick sequences of
deltaic deposits found along the Gulf Coast of North America. Extensive hydrogeological
studies (IT, 1995) have shown that very wide ranges in permeability exist over a few
metres in the vertical direction and over tens of metres in the horizontal direction. The clay
and silt sized particles are deposited in low energy, marshy floodplain environments.
Periodic flood events are responsible for the sheet-like distribution of coarse grained
deposits, leading to thin cyclical beds of sands and silts mixed with the clays and silty
clays.
The use of a typical capillary pressure–saturation scaling relationship (e.g. Leverett,
1941) is not appropriate given the wide variation in the permeabilities in the generated
fields. The relationship employed in this work was, therefore, developed from values of
displacement pressure reported in the literature for various porous media. Results reported
by Brooks and Corey (1964), Thomas et al. (1968), Schowalter (1979), and Kueper and
Frind (1991b) were used to develop a relationship between displacement pressure and
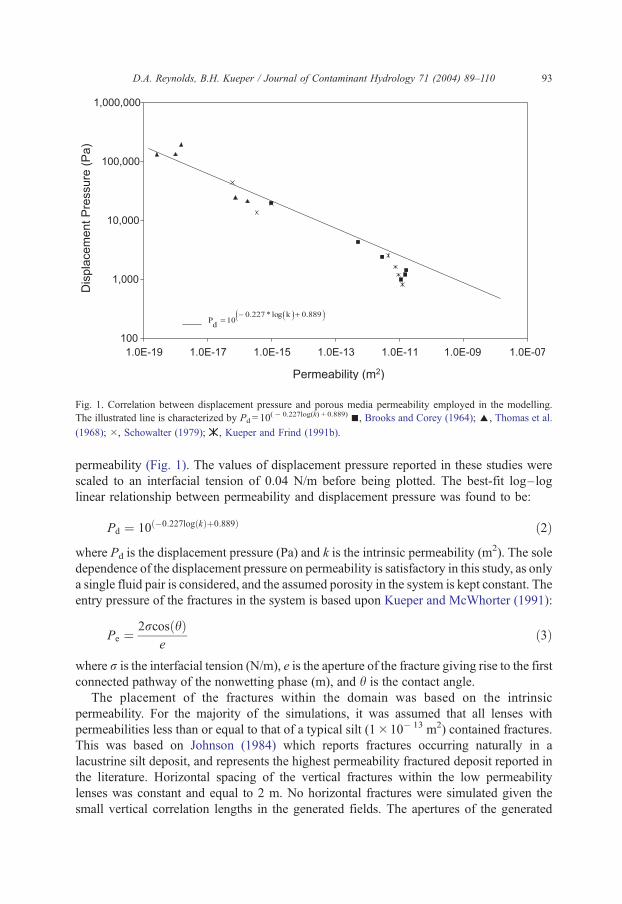
Fig. 1. Correlation between displacement pressure and porous media permeability employed in the modelling.
The illustrated line is characterized by Pd = 10(� 0.227log(k) + 0.889) n, Brooks and Corey (1964); E, Thomas et al.
(1968); , Schowalter (1979); , Kueper and Frind (1991b).
D.A. Reynolds, B.H. Kueper / Journal of Contaminant Hydrology 71 (2004) 89–110 93
permeability (Fig. 1). The values of displacement pressure reported in these studies were
scaled to an interfacial tension of 0.04 N/m before being plotted. The best-fit log–log
linear relationship between permeability and displacement pressure was found to be:
Pd ¼ 10ð�0:227logðkÞþ0:889Þ ð2Þ
where Pd is the displacement pressure (Pa) and k is the intrinsic permeability (m2). The sole
dependence of the displacement pressure on permeability is satisfactory in this study, as only
a single fluid pair is considered, and the assumed porosity in the system is kept constant. The
entry pressure of the fractures in the system is based upon Kueper and McWhorter (1991):
Pe ¼2rcosðhÞ
eð3Þ
where r is the interfacial tension (N/m), e is the aperture of the fracture giving rise to the first
connected pathway of the nonwetting phase (m), and h is the contact angle.
The placement of the fractures within the domain was based on the intrinsic
permeability. For the majority of the simulations, it was assumed that all lenses with
permeabilities less than or equal to that of a typical silt (110� 13 m2) contained fractures.
This was based on Johnson (1984) which reports fractures occurring naturally in a
lacustrine silt deposit, and represents the highest permeability fractured deposit reported in
the literature. Horizontal spacing of the vertical fractures within the low permeability
lenses was constant and equal to 2 m. No horizontal fractures were simulated given the
small vertical correlation lengths in the generated fields. The apertures of the generated

Fig. 2. Correlation between aperture and porous media permeability. The fit line is characterized by
e=(760,000 + 45,000 log(k))0.43. E, McKay et al. (1993); 5, Jorgensen et al. (1998); x, Hinsby et al. (1996); +,
IT (1995); n, Johnson (1984).
D.A. Reynolds, B.H. Kueper / Journal of Contaminant Hydrology 71 (2004) 89–11094
fractures were correlated to the permeability of the lenses surrounding them. Fig. 2
presents literature values of aperture in terms of the reported matrix permeability of the
fractured unit. The majority of these studies used modelling to determine ‘‘hydraulic’’
apertures for the medium in question, and no differentiation is made between ‘‘hydraulic’’
and mechanical apertures. The best-fit function to the presented data is given by:
e ¼ ð760; 000þ 45; 000logðkÞÞ0:43 ð4Þ
where e is the aperture (Am) and k is the intrinsic permeability (m2) of the porous medium.
The primary focus of this work is on the geologic controls on DNAPL and dissolved
phase migration through fractured heterogeneous environments. Three key geologic
parameters were investigated, the mean permeability of the generated field, the variance
in permeability, and the maximum permeability of units that were assigned fractures. The
base case domain used in the simulations is displayed in Fig. 3a, showing the random
permeability field in greyscale (with the fractures portrayed by the vertical white lines).
The values of the relevant parameters used in the base-case simulation are listed in Table
1, with the chemical parameters chosen to be representative of TCE. A summary of all
simulations is provided in Table 2. The sensitivity of the migration to the statistical
parameters governing the generated permeability field was evaluated by performing
identical release simulations with the mean equal to 10 times and one tenth of its base
value, and the variance equal to twice and one-half its base value (four simulations in
addition to base case). The generation of the permeability fields with different means was
performed with the same random seed, thus ensuring that the location and size of the

Fig. 3. Generated permeability fields (a) base case, (b) increased mean permeability, (c) increased permeability
variance, (d) increased cut-off permeability for fractures.
D.A. Reynolds, B.H. Kueper / Journal of Contaminant Hydrology 71 (2004) 89–110 95
lenses was identical, the only difference being the magnitude of the permeability. The
fracturing procedure was not varied between simulations, however, which resulted in
different fracture patterns between the fields. As described earlier, the fracturing

Table 1
Base case numerical model input parameters
Parameter Value
Mean porous media permeability 1.02 10� 13 (m2)
Variance of log of permeability 5.5
Porous media permeability horizontal correlation length 20.0 m
Porous media permeability vertical correlation length 1.0 m
Maximum porous media permeability fractured 1.02 10� 13 (m2)
Porous media porosity 0.30
Pore size distribution index (porous media and fractures) 2.0
Residual wetting phase saturation (porous media and fractures) 0.10
Porous media longitudinal dispersivity 1.0 (m)
Porous media transverse dispersivity 0.10 (m)
Fracture longitudinal dispersivity 0.01 (m)
Fracture transverse dispersivity 0.001 (m)
Wetting phase density 1000 (kg/m3)
Nonwetting phase density 1460 (kg/m3)
Wetting phase viscosity 0.001 (Pa s)
Nonwetting phase viscosity 0.00057 (Pa s)
Interfacial tension 0.01 (N/m)
Tortuosity 0.10
Free solution diffusion coefficient (porous media and fractures) 1.0110� 9 (m2/s)
Equilibrium mole fraction in aqueous phase 1.9 10� 4
Distribution coefficient (porous media and fractures) 1.26 10� 4 (m3/kg)
Porous media dry bulk density 1.82 103 (kg/m3)
Applied wetting phase gradient 0.05 Upwards
D.A. Reynolds, B.H. Kueper / Journal of Contaminant Hydrology 71 (2004) 89–11096
algorithm located all lenses with permeabilities less than 1.0 10� 13 m2, and produced
vertical fractures within the lenses at a spacing of 2 m. For the simulation with the
increased mean permeability, this procedure results in significantly less fracturing in the
system as compared to the base scenario (e.g. Fig. 3b vs. Fig. 3a). The fracture patterns
and locations in the permeability fields with differing variances are not as altered from
the base scenario as for the increased mean permeability case (e.g. Fig. 3c vs. Fig. 3a).
The final geologic control varied in this work was the cut-off permeability below which
fractures were created (two simulations). Fig. 3d presents the permeability field for the
case where the cut-off permeability was increased by an order of magnitude (to
1.0 10� 12 m2). This results in significantly more fracturing in the system, as more
lenses fall under the cut-off, as well as increasing the lengths of the existing fractures
Table 2
Parameters varied in sensitivity simulations
Simulation Mean permeability (m2) Variance of log
permeability
Maximum fractured
lens permeability (m2)
Low-k 1.02 10� 14 5.5 1.02 10� 13
Hi-k 1.02 10� 12 5.5 1.02 10� 13
Low-Var 1.02 10� 13 4.5 1.02 10� 13
Hi-Var 1.02 10� 13 6.5 1.02 10� 13
Cut-Low 1.02 10� 13 5.5 1.02 10� 14
Cut-Hi 1.02 10� 13 5.5 1.02 10� 12

Fig. 4. Generated permeability fields (a) base case, (b) decreased mean permeability, (c) decreased permeability
variance, (d) decreased cut-off permeability for fractures.
D.A. Reynolds, B.H. Kueper / Journal of Contaminant Hydrology 71 (2004) 89–110 97
through the higher permeability gradations surrounding the previously fractured lenses.
The reverse behaviour applies to the above discussion when the varied parameter is less
than the base parameter (Fig. 4a–d).

D.A. Reynolds, B.H. Kueper / Journal of Contaminant Hydrology 71 (2004) 89–11098
3. Results and discussion
3.1. Depth of migration
One of the most critical questions asked in a DNAPL release scenario is the
maximum depth of penetration of the nonwetting phase in the system. It is well
established that the migration pathway of the DNAPL is controlled by subtle
permeability variations in the subsurface (Kueper et al., 1993) whose locations cannot
be predicted by common field methods. The presence of high permeability fractures in
the path of the migrating DNAPL opens the possibility of significant ‘‘short-circuiting’’
of the DNAPL across otherwise impenetrable lenses.
Table 3 presents the cumulative length of fractures in the seven simulations conducted
in this work. Given the algorithm used to produce the fractures, the maximum length
possible for a domain consisting entirely of fractured media would be 2400 m, with the
simulations conducted in this work ranging between 1.5% and 30% of the maximum. Fig.
5 compares the lowest elevation of the DNAPL front versus time for the seven different
scenarios. The most obvious trend in the data is the importance of the mean porous media
permeability of the domain. The increased permeability simulation exhibits DNAPL
migrating quickly through the system, due to the lower entry pressures and higher
permeabilities encountered.
Fig. 6 reports the time required for a fixed mass of DNAPL to enter the domain
for each simulation. For each simulation, the equivalent of 3 m3 in a 0.1-m-thick
domain was released. As expected, the low permeability and high permeability fields
exhibit the lowest and highest rates of infiltration, respectively. It is of interest to
note the behaviour of the infiltration rates for the different cut-off permeability
simulations as compared to the base case scenario. The rate is almost identical to the
base for the situation where only lenses of permeability less than 1.0 10� 14 m2 are
fractured, implying that during the ‘‘source-on’’ portion of the simulations, the
geology encountered by the migrating DNAPL is similar and fractures have little
influence on the infiltration rate (this is supported by the results presented in Fig. 5).
The infiltration rate is greater than that of the base case for the simulation, however,
where lenses of permeability less than 1.0 10� 12 m2 are fractured, implying that the
Table 3
Total length of fractures present in simulations
Simulation Total linear length
of fractures (m)
Decreased cut-off permeability 65.0
Increased mean permeability 245.5
Decreased variance of permeability 276.3
Base 351.5
Increased variance of permeability 406.0
Decreased mean permeability 481.5
Increased cut-off permeability 728.5
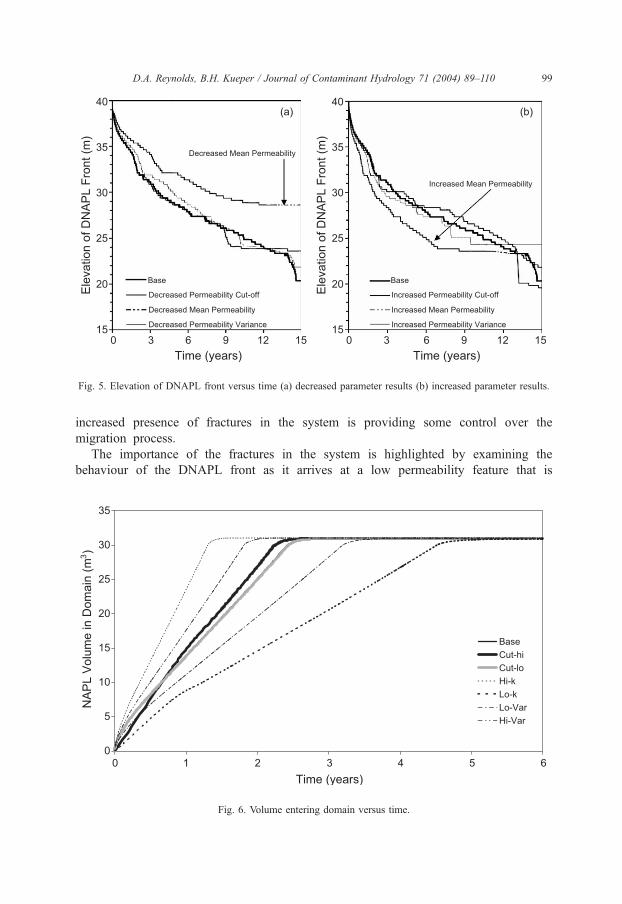
Fig. 5. Elevation of DNAPL front versus time (a) decreased parameter results (b) increased parameter results.
D.A. Reynolds, B.H. Kueper / Journal of Contaminant Hydrology 71 (2004) 89–110 99
increased presence of fractures in the system is providing some control over the
migration process.
The importance of the fractures in the system is highlighted by examining the
behaviour of the DNAPL front as it arrives at a low permeability feature that is
Fig. 6. Volume entering domain versus time.

D.A. Reynolds, B.H. Kueper / Journal of Contaminant Hydrology 71 (2004) 89–110100
present in all simulations. The silt lens, located at an elevation of approximately 32
m and spanning from 50 to 70 m horizontally, is present in some form in each of the
seven domains. Three ways exist to penetrate beyond this barrier; by-passing it
through porous media flow, penetrating into it through porous media flow, and short-
circuiting through it via fractures. The determination of which process has occurred
requires examination of the global pattern of migration, as the presence of the
DNAPL at an elevation equal to that of the bottom of the lens does not necessarily
signify breakthrough, since this could be occurring elsewhere in the domain.
Comparisons for four simulations are presented after 15 years of migration in Fig.
7. In the four scenarios presented, the low permeability lens under consideration has
been by-passed in the base case, increased mean permeability, and increased variance
of permeability simulations. The increased fracturing present in the increased
permeability cut-off simulation has allowed the DNAPL to both by-pass and short-
circuit across the lens. The short-circuiting is the quicker mechanism in this particular
circumstance, as evidenced by the rapid decrease in elevation of the DNAPL front
shortly after reaching the capillary barrier (Fig. 5). This pattern is signatory of flow
through fractures and its occurrence can be noted elsewhere in Fig. 5.
The time required for the by-passing of the capillary barrier in the increased mean
permeability scenario is similar to that of the increased permeability cut-off scenario,
but is entirely through by-passing, as evidenced in Fig. 7b. The decreased mean
permeability simulation requires greater than twice the time to by-pass the barrier due
to a combination of the decreased infiltration rate providing reduced driving forces, a
greater lateral extent of the lens, and a ‘‘skin’’ effect which occurs as the permeability
of the lens and it’s surroundings is decreased requiring higher capillary pressures to be
invaded, yet is not low enough to be fractured and provide high permeability
pathways. A second, more significant (both from a capillary and size standpoint)
barrier exists in every domain centred at an elevation of approximately 21 m and a
horizontal distance of 65 m. The upper surface of the lens is variable between
domains, due to the different controlling statistics underlying their generation, but is
located at approximately 24 m. After 15 years, four of the seven simulations have
resulted in the occurrence of DNAPL below this barrier. The three simulations that do
not exhibit DNAPL below this barrier (decreased mean permeability, increased variance
of permeability, and decreased cut-off permeability) have essentially stopped migration
after 15 years.
The near-vertical section of the migration versus time data for the increased cut-off
permeability scenario at approximately 13 years in Fig. 5 is the rapid crossing of the lens
through the extensive fracturing in this domain. The slow vertical migration that occurs in
this simulation after breaking through the lens is a function of the small volumes which
fractures are capable of transmitting. Reynolds and Kueper (in press) found similar
behaviours in homogeneous domains, where the presence of porous media underlying
fractured formations resulted in significant increases in vertical migration times. At the 15-
year point in the migration, the only other simulation to breach the lower capillary barrier
is the base case, and this has occurred in a single fracture only (Fig. 7a), and has not in
actuality exited the fracture due to the relatively high displacement pressures in the
underlying silty-sand formation.

Fig. 7. Wetting phase saturations after 15 years (a) base case, (b) increased mean permeability, (c) increased
permeability variance, (d) increased cut-off permeability for fractures.
D.A. Reynolds, B.H. Kueper / Journal of Contaminant Hydrology 71 (2004) 89–110 101
D.A. Reynolds, B.H. Kueper / Journal of Contaminant Hydrology 71 (2004) 89–110102
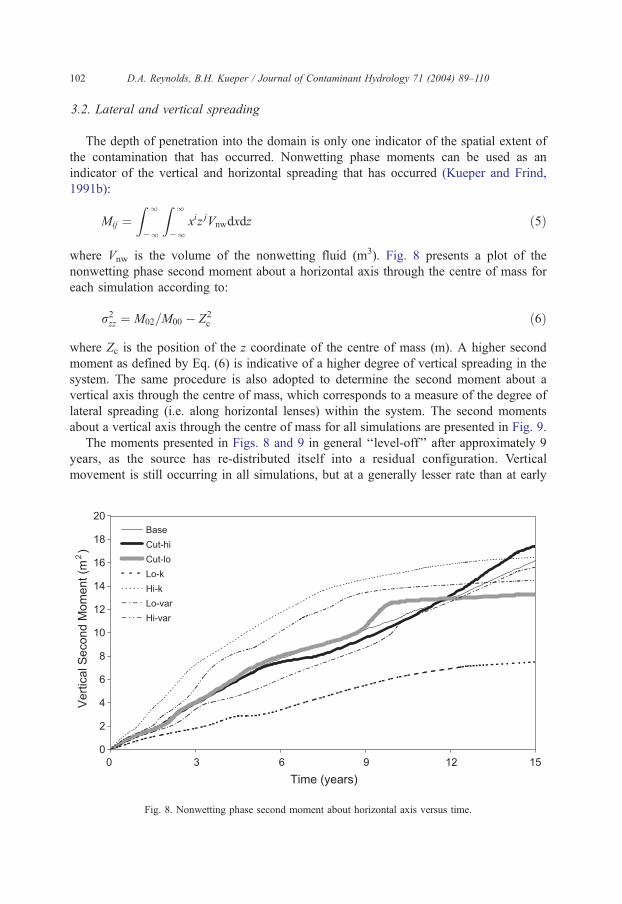
3.2. Lateral and vertical spreading
The depth of penetration into the domain is only one indicator of the spatial extent of
the contamination that has occurred. Nonwetting phase moments can be used as an
indicator of the vertical and horizontal spreading that has occurred (Kueper and Frind,
1991b):
Mij ¼Z l
�l
Z l
�lxiz jVnwdxdz ð5Þ
where Vnw is the volume of the nonwetting fluid (m3). Fig. 8 presents a plot of the
nonwetting phase second moment about a horizontal axis through the centre of mass for
each simulation according to:
r2zz ¼ M02=M00 � Z2
c ð6Þ
where Zc is the position of the z coordinate of the centre of mass (m). A higher second
moment as defined by Eq. (6) is indicative of a higher degree of vertical spreading in the
system. The same procedure is also adopted to determine the second moment about a
vertical axis through the centre of mass, which corresponds to a measure of the degree of
lateral spreading (i.e. along horizontal lenses) within the system. The second moments
about a vertical axis through the centre of mass for all simulations are presented in Fig. 9.
The moments presented in Figs. 8 and 9 in general ‘‘level-off’’ after approximately 9
years, as the source has re-distributed itself into a residual configuration. Vertical
movement is still occurring in all simulations, but at a generally lesser rate than at early
Fig. 8. Nonwetting phase second moment about horizontal axis versus time.

D.A. Reynolds, B.H. Kueper / Journal of Contaminant Hydrology 71 (2004) 89–110 103
time. This is consistent with the leading-edge vertical migration results presented in Fig. 5.
The DNAPL in the exceptions to this case (base case, increased permeability cut-off,
decreased permeability cut-off) is still migrating vertically, but has essentially ceased
spreading horizontally (Fig. 9).
The maximum depth of penetration into a system, however, does not provide a
complete picture of the extents of DNAPL contamination. The maximum vertical
penetration portrayed in Fig. 5 could be the result of DNAPL travelling down a single
fracture, while the bulk of the DNAPL resides higher in the system. Combining the
results of Fig. 5 with those of Fig. 8 (vertical second moments) produces a more
accurate view of the vertical extent of the DNAPL contamination in the system. Based
on Fig. 5, after 12 years the maximum penetration into the system for all the scenarios
(with the exception of the reduced mean permeability simulation) is between elevations
of 23 and 25 m. Comparing the degree of vertical spreading between simulations (Fig.
8) shows that only the base case, decreased variance of permeability and low
permeability cut-off simulations have similar vertical second moments, and therefore
similar vertical DNAPL distributions in the subsurface. Coupled with this, the similar-
ities in horizontal second moments (Fig. 9) in these simulations indicates that the
DNAPL body is migrating in a similar manner in these three domains. It is of interest to
note that the lower infiltration rate exhibited by the reduced variance of permeability
simulation does not affect the vertical migration pattern of the DNAPL, but rather the
extents of the horizontal migration.
The general trends exhibited in regards to the vertical spreading of the DNAPL body
are expected, based on the underlying permeability distributions. The increased mean
permeability domain exhibits the largest degree of vertical spreading, as the boundary
capillary pressures force the body through the horizontal lenses. Conversely, the reduced
Fig. 9. Nonwetting phase second moment about vertical axis versus time.

D.A. Reynolds, B.H. Kueper / Journal of Contaminant Hydrology 71 (2004) 89–110104
mean permeability simulation exhibits the least degree of vertical spreading. The
decreased variance of permeability simulation migrates vertically at a slower rate than
the increased scenario, but penetrates deeper into the system. These results are
mimicked by the vertical second moments, which show the increased variance of
permeability simulation spreading to a greater degree at early time, and to a lesser
degree at late time. This is likely a function of the generated distribution allowing for
migration along a high permeability pathway at early time in the more heterogeneous
domain.
Fig. 10 presents the arithmetic average wetting phase saturations in each domain as a
function of time (all nodes are included in this calculation, whether invaded by DNAPL
or not). The reduced spreading in the reduced mean permeability domain is accounted
for in the increased average wetting phase saturations. The DNAPL has tended to remain
trapped in lenses at greater saturations that in the other simulations. The general
increasing trends exhibited by all simulations in Fig. 10 (after the abrupt inflection
point) represents the redistribution of the DNAPL after the source has been turned
‘‘off’’. The increase in average wetting phase saturations marks the re-distribution of the
NAPL towards residual levels.
The presence of fractures in the porous media domains studied here has not influenced
the vertical migration of the DNAPL body to a significant degree, but has affected the
horizontal spreading. The increased cut-off permeability scenario has managed to avoid
the high permeability ‘‘sink’’ located at the left side of the domain at an elevation of 30 m
(Fig. 3). This simulation (as well as the decreased mean permeability) was the only one to
display this behaviour. The increased density of fracturing in the system allowed the
Fig. 10. Average wetting phase saturation versus time (a) decreased parameter results (b) increased parameter
results.

D.A. Reynolds, B.H. Kueper / Journal of Contaminant Hydrology 71 (2004) 89–110 105
DNAPL to by-pass the ‘‘sink’’ by migrating vertically through a lower permeability layer.
Similar behaviour (to a lesser degree) can be seen to occur on the right hand edge of the
DNAPL body.
The changing nature of the DNAPL body with time is evidenced by comparing the
second moments of the increased mean permeability simulation. The DNAPL in this
domain spreads laterally and vertically faster than any other simulation, due to the high
capillary pressure to displacement pressure ratio as compared to the other simulations.
Examination of Fig. 9 shows the degree of horizontal spreading decreases after 6 years,
however. This is not indicative of the edges of the DNAPL body receding, but could be
due to the mobile DNAPL mass draining slowly back towards the middle of the domain
and vertically downwards, or a migration of the centre of mass.
3.3. Timescales of DNAPL movement
Another important aspect concerning the migration of a DNAPL through the subsurface
is the timeframe during which movement occurs. The incorporation of hysteresis and
trapping in the constitutive relationships within the model allows for simulation of the
production of residual DNAPL upon re-distribution. It should be pointed out that the
particular formulation of the hysteretic relationship used, as well as the employed
parameters, will influence the time of migration. The results presented here, therefore,
are an attempt to determine the relative effects of the altered permeability fields, rather
than an attempt to produce a general statement on the migration times of DNAPL spills.
In the process of assessing the migration of a DNAPL body after its release to the
subsurface, differentiation must be made between migration and re-distribution and the
parameters used to indicate each. The results presented in Fig. 5 represent the migration of
the DNAPL vertically through the subsurface, resulting in further contamination as the
front drops. From these results, it can be concluded that in the majority of the simulations,
DNAPL has stopped rapid large-scale migration after 15 years (with the possible exception
of the increased permeability for fracturing scenario). The use of moment analysis,
however, does not necessarily indicate that a larger volume of the subsurface is being
contaminated with increasing moments. The DNAPL may be re-distributing within the
body after the source has been removed (as is evidenced in Fig. 10), and not increasing in
volume.
The second moment results presented in Figs. 8 and 9 allow for some indication of the
continuing movement of the DNAPL body. If the second moments are stabilizing with
time, it can be inferred (in this work) that the DNAPL body has, at least temporarily,
slowed in its large-scale migration. Of the seven simulations presented in Fig. 9 it would
appear that the increased variance of permeability simulation is the only one exhibiting
lateral DNAPL migration to any great extent after 15 years. The 15 year ‘‘snap-shot’’
presented in Fig. 7 shows that the high permeability lens located in the upper left hand side
of the domain contains high nonwetting phase saturations, and is exiting the side of the
domain (this is the only simulation in which this occurred). Slow migration laterally is also
occurring above the centrally located low permeability barrier.
The moments presented in Fig. 8, however, indicate that vertical redistribution of the
DNAPL after 15 years is still occurring in all but three scenarios (reduced mean

D.A. Reynolds, B.H. Kueper / Journal of Contaminant Hydrology 71 (2004) 89–110106
permeability, increased mean permeability, and increased variance of permeability). This is
an indication that while the presence of fractures does not exhibit a controlling influence
on the extent of vertical DNAPL migration in the systems studied, they do allow for
extended periods of movement. The two altered mean permeability simulations (which are
no longer migrating vertically) have the least amount of fracture length contaminated by
DNAPL, due to the few fractures present in the increased mean permeability scenario, and
the lack of fractures encountered in the decreased mean permeability scenario. The
remaining scenarios have significant flow occurring in the fractures, as well as in the
porous media underlying the fractures. The base case scenario was extended to 30 years
simulation time, and had yet to reach asymptotic behaviour (data not shown).
3.4. Aqueous phase contamination
The main focus of this work has been on the migration of the nonwetting phase through
the seven simulated systems. All simulations conducted in this work also included
equilibrium dissolution as well as advective/dispersive transport of the dissolved phase.
The upward gradient applied (0.05) resulted in an average downward retarded solute
velocity of 2.98 m/year. This is locally variable due to the combined effects of local-scale
permeability and the reduced relative permeability due to the presence of DNAPL. In all
simulations the majority of the organic remained in the nonwetting phase throughout the
15 years of simulated migration.
Fig. 11 presents ‘‘snap-shots’’ of the contaminant plume after 15 years of simulation for
the base case, decreased mean of permeability, decreased variance of permeability, and
decreased cut-off permeability for fracturing scenarios. In general, the arrival times of the
dissolved phase are not significantly in advance of the nonwetting phase. In the 15 years of
simulated migration, the dissolved phase would be expected to have migrated approxi-
mately 45 m vertically (assuming a homogeneous domain at the mean permeability).
Examination of Fig. 11 shows that, despite the presence of high permeability pathways,
this has not occurred in any scenario. Taking the base case scenario, and the average
wetting phase saturation in the domain from Fig. 10, the presence of the nonwetting phase
would reduce the expected vertical migration of the aqueous phase to approximately 16 m,
less than that observed for each simulation presented in Fig. 11. There are isolated
instances, however, where the aqueous phase has migrated significantly ahead of the
nonwetting phase.
In certain cases, the DNAPL source has become exhausted, and the vertical migration
has stopped slightly above a fractured unit (for example the protrusion on the right hand
side of the main DNAPL body in the base and increased variance of permeability
simulations at 80 m in Fig. 7). The wetting phase flow is being funnelled around this
area due to the reduced permeability caused by the presence of the DNAPL and the high
permeability pathway below represented by the fractures. This causes the dissolved phase
to migrate through the fractures and appear ‘‘ahead’’ of the DNAPL.
Due to the discretization limitations imposed by the available computational resources,
this migration is not as retarded due to matrix diffusion as would be the case in an
analytical formulation. To examine the impact of this, an analysis was conducted of the
migration of dissolved TCE through a 1-m-long 130-Am-aperture fracture (equivalent to a

Fig. 11. TCE concentrations (mg/l) after 15 years (a) base case, (b) decreased mean permeability, (c) decreased
permeability variance, (d) decreased cut-off permeability for fractures.
D.A. Reynolds, B.H. Kueper / Journal of Contaminant Hydrology 71 (2004) 89–110 107
silty sand in this work) within a similar hydrological setting (matrix porosity, retardation,
aqueous phase velocity, etc.) using the analytical method of Sudicky and Frind (1982). The
analytical method showed that concentrations exiting a 1-m-long fracture exceeded 1 ppm
in less than 10 days, indicating that the coarse discretization in the numerical model

D.A. Reynolds, B.H. Kueper / Journal of Contaminant Hydrology 71 (2004) 89–110108
provides reasonably accurate results for the large aperture fractures. Concentrations exiting
a 30 Am fracture in the same setting would require more than 150 years to reach 1 ppm,
indicating that discretization becomes more important as the fracture aperture decreases.
The second situation in which the dissolved phase occurs in advance of the DNAPL
also involves the deviation of the flowlines due to increased permeability zones in the
domain that are not due to fractures. An examination of the dissolved phase in the reduced
variance of permeability simulation (Fig. 1c) shows the migration of the aqueous phase out
the left side of the domain through the high permeability lens at 30 m elevation discussed
earlier. In general, however, the vertical aqueous phase migration is not significantly in
advance of the DNAPL, under the moderate gradients applied in this work. Visual
examination of the concentration distributions presented in Fig. 11 shows that the majority
of the aqueous phase concentrations are at saturation levels due to the equilibrium mass
transfer assumption used in the modelling. The low aqueous phase velocities discussed
earlier result in little spreading of the aqueous phase, which results in the temporal
behaviour of the average aqueous phase concentration being relatively invariant.
4. Conclusions and implications
The migration of DNAPL and dissolved phase contamination through a fractured
heterogeneous porous medium has been investigated through the use of a multiphase
compositional model. The sensitivity to the mean permeability, the variance of the
permeability, and the cut-off permeability below which units are assumed fractured was
examined. A release of TCE was allowed to migrate for 15 years, and the resultant
distribution of the nonwetting and dissolved phases was examined. The investigation used
relationships between the permeability of a lens and fracture aperture, and between the
permeability and displacement pressure that were developed for this work from published
values.
The presence of vertical fractures in the low permeability units of severely heteroge-
neous soils was found to, in general, increase the vertical migration of both the non-
wetting and dissolved phases. These high permeability vertical pathways were found to
provide ‘‘short-circuits’’ for aqueous and non-aqueous phase contamination through
otherwise competent capillary barriers. In most cases, the non-wetting phase was also
found to by-pass these capillary barriers when they were encountered during the ‘‘source-
on’’ portion of the simulations. The reduction in driving force, which develops during
imbibition, however, often prevents the flow of non-wetting phase around the barriers
implying that the importance of the fractures as vertical conduits increases with time since
the release.
Vertical fractures increase in importance with their presence in increasing perme-
ability units. Simulations with fractures present in units with permeabilities greater than
1.0 10� 12 m2 were found to penetrate the farthest into the aquifer, and spread the
least laterally. Even though these simulations contained the most fractures, the total
number of fractures present, however, is not an effective indicator of the maximum
depth of migration, as simulations with reduced mean permeabilities (and therefore

D.A. Reynolds, B.H. Kueper / Journal of Contaminant Hydrology 71 (2004) 89–110 109
significantly more fracturing) were found to penetrate the shallowest and take the
longest to infiltrate.
The migration of the dissolved phase in most cases was approximately co-incident
with the non-wetting phase, despite the presence of an upwards hydraulic gradient. In
general, the presence of fractures in these systems does not result in a significant
increase in risk due to the vertical migration of the aqueous phase, except when coupled
with the presence of non-wetting phase in the fractures. Significant migration of the
aqueous phase (in the absence of nonaqueous phase) only occurred in large aperture
fractures (f 130 Am), as matrix diffusion in small aperture fractures significantly retards
the migration rate.
The bulk horizontal migration of the nonwetting phase in the domains used in this study
had stopped after approximately 15 years. Bulk vertical migration, however, continues for
at least 30 years in some cases. The presence of fractures may not be a controlling force on
the overall extent of vertical nonwetting phase penetration, but does play an important role
in regards to extending the duration of nonwetting phase migration.
Two of the main findings of this work have significant implications to actual release
scenarios. The historical approach when dealing with the release of DNAPLs to the
subsurface is to attempt to identify capillary barriers that will arrest vertical migration
(such as vertically and horizontally extensive clay or silt units). Previous work by the
authors and others has shown that the existence of extensive capillary barriers is not a
guarantee of vertical containment if the barriers contain fractures. This work has shown
that in highly heterogeneous deposits the existence of fractures is less important than in
more homogeneous situations, and that the spatial variability of the porous media
permeability is a more effective mitigant. The ultimate depth of penetration will be
dependent on the volume of release and the degree of spreading. This will dictate
whether such deposits are capable of protecting deeper groundwater sources. Future
work should consider the importance of the spatial correlation lengths of the perme-
ability field, as it can be envisioned that the types of deposits characterized by large
vertical correlation lengths would be more susceptible to nonwetting phase short-
circuiting through fractures.
References
Abriola, L.M., Pinder, G.F., 1985. A multiphase approach to the modeling of porous media contamination by
organic compounds: 1. Equation development. Water Res. Res. 27 (6), 11–18.
Bradford, S.A., Abriola, L.M., Rathfelder, K., 1998. Flow and entrapment of dense nonaqueous phase liquids in
physically and chemically heterogeneous formations. Adv. Water Resour. 22 (2), 117–132.
Brooks, R.H., Corey, A.T., 1964. Hydraulic properties of porous media. Hydrol. Paper, vol. 3. Colorado St. Univ.,
Fort Collins, CO.
Cherry, J.A., Feenstra, S., MacKay, D.M., 1996. Concepts for the remediation of sites contaminated with
dense nonaqueous phase liquids (DNAPLs). In: Pankow, J.F., Cherry, J.A. (Eds.), Dense Chlorinated
Solvents and Other DNAPLs in Groundwater: History, Behaviour, and Remediation. Waterloo Press,
Portland, OR, pp. 475–506.
Dekker, T.J., Abriola, L.M., 2000. The influence of field-scale heterogeneity on the infiltration and
entrapment of dense non-aqueous phase liquids in saturated formations. J. Contam. Hydrol. 42,
187–218.

D.A. Reynolds, B.H. Kueper / Journal of Contaminant Hydrology 71 (2004) 89–110110
Freeze, R.A., McWhorter, D.B., 1997. A framework for assessing risk reduction due to DNAPL mass removal
from low permeability soils. Ground Water 35 (1), 111–123.
Gerhard, J.I., Kueper, B.H., Hecox, G.R., 1998. The influence of waterflood design on the recovery of mobile
DNAPLs. Ground Water 36 (2), 283–292.
Hinsby, K., McKay, L.D., Jorgensen, P., Lenczewski, M., Gerba, C.P., 1996. Fracture aperture measurements and
migration of solutes, viruses, and immiscible creosote in a column of clay-rich till. Ground Water 34 (6),
1065–1075.
International Technology, 1995. Base Clay Characterization. Report, Phase II Draft Sitewide RFI Report, Volume
3 of 14, Binder 1 of 2.
Johnson, R.L., 1984. The Groundwater Transport of Chlorophenolics in a Highly Fractured Soil at Alkali Lake,
OR. PhD Thesis, Oregon Graduate Center, Beaverton, OR 97006.
Jorgensen, P.R., McKay, L.D., Spliid, N.H., 1998. Evaluation of chloride and pesticide transport in a
fractured clayey till using large undisturbed columns and numerical modeling. Water Res. Res. 34 (4),
539–553.
Kueper, B.H., Frind, E.O., 1991a. Two-phase flow in heterogeneous porous media: 2. Model development. Water
Res. Res. 27 (6), 1049–1057.
Kueper, B.H., Frind, E.O., 1991b. Two-phase flow in heterogeneous porous media: 2. Model application. Water
Res. Res. 27 (6), 1058–1070.
Kueper, B.H., Gerhard, J.I., 1995. Variability of point source infiltration rates for two-phase flow in heteroge-
neous porous media. Water Res. Res. 31 (12), 2971–2980.
Kueper, B.H., McWhorter, D.B., 1991. The behaviour of dense, nonaqueous phase liquids in fractured clay and
rock. Ground Water 29 (5), 716–728.
Kueper, B.H., Redmond, D., Starr, R.C., Reitsma, S., Mah, M., 1993. A field experiment to study the behaviour
of tetrachloroethylene below the water table: spatial distribution of residual and pooled DNAPL. Ground
Water 31 (5), 756–778.
Leverett, M.C., 1941. Capillary behaviour in porous solids. AIME Trans. 142, 152–169.
McKay, L.D., Fredericia, J., 1995. Distribution, origin, and hydraulic influence of fractures in a clay-rich glacial
deposit. Can. Geotech. J. 32, 957–975.
McKay, L.D., Cherry, J.A., Gillham, R.W., 1993. Field experiments in a fractured clay till: 1. Hydraulic con-
ductivity and fracture aperture. Water Res. Res. 29 (4), 1149–1162.
Murphy, J.R., Thomson, N.R., 1993. Two-phase flow in a variable aperture fracture. Water Res. Res. 29 (10),
3453–3476.
Poulsen, M., Kueper, B.H., 1992. A field experiment to study the behaviour of tetrachloroethylene in unsaturated
porous media. Environ. Sci. Technol. 26 (5), 889–895.
Reitsma, S.R., Kueper, B.H., 1994. Laboratory measurement of capillary pressure–saturation relationships in a
rock fracture. Water Res. Res. 30 (4), 856–878.
Reynolds, D.A., Kueper, B.H., 2001. Multiphase flow and transport in fractured clay/sand sequences. J. Contam.
Hydrol. 51 (1–2), 41–62.
Schowalter, T.T., 1979. Mechanics of secondary hydrocarbon migration and entrapment. Am. Assoc. Pet. Geol.
Bull. 63 (5), 723–760.
Schwille, F., 1988. Dense Chlorinated Solvents in Porous and Fractured Media. Trans. by J.F. Pankow, Lewis,
Chelsea, MI.
Slough, K.J., Sudicky, E.A., Forsyth, P.A., 1999a. Numerical simulation of multiphase flow and phase partition-
ing in discretely fractured geologic media. J. Contam. Hydrol. 40, 107–136.
Slough, K.J., Sudicky, E.A., Forsyth, P.A., 1999b. Importance of rock matrix entry pressure on DNAPL migra-
tion in fractured geologic materials. Ground Water 37 (2), 237–244.
Sudicky, E.A., Frind, E.O., 1982. Contaminant transport in fractured porous media: analytical solutions for a
system of parallel fractures. Water Res. Res. 18, 1634–1642.
Thomas, L.K., Katz, D.L., Tek, M.R., 1968. Threshold pressure phenomenon in porous media. SPE J. 243,
174–184.