multilateral trade liberalization and government … finding highlights the importance for members...
TRANSCRIPT

Abstract
This paper contributes to the impact of domestic trade liberalization on government revenue by examining whether multilateral trade policy liberalization is important for government revenue. Our empirical analysis uses a panel dataset covering 169 countries from 1995 to 2013 to provide evidence that multilateral trade policy liberalization does have a positive impact on government revenue. However, this impact appears to be dependent upon both countries’ level of development and their level of domestic trade policy liberalization. This finding highlights the importance for members of the World Trade Organization to promote multilateral trade liberalization. Further, restrictive domestic trade policies, which could undermine multilateralization efforts, will ultimately weaken the positive impact of multilateral trade liberalization on government revenues.
JEL Classifications: F13, H2Keywords: Multilateral Trade Policy Liberalization, Domestic Trade Policy, Government Revenue
ⓒ 2017-Center for Economic Integration, Sejong Institution, Sejong University, All Rights Reserved. pISSN: 1225-651X eISSN: 1976-5525
Multilateral Trade Liberalization and Government RevenueSèna Kimm GnangnonWorld Trade Organization, Switzerland
*Corresponding Author: Sèna Kimm Gnangnon; World Trade Organization, 154 Rue de Lausanne, 1211 Genève 2, Switzerland; Email: [email protected]; [email protected]
Journal of Economic Integration
Vol.32 No.3, September 2017, 586~614http://dx.doi.org/10.11130/jei.2017.32.3.586
jei

Multilateral Trade Liberalization and Government Revenue jei
587
I. Introduction
A number of studies in public finance have investigated the impact of international trade and liberalization on government revenue with mixed results.
Nashashibi and Bazoni (1994), Khattry and Rao (2002), and Cagé and Gadenne (2014), have found that trade liberalization undermines tax revenues, while Ebrill, Stotsky, and Gropp (1999) and Adam, Bevan, and Chambas (2001) have reported a positive effect of trade openness on tax revenues. Yet Agbeyegbe, Stotsky, and WoldeMariam (2006) have provided evidence to the relationship between trade liberalization and tax revenue may not be conclusive as this relationship depends on the measure used as a proxy for trade liberalization. More recent studies by Thomas and Treviño (2013), Crivelli and Gupta (2014), and Brun, Chambas, and Mansour (2015), have reported a positive impact of trade openness on non-resource tax revenue, although the role of trade openness in non-resource tax revenue mobilization was not focused on these studies. In recent years, the world has witnessed a proliferation of bilateral and regional trade agreements, in particular, mega-regional trade agreements. The latter include the Trade Pacific Partnership (TPP) and the Canada-European Union Comprehensive Economic and Trade Agreement (CETA), which was signed by Canada in October 2016 and is under consideration for ratification by the European member countries. Other mega-regional trade agreements that are under negotiation include the Transatlantic Trade and Investment Partnership (TTIP) and the Regional Comprehensive Economic Partnership (RCEP). All these mega-regional trade agreements would constitute a major step toward greater multilateral trade policy liberalization.
Since 2013, and for the first time since the creation of the World Trade Organization (WTO) in 1995, WTO members have delivered substantial multilateral outcomes (e.g., the Trade Facilitation Agreement and Export Competition Decision), including at the Bali 2013 Ministerial Conference and the Nairobi 2015 Trade Ministers Conference. These outcomes have significantly contributed to the fostering of multilateral trade liberalization. However, despite these efforts by the international trade community, and particularly by WTO members, the world is currently facing a backlash against international trade. This growing anti-trade sentiment disregards the well-known positive effects of international trade by strongly emphasizing fair distribution of trade benefits across societies. It is emerging in a world that is experiencing the slowest pace of trade growth since the financial crisis of 2009 (WTO 2016). In addition, the WTO

Vol.32 No.3, September 2017, 586~614 Sèna Kimm Gnangnon
http://dx.doi.org/10.11130/jei.2017.32.3.586jei
588
has projected that global trade should expand between 1.8 and 3.6 per cent in 2017 and between 2.1 and 4 percent in 2018, given the uncertainty over near-term economic and policy developments (WTO 2017). The prevailing anti-trade sentiment could undermine the process of multilateral trade liberalization, and the WTO should continue to safeguard against it.
This paper contributes to the impact of trade policy on public revenue by investigating the implications of multilateral trade liberalization for government revenue. In other words, this study aims to examine whether the backlash against international trade will hurt the mobilization of government revenue.
The empirical analysis conducted on a panel of 163 countries that includes both developed and developing countries over the period 1995~2013 conveys the following three important messages. First, multilateral trade policy liberalization exerts a positive impact on government revenue in the medium to long term. This finding also applies to Least Developed Countries (LDCs). Second, the impact of multilateral trade liberalization on government revenue depends on the country’s level of economic development as captured in the real per capita Gross Domestic Product (GDP). Finally, multilateral trade policy liberalization results in higher government revenue when countries’ domestic trade policy liberalization has reached a certain level. In terms of policy implications, these findings suggest that the backlash against international trade, which could result in less multilateral trade policy liberalization, may hurt countries’ public revenues and undermine their ability to finance the Sustainable Development Goals (SDGs). Moreover, our findings indicate that very low income countries may not see the impact of multilateral trade policy liberalization on government revenue because they lack the required trade and institutional capacity to benefit from such liberalization. Only a joint effort with the international community such as international financial institutions and regional development banks can help them overcome the constraints in reaping the benefits of multilateral trade policy liberalization.
The rest of the paper is organized as follows. Section II discusses the theoretical effects of domestic trade policy liberalization and multilateral trade policy liberalization on government revenues. Section III lays out the model specification and discusses the empirical strategy for estimating it. Section IV interprets the results, and Section V presents the conclusions of the study.
Multilateral Trade Liberalization and Government Revenue jei
589
II. Literature Review
There is huge literature on the impact of trade liberalization on public revenue. In this section, we first briefly provide a literature review of this subject before moving on to discuss the impact of multilateral trade policy liberalization on government revenues.
A. Domestic trade policy and government revenue
The literature on the determinants of government revenue in developing countries has identified the foreign trade sector as one of the structural factors in how governments mobilize revenue. This sector is an important source of tax revenue.
Indeed, the monetized nature of the international trade sector makes the collection of trade taxes easier than the collection of income taxes in low-income countries. As Stotsky and WoldeMariam (1997) point out, there are certain features of international trade that make it more amenable to taxation compared with those of domestic activities; Bornhorst, Gupta, and Thornton (2009) and Drummond, Daal, Srivastava, and Oliveira (2012) contend that countries can easily levy taxes at the border. Furthermore, by allowing increased productivity and steadier growth, trade openness generates higher government revenue (Frankel 1999). That being said, domestic trade liberalization can also increase the wages of workers in foreign trade-oriented companies and thus generate higher direct and indirect tax revenue. If such liberalization translates into higher imports, it may also become associated with higher trade tax revenue. Similarly, if a fall in prices induced by domestic trade policy liberalization is genuinely transmitted by domestic producers to consumers, domestic consumers may experience a rise in their purchasing power and, thus, increase their domestic consumption and even their imports. As a result, government revenue would increase through higher indirect taxes and possibly import tariffs. By improving the competitiveness of domestic producers’ exportable goods, trade liberalization could increase their income, but, could drive up public revenues.
The impact of trade openness on government revenue hinges on several factors, which include the structure of trade liberalization and its effect on each component of government revenue. These factors show the extent of quantitative restrictions with tariffs, how tariff reduction affects imports, the price elasticity of demand for imports, the price

Vol.32 No.3, September 2017, 586~614 Sèna Kimm Gnangnon
http://dx.doi.org/10.11130/jei.2017.32.3.586jei
590
elasticity of supply of import substitutes, and how exports respond to trade liberalization. More details can be found in Ebrill, Stotsky, and Gropp (1999) and Agbeyegbe, Stotsky, and WoldeMariam (2006), among others.
The empirical analyses of the effect of trade liberalization on government revenue reflect the inconclusive theoretical literature discussed above and show mixed results. Blejer and Cheasty (1990) and Tanzi (1989) conclude that the net impact of trade reform on revenue is an empirical matter. Nashashibi and Bazoni (1994) study Sub-saharan African (SSA) countries and find that import liberalization undermines the tax base, while Ebrill, Stotsky, and Gropp (1999) provide evidence to show that tariff reforms have not resulted in lower trade tax revenue. Adam, Bevan, and Chambas (2001) use a sample of SSA countries and find that trade openness raises overall tax revenue in the Communauté Financière Africaine (African Financial Community, CFA) franc countries but has little effect in non-CFA franc ones. However, the outcome for disaggregated revenue suggests that trade openness improves trade tax revenues in CFA countries. Khattry and Rao (2002) find empirical evidence to show that trade liberalization is negatively associated with total tax revenue and international trade tax revenues. More specifically, their results reveal that structural characteristics of low-income and upper-middle-income countries, such as trade liberalization, the size of the population, the age dependency ratio, and the degree of urbanization, explain a substantial part of the decline in tax revenues from falling incomes and trade tax revenues. Agbeyegbe, Stotsky, and WoldeMariam (2006) show that for SSA economies, trade liberalization is not strongly linked to aggregate tax revenue or its components. Baunsgaard and Keen (2010) examine whether countries are able to recover from domestic taxes the revenues they have lost during past episodes of trade liberalization. They find that high-income countries are able to recover from them. Middle-income ones show robust signs of strong replacement in the long run. However, low-income countries do not show signs of significant recovery, although the experiences of these countries vary widely. Hisali (2012) examines the long- and short-term relationships between the reform of trade policy and revenues from customs tax in Uganda. The empirical results indicate that exchange rate depreciation has pass-through effects on the domestic market price of imports, which reduce trade tax revenue in the long run, although such revenue in the short term increases. A number of recent studies have examined the effects of several factors, including trade openness, on non-resource tax revenue. Thomas and Treviño (2013) and Brun, Chambas, and Mansour (2015) find a positive effect of trade openness on non-resource tax revenue. Crivelli and Gupta (2014) see a mixed effect of non-resource trade openness on the mobilization of

Multilateral Trade Liberalization and Government Revenue jei
591
domestic non-resource tax revenue in resource-rich countries.
B. Multilateral trade policy and government revenue
We see multilateral trade liberalization as all decisions, including those taken at the multilateral level under the auspices of the WTO, that ultimately contribute to reducing tariff and non-tariff barriers to trade by all countries or at least an overwhelming majority of them (Gnangnon 2017). By constraining trade practices that introduce distortions in international trade markets, multilateral trade liberalization creates a level playing field for international trade, especially for developing countries. Similarly, if a group of countries, including WTO members, choose to lower tariff and/or non-tariff barriers among them, it would lead to multilateral trade liberalization if these preferences are extended to countries outside the group. An example of this is a plurilateral trade agreement.
The impact of multilateral trade policy liberalization on government revenues is channeled in many ways as discussed below. Multilateral trade policy liberalization entails a significant decline in tariffs across all products and is associated with lower trade tax revenue. Even if it generates more imports for a given country. it is unlikely that this rise in imports more than compensates the adverse consequences of the significant fall in tariff and non-tariff barriers for trade tax revenue. The ultimate impact of multilateral trade policy liberalization would likely be felt on domestic government revenue, including direct tax revenue and indirect revenue.
By making the international market a level playing field, multilateral trade policy liberalization could lead to the creation of new trade activities such as the emergence of Small and Medium Enterprises (SMEs). However, it could also cause companies that are less competitive to close down. We argue that the net effect of multilateral trade liberalization on trade is positive. Multilateral trade policy liberalization can generate higher export incomes in both the public and private sectors. This would result in higher profits and probably an increase in wages as well as a positive hiring dynamic for the firms concerned. As a result, direct taxes will go up, thereby increasing government revenues. The rise in wages could increase purchasing power and ultimately lead to higher domestic consumption. This could lead to higher indirect tax revenues from VAT and excise duties.
By reducing the costs of inputs used in the production of exportable goods,

Vol.32 No.3, September 2017, 586~614 Sèna Kimm Gnangnon
http://dx.doi.org/10.11130/jei.2017.32.3.586jei
592
multilateral trade policy liberalization would make foreign trade-oriented firms more competitive in the international trade market and consequently generate higher direct and indirect tax revenues.
Multilateral trade policy liberalization can also contribute to reducing the international price of imported products, thus benefiting consumers and producers in the importing countries. Consumers will experience a rise in their purchasing power, and if this translates into higher imports, one could see higher indirect tax revenue and possibly higher import tax revenue for the government. Similarly, the decline in the international price of imported products in countries that use these products as inputs in the production of final goods would mean lower input costs for producers. Public revenue would increase in the following two ways. First, domestically oriented trade firms operating in the informal sector of the domestic economy will now be motivated to move to the formal sector to take full advantage of the lower costs of imported inputs used in their production process. Even companies in the formal sector that produce and sell in the domestic markets would be motivated to stay in this sector to take full advantage of the lower prices of imported inputs generated by multilateral trade policy liberalization. Thus, the government would be able to rake in tax revenues from the rising number of companies operating in the formal sector. Moreover, such tax revenue would likely go up because of an increase in the domestic activities of these companies, including through higher value addition. Second, to ensure that the benefits of multilateral trade liberalization are transmitted to consumers in the domestic economy, the government should adopt appropriate measures to ensure that the decline in the prices of imported products is passed on to these consumers. Consumers should experience an increase in their purchasing power and have access to a wide range of products of better quality and lower prices than those supplied by domestic firms.
III. Model and Estimation Strategy
A. Model
We empirically examine the impact of multilateral trade policy liberalization on government revenues by modeling total government revenue as a function of the index
Multilateral Trade Liberalization and Government Revenue jei
593
of multilateral trade policy liberalization, domestic trade policy liberalization, and a set of control variables derived from the empirical literature on the determinants of tax ratio (e.g., Ghura 1998) and tax effort (e.g., Khattry and Rao 2002, Gupta 2007, Baunsgaard and Keen 2010, Brun, Chambas, and Mansour 2015).
Our model specification takes the following form:
where i is the subscript associated with a country and t denotes the annual time period. The model is estimated using a panel dataset comprising 163 countries, both developed and developing countries, for the period from 1995 to 2013. The choice of countries and the time period have been dictated by data availability.
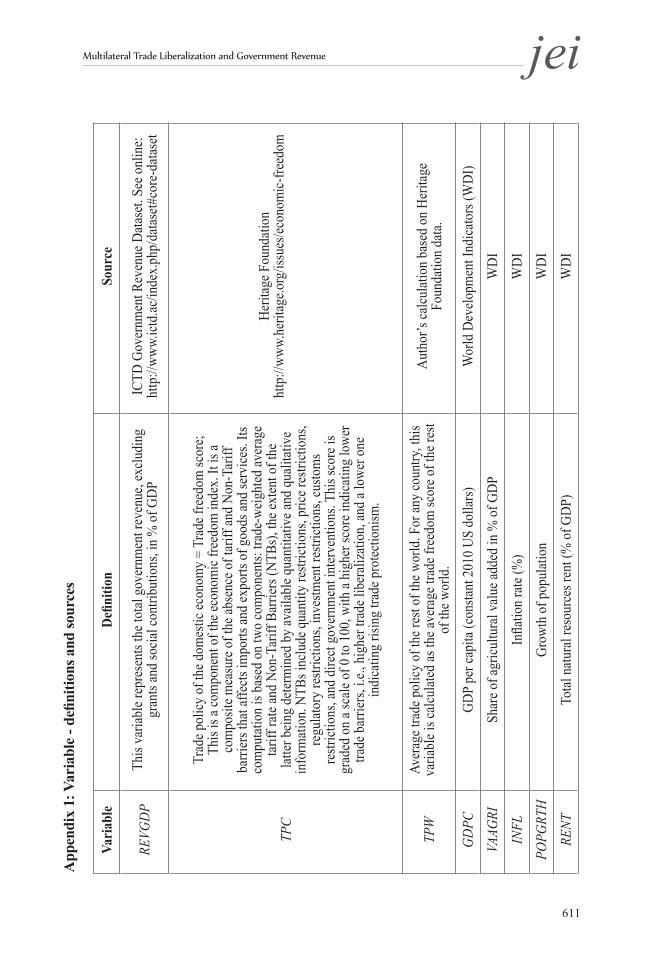
REVGDP (the total government revenue)represents total government revenue ratio (in % GDP). TPC (trade policy of a given country) is our measure of domestic trade policy for a given country. It is measured by the indicator of freedom to trade internationally proposed by the Heritage Foundation and widely used in empirical studies. As our main objective is to examine, inter alia, the impact of multilateral trade policy on government revenue, we need a domestic trade policy indicator that would allow us to easily compute a measure of multilateral trade policy indicator. The freedom to trade internationally indicator is a component of the economic freedom index and encompasses measures of trade taxes, tariff rates and trade barriers, and capital market controls. It has the advantage of providing an annual absolute measure of the degree of trade policy liberalization of a given country. This indicator is based on two components: trade-weighted average tariff barriers and non-tariff barriers. The extent of non-tariff barriers is determined by the available quantitative and qualitative information (see Appendix 1). The score on this indicator runs from 0 to 100, with a higher score indicating lower trade barriers, i.e., higher trade liberalization and a lower score indicating higher trade protection, i.e., lower trade liberalization.
There are other trade policy indicators, which can broadly be classified into incidence-based and outcome-based. Incidence-based indicators include the average level of tariffs, the level of export taxes, the percentage of imports subject to non-tariff restrictions, or a combination of these partial trade policy instruments. The Sachs and Warner indicator is also called the trade liberalization dummy. Despite their advantages, incidence-based indicators do not reflect the full range of trade measures adopted by a country to
(1)REVGDPit = α 0+ α 1REVGDPit -1 + α 2TPWit + α 3TPCit + α 4Log (GDPC)it
+ α 5VAAGRIit + α 6Log (INFL+100)it -1 + α 7RENTit -1 + α 8POPGRTHit + μ i+ εit

Vol.32 No.3, September 2017, 586~614 Sèna Kimm Gnangnon
http://dx.doi.org/10.11130/jei.2017.32.3.586jei
594
regulate its trade flows. In addition, partial trade policy instruments such as the trade liberalization dummy proposed by Sachs and Warner (1995) do not reflect the intensity or the degree of trade liberalization undertaken by a country. Additionally, this indicator is not available to many less developed countries. Therefore, these indicators cannot be used to compute a multilateral trade policy indicator.
Outcome-based indicators are expressed in terms of prices and quantities. For example, the index proposed by Dollar (1992) is calculated using a regression of the real exchange rate on its non-policy determinants. This indicator could be sensitive to the set of countries used in the regression and is therefore not suitable for computing an average world trade policy indicator. Similarly, quantity-based indicators such as trade openness are not reliable for computing a multilateral trade policy indicator. For all these reasons, we use the freedom to trade internationally indicator proposed by the Heritage Foundation as our measure of domestic trade policy indicator. As shown below, this will help us compute our index of multilateral trade policy indicator.
TPW stands for our index of multilateral trade policy and is based on the freedom to trade indicator (TPC) described above by considering, for a given country, the average trade freedom score of the rest of the world, i.e., for all countries except the country concerned, for which data exist. A similar indicator has been calculated by Ratnaike (2012).
Other variables include the following: GDPC, the real GDP per capita of country i, which captures the overall level of
development; VAAGRI, value added in the agricultural sector as a percentage of GDP; RENT, the total natural resources rent as a percentage of GDP; INFL, the inflation rate in percentage; and POPGRTH, the growth rate of the total population in percentage. In Model (1), we take the logarithm of the inflation values plus 100, as the inflation rate is expressed in percentage and contains negative values. It ranges from −35.84 per cent to 24411 per cent.
B. Other variables
Real per capita income is taken as a proxy for the country’s level of economic development. It is expected to affect the total government revenue positively, as a rise in per capita income reflects a growing demand for public services and a higher degree of economic and institutional sophistication (see also Crivelli and Gupta 2014 for this

Multilateral Trade Liberalization and Government Revenue jei
595
argument). Similarly, countries with a high share of agriculture in the total output may find it
difficult to tax domestic output. Hence, we expect that a rise in the agricultural value-added share of total GDP would be negatively associated with lower total government revenue, as in previous studies.
Higher rent for natural resource would likely lead to lower mobilization of non-resource tax revenue. However, it is not clear whether it would influence total government revenue mobilization positively or negatively, as such revenue includes not only non-resource tax revenue but also non-tax revenue and resource tax revenue. Tanzi (1977) argues that tax obligations are lower in real terms at the time of tax payments if in an inflationary environment actual tax payments lag the transactions to be taxed. In addition, specific excise tax rates on some products (tobacco, alcohol, and gasoline) may not always be adjusted for inflation (Tanzi 1989). Similarly, high inflation rates can reduce the tax base because economic agents will adjust their portfolios in favor of assets that typically escape the domestic tax net to protect the real value of their wealth (Ghura 1998). Inflation could also affect non-resource tax revenues through both unindexed tax systems and the generation of seigniorage (see Crivelli and Gupta 2014). Note that in Model (1), we use the one-year lag of the variable Log(100 + INFL) to take into account the lag effect of inflation on government revenue.
With regard to the population growth rate, which captures demographic characteristics, Bahl (2003, p13) points out that in countries that have faster growing populations, tax systems may lag behind in the ability to capture new taxpayers. Accordingly, we expect the population rate to be negatively associated with government revenue mobilization.α 0 to α 10 are the parameters to be estimated. μ i represents country-specific effects.
The disturbance term εit is assumed to be independently and identically distributed ε it
~i.i.d.(0, σ2ε ).
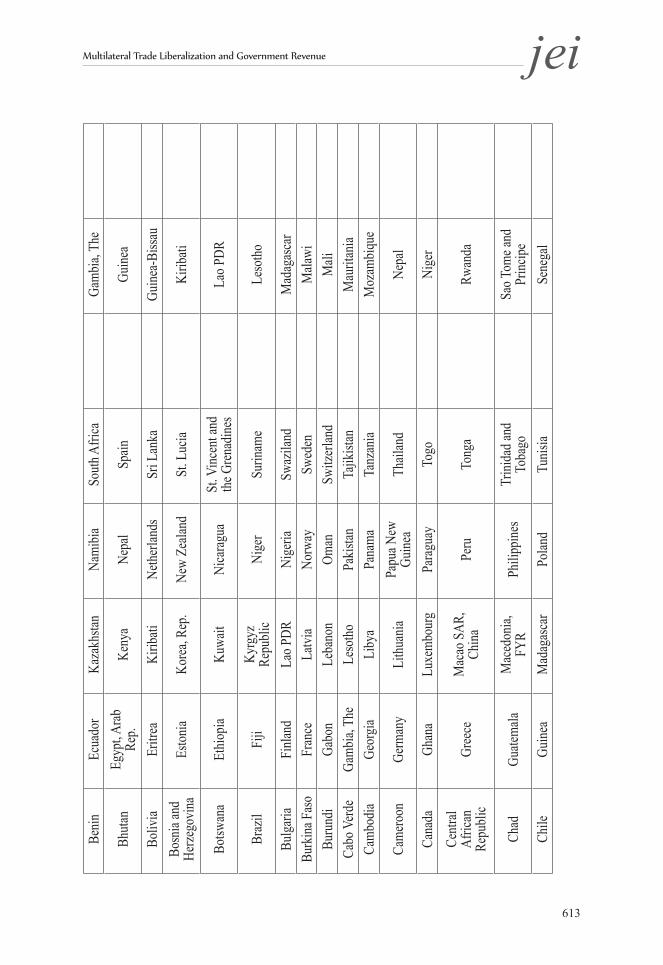
The definition and sources of the variables used in Model (1) are provided in Appendix 1 while the list of countries used in the analysis is in Appendix 2. The descriptive statistics can be found in Appendix 3, while the pairwise correlation between these variables is reported in Appendix 4.
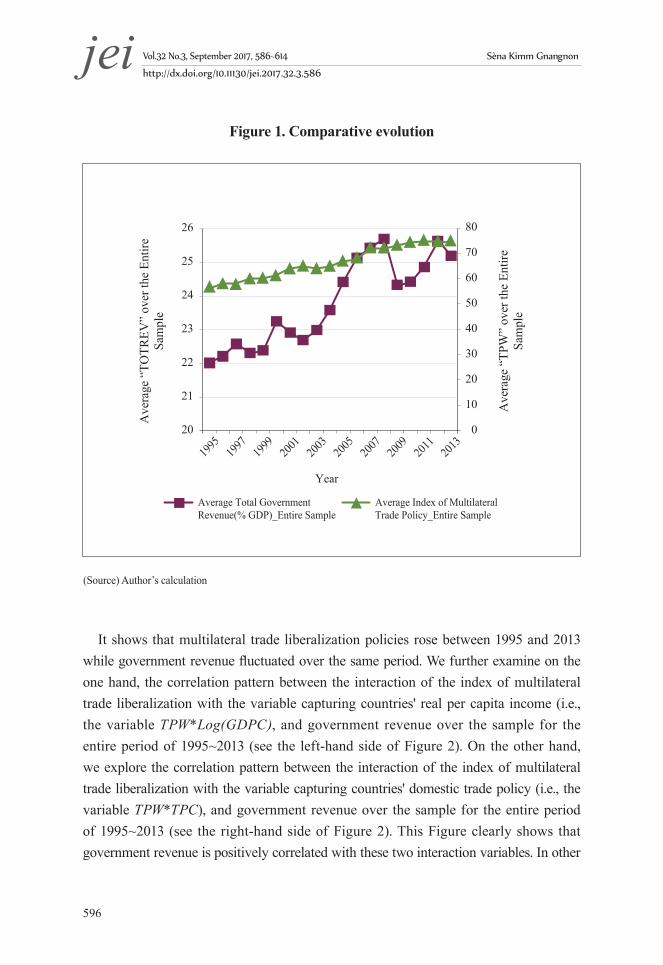
We provide an insight into the correlation between the index of multilateral trade liberalization and government revenue by plotting the evolution of average total government revenue (% GDP) and the average index of multilateral trade policy liberalization over the sample for the entire period of 1995~2013 in Figure 1.
Vol.32 No.3, September 2017, 586~614 Sèna Kimm Gnangnon
http://dx.doi.org/10.11130/jei.2017.32.3.586jei
596
Figure 1. Comparative evolution
It shows that multilateral trade liberalization policies rose between 1995 and 2013 while government revenue fluctuated over the same period. We further examine on the one hand, the correlation pattern between the interaction of the index of multilateral trade liberalization with the variable capturing countries' real per capita income (i.e., the variable TPW*Log(GDPC), and government revenue over the sample for the entire period of 1995~2013 (see the left-hand side of Figure 2). On the other hand, we explore the correlation pattern between the interaction of the index of multilateral trade liberalization with the variable capturing countries' domestic trade policy (i.e., the variable TPW*TPC), and government revenue over the sample for the entire period of 1995~2013 (see the right-hand side of Figure 2). This Figure clearly shows that government revenue is positively correlated with these two interaction variables. In other
(Source) Author’s calculation

Multilateral Trade Liberalization and Government Revenue jei
597
words, the correlation between multilateral trade policy liberalization and government revenue is higher, the higher countries' real per capita income. In addition, the correlation between multilateral trade policy liberalization and government revenue is higher, the greater countries' domestic trade policy liberalization.
Figure 2. Correlation patterns
C. Estimation strategy
Estimating Model (1) using estimators such as fixed effects or random effects is likely to generate biased estimates. The variables capturing real per capita income and rents may be endogenous because of reverse causality. In addition, the presence of the one-year lag of the dependent variable as an explanatory variable in Model (1) generates
(Note) CROSSVAR1 = TPW * Log(GDPC); CROSSVAR2 = TPW * TPC. TPW is the measure of multilateral trade policy liberalization; TPC is the measure of domestic trade policy liberalization. REVGDP is the measure of total government revenue in % GDP.
(Source) Author’s calculation

Vol.32 No.3, September 2017, 586~614 Sèna Kimm Gnangnon
http://dx.doi.org/10.11130/jei.2017.32.3.586jei
598
Nickell (1981) bias, given the limited dimension of the time period. To address these problems, we estimate Model (1) using the two-step Generalized Method of Moments (GMM) technique proposed by Blundell and Bond (1998). This technique has been widely used in empirical studies to address the endogeneity problem in dynamic models such as ours. The estimator is known to perform better than the first-difference GMM estimator suggested by Arellano and Bond (1991), particularly when cross-sectional variability dominates time variability and when there is strong persistence in the time series under investigation (Blundell and Bond 1998). Furthermore, the two-step GMM estimator also performs better than the one-step estimator when heteroscedasticity and serial correlation are present, as it uses a consistent estimate of the weighting matrix taking the residuals from the one-step estimate (Davidson and Mackinnon 2004). Meanwhile, Roodman (2009) advises against using the difference GMM estimator when the panel dataset is unbalanced, as this estimator tends to magnify gaps.
We assess the validity of the system GMM estimator by using the Arellano–Bond (AB) test of first-order serial correlation in the error term and no second-order autocorrelation in the residuals as well as the Sargan–Hansen test of over-identifying restrictions. Furthermore, we report the number of instruments used in the regressions given that the GMM estimator may lose power if the number of instruments exceeds the number of countries (Roodman 2009). The system GMM approach helps identify the short-term effects of the covariates, particularly for our variable of interest TPW, with these effects being the ones provided directly by the estimates, while the long-term effects can be calculated as the short-term coefficients divided by 1 minus the coefficient of the lagged dependent variable.
The entire sample is subject to empirical analysis. We also differentiate between the effects of multilateral trade policy liberalization on government revenue for LDCs2 and non-LDCs. To do this, we create a dummy variable LDC that takes the value 1 if a country is considered as an LDC, and 0 otherwise, and interact that with the TPW variable. We then investigate if the effect of multilateral trade liberalization on government revenue depends on the level of economic development. To do this, we introduce in Model (1) an interaction variable between the TPW and Log(GDPC) variables. We further explore whether the effect of multilateral trade liberalization on government revenue depends on the level of domestic trade policy by introducing an interaction variable between the TPW
2 The United Nations views LDCs as the poorest and the most vulnerable to natural and external shocks. It groups these countries on the basis of three criteria: income, Human Assets Index (HAI), and Economic Vulnerability Index (EVI) (for more details, see online: http://unohrlls.org/about-ldcs/criteria-for-ldcs/). As of May 2016, 48 countries were included in this group (see the list at http://www.un.org/en/development/desa/policy/cdp/ldc/ldc_list.pdf).

Multilateral Trade Liberalization and Government Revenue jei
599
and TPC variables.
IV. Empirical Results
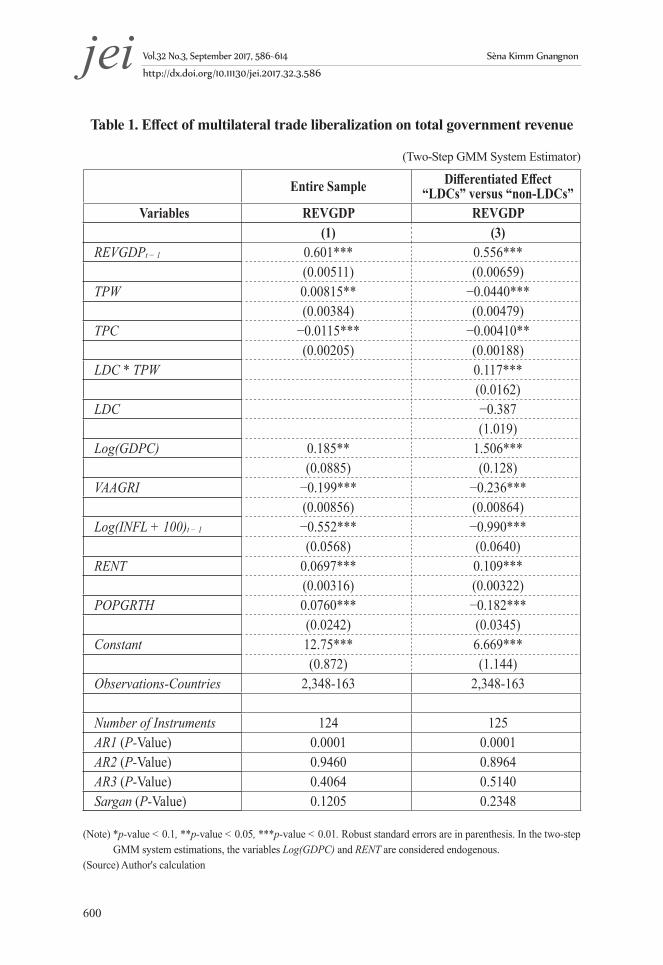
Table 1 reports the results of estimating Model (1) by the two-step GMM system for the entire sample (see column 1 of Table 1). The results of the estimation that allow us to compute the differentiated effect of multilateral trade policy liberalization on government revenue between LDCs and non-LDCs are reported in column 2 of Table 1.
The results reported in column 1 of Table 2 show whether the effect of multilateral trade liberalization on government revenue depends on the level of economic development. The results displayed in column 2 of Table 2 show whether the effect of multilateral trade liberalization on government revenue depends on the level of domestic trade policy.
Both tables show that the coefficient associated with the one-year lag of the dependent variable is always positive and statistically significant at the 1% level, thereby confirming the findings of previous studies that government revenue follows a state-dependence path, i.e., the previous year’s share of total government revenue in the GDP is positively correlated with the current year’s share of total government revenue in the GDP. Furthermore, the p-value is zero for AR(1) autocorrelation tests and greater than 10% for the AR(2) and AR(3) autocorrelation tests. Incidentally, the p-value associated with the Sargan–Hansen test is always greater than 10%, and the number of instruments used in the estimations is always lower than the number of countries. All these results confirm the validity of the system GMM estimator.
As expected, column 1 of this table suggests that multilateral trade policy liberalization influences government revenues positively. This is shown by the positive and significant coefficient associated with total government revenue. Specifically, a one point increase in the index of multilateral trade policy liberalization is associated with a 0.00815 percentage point increase in the share of total government revenue to GDP. Surprisingly, domestic trade policy liberalization influences government revenues negatively and significantly. This result certainly hides different effects across industrialized countries and non-industrialized countries, and within the latter, across different categories of developing countries depending on countries’ income levels.
Vol.32 No.3, September 2017, 586~614 Sèna Kimm Gnangnon
http://dx.doi.org/10.11130/jei.2017.32.3.586jei
600
Table 1. Effect of multilateral trade liberalization on total government revenue
(Two-Step GMM System Estimator)
Entire Sample Differentiated Effect “LDCs” versus “non-LDCs”
Variables REVGDP REVGDP(1) (3)
REVGDPt − 1 0.601*** 0.556***(0.00511) (0.00659)
TPW 0.00815** −0.0440***(0.00384) (0.00479)
TPC −0.0115*** −0.00410**(0.00205) (0.00188)
LDC * TPW 0.117***(0.0162)
LDC −0.387(1.019)
Log(GDPC) 0.185** 1.506***(0.0885) (0.128)
VAAGRI −0.199*** −0.236***(0.00856) (0.00864)
Log(INFL + 100)t − 1 −0.552*** −0.990***(0.0568) (0.0640)
RENT 0.0697*** 0.109***(0.00316) (0.00322)
POPGRTH 0.0760*** −0.182***(0.0242) (0.0345)
Constant 12.75*** 6.669***(0.872) (1.144)
Observations-Countries 2,348-163 2,348-163
Number of Instruments 124 125AR1 (P-Value) 0.0001 0.0001AR2 (P-Value) 0.9460 0.8964AR3 (P-Value) 0.4064 0.5140Sargan (P-Value) 0.1205 0.2348
(Note) *p-value < 0.1, **p-value < 0.05, ***p-value < 0.01. Robust standard errors are in parenthesis. In the two-step GMM system estimations, the variables Log(GDPC) and RENT are considered endogenous.
(Source) Author's calculation

Multilateral Trade Liberalization and Government Revenue jei
601
With regard to other variables, we see that per capita income exerts a negative and significant impact on total government revenue. This result can be explained by the heterogeneity of countries in the sample. It can also be explained by the fact that the GDP of some low-income countries is likely to have been underestimated, resulting in a higher tax share for these countries. Thus, a proper assessment of these countries’ GDP may well show a lower tax share. The other positive drivers of government revenue include higher natural resource rents, lower inflation rates, a lower agriculture value-added share of GDP, and a higher population growth rate.
The results shown in column 2 of Table 1 indicate that the impact of multilateral trade liberalization on government revenue is higher in LDCs than in non-LDCs (see the coefficient associated with the interaction variable between LDC and TPW). The net effect of multilateral trade policy liberalization on government revenue is given by 0.073 (= 0.117 − 0.0440). This means that a one point increase in the index of multilateral trade liberalization is associated with a 0.073 percentage point increase in the ratio of total government revenue to GDP in LDCs. The estimates for the other variables are broadly in line with those reported in column 1.
We examine whether the effect of multilateral trade policy liberalization on government revenue depends on the country’s level of economic development. We note that in column 1 of Table 2, the interaction term (i.e., the coefficient associated with the variable TPW * Log(GDPC)) is positive and statistically significant at the 5% level, while simultaneously, the coefficient associated with the variable TPW is negative and statistically significant. These two results suggest that the total impact of TPW on government revenue is negative and changes sign above a certain threshold level of development, proxied by real per capita income. However, this result does not make clear how the impact of multilateral trade policy liberalization on government evolves across countries in the entire sample.

Vol.32 No.3, September 2017, 586~614 Sèna Kimm Gnangnon
http://dx.doi.org/10.11130/jei.2017.32.3.586jei
602
Table 2. Effect of multilateral trade liberalization on total government revenue : for various levels of development
(Two-Step GMM System Estimator)
Variables REVGDP REVGDP(1) (2)
REVGDPt − 1 0.614*** 0.600***(0.00340) (0.00511)
TPW −0.0454** −0.0915***(0.0180) (0.0177)
TPC −0.00771*** −0.0973***(0.00128) (0.0148)
TPW * Log(GDPC) 0.00579***(0.00206)
TPW * TP 0.00135***(0.000233)
Log(GDPC) −0.0867 0.115(0.170) (0.0863)
VAAGRI −0.188*** −0.208***(0.00676) (0.00852)
Log(INFL + 100)t − 1 −0.599*** −0.613***(0.0421) (0.0578)
RENT 0.0713*** 0.0696***(0.00227) (0.00311)
POPGRTH 0.0556*** 0.0684***(0.0167) (0.0234)
Constant 14.95*** 20.10***(1.533) (1.446)
Observations-Countries 2,348-163 2,348-163
Number of Instruments 142 125AR1 (P-Value) 0.0001 0.0001AR2 (P-Value) 0.9410 0.9434AR3 (P-Value) 0.3926 0.4223Sargan (P-Value) 0.1562 0.1497
(Note) Captured by per capita income and for various levels of domestic trade policy liberalization.*p-value < 0.1, **p-value < 0.05, ***p-value < 0.01. Robust standard errors are in parenthesis. In the two-step GMM system estimations, the variables Log(GDPC) and RENT and the interaction variable TPW * Log(GDPC) are considered endogenous in the two different model (1) specifications.
(Source) Author’s calculation
Multilateral Trade Liberalization and Government Revenue jei
603
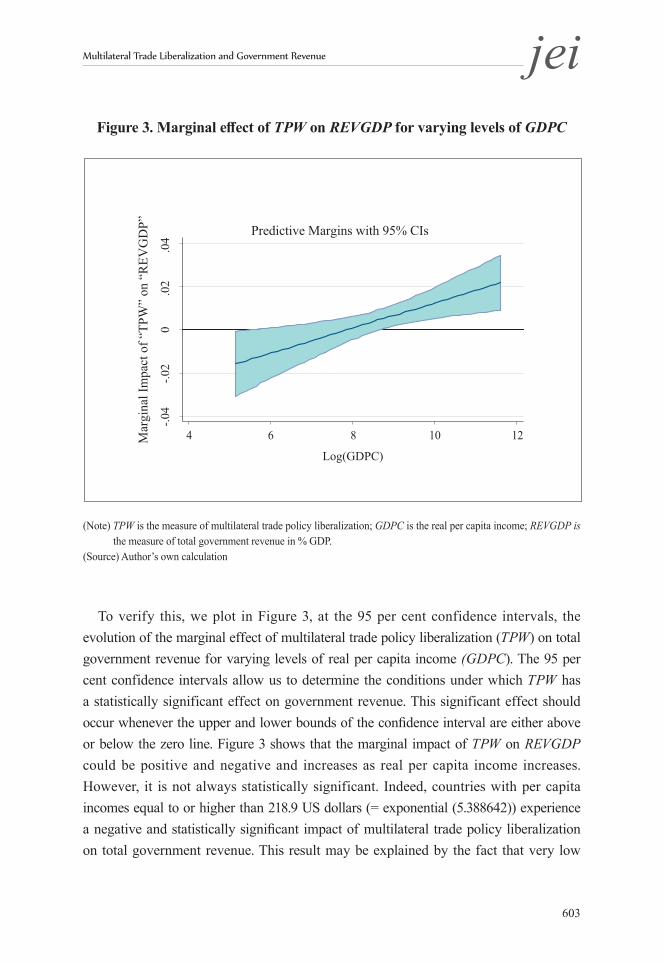
Figure 3. Marginal effect of TPW on REVGDP for varying levels of GDPC
(Note) TPW is the measure of multilateral trade policy liberalization; GDPC is the real per capita income; REVGDP is the measure of total government revenue in % GDP.
(Source) Author’s own calculation
To verify this, we plot in Figure 3, at the 95 per cent confidence intervals, the evolution of the marginal effect of multilateral trade policy liberalization (TPW) on total government revenue for varying levels of real per capita income (GDPC). The 95 per cent confidence intervals allow us to determine the conditions under which TPW has a statistically significant effect on government revenue. This significant effect should occur whenever the upper and lower bounds of the confidence interval are either above or below the zero line. Figure 3 shows that the marginal impact of TPW on REVGDP could be positive and negative and increases as real per capita income increases. However, it is not always statistically significant. Indeed, countries with per capita incomes equal to or higher than 218.9 US dollars (= exponential (5.388642)) experience a negative and statistically significant impact of multilateral trade policy liberalization on total government revenue. This result may be explained by the fact that very low

Vol.32 No.3, September 2017, 586~614 Sèna Kimm Gnangnon
http://dx.doi.org/10.11130/jei.2017.32.3.586jei
604
income countries do not have the requisite capacity to derive benefits from multilateral trade policy liberalization in terms of higher government revenue. At the same time, for countries with real per capita income higher than 218.9 US dollars but lower than or equal to 5586 US dollars (= exponential (8.628018)), multilateral trade policy liberalization exerts no significant impact on government revenue. However, countries with real per capita income higher than 5586 US dollars enjoy a positive and significant impact of multilateral trade policy liberalization on government revenue.
It is worth noting that with a few exceptions, the estimates associated with the other variables in column 1 of Table 2 are broadly in line with those in column 1 of Table 1.
Let us now turn to the results reported in column 2 of Table 2. We are particularly interested in examining whether the effect of multilateral trade policy liberalization on government revenue depends on the country’s level of domestic trade policy. We note that there is a negative and significant coefficient associated with the variable TPW while the interaction term (i.e., the coefficient associated with the variable TPW * TP) is positive and significant at the 5% level. Taken together, these two results suggest that the total impact of TPW on government revenue is negative and changes sign above a certain threshold level of domestic trade policy. However, this result may hide different marginal effects of multilateral trade policy liberalization on government revenue for various levels of countries’ domestic trade policy. To check this, we present in Figure 4, at the 95 per cent confidence interval, the evolution of the marginal effect of multilateral Trade Policy Liberalization (TPW) on total government revenue for varying levels of domestic trade policy (TPC). It can be seen from this figure that this marginal impact takes both positive and negative values, but its magnitude increases as countries liberalize their domestic trade policy further. However, it is not always statistically significant. Indeed, multilateral trade policy liberalization exerts a negative and significant impact on government revenue for countries whose level of domestic trade policy is lower than or equal to 58.9. This result may indicate that this group of countries lacks the capacity, including the requisite trade capacity, to take advantage of the benefits of multilateral trade liberalization in terms of government revenue. The impact of multilateral trade liberalization on government revenue is positive and significant for countries whose level of domestic trade policy is higher than or equal to 74.1. However, countries whose level of domestic trade policy ranges between 58.9 and 74.1 experience a statistically zero effect of multilateral trade policy liberalization on government revenue.
The effects of other variables reported in column 2 of Table 2 are largely consistent with those displayed in column 1 of Table 1.

Multilateral Trade Liberalization and Government Revenue jei
605
Figure 4. Marginal effect of TPW on REVGDP for varying levels of TPC
(Note) TPW is the measure of multilateral trade policy liberalization; TPC is the measure of domestic trade policy liberalization; REVGDP is the measure of total government revenue in % GDP.
(Source) Author’s own calculation
V. Conclusion
Studies on the macroeconomic determinants of government revenue mobilization have typically examined the effect of trade openness or trade liberalization on government revenue. Given the current context of anti-trade and anti-globalization sentiments, which could undermine multilateral trade liberalization, this paper examines the impact of multilateral trade policy liberalization on total government revenue. It bridges a gap in the existing literature, which has not explored this topic to the best of our knowledge.
The analysis is carried out on a sample of 163 countries of which 37 are LDCs, the data

Vol.32 No.3, September 2017, 586~614 Sèna Kimm Gnangnon
http://dx.doi.org/10.11130/jei.2017.32.3.586jei
606
span the period 1995~2013. Results suggest that multilateral trade policy liberalization consistently exerts a positive impact in the medium to long term on government revenue. This result applies particularly to LDCs. Interestingly, the positive impact of multilateral trade liberalization on government revenue appears to be dependent upon countries’ level of economic development. It is especially true of countries whose real per capita income is higher than 5586 US dollars. Finally, multilateral trade policy liberalization has a positive and significant impact on government revenue if the level of domestic trade policy in a country reaches a certain threshold, given as a score of 71.9 for a policy range of 0 to 95. In addition, the magnitude of this positive marginal effect of multilateral trade policy liberalization on the government increases as countries further liberalize their domestic trade policy going beyond the 71.9 threshold. This probably shows that the positive impact of multilateral trade policy liberalization can translate into higher government revenue if domestic trade policy is liberalized to reach at least a certain level.
Our analysis suggests that the currently growing anti-trade sentiment which can hurt the mobilization of higher public finance revenue particularly in developing countries. Hence, WTO members must revive multilateral trade talks under the auspices of the WTO and produce substantial outcomes for the benefit of all members. This would, inter alia, allow developing countries to mobilize higher government revenue, which is key for the attainment of the SDGs adopted in September 2015 by the United Nations. Particular attention should be paid to very poor countries who may not benefit from the positive impact of multilateral trade policy liberalization on government revenue probably because they lack the capacity, including the trade and institutional capacities, to do so. A joint effort between these countries and the international community, including international financial institutions and regional development banks, would be useful in helping these countries overcome the constraints that prevent them from fully reaping the benefits of multilateral trade policy liberalization in terms of government revenues.
Future research could explore different ways to measure multilateral trade policy liberalization and re-examine how it could influence government revenues as well as its components.
Received 19 June 2017, Revised 7 July 2017, Accepted 9 August 2017
Multilateral Trade Liberalization and Government Revenue jei
607
References
Adam C., Bevan, D., and Chambas, G. "Exchange rate regimes and revenue performance in sub-Saharan Africa," Journal of Development Economics 64 (2001): 173–213.
Agbeyegbe, T. D., Stotsky, J. and WoldeMariam, A. "Trade liberalization, exchange rate changes, and tax revenue in Sub-Saharan Africa," Journal of Asian Economics, 17, no.2 (2006): 261-284.
Arellano, M., and Bond, S. "Some Tests of Specification for Panel Data: Monte Carlo Evidence and an Application to Employment Equations," Review of Economic Studies 58 (1991): 277–297.
Bahl, Roy. "Reaching the Hardest to Tax: Consequences and Possibilities". Paper presented at the ‘Hard to Tax: An International Perspective’ conference, : May 15-16.Andrew Young School of Policy Studies, Georgia State University (2003)
Blundell, R., and Bond, S. "Initial Conditions and Moment Restrictions in Dynamic Panel Data Models", Journal of Econometrics 87 (1998): 115–143.
Bird, R. M., Martinez-Vazquez, J., and Torgler, B. "Tax Effort in Developing Countries and High Income Countries: The Impact of Corruption, Voice and Accountability", Economic Analysis and Policy 38, no.1 (2008): 55-71.
Baunsgaard T, and Keen, Michael. Tax Revenue and (or?) Trade Liberalization, Journal of Public Economics 94(9-10), (2010): 563 – 577.
Blejer, M., and A. Cheasty, “Fiscal Implications of Trade Liberalization,” in Fiscal Policy in Open Developing Economies, edited by V. Tanzi ,66-81. Washington D.C. International Monetary Fund, 1990
Bornhorst, F., Gupta, S. and Thornton, J. "Natural Resource Endowments and the Domestic Revenue Effort," European Journal of Political Economy 25 (2009): 439–446.

Vol.32 No.3, September 2017, 586~614 Sèna Kimm Gnangnon
http://dx.doi.org/10.11130/jei.2017.32.3.586jei
608
Brun, J. F., Chambas, G. and Mansour, M. Tax Effort of Developing Countries: An Alternative Measure, In: Financing Sustainable Development Addressing Vulnerabilities, edited by Boussichas, M., and Guillaumont, P., Economica. FERDI, 2015.
Cagé, J. and Gadenne, L. "Tax Revenues, Development, and the Fiscal Cost of Trade Liberalization, 1792-2006" Working Paper (2014)
Crivelli E. and Gupta, S. "Resource Blessing, Revenue Curse? Domestic Revenue Effort in Resource-Rich Countries," European Journal of Political Economy, 35 (2014): 88-101.
Davidson R, and. MacKinnon, J.G. Econometric Theory and Methods, Oxford University Press, (2004).
Dollar, David, "Outward-oriented Developing Economies Really Do Grow More Rapidly: Evidence from 95 LDCs, 1976–85," Economic Development and Cultural Change, 40, no.3(1992): 523–544.
Drummond P. et al., "Mobilizing Revenue in Sub-saharan Africa: Empirical Norms and Key Determinants," Internayional Monetary Fund working Paper no. 12/108 (2012).
Ebrill, L., Stotsky, J., and Gropp, R. "Revenue implications of trade liberalization, Occasional Paper" International Monetary Fund 180 (1999).
Frankel Jeffrey, "No Single Currency Regime is Right for All Countries or At All Times," NBER Working Paper No. 7338, (1999).
Gnangnon, Sèna Kimm, "The Impact of Multilateral Trade Liberalization on Economic Development: Some Empirical Evidence," Accepted and forthcoming in Economic Affairs, (October, 2017).
Ghura, Dhaneshwar, "Tax Revenue in Sub-Saharan Africa: Effects of Economic Policies and Corruption," IMF Working Paper 98(135). Washington: International Monetary Fund, (1998).

Multilateral Trade Liberalization and Government Revenue jei
609
Gupta, S. "Determinants of Tax Revenue Efforts in Developing Countries," IMF Working Paper 07(184). Washington: International Monetary Fund, (2007).
Hisali, E. "Trade policy reform and international trade tax revenue in Uganda", Economic Modelling, 29 (2012): 2144-2154.
International Monetary Fund (IMF), "World Economic Outlook, Subdued Demand: Symptoms and Remedies, 2016", (October 2016).
Khattry, B., and Rao, M.J. "Fiscal Faux Pas?: An analysis of the revenue implications of trade liberalization," World Development, 30, no.8 (2002): 1431–1444.
Nashashibi K, and Bazoni, S. "Exchange rate policies and fiscal performance in sub-Saharan Africa," IMF Staff Papers 41 (1) (1994): 76–122.
Nickell Stephen, "Biases in Dynamic Models with Fixed Effects," Econometrica, 49 (1981): 1417–1426.
Ratnaike, Yasanji, "Is There an Empirical Link Between Trade Liberalisation and Export Performance?" Economics Letters, 117 (2012): 375–378.
Roodman David, "A note on the theme of too many instruments. Oxford Bulletin of Economic and Statistics," 71, no.1(2009): 135–158.
Sachs, J. D., and Warner, A. "Economic Reform and the Process of Global Integration," Brookings Papers on Economic Activity, 26. no.1 (1995): 1–118.
Stotsky J G and WoldeMariam, A. (1997). "Tax effort in Sub-Saharan Africa," IMF Working Paper, 97(107), (1997).
Tanzi, Vito, "Inflation, Lags in Collection, and the Real Value of Tax Revenue", IMF Staff Papers.26, International Monetary Fund, Washington D.C., (1977): 154-67.
Tanzi, Vito, "The impact of macroeconomic policies on the level of taxation and fiscal balance in developing countries," IMF Staff Papers 36, Washington, DC. (1989): 633-656
Tanzi, Vito, 'Structural Factors and Tax Revenue in Developing Countries: A Decade of Evidence', in Open Economies: Structural Adjustment and Agriculture edited by

Vol.32 No.3, September 2017, 586~614 Sèna Kimm Gnangnon
http://dx.doi.org/10.11130/jei.2017.32.3.586jei
610
Goldin and L. A. Winters, Cambridge: Cambridge University Press (1992): 267-281.
Thomas A. and Treviño, J P. "Resource Dependence and Fiscal Effort in Sub-Saharan Africa," 13 (188) IMF Working Paper, (2013)
World Trade Organization (WTO). Trade Statistics and Outlook: Trade in 2016 to grow at slowest pace since the financial crisis, Press Release, PRESS/779, 27 September 2016, (16-0000).
WTO (World Trade Organization) ‘Trade recovery expected in 2017 and 2018, amid policy uncertainty’. Trade Statistics and Outlook Press Release 793, 12 April 2017,
https://www.wto.org/english/news_e/pres17_e/pr791_e.htm (accessed 12 April 2017).
Multilateral Trade Liberalization and Government Revenue jei
611
Va
riabl
eDe
finiti
onSo
urce
REVG
DPTh
is va
riabl
e rep
rese
nts t
he to
tal g
over
nmen
t rev
enue
, exc
ludi
ng
gran
ts an
d so
cial c
ontri
butio
ns, i
n %
of G
DPIC
TD G
over
nmen
t Rev
enue
Data
set.
See o
nlin
e:
http
://ww
w.ict
d.ac
/inde
x.ph
p/da
taset#
core
-data
set
TPC
Trad
e pol
icy o
f the
dom
estic
econ
omy
= Tr
ade f
reed
om sc
ore;
This
is a c
ompo
nent
of t
he ec
onom
ic fre
edom
inde
x. It
is a
com
posit
e mea
sure
of t
he ab
senc
e of t
ariff
and
Non-
Tarif
f ba
rrier
s tha
t affe
cts im
ports
and
expo
rts o
f goo
ds an
d se
rvice
s. Its
co
mpu
tatio
n is
base
d on
two
com
pone
nts:
trade
-weig
hted
aver
age
tariff
rate
and
Non-
Tarif
f Bar
riers
(NTB
s), th
e ext
ent o
f the
lat
ter b
eing
deter
min
ed b
y av
ailab
le qu
antit
ative
and
quali
tativ
e in
form
ation
. NTB
s inc
lude
qua
ntity
restr
ictio
ns, p
rice r
estri
ction
s, re
gulat
ory
restr
ictio
ns, i
nves
tmen
t res
tricti
ons,
custo
ms
restr
ictio
ns, a
nd d
irect
gove
rnm
ent i
nter
vent
ions
. Thi
s sco
re is
gr
aded
on
a sca
le of
0 to
100
, with
a hi
gher
scor
e ind
icatin
g lo
wer
trade
bar
riers,
i.e.,
hig
her t
rade
libe
raliz
ation
, and
a lo
wer o
ne
indi
catin
g ris
ing
trade
pro
tectio
nism
.
Herit
age F
ound
ation
http
://ww
w.he
ritag
e.org
/issu
es/ec
onom
ic-fre
edom
TPW
Aver
age t
rade
pol
icy o
f the
rest
of th
e wor
ld. F
or an
y co
untry
, thi
s va
riabl
e is c
alcul
ated
as th
e ave
rage
trad
e fre
edom
scor
e of t
he re
st of
the w
orld
.Au
thor
’s ca
lculat
ion
base
d on
Her
itage
Fo
unda
tion
data.
GDPC
GDP
per c
apita
(con
stant
201
0 US
dol
lars)
Wor
ld D
evelo
pmen
t Ind
icato
rs (W
DI)
VAAG
RISh
are o
f agr
icultu
ral v
alue a
dded
in %
of G
DPW
DI
INFL
Infla
tion
rate
(%)
WDI
POPG
RTH
Grow
th o
f pop
ulati
on
WDI
RENT
Total
natu
ral r
esou
rces
rent
(% o
f GDP
)W
DI
App
endi
x 1:
Var
iabl
e - d
efini
tions
and
sour
ces

Vol.32 No.3, September 2017, 586~614 Sèna Kimm Gnangnon
http://dx.doi.org/10.11130/jei.2017.32.3.586jei
612
Coun
tries
use
d in
the A
nalys
is: E
ntire
Sam
ple
Leas
t Dev
elope
d Co
untri
es
Alba
nia
Chin
aGu
inea
-Biss
auM
alawi
Portu
gal
Turk
eyAn
gola
Sier
ra L
eone
Alge
riaCo
lom
bia
Guya
naM
alays
iaQa
tarUg
anda
Bang
lades
hTa
nzan
iaAn
gola
Com
oros
Hond
uras
Mald
ives
Rom
ania
Ukra
ine
Beni
nTo
go
Arm
enia
Cong
o, De
m.
Rep.
Hong
Kon
g SA
R, C
hina
Mali
Russ
ian
Fede
ratio
nUn
ited
King
dom
Bhut
anUg
anda
Austr
alia
Cong
o, Re
p.Hu
ngar
yM
alta
Rwan
daUn
ited S
tates
Burk
ina F
aso
Vanu
atu
Austr
iaCo
sta R
icaIc
eland
Mau
ritan
iaSa
o Tom
e and
Pr
incip
eUr
ugua
yBu
rund
iYe
men
, Rep
.
Azer
baija
nCo
te d’
Ivoi
reIn
dia
Mau
ritiu
sSa
udi A
rabi
aUz
beki
stan
Cam
bodi
aZa
mbi
aBa
ham
as,
The
Croa
tiaIn
done
siaM
exico
Sene
gal
Vanu
atuCe
ntra
l Afri
can
Repu
blic
Bahr
ainCy
prus
Iran,
Islam
ic Re
p.M
icron
esia,
Fe
d. St
s.Se
rbia
Vene
zuela
, RB
Chad
Bang
lades
hCz
ech
Repu
blic
Irelan
dM
oldo
vaSe
yche
lles
Vietn
amCo
mor
os
Barb
ados
Denm
ark
Italy
Mon
golia
Sier
ra L
eone
Yem
en, R
ep.
Cong
o, De
m.
Rep.
Belar
usDj
ibou
tiJa
maic
aM
onten
egro
Sing
apor
eZa
mbi
aDj
ibou
ti
Belg
ium
Dom
inica
Japa
nM
oroc
coSl
ovak
Re
publ
icZi
mba
bwe
Eritr
ea
Beliz
eDo
min
ican
Repu
blic
Jord
anM
ozam
biqu
eSl
oven
iaEt
hiop
ia
App
endi
x 2:
List
of c
ount
ries
use
d in
the
entir
e sa
mpl
e
Multilateral Trade Liberalization and Government Revenue jei
613
Beni
nEc
uado
rKa
zakh
stan
Nam
ibia
Sout
h Afri
caGa
mbi
a, Th
e
Bhut
anEg
ypt, A
rab
Rep.
Keny
aNe
pal
Spain
Guin
ea
Boliv
iaEr
itrea
Kirib
atiNe
ther
lands
Sri L
anka
Guin
ea-B
issau
Bosn
ia an
d He
rzeg
ovin
aEs
toni
aKo
rea,
Rep.
New
Zeala
ndSt
. Luc
iaKi
ribati
Botsw
ana
Ethi
opia
Kuwa
itNi
cara
gua
St. V
ince
nt an
d th
e Gre
nadi
nes
Lao P
DR
Braz
ilFi
jiKy
rgyz
Re
publ
icNi
ger
Surin
ame
Leso
tho
Bulg
aria
Finl
and
Lao P
DRNi
geria
Swaz
iland
Mad
agas
car
Burk
ina F
aso
Fran
ceLa
tvia
Norw
aySw
eden
Mala
wiBu
rund
iGa
bon
Leba
non
Oman
Switz
erlan
dM
aliCa
bo V
erde
Gam
bia,
The
Leso
tho
Paki
stan
Tajik
istan
Mau
ritan
iaCa
mbo
dia
Geor
gia
Liby
aPa
nam
aTa
nzan
iaM
ozam
biqu
e
Cam
eroo
nGe
rman
yLi
thua
nia
Papu
a New
Gu
inea
Thail
and
Nepa
l
Cana
daGh
ana
Luxe
mbo
urg
Para
guay
Togo
Nige
rCe
ntra
l Af
rican
Re
publ
icGr
eece
Mac
ao S
AR,
Chin
aPe
ruTo
nga
Rwan
da
Chad
Guate
mala
Mac
edon
ia,
FYR
Phili
ppin
esTr
inid
ad an
d To
bago
Sao T
ome a
nd
Prin
cipe
Chile
Guin
eaM
adag
asca
rPo
land
Tuni
siaSe
nega
l

Vol.32 No.3, September 2017, 586~614 Sèna Kimm Gnangnon
http://dx.doi.org/10.11130/jei.2017.32.3.586jei
614
Variable Observations Mean Standard Deviation Minimum Maximum
REVGDP 2905 23.752 10.273 0.000 81.545
TPC 2754 67.565 15.697 0.000 95.000
TPW 3097 66.401 6.231 56.388 75.062
GDPC 3073 11730.040 17335.270 168.931 110001.100
VAAGRI 2941 14.909 13.475 0.000 62.383
POPGRTH 3091 1.447 1.447 −3.820 17.625
RENT 3033 9.720 14.221 0.000 92.019
INFL 3087 21.168 450.033 −35.837 24411.030
Appendix 3: Descriptive statistics
REVGDP TPC TPW GDPC VAAGRI POPGRTH RENT INFL
REVGDP 1.0000
TPC 0.3119* 1.0000
TPW 0.1044* 0.3781* 1.0000
GDPC 0.4934* 0.4549* 0.0695* 1.0000
VAAGRI −0.6025* −0.4138* −0.1388* −0.5405* 1.0000
POPGRTH −0.1652* −0.2458* 0.0289 −0.0905* 0.3328* 1.0000
RENT 0.1777* −0.1786* 0.0786* −0.1127* 0.1396* 0.3773* 1.0000
INFL −0.0380* −0.0409* −0.0031 −0.0241 0.0170 0.0013 0.0315* 1.0000
Appendix 4: Pairwise correlation between variables