multidimensional poverty in germany: a capability approach
DESCRIPTION
Multidimensional Poverty in Germany: A Capability Approach. Nicole Rippin 24 June 2014. Outline. Introduction The Correlation Sensitive Poverty Index (CSPI) The German Correlation Sensitive Poverty Index (GCSPI) Poverty Comparisons Conclusion. I. Introduction II. The CSPI - PowerPoint PPT PresentationTRANSCRIPT

Multidimensional Poverty in Germany: A Capability Approach
Nicole Rippin
24 June 2014

© Deutsches Institut für Entwicklungspolitik (DIE) 2
Outline
I. Introduction
II. The Correlation Sensitive Poverty Index (CSPI)
III. The German Correlation Sensitive Poverty Index (GCSPI)
IV. Poverty Comparisons
V. Conclusion
I. Introduction
II. The CSPI
III. The GCSPI
IV. Poverty Comparisons
V. Conclusion
© Deutsches Institut für Entwicklungspolitik (DIE) 3
Introduction
I. Introduction
II. The CSPI
III. The GCSPI
IV. Poverty Comparisons
V. Conclusion
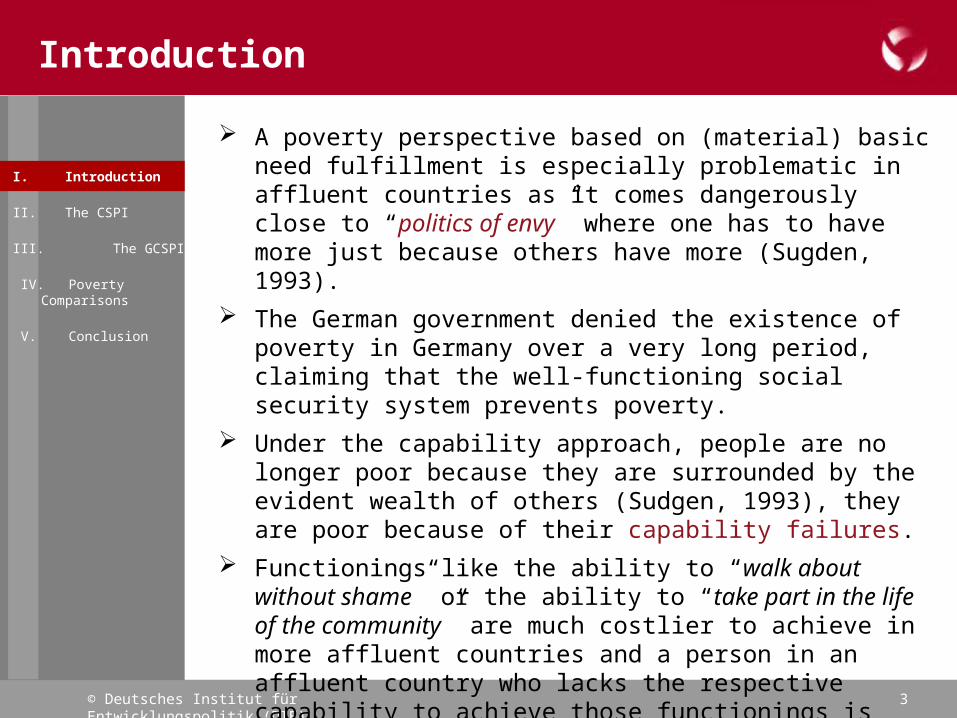
A poverty perspective based on (material) basic need fulfillment is especially problematic in affluent countries as it comes dangerously close to “politics of envy” where one has to have more just because others have more (Sugden, 1993).
The German government denied the existence of poverty in Germany over a very long period, claiming that the well-functioning social security system prevents poverty.
Under the capability approach, people are no longer poor because they are surrounded by the evident wealth of others (Sudgen, 1993), they are poor because of their capability failures.
Functionings like the ability to “walk about without shame” or the ability to “take part in the life of the community” are much costlier to achieve in more affluent countries and a person in an affluent country who lacks the respective capability to achieve those functionings is just as poor as a person who lacks the same capability in a poor country (Sen, 1996).

© Deutsches Institut für Entwicklungspolitik (DIE) 4
Introduction
I. Introduction
II. The CSPI
III. The GCSPI
IV. Poverty Comparisons
V. Conclusion
The first German poverty report, finally introduced in 2001, is explicitly based on the capability approach.
Yet, few steps have been taken so far to operationalise the capability approach when it comes to measurement issues: The at-risk-of-poverty rate that is based on net equivalence income is still the only official poverty measure in Germany.
This work is a suggestion for a possible way to operationalise the capability approach by introducing a multidimensional poverty index for Germany: the German Correlation Sensitive Poverty Index (GCSPI).
The GCSPI belongs to a class of multidimensional poverty indices that are unique in the sense that they are the only counting indices that are able to account for the inequality between and the correlation among poverty dimensions.
This is achieved by a new identification method that differs significantly from the method that is usually utilised for counting indices like, for instance, the well-known Multidimensional Poverty Index (MPI).
© Deutsches Institut für Entwicklungspolitik (DIE) 5
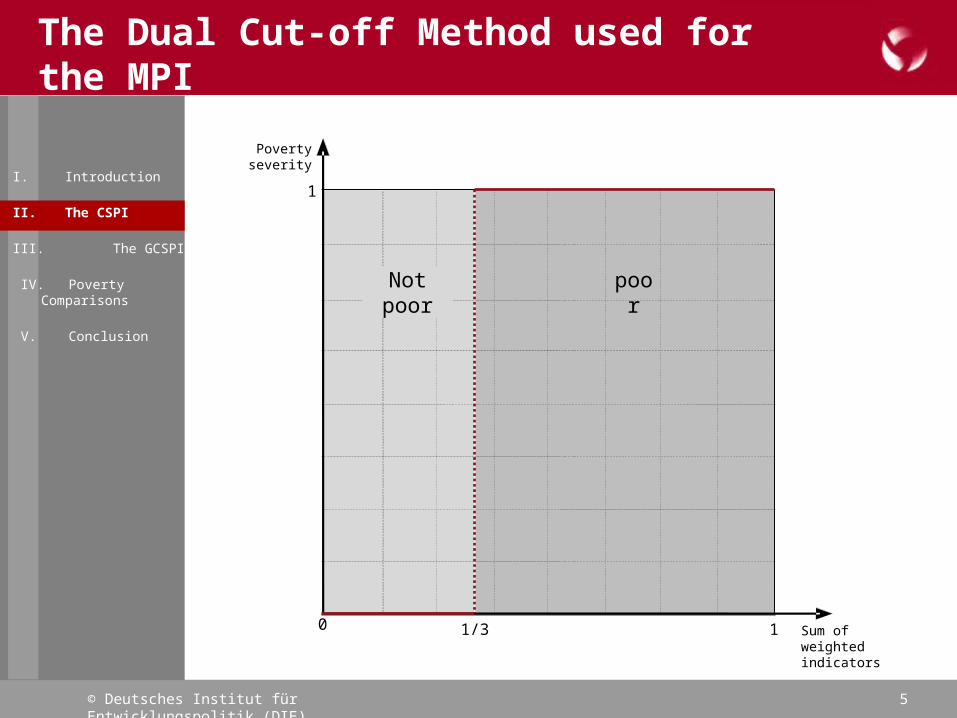
The Dual Cut-off Method used for the MPI
I. Introduction
II. The CSPI
III. The GCSPI
IV. Poverty Comparisons
V. Conclusion
0
1
1 Sum of weighted indicators
Poverty severity
1/3
Not poor poor

© Deutsches Institut für Entwicklungspolitik (DIE) 6
The Weakness of the Dual Cut-off Method
I. Introduction
II. The CSPI
III. The GCSPI
IV. Poverty Comparisons
V. Conclusion
The MPI that is based on the dual cut-off method does not distinguish between the poor.
MPI = 0.500
Assets
Floor
Electricity
Water
Sanitation
Cooking Fuel
Schooling
Enrolment
Education
Living Standards
Health Nutrition
Child Mortality
Ten Indicators
Th
ree
Dim
ensi
ons
1/6
1/6
1/6
1/6
1/18
1/18
1/18
1/18
1/18
1/18
This creates a kind of “inverted Robin Hood effect”:
MPI = 0.639
In other words, a household is considered poor whether it is deprived in 33% of weighted indicators or in 100%.

© Deutsches Institut für Entwicklungspolitik (DIE) 7
The new Identification Method used for the CSPI
I. Introduction
II. The CSPI
III. The GCSPI
IV. Poverty Comparisons
V. Conclusion
High initial poverty severity
Medium initial poverty severity
Low initial poverty severity 0
1
1 Sum of weighted indicators
Poverty severity
Low Substitutability
High Substitutability
© Deutsches Institut für Entwicklungspolitik (DIE) 8
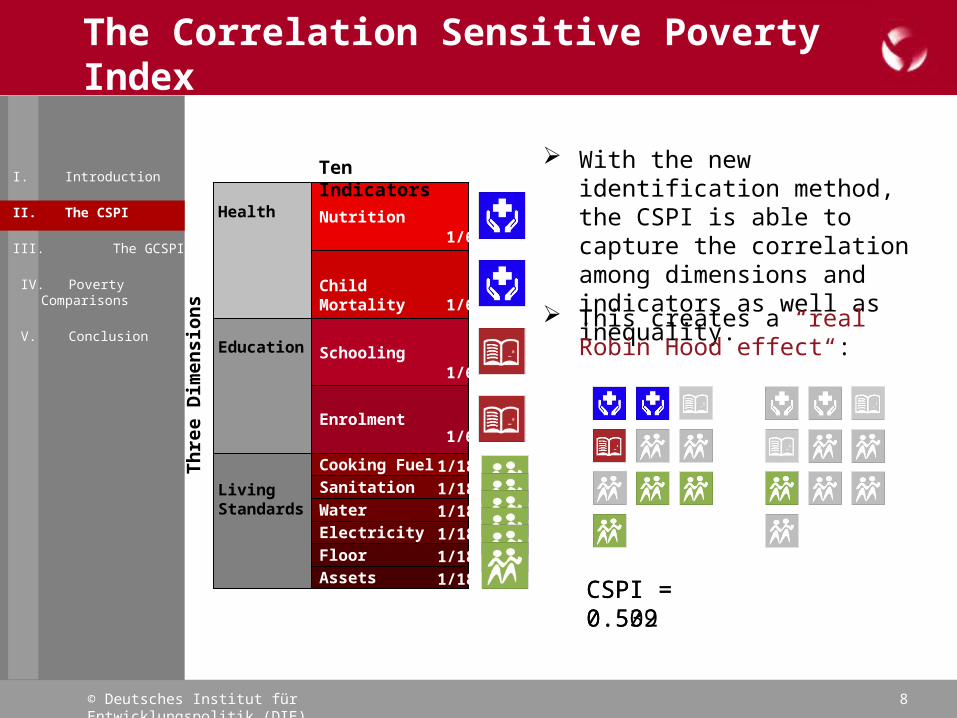
The Correlation Sensitive Poverty Index
Assets
Floor
Electricity
Water
Sanitation
Cooking Fuel
Schooling
Enrolment
Education
Living Standards
Health Nutrition
Child Mortality
Ten Indicators
Th
ree
Dim
ensi
ons
1/6
1/6
1/6
1/6
1/18
1/18
1/18
1/18
1/18
1/18 CSPI = 0.539
With the new identification method, the CSPI is able to capture the correlation among dimensions and indicators as well as inequality.
This creates a “real Robin Hood effect“:
CSPI = 0.502
I. Introduction
II. The CSPI
III. The GCSPI
IV. Poverty Comparisons
V. Conclusion

© Deutsches Institut für Entwicklungspolitik (DIE) 9
The German Correlation Sensitive Poverty Index
I. Introduction
II. The CSPI
III. The GCSPI
IV. Poverty Comparisons
V. Conclusion
Dimension Main Capability Indicator Threshold
Health Bodily Health
Health Condition Subjective health condition either poor or bad
Health Impairments
At least four of the following: 1. Have trouble climbing stairs 2. Health limits vigorous activities 3. Achieved less due to physical health condition 4. Achieved less due to mental health condition 5. Reduced social contacts due to health problems
EducationSenses, Imagination and Thought
Schooling Less than nine years of schoolingGraduation Neither graduation nor training qualification
Employment
Affiliation;Control over Environment;Play
Employment
At least one of the following: 1. Activity status 'unemployed' 2. Working poor (wage below minimum) 3. Time poor (working hour tension at least 10 hours)
HousingBodily Health;Affiliation
Housing ConditionCondition of housing either: 1. In urgent need of complete renovation 2. In danger of breaking down
Amenities
Lack of either of the following: 1. In-house bath / shower 2. Warm water 3. In-house toilet 4. Central heating
Living SpaceLiving space below minimum (45sqm for first, 15sqm for additional household members excluding infants)
Mobility Bodily IntegrityTransport
Public transport more than 20 minutes away and no car available
Crime Neighborhood either insecure or dangerous
IncomeControl over Environment
Disposable IncomeDisposable income below breadline (638 EUR for first, 356 EUR for additional adults, 322 EUR for additional children)

© Deutsches Institut für Entwicklungspolitik (DIE) 10
I. Introduction
II. The CSPI
III. The GCSPI
IV. Poverty Comparisons
V. Conclusion
Poverty Comparisons
Disposable Income
Crime
Transport
Time Poverty
Minimum Wage
Activity Status
Schooling
Graduation
Education
Housing
Health Health Condition
Health Impairments
Thirteen indicators
Six
dim
ensi
ons
1/12
1/12
1/12
1/12
1/18
1/18
1/18
1/12
1/12
1/6
Employment
Mobility
Income
Living Space1/18
Amenities1/18
Housing Condition1/18
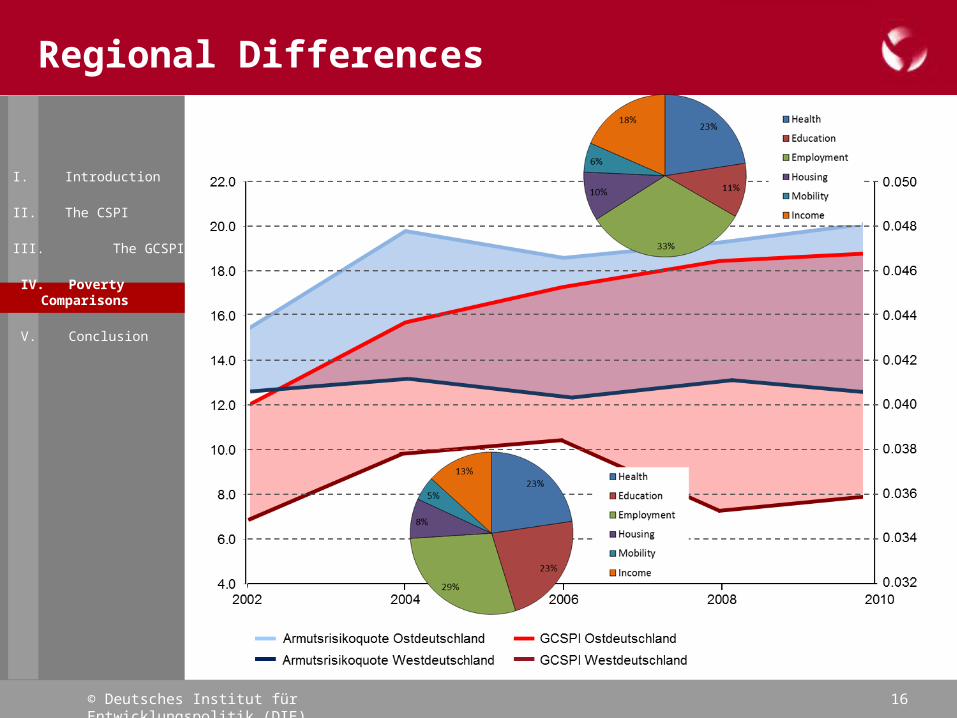
- Differences in poverty trends
- Different persons are identified as being poor
- Health, education and employment are greater contributors to overall poverty than income
- Regional differences
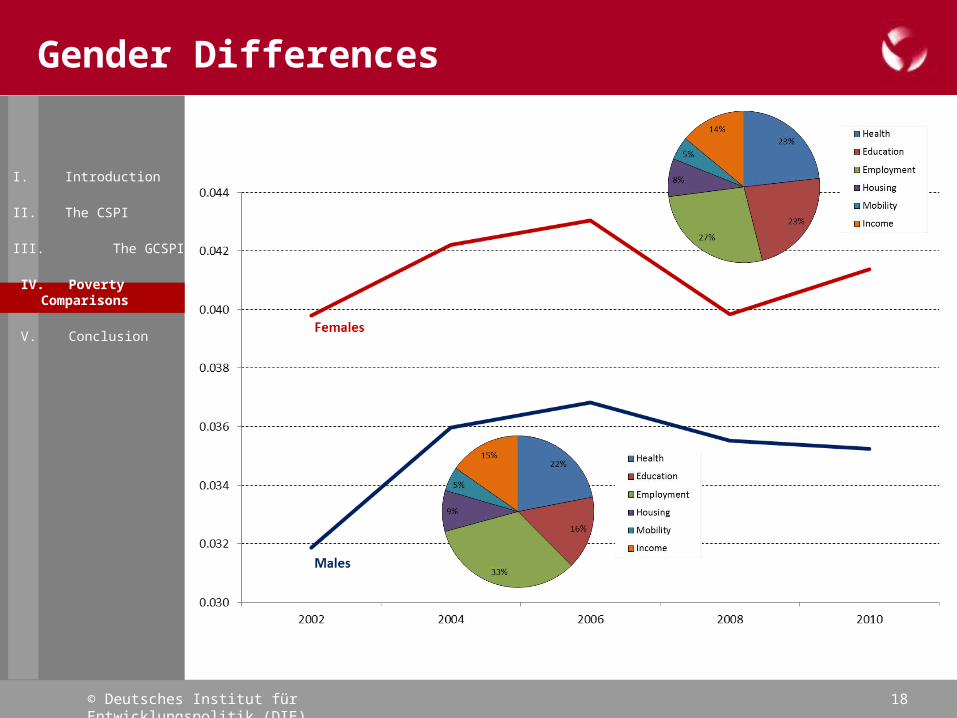
- Gender differences can be captured by the GCSPI but not by the at-risk-of-poverty rate
A comparison with the at-risk-of-poverty rate reveals considerable differences between the two indices:
I. Introduction
II. The CSPI
III. The GCSPI
IV. Poverty Comparisons
V. Conclusion

© Deutsches Institut für Entwicklungspolitik (DIE) 11
Differences in the Identification of the Poor
I. Introduction
II. The CSPI
III. The GCSPI
IV. Poverty Comparisons
V. Conclusion
At-risk-of-poverty rate
Net equivalence income
Multidimensional achievements
7%
Multidimensional poverty line (weighted sum of
indicators ≥ 1/3)
Deprivation line (weighted sum of indicators < 1/3)
6% 48%
5% 1%

© Deutsches Institut für Entwicklungspolitik (DIE) 12
Differences in Poverty Trends
I. Introduction
II. The CSPI
III. The GCSPI
IV. Poverty Comparisons
V. Conclusion
GCSPI
At-risk-of-poverty rate

© Deutsches Institut für Entwicklungspolitik (DIE) 13
Differences in Poverty Trends
I. Introduction
II. The CSPI
III. The GCSPI
IV. Poverty Comparisons
V. Conclusion
Headcount
Intensity
Inequality

© Deutsches Institut für Entwicklungspolitik (DIE) 14
Regional Differences
I. Introduction
II. The CSPI
III. The GCSPI
IV. Poverty Comparisons
V. Conclusion

© Deutsches Institut für Entwicklungspolitik (DIE) 15
Regional Differences
I. Introduction
II. The CSPI
III. The GCSPI
IV. Poverty Comparisons
V. Conclusion
© Deutsches Institut für Entwicklungspolitik (DIE) 16
Regional Differences
I. Introduction
II. The CSPI
III. The GCSPI
IV. Poverty Comparisons
V. Conclusion

© Deutsches Institut für Entwicklungspolitik (DIE) 17
Regional Differences
I. Introduction
II. The CSPI
III. The GCSPI
IV. Poverty Comparisons
V. Conclusion
© Deutsches Institut für Entwicklungspolitik (DIE) 18
Gender Differences
I. Introduction
II. The CSPI
III. The GCSPI
IV. Poverty Comparisons
V. Conclusion

© Deutsches Institut für Entwicklungspolitik (DIE) 19
Gender Differences
I. Introduction
II. The CSPI
III. The GCSPI
IV. Poverty Comparisons
V. Conclusion

© Deutsches Institut für Entwicklungspolitik (DIE) 20
Conclusion
I. Introduction
II. The CSPI
III. The GCSPI
IV. Poverty Comparisons
V. Conclusion
The German poverty reports are explicitly based on the capability approach, yet the only official German poverty index is the income-based at-risk-of-poverty rate.
This work seeks to contribute to an operationalization of the capability approach by introducing a multidimensional poverty index for Germany, the German Correlation Sensitive Poverty Index (GCSPI).
This index is a representative of a whole new class of ordinal poverty indices that are the first additive indices able to capture correlation-sensitivity and inequality while at the same time being fully decomposable (according to dimensions and population subgroups).

© Deutsches Institut für Entwicklungspolitik (DIE) 21
Conclusion
The specific properties of the new index have especially interesting implications for policy making:
- The index accounts for efficiency, i.e. scarce resources are applied in a way that their impact is strongest;
- It accounts for distributive justice, i.e. ensures that the neediest are not left behind;
- Due to its decomposability according to population sub-groups and poverty dimensions as well as the three I’s of poverty (incidence, intensity and inequality), it provides a detailed picture of the poverty structure in a given country.
I. Introduction
II. The CSPI
III. The GCSPI
IV. Poverty Comparisons
V. Conclusion

© Deutsches Institut für Entwicklungspolitik (DIE)
Applying this new index to the German SOEP data set reveals considerable differences to the at-risk-of-poverty rate:
22
Conclusion
- Different persons are identified as being poor;- Poverty trends are different;- Health, education and employment are greater
contributors to overall poverty than income;- Considerable regional differences exist; and- Gender differences can be captured by the GCSPI that
cannot be captured by the at-risk-of-poverty rate.
All these results suggest that complementing the official poverty index with a multidimensional poverty index will provide crucial additional insight in the poverty structure of Germany.
I. Introduction
II. The CSPI
III. The GCSPI
IV. Poverty Comparisons
V. Conclusion

© Deutsches Institut für Entwicklungspolitik (DIE) 23
Thank you for your attention!
German Development Institute/
Deutsches Institut für Entwicklungspolitik (DIE)
Tulpenfeld 6
D-53113 Bonn
Telefon: +49 (0)228-949 27-0
E-Mail: [email protected]
www.die-gdi.de
www.facebook.com/DIE.Bonn
www.youtube.com/DIEnewsflash