multi-trait index selection and associated genetic gains ... · multi-trait index selection and...
TRANSCRIPT
New Zealand Journal of Forestry Science Vol. 10 No. 2 (1980): 307-24
MULTI-TRAIT INDEX SELECTION AND ASSOCIATED GENETIC GAINS OF PINUS RADIATA PROGENIES AT
FIVE SITES
C J. A. SHELBOURNE and C. B. LOW Forest Research Institute, New Zealand Forest Service, Private Bag, Rotorua, New Zealand
In 1971, 220 of 588 wind pollinated Kaingaroa plus-tree progenies of the "268" series, originally planted in 1969 at Kaingaroa and Waimihia, were planted with an additional 80 plus-tree progenies ( = families) from Ashley and Berwick State Forests in progeny tests at Woodhill, Golden Downs, and Otago Coast. A sets-in-replications design with 10 sets of 30 families was used for these trials which were assessed in 1978 at age 7 years for diameter, straightness, branch quality, and malformation.
Components of variance and covariance were estimated for each site from analyses of all families, ignoring sets, and were used to calculate within-site multi-trait selection indices. The 300 families were ranked on these indices within sets, and the best families overall were provisionally selected on their summed rank positions within each set at 5 sites (including the same progenies in the 1969 experiments at Kaingaroa and Waimihia).
An overall selection index was calculated that combined a total of 17 site-traits from the 1969 and 1971 trials using a method recently developed by R, D. Burdon. This index was used to select the best 33 of the 220 families common to all 5 sites. The families selected agreed closely with those selected by summed rankings. Additional families from the other Ashley and Berwick clonal series were selected using the summed rankings as these families were not planted at Kaingaroa and Waimihia.
The "268" series open pollinated families selected on a fast-growth site in the Northern Boundary region of Kaingaroa Forest proved to be an adaptable group. They showed superior growth and form to progenies selected at Berwick, even when grown on a Southland site. They were also slightly superior to seed of the Kaingaroa seed orchard of "850" series clones, selected more intensively in an earlier generation of stands.
Realised gains of the best 36 reselected families were conservatively estimated by comparison with a control lot (990), which proved almost as good as the average of all "268" families. A previous re-evaluation of this control had concluded that its performance was anomalously good. Gains were also estimated on an alternative basis and proved large for most traits. Expected gains from selecting for all sites were only slightly less than those from selecting families specifically for each site.
INTRODUCTION
The first phase of phenotypic selection in New Zealand's Pinus radiataT>.Don breeding programme took place during the early 1950s and was characterised by very intensive phenotypic selection for vigour, bole straightness, branching, and freedom from malformation. This involved searching many thousands of hectares of 2 5-year-old
Received 7 February 1980; revision 31 March 1980

308 New Zealand Journal of Forestry Science Vol. 10 No. 2 (1980)
and older stands for the 36 "850" series clones that were eventually included in the seed orchards. In the second phase of first generation phenotypic selection in 1967, many more trees were much less intensively selected from stands 12-17 years old; the forest was divided into small rectangular blocks of about 1.2 ha each from which the best tree was selected. The 1967 selection was in the Northern Boundary region of Kaingaroa Forest and also on a smaller scale at Ashley and Berwick State Forests in the South Island. Wind pollinated seed was collected from all selected trees. The parent trees were all propagated as grafts or cuttings in clonal archives that were later kept hedged to stop further maturation, to produce abundant cutting and scion material, and also to produce accessible flowers for controlled pollination.
In 1969, 588 wind-pollinated progenies of the "268" clonal series (from Kaingaroa) were planted at Kaingaroa, Waimihia, and Gwavas, and 220 of these same families, with another 19 from Berwick ("768"), 54 from Ashley ("668"), and 7 "850" families from Canterbury and Southland, were planted at Woodhill, Golden Downs, and Otago Coast in 1971. The 1969 experiments were assessed at age 5 years from planting (Wilcox & Firth and Wilcox et al., unpubl. data). This paper reports assessment of the 1971 plantings when they were approaching age 7 years. The fifth-year data from Kaingaroa and Waimihia of the 220 "268" series families involved at the other sites have also been incorporated into the overall analysis.
The primary objective of these large wind-pollinated progeny tests is to allow estimation of the breeding value of their female parents, so that the best 5-10% of these parents can be reselected for use in clonal seed orchards. Wind-pollinated progenies. give acceptable estimates of breeding value because plantation stands provide a homogenous source of unrelated trees, derived from large seed collections from many parents. Cones are normally collected from several years' pollination in this serotinous species, and there is every likelihood that a large group of male parents will effect pollination on any single female parent.
Additional objectives included: (a) Selecting the best trees within the tests. This was realised in the 1969 trials but was
not attempted in the 1971 experiments. (b) Investigating GE interaction effects on intra-site versus overall sites selection. (c) Comparing progenies from different areas and selection phases, i.e., the "268",
"768", "668", and "850" series. (d) Predicting genetic gains from clonal seed orchards based on reselection of a
proportion of the parent clones.
MATERIALS A N D METHODS
Experimental design and layout A total of 54 "668" (ex Ashley), 19 "768" (ex Berwick), 222 "268" (ex Kaingaroa),
and 7 "850" families were raised at Kumeu and Rangiora nurseries. They were sown, unreplicated, in numerical order. At planting the families were arranged in 10 sets of 30 families. Sets 1 to 8 were made of 24 to 27 "268" families, 3 "668" families, and 3 "768" families. A total of 7 "850" progenies (collected from the original ortets of the early-selected Amberley seed orchard clones) were also included in Sets 6 and 9. Set 10 was not included at Woodhill because of shortage of stock. In each set there
Shelbourne and Low — Multi-trait index selection 309
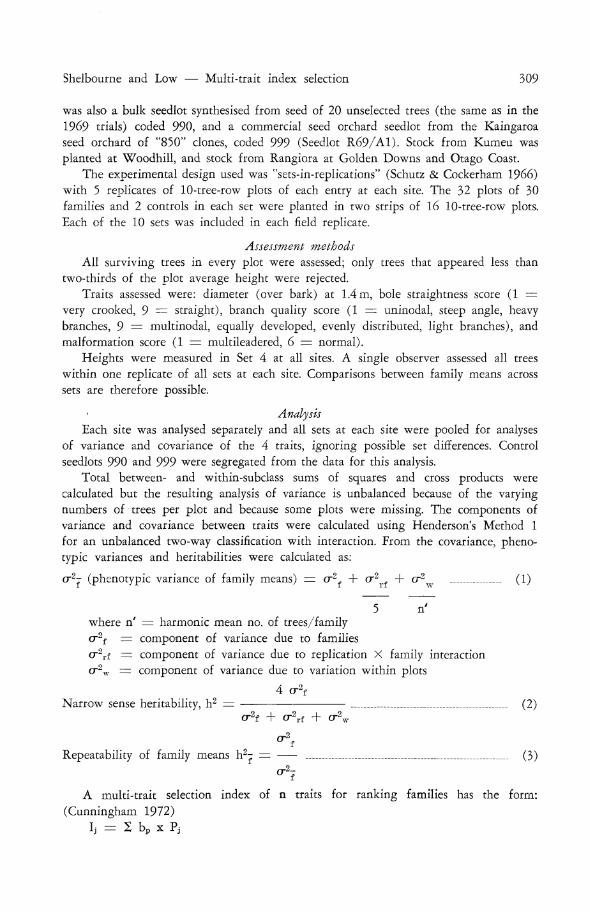
was also a bulk seedlot synthesised from seed of 20 unselected trees (the same as in the 1969 trials) coded 990, and a commercial seed orchard seedlot from the Kaingaroa seed orchard of "850" clones, coded 999 (Seedlot R69/A1). Stock from Kumeu was planted at Woodhill, and stock from Rangiora at Golden Downs and Otago Coast.
The experimental design used was "sets-in-replications" (Schutz & Cockerham 1966) with 5 replicates of 10-tree-row plots of each entry at each site. The 32 plots of 30 families and 2 controls in each set were planted in two strips of 16 10-tree-row plots. Each of the 10 sets was included in each field replicate.
Assessment methods All surviving trees in every plot were assessed; only trees that appeared less than
two-thirds of the plot average height were rejected. Traits assessed were: diameter (over bark) at 1.4 m, bole straightness score (1 =
very crooked, 9 = straight), branch quality score (1 = uninodal, steep angle, heavy branches, 9 = multinodal, equally developed, evenly distributed, light branches), and malformation score (1 = multileadered, 6 = normal).
Heights were measured in Set 4 at all sites. A single observer assessed all trees within one replicate of all sets at each site. Comparisons between family means across sets are therefore possible.
Analysis Each site was analysed separately and all sets at each site were pooled for analyses
of variance and covariance of the 4 traits, ignoring possible set differences. Control seedlots 990 and 999 were segregated from the data for this analysis.
Total between- and within-subclass sums of squares and cross products were calculated but the resulting analysis of variance is unbalanced because of the varying numbers of trees per plot and because some plots were missing. The components of variance and covariance between traits were calculated using Henderson's Method 1 for an unbalanced two-way classification with interaction. From the covariance, phenotypic variances and heritabilities were calculated as:
er2- (phenotypic variance of family means) = cr2f + cr2
rf + or2w (1)
5 n' where n' = harmonic mean no. of trees/family cr2
f = component of variance due to families cr2
rf = component of variance due to replication X family interaction cr2
w z= component of variance due to variation within plots
4 o-2f
Narrow sense heritability, h2 = cr2f + cr2
rf + cr2w
Repeatability of family means h2- =
A multi-trait selection index of n traits for ranking families has the (Cunningham 1972)
I, = 2 bp X Pi
(2)
- (3)
form:
310 New Zealand Journal of Forestry Science Vol. 10 No. 2 (1980)
Where: lj is the index value of the j th family
bp is the weighting factor for the pth trait; x is the mean phenotypic value of the pth trait for the j th family.
The b's are found from: b = P ^ A a
Where: P is the phenotypic variance-covariance matrix of family means A is the matrix of family variances and covariances a. is the vector of economic weights with unit weight per Standard Deviation of family ~ means assumed for each trait b is the vector of index weights.
The phenotypic variance-covariance matrix P for each site (Otago Coast, Golden Downs, and Woodhill) was calculated from the components of variance and covariance, and the genotypic variance-covariance matrix A was derived from the family components. Allocating an economic weight to each trait corresponding to the reciprocal of the standard deviation of family means for that trait was adopted in the absence of any quantitative data on the relative economic importance of traits. A selection index was calculated for each site and the families were ranked on their index values at each site. A similar approach was adopted by Wilcox & Firth (unpubl. data) in their analysis of the 1969 planted trials at Waimihia and Kaingaroa; their results are used here.
Using only the 205 "268" families that were common to all 3 sites and which were also planted at Kaingaroa and Waimihia in 1969, a combined index over the 5 sites was constructed with information from a total of 17 site-traits, according to the method proposed by Burdon (1979). The only additional analysis required was to obtain between-site mean squares and cross products for the 17 site-traits for 205 family means. The phenotypic variance-covariance matrix P was constructed from the single site analyses for the intra-site portion and the covariances between 2 traits at different sites were obtained from the mean cross products of family means (Burdon 1979), such that a mean cross product provides a direct estimate of the genotypic (family) covariance. The values of these covariances are the same for both P and A matrices, as:
Cov f Xi yi = Gov f xi yi.
A combined index was calculated to give the 17 b weights for each trait at each site and these 205 families were then ranked on the combined index.
RESULTS A N D DISCUSSION
Her it abilities and genetic correlations between traits within sites
Estimates of variance and covariance components from the within-site analyses, as well as heritabilities of the different traits, are given in Table 1, and genetic and phenotypic correlations are shown in Table 2. Heritability of malformation was low at Golden Downs and Otago Coast; this trait was not assessed at Woodhill as there

Shelbourne and Low — Multi-trait index selection 311
TABLE 1—Within-site variance and covariance components and heritabilities
Site and trait
OTAGO COAST
Diameter Straightness Br. quality Malformation Diam, x ST Diam, x BQ Diam, x Malf. ST x BQ ST x Malf. BQ x Malf.
GOLDEN DOWNS
Diameter Straightness Br. quality Malformation Diam, x ST Diam, x BQ Diam, x Malf. ST x BQ ST x Malf. BQ x Malf.
WOODHILL
Diameter Straightness Br. quality Diam, x ST Diam, x BQ ST x BQ
KAINGAROA*
Diameter Straightness Br. quality
WAIMIHIA*
Diameter Straightness Br. quality
o-2
r
47.53 0.762 0.447 0.308 5.116 3.616 3.254 0.524 0.446 0.309
13.49 0.548 0.840 0.017
—2.124 —2.946 —0.455
0.468 0.090 0.093
6.38 0.328 0.146 1.331 0.750 0.186
20.0 0.28 0.23
19.2 0.13 0.08
<T\ f
28.62 0.059 0.116 0.039 0.409 0.719
—0.352 0.056 0.029 0.019
9.76 0.050 0.289 0.014
—0.029 0.438 0.004
—0.001 0.008 0.013
21.10 0.098 0.266 0.437 1.062 0.090
14.1 0.14 0.21
11.8 0.18 0.18
e r 2 , rf
76.51 0.228 0.201 0.125 0.683 0.618
—0.535 0.110 0.091 0.059
181.77 0.189 0.315 0.017
—0.376 0.536
—1.184 0.005 0.012 0.015
54.01 0.4024 0.236 0.849 0.681 0.236
27.2 0.21 0.11
19.7 0.12 0.02
O"2
w
223.46 1.656 1.875 1.886 2.203 4.457 0.306 0.520 0.401 0.349
303.52 1.565 2.448 0.938
—0.132 4.618
—1.242 0.350 0.282 0.164
344.87 1.8200 2.330 3.060 7.330 0.830
262.5 2.78 3.23
295,8 2.63 3.26
h2
0.348 0.121 0.211 0.075
0.079 0.111 0.379 0.058
0.201 0.169 0.376
0.18 0.18 0.24
0.14 0.25 0.21
h2-f
0.576 0.400 0.568 0.344
0.182 0.396 0.701 0.347
0.523 0.439 0.718
0.58 0.59 0.70
0.54 0.69 0.66
*From: Wilcox & Firth (1974)
ST = Straightness
BQ = Branch quality

312 New Zealand Journal of Forestry Science Vol. 10 No. 2 (1980)
TABLE 2—Estimates of genetic correlation (rG) and phenotypic correlation (rp)
GENETIC CORRELATION (rG) COVA
A i #
Ver2, er2
A i
Trait
Diam. ST BQ
Otago Coast
ST BQ
0.316 0.395 0.682
Malf.
—0.336 0.438 0.282
Golden Downs
ST BQ
—0.042 0.261 —0.007
Malf.
0.012 0.313 0.202
Woodhill
ST BQ
0.304 0.448 0.557
Where COV = additive genetic covariance between traits 1 and 2 A 1 2
a2 0.2 = additive genetic variance (half sib family variance) of traits 1 Al A2
and 2
PHENOTYPIC CORRELATIONS (rp)
cov-fl2
V o - 2h o-2-f2
Trait
Diam. ST BQ
Where
Otago Coast
ST BQ
0.223 0.301 0.330
Malf.
—0.192 0.385 0.261
Golden Downs
ST BQ
—0.042 0.140 0.038
Malf.
0.179 0.247 0.155
COV- = phenotypic covariance between family means of traits 1
er2- and er2- = variance of family means of traits 1 and 2
Woodhill
ST BQ
0.227 0.358 0.548
and 2
was very little malformation on this sand dune site. Heritability of diameter was very low at Golden Downs, and moderate at the other two sites; this reflects the extreme variability of the Golden Downs site where growth was good in the valleys and very poor on the ridges, and blocking was ineffective in overcoming the plot error. Estimated heritability of diameter was high at Otago Coast because fortuitous site differences between sets inflated differences between families in the analysis, which was carried out with all sets pooled. Moderately high heritability for branch quality was maintained at •11 sites in spite of these effects. Repeatabilities of family means of these traits in the 1969 planted experiments at Kaingaroa and Waimihia (Wilcox & Firth, unpubl. data) are shown as well and were generally higher.
Estimates of genetic correlations between traits appeared fairly consistent at Woodhill and Otago Coast but those at Golden Downs were out of line. This was probably due

Shelbourne and Low — Multi-trait index selection 313
in part to the very low heritability of diameter there. With poorly heritable traits genetic correlations with other traits are often imprecisely estimated.
Genotype X environment interaction
Data from Set 4, in which height and malformation were assessed at all sites as well as diameter, straightness, and branch quality, was analysed over all sites. Components of variance, heritabilities, and genetic correlations for this overall analysis are given in Table 3. The size of the family X site variance component relative to the family component provides a measure of the importance of genotype X site interaction at these 3 sites. The ratios of family X site: family variance were 0.34, 0.50, 0.34, 0.58, and 0.29 for diameter, height, volume, straightness, and branch quality respectively, indicating that although there is interaction, it is not swamping the family effects. This implies that selection of the best families over the 3 sites will not result in large losses in genetic gain, compared with selecting the best families at each site.
TABLE 3—Estimates of genetic parameters in Set 4 over Otago Coast, Golden Downs, and Woodhill components of variance and heritabilities
Diameter a-2
Height Volume a-2
Straightness Br. Quality Malformation
vL fs er fr ;
er-h2
h2-
61.6
71.4
10.6
3.6 71.0
281.0
0.12
0.56
90.2
39.6
5.4 2.7 23.3
67.3
0.21
0.64
27.3 X IO6
79.6 X IO6
12.1 X IO6
4.1 X IO6
53.6 X IO6
232.9 X IO6
0.16
0.64
0.226
0.740
0.028
0.016
0.131
1.753
0.08
0.50
0.305
0.331
0.243
0.071
0.137
2.480
0.33
0.82
0.699
0.073
0.001
0.032
0.032
0.954
0.01
0.03
where
er6
tf" CF2
fr : s CF*
Components of variance due to: sites replications within sites families interaction of families and sites interaction of families and reps within sites, i.e., plot error
trees within plots
Genetic correlations over 3 sites
Height Volume Straightness Br. quality Malformations-
Diameter Height Volume Straightness Br. quality
1.08 1.00 1.02
-0.03 —0.06 —0.05
0.90 0.80 0.88 0.51
0.04 —0.94 —0.37 0.42 0.20
* Because heritability of malformation was near zero, these genetic correlations are meaningless.

314 New Zealand Journal of Forestry Science Vol. 10 No. 2 (1980)
TABLE 4—Inter-site genetic correlations
Trait and site
DIAMETER Otago Coast Golden Downs Woodhill Kaingaroa Waimihia
STRAIGHTNESS Otago Coast Golden Downs Woodhill Kaingaroa Waimihia
BR. QUALITY Otago Coast Golden Downs Woodhill Kaingaroa Waimihia
Golden Downs
0.70
0.76
0.51
Woodhill
0.47 0.59
0.46 0.74
0.20 0.45
Kaingaroa
0.79 0.50 0.56
0.91 0.73 0.65
0.59 0.71 0.39
Waimihia
0.61 0.08 0.43 1.14
0.55 0.66 0.49 0.69
0.46 0.54 0.30 0.87
h2_ f
0.58 0.18 0.52 0.58 0.54
0.40 0.40 0.44 0.59 0.69
0.57 0.70 0.72 0.70 0.66
Mean correlations
0.64 0.47 0.51 0.75 0.57
0.67 0.72 0.59 0.75 0.60
0.44 0.55 0.34 0.64 0.54
The genetic correlations between traits for Set 4 were generally high and positive between growth traits and branch quality, i.e., multinodal trees tend to grow faster. The same trend was shown in the within-site genetic correlations.
Genetic correlations between the same trait at different sites are another way of expressing GE interactions (Table 4). Branch quality generally shows lower correlations among sites than the other traits; this character is largely expressing the multinodal-uninodal branching habit which is strongly affected by soils and nutrition and by climate. Woodhill shows lowest average correlations for diameter, straightness, and branch quality and Kaingaroa shows the highest average inter-site correlations.
There are high correlations between Kaingaroa and Waimihia for all traits, as might be expected, and generally low correlations between Woodhill and Otago Coast, and Woodhill and Waimihia. At Golden Downs correlations involving diameter will be somewhat unreliable because of the low family mean repeatability of this trait there.
One can conclude from these results that the best single site for general testing would be Kaingaroa, and that the Woodhill sand dune site would be a poor one for this purpose.
Family means In retrospect, pooling the sets at each site into one series of analyses of variance
and covariance was not ideal, partly because there were some appreciable environmental differences between sets, particularly at Otago Coast, which inflated family differences overall. It also reduced precision of family to family comparisons within sets. However, computing coefficients for 30 separate Henderson Method 1 estimates of variance components would have been unduly laborious.

Shelbourne and Low — Multi-trait index selection 315
The most serious problem with this experiment was the imprecise estimates of family means. This was due to site variation within each set replicate because widely different micro-environments affected different families in different parts of each replication. Five replicates at each site were insufficient to overcome this source of error. The ratio of replication X family interaction variance to family variance reflects this situation for the different sites. For diameter, this ratio was 19 at Golden Downs compared with only about 3 at Woodhill and Otago Coast. Analysis by sets would have reduced this error somewhat but planting the same number of trees per family per site with more replications of individual tree plots would have been the most effective remedy.
Within-site selection indices and family ranking
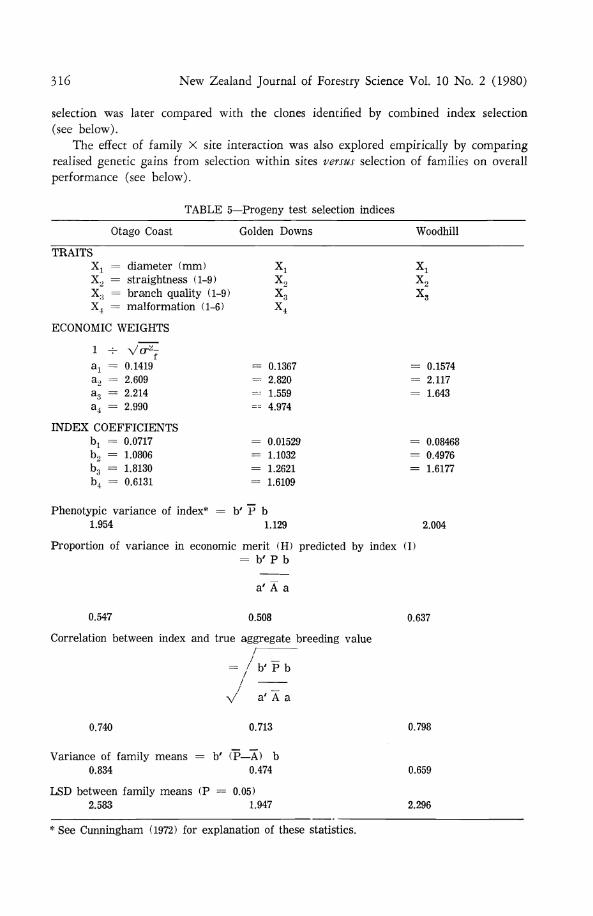
Multi-trait selection indices for each site were calculated as shown earlier (Table 5). Considering the selection index coefficients, bi, the weighting for family mean diameter was very small at Golden Downs (because of low family mean repeatability there) and was highest at Woodhill. Straightness (bo) received a low weight at Woodhill (there was less family variation in straightness which was generally good on this site), and branch quality (bs) received more weight at Otago Coast than at Woodhill or at Golden Downs. Malformation (b4) received a low weighting at Otago Coast compared with Golden Downs because of a negative correlation with diameter at Otago Coast.
All families were ranked by sets at each site to enable selection of the best families in each set at each site*. Selection within sets was desirable because of differing contributions of the different clonal series.
The top-ranked families in each set combine good diameter growth with high branch quality and straightness ratings. Malformation scores appear to have contributed little to the rankings.
The rank positions (from 1 to 32) for each family within Sets 1 and 2 of each site are summarised in Table 6. Family rank positions at Kaingaroa and Waimihia are not strictly comparable with those at the other sites as the sets were composed differently and there were 40 seedlots in each set. The rank positions given for these 2 sites are the rank of that seedlot in the set in which it was planted.
Although ranks change considerably from site to site, there are a few progenies in each set that rank quite highly on all sites. Progenies do not rank the same at each site because of experimental error (family means have quite broad confidence limits) and because of family X site interaction (families perform differently relative to each other in different environments). For individually selected families these sources of variation are inseparable. The genetic correlations between sites (Table 4) discussed previously indicated that of all the sites Woodhill showed lowest correlations with other sites. At present, however, there is insufficient economic justification for establishing a breeding programme and seed orchard for coastal sand dunes. Therefore families (and thus the parent clones) were selected for good performance at all sites. Initially a list of the best clones in each set was drawn up by summing the rank positions at all 5 sites of the better clones and selecting those with the lowest rank totals. This
* Complete information on all families is too lengthy for publication. A complete unpublished account is available from the authors.
316 New Zealand Journal of Forestry Science Vol. 10 No. 2 (1980)
selection was later compared with the clones identified by combined index selection (see below).
The effect of family X site interaction was also explored empirically by comparing realised genetic gains from selection within sites versus selection of families on overall performance (see below).
TABLE 5—Progeny test selection indices
Otago Coast Golden Downs Woodhill
TRAITS X-L = diameter (mm) X2 = straightness (1-9) X8 = branch quality (1-9) X4 = malformation (1-6)
ECONOMIC WEIGHTS
1 - V o ^ ax = 0.1419 a2 = 2.609 a3 = 2.214 a4 = 2.990
INDEX COEFFICIENTS bj = 0.0717 b2 = 1.0806 b3 = 1.8130 b4 = 0.6131
Phenotypic variance of index* = b' 1.954
= = ~ ==
= = = =
Xi
x9 x, x4
0.1367 2.820 1.559 4.974
0.01529 1.1032 1.2621 1.6109
P b 1.129
Xx
X0
0.1574 2.117 1.643
0.08468 0.4976 1.6177
2.004
Proportion of variance in economic merit (H) predicted by index (I) = b ' P b
a' A a
0.547 0.508 0.637
Correlation between index and true aggregate breeding value
0.740
= / b ' P b /
V a' A a
0.713 0.798
Variance of family means = b' (P—A) b 0.834 0.474
LSD between family means (P = 0.05) 2,583 1.947
0.659
2.296
* See Cunningham (1972) for explanation of these statistics.

Shelbourne and Low — Multi-trait index selection 317
TABLE 6—Rank positions at five sites: intra-site index 1
Set 1 Set 2
Fam
ily
2008 2009 2012 2018 2020 2021 2022 2023 2026 2027 2031 2032 2033 2037 2038 2039 2042 2043 2044 2045 2046 2048 2049 2054 6002 6005 6006 7001 7003 7004 2990 2999
Gol
den
Dow
ns
26 23 14 31 19 4 17 3 9 2 21 28 10 16 6 20 12 11 13 7 18 5 25 1 15 8 30 24 32 29 22 27
Ota
go C
oast
27 24 9 15 16 21 17 5 11 4 14 26 8 10 12 13 18 6 2 1 30 29 22 3 19 7 25 23 31 28 20 32
Woo
dhill
18 12 13 25 27 22 24 3 15 7 26 28 1 8 11 16 19 21 5 10 2 20 6 9 14 4 32 31 30 32 18 24
Kai
ngar
oa
39 25 18 27 30 15 32 11 9 22 20 10 2 26 17 24 6 30 15 18 36 40 31 2
29 19
Wai
mih
ia
13 10 4 31 7 19 29 30 18 37 35 14 5 12 9 36 24 5 7 31 13 37 14 4
28 17
Fam
ily
2058 2065 2068 2072 2076 2077 2081 2082 2083 2087 2089 2097 2098 2101 2102 2103 2105 2106 2112 2113 2115 2117 2121 2122 6010 6011 6016 7005 7006 7007 2990 2999
Gol
den
Dow
ns
27 11 29 7 16 20 19 n 12 15 3 23 24 6 14 25 9 28 4 10 26 1 2 13 30 17 5 21 32 31 8 18
Ota
go C
oast
24 27 11 2 9 21 22 2tt 17 8 10 29 23 3 20 7 16 15 6 14 26 4 25 19 18 5 1 32 31 30 12 13
Woo
dhill
10 2 13 21 17 24 22 4 7 18 12 30 7 8 11 26 16 15 5 20 19 1 3 28 29 23 25 31 27 32 6 14
Kai
ngar
oa
26 5/21 25 20 14 5 34 31 25 15 8 39 22 4 18 32 19 33 3 28 37 1 9 30
26 21
Wai
mih
ia
15 2/21 21 34 38 25 31 28 22 33 5 39 23 17 4 19 11 35 14 21 30 7 22 30
38 10
Combined (over-sites) selection index and family ranking
The results of the 1971 trials at Golden Downs, Otago Coast, and Woodhill were combined with those for the same 220 "268" families at Kaingaroa and Waimihia planted in 1969. A 17-trait selection index was constructed (as previously described) with equal economic weights for each trait at each site (Table 7).
This index provides a completely different set of index coefficients than the within-site indices. For instances, diameter coefficients were 0.134, 0.029, 0.118, 0.168, 0.064 at Otago Coast, Golden Downs, Woodhill, Kaingaroa, and Waimihia respectively for the

318 New Zealand Journal of Forestry Science Vol. 10 No. 2 (1980)
TABLE 7—Combined index over all sites
Character and site
X1 Diameter — Otago Coast X2 Straightness — Otago Coast X3 Branch quality — Otago Coast X4 Malformation — Otago Coast X5 Diameter — Golden Downs X6 Straightness — Golden Downs X7 Branch quality — Golden Downs X8 Malformation — Golden Downs X9 Diameter — Woodhill X10 Straightness — Woodhill X n Branch quality — Woodhill X12 Diameter — Kaingaroa X13 Straightness — Kaingaroa X14 Branch quality — Kaingaroa X15 Diameter — Waimihia X16 Straightness — Waimihia X17 Branch quality — Waimihia
Phenotypic variance of index V(I) = b' P b* = 3.171 Proportion of variance in economic merit (H) predicted by Index (I)
= b l P b = 0.810
Economic weights
a i
0.1419 2.609 2.214 2.990 0.1367 2.819 1.559 4.974 0.1574 2.117 1.642 0.2035 2.016 1.812 0.2134 1.967 1.935
Index coefficient
bi
0.1343 0.4764 2.526 0.1771 0.0293 2.028 1.521 1.539 0.1177 1.017 1.167 0.1675 2.350 2.353 0.0642 2.199 1.266
a ' A a
Correlation between index and true aggregate breeding value /-/ _
/ b' P b = 0.900
V a' A a Heritability of performance index = 0.815 LSD between family means = 6.85
*See Cunningham (1972).
combined index, compared with 0.072, 0.015, 0.085, 0.215, 0.222 for the within-site indexes (however, diameter at Kaingaroa and Waimihia received twice the economic weight of the other traits in these within-site indexes (Wilcox & Firth, unpubl. data)). The combined index takes into account the repeatability of family means of each trait at each site but in addition involves the genetic correlations between each trait at each site. In this instance, the within-site variances and covariances were estimated from a different sample of families at Kaingaroa and Waimihia than were involved at the other sites. There, all 220 families in the 1971 experiments were used to calculate the within-site and between-site variances and covariances.
Only the "268" series families could be ranked on the combined index because the families of the other series were not planted at Kaingaroa and Waimihia. There was considerable though varying agreement between rankings on within site indexes, and

Shelbourne and Low — Multi-trait index selection 319
on the combined index. In 6 out of 8 sets none of the first 5 clones (on the basis of summed within-site rankings) was lower than 7th on the combined index ranking, and in the other 2 sets none was lower than 9th or 10th in the combined index rankings. This provided a good empirical test that the combined index method was working satisfactorily.
A group of 33 clones was finally selected by choosing the best 3-5 families of each set of 30 on the basis of the combined index, and another 3 clones of the "668" series were chosen from the within-site rankings as this series was not planted at Waimihia and Kaingaroa.
Comparison of progeny series
In Table 8, the means for the "268" (ex Kaingaroa), "668" (ex Ashley), "768" (ex Berwick), and "850" series of families are compared with the 990 unselected control and the 999 seed orchard control. Differences between straightness and branching scores between sites are due both to differing environments and different observers and are not meaningful. There were modest differences between the series for most traits. Trees of the "268" series were generally slightly more vigorous, slightly straighter, and of better branch quality than trees of the "668", "768", and "850" series. It is odd that local selection of the "768" Berwick clones did not give as straight or as well branched offspring at Otago Coast as selection in the Northern Boundary region of Kaingaroa. The 7 "850" clones, whose offspring are represented, were selected very much earlier and more intensively in Canterbury and Southland from 1st rotation stands and these progenies performed poorly compared with the "268"s. The 999 Kaingaroa seed orchard control lot (from "850" series North Island selections) grew at about the same rate, and was, surprisingly, slightly poorer in straightness and branch quality than the "268" families, which are from wind pollinated seed collected from the parent ortets. This could be explained by a genetic improvement because of silvicultural and natural selection in the 2nd rotation stands, from which the "268"s were selected.
The 990 control lot is the same as was used in the 1969 trials and was of bulked seed of 20 trees supposedly randomly selected in the same stands as the "268"s. Its growth, straightness, and branching were only slightly inferior to the "268" families. In an examination of this anomalous result in the 1969 trials, Shelbourne (unpubl. data) concluded that the 990 seedlot was indeed much better than expected from a base population, and that from data from other experiments, seedlot 993, the wind pollinated progeny of clone 850-037, in fact approximated the base population more closely and could be used in the 1969 experiments (but was not used in the 1971 trials) to simulate an unselected base population. Progeny of clone 268-097 ranked next to those of 850-037 in the 1969 trials at Kaingaroa and Waimihia (Table 9). The means of the 268-097 progeny at these sites and at Otago Coast, Golden Downs, and Woodhill are considerably poorer in all traits than those of control lot 990, providing some additional evidence of the anomalous superiority of the 990 control.
Therefore, it seems that the moderately intensive selection of the "268" parents in the Northern Boundary stands in Kaingaroa has identified genotypes that on the average grow at least as well with better bole straightness and branching than those yielded by more intensive and/or local selection on other sites. Quite fortuitously these stands with high site index and maximum expression of branching characteristics and stem

320 New Zealand Journal of Forestry Science Vol. 10 No. 2 (1980)
TABLE 8—Progeny group means
Series
DIAMETER
268 688 768 850 990 999
Otago Coast
117.0 a 117.8 a 114.2 b 112.1 b 116.4 ab 116.7 ab
STRAIGHTNESS
268 688 768 850 930 999
5.53 a 5.47 a 5.25 ab 5.11 b 5.42 a 5.41 a
BRANCH QUALITY
268 688 768 850 990 999
4.74 a 4.50 b 4.09 c 4.08 c 4.62 ab 4.63 ab
MALFORMATION
268 668 768 850 990 999
4.29 a 4.25 ab 4.17 b 4.10 b 4.28 ab 4.39 ab
Golden Downs
103.8 a 105.9 b 101.3 a 101.6 ab 104.7 ab 102.7 ab
6.59 a 6.59 a 6.45 b 6.20 c 6.40 be 6.43 abc
5.40 a 4.87 b 4.28 c 4.49 c 5.30 a 5.07 ab
5.45 a 5.36 b 5.47 a 5.25 b 5.38 ab 5.43 ab
Woodhill
120.5 a 117.7 b 113.4 c 113.9 c 114.7 c 116.5 be
6.77 a 6.66 b 6.10 c 6.56 ab 6.54 b 6.68 ab
6.23 a 5.86 b 5.32 a 6.12 a 6.18 a 5.86 ab
Kaingaroa:i:
119.0 a
118.8 a 119.7 a
5.18 a
4.51 b 4.94 c
4.78 a
4.43 b 4.61 b
Waimihia*
110.0 ab
108.7 a 111.0 b
5.31 a
4.96 b 5.08 b
4.42 a
4.14 b 4.28 b
: From Wilcox & Firth (unpubl. data).
defects have proved to be a good population growing in a good selection environment. From this large group of progenies it is possible to select genotypes that will perform well over a wide range of other sites. The "268" families are performing slightly better at all sites than a commercial seedlot from the Kaingaroa seed orchard which indicates that these clones as a group are at least the equal of the more intensively selected "850" series and may well be superior. The performance of the 990 control again gives support to the suspicion that it is not composed of seed of unselected parents.
The seedlots from which the Ashley and Berwick stands derive and which furnished the "668" and "768" clones, were collected locally from many different sources and offer no clues to the inferior performance of these groups of clones.
The seedlots from which the Northern Boundary stands were planted derive from the felling of some of the oldest P. radiata in the Waiotapu subdivision of Kaingaroa in the early 1950s, and have thus grown for 2 generations in Kaingaroa. The stands,

Site
Otago Coast
Golden Downs
Woodhill
Kaingaroa
Waimihia
Overall means 2
TABLE 9—Selection differentials from reselection among wind
Trait
Diameter Straightness Br. quality Malformation
Diameter Straightness Br. quality Malformation
Diameter Straightness Br. quality
Diameter Straightness Br. quality
Diameter Straightness Br. quality
Diameter Straightness Br. quality
i Selection differentials in ( ) are
268-097
117 5.00 4.25 4.25
90 6.31 5.21 5.51
113 6.03 5.29
111.6 4.6 4.0
104.0 4.6 3.6
107.1 5.31 4.47
based on
990 control
116.4 5.42 4.62 4.28
104.7 6.40 5.30 5.38
114.7 6.54 6.18
118.8 4.51 4.43
108.7 4.96 4.14
112.7 5.57 4.93
Means
Best 36
(combined index)
119.9 5.75 5.06 4.31
108.1 6.75 5.93 5.47
124.21 7.02 6.58
122.7 5.58 5.46
113.4 5.56 4.91
117.7 6.13 5.59
progeny 268-097.
2 Arithmetic average of 5 site means for that progeny or
Best 36
(within-site index)
121.3 5.90 5.26 4.51
105.8 6.86 6.07 5.58
127.3 7.11 6.85
125.1 5.51 5.46
115.9 5.60 4.86
119.1 6.20 5.70
progeny group.
999 seed
orchard
116.7 5.41 4.63 4.39
102.7 6.43 5.07 5.43
116.5 6.68 5.86
119.7 4.94 4.61
111.0 5.06 4.28
113.3 5.70 4.89
pollinated progenies
Selection differential %
Best 36
(combined index)
3.0 6.1 9.5 0.7
3.2 5.5
11.9 1.7
8.3 7.3 6.5
3.3 23.7 23.3
4.3 12.1 18.6
4.4 (9.9)1 10.9 (15.4) 14.0 (25.1)
Best 33
(within-site)
4.2 8.9
13.9 5.4
1.1 7.2
14.5 3.3
11.0 8.7
10.8
5.3 22.2 23.3
6.6 12.9 17.4
5.6 (11.2) 12.0 (16.8) 16.0 (27.5)
999 seed
orchard
0.3 —0.2
0.2 2.6
—1.9 0.5
—4.3 0.9
1.6 2.1
—5.2
0.8 9.5 4.1
2.12 2.0 3.4
0.6 (5.8) 2.8 (7.3)
—0.4 (9.4)
Shelbc lurne
P p
Low
|
£ g r-t
rt'
CA CD
nT
o" p

322 New Zealand Journal of Forestry Science Vol. 10 No. 2 (1980)
established 1926-31, from which the "850" clones in the Kaingaroa seed orchard were mainly selected (mainly from farm shelterbelts) derive from seed collected by the firm of N. & R. Oxnam, Aokautere, Manawatu (M. D. Wilcox, pers. comm.). A possible explanation for the better performance of "268" offspring could thus lie in an extra generation of natural and silvicultural selection in the Kaingaroa environment. An alternative explanation may lie in the fact that the "850" series clones were selected in stands of 25 years and over whereas the "268"s were selected in stands aged 12 and 17 years. It is possible that selection in younger stands is more effective.
Selection differentials from res election of 36 wind 'pollinated j amities
For each trait the difference between the means of a group of families reselected by the combined index and the means of an unselected control seedlot are the gains that would be made by replanting these same families on the same sites, after reduction by a shrinkage factor corresponding to the repeatability of the means of the reselected group of families. As methods of calculation of this shrinkage factor are uncertain these "gains" are shown in Table 9 as selection differentials over the 990 control. It is recognised that the 990 control is almost certainly much better than a typical bulk unselected seedlot in growth, straightness, and branching. However, it is the only seedlot planted in every set of the 1971 experiments that can be used as a base for gain estimation. Selection differentials (over 990) from selection on the combined index for the best 36 families were therefore compared with selection differentials from selection for the best 36 based on the within-site indices at each site (Table 9). The selection differentials from combined index selection averaged from 80 to 90% of those that could be obtained from within-site selection. Some of this reduction is due to progeny X site interaction but the high sampling error of within-site estimates of family means must appreciably inflate within-site selection differentials. In general, the increased "reliability" of the selections seems well worth the apparent reduction in selection differential for combined selection (versus within-site selection).
The selection differentials over the 990 control for the 999 seed orchard lot (Table 9) were small and occasionally negative. There seems little doubt that these low estimates, which do not agree with those from other experiments (Shelbourne 1977 and unpubl.) involving other control seedlots, stem from the anomalously good performance of the 990 control seedlot. Recalculation of the selection differentials based on the progeny of 268-097 gave results more in line with those estimated in other experiments.
Prediction of actual genetic gains from a seed orchard expected from combined index selection involves predicting complex correlated responses for which a solution was not readily available. In evaluating gain predictions for various orchard strategies much depends, too, on the validity and precision of estimates of the base population mean (with 50 replicates precision is adequate but the genetic sample is suspect). Approximate predictions of genetic gain over the control seedlot 990 from an orchard of 36 clones re-selected with the combined index (Table 9) were made, ignoring correlated responses, as shown in Table 10. Predicted gains were generally larger at Kaingaroa and Waimihia because family mean herkabilities were higher there and because selection differentials were larger. The predicted gains were also calculated for an orchard of the same 36 clones based on improvement over the progeny means of

Shelbourne and Low — Multi-trait index selection 323
268-097. These gains were larger, normally over double those of the control lot 990, mainly because this lot performed much better than the progeny of 268-097.
The predicted gains over the 990 control are generally low relative to the selection differentials shown in Table 9 because of two factors: the absence of any real phenotypic selection gain of the 268 progenies overall (a small Si, in Table 10), combined with rather low repeatability of family means for some traits at some sites which drastically reduced the contribution of S2. Uncertainty of the value of these predicted gains emphasises the vital importance of having a suitable and well replicated base population seedlot in such experiments.
TABLE 10—Approximate predicted gains from clonal orchard of best 36 clones (from combined index)
Site Trait Gain % over 990
3.9 7.3
13.1 0.8
—0.2 7.9
17.8 2.9
13.5 10.4 9.8 3.9
40.2 37.3 5.8
21.1 29.1
Gain % over 288-097
2.9 24.7 31.6 2.2
32.4 10.9 21.6
—1.9 16.7 28.2 45.0 17.1 35.5 62.8 15.1 38.4 63.5
Otago Coast
Golden Downs
Woodhill
Kaingaroa Cpt 1350
Waimihia Cpt 767
Diameter Straightness Br. quality Malformation Diameter Straightness Br. quality Malformation Diameter Straightness Br. quality Diameter Straightness Br. quality Diameter Straightness Br. quality
S, X 2 + S2 X 2 X h2-
Based on: Gain % 990 Mean
where: Si s2 h2-
— Mean of 205 "268" families = Mean of best 36 families -
— mean of 990 and 268-097 mean of all "268"
(as defined — Equation 3) = er2
cr2f + cr2
rf + cr2w
~~5~ "n7" where n' is hormonic mean no. of trees/family
CONCLUSIONS
Precision of individual family mean estimates at each site is relatively low, and although GE interaction evidently exists it did not appear strong enough or with a sufficiently pronounced regional pattern to warrant development of regional breeding programmes from these results. Accordingly a single group of generally superior clones has been selected for use in new seed orchards.

324 New Zealand Journal of Forestry Science Vol. 10 No. 2 (1980)
2. A combined index using data from 5 sites and a total of 17 site-traits (Burdon 1979) was used to select the best 36 families. The combined index method was given extensive empirical testing and provided a convenient optimal means of combining information from different experiments without the need to do analyses over all sites, conjointly.
3. The "268" families from ortets selected mainly in the high-site index Tarawera scoria sites in the Northern Boundary region of Kaingaroa proved to be an adaptable group. They were generally superior on all sites to families from ortets selected at Ashley, Berwick, and other parts of Canterbury and Southland, and on average were slightly superior even to seed from the Kaingaroa seed orchard of "850" clones. They appear to be a suitable group from which to reselect clones for use in most parts of New Zealand and from which to select second generation trees.
4. The 990 control seedlot performed about as well as the average of the "268" progenies and about the same as the Kaingaroa orchard seedlot 999, and as such is believed to be anomalous. The progeny of 268-097 was used as an alternative basis for approximate predictions of gain from an orchard of 36 clones and is believed to more closely resemble an unimproved seedlot. Predicted gains were lower, especially for straightness and branch quality, at Otago Coast, Golden Downs, and Woodhill, than at Kaingaroa and Waimihia.
ACKNOWLEDGMENTS Establishment, maintenance, and assessment of these trials was carried out by members
of the Genetics and Tree Improvement Group at the Forest Research Institute, with help from local forest staff, particularly woodsmen trainees, too numerous to mention individually. The amount of field work involved can be judged from the 105 000 trees that were individually planted, measured, and scored.
The thoughtful and detailed reviews of an early draft of the paper by R. D. Burdon and M. D. Wilcox are gratefully acknowledged.
REFERENCES BURDON, R. D. 1979: Generalisation of multi-trait selection indices using information from
several sites. New Zealand Journal of Forestry Science 9(2): 145-52. CUNNINGHAM, E. P. 1972: Theory and application of statistical selection methods. Pp. 1-38,
Xivth British Poultry Breeders Round Table, Birmingham. SCHUTZ, W. M.; COCKERHAM, C. C. 1966: The effects of field blocking on gain from
selection. Biometrics 22(4): 843-63. SHELBOURNE, C. J. A. 1977: Genetic gains in 7-year-old Pinus radiata from seed orchard
and control pollinated progenies. Plant Breeding papers. SABRAO Congress, Canberra. February, 1977.