multi-criteria decision analysis to identify dryland ecosystem … · multi-criteria decision...
TRANSCRIPT

Ecosystem Services 17 (2016) 142–151
Contents lists available at ScienceDirect
Ecosystem Services
http://d2212-04
n CorrE-m
L.StringM.DallimMark.ReMulalek
journal homepage: www.elsevier.com/locate/ecoser
Multi-Criteria Decision Analysis to identify dryland ecosystem servicetrade-offs under different rangeland land uses
Favretto N.a,n, Stringer L.C.b, Dougill A.J.b, Dallimer M.b, Perkins J.S.c, Reed M.S.d,Atlhopheng J.R.c, Mulale K.c
a United Nations University-Institute for Water, Environment and Health (UNU-INWEH), 175 Longwood Road South, Suite 204, Hamilton, L8P 0A1 Ontario,Canadab Sustainability Research Institute, School of Earth and Environment, University of Leeds, Woodhouse Lane, Leeds, LS2 9JT, United Kingdomc Department of Environmental Science, University of Botswana, Private Bag 002, Gaborone, Botswanad Knowledge Exchange Research Centre of Excellence, Birmingham School of the Built Environment, Birmingham City University, City Centre Campus, Mil-lennium Point, Curzon Street, Birmingham, B4 7XG, United Kingdom
a r t i c l e i n f o
Article history:Received 29 October 2014Received in revised form30 November 2015Accepted 17 December 2015Available online 30 December 2015
Keywords:Sustainable land managementLand degradationKalahariSouthern AfricaMulti-Criteria Decision Analysis
x.doi.org/10.1016/j.ecoser.2015.12.00516/& 2016 The Authors. Published by Elsevier
esponding author.ail addresses: [email protected] (N. [email protected] (L.C. Stringer), A.J.Dougill@[email protected] (M. Dallimer), [email protected] (M.S. Reed), MAtlhophe@[email protected] (K. Mulale).
a b s t r a c t
Land degradation undermines ecosystem service provision, limiting economic returns from semi-aridrangelands. We apply a Multi-Criteria Decision Analysis (MCDA) to assess the value of ecosystem ser-vices, using monetary and non-monetary techniques in semi-arid rangelands in Kgalagadi District,southern Botswana. In doing so, we provide an empirical understanding of the linkages between policy,land use and the provision of ecosystem services based on the perspectives of local stakeholders iden-tified through interviews and a workshop consultation. Findings suggest communal grazing provides thewidest range of monetary and non-monetary values linked to ecosystem service delivery. Current eco-nomic incentives and policy initiatives supporting the livestock sector, linked to fencing and boreholedrilling, create perverse incentives that over-emphasise commercial food production at the expense ofother services. We identify a need for policy reforms to support livelihood diversification through theprovision of a wider range of ecosystem services, and for further research to explore market opportu-nities for veld products and carbon trading. We show that MCDA offers a useful holistic assessmentframework that could be applied more widely to semi-arid rangelands globally.& 2016 The Authors. Published by Elsevier B.V. This is an open access article under the CC BY-NC-ND
license (http://creativecommons.org/licenses/by-nc-nd/4.0/).
1. Introduction
Land degradation is driven by a variety of socio-economic,political and environmental factors, and undermines a range ofecosystem services (ES) for billions of people who depend on thenatural resource base for their livelihoods and subsistence (Foleyet al., 2005). The United Nations Convention to Combat Desertifi-cation (UNCCD) provides an important international policy fra-mework for countries to tackle land degradation. At the nationallevel, parties to the UNCCD develop National Action Programmes(NAPs) to outline the national status of land degradation, andprovide a Sustainable Land Management (SLM) strategy to addressthe problem (Stringer et al., 2007). SLM refers to practices throughwhich land users can meet their needs and derive socio-economic
B.V. This is an open access article u
retto),s.ac.uk (A.J. Dougill),[email protected] (J.S. Perkins),i.ub.bw (J.R. Atlhopheng),
benefits from the land, while simultaneously ensuring long-termproductive potential and maintenance of the land's environmentalfunctions (WOCAT, 2010). In addition to NAPs, countries developsector-specific policies that treat land degradation as a cross-cut-ting issue. This cross-cutting nature demands the integrated as-sessment of different kinds of land uses and management, andinformation that can help policy makers to prioritise actions toenhance ES delivery (and/or avoid ES losses), and promote SLMwithin decision making (Akhtar-Schuster et al., 2011). In turn, thisrequires integrated, holistic methodologies that bring togethersocio-economic, environmental and policy dimensions (Batemanet al., 2013; Costanza et al., 2014).
Various analytical frameworks can quantify and value ES, pro-viding useful information for the public and policymakers (e.g. TEEB,2010). For example, the monetary value of ES can be conceptualisedas the way in which they contribute to different elements of the‘Total Economic Value’. ES may increase an individual's welfarethrough direct provision of goods (e.g., food or recreational use), orindirectly through e.g. the regulation of water and carbon cycles(TEEB, 2010). People also value ES for their non-use (also termed“passive-use”) benefits. However, these conventional monetary
nder the CC BY-NC-ND license (http://creativecommons.org/licenses/by-nc-nd/4.0/).

N. Favretto et al. / Ecosystem Services 17 (2016) 142–151 143
valuation approaches do not capture shared values, which peoplehold for others and the communities and society in which they live(Kenter et al., 2014). This presents the need to integrate these variousdimensions through mixed-method approaches that combine de-liberative-based techniques, where varied stakeholders’ perspectivesare brought together. Fish et al. (2011) identify Multi-Criteria Deci-sion Analysis (MCDA) as an effective decision making tool to evaluatethe non-monetary and monetary costs and benefits of differentmanagement options. MCDA offers a useful integrative approach thatalso allows cultural and shared values related to ES to be assessed ina systematic way based on key socio-economic, policy and environ-mental priorities (Kenter et al., 2014).
Following the de Groot et al. (2010) ES classification, in thispaper we present an analytical framework using MCDA to identifythe multiple monetary and non-monetary dimensions of land useand management in southern Kgalagadi District, Botswana. Weidentify, value and score ES benefits from four types of landmanagement: (i) private (fenced) cattle ranching, (ii) (unfenced)communal livestock grazing, (iii) (private) game farming and (iv)Wildlife Management Areas (WMAs). We then discuss the costsand trade-offs associated with ES delivery under each of theseoptions. Our approach provides decision makers with a valuableanalytical example that can be used to better understand ES pro-vision across semi-arid rangelands, while findings can be used toinform measures that could reduce degradation of particular ESand advance SLM.
2. Materials and methods
2.1. Study area
Data were collected during 2013–2014 along an east–westtransect of the southern part of Kgalagadi District, Botswana(Fig. 1), incorporating a total area of c. 66,000 km2 (Government ofBotswana (GoB), 2003) and an estimated human population of
Fig. 1. Land use of Kgalagadi District, southern Botswana
30,000 (GoB, 2012a). Rangeland degradation has led to extensivebush encroachment (Thomas and Twyman, 2004); reducing goodquality grazing and increasing rural poverty levels (Chanda et al.,2003). Land uses include communal grazing areas (unfenced cattleposts) (c. 14,800 km2), privately owned (fenced) cattle ranches (c.8,900 km2), private game ranches (c. 800 km2) and WildlifeManagement Areas (WMAs) (c. 14,800 km2) designated as pro-tected conservation areas around the National Parks (KgalagadiTransfrontier Park, c. 26,700 km2).
2.2. Methods
We use MCDA as a framework that allows monetary-basedtechniques to be integrated with non-monetary ecological andshared values (de Groot et al., 2010; Kenter et al., 2014). This al-lows us to rank alternative options by quantifying, scoring andweighting a range of quantitative and qualitative criteria (Fontanaet al., 2013). Scoring was undertaken by the project team (com-posed of national and international researchers with expertise inland policy, livelihoods, ES valuation, land degradation assessment,range ecology, geomorphology and environmental economics).Weighting was undertaken in consultation with stakeholders fromthe government and NGOs.
2.2.1. Problem definitionThe research problem was defined as: “Which land uses and
land management strategies are best placed to generate the widestrange of economic and non-economic values linked to specific ESdelivered in Kalahari rangelands in southern Kgalagadi District,Botswana?”.
2.2.2. Identification of options, criteria definition and assessmentFour land uses which include all the key land uses in the study
area were defined as MCDA options: (i) communal livestockgrazing; (ii) private cattle ranches; (iii) private game ranches; (iv)WMAs. Performance of the options was measured by their
and study sites Source: adapted from KGLB (2013).
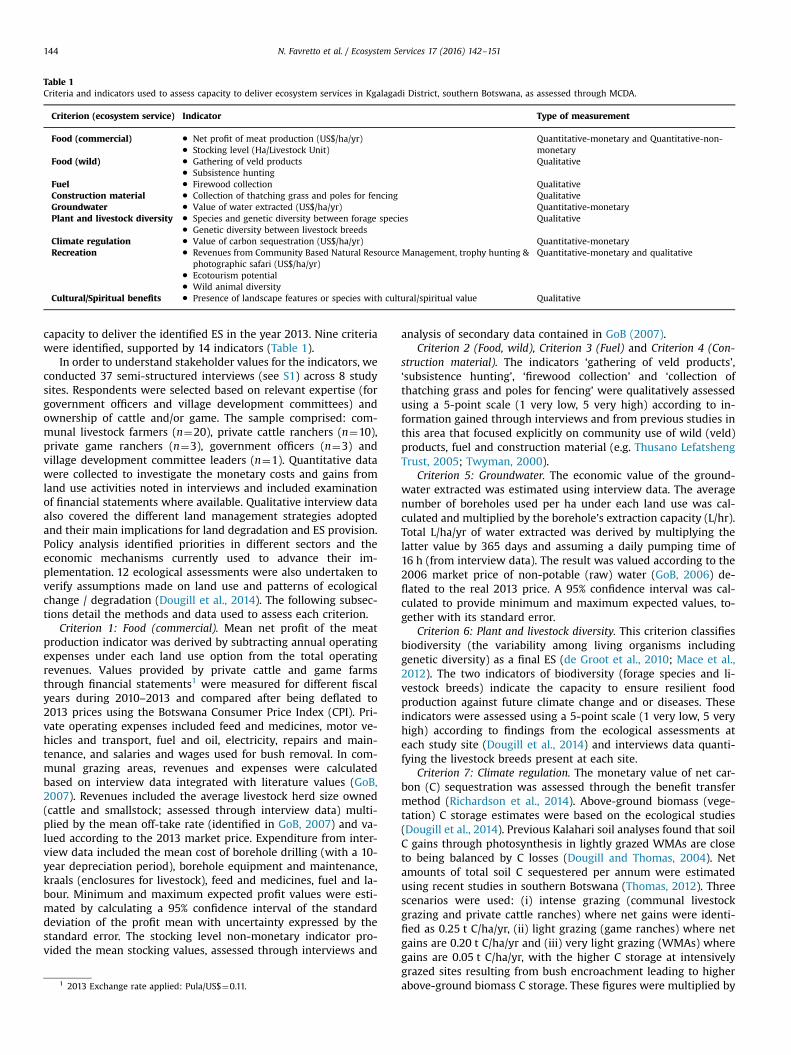
Table 1Criteria and indicators used to assess capacity to deliver ecosystem services in Kgalagadi District, southern Botswana, as assessed through MCDA.
Criterion (ecosystem service) Indicator Type of measurement
Food (commercial) � Net profit of meat production (US$/ha/yr)� Stocking level (Ha/Livestock Unit)
Quantitative-monetary and Quantitative-non-monetary
Food (wild) � Gathering of veld products� Subsistence hunting
Qualitative
Fuel � Firewood collection QualitativeConstruction material � Collection of thatching grass and poles for fencing QualitativeGroundwater � Value of water extracted (US$/ha/yr) Quantitative-monetaryPlant and livestock diversity � Species and genetic diversity between forage species
� Genetic diversity between livestock breedsQualitative
Climate regulation � Value of carbon sequestration (US$/ha/yr) Quantitative-monetaryRecreation � Revenues from Community Based Natural Resource Management, trophy hunting &
photographic safari (US$/ha/yr)� Ecotourism potential� Wild animal diversity
Quantitative-monetary and qualitative
Cultural/Spiritual benefits � Presence of landscape features or species with cultural/spiritual value Qualitative
N. Favretto et al. / Ecosystem Services 17 (2016) 142–151144
capacity to deliver the identified ES in the year 2013. Nine criteriawere identified, supported by 14 indicators (Table 1).
In order to understand stakeholder values for the indicators, weconducted 37 semi-structured interviews (see S1) across 8 studysites. Respondents were selected based on relevant expertise (forgovernment officers and village development committees) andownership of cattle and/or game. The sample comprised: com-munal livestock farmers (n¼20), private cattle ranchers (n¼10),private game ranchers (n¼3), government officers (n¼3) andvillage development committee leaders (n¼1). Quantitative datawere collected to investigate the monetary costs and gains fromland use activities noted in interviews and included examinationof financial statements where available. Qualitative interview dataalso covered the different land management strategies adoptedand their main implications for land degradation and ES provision.Policy analysis identified priorities in different sectors and theeconomic mechanisms currently used to advance their im-plementation. 12 ecological assessments were also undertaken toverify assumptions made on land use and patterns of ecologicalchange / degradation (Dougill et al., 2014). The following subsec-tions detail the methods and data used to assess each criterion.
Criterion 1: Food (commercial). Mean net profit of the meatproduction indicator was derived by subtracting annual operatingexpenses under each land use option from the total operatingrevenues. Values provided by private cattle and game farmsthrough financial statements1 were measured for different fiscalyears during 2010–2013 and compared after being deflated to2013 prices using the Botswana Consumer Price Index (CPI). Pri-vate operating expenses included feed and medicines, motor ve-hicles and transport, fuel and oil, electricity, repairs and main-tenance, and salaries and wages used for bush removal. In com-munal grazing areas, revenues and expenses were calculatedbased on interview data integrated with literature values (GoB,2007). Revenues included the average livestock herd size owned(cattle and smallstock; assessed through interview data) multi-plied by the mean off-take rate (identified in GoB, 2007) and va-lued according to the 2013 market price. Expenditure from inter-view data included the mean cost of borehole drilling (with a 10-year depreciation period), borehole equipment and maintenance,kraals (enclosures for livestock), feed and medicines, fuel and la-bour. Minimum and maximum expected profit values were esti-mated by calculating a 95% confidence interval of the standarddeviation of the profit mean with uncertainty expressed by thestandard error. The stocking level non-monetary indicator pro-vided the mean stocking values, assessed through interviews and
1 2013 Exchange rate applied: Pula/US$¼0.11.
analysis of secondary data contained in GoB (2007).Criterion 2 (Food, wild), Criterion 3 (Fuel) and Criterion 4 (Con-
struction material). The indicators ‘gathering of veld products’,‘subsistence hunting’, ‘firewood collection’ and ‘collection ofthatching grass and poles for fencing’ were qualitatively assessedusing a 5-point scale (1 very low, 5 very high) according to in-formation gained through interviews and from previous studies inthis area that focused explicitly on community use of wild (veld)products, fuel and construction material (e.g. Thusano LefatshengTrust, 2005; Twyman, 2000).
Criterion 5: Groundwater. The economic value of the ground-water extracted was estimated using interview data. The averagenumber of boreholes used per ha under each land use was cal-culated and multiplied by the borehole’s extraction capacity (L/hr).Total L/ha/yr of water extracted was derived by multiplying thelatter value by 365 days and assuming a daily pumping time of16 h (from interview data). The result was valued according to the2006 market price of non-potable (raw) water (GoB, 2006) de-flated to the real 2013 price. A 95% confidence interval was cal-culated to provide minimum and maximum expected values, to-gether with its standard error.
Criterion 6: Plant and livestock diversity. This criterion classifiesbiodiversity (the variability among living organisms includinggenetic diversity) as a final ES (de Groot et al., 2010; Mace et al.,2012). The two indicators of biodiversity (forage species and li-vestock breeds) indicate the capacity to ensure resilient foodproduction against future climate change and or diseases. Theseindicators were assessed using a 5-point scale (1 very low, 5 veryhigh) according to findings from the ecological assessments ateach study site (Dougill et al., 2014) and interviews data quanti-fying the livestock breeds present at each site.
Criterion 7: Climate regulation. The monetary value of net car-bon (C) sequestration was assessed through the benefit transfermethod (Richardson et al., 2014). Above-ground biomass (vege-tation) C storage estimates were based on the ecological studies(Dougill et al., 2014). Previous Kalahari soil analyses found that soilC gains through photosynthesis in lightly grazed WMAs are closeto being balanced by C losses (Dougill and Thomas, 2004). Netamounts of total soil C sequestered per annum were estimatedusing recent studies in southern Botswana (Thomas, 2012). Threescenarios were used: (i) intense grazing (communal livestockgrazing and private cattle ranches) where net gains were identi-fied as 0.25 t C/ha/yr, (ii) light grazing (game ranches) where netgains are 0.20 t C/ha/yr and (iii) very light grazing (WMAs) wheregains are 0.05 t C/ha/yr, with the higher C storage at intensivelygrazed sites resulting from bush encroachment leading to higherabove-ground biomass C storage. These figures were multiplied by
N. Favretto et al. / Ecosystem Services 17 (2016) 142–151 145
the total land surface under each use and valued according to the2013 C price set in the European Union Emissions TradingScheme (EU ETS) (US $6.7/t).
Criterion 8: Recreation. Revenues from Community-Based Nat-ural Resource Management (CBNRM) gained through trophyhunting and/or photographic safaris for the controlled huntingarea in the WMA were assessed by examining the 2006 huntingagreement provided by the Khawa Kopanelo Development Trust.These values validate the CBNRM estimates from another studybased in southern Botswana (Madzwamuse et al., 2007). Real 2013prices were calculated using the Botswana CPI. The ecotourismpotential indicator was assessed using a 5-point scale in inter-views, and the WMA land use management plan and a local de-velopment plan designed by a private safari operator. Wild animaldiversity was assessed using a 5-point scale developed by usingthe 2012 Aerial Census of Animals in Botswana (GoB, 2012b) thatmaps the spatial distribution of the main 26 wild animal species.
Criterion 9. Cultural/Spiritual benefits. The same qualitativemethods for assessing the indicator ‘presence of landscape fea-tures or species with spiritual value’ were used as for criteria 2,3 and 4 using previous studies from Arntzen et al. (2010) andMadzwamuse et al. (2007).
2.2.3. Criteria weightingEach criterion was weighted to reflect its relative importance to
society for the final ranking. Weights were assigned using a directweighting system based on the ranking technique (Hokkanen andSalminen, 1994; Hokkanen et al., 1995), with scores obtained in anational policy workshop held in 2014. Attendees at this workshopwere secured via 28 invitations sent to national and regional expertson land degradation. Fifteen stakeholders attended, and their in-dividual ranking for the criteria weights was gathered through aquestionnaire, yielding a similar number of responses to those inother studies (e.g. Fontana et al., 2013; Hajkowicz et al., 2000).Stakeholders were from several sectors affected by land degradation,including agriculture and water (n¼6), wildlife and forestry (n¼6),as well as the cross-cutting sectors of statistics (n¼2) and energy(n¼1). Rankings were obtained on a 9-point scale ranging frommost important (9) to least important (1) criteria. The ordinal in-formation was used to derive cardinal weights needed for the MCDAusing the rank summethod (Barron and Barret 1996). The geometricmean was used to aggregate the individual priorities of each sta-keholder into a single representative weight for the entire group(Fontana et al., 2013). Although ordinal ranking does not necessarilyreflect the exact importance of criteria for stakeholders (Hokkanenet al., 1995), time and resource constraints motivated our decision touse direct ranking rather than the commonly used pair-wise com-parisons. Indeed, direct ranking allows a simpler representation ofthe relative importance of the criteria involved (Rogers and Bruen,1998) and is often preferred by decision makers (Hajkowicz et al.,2000). Additionally, Hokkanen and Salminen (1994) tested an al-ternative method which weighted the criteria according to stake-holders’ perceptions of how many times each criterion was moreimportant than others, finding discrepancies between the two ap-proaches to be minimal. Our approach is therefore robust, some-thing which we tested through sensitivity analysis (see Section 3).
2.2.4. Derivation of overall preference scores for each land use optionQuantitative and qualitative criteria were scored on a homo-
geneous 100-point scale. A score of 0 represented the worst levelof performance encountered, and 100 the best (as per UK Gov-ernment (GoUK), 2009). End points were established based on thecriteria assessment. A linear value function translated the 100-point performance scale of each criterion (j) into a MCDA criterionscore (0-100). For each land use option (i), each criterion score (sij)was multiplied by the criterion's weight (wj). The land use options’
overall preference score (Si) was derived by summing these pro-ducts for all the criteria (n) under each land use option (Eq. 1).
∑=( )=
Si wjsij1j
n
1
3. Results
Table 2 shows the performance of each criterion under thedifferent land use options, alongside the type of valuation and datacollection method(s) used to inform the MCDA.
Table 3 details the weights attributed to each criterion. Nor-malised values indicate groundwater ranks highest, followed bycommercial food production, plant and livestock diversity, wildfood, fuel and construction material. Climate regulation, recreationand spiritual inspiration were ranked lowest.
Final scores (quantitative and qualitative criteria ranked on a100-point scale) are outlined in Table 4. Weighted values (singleland use options’ scores multiplied by normalised criterionweight) are in brackets.
Performance of each land use regarding its capacity to deliver therange of ES under consideration is summarised in Fig. 2. Communallivestock grazing provides the greatest benefit to society, achievingthe highest MCDA score, followed by private cattle ranches, WMAsand private game ranches. High scores for communal grazing areasare mainly linked to their use for commercial food production, withmanagement practices allowing wild food production, fuelwood col-lection, construction material provision, climate regulation and cul-tural/spiritual non-use values to be retained.
We recognise that our results have been derived from a singleset of scoring and weighting of the criteria. It is therefore plausiblethat a different set of scores/weights would have led us to otherconclusions. To increase confidence in our results, a deterministicsensitivity analysis was carried out. Through several iterations,different weightings and scores were applied to assess possibledeviations in the final MCDA ranking against results in Fig. 2(Broekhuizen et al., 2015). Iterations included doubling theweighting of one or multiple criteria at the same time under dif-ferent scenarios, and also doubling or halving the MCDA score ofmultiple options (i.e. commercial food, wild food, constructionmaterial, climate regulation, recreation and cultural/spiritualbenefits) (Fig. 3). This approach is intuitive and easily applicable toboth uncertainty in performance scores and criteria weights(Broekhuizen et al., 2015).
Results indicated insensitivity of the highest and lowest resultsin the ranking (i.e. communal grazing was always ranked first andthe private game ranch option last). Rankings of private cattleranches and WMAs changed position when some of the differentweights were tested (Figs. 3.b,.c, .e and .f). When scoring of dif-ferent options was tested (Fig. 3.f), the intermediate MCDA rankingdid change. This suggests that if a broader panel of individuals wasinterviewed the main results would not change, but changes in theintermediate options may occur. The same sensitivity tests werecarried out on an alternative set of weighted scores, where thecriteria weights were elicited through policy and discourse ana-lysis rather than stakeholder ranking (see S2). By testing possiblechanges in the results when an alternative set of stakeholders’preferences is used, similar results were obtained.
4. Discussion
The MCDA shows that Kalahari communal rangelands are im-portant for a broader range of ES than simply commercial food

Table 2Criteria performance for four land use types in Kgalagadi District, southern Botswana, as assessed through the MCDA.
Criterion (ecosystemservice)
Indicator / ES category (de Grootet al., 2010)
Communal live-stock grazing
Private cattleranches
Private gameranches
WMAs Valuation/collection meth-ods used to inform theMCDA
Provisioning servicesFood (commercial) Net profit of meat production (US
$/ha/yr)Mean: 0.64 Mean: 1.21 Mean: �2.07 0 Interviews & market prices(�0.56; 1.95)a (0.66; 1.75)a (�7.89; 3.75)a
(0.64)b (0.16)b (1.33)b (0.0)b
Stocking level (Ha/LSU) Mean: 11 Mean: 14 Mean: 9.5 Mean: 160 Interviews & literature(9; 13) (8; 20) (7; 12) (120; 200)
Food (wild) Gathering of veld products High Low Low Medium Interviews & literatureSubsistence hunting High Very low Very low Very high Interviews & literature
Fuel Firewood collection Very high Medium Medium High Interviews & literatureConstruction material Collection of thatching grass and
poles for fencingVery high Medium Low High Interviews & literature
Groundwater Value of water extracted (US$/ha/yr) Mean: 0.84 Mean: 0.97 0.15 0 Interviews & market prices(0.63; 1.05)a (0.22; 1.71)a
(0.21)b (0.37)b (0)b (0)b
Plant and livestockdiversity
Species and genetic diversity be-tween forage species
Low Medium High Very high Ecological assessments
Genetic diversity between livestockbreeds
Low High Very low Low Interviews
Regulating servicesClimate regulation Value of carbon sequestration (US
$/ha/yr)1.7 1.7 1.3 0.3 Benefit transfer & market
pricesCultural services
Recreation Revenues from CBNRM trophyhunting and photographic safari (US$/ha/yr)
0 0 0 0.04 Interviews
Ecotourism potential Low Very low High Very high InterviewsWild animals diversity Medium Very low Very high Very high Literature
Cultural/Spiritualbenefits
Presence of landscape features orspecies with cultural/spiritualbenefits
Very high Very low Medium Very high Interviews
a 95% confidence interval of the standard deviation of the mean.b Standard error.
N. Favretto et al. / Ecosystem Services 17 (2016) 142–151146
production, but that the value of these other ES is currently un-derestimated. When non-marketed ES are weighted according totheir relative importance to other ES, communal grazing areasrank as the land use that generates the highest value (both inprovisioning and cultural terms), followed by WMAs. This in-dicates that the value of a land use is not only linked to theavailability of an ES, but also to its relative importance to society.The relative importance of ES assessed might vary for differentsocial groups, and as shown by the sensitivity analysis, this canchange the ranking of intermediate MCDA land use options. Ourapproach produces robust results (see sensitivity analysis, Section3) that allow for a meaningful discussion of the impacts on EStrade-offs of different land management strategies through asimplified representation of the stakeholders’ preferences on theimportance of the different criteria (see Section 2.2.3).
Table 3Criteria weighting based on the rating technique with inputs from policy stakeholders.
Criteria Ground water Fooda Plant & livestock diversity F
Mean weight (normalised) 0.18 0.17 0.15 0Mean weight (non-normalised) 7.6 7.0 6.2 4Standard deviation 1.2 1.8 1.3 1
Abbreviationsa commercial.b construction material.c climate regulation.d cultural/spiritual benefits.
4.1. Land management strategies and policy drivers: Impacts on EStrade-offs
Livestock production is the major land use, partly due to thestrong policy support (TGLP, 1975; NPAD, 1991) and subsidy schemesgranted to the livestock sector (e.g. Services to Livestock Owners inCommunal Areas (SLOCA), 2002, Livestock Water Development Pro-gramme (LWDP), 2002 and the Livestock Management and Infra-structure Development Programme (LIMID), 2007). National policieshave promoted fencing and land privatisation for livestock produc-tion, assuming that private ranches would adopt more sustainableand profitable land management practices through rotational grazingand reduced stocking levels. The literature suggests that per animalproductivity gains on fenced ranches are only slightly better thanthose on communal grazing areas (Hubbard, 1982); our MCDA
ood (wild) Fuel Constr. materialb Climate reg.c Recreation Spirituald Total
.12 0.11 0.10 0.08 0.06 0.03 1.0
.9 4.4 4.1 3.3 2.6 1.4 -
.5 1.6 1.4 1.9 1.8 1.8 -

Table 4Final scoring of the MCDA (scale 0–100) (weighted values, representing single land use options’ scores multiplied by normalised criterion weight, in brackets).
Criterion Indicator / ES category Communal livestockgrazing
Private cattleranches
Private gameranches
WMAs
ProvisioningFood (commercial) Net profit of meat production 73 (12) 78 (13) 50 (9) 68 (12)
Stocking level 98 (17) 96 (16) 99 (17) 20 (3)Mean 86 (15) 87 (15) 75 (13) 44 (7)
Food (wild) Gathering of veld products 75 (9) 25 (3) 25 (3) 50 (6)Subsistence hunting 75 (9) 0 (0) 0 (0) 75 (9)
Mean 75 (9) 13 (2) 13 (2) 63 (8)Fuel Firewood collection 100 (11) 50 (6) 50 (6) 75 (8)Construction material Collection of thatching grass and poles for fencing 100 (10) 50 (5) 25 (3) 75 (8)Groundwater Value of water extracted 49 (9) 57 (10) 9 (2) 0 (0)Plant & livestock diversity Species and genetic diversity between forage
species25 (4) 50 (8) 75 (11) 100 (15)
Genetic diversity between livestock breeds 25 (4) 75 (11) 0 (0) 25 (4)Mean 25 (4) 63 (9) 38 (6) 63 (9)
RegulatingClimate regulation Value of carbon sequestration 68 (5) 68 (5) 52 (4) 12 (1)
CulturalRecreation Revenues from CBNRM trophy hunting and pho-
tographic safari0 (0) 0 (0) 0 (0) 44 (3)
Ecotourism potential 25 (2) 0 (0) 75 (5) 100 (6)Wild animals diversity 50 (3) 0 (0) 100 (6) 100 (6)
Mean 25 (2) 0 (0) 58 (4) 81 (5)Cultural/ Spiritual inspiration Presence of landscape features or species with
spiritual value100 (3) 0 (0) 50 (2) 100 (3)
TOTAL (weighted) (67) (52) (39) (49)
0
10
20
30
40
50
60
70
80
Communallivestock grazing
Private ca�leranches
Private gameranches
WMAs
Tota
l (w
eigh
ted)
val
ue o
f ES
Type of land use
Cultural/Spiritual benefits
Recrea�on
Climate regula�on
Plant and livestock diversity
Construc�on material
Fuel
Groundwater
Food (wild)
Food (commercial)
Fig. 2. Weighted performance of ecosystem service delivery under four alternativeland uses in Kgalagadi District, southern Botswana, as assessed through the MCDA.
N. Favretto et al. / Ecosystem Services 17 (2016) 142–151 147
findings support this assertion (Table 2).Commercial food production is a complementary ES to plant
and livestock diversity (Mace et al., 2012). Diversity of foragespecies (Scherf et al., 2008) and livestock breeds (Notter, 1999) isvital for the nutritional status of cattle and to ensure their resi-lience, particularly during drought. The highest MCDA scores un-der the plant and livestock diversity criterion were achieved byprivate cattle ranches and WMAs as opposed to private gameranches and communal grazing areas. In the WMAs, limited de-gradation is found and nutritious forage species are preserved(Dougill et al., 2014). Private cattle ranches support SLM by im-plementing management strategies that aim to conserve grazingresources: “Since we increased the resting period across paddocks to90 days, the land condition has drastically improved and we haveplenty of grass…new perennial grasses are growing such as Bra-chiaria nigropedata, Digitaria eriantha and Schmidtia pappophor-oides”, (interview data, private cattle ranch, Werda, 2013). Despitethese practices, ecological assessments show that privately-ownedcattle ranches are just as heavily bush-encroached as communal
grazing areas (Dougill et al., 2014).SLM practices are supported on private ranches by sizeable
investments to remove encroaching bushes to increase the grazingsurface and enhance grass quality. Costs reach US $22.9/hathrough selective hand spraying or US $36.6/ha through aerialspraying. Few farmers can afford such investments, despite en-couraging results: “Some people do not de-bush as they have nomoney. I am borrowing [the money used for treatment]… removingbushes pays back shortly” (interview data, private cattle ranch,Werda, 2013). Practices such as bush removal can enhance provi-sioning ES through improved cattle production resulting frombetter forage, but this reduces the carbon stored in above-groundbiomass. Sizeable investments also allow the management ofmixed cattle breeds in private ranches. Mixed breeding is lesscommon in communal areas due to a lack of fences: “We are notable to keep specific breeds other than Tswana because our cattleare mixed with the ones owned by other farmers” (interview data,communal farmer, Werda, 2013).
Freshwater is scarce and groundwater extracted thro-ugh boreholes is often highly saline, so while Table 2 suggestsgroundwater extraction has the second highest economic value,the figures need to be interpreted cautiously. Extraction throughborehole technology is expensive, and drilling investments trans-late into an economic loss when the water found is unusable, dueto excessive salinity or because the quantity is small: “In 2011 wedrilled 5 boreholes, but 2 have too salty water and 3 are empty”(interview data, communal farmer, Khawa, 2013). Interview dataindicate that on average a single private cattle rancher uses5 boreholes with a mean extraction capacity of 4,400 L/h while acommunal farmer uses 2 boreholes (of which 1 commonly belongsto a syndicate) with a mean extraction capacity of 2,500 L/h.Pumping time ranges from 9 h/day to 24 h/day for both communaland private users, despite government recommendations that foradequate groundwater recharge, pumping should not exceed 8 h/day. Water extraction costs for livestock in communal areas havebeen subsidised through various programmes (e.g. LIMID, LWDPand SLOCA). Subsidies cover up to 60% of the borehole drillingcosts (GoB, 2013), allowing a positive MCDA score for this land use.

a. Weighting of plant and livestock diversity doubled (MCDA ranking unchanged)
b. Weighting of recreation doubled (WMAs and private cattle ranches changed position)
c. Weighting of ground water halved (WMAs and private cattle ranches changed position)
d. Weighting of cultural/spiritual benefits doubled (WMAs and private cattle ranches achieve an equal MCDA score)
e. Weighting of wild food doubled (WMAs and private cattle ranches changed position)
f. Scoring of multiple options changed: halved under commercial foodand climate regulation, and doubled under wild food, construction material, recreation and cultural/spiritual benefits (WMAs and private cattle ranches changed position)
0
10
20
30
40
50
60
70
80
Communallivestockgrazing
Privatecattle
ranches
Privategame
ranches
WMAs
Cultural/Spiritual benefits
Recreation
Climate regulation
Plant and livestockdiversity
Construction material
Fuel
Groundwater
Food (wild)
Food (commercial)0
10
20
30
40
50
60
70
80
Communallivestockgrazing
Privatecattle
ranches
Privategame
ranches
WMAs
Cultural/Spiritualbenefits
Recreation
Climate regulation
Plant and livestockdiversity
Construction material
Fuel
Groundwater
Food (wild)
Food (commercial)
0
10
20
30
40
50
60
70
Communallivestockgrazing
Privatecattle
ranches
Privategame
ranches
WMAs
Cultural/SpiritualbenefitsRecreation
Climate regulation
Plant and livestockdiversityConstruction material
Fuel
Groundwater
Food (wild)
Food (commercial)0
10
20
30
40
50
60
70
80
Communallivestockgrazing
Privatecattle
ranches
Privategame
ranches
WMAs
Cultural/Spiritualbenefits
Recreation
Climate regulation
Plant and livestockdiversity
Constructionmaterial
Fuel
Groundwater
Food (wild)
Food (commercial)
0
10
20
30
40
50
60
70
80
Communallivestockgrazing
Privatecattle
ranches
Privategame
ranches
WMAs
Cultural/Spiritualbenefits
Recreation
Climate regulation
Plant and livestockdiversity
Construction material
Fuel
Groundwater
Food (wild)
Food (commercial)0
10
20
30
40
50
60
70
80
90
Communallivestockgrazing
Privatecattle
ranches
Privategame
ranches
WMAs
Cultural/Spiritual benefits
Recreation
Climate regulation
Plant and livestockdiversity
Construction material
Fuel
Groundwater
Food (wild)
Food (commercial)
Fig. 3. Sensitivity analysis of the MCDA ranking of four land uses in Kgalagadi District, southern Botswana, performed by applying varied MCDA scoring and weighting (XAxis ‘Type of land use’, Y Axis ‘Total (weighted) value of ES’).
N. Favretto et al. / Ecosystem Services 17 (2016) 142–151148

N. Favretto et al. / Ecosystem Services 17 (2016) 142–151 149
Important trade-offs between commercial food production(including groundwater extraction) and conservation of foragespecies diversity are observed in the MCDA: a high score for theformer is usually associated with a lower score for the latter.Policy-led expansion of boreholes across semi-arid communalrangelands has concentrated cattle around water points andmoved away from multi-species production systems and viableCBNRM projects. Fencing for commercial production and the ef-fective private status of individually owned (or syndicate owned)cattleposts, has greatly reduced the amount of communal grazingland (Perkins, 1996). Ecological assessments indicate this producesa noticeable retreat of grass cover as well as bush encroachmentup to at least 5 km from water points in communal grazing areas(Dougill et al., 2014).
Apart from livestock production, communal and WMA landuses are important sources of veld products. They provide sup-plementary (wild) food (and water), particularly in the dry seasonor during drought, and can also be used as medicines (e.g. Hoodiagordonii is used as an appetite suppressant and Devil's Claw(Harpagophytum procumbens) is an analgesic, sedative and anti-inflammatory) with commercial value. Trade-offs between cattlefarming and veld products are observed in the weighted MCDAscores. The economic value and availability of veld products havedeclined with the expansion of borehole drilling. Consequently,these products are found increasingly further from communalsettlements (Perkins et al., 2002). Villagers’ willingness to investtime in veld product collection is limited by the lack of a formalmarket, hampering generation of financial returns: “We do notharvest for sale because it is very difficult to sell these products…weonly consume them in the household” (interview data, communalfarmer, Khawa, 2013). Similar trade-offs are observed betweenpolicy-driven cattle production and use of construction material(thatching grass and poles for fencing) and fuel (firewood). Thesetwo ES rank higher under communal grazing and in WMAs,showing their importance in the management strategies adoptedunder these land uses. The supply of these ES is threatened bydegradation and privatisation, as with veld products.
Subsistence hunting plays a significant role in WMAs and theneighbouring communal grazing areas, contributing to the highestvalues achieved by these land uses under the criterion ‘wild foodproduction’. Hunting is regulated by licensing through the De-partment of Wildlife and National Parks (DWNP). Interviews in-dicate that strict government control (including a hunting banapplied since January 2014) discourages hunting: “There are toomany rules that constrain hunting” (interview data, communalfarmer, Khawa, 2013).
CBNRM approaches have been developed through the WildlifeConservation Policy of 1986 since the 1990 s and a CBNRM Policywas adopted in 2007. CBNRM charges local communities adjacentto WMAs with managing wildlife so that resource conservationand financial returns can be simultaneously promoted. Exclusiverights were granted over a wildlife quota. Communities coulddecide whether to hunt the quota for subsistence use or sell thequota rights to a private operator. CBNRM trophy hunting andphotographic safaris have generated tangible benefits to the WMAcommunity of Khawa. Our analysis reveals that these activitiesgenerate up to US $31,000 annually: “Hunting is our only source ofrevenue. It allows us to sustain our livelihoods” (interview data,communal farmer, Khawa, 2013). CBNRM approaches offer addi-tional opportunities to generate economic benefits through eco-tourism, where tourists are attracted by wildlife diversity andcultural experiences (e.g. guided visits and 4�4 driving).
CBNRM and natural resource use diversification remain con-strained by policy and market incentives in the livestock sector.Declining wildlife numbers and diversity are caused by the ex-pansion of livestock production and exacerbated by the promotion
of fencing which, together with veterinary cordon fences, haveblocked wildlife migration routes (Perkins, 1996). Policy incentiveswithin the livestock sector, alongside recent decisions on hunting,contrast with the WMAs’ wildlife conservation objective, limitingthe economic viability of CBNRM under this land use: “Wildlifenumbers are declining. The government took key animals-lions andleopards-out of the hunting quota for conservation purposes. Sincethen, the safari hunting business has not anymore been profitable,neither for the private operators or the community” (interview data,private safari operator, Werda, 2013).
The hunting ban and climatic constraints constrain CBNRMdevelopment. Low rainfall and high inter-annual variability (Mo-gotsi et al., 2013) exacerbate degradation observed as a result ofsuboptimal land management strategies: “The area is vulnerable todrought. When it rains the veld is fine even if we are overgrazed, butduring droughts many of our cattle die” (interview data, communalfarmer, Kokotsha, 2013). While climate change requires long-termapproaches so that rangeland users can adapt, the MCDA findingsshow that current policy fails to provide strong support thatguides livelihoods away from livestock production into alternativeactivities.
In addition to the provisioning and cultural services, the Kala-hari provides other values through climate regulation. Whether Csequestration can be profitable is questionable, due to low globalprices, uncertainty over markets and standards, and poorly de-veloped methodologies, particularly for monitoring, reporting andverification (Stringer et al., 2012). Care needs to be taken that in-creased woody biomass resulting from land degradation is notencouraged through carbon credit schemes. Other monetary ap-proaches could be used to extract economic benefits from C se-questration and biodiversity enhancement, e.g. through Paymentsfor Ecosystem Services (PES) initiatives. However, little evidence ofhow these schemes could work is available for rangeland systems(Dougill et al., 2012). Potential markets also may not exist for allES, e.g. the spiritual value of landscapes is difficult to be valuedeconomically. Future policy interventions will need to be placedwithin the cultural context of ES values, so that they create in-centives for land users to invest in rangeland resources, ratherthan misusing them (Ostrom et al., 1999).
4.2. Policy change for SLM
Southern Botswana's rangelands pose complex land manage-ment challenges when viewed through an ES lens, particularlywhen some ES are providing current economic benefits whereasothers are yet to be tapped. Policy and economic mechanisms areneeded so that the values assessed through MCDA can be trans-lated into concrete economic benefits. These might include es-tablishing a functioning market for ES that can generate im-mediate benefits through local commercialisation (i.e. wild food,construction material and fuel). However, our MCDA indicates thatpolicy measures should not only focus market establishment, butalso on promoting management practices that do not reduce ac-cess to the broader range of ES.
Declining opportunities for hunting and gathering are linked toreduced wildlife numbers and plant diversity losses resulting fromintensive cattle rearing. This, together with limited capability todevelop tourism and CBNRM activities, exacerbates poverty forrangeland users and results in higher dependency on governmentsupport and drought relief programmes. Well- intentioned pov-erty alleviation schemes that provided livestock to the poorest insociety have increased stocking rates (and degradation) aroundcommunal (village) water points, but reduced the biodiversityvalue of the system.
Key to maintaining wild animal biomass in the south-westernKalahari is to maintain mobility over large areas, with its
N. Favretto et al. / Ecosystem Services 17 (2016) 142–151150
conservation linked to the development of wildlife-based eco-nomic activities such as tourism. Policies that support boreholedrilling and fencing conflict with those needs and drought reliefinterventions address only short-term sector-specific needs. Theyfail to develop multi-species production systems and to createlonger term drought-resistant socio-economic structures (Jacques,1995). There is an urgent need to promote alternative land man-agement strategies that improve SLM and the community welfarethrough economic and livelihood diversification. To achieve thisrequires assessment of how different policies and incentives in-teract and conflict, such that a more enabling policy context can bedeveloped by promoting synergies. Successful outcomes (bothsocio-economic and environmental) depend not only on the typeof land use promoted by policy, but also on the range of man-agement strategies adopted under each land use, and the inter-actions between them.
5. Conclusions and ways forward for SLM
This paper applied MCDA to Kalahari rangelands of Botswana'ssouthern Kgalagadi District to assess the linkages between ran-geland land uses and the provision of ES. The study provides anempirical contribution to our understanding of which land usesand land management strategies are best placed to generate thewidest range of monetary and non-monetary values from specificES. While private land use enables higher incomes that can beinvested in SLM practices, our findings suggest that communalgrazing was identified as the most appropriate land use option forES provision, achieving the highest MCDA score.
Significant government support to the cattle sector throughborehole technology for groundwater extraction and throughfencing has increased cattle populations and degradation aroundwater points. Veld products, construction material and fuelwoodremain undervalued from an economic perspective due to the lackof markets. Creation of a market with commercial potential isneeded so that the provisioning values of these ES translate intowider economic benefits to society. However, perverse incentivesthat encourage overharvesting must be avoided when the com-mercial market is created.
Livestock production and wildlife areas could be more clearlyseparated by limiting borehole development within communalgrazing land use in areas in proximity to WMAs. This would in-crease livelihood diversification opportunities for the pooresthouseholds by increasing the opportunities derived from provi-sioning ES, and potentially rewarding cultural ES. Whether suchdiversification could include revenues from C trading remainsunclear and requires further investigation.
By integrating monetary with non-monetary valuation techni-ques, MCDA provides a mechanism for identifying the values ofstakeholders from a range of policy sectors, which in turn supportwider dryland populations who depend on ES. Policies that fail totake a holistic approach to valuing such services risk inadvertentlyexacerbating land degradation, resulting in unforeseen social andeconomic costs. In promoting SLM practices, future policies shouldgo beyond the profitability of commercial food production andconsider the broader livelihood impacts (the social distribution ofwealth and diversification), and the ecological implications of allthe ES analysed, including non-marketed provisioning servicesand cultural values. Such an approach better recognises that live-lihoods are not just about income generation but also are sup-ported by other social, cultural, environmental and physical assets.
Acknowledgements
This research was funded by the Economics of Land Degrada-tion Initiative, contract number 81163498, and carried out underresearch permit number EWT 8/36/4xxv(60) of the Government ofBotswana. We thank the staff of the Deutsche Gesellschaft fürInternationale Zusammenarbeit (GIZ), United Nations Conventionto Combat Desertification (UNCCD) and United Nations University(UNU) for their support, and particularly Emmanuelle Quillerou forher thoughtful comments on this paper.
Appendix A. Supplementary material
Supplementary data associated with this article can be found inthe online version at http://dx.doi.org/10.1016/j.ecoser.2015.12.005.
References
Akhtar-Schuster, M., Thomas, R.J., Stringer, L.C., Chasek, P., Seely, M., 2011. Im-proving the enabling environment to combat land degradation: Institutional,financial, legal and science-policy challenges and solutions. Land Degrad. Dev.22 (2), 299–312. http://dx.doi.org/10.1002/ldr.1058.
Arntzen, J., Barnes, J., Turpie, J., Ruthenberg, P., Setlhogile, P., 2010. The economicvalue of the MFMP area. In: Centre for Applied Research and Department ofEnvironmental Affairs. Makgadikgadi Framew. Manag. Plan. Volume 2 [online].Gaborone. [Accessed 01 April 2014]. Available from ⟨http://www.mewt.gov.bw/uploads/files/Final%20Chapter%202%20Value.pdf⟩.
Barron, F.H., Barrett, B.E., 1996. Decision Quality Using Ranked Attribute Weights.Manag. Sci. 42, 1515–1523. http://dx.doi.org/10.1287/mnsc.42.11.1515.
Bateman, I.J., Harwood, A.R., Mace, G.M., Watson, R.T., Abson, D.J., Andrews, B.,Binner, A., Crowe, A., Day, B.H., Dugdale, S., Fezzi, C., Foden, J., Hadley, D.,Haines-Young, R., Hulme, M., Kontoleon, A., Lovett, A., Munday, P., Pascual, U.,Paterson, J., Perino, G., Sen, A., Siriwardena, G., van Soest, D., Termansen, M.,2013. Bringing Ecosystem Services into Economic Decision-Making: Land Use inthe United Kingdom. Science 341 (6141), 45–50. http://dx.doi.org/10.1126/science.1234379.
Broekhuizen, H., Groothuis-Oudshoorn, C., van Til, J., Hummel, J., IJzerman, M., 2015.A Review and Classification of Approaches for Dealing with Uncertainty inMulti-Criteria Decision Analysis for Healthcare Decisions. Pharmacoecnbo-nomics 33 (5), 445–455. http://dx.doi.org/10.1007/s40273-014-0251-x.
Chanda, R., Totolo, O., Moleele, N., Setshogo, M., Mosweu, S., 2003. Prospects ofsubsistence livelihood and environmental sustainability along the Kalaharitransect: The case of Matsheng in Botswana's Kalahari rangelands. J. Arid. En-viron. 54 (2), 425–445. http://dx.doi.org/10.1006/jare.2002.1100.
Costanza, R., de Groot, R., Sutton, P., van der Ploeg, S., Anderson, S.J., Kubiszewski, I.,Farber, S., Turner, R.K., 2014. Changes in the global value of ecosystem services.Glob. Environ. Chang. 26, 152–158. http://dx.doi.org/10.1016/j.gloenvcha.2014.04.002.
de Groot, R.S., Fisher, B., Christie, M., Aronson, J., Braat, L., Haines-Young, R., Gowdy,J., Maltby, E., Neuville, A., Polasky, S., Portela, R., Ring, I., 2010. Integrating theecological and economic dimensions in biodiversity and ecosystem servicevaluation. In: TEEB. (Ed.), The Economics of Ecosystems and Biodiversity Eco-logical and Economic Foundations. Earthscan, London and Washington.
Dougill, A.J., Thomas, A.D., 2004. Kalahari Sand Soils: Spatial Heterogeneity, Bio-logical Soil Crusts and Land Degradation. Land Degrad. Dev. 15 (3), 233–242.http://dx.doi.org/10.1002/ldr.611.
Dougill, A.J., Perkins, J.S., Akanyang, L., Eckardt, F., Stringer, L.C., Favretto, N., Atl-hopheng, J. and Mulale, K. 2014. Land Use, Rangeland Degradation and EcosystemService Provision: New Analyses from southern Kalahari, Botswana. Leeds, UK:Report for the Economics of Land Degradation Initiative [online]. [Accessed4 April 2014]. Available from: ⟨http://www.see.leeds.ac.uk/research/sri/eld/⟩.
Dougill, A.J., Stringer, L.C., Leventon, J., Riddell, M., Rueff, H., Spracklen, D.V., Butt, E.,2012. Lessons from Community-based Payment for Ecosystem ServiceSchemes: From Forests to Rangelands. Philos. Trans. R Soc. B 367, 3178–3190.
Fish, R., Burgess, J., Chilvers, J., Footitt, A., Haines-Young, R., Russel, D., Turner, K.,Winter, D.M. 2011. Participatory and deliberative techniques to embed anecosystems approach into decision-making: Full technical report. London,Defra.
Foley, J.A., DeFries, R., Asner, G.P., Barford, C., Bonan, G., Carpenter, S.R., Chapin, F.S.,Coe, M.T., Daily, G.C., Gibbs, H.K., Helkowski, J.H., Holloway, T., Howard, E.A.,Kucharik, C.J., Monfreda, C., Patz, J.A., Prentice, C., Ramankutty, N., Snyder, P.K.,2005. Global Consequences of Land Use. Science 309 (5734), 570–579. http://dx.doi.org/10.1126/science.1111772.
Fontana, V., Radtke, A., Bossi Fedrigotti, V., Tappeinera, U., Tasserc, E., Zerbeb, S.,Buchholzd, T., 2013. Comparing land-use alternatives: Using the ecosystemservices concept to define a multi-criteria decision analysis. Ecol. Econ. 93,128–136. http://dx.doi.org/10.1016/j.ecolecon.2013.05.007.
N. Favretto et al. / Ecosystem Services 17 (2016) 142–151 151
GoB. 2003. Kgalagadi District Development Plan 6: 2003-2005 [online]. Gaborone:Ministry of Local Government. [Accessed 6 June 2014]. Available from: ⟨http://www.gov.bw/Global/MLG/Kgalagadi_DDP.pdf⟩.
GoB, 2006. Policy Brief on Botswana’s Water Management. Department of En-vironmental Affairs, Gaborone [Accessed 6 June 2014]. Available from ⟨http://www.mewt.gov.bw/uploads/files/DEA/water%20policy%20brief%20final.pdf⟩.
GoB. 2007. Natural Resource Accounting of Botswana’s Livestock Sector [online].Gaborone: Department of Environmental Affairs and Centre for Applied Re-search. [Accessed 6 June 2014]. Available from: ⟨http://www.mewt.gov.bw/uploads/files/natural_resource_accounting_of_bws_livestock_sector.pdf⟩.
GoB. 2012a. 2011 Botswana population and housing census [online]. Gaborone: Cen-tral Statistics Office. [Accessed 6 June 2014]. Available from: ⟨http://www.cso.gov.bw/⟩.
GoB, 2012b. Aerial Census of Animals in Botswana: 2012 Dry Season. Department ofWildlife and National Parks, Gaborone.
GoB. 2013. Botswana Integrated Water Resources Management & Water EfficiencyPlan [online]. Gaborone, Botswana: Department of Water Affairs. [Accessed6 June 2014]. Available from: ⟨http://www.water.gov.bw/images/Reports/Final%20Botswana%20IWRM%20WE%20Plan%20Vol%202%20Version%204%20(Web-Optimised).pdf⟩.
GoUK, 2009. Multi-criteria analysis: a manual [online]. Department for Commu-nities and Local Government, London [Accessed 6 June 2014]. Available from⟨http://eprints.lse.ac.uk/12761/1/Multi-criteria_Analysis.pdf⟩.
Hajkowicz, S.A., McDonald, G.T., Smith, P.N., 2000. An evaluation of multiple ob-jective decision support weighting techniques in natural resource manage-ment. J. Environ. Plan. Manag. 43 (4), 505–518.
Hokkanen, J., Salminen, S., 1994. Choice of a Solid Waste Management System byUsing the ELECTRE III Method. In: Paruccini, M. (Ed.), Applying MCDA for Deci-sion to Environmental Management.. Kluwer Academic Publishers, Dordrecht,Holland
Hokkanen, J., Salminen, P., Rossi, E., Ettala, M., M., 1995. The choice of a solid wastemanagement system using the Electre II decision-aid method. Waste Manag.Res. 13 (2), 175–193. http://dx.doi.org/10.1016/S0734-242X(95)90118-3.
Hubbard, M., 1982. Stock limitation — any economic alternatives for Botswana?Pastoralist Development Network Paper. 14c. Agricultural Administration Unit,ODI, London.
Jacques, G., 1995. Drought in Botswana: Intervention as Fact and Paradigm. Pula:Botsw. J. Afr. Stud. 9 (1), 33–60, URL ⟨http://archive.lib.msu.edu/DMC/African%20Journals/pdfs/PULA/pula009001/pula009001004.pdf⟩.
Kenter, J.O., Reed, M.S., Irvine, K.N., O’Brien, E., Brady, E., Bryce, R., Christie, M.,Church, A., Cooper, N., Davies, A., Hockley, N., Fazey, I., Jobstvogt, N., Molloy, C.,Orchard-Webb, J., Ravenscroft, N., Ryan, M., Watson, V., 2014. UK NationalEcosystem Assessment Follow-on. Work Package Report 6: Shared, Plural andCultural Values of Ecosystems. UNEP-WCMC, LWEC, UK.
Mace, G.M., Norris, K., Fitter, A.H., 2012. Biodiversity and ecosystem services: amultilayered relationship. Trends Ecol. Evol. 27 (1), 19–26. http://dx.doi.org/10.1016/j.tree.2011.08.006.
Madzwamuse, M., Schuster, B., Nherera, B., 2007. The Real Jewels of the Kalahari.Drylands Ecosystem Goods and Services in Kgalagadi South District, Botswana[online]. IUCN The World Conservation Union, France [Accessed 6 June 2014].Available from ⟨http://www.cbd.int/financial/values/botswana-valueservices.pdf⟩.
Notter, D.R., 1999. The importance of genetic diversity in livestock populations ofthe future. J. Anim. Sci. 77 (1), 61–69, URL ⟨http://www.journalofanimalscience.org/content/77/1/61⟩.
Ostrom, E., Burger, J., Field, C.B., Norgaard, R.B., Policansky, D., 1999. Revisiting theCommons: Local lessons, global challenges. Science 284 (5412), 278–282.
Perkins, J.S., 1996. Botswana: fencing out the equity issue. Cattleposts and cattleranching in the Kalahari Desert. J. Arid Environ. 33; , pp. 503–517. http://dx.doi.org/10.1006/jare.1996.0086.
Perkins, J.S., Stuart-Hill, G., Kgabung, B., 2002. The impact of borehole based cattlekeeping on the environment and society of the Kalahari. In: Sporton., D.,Thomas., D.S.G. (Eds.), Sustainable livelihoods in Kalahari Environments: con-tributions to global debates. OUP, Oxford.
Richardson, L., Loomis, J., Kroeger, T., Casey, F., 2014. The role of benefit transfer inecosystem service valuation. Ecol. Econ. 115, 51–58. http://dx.doi.org/10.1016/j.ecolecon.2014.02.018.
Rogers, M.G., Bruen, M., 1998. A new system for weighting environmental criteriafor use within ELECTRE III. Eur. J. Oper. Res. 107 (3), 552–563. http://dx.doi.org/10.1016/S0377-2217(97)00154-9.
Scherf, B., Rischkowsky, B., Hoffmann, I., Wieczorek, M., Montironi, A., Cardellino,R., 2008. Livestock Genetic Diversity in Dry Rangelands. In: Lee, C., Schaaf., T.(Eds.), The Future of Drylands. Springer, Netherlands, pp. 89–100.
Stringer, L.C., Dougill, A., Thomas, A., Stracklen, D., Chesterman, S., Ifejika-Speranza,C., Rueff, R., Riddell, M., Williams, M., Beedy, T., Abson, D., Klintenberg, P.,Syampungani, S., Powell, P., Palmer, A., Seely, M., Mkwambisi, D., Falcao, M.,Sitoe, A., Ross, S., Kopolo, G., 2012. Challenges and opportunities in linkingcarbon sequestration, livelihoods and ecosystem service provision in drylands.Environ. Sci. Policy 19–20, 121–135. http://dx.doi.org/10.1016/j.envsci.2012.02.004.
Stringer, L.C., Thomas, D.S.G., Twyman, C., 2007. From global politics to local landusers: applying the United Nations Convention to combat desertification inSwaziland. Geogr. J. 173 (2), 129–142. http://dx.doi.org/10.1111/j.1475-4959.2007.00226.x.
TEEB, 2010. The Economics of Ecosystems and Biodiversity Ecological and EconomicFoundations. In: Kumar, Pushpam (Ed.), 2010. Earthscan, London andWashington.
Thomas, A.D., 2012. Impact of grazing intensity on seasonal variations in soil or-ganic carbon and soil CO2 efflux in two semiarid grasslands in southernBotswana. Philos. Trans. R Soc. B: Biol. Sci. 367 (1606), 3076–3086, URL ⟨http://hdl.handle.net/2160/11980⟩.
Thomas, D.S.G., Twyman, C., 2004. Good or bad rangeland? Hybrid knowledge,science, and local understandings of vegetation dynamics in the Kalahari. LandDegrad. Dev. 15 (3), 215–231. http://dx.doi.org/10.1002/ldr.610.
Thusano Lefatsheng Trust, 2005. Land use and management plan: ControlledHunting Area KD 15. Prepared for Khawa Kopanelo Development Trust. Thu-sano Lefatsheng Trust, Gaborone.
Twyman, C. 2000. Livelihood Opportunity and Diversity in Kalahari WildlifeManagement Areas, Botswana: Rethinking Community Resource Management.Journal of Southern African Studies. 26(4), pp. 783–806. URL: ⟨http://www.jstor.org/stable/2637571⟩.
WOCAT. 2010. Sustainable land management [Online]. [Accesed 6 June 2014].Available from: ⟨https://www.wocat.net/en/about-wocat/vision-mission/sustainable-land-management.html⟩.