multi asset variance risk premium - cboe | cboe options … · fulcrum multi asset volatility 2 the...
TRANSCRIPT

STRICTLY CONFIDENTIAL – DO NOT DISTRIBUTE
Multi Asset Variance Risk Premium
2 Fulcrum Multi Asset Volatility
The S&P 500 Variance Risk Premium
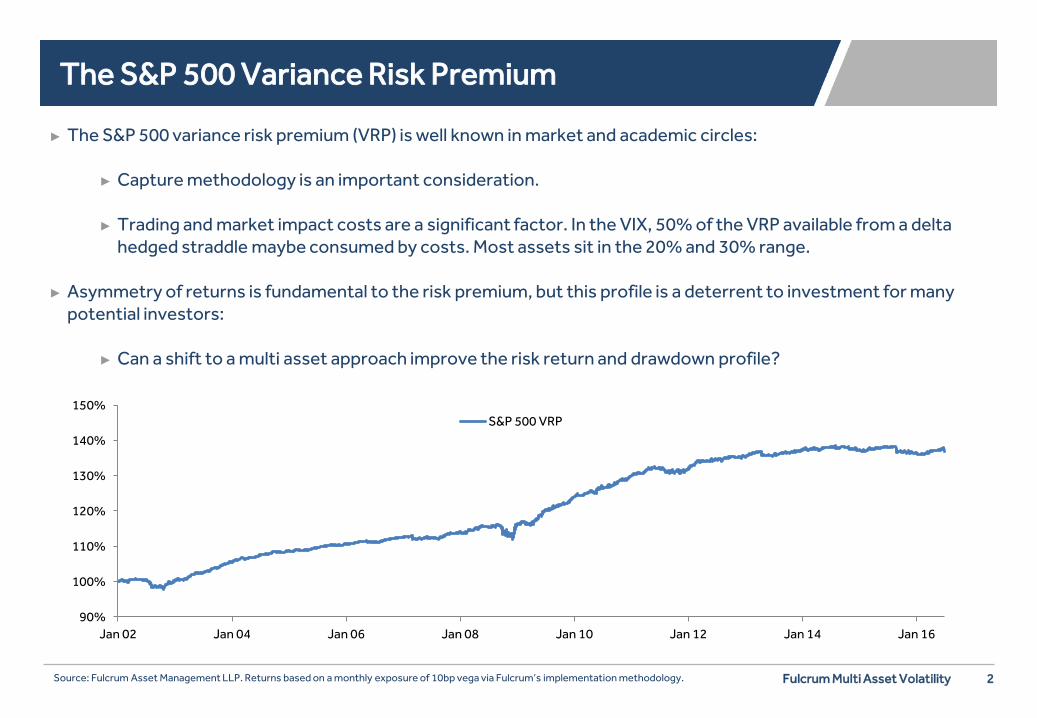
► The S&P 500 variance risk premium (VRP) is well known in market and academic circles:
► Capture methodology is an important consideration.
► Trading and market impact costs are a significant factor. In the VIX, 50% of the VRP available from a delta hedged straddle maybe consumed by costs. Most assets sit in the 20% and 30% range.
► Asymmetry of returns is fundamental to the risk premium, but this profile is a deterrent to investment for many
potential investors:
► Can a shift to a multi asset approach improve the risk return and drawdown profile?
Source: Fulcrum Asset Management LLP. Returns based on a monthly exposure of 10bp vega via Fulcrum’s implementation methodology.
90%
100%
110%
120%
130%
140%
150%
Jan 02 Jan 04 Jan 06 Jan 08 Jan 10 Jan 12 Jan 14 Jan 16
S&P 500 VRP

3 Fulcrum Multi Asset Volatility
S&P 500, Eurostoxx 50 and natural gas
► The first step towards diversification is to broaden the equity basket:
► Since 2002, the correlation between Eurostoxx 50 and S&P 500 has been 85%, whilst the correlation between the VRPs is 72%.
► The real benefits emerge from a move to a multi asset basis:
► The correlation between the S&P 500 and natural gas VRPs is only 2%.
► Diversifying the portfolio increases the information ratio and reduces the maximum drawdown.
Source: Fulcrum Asset Management LLP. Returns based on a monthly exposure of 10bp vega via Fulcrum’s implementation methodology.
90%
100%
110%
120%
130%
140%
150%
160%
Jan 02 Jan 05 Jan 08 Jan 11 Jan 14
S&P 500 VRP Eurostoxx 50 VRP Nat Gas VRP S&P 500 Eurostoxx 50 Nat Gas Equity Equity + Nat Gas
Annualised Return
2.2% 1.9% 3.2% 2.1% 2.5%
Volatility 1.9% 2.2% 4.4% 1.7% 1.9%
Sharpe Ratio 1.1 0.9 0.7 1.2 1.3
Max Drawdown -3.6% -4.7% -11.1% -3.7% -2.9%

4 Fulcrum Multi Asset Volatility
The correlation structure
► Correlation structure analysed by looking at the average correlation of an asset’s VRP with the VRP of other assets:
► Average correlation between asset VRPs is only 31%.
► Equities and gold have higher than average correlations. Gold has acted as a risk on / risk off asset and
equity correlation is elevated due to the high pairwise correlation between indices.
► Commodities are the strongest diversifiers along with a surprise showing from VIX.
Source: Fulcrum Asset Management LLP. Correlations based on Fulcrum’s implementation methodology.
0%
10%
20%
30%
40%
50%
VR
P co
rrel
atio
n
5 Fulcrum Multi Asset Volatility
A granular review of correlation structure
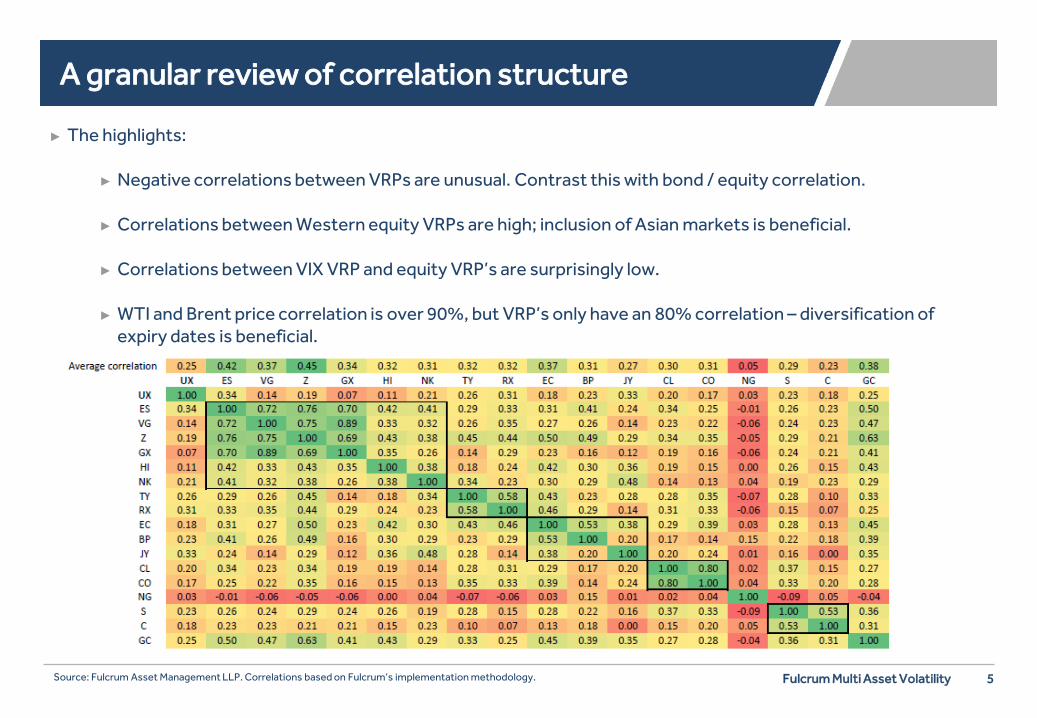
► The highlights:
► Negative correlations between VRPs are unusual. Contrast this with bond / equity correlation.
► Correlations between Western equity VRPs are high; inclusion of Asian markets is beneficial.
► Correlations between VIX VRP and equity VRP’s are surprisingly low.
► WTI and Brent price correlation is over 90%, but VRP’s only have an 80% correlation – diversification of expiry dates is beneficial.
Source: Fulcrum Asset Management LLP. Correlations based on Fulcrum’s implementation methodology.

6 Fulcrum Multi Asset Volatility
How stable were these correlations?
► Analysis of the rolling 2 year correlation between Nat Gas VRP and the S&P 500, US 10yr, Euro and WTI VRPs reveals:
► Correlations have sat within a band of 20% around 0%. ► Correlations with “financial assets” have tended to move together.
► Nat Gas VRP has in the past offered a relatively stable diversification opportunity.
Source: Fulcrum Asset Management LLP. Correlations based on Fulcrum’s implementation methodology.
-40%
-20%
0%
20%
40%
Jan 04 Jan 06 Jan 08 Jan 10 Jan 12 Jan 14 Jan 16
S&P 500 US 10yr Euro WTI
7 Fulcrum Multi Asset Volatility
Asset allocation
► There are numerous asset allocation techniques available.
► Equal Weight:
► Simple but fails to differentiate between the very different volatility profiles of the individual VRPs.
► Equal volatility:
► A risk parity approach with low risk strategies leveraged higher. ► Approach ignores the benefits of diversification.
► Minimum variance, equal risk contribution, maximum diversification:
► Requires an estimate of the correlation matrix. Are we confident enough in the forecast? ► Can lead to high allocations to commodities and natural gas in particular.

8 Fulcrum Multi Asset Volatility
An example
► A measure of diversification is an estimate of the number of orthogonal positions:
Number of orthogonal assets = ∑𝑤𝑖𝜎𝑖 𝜎𝑝�2
► Optimising the asset allocation to maximise the benefits of diversification results in 4.7 orthogonal assets:
► An unhealthy risk allocation to natural gas. ► A heavy risk allocation to commodities. ► The removal of the gold and US equity VRPs from the portfolio.
Source: Fulcrum Asset Management LLP.
Asia Europe Asia
Nat Gas Europe
US Europe
Grain
VIX
Oil
0.0%
0.5%
1.0%
1.5%
2.0%
2.5%
3.0%
3.5%
Equity Fixed Income FX Commodities
Ris
k ex
posu
re
9 Fulcrum Multi Asset Volatility
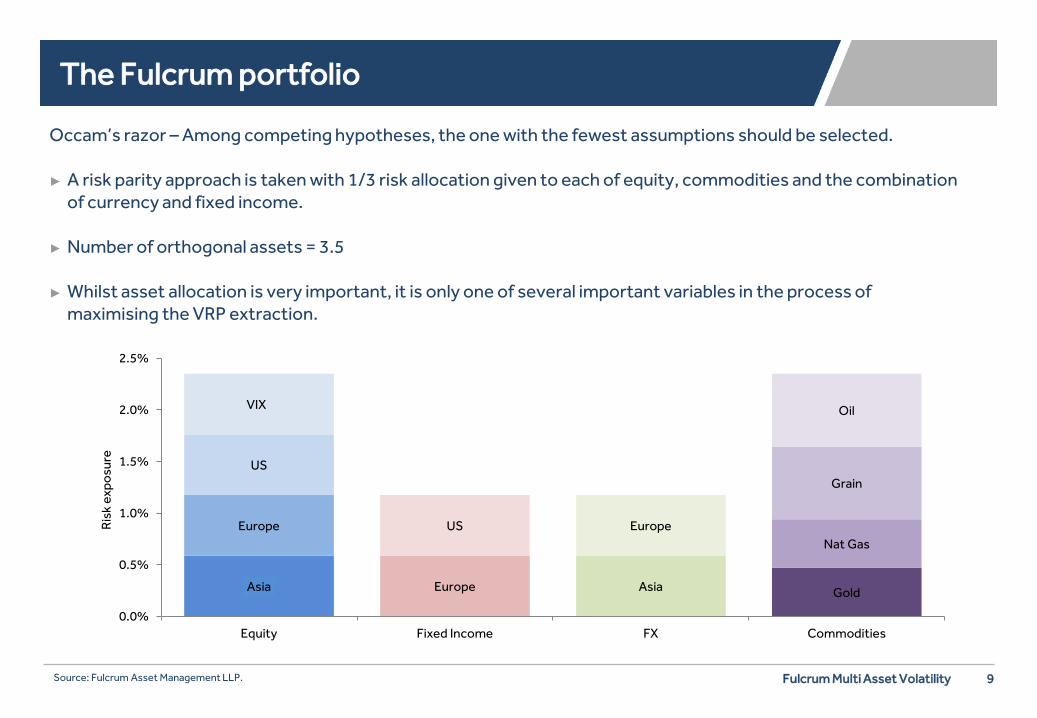
The Fulcrum portfolio
Occam’s razor – Among competing hypotheses, the one with the fewest assumptions should be selected. ► A risk parity approach is taken with 1/3 risk allocation given to each of equity, commodities and the combination
of currency and fixed income. ► Number of orthogonal assets = 3.5
► Whilst asset allocation is very important, it is only one of several important variables in the process of
maximising the VRP extraction.
Source: Fulcrum Asset Management LLP.
Asia Europe Asia Gold
Europe US Europe Nat Gas
US Grain
VIX Oil
0.0%
0.5%
1.0%
1.5%
2.0%
2.5%
Equity Fixed Income FX Commodities
Ris
k ex
posu
re

10 Fulcrum Multi Asset Volatility
Should one exclude assets?
► Start with the premise that all option markets trade with an implicit VRP.
► To exclude an asset one of three conditions must be met:
► Cost
► There is a limited premium on offer and costs rapidly eat into the opportunity. ► Bid offer on heating oil options is high. Correlation of 80% with Brent and WTI VRPs.
► Non free floating asset:
► Short option exposure may result in excessive gap risk being taken. ► EURCHF implied traded at 2.6% in January 2015 before SNB removed the floor. Realised traded in
excess of 30% after its removal.
► An unexplainably poor backtest:
► A controversial rational in the world of CTA. ► AUD VRP has performed very poorly over the last decade. A function of it being a carry currency /
China proxy?

11 Fulcrum Multi Asset Volatility
Drawbacks of the multi asset approach
► Whilst the benefits to the investor are clear, there are clearly high research and operational costs associated with extending the strategy beyond the S&P 500:
► Research:
► Does the VRP exhibit seasonality? ► Impact of limit days?
► In grains, this can have a significant impact on the realisable VRP. ► New crop / old crop, standard or off cycle option expiry?
► Operational:
► A minimum AUM level to warrant the complexity and ensure market efficiency. ► Robust systems:
► A S&P 500 straddle can be run on a spreadsheet, but that is not realistic for a multi asset VRP book. ► Heavy demand on trading team to initiate / close / manage expiry of option positions. Delta hedging can
be largely automated.
12 Fulcrum Multi Asset Volatility
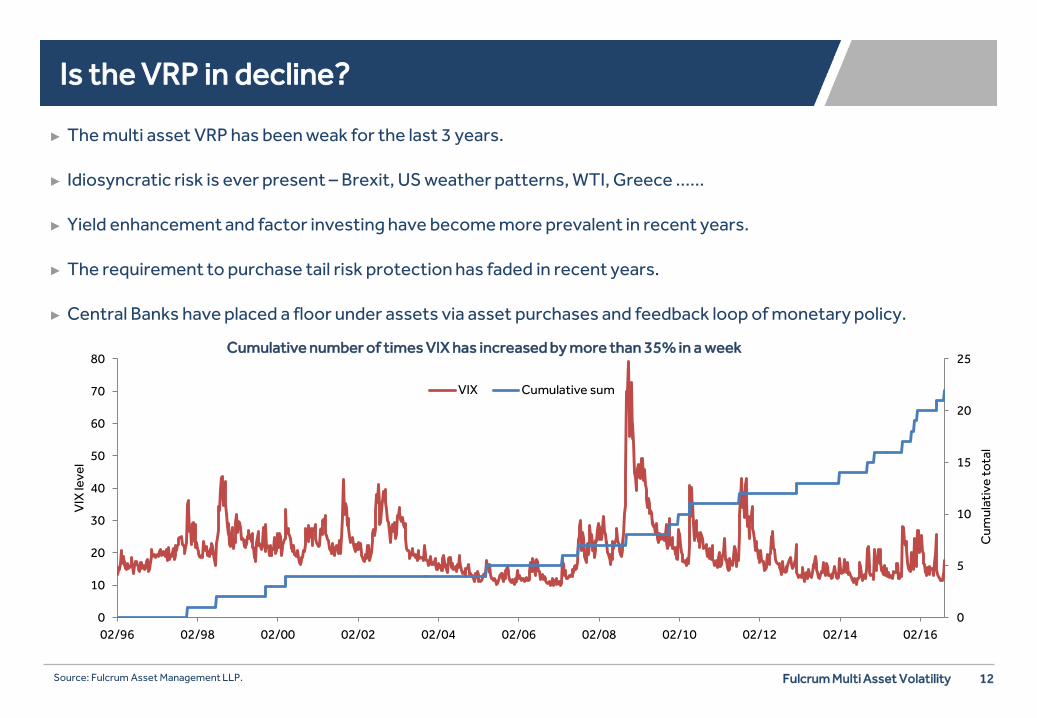
Is the VRP in decline?
► The multi asset VRP has been weak for the last 3 years.
► Idiosyncratic risk is ever present – Brexit, US weather patterns, WTI, Greece ……
► Yield enhancement and factor investing have become more prevalent in recent years.
► The requirement to purchase tail risk protection has faded in recent years. ► Central Banks have placed a floor under assets via asset purchases and feedback loop of monetary policy.
Source: Fulcrum Asset Management LLP.
0
5
10
15
20
25
0
10
20
30
40
50
60
70
80
02/96 02/98 02/00 02/02 02/04 02/06 02/08 02/10 02/12 02/14 02/16
Cum
ulat
ive
tota
l
VIX
leve
l
Cumulative number of times VIX has increased by more than 35% in a week
VIX Cumulative sum

13 Fulcrum Multi Asset Volatility
Conclusion
► Asymmetry of returns is fundamental to the risk premium.
► S&P 500 VRP has delivered long term robust returns.
► A move to a multi asset VRP results in significantly enhanced risk return profile.
► Periods of flat / adverse performance are to be expected from a risk premium extraction strategy.
Source: Fulcrum Asset Management LLP. Returns based on a monthly exposure of 65bp vega via Fulcrum’s implementation methodology.
Multi Asset VRP
Annualised Return 7.6%
Volatility 4.3%
Sharpe Ratio 1.8
Max Drawdown -13.1%
50%
100%
150%
200%
250%
300%
350%
Jan 02 Jan 05 Jan 08 Jan 11 Jan 14

14 Fulcrum Multi Asset Volatility
Disclaimer
This material is for your information only and is not intended to be used by anyone other than you. It is directed at professional clients and eligible counterparties only and is not intended for retail clients. This is not an offer or solicitation with respect to the purchase or sale of any security. The material is intended only to facilitate your discussions with Fulcrum Asset Management as to the opportunities available to our clients. The given material is subject to change and, although based upon information which we consider reliable, it is not guaranteed as to accuracy or completeness and it should not be relied upon as such. The material is not intended to be used as a general guide to investing, or as a source of any specific investment recommendations, and makes no implied or express recommendations concerning the manner in which any client’s account should or would be handled, as appropriate investment strategies depend upon client’s investment objectives. The price and value of the investments referred to in this material and the income from them may go down as well as up and investors may not receive back the amount originally invested. Past performance is not a guide to future performance. Future returns are not guaranteed and a loss of principal may occur. It is the responsibility of any person or persons in possession of this material to inform themselves of and to observe all applicable laws and regulations of any relevant jurisdiction. Fulcrum Asset Management does not provide tax advice to its clients and all investors are strongly advised to consult with their tax advisors regarding any potential investment. Opinions expressed are our current opinions as of the date appearing on this material only. Any historical price(s) or value(s) are also only as of the date indicated. We will endeavor to update on a reasonable basis the information discussed in this material. References to market or composite indices, benchmarks or other measures of relative market performance over a specified period of time ("benchmarks") are provided by Fulcrum Asset Management for your information purposes only. Investors cannot invest directly in indices. Indices are typically unmanaged and the figures for the indices shown herein do not reflect any investment management fees or transaction expenses. Fulcrum Asset Management does not give any commitment or undertaking that the performance or risk profile of your account(s) will equal, exceed or track any benchmark. The composition of the benchmark may not reflect the manner in which a portfolio is constructed in relation to expected or achieved returns, portfolio guidelines, restrictions, sectors, correlations, concentrations, volatility or tracking error targets, all of which are subject to change over time. Simulated, modeled, or hypothetical performance results may be used and have certain inherent limitations. Simulated results are hypothetical and do not represent actual trading, and thus may not reflect material economic and market factors, such as liquidity constraints, that may have had an impact on actual decision-making. Simulated results are also achieved through retroactive application of a model designed with the benefit of hindsight. No representation is being made that any client will or is likely to achieve results similar to those shown. Certain funds managed by Fulcrum Asset Management LLP use quantitative models, where this is the case, Fulcrum Asset Management LLP can and do make discretionary decisions on a frequent basis and reserves the right to do so at any point. Certain transactions, including those involving futures, options and high yield securities and investments in emerging markets may give rise to substantial risk and may not be suitable for all investors. Foreign currency denominated investments are subject to fluctuations in exchange rates that could have an adverse effect on the value or price of, or income derived from, the investment; such investments are also subject to the possible imposition of exchange control regulations or other laws or restrictions applicable to such investments. Investments referred to in this material are not necessarily available in all jurisdictions, may be illiquid and may not be suitable for all investors. Investors should consider whether an investment is suitable for their particular circumstances and seek advice from their investment adviser. For US Investors: Shares in the Fund will not be registered under the Securities Act of 1933, the securities laws of any state or the securities laws of any other jurisdiction, and the Fund will not be registered under the Investment Company Act of 1940. There is no public market for the shares, and no such market is expected to develop in the future. Shares in the Fund may not be sold or transferred except as permitted under the Fund's articles of association, and unless they are registered under the Securities Act of 1933 or an exemption from registration thereunder and under any other applicable securities law registration requirements is available. Accordingly, investors will be required to bear the financial risks of an investment in the Fund for an extended period of time. This document is not intended for distribution to, or use by any person or entity in any jurisdiction or country where such distribution or use would be contrary to local law or regulation. In particular this document is not intended for distribution in the United States or for the account of U.S. persons (as defined in Regulation S under the United States Securities Act of 1933, as amended (the "Securities Act")) except to persons who are "qualified purchasers" (as defined in the United States Investment Company Act of 1940, as amended), "accredited investors" (as defined in Rule 501(a) under the Securities Act) and Qualified Eligible Persons (as defined in Commodity Futures Trading Commission Regulation 4.7). This material has been approved for issue in the United Kingdom solely for the purposes of Section 21 of the Financial Services and Markets Act 2000 by Fulcrum Asset Management (“Fulcrum”), Marble Arch House, 66 Seymour Street, London W1H 5BT. Fulcrum Asset Management LLP is authorised and regulated by the Financial Conduct Authority (No: 230683). © 2016 Fulcrum Asset Management LLP. All rights reserved.