2011 market statistics - cboe
TRANSCRIPT
CBOE 2011 MARKET STATISTICS

Table of Contents
CBOE HOLDINGS TRADING ACTIVITY - 2011 (Includes CBOE and C2) Total Options Trading Summary ...........................................................................1 Total Options Average Premium Per Contract,
Average Contracts Per Trade and Transactions................................................2 Total Options Contract Volume - All Options...........................................................2
CBOE TRADING ACTIVITY - 2011 Total CBOE Options Trading Summary ..................................................................3 Total CBOE Options Average Premium Per Contract,
Average Contracts Per Trade and Transactions................................................4 Total CBOE Options Contract Volume - All Options .................................................4
CBOE EQUITY OPTIONS - 2011 Equity Options Contract Volume ............................................................................5 Equity Options Open Interest and Dollar Volume.....................................................5 Equity Options Average Premium Per Contract,
Average Contracts Per Trade and Transactions................................................6 Equity FLEX® Options Contract Volume, Open Interest
and Dollar Volume .........................................................................................7 Equity FLEX® Options Average Premium Per Contract,
Average Contracts Per Trade and Transactions................................................7 CBOE Equity Options Volume ...............................................................................8-52 CBOE Top 100 Equity Options Ranked By Volume ................................................53-54
CBOE CASH INDEX OPTIONS - 2011 (Each listing includes Contract Volume, Open Interest and Dollar Volume, Average Premium Per Contract, Average Contracts Per Trade and Transactions)
Cash Index Options Launch Dates ......................................................................55
Most Active Cash Indexes-2011.........................................................................56-57
Total Cash Index Options ...................................................................................58-59 Total Cash Index FLEX (NDX, RUT, SPX, VIX) ........................................................60-61 Total CBOE Volume for FLEX, QUARTERLY, WEEKLY and BINARY Cash Index Options ............................................................................61 SPX® (S&P 500®) ..............................................................................................62-63 XSP® (Mini-S&P 500® Index) ..............................................................................64-65 OEX® (S&P 100®) ..............................................................................................66-67 XEO® (S&P 100® European Style) .......................................................................68-69 DJX (Dow Jones Industrial AverageSM) ................................................................70-71 NDX (Nasdaq-100 Index®) .................................................................................72-73 MNX (Mini Nasdaq-100 Index®) .........................................................................74-75 RUT (Russell 2000® Index) ................................................................................76-77 VIX® (CBOE Volatility Index®)...............................................................................78-79 Other Cash Index Option Products ......................................................................80-81 Other Cash Index Options Contract Volume Detail ................................................82
CBOE BINARY OPTIONS – 2011 (Each listing includes Contract Volume, Open Interest and Dollar Volume, Average Premium Per Contract, Average Contracts Per Trade and Transactions)
BSZ CBOE Binary Options (SPX) ..........................................................................83 BVZ CBOE Binary Options (VIX) ...........................................................................84
CBOE EXCHANGE TRADED FUNDS OPTIONS – 2011
(Each listing includes Contract Volume, Open Interest and Dollar Volume, Average Premium Per Contract, Average Contracts Per Trade and Transactions)
Exchange Traded Funds-2011............................................................................85-87 Most Active Exchange Traded Funds...................................................................88 Total CBOE Exchange Traded Funds Options ......................................................89-90 Total CBOE Exchange Traded Funds FLEX ………… ................................ ……91-92 QQQ (PowerShares QQQ) ...................................................................................93-94 DIA (DIAMONDS®)..............................................................................................95-96 SPY (S&P Depository Receipts) ...........................................................................97-98 IWM (iShares Russell 2000® Index Fund) ............................................................99-100 Other CBOE Exchange Traded Funds Option Products .......................................101-102 Other CBOE Exchange Traded Funds Options Contract Volume Detail .................103-110
CBOE INTEREST RATE OPTIONS - 2011
(Each listing includes Contract Volume, Open Interest and Dollar Volume, Average Premium Per Contract, Average Contracts Per Trade and Transactions)
Total Interest Rate Options ..............................................................................111-112 TNX Options ...................................................................................................113-114
CBOE CREDIT OPTIONS – 2011 Total Single-Name CEBOs Contract Volume, Dollar Volume and Transactions ......115
C2 TRADING ACTIVITY - 2011 Total C2 Options Trading Summary ..................................................................116 Total C2 Options Average Premium Per Contract,
Average Contracts Per Trade and Transactions ...........................................117 Total C2 Options Contract Volume - All Options .................................................117
C2 EQUITY OPTIONS - 2011 Equity Options Contract Volume........................................................................118 Equity Options Open Interest and Dollar Volume.................................................118 Equity Options Average Premium Per Contract,
Average Contracts Per Trade and Transactions ...........................................119 C2 Equity Options Volume ...............................................................................120-124 C2 Top 100 Equity Options Ranked By Volume ..................................................125-126
C2 CASH INDEX OPTIONS – 2011 (Each listing includes Contract Volume, Open Interest and Dollar Volume, Average Premium Per Contract, Average Contracts Per Trade and Transactions)
Cash Index Options Launch Dates ....................................................................127 Total Cash Index Options..................................................................................128 SPXpm (S&P 500®) .........................................................................................128
C2 EXCHANGE TRADED FUNDS OPTIONS – 2011 (Each listing includes Contract Volume, Open Interest and Dollar Volume, Average Premium Per Contract, Average Contracts Per Trade and Transactions)
C2 Exchange Traded Funds-2011 ....................................................................129-130 Total C2 Volume for QUARTERLY, WEEKLY Options............................................130 QQQ (PowerShares QQQ) .................................................................................131-132 DIA (DIAMONDS®)............................................................................................133-134 SPY (S&P Depository Receipts) .........................................................................135-136 IWM (iShares Russell 2000® Index Fund) ..........................................................137-138 Other C2 Exchange Traded Funds Option Products ...........................................139-140 Other C2 Exchange Traded Funds Options Contract Volume Detail......................141-143
CBOE HOLDINGS, INC. TRADING ACTIVITY AND MARKET SHARE – 2011 Total Options Contract Volume by Exchange ......................................................144 Total Equity Options Contract Volume by Exchange ............................................144 Total Exchange Traded Funds Contract Volume by Exchange ..............................145 Total Cash Index Options Contract Volume by Exchange .....................................145 Total Other CBOE Contract Volume (CEBOs and Interest Rate) ...........................145
HISTORICAL TRADING ACTIVITY Total CBOE Options..........................................................................................146-149 Total C2 Options ..............................................................................................150 Total Options Contract Volume by Exchange ......................................................151 Total CBOE Equity Options................................................................................152-154 Total C2 Equity Options ....................................................................................155 Total Equity Options Contract Volume by Exchange ............................................156 Total CBOE Equity LEAPS Contract Volume ........................................................157 Total CBOE Cash Index Options.........................................................................158-165 Total C2 Cash Index Options.............................................................................166 Total Cash Index Options Contract Volume by Exchange .....................................167 Total CBOE Exchange Traded Funds Options .....................................................168-169 Total C2 Exchange Traded Funds Options..........................................................170 Total Exchange Traded Funds by Exchange .......................................................171 Total CBOE Interest Rate Options ......................................................................172-173 Total CBOE Credit Options ................................................................................174
CBOE FUTURES EXCHANGE ACTIVITY (CFE) – 2011 (Includes Futures and Option Futures) Total CFE Trading Summary .............................................................................175 Total CFE Futures and Option Futures Average Contracts Per Trade and Transactions ........................................................................175 Total CFE Futures and Option Futures Contract Volume ......................................176
CFE FUTURES TRADING ACTIVITY – 2011 Futures Contract Volume Total CFE Futures Average Contracts Per Trade and Transactions .......................177 VIX (CBOE Volatility Index Futures).....................................................................178 VM (CBOE Mini-VIX Futures) .............................................................................179 VTI (CBOE S&P 500 Three-Month Variance Futures)...........................................180 GVZ (CBOE Gold ETF Volatility Index Futures) .....................................................181
CFE OPTIONS ON FUTURES TRADING ACTIVITY – 2011 VOW (CBOE Volatility Index Options on Futures) Contract Volume........................182 VOW (CBOE Volatility Index Options on Futures) Average Contracts ....................182 Per Trade and Transactions

CBOE HOLDINGS, INC. TRADING ACTIVITY - 2011(Includes CBOE and C2 combined)
Total CBOE HOLDINGS Options Trading Summary
Call Put TotalNo. of Contracts 602,232,777 602,649,236 1,204,882,013Average Daily Volume 2,389,813 2,391,465 4,781,278Dollar Volume $335,111,444,133 $371,254,438,941 $706,365,883,074Open Interest 153,775,363 133,363,797 287,139,160Transactions 33,909,312 24,404,641 58,313,953
Trading Average Daily Total Dollar Month Days Call Put Total Total Call Put Total Volume
Jan 20 58,862,927 46,925,051 105,787,978 5,289,399 126,453,827 113,205,495 239,659,322 $46,375,754,831Feb 19 51,373,353 43,704,389 95,077,742 5,004,092 141,834,422 126,323,381 268,157,803 $41,056,860,721Mar 23 58,363,293 53,180,755 111,544,048 4,849,741 151,561,860 134,756,299 286,318,159 $57,770,314,117Apr 20 47,273,572 42,405,946 89,679,518 4,483,976 154,740,954 137,821,055 292,562,009 $42,052,432,705May 21 45,744,472 42,328,280 88,072,752 4,193,941 154,914,306 142,274,978 297,189,284 $34,628,855,803Jun 22 48,097,535 51,256,823 99,354,358 4,516,107 156,489,097 143,550,094 300,039,191 $60,080,385,647Jul 20 46,501,362 44,877,388 91,378,750 4,568,938 160,726,446 147,526,418 308,252,864 $44,535,159,233Aug 23 68,399,577 82,782,687 151,182,264 6,573,142 174,213,048 163,621,213 337,834,261 $116,667,384,265Sep 21 48,577,711 55,669,456 104,247,167 4,964,151 168,689,424 157,428,374 326,117,798 $83,132,513,494Oct 21 49,934,824 55,226,030 105,160,854 5,007,660 166,180,596 149,603,706 315,784,302 $72,875,516,248Nov 21 41,923,694 46,987,494 88,911,188 4,233,866 166,077,645 152,028,936 318,106,581 $60,365,871,379Dec 21 37,180,457 37,304,937 74,485,394 3,546,924 153,775,363 133,363,797 287,139,160 $46,824,834,631Total 252 602,232,777 602,649,236 1,204,882,013 4,781,278 -- -- -- $706,365,883,074
Contract Volume Open Interest
CBOE HOLDINGS, INC. Page 1 2011 MARKET STATISTICS

Total CBOE HOLDINGS Options Average Premium Per Contract, Average Contracts Per Trade and Transactions
TradingMonth Days Call Put Total Call Put Total Call Put Total
Jan 20 $465 $405 $438 17 22 19 3,528,740 2,129,403 5,658,143Feb 19 $476 $380 $432 16 23 19 3,129,486 1,907,224 5,036,710Mar 23 $509 $527 $518 18 24 20 3,302,871 2,242,222 5,545,093Apr 20 $493 $442 $469 16 23 19 2,883,224 1,834,430 4,717,654May 21 $352 $437 $393 18 22 20 2,607,523 1,885,206 4,492,729Jun 22 $625 $586 $605 20 26 22 2,457,026 1,993,119 4,450,145Jul 20 $488 $487 $487 19 26 22 2,492,622 1,752,321 4,244,943Aug 23 $593 $919 $772 20 29 24 3,386,545 2,884,560 6,271,105Sep 21 $757 $833 $797 18 26 22 2,644,834 2,109,610 4,754,444Oct 21 $664 $719 $693 17 26 21 2,866,855 2,122,918 4,989,773Nov 21 $660 $696 $679 17 24 20 2,470,683 1,946,158 4,416,841Dec 21 $623 $634 $629 17 23 20 2,138,903 1,597,470 3,736,373Total 252 $556 $616 $586 18 25 21 33,909,312 24,404,641 58,313,953
Total CBOE HOLDINGS Options Contract Volume - All Options
MonthTradingDays
TotalVolume
EquityVolume
Cash IndexVolume
ETFVolume
Interest RateVolume
CEBOsVolume
Jan 20 105,787,978 59,709,134 22,484,103 23,594,740 1Feb 19 95,077,742 50,648,241 21,003,954 23,425,539 8Mar 23 111,544,048 51,095,898 29,197,334 31,250,816Apr 20 89,679,518 43,606,520 19,979,877 26,093,121May 21 88,072,752 39,783,640 21,595,396 26,693,709 7Jun 22 99,354,358 38,571,838 28,631,968 32,150,542 10Jul 20 91,378,750 37,884,538 25,938,390 27,555,769 53Aug 23 151,182,264 51,606,560 45,848,161 53,727,533 10Sep 21 104,247,167 36,441,008 29,985,432 37,820,687 40Oct 21 105,160,854 40,791,746 29,399,055 34,970,053Nov 21 88,911,188 35,087,393 25,749,820 28,073,973 2Dec 21 74,485,394 30,911,156 20,579,901 22,994,337Total 252 1,204,882,013 516,137,672 320,393,391 368,350,819 9 122
Average Premium Per Contract Average Contracts Per Trade Transactions
CBOE HOLDINGS, INC. Page 2 2011 MARKET STATISTICS

CBOE TRADING ACTIVITY - 2011
Total CBOE Options Trading Summary
Call Put TotalNo. of Contracts 577,092,395 574,971,002 1,152,063,397Average Daily Volume 2,290,049 2,281,631 4,571,680Dollar Volume $331,057,740,628 $367,348,411,875 $698,406,152,503Open Interest 153,763,441 133,334,146 287,097,587Transactions 32,213,431 22,972,711 55,186,142
Trading Average Daily Total Dollar Month Days Call Put Total Total Call Put Total Volume
Jan 20 57,230,047 45,437,764 102,667,811 5,133,391 126,453,827 113,205,495 239,659,322 $45,934,682,521Feb 19 49,936,806 42,314,282 92,251,088 4,855,320 141,834,422 126,323,381 268,157,803 $40,720,460,988Mar 23 56,326,564 51,090,774 107,417,338 4,670,319 151,561,860 134,756,299 286,318,159 $57,297,820,499Apr 20 45,550,834 40,636,954 86,187,788 4,309,389 154,740,954 137,821,055 292,562,009 $41,677,155,978May 21 43,895,095 40,262,234 84,157,329 4,007,492 154,914,306 142,274,978 297,189,284 $34,190,639,535Jun 22 46,003,318 48,711,331 94,714,649 4,305,211 156,489,097 143,550,094 300,039,191 $59,539,646,748Jul 20 44,604,949 42,371,493 86,976,442 4,348,822 160,726,446 147,526,418 308,252,864 $43,973,737,012Aug 23 65,098,274 78,935,355 144,033,629 6,262,332 174,213,048 163,621,213 337,834,261 $115,404,695,120Sep 21 46,270,401 53,176,261 99,446,662 4,735,555 168,689,424 157,428,374 326,117,798 $82,221,571,182Oct 21 47,181,231 52,351,491 99,532,722 4,739,653 166,167,259 149,573,579 315,740,838 $71,694,212,900Nov 21 39,743,714 44,331,428 84,075,142 4,003,578 166,061,241 152,003,661 318,064,902 $59,492,148,519Dec 21 35,251,162 35,351,635 70,602,797 3,362,038 153,763,441 133,334,146 287,097,587 $46,259,381,501Total 252 577,092,395 574,971,002 1,152,063,397 4,571,680 -- -- -- $698,406,152,503
Contract Volume Open Interest
CBOE HOLDINGS, INC. Page 3 2011 MARKET STATISTICS

Total CBOE Options Average Premium Per Contract, Average Contracts Per Trade and Transactions
TradingMonth Days Call Put Total Call Put Total Call Put Total
Jan 20 $474 $415 $447 17 23 19 3,373,836 2,011,781 5,385,617Feb 19 $486 $389 $441 17 23 19 3,015,446 1,822,971 4,838,417Mar 23 $523 $545 $533 18 24 20 3,162,547 2,131,932 5,294,479Apr 20 $508 $457 $484 16 23 19 2,773,027 1,749,790 4,522,817May 21 $363 $454 $406 18 23 20 2,490,988 1,785,700 4,276,688Jun 22 $648 $610 $629 20 26 22 2,342,761 1,889,880 4,232,641Jul 20 $502 $509 $506 19 25 21 2,389,699 1,665,593 4,055,292Aug 23 $615 $955 $801 20 29 24 3,196,202 2,699,906 5,896,108Sep 21 $785 $863 $827 19 27 22 2,497,184 1,976,780 4,473,964Oct 21 $689 $748 $720 18 27 22 2,668,657 1,956,647 4,625,304Nov 21 $685 $728 $708 17 24 20 2,315,446 1,809,966 4,125,412Dec 21 $649 $661 $655 18 24 20 1,987,638 1,471,765 3,459,403Total 252 $574 $639 $606 18 25 21 32,213,431 22,972,711 55,186,142
Total CBOE Options Contract Volume - All Options
MonthTradingDays
TotalVolume
EquityVolume
Cash IndexVolume
ETFVolume
Interest RateVolume
CEBOsVolume
Jan 20 102,667,811 57,979,927 22,484,103 22,203,780 1Feb 19 92,251,088 49,216,720 21,003,954 22,030,406 8Mar 23 107,417,338 49,369,929 29,197,334 28,850,075Apr 20 86,187,788 42,103,823 19,979,877 24,104,088May 21 84,157,329 38,441,170 21,595,396 24,120,756 7Jun 22 94,714,649 37,338,073 28,631,968 28,744,598 10Jul 20 86,976,442 36,673,066 25,938,390 24,364,933 53Aug 23 144,033,629 49,393,932 45,848,161 48,791,526 10Sep 21 99,446,662 35,019,922 29,985,432 34,441,268 40Oct 21 99,532,722 38,681,392 29,298,773 31,552,557Nov 21 84,075,142 33,482,807 25,639,275 24,953,058 2Dec 21 70,602,797 29,205,022 20,474,442 20,923,333Total 252 1,152,063,397 496,905,783 320,077,105 335,080,378 9 122
Average Premium Per Contract Average Contracts Per Trade Transactions
CBOE HOLDINGS, INC. Page 4 2011 MARKET STATISTICS

CBOE EQUITY OPTIONS - 2011
CBOE Equity Options Contract Volume
Trading Average DailyMonth Days Call Put Total Volume
Jan 20 38,435,638 19,544,289 57,979,927 2,898,996Feb 19 31,586,289 17,630,431 49,216,720 2,590,354Mar 23 30,739,455 18,630,474 49,369,929 2,146,519Apr 20 26,555,387 15,548,436 42,103,823 2,105,191May 21 23,489,365 14,951,805 38,441,170 1,830,532Jun 22 21,417,114 15,920,959 37,338,073 1,697,185Jul 20 22,432,871 14,240,195 36,673,066 1,833,653Aug 23 27,523,194 21,870,738 49,393,932 2,147,562Sep 21 20,419,011 14,600,911 35,019,922 1,667,615Oct 21 23,295,351 15,386,041 38,681,392 1,841,971Nov 21 19,455,409 14,027,398 33,482,807 1,594,419Dec 21 17,240,794 11,964,228 29,205,022 1,390,715Total 252 302,589,878 194,315,905 496,905,783 1,971,848
CBOE Equity Options Open Interest and Dollar Volume
Month Call Put Total Call Put TotalJan 95,178,199 66,026,985 161,205,184 $8,346,534,687 $3,240,290,953 $11,586,825,640Feb 105,831,950 73,814,344 179,646,294 $6,436,153,135 $2,845,991,517 $9,282,144,652Mar 113,870,713 80,550,049 194,420,762 $5,678,300,615 $3,374,581,088 $9,052,881,703Apr 115,896,315 82,232,879 198,129,194 $5,083,214,870 $2,789,115,297 $7,872,330,167May 114,056,184 83,440,745 197,496,929 $3,985,189,186 $2,801,416,040 $6,786,605,226Jun 115,053,939 84,920,082 199,974,021 $3,598,821,256 $3,447,063,354 $7,045,884,610Jul 118,675,114 86,930,209 205,605,323 $5,576,955,781 $2,798,305,468 $8,375,261,249Aug 122,730,304 91,363,130 214,093,434 $5,581,326,849 $5,834,262,267 $11,415,589,116Sep 120,091,080 90,237,798 210,328,878 $4,788,583,708 $3,888,025,120 $8,676,608,828Oct 119,440,384 87,109,787 206,550,171 $5,676,413,357 $3,715,669,377 $9,392,082,734Nov 119,296,363 88,191,541 207,487,904 $4,187,615,297 $3,172,511,957 $7,360,127,254Dec 114,997,656 83,128,740 198,126,396 $3,189,815,893 $2,616,118,780 $5,805,934,673Total -- -- -- $62,128,924,634 $40,523,351,218 $102,652,275,852
During 2011, 497 million equity contracts were traded on the CBOE, representing options on 49.7 billion shares of underlying stock.
Open interest represents the number of outstanding options contracts at any point in time. It is the total number of options which have been purchased but not liquidated in the secondary market, exercised or expired. At year-end 2011, open interest in equity options on CBOE was 198,126,396 contracts.
Open Interest Dollar Volume
Contract Volume
CBOE HOLDINGS, INC. Page 5 2011 MARKET STATISTICS
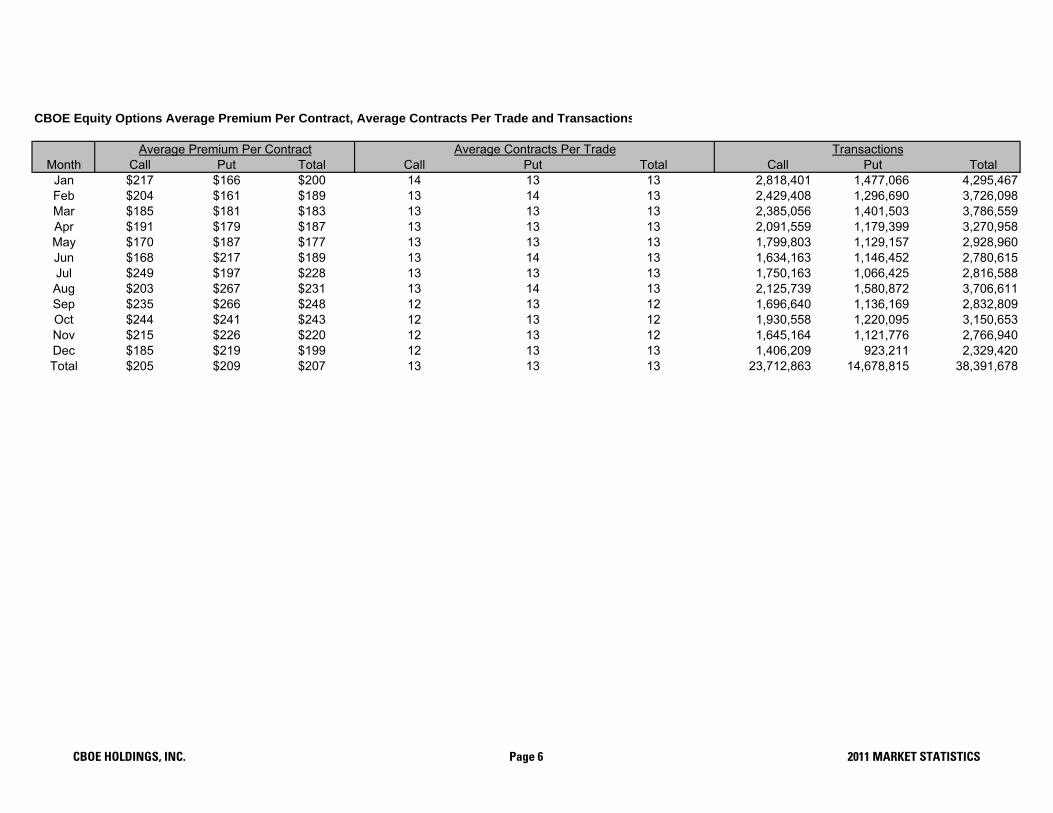
CBOE Equity Options Average Premium Per Contract, Average Contracts Per Trade and Transactions
Month Call Put Total Call Put Total Call Put TotalJan $217 $166 $200 14 13 13 2,818,401 1,477,066 4,295,467Feb $204 $161 $189 13 14 13 2,429,408 1,296,690 3,726,098Mar $185 $181 $183 13 13 13 2,385,056 1,401,503 3,786,559Apr $191 $179 $187 13 13 13 2,091,559 1,179,399 3,270,958May $170 $187 $177 13 13 13 1,799,803 1,129,157 2,928,960Jun $168 $217 $189 13 14 13 1,634,163 1,146,452 2,780,615Jul $249 $197 $228 13 13 13 1,750,163 1,066,425 2,816,588Aug $203 $267 $231 13 14 13 2,125,739 1,580,872 3,706,611Sep $235 $266 $248 12 13 12 1,696,640 1,136,169 2,832,809Oct $244 $241 $243 12 13 12 1,930,558 1,220,095 3,150,653Nov $215 $226 $220 12 13 12 1,645,164 1,121,776 2,766,940Dec $185 $219 $199 12 13 13 1,406,209 923,211 2,329,420Total $205 $209 $207 13 13 13 23,712,863 14,678,815 38,391,678
Average Premium Per Contract Average Contracts Per Trade Transactions
CBOE HOLDINGS, INC. Page 6 2011 MARKET STATISTICS
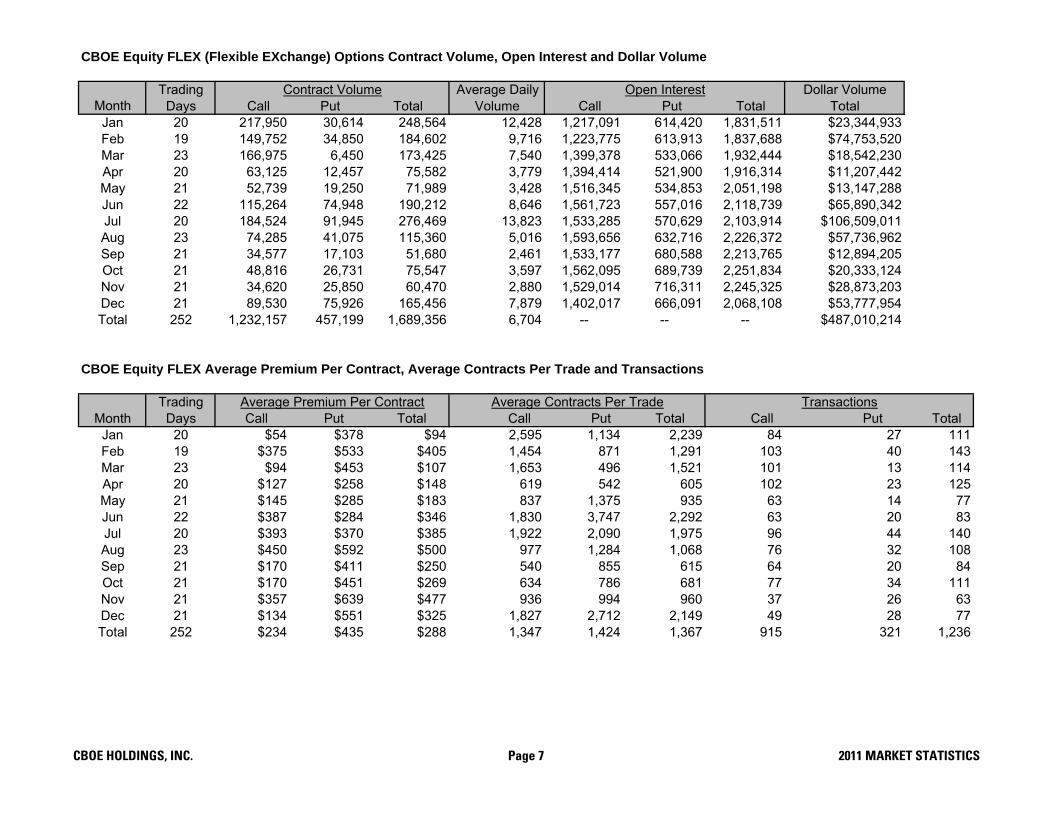
Trading Average Daily Dollar VolumeMonth Days Call Put Total Volume Call Put Total Total
Jan 20 217,950 30,614 248,564 12,428 1,217,091 614,420 1,831,511 $23,344,933Feb 19 149,752 34,850 184,602 9,716 1,223,775 613,913 1,837,688 $74,753,520Mar 23 166,975 6,450 173,425 7,540 1,399,378 533,066 1,932,444 $18,542,230Apr 20 63,125 12,457 75,582 3,779 1,394,414 521,900 1,916,314 $11,207,442May 21 52,739 19,250 71,989 3,428 1,516,345 534,853 2,051,198 $13,147,288Jun 22 115,264 74,948 190,212 8,646 1,561,723 557,016 2,118,739 $65,890,342Jul 20 184,524 91,945 276,469 13,823 1,533,285 570,629 2,103,914 $106,509,011Aug 23 74,285 41,075 115,360 5,016 1,593,656 632,716 2,226,372 $57,736,962Sep 21 34,577 17,103 51,680 2,461 1,533,177 680,588 2,213,765 $12,894,205Oct 21 48,816 26,731 75,547 3,597 1,562,095 689,739 2,251,834 $20,333,124Nov 21 34,620 25,850 60,470 2,880 1,529,014 716,311 2,245,325 $28,873,203Dec 21 89,530 75,926 165,456 7,879 1,402,017 666,091 2,068,108 $53,777,954Total 252 1,232,157 457,199 1,689,356 6,704 -- -- -- $487,010,214
TradingMonth Days Call Put Total Call Put Total Call Put Total
Jan 20 $54 $378 $94 2,595 1,134 2,239 84 27 111Feb 19 $375 $533 $405 1,454 871 1,291 103 40 143Mar 23 $94 $453 $107 1,653 496 1,521 101 13 114Apr 20 $127 $258 $148 619 542 605 102 23 125May 21 $145 $285 $183 837 1,375 935 63 14 77Jun 22 $387 $284 $346 1,830 3,747 2,292 63 20 83Jul 20 $393 $370 $385 1,922 2,090 1,975 96 44 140Aug 23 $450 $592 $500 977 1,284 1,068 76 32 108Sep 21 $170 $411 $250 540 855 615 64 20 84Oct 21 $170 $451 $269 634 786 681 77 34 111Nov 21 $357 $639 $477 936 994 960 37 26 63Dec 21 $134 $551 $325 1,827 2,712 2,149 49 28 77Total 252 $234 $435 $288 1,347 1,424 1,367 915 321 1,236
Average Premium Per Contract Average Contracts Per Trade Transactions
CBOE Equity FLEX (Flexible EXchange) Options Contract Volume, Open Interest and Dollar Volume
Contract Volume Open Interest
CBOE Equity FLEX Average Premium Per Contract, Average Contracts Per Trade and Transactions
CBOE HOLDINGS, INC. Page 7 2011 MARKET STATISTICS
Standard Symbol Stock Total Call Put Total Call Put
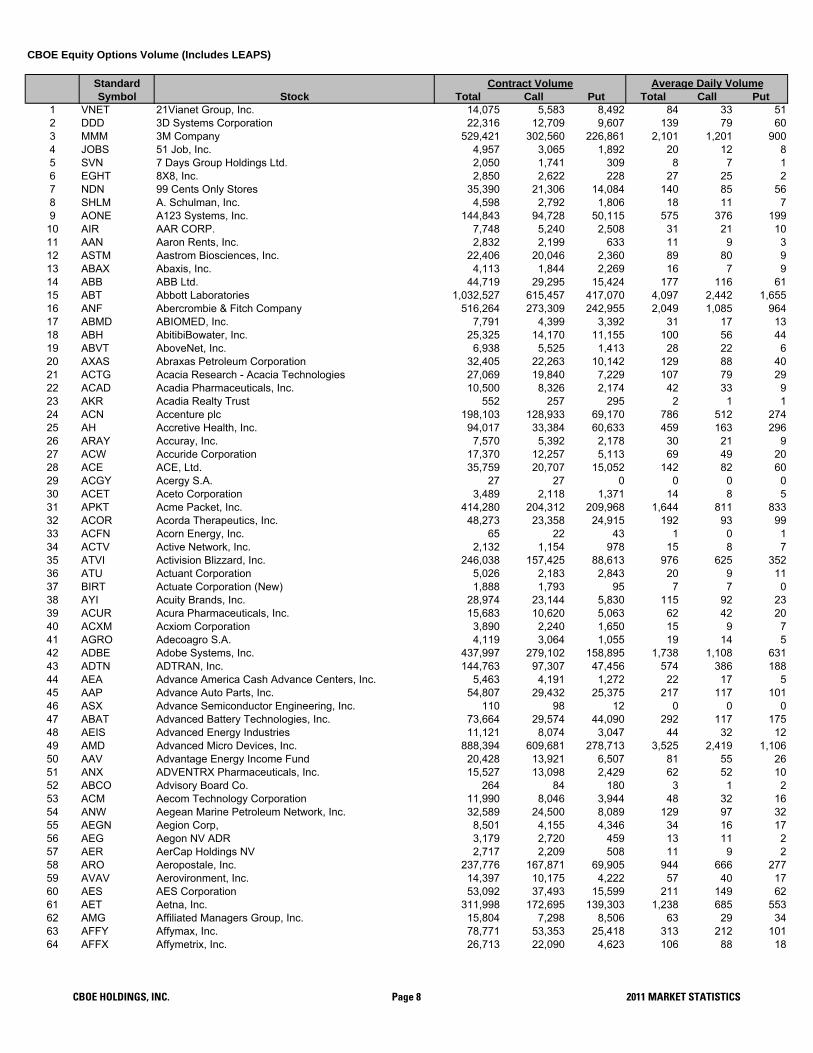
1 VNET 21Vianet Group, Inc. 14,075 5,583 8,492 84 33 512 DDD 3D Systems Corporation 22,316 12,709 9,607 139 79 603 MMM 3M Company 529,421 302,560 226,861 2,101 1,201 9004 JOBS 51 Job, Inc. 4,957 3,065 1,892 20 12 85 SVN 7 Days Group Holdings Ltd. 2,050 1,741 309 8 7 16 EGHT 8X8, Inc. 2,850 2,622 228 27 25 27 NDN 99 Cents Only Stores 35,390 21,306 14,084 140 85 568 SHLM A. Schulman, Inc. 4,598 2,792 1,806 18 11 79 AONE A123 Systems, Inc. 144,843 94,728 50,115 575 376 199
10 AIR AAR CORP. 7,748 5,240 2,508 31 21 1011 AAN Aaron Rents, Inc. 2,832 2,199 633 11 9 312 ASTM Aastrom Biosciences, Inc. 22,406 20,046 2,360 89 80 913 ABAX Abaxis, Inc. 4,113 1,844 2,269 16 7 914 ABB ABB Ltd. 44,719 29,295 15,424 177 116 6115 ABT Abbott Laboratories 1,032,527 615,457 417,070 4,097 2,442 1,65516 ANF Abercrombie & Fitch Company 516,264 273,309 242,955 2,049 1,085 96417 ABMD ABIOMED, Inc. 7,791 4,399 3,392 31 17 1318 ABH AbitibiBowater, Inc. 25,325 14,170 11,155 100 56 4419 ABVT AboveNet, Inc. 6,938 5,525 1,413 28 22 620 AXAS Abraxas Petroleum Corporation 32,405 22,263 10,142 129 88 4021 ACTG Acacia Research - Acacia Technologies 27,069 19,840 7,229 107 79 2922 ACAD Acadia Pharmaceuticals, Inc. 10,500 8,326 2,174 42 33 923 AKR Acadia Realty Trust 552 257 295 2 1 124 ACN Accenture plc 198,103 128,933 69,170 786 512 27425 AH Accretive Health, Inc. 94,017 33,384 60,633 459 163 29626 ARAY Accuray, Inc. 7,570 5,392 2,178 30 21 927 ACW Accuride Corporation 17,370 12,257 5,113 69 49 2028 ACE ACE, Ltd. 35,759 20,707 15,052 142 82 6029 ACGY Acergy S.A. 27 27 0 0 0 030 ACET Aceto Corporation 3,489 2,118 1,371 14 8 531 APKT Acme Packet, Inc. 414,280 204,312 209,968 1,644 811 83332 ACOR Acorda Therapeutics, Inc. 48,273 23,358 24,915 192 93 9933 ACFN Acorn Energy, Inc. 65 22 43 1 0 134 ACTV Active Network, Inc. 2,132 1,154 978 15 8 735 ATVI Activision Blizzard, Inc. 246,038 157,425 88,613 976 625 35236 ATU Actuant Corporation 5,026 2,183 2,843 20 9 1137 BIRT Actuate Corporation (New) 1,888 1,793 95 7 7 038 AYI Acuity Brands, Inc. 28,974 23,144 5,830 115 92 2339 ACUR Acura Pharmaceuticals, Inc. 15,683 10,620 5,063 62 42 2040 ACXM Acxiom Corporation 3,890 2,240 1,650 15 9 741 AGRO Adecoagro S.A. 4,119 3,064 1,055 19 14 542 ADBE Adobe Systems, Inc. 437,997 279,102 158,895 1,738 1,108 63143 ADTN ADTRAN, Inc. 144,763 97,307 47,456 574 386 18844 AEA Advance America Cash Advance Centers, Inc. 5,463 4,191 1,272 22 17 545 AAP Advance Auto Parts, Inc. 54,807 29,432 25,375 217 117 10146 ASX Advance Semiconductor Engineering, Inc. 110 98 12 0 0 047 ABAT Advanced Battery Technologies, Inc. 73,664 29,574 44,090 292 117 17548 AEIS Advanced Energy Industries 11,121 8,074 3,047 44 32 1249 AMD Advanced Micro Devices, Inc. 888,394 609,681 278,713 3,525 2,419 1,10650 AAV Advantage Energy Income Fund 20,428 13,921 6,507 81 55 2651 ANX ADVENTRX Pharmaceuticals, Inc. 15,527 13,098 2,429 62 52 1052 ABCO Advisory Board Co. 264 84 180 3 1 253 ACM Aecom Technology Corporation 11,990 8,046 3,944 48 32 1654 ANW Aegean Marine Petroleum Network, Inc. 32,589 24,500 8,089 129 97 3255 AEGN Aegion Corp, 8,501 4,155 4,346 34 16 1756 AEG Aegon NV ADR 3,179 2,720 459 13 11 257 AER AerCap Holdings NV 2,717 2,209 508 11 9 258 ARO Aeropostale, Inc. 237,776 167,871 69,905 944 666 27759 AVAV Aerovironment, Inc. 14,397 10,175 4,222 57 40 1760 AES AES Corporation 53,092 37,493 15,599 211 149 6261 AET Aetna, Inc. 311,998 172,695 139,303 1,238 685 55362 AMG Affiliated Managers Group, Inc. 15,804 7,298 8,506 63 29 3463 AFFY Affymax, Inc. 78,771 53,353 25,418 313 212 10164 AFFX Affymetrix, Inc. 26,713 22,090 4,623 106 88 18
CBOE Equity Options Volume (Includes LEAPS)
Contract Volume Average Daily Volume
CBOE HOLDINGS, INC. Page 8 2011 MARKET STATISTICS
Standard Symbol Stock Total Call Put Total Call Put
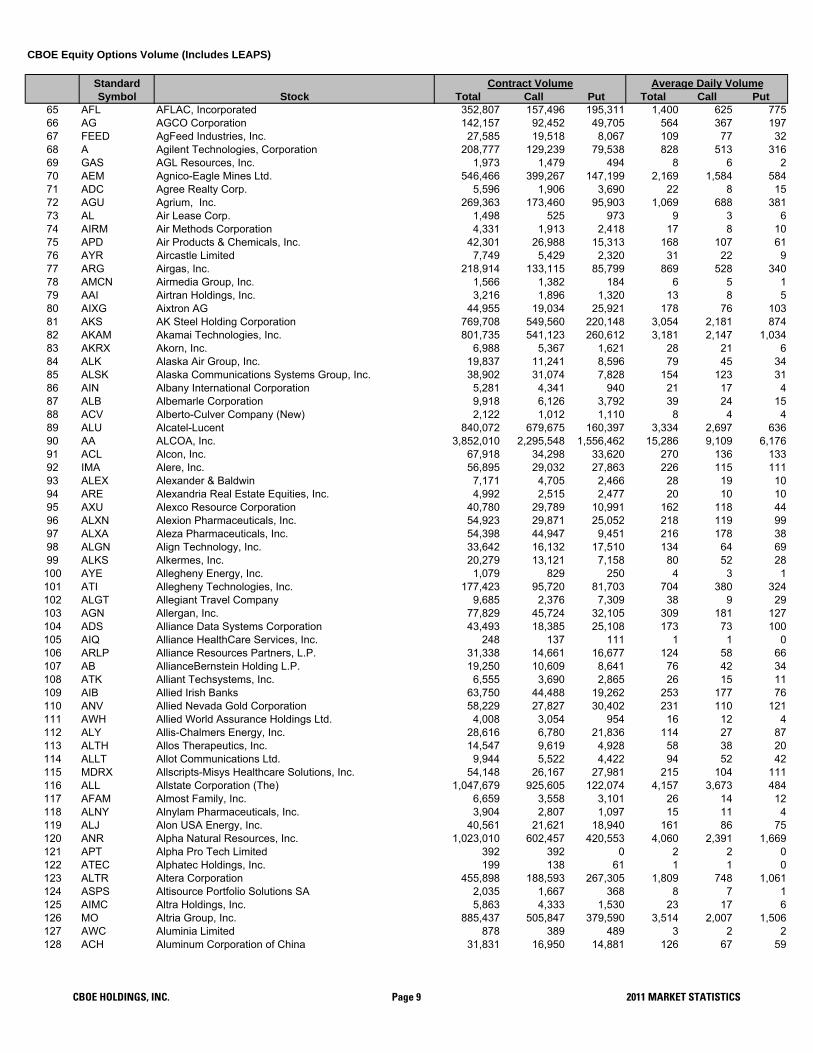
CBOE Equity Options Volume (Includes LEAPS)
Contract Volume Average Daily Volume
65 AFL AFLAC, Incorporated 352,807 157,496 195,311 1,400 625 77566 AG AGCO Corporation 142,157 92,452 49,705 564 367 19767 FEED AgFeed Industries, Inc. 27,585 19,518 8,067 109 77 3268 A Agilent Technologies, Corporation 208,777 129,239 79,538 828 513 31669 GAS AGL Resources, Inc. 1,973 1,479 494 8 6 270 AEM Agnico-Eagle Mines Ltd. 546,466 399,267 147,199 2,169 1,584 58471 ADC Agree Realty Corp. 5,596 1,906 3,690 22 8 1572 AGU Agrium, Inc. 269,363 173,460 95,903 1,069 688 38173 AL Air Lease Corp. 1,498 525 973 9 3 674 AIRM Air Methods Corporation 4,331 1,913 2,418 17 8 1075 APD Air Products & Chemicals, Inc. 42,301 26,988 15,313 168 107 6176 AYR Aircastle Limited 7,749 5,429 2,320 31 22 977 ARG Airgas, Inc. 218,914 133,115 85,799 869 528 34078 AMCN Airmedia Group, Inc. 1,566 1,382 184 6 5 179 AAI Airtran Holdings, Inc. 3,216 1,896 1,320 13 8 580 AIXG Aixtron AG 44,955 19,034 25,921 178 76 10381 AKS AK Steel Holding Corporation 769,708 549,560 220,148 3,054 2,181 87482 AKAM Akamai Technologies, Inc. 801,735 541,123 260,612 3,181 2,147 1,03483 AKRX Akorn, Inc. 6,988 5,367 1,621 28 21 684 ALK Alaska Air Group, Inc. 19,837 11,241 8,596 79 45 3485 ALSK Alaska Communications Systems Group, Inc. 38,902 31,074 7,828 154 123 3186 AIN Albany International Corporation 5,281 4,341 940 21 17 487 ALB Albemarle Corporation 9,918 6,126 3,792 39 24 1588 ACV Alberto-Culver Company (New) 2,122 1,012 1,110 8 4 489 ALU Alcatel-Lucent 840,072 679,675 160,397 3,334 2,697 63690 AA ALCOA, Inc. 3,852,010 2,295,548 1,556,462 15,286 9,109 6,17691 ACL Alcon, Inc. 67,918 34,298 33,620 270 136 13392 IMA Alere, Inc. 56,895 29,032 27,863 226 115 11193 ALEX Alexander & Baldwin 7,171 4,705 2,466 28 19 1094 ARE Alexandria Real Estate Equities, Inc. 4,992 2,515 2,477 20 10 1095 AXU Alexco Resource Corporation 40,780 29,789 10,991 162 118 4496 ALXN Alexion Pharmaceuticals, Inc. 54,923 29,871 25,052 218 119 9997 ALXA Aleza Pharmaceuticals, Inc. 54,398 44,947 9,451 216 178 3898 ALGN Align Technology, Inc. 33,642 16,132 17,510 134 64 6999 ALKS Alkermes, Inc. 20,279 13,121 7,158 80 52 28100 AYE Allegheny Energy, Inc. 1,079 829 250 4 3 1101 ATI Allegheny Technologies, Inc. 177,423 95,720 81,703 704 380 324102 ALGT Allegiant Travel Company 9,685 2,376 7,309 38 9 29103 AGN Allergan, Inc. 77,829 45,724 32,105 309 181 127104 ADS Alliance Data Systems Corporation 43,493 18,385 25,108 173 73 100105 AIQ Alliance HealthCare Services, Inc. 248 137 111 1 1 0106 ARLP Alliance Resources Partners, L.P. 31,338 14,661 16,677 124 58 66107 AB AllianceBernstein Holding L.P. 19,250 10,609 8,641 76 42 34108 ATK Alliant Techsystems, Inc. 6,555 3,690 2,865 26 15 11109 AIB Allied Irish Banks 63,750 44,488 19,262 253 177 76110 ANV Allied Nevada Gold Corporation 58,229 27,827 30,402 231 110 121111 AWH Allied World Assurance Holdings Ltd. 4,008 3,054 954 16 12 4112 ALY Allis-Chalmers Energy, Inc. 28,616 6,780 21,836 114 27 87113 ALTH Allos Therapeutics, Inc. 14,547 9,619 4,928 58 38 20114 ALLT Allot Communications Ltd. 9,944 5,522 4,422 94 52 42115 MDRX Allscripts-Misys Healthcare Solutions, Inc. 54,148 26,167 27,981 215 104 111116 ALL Allstate Corporation (The) 1,047,679 925,605 122,074 4,157 3,673 484117 AFAM Almost Family, Inc. 6,659 3,558 3,101 26 14 12118 ALNY Alnylam Pharmaceuticals, Inc. 3,904 2,807 1,097 15 11 4119 ALJ Alon USA Energy, Inc. 40,561 21,621 18,940 161 86 75120 ANR Alpha Natural Resources, Inc. 1,023,010 602,457 420,553 4,060 2,391 1,669121 APT Alpha Pro Tech Limited 392 392 0 2 2 0122 ATEC Alphatec Holdings, Inc. 199 138 61 1 1 0123 ALTR Altera Corporation 455,898 188,593 267,305 1,809 748 1,061124 ASPS Altisource Portfolio Solutions SA 2,035 1,667 368 8 7 1125 AIMC Altra Holdings, Inc. 5,863 4,333 1,530 23 17 6126 MO Altria Group, Inc. 885,437 505,847 379,590 3,514 2,007 1,506127 AWC Aluminia Limited 878 389 489 3 2 2128 ACH Aluminum Corporation of China 31,831 16,950 14,881 126 67 59
CBOE HOLDINGS, INC. Page 9 2011 MARKET STATISTICS

Standard Symbol Stock Total Call Put Total Call Put
CBOE Equity Options Volume (Includes LEAPS)
Contract Volume Average Daily Volume
129 ALVR Alvarion Limited 4,417 3,905 512 18 15 2130 AMAG AMAG Pharmaceutcals, Inc. 29,782 22,506 7,276 118 89 29131 AMRN Amarin Corporation 737,989 562,051 175,938 2,929 2,230 698132 AMZN Amazon.Com, Inc. 4,643,679 2,322,861 2,320,818 18,427 9,218 9,210133 AMCX AMC Networks, Inc. 2,297 1,364 933 18 11 7134 ACO AMCOL International Corporation 2,926 1,979 947 12 8 4135 DOX Amdocs Ltd. 24,230 14,987 9,243 96 59 37136 AMED Amedisys, Inc. 55,695 33,594 22,101 221 133 88137 AEE Ameren Corporation 9,224 6,753 2,471 37 27 10138 AMRC Ameresco, Inc. 7,210 4,935 2,275 29 20 9139 AMX America Movil S.A.B. de C.V. 125,949 72,063 53,886 500 286 214140 APP American Apparel, Inc. 920 637 283 4 3 1141 AAT American Assets Trust, Inc. 646 460 186 3 2 1142 AXL American Axle & Manufacturing Holdings, Inc. 140,511 94,775 45,736 558 376 181143 ACC American Campus Communities, Inc. 3,792 2,605 1,187 15 10 5144 AGNC American Capital Agency Corporation 341,664 215,299 126,365 1,356 854 501145 MTGE American Capital Mortgage Investment Corp. 1,111 728 383 12 8 4146 ACAS American Capital, Ltd. 189,664 144,433 45,231 753 573 179147 ADY American Dairy, Inc. 21,524 12,675 8,849 85 50 35148 AEO American Eagle Outfitters, Inc. 384,194 274,933 109,261 1,525 1,091 434149 AEP American Electric Power Company, Inc. 142,514 99,419 43,095 566 395 171150 AXP American Express Company 1,094,446 578,760 515,686 4,343 2,297 2,046151 AM American Greetings Corp Class A 6,648 3,407 3,241 26 14 13152 AIG American International Group, Inc. 1,378,134 774,090 604,044 5,469 3,072 2,397153 AMMD American Medical Systems Holdings, Inc. 6,163 2,609 3,554 24 10 14154 AOB American Oriental Bioengineering, Inc. 5,620 2,812 2,808 22 11 11155 APEI American Public Education, Inc. 12,473 5,095 7,378 49 20 29156 ASEI American Science and Engineering, Inc. 3,521 2,188 1,333 14 9 5157 AWR American States Water Co. 1,205 928 277 15 11 3158 AMSC American Superconductor Corp. 212,190 123,951 88,239 842 492 350159 AMT American Tower Corporation CLA 168,763 112,675 56,088 670 447 223160 AWK American Water Works Co., Inc. 5,607 4,099 1,508 22 16 6161 CRMT America's Car-Mart, Inc. 1,221 765 456 5 3 2162 APU AmeriGas Partners, LP 3,505 2,131 1,374 14 8 5163 AGP AMERIGROUP Corporation 28,291 11,929 16,362 112 47 65164 AMP Ameriprise Financial, Inc. 32,437 18,800 13,637 129 75 54165 AMSF Amerisafe, Inc. 678 388 290 3 2 1166 ABC AmerisourceBergen Corporation 47,992 25,521 22,471 190 101 89167 ASCA Ameristar Casinos, Inc. 2,745 2,139 606 11 8 2168 AMN Ameron International Corp. 8,260 3,908 4,352 33 16 17169 AME AMETEK, Inc. 1,747 1,308 439 7 5 2170 AMGN Amgen, Inc. 1,100,929 597,395 503,534 4,369 2,371 1,998171 AMKR Amkor Technology, Inc. 51,587 40,084 11,503 205 159 46172 APH Amphenol Corporation 43,842 16,443 27,399 174 65 109173 AMR AMR Corporation 1,365,571 854,931 510,640 5,419 3,393 2,026174 ASYS Amtech Systems 35,653 24,602 11,051 141 98 44175 AFSI Amtrust Financial Services, Inc. 8,141 4,897 3,244 32 19 13176 AMLN Amylin Pharmaceuticals, Inc. 208,587 141,462 67,125 828 561 266177 APC Anadarko Petroleum Corporation 831,691 533,775 297,916 3,300 2,118 1,182178 ANAD ANADIGICS, Inc. 5,448 3,347 2,101 22 13 8179 ANDS Anadys Pharmaceuticals, Inc. 8,186 7,683 503 32 30 2180 ADI Analog Devices, Inc. 102,260 66,856 35,404 406 265 140181 ALOG Analogic Corporation 1,847 730 1,117 7 3 4182 ACOM Ancestry.com, Inc. 66,263 40,338 25,925 263 160 103183 ANGI Angie's List, Inc. 6,431 4,296 2,135 292 195 97184 AU AngloGold Ashanti Limited ADS 84,147 48,838 35,309 334 194 140185 BUD Anheuser-Busch InBev 80,053 46,110 33,943 318 183 135186 AXE Anixter International, Inc. 7,257 4,858 2,399 29 19 10187 ANN ANN Inc. 141,751 85,011 56,740 563 337 225188 NLY Annaly Capital Management, Inc. 916,671 503,228 413,443 3,638 1,997 1,641189 ANSS ANSYS, Inc. 10,855 9,915 940 43 39 4190 ANH Anworth Mortgage Asset Corporation 15,098 6,597 8,501 60 26 34191 AOL AOL, Inc. 83,798 53,423 30,375 333 212 121192 AOC AON Corporation 48,541 26,052 22,489 193 103 89
CBOE HOLDINGS, INC. Page 10 2011 MARKET STATISTICS

Standard Symbol Stock Total Call Put Total Call Put
CBOE Equity Options Volume (Includes LEAPS)
Contract Volume Average Daily Volume
193 APAC APAC Customer Services, Inc. 22,392 727 21,665 89 3 86194 APA Apache Corporation 587,040 346,315 240,725 2,330 1,374 955195 AIV Apartment Investment & Management Company 1,527 1,076 451 6 4 2196 APOG Apogee Enterprises, Inc. 1,195 810 385 5 3 2197 ARI Apollo Commercial Real Estate Finance, Inc. 1,841 1,703 138 7 7 1198 APO Apollo Global Management LLC 2,404 1,080 1,324 13 6 7199 APOL Apollo Group, Inc. 399,426 209,390 190,036 1,585 831 754200 AINV Apollo Investment Corporation 26,696 17,429 9,267 106 69 37201 AMTG Apollo Residential Mortgage, Inc. 244 202 42 2 2 0202 APWR A-Power Energy Generation Systems Ltd. 32,744 16,944 15,800 130 67 63203 AAPL Apple, Inc. 21,570,675 12,685,797 8,884,878 85,598 50,340 35,257204 AIT Applied Industrial Technologies, Inc. 1,582 1,081 501 6 4 2205 AMAT Applied Materials, Inc. 623,028 385,446 237,582 2,472 1,530 943206 AMCC Applied Micro Circuits Corporation 14,768 9,455 5,313 59 38 21207 APSG Applied Signal Technology, Inc. 2,683 171 2,512 11 1 10208 AREX Approach Resources, Inc. 2,535 2,260 275 10 9 1209 ATR AptarGroup, Inc. 2,269 1,426 843 9 6 3210 WTR Aqua America, Inc. 3,927 2,803 1,124 16 11 4211 ARB Arbitron, Inc. 1,116 270 846 4 1 3212 MT Arcelor Mittal 590,705 411,029 179,676 2,344 1,631 713213 ACGL Arch Capital Group Ltd. 7,854 5,080 2,774 31 20 11214 ARJ Arch Chemicals, Inc. 4,064 1,131 2,933 16 4 12215 ACI Arch Coal, Inc. 604,190 359,019 245,171 2,398 1,425 973216 ADM Archer-Daniels-Midland Company 489,413 279,636 209,777 1,942 1,110 832217 ARCO Arcos Dorados Holdings, Inc. 44,873 29,056 15,817 256 166 90218 RDEA Ardea Biosciences, Inc. 8,266 2,822 5,444 33 11 22219 ARNA Arena Pharmaceuticals, Inc. 98,228 78,838 19,390 390 313 77220 ARCC Ares Capital Corporation 32,136 22,896 9,240 128 91 37221 ARIA ARIAD Pharmaceuticals, Inc. 500,811 265,788 235,023 1,987 1,055 933222 ARBA Ariba, Inc. 31,019 15,642 15,377 123 62 61223 ABFS Arkansas Best Corporation 11,588 8,796 2,792 46 35 11224 ARMH ARM Holdings plc (New) 311,681 170,929 140,752 1,237 678 559225 ARR ARMOUR Residential REIT, Inc. 28,126 18,328 9,798 135 88 47226 AWI Armstrong World Industries, Inc. 6,811 2,636 4,175 27 10 17227 ARQL ArQule, Inc. 3,129 2,671 458 12 11 2228 ARRS Arris Group, Inc. 11,381 4,774 6,607 45 19 26229 ARW Arrow Electronics, Inc. 13,599 9,823 3,776 54 39 15230 ARTC ArthroCare Corporation 1,732 1,277 455 7 5 2231 AJG Arthur J. Gallagher & Co. 702 465 237 3 2 1232 ART Artio Global Investors, Inc. 1,103 978 125 4 4 0233 ARUN Aruba Networks, Inc. 479,903 243,611 236,292 1,904 967 938234 ASA ASA Limited 15,154 9,797 5,357 60 39 21235 ABG Asbury Automotive Group, Inc. 13,087 8,610 4,477 52 34 18236 ASTI Ascent Solar Technologies, Inc. 5,027 410 4,617 20 2 18237 AHT Ashford Hospitality-Trust 24,768 17,429 7,339 98 69 29238 ASH Ashland, Inc. 43,629 27,197 16,432 173 108 65239 ASIA Asiainfo Holdings, Inc. 56,269 22,638 33,631 223 90 133240 ASML ASM Holding N.V. 34,060 20,711 13,349 135 82 53241 ASMI ASM International N.V. 4,578 2,672 1,906 18 11 8242 AHL Aspen Insurance Holdings Ltd. 3,940 2,078 1,862 16 8 7243 AZPN Aspen Technology, Inc. 1,615 1,479 136 6 6 1244 APPY AspenBio Pharma, Inc. 571 132 439 2 1 2245 ASBC Associated Banc-Corp. 3,667 3,277 390 15 13 2246 AIZ Assurant, Inc. 7,666 5,205 2,461 30 21 10247 AGO Assured Guaranty Ltd. 289,452 188,466 100,986 1,149 748 401248 ASTE Astec Industries, Inc. 1,966 1,435 531 8 6 2249 ASTX Astex Pharmaceuticals, Inc. 11,302 4,713 6,589 45 19 26250 AF Astoria Financial Corporation 6,107 3,718 2,389 24 15 9251 AZN AstraZeneca plc ADS 73,890 35,335 38,555 293 140 153252 T AT&T Corporation 2,385,124 1,427,603 957,521 9,465 5,665 3,800253 ATHN athenahealth, Inc. 40,248 24,223 16,025 160 96 64254 ATHR Atheros Communications 117,031 91,098 25,933 464 362 103255 ATHX Athersys, Incorp. 484 254 230 2 1 1256 AT Atlantic Power Corporation 9,285 4,167 5,118 37 17 20
CBOE HOLDINGS, INC. Page 11 2011 MARKET STATISTICS

Standard Symbol Stock Total Call Put Total Call Put
CBOE Equity Options Volume (Includes LEAPS)
Contract Volume Average Daily Volume
257 ATNI Atlantic-Tele Network, Inc. 1,153 461 692 5 2 3258 AAWW Atlas Air Worldwide Holdings, Inc. 12,593 7,682 4,911 50 30 19259 ATLS Atlas Energy, L.P. 80,270 54,326 25,944 319 216 103260 AHD Atlas Pipeline Holdings LP 80,351 36,791 43,560 319 146 173261 APL Atlas Pipeline Partners, LP 42,685 32,097 10,588 169 127 42262 ATML Atmel Corporation 168,183 129,274 38,909 667 513 154263 ATMI ATMI, Inc. 3,943 2,693 1,250 16 11 5264 ATO Atmos Energy Corporation 1,402 1,100 302 6 4 1265 ATPG ATP Oil & Gas Corporation 528,067 323,070 204,997 2,096 1,282 813266 ATW Atwood Oceanics, Inc. 15,881 9,826 6,055 63 39 24267 AUO AU Optronics Corp. 17,245 15,841 1,404 68 63 6268 AZC Augusta Resource Corporation 23,946 21,163 2,783 95 84 11269 AUQ AuRico Gold, Inc. 64,369 53,628 10,741 255 213 43270 AZK Aurizon Mines Ltd. 12,827 9,553 3,274 51 38 13271 AUTH AuthenTec, Inc. 2,259 2,192 67 9 9 0272 ADSK Autodesk, Inc. 193,035 112,110 80,925 766 445 321273 ALV Autoliv, Inc. 11,367 6,190 5,177 45 25 21274 ADP Automatic Data Processing, Inc. 115,239 78,169 37,070 457 310 147275 AN AutoNation, Inc. 25,373 14,502 10,871 101 58 43276 AZO Autozone, Inc. 121,131 56,578 64,553 481 225 256277 AUXL Auxilium Pharmaceuticals, Inc. 22,941 16,416 6,525 91 65 26278 AVB Avalonbay Communities, Inc. 56,079 34,451 21,628 223 137 86279 AVNR Avanir Pharmaceuticals 336,482 302,968 33,514 1,335 1,202 133280 AVTR Avatar Holdings, Inc. 1,914 851 1,063 8 3 4281 AVEO AVEO Pharmaceuticals, Inc. 14,270 7,937 6,333 84 47 37282 AVY Avery Dennison Corporation 15,829 9,376 6,453 63 37 26283 AVL Aviall, Inc. 123,595 92,655 30,940 490 368 123284 AVID Avid Technology, Inc. 5,564 4,221 1,343 22 17 5285 CAR Avis Budget Group, Inc. 139,554 109,693 29,861 554 435 118286 AVA Avista Corporation (New) 232 133 99 1 1 0287 AVT Avnet, Inc. 22,714 11,162 11,552 90 44 46288 AVP Avon Products, Inc. 213,083 136,612 76,471 846 542 303289 AVX AVX Corporation 697 481 216 3 2 1290 ACLS Axcelis Technologies, Inc. 3,156 2,579 577 13 10 2291 AXS Axis Capital Holdings Limited 546 255 291 2 1 1292 AXTI AXT, Inc. 10,361 7,811 2,550 50 37 12293 AZZ AZZ, Incorporated 3,244 2,040 1,204 13 8 5294 BGS B&G Foods, Inc. 32,525 22,796 9,729 129 90 39295 BWC Babcock & Wilcox Co. 11,825 7,789 4,036 47 31 16296 BMI Badger Meter, Inc. 2,055 1,616 439 8 6 2297 BIDU Baidu, Inc. ADS 4,476,023 2,598,873 1,877,150 17,762 10,313 7,449298 BHI Baker Hughes, Incorporated 571,538 331,836 239,702 2,268 1,317 951299 BCPC Balchem Corp. 4,384 3,152 1,232 17 13 5300 BLL Ball Corporation 14,382 11,611 2,771 57 46 11301 BTN Ballantyne Strong, Inc. 5 1 4 0 0 0302 BYI Bally Technologies, Inc. 57,808 28,433 29,375 229 113 117303 BALT Baltic Trading Limited 7,117 4,015 3,102 28 16 12304 BBV Banco Bibao Vizcaya SP ADR 101,444 49,132 52,312 403 195 208305 BBD Banco Bradesco 116,166 62,887 53,279 461 250 211306 ITUB Banco Itaú Holding Financeira S.A. 257,043 154,482 102,561 1,020 613 407307 BLX Banco Latinoamericano de Comercio Exterior 324 196 128 4 2 2308 BSBR Banco Santander Brasil SA 27,110 15,755 11,355 108 63 45309 SAN Banco Santander Chile 30,871 2,647 28,224 123 11 112310 STD Banco Santander SA 654,730 288,337 366,393 2,598 1,144 1,454311 BXS BancorpSouth, Inc. 13,627 6,628 6,999 54 26 28312 BKMU Bank Mutual Corp. 295 95 200 1 0 1313 BAC Bank of America Corporation 22,655,201 13,711,648 8,943,553 89,902 54,411 35,490314 IRE Bank of Ireland 106,918 64,732 42,186 424 257 167315 BMO Bank of Montreal 78,497 61,919 16,578 311 246 66316 BNS Bank of Nova Scotia 17,619 11,039 6,580 70 44 26317 BBX BankAtlantic Bancorp., Inc. Class A (New) 854 408 446 3 2 2318 RATE Bankrate, Inc. 1,995 495 1,500 8 2 6319 BKU BankUnited, Inc. 1,050 549 501 5 2 2320 BANR Banner Corporation 9,405 8,679 726 37 34 3
CBOE HOLDINGS, INC. Page 12 2011 MARKET STATISTICS

Standard Symbol Stock Total Call Put Total Call Put
CBOE Equity Options Volume (Includes LEAPS)
Contract Volume Average Daily Volume
321 BAA Banro Corporation 6,175 5,836 339 25 24 1322 BCS Barclays PLC 278,943 141,975 136,968 1,107 563 544323 BCR Bard (C.R.), Inc. 12,210 8,305 3,905 48 33 15324 BKS Barnes & Noble, Inc. 141,159 81,388 59,771 560 323 237325 B Barnes Group, Inc. 4,373 2,506 1,867 17 10 7326 ABX Barrick Gold Corporation 1,696,027 1,102,998 593,029 6,730 4,377 2,353327 BAS Basic Energy Services, Inc. 20,890 11,298 9,592 83 45 38328 BAX Baxter International, Inc. 512,641 362,977 149,664 2,034 1,440 594329 BTE Baytex Energy Corp. 12,023 7,637 4,386 48 30 17330 BBT BB&T Corporation 338,101 211,870 126,231 1,342 841 501331 BCE BCE, Inc. 4,950 2,968 1,982 20 12 8332 BEAV BE Aerospace, Inc. 18,900 12,990 5,910 75 52 23333 BECN Beacon Roofing Supply, Inc. 3,490 1,652 1,838 14 7 7334 BEAM Beam Inc. 38,099 23,479 14,620 151 93 58335 BZH Beazer Homes USA, Inc. 77,317 57,100 20,217 307 227 80336 BEBE bebe stores, inc. 21,738 13,559 8,179 86 54 32337 BEC Beckman Coulter, Inc. 60,000 33,753 26,247 238 134 104338 BDX Becton Dickinson & Company 24,248 10,589 13,659 96 42 54339 BBBY Bed Bath & Beyond, Inc. 221,317 129,981 91,336 878 516 362340 BDC Belden, Inc. 1,865 1,036 829 7 4 3341 BMS Bemis Company 7,947 6,391 1,556 32 25 6342 BRK/B Berkshire Hathaway, Inc. 600,297 318,499 281,798 2,382 1,264 1,118343 BRY Berry Petroleum Company Cl A 8,453 4,840 3,613 34 19 14344 BBY Best Buy Co., Inc. 915,838 548,884 366,954 3,634 2,178 1,456345 BHP BHP Billiton Limited 529,938 213,813 316,125 2,103 848 1,254346 BBL BHP Billiton plc 6,179 3,752 2,427 25 15 10347 BGFV Big 5 Sporting Goods Corporation 2,457 1,244 1,213 10 5 5348 BIG Big Lots, Inc. 237,754 164,766 72,988 943 654 290349 BBND BigBand Networks, Inc. 310 307 3 1 1 0350 BBG Bill Barrett Corporation 6,444 3,586 2,858 26 14 11351 BCRX BioCryst Pharmaceuticals, Inc. 9,058 7,479 1,579 36 30 6352 BIOD Biodel, Inc. 38,778 29,249 9,529 154 116 38353 BDSI BioDelivery Sciences International, Inc. 19,959 15,125 4,834 79 60 19354 BIIB BIOGEN IDEC, Inc. 183,503 100,875 82,628 728 400 328355 BMRN BioMarin Pharmaceutical, Inc. 7,774 6,190 1,584 31 25 6356 BMR Biomed Realty Trust 4,422 2,448 1,974 18 10 8357 BMTI BioMimetic Therapeutics, Inc. 83,059 47,633 35,426 330 189 141358 BIO Bio-Rad Laboratories, Inc. 4,183 1,312 2,871 17 5 11359 BRLI Bio-Reference Laboratories, Inc. 4,753 2,374 2,379 19 9 9360 BPAX BioSante Pharmaceuticals, Inc. 213,728 171,962 41,766 848 682 166361 BIOS BioScripp, Inc. 6,516 5,005 1,511 26 20 6362 BJRI BJ's Restaurant, Inc. 30,441 16,264 14,177 121 65 56363 BJ BJ's Wholesale Club, Inc. 255,748 175,988 79,760 1,015 698 317364 BBOX Black Box Corporation 661 346 315 3 1 1365 BBBB Blackboard, Inc. 96,154 62,435 33,719 382 248 134366 BKCC BlackRock Kelso Capital Corp. 17,869 10,664 7,205 71 42 29367 BLK BlackRock, Inc. 55,216 20,903 34,313 219 83 136368 HRB Block (H & R), Inc. 291,640 108,421 183,219 1,157 430 727369 BLT Blount International, Inc. 1,343 837 506 5 3 2370 BCSI Blue Coat Systems, Inc. 79,063 44,983 34,080 314 179 135371 NILE Blue Nile, Inc. 47,493 21,216 26,277 188 84 104372 BPHX Bluephoenix Solutions Ltd. 2 2 0 0 0 0373 BMC BMC Software, Inc. 80,414 54,328 26,086 319 216 104374 BJGP BMP Sunstone Corporation 133 133 0 1 1 0375 BWP Boardwalk Pipeline Partners, LP 7,934 5,125 2,809 31 20 11376 BOBE Bob Evans Farms, Inc. 6,745 4,501 2,244 27 18 9377 BA Boeing Company (The) 1,228,708 674,545 554,163 4,876 2,677 2,199378 BZ Boise, Incorp. 76,227 54,721 21,506 302 217 85379 BOKF BOK Financial Corporation 806 241 565 3 1 2380 BONA Bona Film Group Ltd. 1,272 395 877 5 2 4381 BAH Booz Allen Hamilton Corp. 5,247 4,415 832 21 18 3382 BGP Borders Group, Inc. 12,139 5,296 6,843 48 21 27383 BWA BorgWarner, Inc. 41,386 26,517 14,869 164 105 59384 SAM Boston Beer Company, Inc. 19,223 8,834 10,389 76 35 41
CBOE HOLDINGS, INC. Page 13 2011 MARKET STATISTICS

Standard Symbol Stock Total Call Put Total Call Put
CBOE Equity Options Volume (Includes LEAPS)
Contract Volume Average Daily Volume
385 BXP Boston Properties, Inc. 12,535 5,367 7,168 50 21 28386 BSX Boston Scientific Corporation 410,213 260,341 149,872 1,628 1,033 595387 EPAY Bottomline Technologies, Inc. 1,792 1,240 552 7 5 2388 BYD Boyd Gaming Corporation 111,884 68,757 43,127 444 273 171389 BP BP p.l.c. 2,527,873 1,585,270 942,603 10,031 6,291 3,740390 BPT BP Prudhoe Bay Royalty Trust 15,461 8,540 6,921 61 34 27391 BRC Brady Corporation 1,117 696 421 4 3 2392 BDN Brandywine Realty Trust 2,926 2,611 315 12 10 1393 BRP Brasil Telecom S.A. 1,783 707 1,076 7 3 4394 BAK Braskem S.A. 8,112 2,708 5,404 32 11 21395 BRE BRE Properties, Inc. 656 435 221 3 2 1396 BBEP BreitBurn Energy Partners LP 22,545 17,125 5,420 89 68 22397 BRFS BRF-Brasil Foods SA 45,666 33,064 12,602 181 131 50398 BPI Bridgepoint Education, Inc. 74,230 35,989 38,241 295 143 152399 BGG Briggs & Stratton 6,859 4,925 1,934 27 20 8400 BEXP Brigham Exploration Company 244,735 168,993 75,742 971 671 301401 CELL Brightpoint, Inc. 2,258 1,686 572 9 7 2402 EAT Brinker International, Inc. 24,090 8,427 15,663 96 33 62403 BMY Bristol-Myers Squibb Company 1,293,145 810,378 482,767 5,132 3,216 1,916404 BRS Bristow Group, Inc. 3,424 775 2,649 14 3 11405 BTI British American Tobacco p.l.c. 15,395 11,017 4,378 61 44 17406 BRCM Broadcom, Inc. 1,011,896 643,107 368,789 4,015 2,552 1,463407 BR Broadridge Financial Solutions LLC 4,580 1,931 2,649 18 8 11408 BWEN Broadwind Energy, Inc. 5,539 5,011 528 22 20 2409 BRCD Brocade Communications Systems, Inc. 612,773 445,579 167,194 2,432 1,768 663410 BRNC Bronco Drilling Company, Inc. 8,667 6,527 2,140 34 26 8411 BKD Brookdale Senior Living, Inc. 20,251 11,034 9,217 80 44 37412 BAM Brookfield Asset Management, Inc. 2,451 1,195 1,256 10 5 5413 BHS Brookfield Homes Corporation 1,055 495 560 4 2 2414 BIP Brookfield Infrastructure Partners LP 6,968 3,122 3,846 28 12 15415 BPO Brookfield Office Properties, Inc. 7,668 1,497 6,171 30 6 24416 BRKS Brooks Automation, Inc. 4,744 3,427 1,317 19 14 5417 BRO Brown & Brown, Inc. (New) 2,817 2,466 351 11 10 1418 BF/B Brown-Forman Corporation 2,645 1,669 976 10 7 4419 BRKR Bruker Corporation 12,913 7,839 5,074 51 31 20420 BC Brunswick Corporation 31,933 15,881 16,052 127 63 64421 BW Brush Engineered Materials, Inc. 1,710 990 720 7 4 3422 BSDM BSD Medical Corporation 29,723 21,933 7,790 118 87 31423 BSQR BSQUARE Corporation 10,740 8,685 2,055 43 34 8424 BPL Buckeye Partners, LP 21,861 13,305 8,556 87 53 34425 BKI Buckeye Technologies, Inc. 45,551 21,813 23,738 181 87 94426 BUCY Bucyrus International, Inc. 26,639 12,692 13,947 106 50 55427 BWLD Buffalo Wild Wings, Inc. 73,171 35,854 37,317 290 142 148428 BBW Build-A-Bear-Workshop 8,435 7,980 455 33 32 2429 BG Bunge Limited 238,761 151,876 86,885 947 603 345430 CHRW C H Robinson Worldwide, Inc. 88,693 60,933 27,760 352 242 110431 CA CA, Inc. 76,542 40,966 35,576 304 163 141432 CAB Cabela's, Incorporated - Cl A 14,010 6,817 7,193 56 27 29433 CVC Cablevision Systems Corporation 65,077 38,426 26,651 258 152 106434 CCMP Cabot Microelectronics Corporation 19,314 2,312 17,002 77 9 67435 COG Cabot Oil & Gas Corp. 145,893 79,337 66,556 579 315 264436 CAI CACI International Inc. Class A 10,590 5,812 4,778 42 23 19437 CDNS Cadence Design Systems, Inc. 24,231 14,297 9,934 96 57 39438 CADX Cadence Pharmaceuticals, Inc. 112,791 67,393 45,398 448 267 180439 CDZI Cadiz, Inc. 2,343 1,698 645 9 7 3440 DVR Cal Dive International, Inc. 1,701 1,434 267 7 6 1441 CLMS Calamos Asset Management 5,637 3,746 1,891 22 15 8442 CCC Calgon Carbon Corporation (New) 6,225 4,628 1,597 25 18 6443 CPKI California Pizza Kitchen, Inc. 25,107 12,419 12,688 100 49 50444 CWT California Water Service Group 1,008 670 338 4 3 1445 CALX Calix, Inc. 57,612 39,021 18,591 254 172 82446 ELY Callaway Golf Company 5,459 3,173 2,286 22 13 9447 CPE Callon Petroleum Company 11,419 5,848 5,571 45 23 22448 CALM Cal-Maine Foods, Inc. 10,698 5,838 4,860 42 23 19
CBOE HOLDINGS, INC. Page 14 2011 MARKET STATISTICS

Standard Symbol Stock Total Call Put Total Call Put
CBOE Equity Options Volume (Includes LEAPS)
Contract Volume Average Daily Volume
449 CPN Calpine Corporation 64,659 41,937 22,722 257 166 90450 CLMT Calumet Specialty Products Partners, LP 21,408 8,798 12,610 85 35 50451 CPT Camden Property Trust 1,767 1,131 636 7 4 3452 CCJ Cameco Corporation 493,448 304,360 189,088 1,958 1,208 750453 CIS Camelot Information Systems, Inc. 68,908 34,932 33,976 278 141 137454 CAM Cameron International Corporation 159,367 97,621 61,746 632 387 245455 CPB Campbell Soup Company 60,079 35,935 24,144 238 143 96456 CCG Campus Crest Communities, Inc. 594 285 309 2 1 1457 CM Canadian Imperial Bank of Commerce 28,343 18,044 10,299 112 72 41458 CNI Canadian National Railway Company 28,354 19,476 8,878 113 77 35459 CNQ Canadian Natural Resources Ltd. 228,272 134,195 94,077 906 533 373460 CP Canadian Pacific Railway Limited New 19,713 14,052 5,661 78 56 22461 CSIQ Canadian Solar, Inc. 100,179 69,147 31,032 398 274 123462 CAJ Canon, Inc. 5,960 3,378 2,582 24 13 10463 CMN Cantel Medical Corp. 794 462 332 3 2 1464 CPLA Capella Education Company 12,772 4,898 7,874 51 19 31465 CGC Capital Gold Corporation 2,014 1,529 485 8 6 2466 COF Capital One Financial Corporation 380,094 183,316 196,778 1,508 727 781467 CPLP Capital Product Partners LP 5,089 3,907 1,182 20 16 5468 CT Capital Trust, Inc 2,069 1,939 130 13 12 1469 CSE CapitalSource, Inc. 22,966 10,971 11,995 91 44 48470 CFFN Capitol Federal Financial 9,022 3,929 5,093 36 16 20471 CMO Capstead Mortgage Corp. 6,225 2,827 3,398 25 11 13472 CRR CARBO Ceramics, Inc. 47,948 19,005 28,943 190 75 115473 CRDC Cardica, Inc. 680 384 296 3 2 1474 CAH Cardinal Health, Inc. 57,096 37,775 19,321 227 150 77475 CRME Cardiome Pharma Corp. 3,422 2,768 654 14 11 3476 BEAT CardioNet, Inc. 3,124 1,899 1,225 12 8 5477 CATM Cardtronics, Inc. 11,762 7,037 4,725 47 28 19478 CECO Career Education Corporation 103,233 45,553 57,680 410 181 229479 CFN CareFusion Corporation 27,198 21,801 5,397 108 87 21480 CBOU Caribou Coffee Co., Inc. 26,723 21,856 4,867 234 192 43481 KMX CarMax, Inc. 76,864 40,095 36,769 305 159 146482 CKEC Carmike Cinemas, Inc. 7,791 5,720 2,071 31 23 8483 CCL Carnival Corporation (Class A) 277,716 138,809 138,907 1,102 551 551484 CUK Carnival plc 1,863 806 1,057 7 3 4485 CRS Carpenter Technology Corporation 15,058 10,833 4,225 60 43 17486 CRZO Carrizo Oil & Gas, Inc. 44,746 28,320 16,426 178 112 65487 CRI Carter's, Inc. 25,932 11,373 14,559 103 45 58488 CASY Casey's General Stores, Inc. 6,989 3,735 3,254 28 15 13489 CSH Cash America International, Inc. 14,940 9,896 5,044 59 39 20490 CMRG Casual Male Retail Group, Inc. 31 2 29 0 0 0491 CHSI Catalyst Health Solutions, Inc. 11,227 7,566 3,661 45 30 15492 CAT Caterpillar, Inc. 2,768,386 1,439,870 1,328,516 10,986 5,714 5,272493 CAVM Cavium Networks, Inc. 123,205 56,045 67,160 489 222 267494 CBEY Cbeyond, Inc. 450 275 175 2 1 1495 CBL CBL & Associates Properties, Inc. 11,416 8,468 2,948 45 34 12496 CBOE CBOE Holdings, Inc. 201,470 153,259 48,211 799 608 191497 CBG CBRE Group, Inc. Class A 60,703 33,174 27,529 241 132 109498 CBS CBS Corporation 264,257 151,635 112,622 1,049 602 447499 CBS.A CBS Corporation Class A 183 82 101 1 0 0500 CDCAQ CDC Corporation Cl A 7,716 6,121 1,595 31 24 6501 CDI CDI Corporation 2,067 1,545 522 8 6 2502 CEC CEC Entertainment, Inc. 6,867 3,154 3,713 27 13 15503 FUN Cedar Fair LP 5,956 4,543 1,413 24 18 6504 CE Celanese Corporation 81,064 51,310 29,754 322 204 118505 CRA Celera Corporation 18,133 4,243 13,890 72 17 55506 CLS Celestica, Inc. 9,130 6,108 3,022 36 24 12507 CELG Celgene Corporation 497,555 327,400 170,155 1,974 1,299 675508 CTIC Cell Therapeutics, Inc. 126,007 121,127 4,880 500 481 19509 CEL Cellcom Israel Ltd. 20,096 10,890 9,206 80 43 37510 CLDX Celldex Therapeutics, Inc. 25,020 17,810 7,210 99 71 29511 CLSN Celsion Corporation 254,812 210,825 43,987 1,011 837 175512 CX Cemex, S.A.B. de C.V. 251,150 99,684 151,466 997 396 601
CBOE HOLDINGS, INC. Page 15 2011 MARKET STATISTICS

Standard Symbol Stock Total Call Put Total Call Put
CBOE Equity Options Volume (Includes LEAPS)
Contract Volume Average Daily Volume
513 CVE Cenovus Energy, Inc. 49,833 22,958 26,875 198 91 107514 CNC Centene Corporation 6,380 4,802 1,578 25 19 6515 CNP CenterPoint Energy, Inc. 31,900 27,392 4,508 127 109 18516 EBR/B Centrais Electricas Brasileiras S ADR 216 160 56 1 1 0517 EBR Centrais Electricas Brasileria SA 2,020 1,122 898 8 4 4518 CEDC Central European Distribution Corporation 246,213 80,319 165,894 977 319 658519 CETV Central European Media Enterprises Ltd. 24,808 14,699 10,109 98 58 40520 CENTA Central Garden & Pet Co. 381 66 315 2 0 1521 CPF Central Pacific Financial Corp. 28,709 5,698 23,011 114 23 91522 CENX Century Aluminum Company (New) 101,964 64,903 37,061 405 258 147523 CTL Centurytel, Inc. 178,657 124,029 54,628 709 492 217524 CEPH Cephalon, Inc. 348,244 207,368 140,876 1,382 823 559525 CPHD Cepheid, Inc. 12,239 7,369 4,870 49 29 19526 CRDN Ceradyne, Inc. 14,143 8,647 5,496 56 34 22527 CRNT Ceragon Networks Ltd. 8,751 5,480 3,271 35 22 13528 CERP Cereplast, Inc. 5,685 4,173 1,512 23 17 6529 CERN Cerner Corporation 83,591 37,625 45,966 332 149 182530 CERS Cerus Corp. 2,765 2,680 85 11 11 0531 CF CF Industries Holdings, Inc. 410,103 246,705 163,398 1,627 979 648532 GIB CGI Group, Inc. 2,383 1,815 568 9 7 2533 CGV CGV Veritas 1,838 1,160 678 7 5 3534 CYOU Changyou.com Ltd. 18,239 12,250 5,989 72 49 24535 CRL Charles River Laboratories International, Inc. 5,839 4,107 1,732 23 16 7536 CHRS Charming Shoppes, Inc. 9,942 9,000 942 39 36 4537 GTLS Chart Industries, Inc. 33,363 25,809 7,554 132 102 30538 CHTR Charter Communications, Inc. 525 296 229 2 1 1539 CHKP Check Point Software Technologies Ltd. 107,180 66,410 40,770 425 264 162540 CAKE Cheesecake Factory Incorporated (The) 73,928 38,249 35,679 293 152 142541 CHTP Chelsea Therapeutics International 60,912 23,153 37,759 242 92 150542 CHE Chemed Corporation 7,695 2,226 5,469 31 9 22543 CHMT Chemtura Corp. 35,800 20,900 14,900 142 83 59544 CQP Cheniere Energy Partners, LP 36,660 22,774 13,886 145 90 55545 LNG Cheniere Energy, Inc. 562,933 442,144 120,789 2,234 1,755 479546 CHK Chesapeake Energy Corporation 1,807,439 1,238,126 569,313 7,172 4,913 2,259547 CHKR Chesapeake Granite Wash 2,382 1,152 1,230 108 52 56548 CHKM Chesapeake Midstream Partner 5,288 2,882 2,406 21 11 10549 CVX Chevron Corporation 1,468,878 798,254 670,624 5,829 3,168 2,661550 CBI Chicago Bridge & Iron Company N.V. 84,323 60,817 23,506 335 241 93551 CHS Chico's FAS, Inc. 102,221 73,106 29,115 406 290 116552 PLCE Children's Place 56,851 37,914 18,937 226 150 75553 CIM Chimera Investment Corporation 133,162 75,979 57,183 528 302 227554 CAGC China Agritech, Inc. 58,338 16,415 41,923 232 65 166555 RCH China Architectural Engineering, Inc. 50 20 30 0 0 0556 CAAS China Automotive Systems, Inc. 30,707 16,483 14,224 124 66 57557 CBAK China BAK Battery, Inc. 6,298 3,204 3,094 25 13 12558 STV China Digital Holding Co., Ltd. 3,036 2,255 781 12 9 3559 CEAI China Education Alliance, Inc. 5,603 3,978 1,625 22 16 6560 JRJC China Finance Online Company 1,959 1,449 510 8 6 2561 CFSG China Fire & Security Group, Inc. 32,273 10,797 21,476 128 43 85562 CHGS China GengSheng Minerals, Inc. 11,456 7,655 3,801 46 31 15563 CHOP China Gerui Advanced Materials Group Ltd. 15,226 9,934 5,292 60 39 21564 CGA China Green Agriculture, Inc. 56,050 16,480 39,570 222 65 157565 CHLN China Housing & Land Development, Inc. 1,715 1,223 492 7 5 2566 CNIT China Information Technology, Inc. 2,483 1,583 900 10 6 4567 CBEH China Integrated Energy, Inc. 61,212 18,047 43,165 243 72 171568 LFC China Life Insurance Co., Ltd. 59,192 24,588 34,604 235 98 137569 HTHT China Lodging Group 6,050 3,850 2,200 24 15 9570 CMFO China Marine Food Group 10,650 4,534 6,116 42 18 24571 CCME China MediaExpress Holdings 409,329 172,586 236,743 1,624 685 939572 CMED China Medical Technologies, Inc. 136,833 55,019 81,814 543 218 325573 MY China Ming Yang Wind Power Group Limited 7,311 4,662 2,649 29 19 11574 CHL China Mobile Limited 153,668 84,870 68,798 610 337 273575 CHNG China Natural Gas, Inc. 10,029 2,615 7,414 40 10 29576 NPD China Nepstar Chain Drugstore Limited 3,471 2,014 1,457 14 8 6
CBOE HOLDINGS, INC. Page 16 2011 MARKET STATISTICS

Standard Symbol Stock Total Call Put Total Call Put
CBOE Equity Options Volume (Includes LEAPS)
Contract Volume Average Daily Volume
577 BORN China New Borun Corp. 6,084 2,988 3,096 32 16 16578 NEP China North East Petroleum Holdings Ltd. 29,787 17,044 12,743 118 68 51579 SNP China Petroleum and Chemical Corporation 27,408 10,718 16,690 109 43 66580 CPSL China Precision Steel, Inc. 2,070 1,486 584 8 6 2581 CRIC China Real Estate Information Corp. 4,469 1,462 3,007 18 6 12582 CREG China Recycling Energy Corp. 1,315 29 1,286 5 0 5583 CSR China Security & Surveillance Technology, Inc. 83,979 32,732 51,247 333 130 203584 CSKI China Sky One Medical, Incorp. 6,066 3,246 2,820 24 13 11585 CSUN China Sunergy Company 2,365 1,904 461 9 8 2586 CHA China Telecom Corporation Limited 815 488 327 3 2 1587 CTFO China TransInfo Techology Corp. 5,842 3,645 2,197 23 14 9588 CHU China Unicom Limited 23,123 4,519 18,604 92 18 74589 CVVT China Valves Technology, Inc. 34,920 16,731 18,189 139 66 72590 CXDC China XD Plastics Co. Ltd. 8,203 4,426 3,777 36 19 17591 CYD China Yuchai International Limited 38,855 26,144 12,711 154 104 50592 ZX China Zenix Auto Int'l. Ltd. 515 213 302 3 1 2593 CHBT China-Biotics, Inc. 378,848 152,390 226,458 1,503 605 899594 CAST ChinaCast Education Corporation 37,665 13,224 24,441 149 52 97595 CMG Chipotle Mexican Grill, Inc. 703,308 339,977 363,331 2,791 1,349 1,442596 CQB Chiquita Brands International, Inc. 40,306 24,036 16,270 160 95 65597 CHH Choice Hotels International, Inc. 1,869 1,147 722 7 5 3598 CBK Christopher & Banks Corporation 6,885 5,462 1,423 27 22 6599 CB Chubb Corporation (The) 65,467 34,760 30,707 260 138 122600 CHT Chunghwa Telecom Co., Ltd. - ADR 367 220 147 1 1 1601 CBD CIA Brasileria de Distribuicao Grupo 3,961 1,649 2,312 16 7 9602 SBS CIA Saneamento Basico De 6,029 3,480 2,549 24 14 10603 CIEN Ciena Corporation 657,547 376,759 280,788 2,609 1,495 1,114604 CI CIGNA Corporation 122,550 77,623 44,927 486 308 178605 XEC Cimarex Energy Co. 54,707 32,528 22,179 217 129 88606 CBB CIncinnati Bell, Inc. 3,579 1,189 2,390 14 5 9607 CINF Cincinnati Financial Corporation 8,019 6,235 1,784 32 25 7608 CNK Cinemark Holdings, Inc. 6,036 3,688 2,348 24 15 9609 CTAS Cintas Corporation 74,314 66,897 7,417 295 265 29610 CIR CIRCOR International, Inc. 754 381 373 3 2 1611 CRUS Cirrus Logic, Inc. 236,361 166,879 69,482 938 662 276612 CSCO Cisco Systems, Inc. 9,040,536 5,869,123 3,171,413 35,875 23,290 12,585613 CIT CIT Group, Inc. 164,789 66,291 98,498 654 263 391614 CTRN Citi Trends, Inc. 7,182 2,605 4,577 29 10 18615 C Citigroup, Inc. 22,713,227 15,556,339 7,156,888 90,132 61,732 28,400616 CRBC Citizens Republic Bancorp, Inc. 1,677 1,332 345 7 5 1617 CIA Citizens, Inc. 500 444 56 2 2 0618 CTXS Citrix Systems, Inc. 272,353 151,738 120,615 1,081 602 479619 CYN City National Corporation 5,353 3,185 2,168 21 13 9620 CTEL City Telecom HK Ltd 2,640 2,042 598 10 8 2621 CKXE CKX, Inc 2,522 212 2,310 14 1 13622 CLC CLARCOR, Inc. 2,511 1,851 660 10 7 3623 CLNE Clean Energy Fuels Corporation 135,721 94,735 40,986 539 376 163624 CLH Clean Harbors, Inc. 10,557 6,877 3,680 42 27 15625 CCO Clear Channel Outdoor Holdings, Inc. 1,371 1,176 195 5 5 1626 CLWR Clearwire Corporation 229,844 140,587 89,257 912 558 354627 CBLI Cleveland Biolabs, Inc. 71,339 59,586 11,753 283 236 47628 CKSW ClickSoftware Technologies Ltd. 7,999 6,823 1,176 32 27 5629 CLF Cliffs Natural Resources, Inc. 942,840 581,200 361,640 3,741 2,306 1,435630 CLDA Clinical Data, Inc. 498,993 334,647 164,346 1,980 1,328 652631 CLX Clorox Company (The) 157,149 88,847 68,302 624 353 271632 CLD Cloud Peak Energy , Inc. 42,308 24,279 18,029 168 96 72633 CME CME Group, Inc. 156,052 80,307 75,745 619 319 301634 CMS CMS Energy Corporation 6,278 4,215 2,063 25 17 8635 CNA CNA Financial Corporation 1,509 905 604 6 4 2636 CNH CNH Global N.V. 15,534 12,340 3,194 62 49 13637 CISG CNinsure, Inc. 63,274 20,452 42,822 251 81 170638 CEO CNOOC Limited 33,083 17,310 15,773 131 69 63639 COH Coach, Inc. 287,431 129,193 158,238 1,141 513 628640 CIE Cobalt International Energy, Inc. 46,458 39,242 7,216 184 156 29
CBOE HOLDINGS, INC. Page 17 2011 MARKET STATISTICS

Standard Symbol Stock Total Call Put Total Call Put
CBOE Equity Options Volume (Includes LEAPS)
Contract Volume Average Daily Volume
641 KO Coca-Cola Company (The) 1,317,993 727,263 590,730 5,230 2,886 2,344642 CCE Coca-Cola Enterprises, Inc. 26,525 12,488 14,037 105 50 56643 KOF Coca-Cola Femsa SAB de CV 884 296 588 4 1 2644 CDE Coeur d' Alene Mines Corp. 474,355 348,173 126,182 1,882 1,382 501645 CSA Cogdell Spencer, Inc. 69 47 22 0 0 0646 CCOI Cogent Communications Group, Inc. 5,882 4,237 1,645 23 17 7647 CTSH Cognizant Technology Solutions Corporation 160,752 85,491 75,261 638 339 299648 COGO Cogo Group, Inc. 16,066 4,946 11,120 64 20 44649 COHR Coherent, Inc. 4,139 2,868 1,271 16 11 5650 COHU Cohu, Inc. 2,192 1,121 1,071 9 4 4651 CSTR Coinstar, Inc. 281,886 174,763 107,123 1,119 694 425652 CWTR Coldwater Creek, Inc. 3,075 2,281 794 12 9 3653 CFX Colfax Corporation 63,713 35,484 28,229 253 141 112654 CL Colgate-Palmolive Company 373,094 240,111 132,983 1,481 953 528655 PSS Collective Brands, Inc. 90,872 59,391 31,481 361 236 125656 CLP Colonial Properties Trust 1,101 944 157 4 4 1657 CLNY Colony Financial, Inc. 16,070 10,187 5,883 64 40 23658 CBRX Columbia Laboratories, Inc. 15,151 13,046 2,105 60 52 8659 COLM Columbia Sportwear Company 4,894 2,656 2,238 19 11 9660 CMCO Columbus McKinnon Corporation 236 166 70 1 1 0661 CMCSK Comcast Corporation (Special Class A) 72,668 51,526 21,142 288 204 84662 CMCSA Comcast Corporation Class A 715,669 327,454 388,215 2,840 1,299 1,541663 CMA Comerica, Incorporated 174,698 107,043 67,655 693 425 268664 FIX Comfort Systems USA, Inc. 4,257 2,008 2,249 17 8 9665 CBSH Commerce Bancshares, Inc. 1,478 1,096 382 6 4 2666 CMC Commercial Metals Company 73,775 61,278 12,497 293 243 50667 CTV Commscope, Inc. 1,925 642 1,283 8 3 5668 CBU Community Bank System, Inc. 3,640 2,272 1,368 14 9 5669 CYH Community Health Systems, Inc. (New) 211,230 111,169 100,061 838 441 397670 CVLT Commvault Systems, Inc. 37,639 25,010 12,629 149 99 50671 ABV Companhia de Bebidas das Americas 82,407 56,865 25,542 327 226 101672 CIG Companhia Energetica de Minas Gerais 2,637 1,297 1,340 10 5 5673 ELP Companhia Paranaense de Energia-Copel 972 212 760 4 1 3674 SID Companhia Siderurgica Nacional ADR 58,686 25,807 32,879 233 102 130675 BVN Compania de Minas Buenaventura S.A. 79,774 36,799 42,975 317 146 171676 CODI Compass Diversified Holdings 4,911 3,667 1,244 29 22 7677 CMP Compass Minerals International, Inc. 6,197 3,134 3,063 25 12 12678 CML Compellent Technologies, Inc. 1,896 1,254 642 8 5 3679 CPX Complete Production Services, Inc. 36,676 21,365 15,311 146 85 61680 CCRT CompuCredit Corporation 85,843 42,644 43,199 341 169 171681 CGEN Compugen Ltd. 7,162 5,942 1,220 28 24 5682 CPSI Computer Programs and Systems, Inc. 3,805 2,310 1,495 15 9 6683 CSC Computer Sciences Corporation 189,238 96,545 92,693 751 383 368684 CPWR Compuware Corporation 6,759 5,692 1,067 27 23 4685 CRK Comstock Resources, Inc. (New) 15,761 7,512 8,249 63 30 33686 CMTL Comtech Telecommunication Corp. 25,994 16,147 9,847 103 64 39687 COMV Comverge, Inc. 1,136 615 521 5 2 2688 CAG ConAgra, Inc. 208,333 169,565 38,768 827 673 154689 CPTS Conceptus, Inc. 1,195 322 873 5 1 3690 CXO Concho Resources, Inc. 101,572 85,377 16,195 403 339 64691 CCM Concord Medical Services Holdings Limited 994 786 208 4 3 1692 CNQR Concur Technologies, Inc. 14,409 5,272 9,137 57 21 36693 CONN Conn's, Inc. 9,324 5,810 3,514 37 23 14694 COP ConocoPhillips 1,371,105 814,470 556,635 5,441 3,232 2,209695 CNX Consol Energy, Inc. 400,909 234,715 166,194 1,591 931 660696 CNSL Consolidated Communications Holdings, Inc. 849 512 337 3 2 1697 ED Consolidated Edison, Inc. 71,457 41,920 29,537 284 166 117698 CGX Consolidated Graphics, Inc. 5,050 3,750 1,300 20 15 5699 CTCT Constant Contact, Inc. 21,432 11,717 9,715 85 46 39700 STZ Constellation Brands, Inc. 16,396 8,416 7,980 65 33 32701 CEG Constellation Energy Corp. 17,474 13,003 4,471 69 52 18702 MCF Contango Oil & Gas Co. 6,683 4,095 2,588 27 16 10703 CNU Contincare Corporation 4,275 2,124 2,151 17 8 9704 CLR Continental Resources, Inc. 66,695 41,280 25,415 265 164 101
CBOE HOLDINGS, INC. Page 18 2011 MARKET STATISTICS

Standard Symbol Stock Total Call Put Total Call Put
CBOE Equity Options Volume (Includes LEAPS)
Contract Volume Average Daily Volume
705 CVG Convergys Corp. 2,203 1,785 418 9 7 2706 CNW Con-way, Inc. 33,974 22,917 11,057 135 91 44707 COO Cooper Companies, Inc. (The) 25,293 17,392 7,901 100 69 31708 CBE Cooper Industries, Inc. 22,925 18,572 4,353 91 74 17709 CTB Cooper Tire & Rubber Company 8,262 5,892 2,370 33 23 9710 CPA Copa Holdings SA 2,994 1,691 1,303 12 7 5711 CPNO Copano Energy LLC 25,488 20,784 4,704 101 82 19712 CPRT Copart, Inc. 178,077 88,540 89,537 707 351 355713 CORT Corcept Therapeutics, Inc. 9,350 5,180 4,170 37 21 17714 CLB Core Laboratories N.V. 10,969 8,224 2,745 44 33 11715 CLGX CoreLogic, Inc. 12,896 7,167 5,729 51 28 23716 COCO Corinthian Colleges, Inc. 236,531 155,368 81,163 939 617 322717 CPO Corn Products International 8,314 5,706 2,608 33 23 10718 GLW Corning, Incorporated 1,161,748 698,692 463,056 4,610 2,773 1,838719 OFC Corporate Office Properties Trust 2,316 1,543 773 9 6 3720 CXW Corrections Corporation of America 5,477 2,309 3,168 22 9 13721 CZZ Cosan Limited 41,419 24,994 16,425 164 99 65722 CMRE Costamare, Inc. 2,512 1,572 940 10 6 4723 CSGP CoStar Group, Inc. 5,588 1,127 4,461 22 4 18724 COST Costco Wholesale Corp. 393,872 201,938 191,934 1,563 801 762725 COT Cott Corporation 1,944 1,608 336 8 6 1726 CUZ Cousins Properties, Inc. 132 111 21 1 0 0727 CVD Covance 10,595 5,378 5,217 42 21 21728 CVA Covanta Holding Corporation 22,238 17,161 5,077 88 68 20729 CVH Coventry Health Care, Inc. 19,305 13,243 6,062 77 53 24730 COV Covidien Ltd. 119,341 84,119 35,222 474 334 140731 COWN Cowen Group, Inc. 11,919 11,728 191 47 47 1732 CPL CPFL Energia SA 13,018 8,063 4,955 52 32 20733 CBRL Cracker Barrel Old Country Store, Inc. 15,714 7,607 8,107 62 30 32734 CRAY Cray, Inc. (New) 1,389 1,024 365 6 4 1735 BAP Credicorp Limited 15,439 10,165 5,274 61 40 21736 CS Credit Suisse Group - SPON ADR 105,565 55,280 50,285 419 219 200737 CREE Cree, Inc. 1,087,928 686,836 401,092 4,317 2,726 1,592738 CRH CRH Plc 2,276 1,517 759 9 6 3739 CROX Crocs, Inc. 216,718 145,790 70,928 860 579 281740 XTXI Crosstex Energy, Inc. 19,614 14,737 4,877 78 58 19741 CCI Crown Castle International Corp. 48,289 24,382 23,907 192 97 95742 CCK Crown Holdings, Inc. 35,414 24,475 10,939 141 97 43743 CRXL Crucell NV - ADR 5,057 2,852 2,205 20 11 9744 CRU Crude Carriers Corporation 3,898 2,234 1,664 15 9 7745 CRYP CryptoLogic Limited 442 384 58 2 2 0746 KRY Crystallex International Corporation 453 453 0 2 2 0747 CSGS CSG Systems International, Inc. 5,624 2,516 3,108 22 10 12748 CSX CSX Corporation 426,681 246,100 180,581 1,693 977 717749 CTCM CTC Media, Inc. 14,051 7,226 6,825 56 29 27750 CTRP Ctrip.com International, Ltd. 165,489 72,913 92,576 657 289 367751 CUBE CubeSmart 1,437 1,023 414 6 4 2752 CUB Cubic Corporation 630 441 189 3 2 1753 CBST Cubist Pharmaceuticals, Inc. 88,572 59,645 28,927 351 237 115754 CFR Cullen/Frost Bankers, Inc. 5,171 3,908 1,263 21 16 5755 CPIX Cumberland Pharmaceuticals, Inc. 1,873 174 1,699 8 1 7756 CMI Cummins, Inc. 665,384 402,919 262,465 2,640 1,599 1,042757 CRIS Curis, Inc. (New) 19,003 5,485 13,518 75 22 54758 CW Curtiss-Wright Corporation 2,473 1,711 762 10 7 3759 CUTR Cutera, Inc. 321 249 72 1 1 0760 CVBF CVB Financial Corp. 6,240 2,658 3,582 25 11 14761 CVI CVR Energy, Inc. 114,895 84,028 30,867 456 333 122762 CVS CVS Caremark Corporation 692,864 409,688 283,176 2,749 1,626 1,124763 CYBX Cyberonics, Inc. 2,843 1,536 1,307 11 6 5764 CYMI Cymer, Inc. 19,453 8,711 10,742 77 35 43765 CYPB Cypress Bioscience, Inc. 86 26 60 0 0 0766 CY Cypress Semiconductor Corporation 308,893 200,213 108,680 1,226 794 431767 CYS Cypress Sharpridge Investments, Inc. 45,617 26,326 19,291 181 104 77768 CYT Cytec Industries, Inc. 12,551 9,103 3,448 50 36 14
CBOE HOLDINGS, INC. Page 19 2011 MARKET STATISTICS

Standard Symbol Stock Total Call Put Total Call Put
CBOE Equity Options Volume (Includes LEAPS)
Contract Volume Average Daily Volume
769 CYTK Cytokinetics, Incorp. 6,784 6,426 358 27 26 1770 CYTX Cytori Therapeutics, Inc. 86,997 58,042 28,955 345 230 115771 DNB D&B Corp. 5,448 3,758 1,690 22 15 7772 DHI D.R. Horton, Inc. 207,107 132,004 75,103 822 524 298773 DDAIF Daimler AG 3 3 0 0 0 0774 DAKT Daktronics, Inc. 7,679 2,690 4,989 30 11 20775 DAN Dana Holding Corporation 45,049 26,778 18,271 179 106 73776 DHR Danaher Corporation 114,261 78,062 36,199 453 310 144777 DNBK Danvers Bancorp, Inc. 4,810 2,684 2,126 19 11 8778 DQ Daqo New Energy Corporation 1,630 787 843 12 6 6779 DRI Darden Restaurants, Inc. 85,722 42,492 43,230 340 169 172780 DAR Darling International, Inc. 22,433 14,905 7,528 89 59 30781 DTLK Datalink Corporation 14,743 13,288 1,455 59 53 6782 DVA DaVita, Inc. 43,979 35,299 8,680 175 140 34783 DWSN Dawson Geophysical Company 969 539 430 4 2 2784 DPM DCP Midstream Partners, LP 9,423 6,571 2,852 37 26 11785 DCT DCT Industrial Trust, Inc. 814 753 61 3 3 0786 DDR DDR Corp. 9,741 8,413 1,328 39 33 5787 DF Dean Foods Company 217,726 120,803 96,923 864 479 385788 DECK Deckers Outdoor Corporation 207,854 116,296 91,558 825 461 363789 DEER Deer Consumer Products 132,024 62,029 69,995 524 246 278790 DE Deere & Company 1,163,712 690,300 473,412 4,618 2,739 1,879791 DLM Del Monte Foods Company 181,636 90,268 91,368 721 358 363792 DCTH Delcath Systems, Inc. 175,964 113,484 62,480 698 450 248793 DK Delek US Holdings, Inc. 12,161 8,715 3,446 48 35 14794 DELL Dell Computer Corp. 1,478,540 851,736 626,804 5,867 3,380 2,487795 DLPH Delphi Automotive PLC 249 118 131 11 5 6796 DFG Delphi Financial Group CL A 3,707 1,901 1,806 15 8 7797 DAL Delta Air Lines 813,605 555,614 257,991 3,229 2,205 1,024798 DPTRQ Delta Petroleum Corporation 15,323 9,087 6,236 61 36 25799 DLX Deluxe Corporation 11,227 6,143 5,084 45 24 20800 DMD Demand Media, Inc. 25,601 7,513 18,088 117 34 83801 DMAN DemandTec, Inc. 8,284 3,203 5,081 33 13 20802 DNR Denbury Resources, Inc. 122,097 98,756 23,341 485 392 93803 DNDN Dendreon Corporation 854,144 643,823 210,321 3,389 2,555 835804 DNN Dennison Mines Corporation 58,558 33,707 24,851 232 134 99805 DENN Denny's Corp. 2,030 1,752 278 8 7 1806 XRAY DENTSPLY International, Inc. 8,379 4,968 3,411 33 20 14807 DEPO Depomed, Inc. 93,945 71,177 22,768 373 282 90808 HXM Desarrolladora Homex S.A. de C.V. 6,448 3,487 2,961 26 14 12809 DEST Destination Maternity Corp. 1,234 177 1,057 7 1 6810 DB Deutsche Bank AG 251,718 85,366 166,352 999 339 660811 DT Deutsche Telekom AG ADR 14 14 0 0 0 0812 DVN Devon Energy Corporation 425,390 279,829 145,561 1,688 1,110 578813 DV DeVRY, Inc. 30,292 13,279 17,013 120 53 68814 DEXO Dex One Corp. 5,335 4,437 898 28 23 5815 DXCM Dexcom, Inc. 12,746 5,790 6,956 51 23 28816 DHT DHT Maritime, Inc. 4,372 4,010 362 17 16 1817 DEO Diageo PLC 20,870 12,623 8,247 83 50 33818 DMND Diamond Foods, Inc. 115,640 62,329 53,311 459 247 212819 DO Diamond Offshore Drilling, Inc. 275,772 177,055 98,717 1,094 703 392820 DRH DiamondRock Hospitality Co. 904 528 376 4 2 1821 DSX Diana Shipping, Inc. 57,724 38,956 18,768 229 155 74822 DKS Dick's Sporting Goods, Inc. 59,557 33,056 26,501 236 131 105823 DBD Diebold, Incorporated 3,995 2,493 1,502 16 10 6824 DGIT Digital Generation, Inc. 26,120 21,219 4,901 104 84 19825 DLR Digital Realty Trust, Inc. 16,638 11,819 4,819 66 47 19826 DRIV Digital River, Inc. 61,215 23,147 38,068 243 92 151827 DGI DigitalGlobe, Inc. 3,061 1,909 1,152 12 8 5828 DDS Dillard Department Stores, Inc. (Class A) 75,709 41,104 34,605 300 163 137829 DIN DineEquity, Inc. 18,204 10,492 7,712 72 42 31830 DIOD Diodes, Incorporated 10,680 6,968 3,712 42 28 15831 DFS Discover Financial Services 72,526 37,257 35,269 288 148 140832 DISCK Discovery Communications, Inc. 6,338 1,640 4,698 25 7 19
CBOE HOLDINGS, INC. Page 20 2011 MARKET STATISTICS

Standard Symbol Stock Total Call Put Total Call Put
CBOE Equity Options Volume (Includes LEAPS)
Contract Volume Average Daily Volume
833 DISCA Discovery Communications, Inc. Series A 48,421 22,071 26,350 192 88 105834 DISH DISH Network Corporation Class A 204,407 136,524 67,883 811 542 269835 RDY Doctor Reddy's Laboratories Limited (New) 5,231 1,354 3,877 21 5 15836 DLB Dolby Laboratories, Inc. 20,828 10,023 10,805 83 40 43837 DOLE Dole Food Company, Inc. 11,552 5,852 5,700 46 23 23838 DLLR Dollar Financial Corporation 1,335 1,088 247 5 4 1839 DG Dollar General Corporation 74,629 54,664 19,965 296 217 79840 DTG Dollar Thrifty Automotive Group, Inc. 110,066 72,235 37,831 437 287 150841 DLTR Dollar Tree, Inc. 136,141 87,120 49,021 540 346 195842 D Dominion Resources, Inc. 38,294 20,537 17,757 152 81 70843 DPZ Domino's Pizza, Inc. 45,276 31,752 13,524 180 126 54844 UFS Domtar Corporation 34,660 24,906 9,754 138 99 39845 DCI Donaldson Company, Inc. 6,827 4,399 2,428 27 17 10846 RRD Donnelley (R.R.) & Sons Company 81,409 29,502 51,907 323 117 206847 DEI Douglas Emmett, Inc. 1,933 1,181 752 8 5 3848 DOV Dover Corporation 31,160 17,549 13,611 124 70 54849 DOW Dow Chemical Company (The) 873,413 494,997 378,416 3,466 1,964 1,502850 DPL DPL, Inc. 314 191 123 1 1 0851 DPS Dr. Pepper Snapple Group, Inc. 32,366 28,328 4,038 128 112 16852 DRWI DragonWave, Inc. 31,631 23,681 7,950 126 94 32853 DWA DreamWorks Animation SKG, Inc. Cl A 34,784 18,120 16,664 138 72 66854 DRC Dresser-Rand Group, Inc. 19,904 16,440 3,464 79 65 14855 DW Drew Industries, Inc. 146 79 67 2 1 1856 DRQ Dril-Quip, Inc. 15,944 9,831 6,113 63 39 24857 DRYS DryShip, Inc. 811,681 638,529 173,152 3,221 2,534 687858 DST DST Systems, Inc. 7,268 4,902 2,366 29 19 9859 DSW DSW, Inc. 13,697 5,769 7,928 54 23 31860 DTE DTE Energy Company Holdings 4,187 2,644 1,543 17 10 6861 DTSI DTS, Inc. 99 44 55 1 1 1862 DD du Pont (E.I.) de Nemours & Company 796,112 461,058 335,054 3,159 1,830 1,330863 DCO Ducommun, Incorporated 522 354 168 2 1 1864 DUK Duke Energy Company 144,747 100,306 44,441 574 398 176865 DRE Duke-Weeks Realty Investment, Inc. 4,099 3,609 490 16 14 2866 DEP Duncan Energy Partners LP 7,510 4,745 2,765 30 19 11867 DNKN Dunkin Brands Group, Inc. 19,957 11,929 8,028 192 115 77868 DGW Duoyuan Global Water, Inc. 64,798 18,446 46,352 257 73 184869 DFT DuPont Fabros Technology, Inc. 10,160 8,288 1,872 40 33 7870 DUSA Dusa Pharmaceuticals, Inc. (New) 2,302 2,019 283 9 8 1871 DYAX Dyax Corporation 1,958 1,817 141 8 7 1872 DY Dycom Industries, Inc. 24,949 10,122 14,827 99 40 59873 BOOM Dynamic Materials Corporation 4,460 3,149 1,311 18 12 5874 DVOX Dynavox, Inc. 4,581 3,255 1,326 18 13 5875 DYN Dynegy, Inc. 232,926 181,123 51,803 924 719 206876 ETFC E*Trade Financial Corporation 418,658 299,683 118,975 1,661 1,189 472877 EGLE Eagle Bulk Shipping, Inc. 74,157 40,032 34,125 294 159 135878 EXP Eagle Materials, Inc. 14,675 10,962 3,713 58 44 15879 EROC Eagle Rock Energy Partners Ltd. 14,753 10,271 4,482 59 41 18880 ELNK EarthLink, Inc. 51,722 45,837 5,885 205 182 23881 EWBC East West Bancorp, Inc. 7,348 6,090 1,258 29 24 5882 EMN Eastman Chemical Company 47,179 29,575 17,604 187 117 70883 EK Eastman Kodak Company 1,255,667 732,418 523,249 4,983 2,906 2,076884 ETN Eaton Corporation 112,303 76,086 36,217 446 302 144885 EV Eaton Vance Corporation 6,950 3,968 2,982 28 16 12886 EBAY eBay, Inc. 1,200,080 693,207 506,873 4,762 2,751 2,011887 EBIX Ebix, Inc. 102,295 45,720 56,575 406 181 225888 ELON Echelon Corporation 5,030 4,189 841 20 17 3889 SATS EchoStar Corporation 2,874 2,153 721 11 9 3890 ECL Ecolab, Inc. 20,619 12,945 7,674 82 51 30891 ECOL Ecology, Inc. 5,371 4,710 661 21 19 3892 EC Ecopetrol SA 13,181 6,637 6,544 52 26 26893 EDAP EDAP TMS SA 1,532 1,168 364 7 5 2894 EIX Edison International 20,582 9,928 10,654 82 39 42895 EDMC Education Management Corporation 56,047 27,761 28,286 222 110 112896 EDR Education Realty Trust, Inc. 838 510 328 3 2 1
CBOE HOLDINGS, INC. Page 21 2011 MARKET STATISTICS
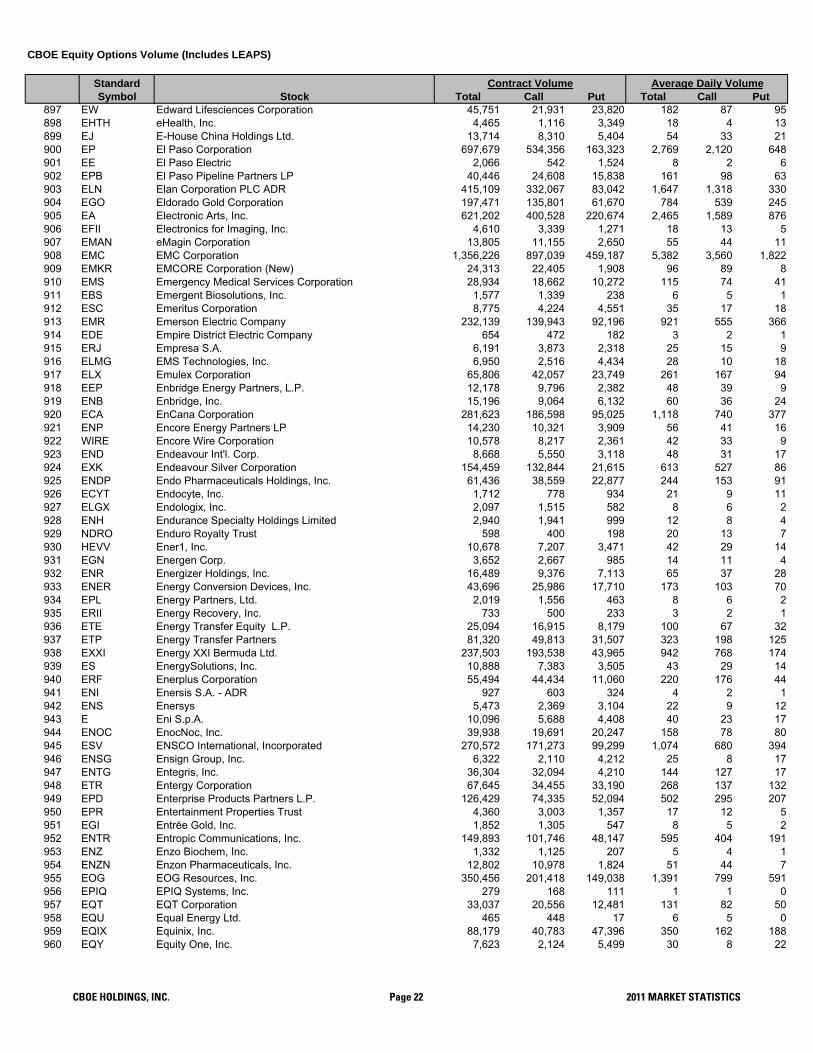
Standard Symbol Stock Total Call Put Total Call Put
CBOE Equity Options Volume (Includes LEAPS)
Contract Volume Average Daily Volume
897 EW Edward Lifesciences Corporation 45,751 21,931 23,820 182 87 95898 EHTH eHealth, Inc. 4,465 1,116 3,349 18 4 13899 EJ E-House China Holdings Ltd. 13,714 8,310 5,404 54 33 21900 EP El Paso Corporation 697,679 534,356 163,323 2,769 2,120 648901 EE El Paso Electric 2,066 542 1,524 8 2 6902 EPB El Paso Pipeline Partners LP 40,446 24,608 15,838 161 98 63903 ELN Elan Corporation PLC ADR 415,109 332,067 83,042 1,647 1,318 330904 EGO Eldorado Gold Corporation 197,471 135,801 61,670 784 539 245905 EA Electronic Arts, Inc. 621,202 400,528 220,674 2,465 1,589 876906 EFII Electronics for Imaging, Inc. 4,610 3,339 1,271 18 13 5907 EMAN eMagin Corporation 13,805 11,155 2,650 55 44 11908 EMC EMC Corporation 1,356,226 897,039 459,187 5,382 3,560 1,822909 EMKR EMCORE Corporation (New) 24,313 22,405 1,908 96 89 8910 EMS Emergency Medical Services Corporation 28,934 18,662 10,272 115 74 41911 EBS Emergent Biosolutions, Inc. 1,577 1,339 238 6 5 1912 ESC Emeritus Corporation 8,775 4,224 4,551 35 17 18913 EMR Emerson Electric Company 232,139 139,943 92,196 921 555 366914 EDE Empire District Electric Company 654 472 182 3 2 1915 ERJ Empresa S.A. 6,191 3,873 2,318 25 15 9916 ELMG EMS Technologies, Inc. 6,950 2,516 4,434 28 10 18917 ELX Emulex Corporation 65,806 42,057 23,749 261 167 94918 EEP Enbridge Energy Partners, L.P. 12,178 9,796 2,382 48 39 9919 ENB Enbridge, Inc. 15,196 9,064 6,132 60 36 24920 ECA EnCana Corporation 281,623 186,598 95,025 1,118 740 377921 ENP Encore Energy Partners LP 14,230 10,321 3,909 56 41 16922 WIRE Encore Wire Corporation 10,578 8,217 2,361 42 33 9923 END Endeavour Int'l. Corp. 8,668 5,550 3,118 48 31 17924 EXK Endeavour Silver Corporation 154,459 132,844 21,615 613 527 86925 ENDP Endo Pharmaceuticals Holdings, Inc. 61,436 38,559 22,877 244 153 91926 ECYT Endocyte, Inc. 1,712 778 934 21 9 11927 ELGX Endologix, Inc. 2,097 1,515 582 8 6 2928 ENH Endurance Specialty Holdings Limited 2,940 1,941 999 12 8 4929 NDRO Enduro Royalty Trust 598 400 198 20 13 7930 HEVV Ener1, Inc. 10,678 7,207 3,471 42 29 14931 EGN Energen Corp. 3,652 2,667 985 14 11 4932 ENR Energizer Holdings, Inc. 16,489 9,376 7,113 65 37 28933 ENER Energy Conversion Devices, Inc. 43,696 25,986 17,710 173 103 70934 EPL Energy Partners, Ltd. 2,019 1,556 463 8 6 2935 ERII Energy Recovery, Inc. 733 500 233 3 2 1936 ETE Energy Transfer Equity L.P. 25,094 16,915 8,179 100 67 32937 ETP Energy Transfer Partners 81,320 49,813 31,507 323 198 125938 EXXI Energy XXI Bermuda Ltd. 237,503 193,538 43,965 942 768 174939 ES EnergySolutions, Inc. 10,888 7,383 3,505 43 29 14940 ERF Enerplus Corporation 55,494 44,434 11,060 220 176 44941 ENI Enersis S.A. - ADR 927 603 324 4 2 1942 ENS Enersys 5,473 2,369 3,104 22 9 12943 E Eni S.p.A. 10,096 5,688 4,408 40 23 17944 ENOC EnocNoc, Inc. 39,938 19,691 20,247 158 78 80945 ESV ENSCO International, Incorporated 270,572 171,273 99,299 1,074 680 394946 ENSG Ensign Group, Inc. 6,322 2,110 4,212 25 8 17947 ENTG Entegris, Inc. 36,304 32,094 4,210 144 127 17948 ETR Entergy Corporation 67,645 34,455 33,190 268 137 132949 EPD Enterprise Products Partners L.P. 126,429 74,335 52,094 502 295 207950 EPR Entertainment Properties Trust 4,360 3,003 1,357 17 12 5951 EGI Entrée Gold, Inc. 1,852 1,305 547 8 5 2952 ENTR Entropic Communications, Inc. 149,893 101,746 48,147 595 404 191953 ENZ Enzo Biochem, Inc. 1,332 1,125 207 5 4 1954 ENZN Enzon Pharmaceuticals, Inc. 12,802 10,978 1,824 51 44 7955 EOG EOG Resources, Inc. 350,456 201,418 149,038 1,391 799 591956 EPIQ EPIQ Systems, Inc. 279 168 111 1 1 0957 EQT EQT Corporation 33,037 20,556 12,481 131 82 50958 EQU Equal Energy Ltd. 465 448 17 6 5 0959 EQIX Equinix, Inc. 88,179 40,783 47,396 350 162 188960 EQY Equity One, Inc. 7,623 2,124 5,499 30 8 22
CBOE HOLDINGS, INC. Page 22 2011 MARKET STATISTICS

Standard Symbol Stock Total Call Put Total Call Put
CBOE Equity Options Volume (Includes LEAPS)
Contract Volume Average Daily Volume
961 EQR Equity Residential 32,778 14,598 18,180 130 58 72962 ERT eRESEARCH Technology, Inc. 125 64 61 0 0 0963 ERIC Ericsson (L.M.) Telephone Co. ADR 98,151 70,832 27,319 389 281 108964 ESE ESCO Technologies, Inc. 2,239 520 1,719 9 2 7965 ESS Essex Property Trust, Inc. 3,791 1,120 2,671 15 4 11966 EL Estee Lauder Companies, Inc. (The) (Class A) 92,752 50,768 41,984 368 201 167967 ETH Ethan Allen Interiors, Inc. 5,969 2,665 3,304 24 11 13968 ESEA Euroseas Ltd. 1,898 1,776 122 8 7 0969 EVEP EV Energy Partners LP 82,348 61,257 21,091 327 243 84970 EVR Evercore Partners, Inc. 7,927 5,048 2,879 31 20 11971 RE Everest Reinsurance Holdings, Inc. 6,367 3,820 2,547 25 15 10972 EEE Evergreen Energy, Inc. 6,768 4,883 1,885 27 19 7973 ESLRQ Evergreen Solar, Inc. 40,517 22,052 18,465 161 88 73974 EPM Evolution Petroleum Corporation 6,110 4,466 1,644 24 18 7975 EXAS Exact Sciences Corporation 44,399 28,149 16,250 176 112 64976 EXAM ExamWorks Group, Inc. 889 726 163 14 12 3977 EXM Excel Maritime Carriers Ltd. 57,915 36,280 21,635 230 144 86978 EXL Excel Trust, Inc. 951 859 92 4 3 0979 XCO EXCO Resources, Inc. 238,824 181,198 57,626 948 719 229980 XLS Exelis, Inc. 95 62 33 2 1 1981 EXEL Exelixis, Inc. 103,924 64,653 39,271 412 257 156982 EXC Exelon Corporation 250,198 166,229 83,969 993 660 333983 XRA Exeter Resource Corporation 59,428 54,369 5,059 236 216 20984 XIDE Exide Technologies, Inc. 19,482 16,178 3,304 77 64 13985 EXPE Expedia, Inc. (New) 369,122 251,276 117,846 1,465 997 468986 EXPD Expeditors International of Washington, Inc. 55,641 27,338 28,303 221 108 112987 ESRX Express Scripts, Inc.-Cl A 485,381 294,099 191,282 1,926 1,167 759988 EXPR Express, Inc. 35,023 24,474 10,549 139 97 42989 EXH Exterran Holdings, Inc. 11,723 8,116 3,607 47 32 14990 XG Extorre Gold Mines Ltd. 5,722 4,620 1,102 54 44 10991 EXR Extra Space Storage, Inc. 3,094 1,011 2,083 12 4 8992 XOM Exxon Mobil Corporation 3,981,181 2,208,141 1,773,040 15,798 8,762 7,036993 EZCH EZchip Semiconductor Ltd. 75,586 60,147 15,439 300 239 61994 EZPW EZCORP, Inc. 17,375 12,074 5,301 69 48 21995 FFIV F5 Networks, Inc. 1,128,914 626,139 502,775 4,480 2,485 1,995996 FN Fabrinet 2,334 2,128 206 28 26 3997 FDS FactSet Research Systems, Inc. 5,177 3,292 1,885 21 13 7998 FICO Fair Isaac Corporation 5,441 3,485 1,956 22 14 8999 FCS Fairchild Semiconductor Int'l, Inc. 70,666 43,049 27,617 280 171 110
1000 FFH Fairfax Financial Holdings Limited 115 65 50 0 0 01001 FALC FalconStor Software, Inc. 865 732 133 3 3 11002 FDO Family Dollar Stores, Inc. 88,225 51,648 36,577 350 205 1451003 DAVE Famous Dave's of America, Inc. 112 32 80 0 0 01004 FNM Fannie Mae 10,949 3,426 7,523 43 14 301005 FARO FARO Technologies, Inc. 4,121 2,601 1,520 16 10 61006 FAST Fastenal Company 197,400 118,576 78,824 783 471 3131007 AGM Federal Agricultural Mortgage Corporation 10,678 7,641 3,037 42 30 121008 FDML Federal Mogul Corporation 3,611 2,260 1,351 14 9 51009 FRT Federal Realty Investment Trust 3,694 1,735 1,959 15 7 81010 FSS Federal Signal Corporation 1,289 944 345 5 4 11011 FII Federated Investors, Inc.-Cl B 10,090 6,082 4,008 40 24 161012 FDX FedEx Corporation 563,455 292,382 271,073 2,236 1,160 1,0761013 FEIC FEI Company 4,530 3,430 1,100 18 14 41014 FCH FelCor Lodging Trust, Inc. 3,195 1,336 1,859 13 5 71015 FOE Ferro Corp. 23,024 18,890 4,134 91 75 161016 FNF Fidelity National Financial, Inc. 17,333 8,223 9,110 69 33 361017 FIS Fidelity National Information Services, Inc. 25,019 13,763 11,256 99 55 451018 FSC Fifth Street Finance Corporation 20,206 13,370 6,836 80 53 271019 FITB Fifth Third Bancorp. 307,659 169,163 138,496 1,221 671 5501020 FNGN Financial Engines, Inc. 3,434 1,731 1,703 14 7 71021 FNSR Finisar Corporation (New) 420,196 263,438 156,758 1,667 1,045 6221022 FAF First American Financial Corp. 2,954 734 2,220 12 3 91023 FBP First Bancorp Puerto Rico 8,369 2,841 5,528 33 11 221024 FCFS First Cash Financial Services, Inc. 11,444 6,881 4,563 45 27 18
CBOE HOLDINGS, INC. Page 23 2011 MARKET STATISTICS

Standard Symbol Stock Total Call Put Total Call Put
CBOE Equity Options Volume (Includes LEAPS)
Contract Volume Average Daily Volume
1025 FCBC First Community Bancshares, Inc. 124 0 124 0 0 01026 FFBC First Financial Bancorp 2,391 674 1,717 9 3 71027 FHN First Horizon National Corporation 48,838 11,218 37,620 194 45 1491028 FR First Industrial Realty Trust 8,982 7,363 1,619 36 29 61029 FMD First Marblehead Corporation 998 998 0 4 4 01030 FMBI First Midwest Bancorp, Inc. 4,369 753 3,616 17 3 141031 FNFG First Niagara Financial Group, Inc. 8,828 6,265 2,563 35 25 101032 FSLR First Solar, Inc. 1,355,163 627,606 727,557 5,378 2,491 2,8871033 FE FirstEnergy Corp. 115,012 75,639 39,373 456 300 1561034 FMER FirstMerit Corporation 7,560 2,512 5,048 30 10 201035 FISV FIserv, Inc. 15,365 11,197 4,168 61 44 171036 FVE Five Star Quality Care, Inc. 12,365 4,477 7,888 49 18 311037 FSR Flagstone Reinsurance Holdings 225 225 0 3 3 01038 FLML Flamel Technologies S.A., ADS 3,775 2,387 1,388 15 9 61039 FLT FleetCor Technologies, Inc. 2,897 2,140 757 12 9 31040 FLEX Flextronics International Ltd. 72,685 50,635 22,050 288 201 881041 FLIR FLIR Systems, Inc. 10,702 7,190 3,512 42 29 141042 FTK Flotek Industries, Inc. 76,573 63,451 13,122 304 252 521043 FLO Flowers Industries, Inc. 5,779 3,312 2,467 23 13 101044 FLS Flowserve Corporation 36,867 18,414 18,453 146 73 731045 FLR Fluor Corporation (New) 223,729 143,323 80,406 888 569 3191046 FMC FMC Corporation 6,539 3,478 3,061 26 14 121047 FTI FMC Technologies, Inc. 27,563 13,138 14,425 109 52 571048 FMCN Focus Media Holding Limited 453,313 208,901 244,412 1,799 829 9701049 FMX Fomento Economico Mexicano S.A.B. 5,623 4,283 1,340 22 17 51050 FL Foot Locker, Inc. 54,890 40,006 14,884 218 159 591051 FRPT Force Protecton, Inc. 14,740 13,285 1,455 58 53 61052 F Ford Motor Company 8,090,971 5,491,016 2,599,955 32,107 21,790 10,3171053 FCE/A Forest City Enterprises, Inc. 1,298 444 854 5 2 31054 FRX Forest Laboratories, Inc. 152,626 96,623 56,003 606 383 2221055 FST Forest Oil Corporation 157,836 95,151 62,685 626 378 2491056 FOR Forestar Real Estate Group, Inc. 1,734 1,271 463 7 5 21057 FORM FormFactor, Inc. 34,857 26,558 8,299 138 105 331058 FORR Forrester Research, Inc. 274 48 226 1 0 11059 FTNT Fortinet, Inc. 166,150 98,967 67,183 659 393 2671060 FIG Fortress Investment Group LLC 46,680 33,970 12,710 185 135 501061 FBHS Fortune Brands Home & Security, Inc. 875 574 301 14 9 51062 FOSL Fossil, Inc. 95,071 43,314 51,757 377 172 2051063 FWLT Foster Wheeler AG 176,143 108,093 68,050 699 429 2701064 FTE France Telecom, ADR 24,126 15,544 8,582 96 62 341065 FRAN Francesca's Holding Corp. 1,577 1,074 503 25 17 81066 FNV Franco-Nevada Corporation 3,194 692 2,502 73 16 571067 FELE Franklin Electric Co., Inc. 3,173 2,250 923 13 9 41068 BEN Franklin Resources, Inc. 55,813 21,713 34,100 221 86 1351069 FSP Franklin Street Properties Corporation 1,213 1,111 102 5 4 01070 FCX Freeport-McMoRan Copper & Gold Co., Inc. (Class B) 3,860,551 2,221,033 1,639,518 15,320 8,814 6,5061071 FSL Freescale Semiconductor, Inc. 19,412 5,155 14,257 77 20 571072 RAIL Freightcar America, Inc. 5,209 3,385 1,824 21 13 71073 FDP Fresh Del Monte Products, Inc. 2,332 1,228 1,104 9 5 41074 TFM Fresh Market, Inc. 9,449 5,224 4,225 37 21 171075 FBR Friedman, Billings, Ramsey Group, Inc. 22,720 6,389 16,331 90 25 651076 FRG Fronteer Development Group 14,028 11,424 2,604 56 45 101077 FTR Frontier Communications Corporation 132,705 58,496 74,209 527 232 2941078 FTO Frontier Oil Corporation 96,297 64,595 31,702 382 256 1261079 FRO Frontline Limited 211,175 124,847 86,328 838 495 3431080 FSII FSI International, Inc. 3,349 3,100 249 13 12 11081 FCN FTI Consulting, Inc. 30,308 14,685 15,623 120 58 621082 FSYS Fuel Systems Solutions, Inc. 22,012 11,103 10,909 87 44 431083 FCEL FuelCell Energy, Inc. 11,504 9,428 2,076 46 37 81084 FTEK Fuel-Tech N.V. 3,054 1,824 1,230 12 7 51085 FUQI Fuqi International, Inc. 26,103 14,931 11,172 104 59 441086 FURX Furiex Pharmaceuticals, Inc. 197 145 52 1 1 01087 FBN Furniture Brands International, Inc. 1,854 525 1,329 7 2 51088 FSIN Fushi Coppenweld, Inc. 61,825 33,150 28,675 245 132 114
CBOE HOLDINGS, INC. Page 24 2011 MARKET STATISTICS
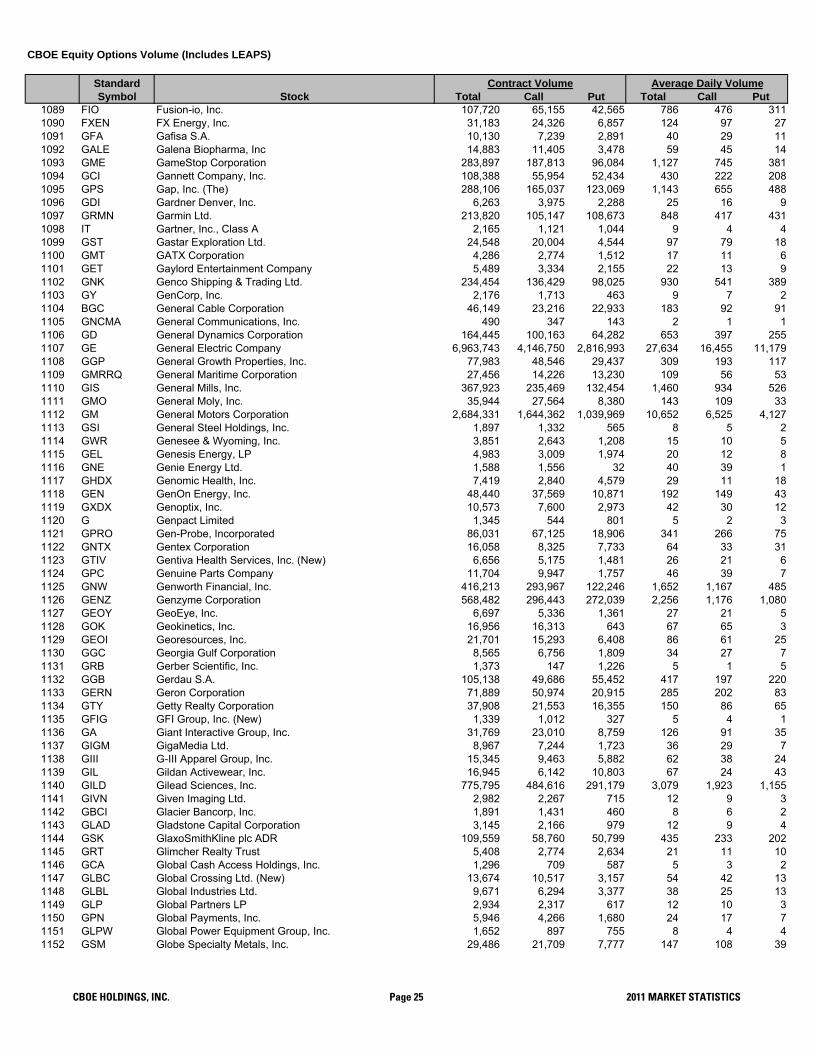
Standard Symbol Stock Total Call Put Total Call Put
CBOE Equity Options Volume (Includes LEAPS)
Contract Volume Average Daily Volume
1089 FIO Fusion-io, Inc. 107,720 65,155 42,565 786 476 3111090 FXEN FX Energy, Inc. 31,183 24,326 6,857 124 97 271091 GFA Gafisa S.A. 10,130 7,239 2,891 40 29 111092 GALE Galena Biopharma, Inc 14,883 11,405 3,478 59 45 141093 GME GameStop Corporation 283,897 187,813 96,084 1,127 745 3811094 GCI Gannett Company, Inc. 108,388 55,954 52,434 430 222 2081095 GPS Gap, Inc. (The) 288,106 165,037 123,069 1,143 655 4881096 GDI Gardner Denver, Inc. 6,263 3,975 2,288 25 16 91097 GRMN Garmin Ltd. 213,820 105,147 108,673 848 417 4311098 IT Gartner, Inc., Class A 2,165 1,121 1,044 9 4 41099 GST Gastar Exploration Ltd. 24,548 20,004 4,544 97 79 181100 GMT GATX Corporation 4,286 2,774 1,512 17 11 61101 GET Gaylord Entertainment Company 5,489 3,334 2,155 22 13 91102 GNK Genco Shipping & Trading Ltd. 234,454 136,429 98,025 930 541 3891103 GY GenCorp, Inc. 2,176 1,713 463 9 7 21104 BGC General Cable Corporation 46,149 23,216 22,933 183 92 911105 GNCMA General Communications, Inc. 490 347 143 2 1 11106 GD General Dynamics Corporation 164,445 100,163 64,282 653 397 2551107 GE General Electric Company 6,963,743 4,146,750 2,816,993 27,634 16,455 11,1791108 GGP General Growth Properties, Inc. 77,983 48,546 29,437 309 193 1171109 GMRRQ General Maritime Corporation 27,456 14,226 13,230 109 56 531110 GIS General Mills, Inc. 367,923 235,469 132,454 1,460 934 5261111 GMO General Moly, Inc. 35,944 27,564 8,380 143 109 331112 GM General Motors Corporation 2,684,331 1,644,362 1,039,969 10,652 6,525 4,1271113 GSI General Steel Holdings, Inc. 1,897 1,332 565 8 5 21114 GWR Genesee & Wyoming, Inc. 3,851 2,643 1,208 15 10 51115 GEL Genesis Energy, LP 4,983 3,009 1,974 20 12 81116 GNE Genie Energy Ltd. 1,588 1,556 32 40 39 11117 GHDX Genomic Health, Inc. 7,419 2,840 4,579 29 11 181118 GEN GenOn Energy, Inc. 48,440 37,569 10,871 192 149 431119 GXDX Genoptix, Inc. 10,573 7,600 2,973 42 30 121120 G Genpact Limited 1,345 544 801 5 2 31121 GPRO Gen-Probe, Incorporated 86,031 67,125 18,906 341 266 751122 GNTX Gentex Corporation 16,058 8,325 7,733 64 33 311123 GTIV Gentiva Health Services, Inc. (New) 6,656 5,175 1,481 26 21 61124 GPC Genuine Parts Company 11,704 9,947 1,757 46 39 71125 GNW Genworth Financial, Inc. 416,213 293,967 122,246 1,652 1,167 4851126 GENZ Genzyme Corporation 568,482 296,443 272,039 2,256 1,176 1,0801127 GEOY GeoEye, Inc. 6,697 5,336 1,361 27 21 51128 GOK Geokinetics, Inc. 16,956 16,313 643 67 65 31129 GEOI Georesources, Inc. 21,701 15,293 6,408 86 61 251130 GGC Georgia Gulf Corporation 8,565 6,756 1,809 34 27 71131 GRB Gerber Scientific, Inc. 1,373 147 1,226 5 1 51132 GGB Gerdau S.A. 105,138 49,686 55,452 417 197 2201133 GERN Geron Corporation 71,889 50,974 20,915 285 202 831134 GTY Getty Realty Corporation 37,908 21,553 16,355 150 86 651135 GFIG GFI Group, Inc. (New) 1,339 1,012 327 5 4 11136 GA Giant Interactive Group, Inc. 31,769 23,010 8,759 126 91 351137 GIGM GigaMedia Ltd. 8,967 7,244 1,723 36 29 71138 GIII G-III Apparel Group, Inc. 15,345 9,463 5,882 62 38 241139 GIL Gildan Activewear, Inc. 16,945 6,142 10,803 67 24 431140 GILD Gilead Sciences, Inc. 775,795 484,616 291,179 3,079 1,923 1,1551141 GIVN Given Imaging Ltd. 2,982 2,267 715 12 9 31142 GBCI Glacier Bancorp, Inc. 1,891 1,431 460 8 6 21143 GLAD Gladstone Capital Corporation 3,145 2,166 979 12 9 41144 GSK GlaxoSmithKline plc ADR 109,559 58,760 50,799 435 233 2021145 GRT Glimcher Realty Trust 5,408 2,774 2,634 21 11 101146 GCA Global Cash Access Holdings, Inc. 1,296 709 587 5 3 21147 GLBC Global Crossing Ltd. (New) 13,674 10,517 3,157 54 42 131148 GLBL Global Industries Ltd. 9,671 6,294 3,377 38 25 131149 GLP Global Partners LP 2,934 2,317 617 12 10 31150 GPN Global Payments, Inc. 5,946 4,266 1,680 24 17 71151 GLPW Global Power Equipment Group, Inc. 1,652 897 755 8 4 41152 GSM Globe Specialty Metals, Inc. 29,486 21,709 7,777 147 108 39
CBOE HOLDINGS, INC. Page 25 2011 MARKET STATISTICS

Standard Symbol Stock Total Call Put Total Call Put
CBOE Equity Options Volume (Includes LEAPS)
Contract Volume Average Daily Volume
1153 GLUU Glu Mobile, Inc. 58,472 51,802 6,670 280 248 321154 GMXR GMX Resources, Inc. 71,183 45,286 25,897 282 180 1031155 GNC GNC Holdings, Inc. 9,506 6,321 3,185 54 36 181156 GOL Gol Linhas Aereas Inteligentes S.A. 5,674 2,875 2,799 23 11 111157 GLNG Golar LNG Ltd. 34,813 25,005 9,808 138 99 391158 GFI Gold Fields Limited 180,389 127,622 52,767 716 506 2091159 GORO Gold Resource Corporation 67,362 39,432 27,930 267 156 1111160 GG Goldcorp, Inc. 1,301,843 908,386 393,457 5,166 3,605 1,5611161 AUMN Golden Minerals Co. 17,354 11,220 6,134 69 45 241162 GSS Golden Star Resources Ltd. 37,698 28,661 9,037 150 114 361163 GR Goodrich Corporation 100,910 62,459 38,451 400 248 1531164 GDP Goodrich Petroleum Corporation 40,146 27,646 12,500 159 110 501165 GT Goodyear Tire & Rubber Company (The) 392,531 224,564 167,967 1,558 891 6671166 GOOG Google, Inc. 4,373,689 2,479,265 1,894,424 17,356 9,838 7,5181167 GPP Government Properties Trust, Inc. 6,658 2,353 4,305 26 9 171168 GTI GrafTech International Ltd. 17,785 11,857 5,928 71 47 241169 GRM Graham Packaging Co., Inc. 9,085 5,673 3,412 36 23 141170 GWW Grainger (W.W.), Inc. 28,654 13,357 15,297 114 53 611171 GKK Gramercy Capital Corp. 16,196 8,581 7,615 64 34 301172 GTE Gran Tierra Energy, Inc. 35,041 22,051 12,990 139 88 521173 LOPE Grand Canyon Education, Inc. 17,531 13,190 4,341 70 52 171174 GVA Granite Construction, Inc. 7,153 3,103 4,050 28 12 161175 GPK Graphic Packaging Holding Co. 170 169 1 1 1 01176 GAP Great Atlantic & Pacific Tea Company, Inc. (The) 556 0 556 2 0 21177 GLDD Great Lakes Dredge & Dock 3,832 3,001 831 15 12 31178 GXP Great Plains Energy, Incorporated 4,014 2,118 1,896 16 8 81179 GB Greatbatch, Inc. 6,374 1,627 4,747 25 6 191180 GDOT Green Dot Corporation 34,945 16,215 18,730 139 64 741181 GMCR Green Mountain Coffee Roasters, Inc. 1,070,251 535,234 535,017 4,247 2,124 2,1231182 GPRE Green Plains Renewable Energy, Inc. 10,660 9,547 1,113 42 38 41183 GHL Greenhill & Co., Inc. 10,512 3,454 7,058 42 14 281184 GEF Greif, Inc. 1,916 1,023 893 8 4 41185 GFF Griffon Corporation (New) 3,797 3,458 339 15 14 11186 GPI Group 1 Automotive, Inc. 5,403 4,229 1,174 21 17 51187 GRPN Groupon, Inc. 127,702 62,343 65,359 3,870 1,889 1,9811188 ASR Grupo Aeroportuario 3,322 2,117 1,205 13 8 51189 TV Grupo Televisa S.A. ADR 6,710 2,278 4,432 27 9 181190 GSIC GSI Commerce, Inc. 65,550 43,025 22,525 260 171 891191 GTAT GT Advanced Technologies, Inc. 140,404 89,808 50,596 557 356 2011192 GTXI GTx, Inc. 17,138 7,762 9,376 68 31 371193 GES Guess?, Inc. 151,478 107,882 43,596 601 428 1731194 GURE Gulf Resources, Inc. 82,196 39,746 42,450 326 158 1681195 GLF GulfMark Offshore, Inc. 3,388 2,215 1,173 13 9 51196 GPOR Gulfport Energy Corporation 49,057 38,777 10,280 195 154 411197 GU Gushan Environmental Energy Limited 11,859 7,666 4,193 47 30 171198 HAE Haemonetics Corporation 1,337 827 510 5 3 21199 HAIN Hain Food Group, Inc. 23,170 19,013 4,157 92 75 161200 HAL Halliburton Company 1,868,471 1,103,707 764,764 7,415 4,380 3,0351201 HALO Halozyme Therapeutics, Inc. 29,165 22,403 6,762 116 89 271202 HBHC Hancock Holding Company 1,960 1,465 495 8 6 21203 HBI Hanesbrands, Inc. 39,867 26,038 13,829 158 103 551204 HNSN Hansen Medical, Inc. 34,797 27,477 7,320 138 109 291205 HANS Hansen Natural Corporation 163,963 110,050 53,913 651 437 2141206 HSOL Hanwha SolarOne Co., Ltd. 60,439 47,848 12,591 240 190 501207 HRBN Harbin Electric, Inc. 1,211,514 622,757 588,757 4,808 2,471 2,3361208 HOG Harley-Davidson, Inc. 235,514 137,709 97,805 935 546 3881209 HAR Harman International Industries, Incorporated 23,047 13,610 9,437 91 54 371210 HLIT Harmonic, Inc. 24,631 17,383 7,248 98 69 291211 HMY Harmony Gold Mining Company Limited 73,601 51,752 21,849 292 205 871212 HRS Harris Corporation 19,348 13,568 5,780 77 54 231213 HWD Harry Winston Diamond Corporation 18,601 6,211 12,390 75 25 501214 HHS Harte-Hanks, Inc. 8,842 6,427 2,415 35 26 101215 HIG Hartford Financial Services Group, Inc.(The) 547,793 321,708 226,085 2,174 1,277 8971216 HNR Harvest Natural Resources, Inc. 95,845 74,315 21,530 380 295 85
CBOE HOLDINGS, INC. Page 26 2011 MARKET STATISTICS

Standard Symbol Stock Total Call Put Total Call Put
CBOE Equity Options Volume (Includes LEAPS)
Contract Volume Average Daily Volume
1217 HAS Hasbro, Inc. 62,598 36,121 26,477 248 143 1051218 HTS Hatteras Financial Corporation 71,768 50,457 21,311 285 200 851219 HA Hawaiian Holdings, Inc 11,316 9,943 1,373 45 39 51220 HAYN Haynes International, Inc. 6,271 4,201 2,070 25 17 81221 HCA HCA Holdings, Inc. 82,663 50,133 32,530 413 251 1631222 HCP HCP, Inc. 19,096 8,170 10,926 76 32 431223 HDB HDFC Bank Ltd. 12,310 7,892 4,418 49 31 181224 HW Headwaters, Incorporated 14,350 11,529 2,821 57 46 111225 HCN Health Care REIT, Inc. 25,743 14,779 10,964 102 59 441226 HMA Health Management Associates, Inc. (Class A) 30,181 15,991 14,190 120 63 561227 HNT Health Net, Inc. 17,182 13,028 4,154 68 52 161228 HR Healthcare Realty Trust, Inc. 747 489 258 3 2 11229 HCSG Healthcare Services Group, Inc. 2,909 1,864 1,045 12 7 41230 HLS Healthsouth Corp. 32,846 17,299 15,547 130 69 621231 HS Healthspring, Inc. 23,364 12,867 10,497 93 51 421232 HWAY Healthways, Inc. 872 632 240 3 3 11233 HPY Heartland Payment Systems, Inc. 631 319 312 3 1 11234 HTWR HeartWare International, Inc. 19,928 14,430 5,498 79 57 221235 HEK Heckmann Corporation 110,484 90,348 20,136 438 359 801236 HL Hecla Mining Company 940,436 728,289 212,147 3,732 2,890 8421237 HEI HEICO Corporation 1,760 914 846 7 4 31238 HNZ Heinz (H.J.) Company 58,151 37,237 20,914 231 148 831239 HELE Helen of Troy Ltd. 3,555 2,474 1,081 14 10 41240 HLX Helix Energy Solutions Group, Inc. 39,971 26,593 13,378 159 106 531241 HP Helmerich & Payne, Inc. 71,616 36,934 34,682 284 147 1381242 HLF Herbalife Ltd. 101,400 60,014 41,386 402 238 1641243 HERO Hercules Offshore, Inc. 122,292 86,622 35,670 485 344 1421244 HRLY Herley Industries, Inc. 3,097 673 2,424 12 3 101245 HT Hersha Hospitality Trust 5,188 4,128 1,060 21 16 41246 HTZ Hertz Global Holdings, Inc. 112,690 85,058 27,632 447 338 1101247 HES Hess Corporation 547,679 323,391 224,288 2,173 1,283 8901248 HPQ Hewlett-Packard Company 2,477,963 1,435,377 1,042,586 9,833 5,696 4,1371249 HXL Hexcel Corporation (New) 11,688 9,802 1,886 46 39 71250 HGG hhgregg, Inc. 27,805 18,618 9,187 110 74 361251 HIBB Hibbett Sports, Inc. 3,596 2,340 1,256 14 9 51252 HIW Highwoods Properties, Inc. 625 460 165 2 2 11253 HIL Hill International, Inc. 4,398 3,078 1,320 17 12 51254 HTH Hilltop Holdings, Inc. 1,139 883 256 5 4 11255 HRC Hil-Rom Holdings, Inc. 2,665 1,633 1,032 11 6 41256 HIMX Himax Technologies, Inc. 4,110 2,082 2,028 16 8 81257 IHS HIS, Inc. 5,285 3,651 1,634 21 14 61258 HIT Hitachi Ltd. ADR 14,356 9,330 5,026 57 37 201259 HITK Hi-Tech Pharmacal Co., Inc. 17,553 12,108 5,445 70 48 221260 HITT Hittite Microwave Corporation 1,928 1,340 588 8 5 21261 HMSY HMS Holdings Corporation 2,413 1,393 1,020 10 6 41262 HOKU Hoku Scientific, Inc. 3,483 1,652 1,831 14 7 71263 HFC HollyFrontier Corporation 144,468 84,470 59,998 573 335 2381264 HOLX Hologic, Inc. 55,593 37,545 18,048 221 149 721265 HOMB Home Bancshares, Inc. 86 24 62 1 0 11266 HD Home Depot, Inc. (The) 953,242 554,898 398,344 3,783 2,202 1,5811267 HMIN Home Inns & Hotels Management, Inc. 17,284 6,202 11,082 69 25 441268 HME Home Properties, Inc. 2,604 2,164 440 10 9 21269 HMC Honda Motor Company, Ltd. ADR 20,430 11,694 8,736 81 46 351270 HON Honeywell International, Inc. 497,308 283,427 213,881 1,973 1,125 8491271 HMN Horace Mann Educators Corporation 1,944 559 1,385 8 2 51272 HRZL Horizon Lines, Inc. 8,148 5,059 3,089 32 20 121273 HRL Hormel Foods Corporation 8,476 3,156 5,320 34 13 211274 HOS Hornbeck Offshore Services, Inc. 12,010 6,213 5,797 48 25 231275 ZINC Horsehead Holding Corporation 5,733 4,446 1,287 23 18 51276 HSP Hospira, Inc. 53,405 31,563 21,842 212 125 871277 HPT Hospitality Properties Trust 18,353 10,931 7,422 73 43 291278 HST Host Hotels & Resorts, Inc. 60,906 22,068 38,838 242 88 1541279 HOTT Hot Topic, Inc. 11,099 8,262 2,837 44 33 111280 HI Household International, Inc. 3,402 2,014 1,388 14 8 6
CBOE HOLDINGS, INC. Page 27 2011 MARKET STATISTICS

Standard Symbol Stock Total Call Put Total Call Put
CBOE Equity Options Volume (Includes LEAPS)
Contract Volume Average Daily Volume
1281 HUSA Houston American Energy Corporation 40,261 33,698 6,563 160 134 261282 HOV Hovnanian Enterprises, Inc. 78,323 37,761 40,562 311 150 1611283 HHC Howard Hughes Corporation 20,528 13,723 6,805 81 54 271284 HBC HSBC Holdings plc 447,760 185,600 262,160 1,777 737 1,0401285 HSNI HSN, Inc. 19,848 11,766 8,082 79 47 321286 HNP Huaneng Power International, Inc. 6,469 3,878 2,591 26 15 101287 HUBG Hub Group, Inc. 3,067 1,053 2,014 12 4 81288 HUB/B Hubbell, Incorporated 1,150 620 530 5 2 21289 HCBK Hudson City Bancorp, Inc. 89,349 51,889 37,460 355 206 1491290 HPP Hudson Pacific Properties, Inc. 751 469 282 3 2 11291 HGT Hugoton Royalty Trust 6,009 4,595 1,414 24 18 61292 HGSI Human Genome Sciences, Inc. 650,078 415,861 234,217 2,580 1,650 9291293 HUM Humana, Inc. 152,667 72,372 80,295 606 287 3191294 JBHT Hunt (J.B.) Transport Services, Inc. 23,040 15,136 7,904 91 60 311295 HBAN Huntington Bancshares, Inc. 232,453 151,076 81,377 922 600 3231296 HII Huntington Ingalls Industries, Inc. 5,922 1,579 4,343 31 8 231297 HUN Huntsman Corporation 188,874 135,637 53,237 750 538 2111298 HURN Huron Consulting Group, Inc. 779 493 286 3 2 11299 HTCH Hutchinson Technology, Inc. 2,647 1,235 1,412 11 5 61300 H Hyatt Hotel Corporation 3,811 2,262 1,549 15 9 61301 HDY Hyperdynamics Corporation 143,852 109,363 34,489 571 434 1371302 IACI IAC/InterActiveCorp 29,322 19,010 10,312 116 75 411303 IAG IAMGOLD Corporation 138,648 84,707 53,941 550 336 2141304 IBKC IberiaBank Corporation 844 273 571 3 1 21305 IBN ICICI Bank Limited 126,027 58,332 67,695 500 231 2691306 ICLR ICON PLC (New) 652 517 135 3 2 11307 ICON Iconix Brand Group, Inc. 3,253 2,119 1,134 13 8 51308 IDIX Idenix Pharmaceuticals, Inc. 26,873 17,216 9,657 107 68 381309 INVE Identive Group, Inc. 4,382 3,885 497 27 24 31310 IEX IDEX Corporation 746 579 167 3 2 11311 IDXX IDEXX Laboratories, Inc. 3,995 1,508 2,487 16 6 101312 IDT IDT Corp. 27,211 16,002 11,209 108 64 441313 IGTE iGate Corp. 16,459 11,673 4,786 65 46 191314 IGOI iGO, Inc. 1,972 1,774 198 9 8 11315 IIVI II-VI, Incorporated 11,330 7,239 4,091 45 29 161316 ITW Illinois Tool Works, Inc. 167,047 112,739 54,308 663 447 2161317 ILMN Illumina, Inc. 92,975 49,282 43,693 369 196 1731318 IMAX Imax Corporation 130,192 92,400 37,792 517 367 1501319 IMMR Immersion Corporation (New) 5,341 4,277 1,064 21 17 41320 BLUD Immucor, Inc. 15,799 9,152 6,647 63 36 261321 IMGN ImmunoGen, Inc. 33,551 25,902 7,649 133 103 301322 IMMU Immunomedics, Inc. 126,217 100,804 25,413 501 400 1011323 IPXL Impax Laboratories, Inc. 18,521 13,954 4,567 73 55 181324 IFT Imperial Holdings, Inc. 12,386 5,046 7,340 52 21 311325 IMO Imperial Oil Ltd. 3,107 1,972 1,135 12 8 51326 IPSU Imperial Sugar Company 22,701 15,545 7,156 90 62 281327 INCY Incyte Corporation 43,636 24,976 18,660 173 99 741328 IFN India Fund, Inc. 31,317 15,457 15,860 124 61 631329 NRGY Inergy, L.P. 22,410 14,204 8,206 89 56 331330 INFN Infinera Corporation 95,152 61,739 33,413 378 245 1331331 INFA Informatica Corporation 70,884 37,782 33,102 281 150 1311332 INFY Infosys Limited 152,867 62,904 89,963 607 250 3571333 ING ING Groep NV 73,384 39,595 33,789 291 157 1341334 IR Ingersoll-Rand Company 138,333 86,106 52,227 549 342 2071335 IM Ingram Micro, Inc. (New) 13,385 9,894 3,491 53 39 141336 INHX Inhibitex, Inc. 32,698 16,673 16,025 130 66 641337 IRC Inland Real Estate Corporation 2,348 761 1,587 9 3 61338 IPHS Innophos Holdings, Inc. 4,044 2,582 1,462 16 10 61339 IPHI Inphi Corp. 4,144 3,383 761 23 19 41340 NSIT Insight Enterprises 2,592 1,915 677 10 8 31341 ISIG Insignia Systems, Inc. 13,248 9,103 4,145 53 37 171342 NSP Insperity, Inc. 2,708 1,813 895 11 7 41343 ISPH Inspire Pharmaceuticals, Inc. 32,597 27,966 4,631 129 111 181344 PODD Insulet Corporation 22,114 19,535 2,579 88 78 10
CBOE HOLDINGS, INC. Page 28 2011 MARKET STATISTICS

Standard Symbol Stock Total Call Put Total Call Put
CBOE Equity Options Volume (Includes LEAPS)
Contract Volume Average Daily Volume
1345 ISYS Integral Systems, Inc. 338 166 172 1 1 11346 IDTI Integrated Device Technology, Inc. 33,510 27,632 5,878 133 110 231347 ISSI Integrated Silicon Solution (New) 4,468 3,805 663 18 15 31348 TEG Integrys Energy Group, Inc. 3,909 2,999 910 16 12 41349 INTC Intel Corporation 5,869,436 3,507,862 2,361,574 23,291 13,920 9,3711350 IBKR Interactive Brokers Group, Inc. 64,960 19,721 45,239 258 78 1801351 ICLK interCLICK, Inc. 6,950 6,448 502 28 26 21352 IHG Intercontinental Hotels Group PLC 1,638 1,199 439 7 5 21353 ICE IntercontinentalExchange, Inc. 109,159 63,823 45,336 433 253 1801354 IDCC InterDigital, Inc. 763,724 538,012 225,712 3,031 2,135 8961355 IN Intermec, Inc. 3,015 2,435 580 12 10 21356 ITMN InterMune, Inc. 310,473 234,754 75,719 1,232 932 3001357 IBM International Business Machines Corporation 2,236,547 1,162,412 1,074,135 8,875 4,613 4,2621358 ICO International Coal Group, Inc. 187,844 150,297 37,547 745 596 1491359 IFF International Flavors & Fragrances, Inc. 23,292 15,654 7,638 92 62 301360 IGT International Game Technology 78,070 51,342 26,728 310 204 1061361 IP International Paper Company 499,887 266,785 233,102 1,984 1,059 9251362 IRF International Rectifier Corporation 4,829 2,020 2,809 19 8 111363 ISCA International Speedway Corp. 1,753 1,035 718 7 4 31364 IOC InterOil Corporation 410,841 241,396 169,445 1,630 958 6721365 IPG Interpublic Group of Companies, Inc. (The) 94,795 41,433 53,362 376 164 2121366 ISIL Intersil Corporation 46,472 25,081 21,391 184 100 851367 IILG Interval Leisure Group, Inc. 114 75 39 0 0 01368 INXN Interxion Holding NV 1,128 498 630 5 2 31369 IVAC Intevac, Inc. 1,088 785 303 4 3 11370 INTL INTL FCStone, Inc. 1,337 838 499 5 3 21371 IL IntraLinks Holdings, Inc. 72,359 34,338 38,021 338 160 1781372 IPI Intrepid Potash, Inc. 126,019 82,986 43,033 500 329 1711373 INTU Intuit Corporation 97,211 59,827 37,384 386 237 1481374 ISRG Intuitive Surgical, Inc. 208,303 127,599 80,704 827 506 3201375 IVC Invacare Corporation 2,156 1,422 734 9 6 31376 INVN InvenSense, Inc. 3,394 895 2,499 424 112 3121377 SNAK Inventure Foods, Inc. 1,098 948 150 4 4 11378 IVZ Invesco PLC 112,509 73,599 38,910 446 292 1541379 ITG Investment Technology Group (New) 14,430 8,552 5,878 57 34 231380 ISBC Investors Bancorp, Inc. 20 20 0 0 0 01381 IRET Investors Real Estate Trust 1,389 455 934 6 2 41382 IO ION Geophysical Corp. 51,997 33,894 18,103 206 135 721383 IPGP IPG Photonics Corporation 23,694 11,324 12,370 94 45 491384 IRDM Iridium Communications, Inc. 23,766 15,741 8,025 94 62 321385 IRIS IRIS International, Inc. 444 245 199 2 1 11386 IRBT iRobot Corporation (New) 7,683 5,059 2,624 30 20 101387 IRM Iron Mountain, Inc. 87,249 38,892 48,357 346 154 1921388 IRWD Ironwood Pharmaceuticals, Inc. 19,267 17,485 1,782 76 69 71389 ISIS Isis Pharmaceuticals, Inc. 24,144 15,882 8,262 96 63 331390 ISS iSoftstone holdings Ltd. 12,761 5,060 7,701 51 20 311391 ISTA Ista Pharmaceuticals, Inc. 22,035 16,756 5,279 87 66 211392 SFI iStar Financial, Inc. 196,032 115,949 80,083 778 460 3181393 ITRI Itron, Inc. 33,818 16,705 17,113 134 66 681394 ITT ITT Corporation 119,471 71,640 47,831 474 284 1901395 ESI ITT Educational Services, Inc. 158,973 77,690 81,283 631 308 3231396 IVAN Ivanhoe Energy, Inc. 8,116 7,524 592 32 30 21397 IVN Ivanhoe Mines Ltd. 215,054 137,192 77,862 853 544 3091398 JCG J. Crew Group, Inc. 75,856 59,434 16,422 301 236 651399 JCOM j2 Global Communications, Inc. 8,049 4,489 3,560 32 18 141400 JASO JA Solar holdings Co., Ltd. 223,049 157,265 65,784 885 624 2611401 JBL Jabil Circuit, Inc. 120,608 68,712 51,896 479 273 2061402 JKHY Jack Henry & Associates, Inc. 1,025 867 158 4 3 11403 JBX Jack in the Box, Inc. 9,325 6,114 3,211 37 24 131404 JHTXQ Jackson Hewitt Tax Service, Inc. 44,001 15,662 28,339 175 62 1121405 JEC Jacobs Engineering Group, Inc. 95,840 34,384 61,456 380 136 2441406 JAG Jaguar Mining, Inc. 92,110 60,183 31,927 366 239 1271407 JAKK JAKKS Pacific, Inc. 1,288 1,062 226 5 4 11408 JRCC James River Coal Company 107,543 76,441 31,102 427 303 123
CBOE HOLDINGS, INC. Page 29 2011 MARKET STATISTICS
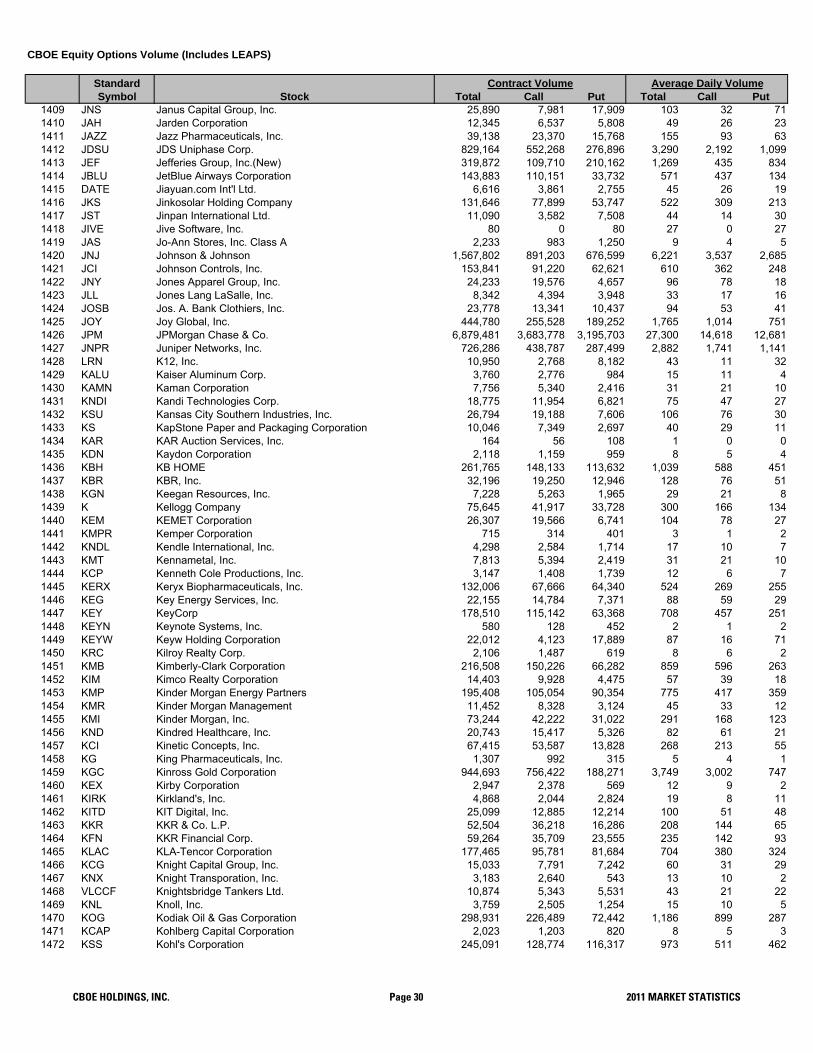
Standard Symbol Stock Total Call Put Total Call Put
CBOE Equity Options Volume (Includes LEAPS)
Contract Volume Average Daily Volume
1409 JNS Janus Capital Group, Inc. 25,890 7,981 17,909 103 32 711410 JAH Jarden Corporation 12,345 6,537 5,808 49 26 231411 JAZZ Jazz Pharmaceuticals, Inc. 39,138 23,370 15,768 155 93 631412 JDSU JDS Uniphase Corp. 829,164 552,268 276,896 3,290 2,192 1,0991413 JEF Jefferies Group, Inc.(New) 319,872 109,710 210,162 1,269 435 8341414 JBLU JetBlue Airways Corporation 143,883 110,151 33,732 571 437 1341415 DATE Jiayuan.com Int'l Ltd. 6,616 3,861 2,755 45 26 191416 JKS Jinkosolar Holding Company 131,646 77,899 53,747 522 309 2131417 JST Jinpan International Ltd. 11,090 3,582 7,508 44 14 301418 JIVE Jive Software, Inc. 80 0 80 27 0 271419 JAS Jo-Ann Stores, Inc. Class A 2,233 983 1,250 9 4 51420 JNJ Johnson & Johnson 1,567,802 891,203 676,599 6,221 3,537 2,6851421 JCI Johnson Controls, Inc. 153,841 91,220 62,621 610 362 2481422 JNY Jones Apparel Group, Inc. 24,233 19,576 4,657 96 78 181423 JLL Jones Lang LaSalle, Inc. 8,342 4,394 3,948 33 17 161424 JOSB Jos. A. Bank Clothiers, Inc. 23,778 13,341 10,437 94 53 411425 JOY Joy Global, Inc. 444,780 255,528 189,252 1,765 1,014 7511426 JPM JPMorgan Chase & Co. 6,879,481 3,683,778 3,195,703 27,300 14,618 12,6811427 JNPR Juniper Networks, Inc. 726,286 438,787 287,499 2,882 1,741 1,1411428 LRN K12, Inc. 10,950 2,768 8,182 43 11 321429 KALU Kaiser Aluminum Corp. 3,760 2,776 984 15 11 41430 KAMN Kaman Corporation 7,756 5,340 2,416 31 21 101431 KNDI Kandi Technologies Corp. 18,775 11,954 6,821 75 47 271432 KSU Kansas City Southern Industries, Inc. 26,794 19,188 7,606 106 76 301433 KS KapStone Paper and Packaging Corporation 10,046 7,349 2,697 40 29 111434 KAR KAR Auction Services, Inc. 164 56 108 1 0 01435 KDN Kaydon Corporation 2,118 1,159 959 8 5 41436 KBH KB HOME 261,765 148,133 113,632 1,039 588 4511437 KBR KBR, Inc. 32,196 19,250 12,946 128 76 511438 KGN Keegan Resources, Inc. 7,228 5,263 1,965 29 21 81439 K Kellogg Company 75,645 41,917 33,728 300 166 1341440 KEM KEMET Corporation 26,307 19,566 6,741 104 78 271441 KMPR Kemper Corporation 715 314 401 3 1 21442 KNDL Kendle International, Inc. 4,298 2,584 1,714 17 10 71443 KMT Kennametal, Inc. 7,813 5,394 2,419 31 21 101444 KCP Kenneth Cole Productions, Inc. 3,147 1,408 1,739 12 6 71445 KERX Keryx Biopharmaceuticals, Inc. 132,006 67,666 64,340 524 269 2551446 KEG Key Energy Services, Inc. 22,155 14,784 7,371 88 59 291447 KEY KeyCorp 178,510 115,142 63,368 708 457 2511448 KEYN Keynote Systems, Inc. 580 128 452 2 1 21449 KEYW Keyw Holding Corporation 22,012 4,123 17,889 87 16 711450 KRC Kilroy Realty Corp. 2,106 1,487 619 8 6 21451 KMB Kimberly-Clark Corporation 216,508 150,226 66,282 859 596 2631452 KIM Kimco Realty Corporation 14,403 9,928 4,475 57 39 181453 KMP Kinder Morgan Energy Partners 195,408 105,054 90,354 775 417 3591454 KMR Kinder Morgan Management 11,452 8,328 3,124 45 33 121455 KMI Kinder Morgan, Inc. 73,244 42,222 31,022 291 168 1231456 KND Kindred Healthcare, Inc. 20,743 15,417 5,326 82 61 211457 KCI Kinetic Concepts, Inc. 67,415 53,587 13,828 268 213 551458 KG King Pharmaceuticals, Inc. 1,307 992 315 5 4 11459 KGC Kinross Gold Corporation 944,693 756,422 188,271 3,749 3,002 7471460 KEX Kirby Corporation 2,947 2,378 569 12 9 21461 KIRK Kirkland's, Inc. 4,868 2,044 2,824 19 8 111462 KITD KIT Digital, Inc. 25,099 12,885 12,214 100 51 481463 KKR KKR & Co. L.P. 52,504 36,218 16,286 208 144 651464 KFN KKR Financial Corp. 59,264 35,709 23,555 235 142 931465 KLAC KLA-Tencor Corporation 177,465 95,781 81,684 704 380 3241466 KCG Knight Capital Group, Inc. 15,033 7,791 7,242 60 31 291467 KNX Knight Transporation, Inc. 3,183 2,640 543 13 10 21468 VLCCF Knightsbridge Tankers Ltd. 10,874 5,343 5,531 43 21 221469 KNL Knoll, Inc. 3,759 2,505 1,254 15 10 51470 KOG Kodiak Oil & Gas Corporation 298,931 226,489 72,442 1,186 899 2871471 KCAP Kohlberg Capital Corporation 2,023 1,203 820 8 5 31472 KSS Kohl's Corporation 245,091 128,774 116,317 973 511 462
CBOE HOLDINGS, INC. Page 30 2011 MARKET STATISTICS

Standard Symbol Stock Total Call Put Total Call Put
CBOE Equity Options Volume (Includes LEAPS)
Contract Volume Average Daily Volume
1473 KONG Kongzhong Corporation 14,172 8,322 5,850 56 33 231474 PHG Koninklijke Philips Electronics N.V. 14,230 6,864 7,366 56 27 291475 KB Kookmin Bank 2,686 1,422 1,264 11 6 51476 KOPN Kopin Corp. 3,717 3,612 105 15 14 01477 KOP Koppers Holdings, Inc. 4,448 2,617 1,831 18 10 71478 KEP Korea Electric Power Corporation 2,246 1,534 712 9 6 31479 KOS Kosmos Energy Ltd. 1,994 1,381 613 13 9 41480 KFT Kraft Foods, Inc. 644,161 365,063 279,098 2,556 1,449 1,1081481 KRA Kraton Performance Polymers, Inc. 15,911 10,898 5,013 63 43 201482 KTOS Kratos Defense & Security Solutions, Inc. 8,687 6,736 1,951 34 27 81483 KKD Krispy Kreme Doughnuts, Inc. 66,282 54,836 11,446 263 218 451484 KR Kroger Company (The) 82,588 42,581 40,007 328 169 1591485 KRO Kronos Worldwide, Inc. 15,354 9,196 6,158 108 65 431486 KSP K-Sea Transporation Partners LP 13,195 10,901 2,294 52 43 91487 KSWS K-Swiss, Inc. 2,438 1,981 457 10 8 21488 KT KT Corp. 922 416 506 4 2 21489 KLIC Kulicke and Soffa Industries, Inc. 61,921 43,823 18,098 246 174 721490 LLEN L&L Energy, Inc. 144,723 57,183 87,540 574 227 3471491 FSTR L.B. Foster Company 2,314 1,759 555 9 7 21492 ID L-1 Identity Solutions, Inc. 39,669 7,794 31,875 157 31 1261493 LLL L-3 Communications Hldgs. 55,567 32,344 23,223 221 128 921494 LH Laboratory Corporation of America Holdings 50,079 17,516 32,563 199 70 1291495 LAB LaBranche & Co, Inc. 798 686 112 3 3 01496 LRCX Lam Research Corporation 158,638 88,369 70,269 630 351 2791497 LAMR Lamar Advertising Company 18,494 14,145 4,349 73 56 171498 LFL Lan Airlines S.A. 3,361 1,855 1,506 13 7 61499 LANC Lancaster Colony Corporation 1,001 782 219 4 3 11500 LDSH Landish Co., Inc. 1,446 1,185 261 6 5 11501 LSTR Landstar System, Inc. 6,768 3,116 3,652 27 12 141502 LVS Las Vegas Sands Corp. 5,001,992 3,355,678 1,646,314 19,849 13,316 6,5331503 LHO LaSalle Hotel Properties 2,599 1,911 688 10 8 31504 LSCC Lattice Semiconductor Corporation 7,542 6,794 748 30 27 31505 LAYN Layne Christensen Company 3,801 2,037 1,764 15 8 71506 LAZ Lazard Ltd. Cl A 20,415 9,651 10,764 81 38 431507 LZB La-Z-Boy 8,873 3,470 5,403 35 14 211508 LCAV LCA-Vision, Inc. 626 406 220 2 2 11509 LDK LDK Solar Company Ltd. 967,844 521,914 445,930 3,841 2,071 1,7701510 GAGA Le Gaga Holdings Limited 1,105 358 747 4 1 31511 LEAP Leap Wireless International, Inc. 152,327 84,462 67,865 604 335 2691512 LF LeapFrog Enterprises, Inc. 12,065 10,551 1,514 48 42 61513 LEA Lear Corporation 23,814 17,206 6,608 95 68 261514 LCRY LeCroy Corporation 4,080 3,401 679 18 15 31515 LGCY Legacy Reserves 11,883 8,350 3,533 47 33 141516 LM Legg Mason, Inc. 65,713 34,054 31,659 261 135 1261517 LEG Leggett & Platt, Incorporated 18,145 11,378 6,767 72 45 271518 LPS Lender Processing Services, Inc. 82,689 25,054 57,635 328 99 2291519 LEN Lennar Corporation 334,653 156,460 178,193 1,328 621 7071520 LUK Leucadia National Corp. 22,253 10,450 11,803 88 41 471521 LVLT Level 3 Comunications, Inc. 362,399 276,105 86,294 1,438 1,096 3421522 LXK Lexmark International Group, Inc. (Class A) 129,347 66,658 62,689 513 265 2491523 LPL LG.Display Co., Ltd. 4,414 2,406 2,008 18 10 81524 LBY Libbey, Inc. 410 283 127 2 1 11525 LBTYA Liberty Global, Inc. 43,015 31,252 11,763 171 124 471526 LINTA Liberty Interactive Series 42,979 20,293 22,686 171 81 901527 LCAPA Liberty Media Corporation Liberty Capital Class A 5,288 3,818 1,470 21 15 61528 LSTZA Liberty Media Corporation Liberty Starz Class A 6,972 5,589 1,383 28 22 51529 LRY Liberty Property Trust 61,206 31,027 30,179 243 123 1201530 LPHI Life Partners Holdings, Inc. 49,573 15,101 34,472 197 60 1371531 LIFE Life Technologies Corporation 73,168 39,989 33,179 290 159 1321532 LTM Life Time Fitness, Inc. 9,420 4,819 4,601 37 19 181533 LPNT LifePoint Hospitals, Inc. 6,669 3,465 3,204 26 14 131534 LGND Ligand Pharmaceuticals, Incorporated (Class B) 2,078 439 1,639 8 2 71535 LTBR Lightbridge Corporation 7,013 5,147 1,866 28 20 71536 LIWA Lihua International, Inc. 30,975 18,462 12,513 123 73 50
CBOE HOLDINGS, INC. Page 31 2011 MARKET STATISTICS

Standard Symbol Stock Total Call Put Total Call Put
CBOE Equity Options Volume (Includes LEAPS)
Contract Volume Average Daily Volume
1537 LLY Lilly (Eli) and Company 554,538 328,177 226,361 2,201 1,302 8981538 LLNW Limelight Networks, Inc. 71,794 60,111 11,683 285 239 461539 LTD Limited Brands, Inc. 150,274 86,264 64,010 596 342 2541540 LNCR LInc.are Holdings, Inc. 50,456 38,864 11,592 200 154 461541 LINC Lincoln Educational Services Corporation 36,262 16,540 19,722 144 66 781542 LECO Lincoln Electric Holdings, Inc. 2,807 2,198 609 11 9 21543 LNC Lincoln National Corporation 200,680 141,929 58,751 796 563 2331544 LNN Lindsay Corporation 19,351 12,313 7,038 77 49 281545 LLTC Linear Technology Corporation 77,580 47,016 30,564 308 187 1211546 LNKD Linkedln Corporation 409,549 198,744 210,805 2,712 1,316 1,3961547 LINE Linn Energy LLC 155,161 106,141 49,020 616 421 1951548 LGF Lions Gate Entertainment Corp. 13,774 9,686 4,088 55 38 161549 LAD Lithia Motors, Inc. 10,479 7,889 2,590 42 31 101550 LFUS Littelfuse, Inc. 3,661 2,334 1,327 15 9 51551 LYV Live Nation, Inc. 42,452 28,991 13,461 168 115 531552 LPSN LivePerson, Inc. 21,623 14,562 7,061 86 58 281553 LIZ Liz Claiborne, Inc. 75,285 53,005 22,280 299 210 881554 LKQX LKQ Corporation 1,494 766 728 6 3 31555 LYG Lloyd's Banking Group PLC 29,348 14,976 14,372 116 59 571556 LOCM Local.com Corp. 20,441 16,517 3,924 81 66 161557 LMT Lockheed Martin Corporation 140,004 82,880 57,124 556 329 2271558 L Loews Corporation 5,298 2,385 2,913 21 9 121559 LOGI Logitech International 40,317 13,100 27,217 160 52 1081560 LOGM LogMeIn, Inc. 26,875 15,602 11,273 107 62 451561 LPR Lone Pine Resources, Inc. 866 763 103 14 12 21562 LFT Longtop Financial Technologies Limited 130,238 41,202 89,036 517 164 3531563 LORL Loral Space & Communications, Inc. 4,501 3,350 1,151 25 19 61564 LO Lorillard, Inc. 393,533 176,506 217,027 1,562 700 8611565 LPX Louisiana-Pacific Corporation 78,060 48,847 29,213 310 194 1161566 LOW Lowe's Companies, Inc. 595,422 369,012 226,410 2,363 1,464 8981567 LRE LRR Energy, L.P. 496 266 230 23 12 101568 LXU LSB Industries, Inc. 7,295 5,850 1,445 29 23 61569 LYTS LSI Industries, Inc. 2,219 1,693 526 9 7 21570 LSI LSI Logic Corporation 115,448 77,507 37,941 458 308 1511571 LZ Lubrizol Corporation 102,747 83,675 19,072 408 332 761572 LUFK Lufkin Industries, Inc. 16,647 8,638 8,009 66 34 321573 LULU Lululemon Athletica 673,402 337,428 335,974 2,672 1,339 1,3331574 LL Lumber Liquidators, Inc. 8,213 6,120 2,093 33 24 81575 LUX Luxottica Group SPA 875 287 588 3 1 21576 LYB LyondellBasell Industries NV 254,825 175,236 79,589 1,011 695 3161577 MTB M&T Bank Corporation 17,796 9,008 8,788 71 36 351578 MDC M.D.C. Holdings, Inc. 25,168 11,340 13,828 100 45 551579 MHO M/I Homes, Inc. 4,344 2,144 2,200 17 9 91580 MAC Macerich Company 17,255 10,977 6,278 68 44 251581 CLI Mack Cali Realty Corp. 2,417 1,552 865 10 6 31582 MIC Macquarie Infrastructure Company Trust 6,750 4,018 2,732 27 16 111583 M Macy's, Inc. 522,392 314,840 207,552 2,073 1,249 8241584 MVG Mag Silver Corporation 12,919 11,000 1,919 51 44 81585 MGLN Magellan Health Services, Inc. 147 110 37 1 0 01586 MMP Magellan Midstream Partners, L.P. 28,128 24,670 3,458 112 98 141587 MGIC Magic Software Enterprises Ltd. 13,920 9,555 4,365 65 45 201588 LAVA Magma Design Automation, Inc. 15,019 8,136 6,883 60 32 271589 MGA Magna International, Inc. 37,837 22,084 15,753 150 88 631590 MHR Magnum Hunter Resources, Inc. 85,190 62,285 22,905 338 247 911591 MHLD Maiden Holdings Ltd. 1,136 1,079 57 5 4 01592 MFB Maidenform Brands, Inc. 5,026 3,564 1,462 20 14 61593 COOL Majesco Entertainment Co. 20,972 18,973 1,999 116 105 111594 MMYT MakeMyTrip Ltd. 14,196 6,963 7,233 84 41 431595 MAKO MAKO Surgical Corporation 165,170 108,866 56,304 655 432 2231596 MTW Manitowoc Company 248,295 184,103 64,192 985 731 2551597 MNKD Mannkind Corporation 887,330 582,954 304,376 3,521 2,313 1,2081598 MAN Manpower, Inc. 22,913 9,485 13,428 91 38 531599 MANT ManTech International Corporation 3,677 3,074 603 15 12 21600 MFC Manulife Financial Corporation 49,501 26,901 22,600 196 107 90
CBOE HOLDINGS, INC. Page 32 2011 MARKET STATISTICS

Standard Symbol Stock Total Call Put Total Call Put
CBOE Equity Options Volume (Includes LEAPS)
Contract Volume Average Daily Volume
1601 MAPP MAP Pharmaceuticals, Inc. 9,334 2,882 6,452 37 11 261602 MRO Marathon Oil Corporation 1,003,496 725,682 277,814 3,982 2,880 1,1021603 MPC Marathon Petroleum Corp. 55,861 37,918 17,943 440 299 1411604 MCS Marcus Corporation 1,584 526 1,058 6 2 41605 HZO MarineMax, Inc. 307 116 191 1 0 11606 MWE Markwest Energy Partners, LP 63,456 39,443 24,013 252 157 951607 MAR Marriott International, Inc. 117,183 59,699 57,484 465 237 2281608 VAC Marriott Vacations Worldwide 150 10 140 6 0 51609 MMC Marsh & McLennan Companies, Inc. 22,777 16,269 6,508 90 65 261610 MI Marshall & Ilsley Corporation 10,514 5,740 4,774 42 23 191611 MATK Martek Biosciences Corporation 1,732 936 796 7 4 31612 MRTN Marten Transport Ltd. 713 412 301 3 2 11613 MSO Martha Stewart Living - CL A 9,610 9,053 557 38 36 21614 MLM Martin Marietta Materials, Inc. 26,154 11,091 15,063 104 44 601615 MRVL Marvell Technology Group Ltd. 1,204,964 855,346 349,618 4,782 3,394 1,3871616 MAS Masco Corporation 85,192 50,924 34,268 338 202 1361617 MASI Masimo Corporation 5,344 2,289 3,055 21 9 121618 MEE Massey Energy Company 366,058 235,204 130,854 1,453 933 5191619 MTZ Mastec, Inc. 15,065 11,409 3,656 60 45 151620 MA MasterCard, Inc. 553,259 286,519 266,740 2,195 1,137 1,0581621 MTRX Matrix Service Company 954 481 473 4 2 21622 MTXX Matrixx Initiatives, Inc. 577 141 436 2 1 21623 MAT Mattel, Inc. 126,229 76,566 49,663 501 304 1971624 MATW Matthews International Corporation 725 408 317 3 2 11625 MTSN Mattson Technology, Inc. 6,025 5,813 212 24 23 11626 MXIM Maxim Integrated Products, Inc. 91,236 47,181 44,055 362 187 1751627 MMS Maximus, Inc. 7,771 1,210 6,561 31 5 261628 MXL Maxlinear, Inc. 4,112 3,183 929 16 13 41629 MBFI MB Financial, Inc. 1,094 620 474 4 2 21630 MBI MBIA, Inc. 442,175 284,643 157,532 1,755 1,130 6251631 MFE McAfee, Inc. 21,137 15,495 5,642 84 61 221632 MNI McClatchy Company 29,112 20,531 8,581 116 81 341633 MSSR McCormick & Schmicks Seafood 8,177 3,998 4,179 45 22 231634 MDR McDermott International, Inc. 145,510 114,638 30,872 577 455 1231635 MCD McDonald's Corporation 1,155,447 660,613 494,834 4,585 2,621 1,9641636 UXG McEwen Mining, Inc. 59,075 53,210 5,865 234 211 231637 MCGC MCG Capital Corporation 8,920 5,289 3,631 35 21 141638 MHP McGraw-Hill Companies, Inc. (The) 78,764 44,923 33,841 313 178 1341639 MCK McKesson Corporation 112,172 63,920 48,252 445 254 1911640 MMR McMoran Exploration Co. 777,977 551,568 226,409 3,087 2,189 8981641 MJN Mead Johnson Nutrition Company 126,291 75,933 50,358 501 301 2001642 MWV MeadWestvaco Corporation 8,477 6,030 2,447 34 24 101643 MEAS Measurement Specialities, Inc. 916 199 717 4 1 31644 MTL Mechel OAO 142,862 83,450 59,412 567 331 2361645 MCOX Mecox Lane Ltd. 10,439 9,076 1,363 41 36 51646 MDAS MedAssets, Inc. 10,590 6,681 3,909 42 27 161647 MHS Medco Health Solutions, Inc. 303,052 167,864 135,188 1,203 666 5361648 MCCC Mediacom Communications Corporation 161 121 40 1 0 01649 MPW Medical Properties Trust, Inc. 4,824 3,853 971 19 15 41650 MDCO Medicines Company (The) 6,076 2,594 3,482 24 10 141651 MRX Medicis Pharmaceutical Corporation 40,192 32,293 7,899 159 128 311652 MDSO Medidate Solutions, Inc. 604 364 240 2 1 11653 MED Medifast, Inc. 68,409 42,073 26,336 271 167 1051654 MDVN Medivation, Inc. 139,003 65,620 73,383 552 260 2911655 MD Mednax, Inc. 3,898 1,626 2,272 15 6 91656 MDT Medtronic, Inc. 469,300 275,617 193,683 1,862 1,094 7691657 MELA MELA Sciences, Inc. 139,050 83,413 55,637 552 331 2211658 MPEL Melco Crown Entertainment 309,927 223,227 86,700 1,230 886 3441659 MLNX Mellanox Technologies Ltd. 50,936 16,013 34,923 202 64 1391660 WFR MEMC Electronic Materials, Inc. 474,307 323,513 150,794 1,882 1,284 5981661 MW Men's Wearhouse, Inc. (The) 24,864 12,822 12,042 99 51 481662 MENT Mentor Graphics Corporation 12,624 8,593 4,031 50 34 161663 MELI Mercadolibre, Inc. 82,777 54,020 28,757 328 214 1141664 MERC Mercer International, Inc. 9,108 6,784 2,324 44 32 11
CBOE HOLDINGS, INC. Page 33 2011 MARKET STATISTICS

Standard Symbol Stock Total Call Put Total Call Put
CBOE Equity Options Volume (Includes LEAPS)
Contract Volume Average Daily Volume
1665 MRK Merck & Co., Inc. 1,676,793 1,000,176 676,617 6,654 3,969 2,6851666 MRCY Mercury Computer Systems, Inc. 2,364 1,546 818 9 6 31667 MDP Meredith Corporation 5,311 4,349 962 21 17 41668 VIVO Meridian Bioscience, Inc. 4,195 1,849 2,346 17 7 91669 MMSI Merit Medical Systems, Inc. 1,225 829 396 5 3 21670 MTH Meritage Corporation 10,296 6,090 4,206 41 24 171671 MTOR Meritor, Inc. 69,384 36,564 32,820 275 145 1301672 MERU Meru Networks, Inc. 9,633 5,118 4,515 38 20 181673 MSB Mesabi Trust 42,197 28,531 13,666 167 113 541674 MEA Metalico, Inc. 11,681 5,381 6,300 46 21 251675 MUSA Metals USA, Holdings Corp., Inc. 2,302 1,829 473 9 7 21676 MEOH Methanex Corporation 3,276 1,953 1,323 13 8 51677 MET MetLife, Inc. 617,073 326,479 290,594 2,449 1,296 1,1531678 PCS Metropcs Communications, Inc. 61,115 41,196 19,919 243 163 791679 MDF Metropolitan Health Networks, Inc. 909 725 184 10 8 21680 MF MF Global Ltd. 122,069 78,025 44,044 484 310 1751681 MFA MFA Financials, Inc. 14,352 8,587 5,765 57 34 231682 MIL MFC Industrial Ltd. 8,153 6,927 1,226 32 27 51683 MTG MGIC Investment Corporation 289,712 184,676 105,036 1,150 733 4171684 MGM MGM Resorts International 2,012,856 1,327,573 685,283 7,988 5,268 2,7191685 MIM MI Developments, Inc. 2,262 1,067 1,195 9 4 51686 KORS Michael Kors Holdings Ltd. 637 40 597 159 10 1491687 MCRL Micrel, Inc. 2,191 1,565 626 9 6 21688 MCHP Microchip Technology, Inc. 73,310 47,043 26,267 291 187 1041689 MITI Micromet, Inc. 21,715 15,865 5,850 86 63 231690 MU Micron Technology, Inc. 1,925,166 1,397,973 527,193 7,640 5,548 2,0921691 MCRS MICROS Systems, Inc. 2,658 2,204 454 11 9 21692 MSCC Microsemi Corporation 1,703 1,101 602 7 4 21693 MSFT Microsoft Corporation 6,901,465 4,432,890 2,468,575 27,387 17,591 9,7961694 MSTR MicroStrategy, Inc. 28,046 15,632 12,414 111 62 491695 MVIS Microvision, Inc. 6,927 6,052 875 27 24 31696 MAA Mid-America Apartment Communities, Inc. 3,688 1,958 1,730 15 8 71697 MILL Miller Petroleum, Inc. 36,830 21,877 14,953 146 87 591698 MIICF Millicom International Cellular S.A. 16,035 9,394 6,641 64 37 261699 MR Mindray Medical International Limited 27,323 13,379 13,944 108 53 551700 MSPD Mindspeed Technologies, Inc. 13,692 9,142 4,550 54 36 181701 MFN Minefinders Corporation 74,136 51,731 22,405 294 205 891702 MTX Minerals Technologies, Inc. 3,060 1,033 2,027 12 4 81703 MIPS MIPS Technologies, Inc. (New) 188,045 130,748 57,297 746 519 2271704 MITK Mitek Systems, Inc. 14,417 9,356 5,061 162 105 571705 MITL Mitel Networks Corporation 3,804 2,655 1,149 15 11 51706 MTU Mitsubishi UFJ Financial Group, Inc. 4,286 3,566 720 17 14 31707 MFG Mizuho Financial Group, Inc. 3,256 1,335 1,921 13 5 81708 MKSI MKS Instruments, Inc. 6,854 4,213 2,641 27 17 101709 MBT Mobile Telesystems OJSC 29,219 19,505 9,714 116 77 391710 MOD Modine Maqnufacturing Company 2,391 1,408 983 9 6 41711 MLNK Moduslink Global Solutions, Inc. 1,316 1,017 299 5 4 11712 MHK Mohawk Industries, Inc. 21,724 7,901 13,823 86 31 551713 MOLX Molex, Incorporated 8,901 4,744 4,157 35 19 161714 MOLXA Molex, Incorporated Cl A 132 72 60 1 0 01715 MOH Molina Healthcare, Inc. 2,377 1,879 498 9 7 21716 TAP Molson Coors Brewing Company 23,073 13,311 9,762 92 53 391717 MCP Molycorp, Inc. 1,580,681 945,854 634,827 6,273 3,753 2,5191718 MNTA Momenta Pharmaceutical, Inc. 152,308 76,983 75,325 604 305 2991719 MCRI Monarch Casino & Resort, Inc. 1,165 361 804 5 1 31720 MGI MoneyGram International, Inc. 1,229 466 763 5 2 31721 MPWR Monolithic Power Systems 3,224 1,757 1,467 13 7 61722 MNRO Monro Muffler Brake, Inc. 5,718 3,668 2,050 23 15 81723 MON Monsanto Company/New 1,011,830 607,979 403,851 4,015 2,413 1,6031724 MWW Monster Worldwide, Inc. 136,269 86,331 49,938 541 343 1981725 MCO Moody's Corporation 118,142 58,354 59,788 469 232 2371726 MOG/A Moog, Inc. 168 156 12 1 1 01727 MS Morgan Stanley 2,158,242 1,030,615 1,127,627 8,564 4,090 4,4751728 MHGC Morgans Hotel Group Co. 16,244 15,584 660 64 62 3
CBOE HOLDINGS, INC. Page 34 2011 MARKET STATISTICS

Standard Symbol Stock Total Call Put Total Call Put
CBOE Equity Options Volume (Includes LEAPS)
Contract Volume Average Daily Volume
1729 MORN Morningstar, Inc. 2,477 1,887 590 10 7 21730 MOS Mosaic Company 1,825,416 1,236,241 589,175 7,244 4,906 2,3381731 MOT Motorola, Inc. 3,567 3,203 364 14 13 11732 MOTR Motricity, Inc. 135,195 87,927 47,268 536 349 1881733 MPG MPG Office Trust, Inc. 4,939 3,355 1,584 20 13 61734 MSM MSC Industrial Direct Co., Inc. 5,491 2,524 2,967 22 10 121735 MSCI MSCI, Inc. 4,243 2,009 2,234 17 8 91736 MWA Mueller Water Products, Inc. 4,063 3,106 957 16 12 41737 MFLX Multi-Fineline Electronix, Inc. 2,266 1,476 790 9 6 31738 MGAM Multimedia Games, Inc. 729 647 82 3 3 01739 MUR Murphy Oil Corporation 198,035 115,805 82,230 786 460 3261740 MVC MVC Capital, Inc. 10,324 10,076 248 41 40 11741 MWIV MWI Veterinary Supply, Inc. 1,152 776 376 5 3 11742 MYE Myers Industries, Inc. 3,496 2,921 575 14 12 21743 MYL Mylan, Inc. 239,672 148,736 90,936 951 590 3611744 MYRG MYR Group, Inc. 729 613 116 3 2 01745 MYRX Myrexis, Inc. 751 560 191 3 2 11746 MYGN Myriad Genetics, Inc. 38,712 14,269 24,443 154 57 971747 NABI Nabi Biophamaceuticals 7,448 4,319 3,129 30 17 121748 NBR Nabors Industries, Ltd. 444,698 305,687 139,011 1,765 1,213 5521749 NLC Nalco Holding Company 20,359 10,502 9,857 81 42 391750 NTE Nam Tai Electronics, Inc. 861 714 147 3 3 11751 NANO Nanometrics, Incorporated 26,745 19,919 6,826 106 79 271752 NAFC Nash Finch Company 829 529 300 3 2 11753 NBG National Bank of Greece S.A. 102,880 49,530 53,350 408 197 2121754 FIZZ National Beverage Corporation 1,049 633 416 4 3 21755 NCMI National CineMedia, Inc. 2,064 1,044 1,020 8 4 41756 NFP National Financial Partners 3,119 2,688 431 12 11 21757 NFG National Fuel Gas Company (New) 26,260 18,109 8,151 104 72 321758 NGG National Grid Plc 30,551 21,052 9,499 121 84 381759 NOV National Oilwell Varco, Inc. 588,809 338,911 249,898 2,337 1,345 9921760 NNN National Retail Properties 2,726 1,982 744 11 8 31761 NSM National Semiconductor Corporation 71,939 49,053 22,886 285 195 911762 NHP Nationwide Health Properties, Inc. 1,220 593 627 5 2 21763 NGS Natural Gas Services Group 3,163 2,220 943 13 9 41764 NRP Natural Resource Partners L.P. 18,207 13,645 4,562 72 54 181765 BABY Natus Medical, Inc. 2,517 1,129 1,388 10 4 61766 NCI Navigant Consulting, Inc. 4,271 3,426 845 17 14 31767 NAVG Navigators Group, Inc. 792 304 488 3 1 21768 NM Navios Maritime Holdings, Inc. 19,134 13,288 5,846 76 53 231769 NMM Navios Martime Partners LP 23,827 15,716 8,111 95 62 321770 NAV Navistar International Corp. 76,533 55,658 20,875 304 221 831771 NCS NCI Building Systems, Inc. 3,035 2,138 897 12 8 41772 NCR NCR Corporation 22,254 16,045 6,209 88 64 251773 NKTR Nektar Therapeutics 25,224 14,880 10,344 100 59 411774 NNI Nelnet, Inc. 2,779 1,173 1,606 11 5 61775 NPTN Neophotonics Corp. 7,021 3,549 3,472 32 16 161776 NEOP Neoprobe Corporation 186,646 164,195 22,451 872 767 1051777 UEPS Net 1 UEPS Technologies, Inc. 3,640 1,910 1,730 14 8 71778 NTAP NetApp, Inc. 618,467 380,380 238,087 2,454 1,509 9451779 NTES Netease.com, Inc. -ADR 164,922 86,158 78,764 654 342 3131780 NFLX NetFlix, Inc. 5,265,685 2,597,818 2,667,867 20,896 10,309 10,5871781 NTGR NETGEAR, Inc. 22,763 14,063 8,700 90 56 351782 NLST NetList, Inc. 7,236 6,586 650 29 26 31783 NETL NetLogic Microsystems, Inc. 189,428 101,043 88,385 752 401 3511784 NTCT NetScout Systems, Inc. 4,058 3,107 951 16 12 41785 NTSP Netspend Holdings, Inc. 4,553 1,754 2,799 18 7 111786 N NetSuite, Inc. 24,029 12,643 11,386 95 50 451787 NBIX Neurocrine Biosciences, Inc. 11,481 9,738 1,743 46 39 71788 NSR NeuStar, Inc. 11,974 6,206 5,768 48 25 231789 TNDM Neutral Tandem, Inc. 37,233 30,276 6,957 148 120 281790 NEWN New Energy Systems Group 4,777 3,140 1,637 26 17 91791 NGD New Gold, Inc. 209,769 176,346 33,423 832 700 1331792 NJR New Jersey Resources Corporation 2,358 1,897 461 9 8 2
CBOE HOLDINGS, INC. Page 35 2011 MARKET STATISTICS

Standard Symbol Stock Total Call Put Total Call Put
CBOE Equity Options Volume (Includes LEAPS)
Contract Volume Average Daily Volume
1793 EDU New Oriental Education & Technology Group, Inc. 80,497 27,397 53,100 319 109 2111794 NWY New York & Company, Inc. 3,630 2,969 661 14 12 31795 NYB New York Community Bancorp 67,496 37,953 29,543 268 151 1171796 NYT New York Times Co. (Class A) 29,747 22,667 7,080 118 90 281797 NAL NewAlliance Bancshares, Inc. 3,498 477 3,021 14 2 121798 NCT Newcastle Investment Corporation 35,998 24,637 11,361 143 98 451799 NWL Newell Rubbermaid, Inc. 71,035 49,500 21,535 282 196 851800 NFX Newfield Exploration Company (New) 138,377 52,898 85,479 549 210 3391801 NEU Newmarket Corporation 8,904 4,338 4,566 35 17 181802 NEM Newmont Mining Corporation 1,443,425 939,261 504,164 5,728 3,727 2,0011803 NWSA News Corp Class A 339,606 202,625 136,981 1,348 804 5441804 NWS News Corporation Ltd. (The) ADR 59,314 25,469 33,845 235 101 1341805 NXY Nexen, Inc. 135,543 94,390 41,153 538 375 1631806 NEE NextEra Energy, Inc. 47,332 30,845 16,487 188 122 651807 NGAS Ngas Resources, Inc. 15 15 0 0 0 01808 NICE Nice-Systems Ltd. 2,046 1,738 308 8 7 11809 NLSN Nielsen Holdings N.V. 4,990 4,461 529 20 18 21810 NIHD NII Holdings, Inc. 120,766 68,388 52,378 479 271 2081811 NKE NIKE, Inc. (Class B) 559,566 335,419 224,147 2,221 1,331 8891812 NTT Nippon Telegraph and Telephone Corporation 5,622 3,311 2,311 22 13 91813 NKA Niska Gas Storage Partners 16,987 8,755 8,232 67 35 331814 NI NISource, Inc. 33,050 31,179 1,871 131 124 71815 NMTI NMT Medical, Inc. 21 6 15 0 0 01816 NED Noah Education Holdings Ltd. 187 113 74 1 0 01817 NOAH Noah Holdings Ltd. 10,771 3,520 7,251 60 19 401818 NBL Noble Affiliates, Inc. 222,426 161,895 60,531 883 642 2401819 NE Noble Corporation 203,695 117,663 86,032 808 467 3411820 NOK Nokia Corporation ADR 1,414,948 933,176 481,772 5,615 3,703 1,9121821 NMR Nomura Holdings, Inc. 3,645 1,005 2,640 14 4 101822 NOR Noranda Aluminum Holding 16,518 12,012 4,506 66 48 181823 NAT Nordic American Tanker Shipping Limited 44,439 26,786 17,653 176 106 701824 NDZ Nordion, Inc. 610 167 443 2 1 21825 NDSN Nordson Corporation 8,734 4,457 4,277 35 18 171826 JWN Nordstrom, Inc. 164,117 82,860 81,257 651 329 3221827 NSC Norfolk Southern Corporation 242,459 139,843 102,616 962 555 4071828 NOA North American Energy Partners, Inc. 7,597 6,693 904 30 27 41829 PAL North American Palladium Ltd. 120,340 90,170 30,170 478 358 1201830 NU Northeast Utilities 4,154 3,595 559 16 14 21831 NAK Northern Dynasty Minerals 108,180 85,133 23,047 429 338 911832 NOG Northern Oil & Gas, Inc. 231,853 106,506 125,347 920 423 4971833 NTRS Northern Trust Bank Corporation 39,897 20,448 19,449 158 81 771834 NXG Northgate Minerals Corporation 18,434 9,114 9,320 73 36 371835 NOC Northrop Grumman Corporation 75,912 46,845 29,067 301 186 1151836 NRF Northstar Realty Finance Corporation 22,283 16,714 5,569 88 66 221837 NWN Northwest Natural Gas Company 8,009 4,736 3,273 32 19 131838 NWPX Northwest Pipe Company 5,648 2,478 3,170 22 10 131839 NWE NorthWestern Corp. 149 114 35 1 0 01840 NVMI Nova Measuring Instruments Ltd. 12,055 9,008 3,047 48 36 121841 NG NovaGold Resources, Inc. 529,136 226,327 302,809 2,100 898 1,2021842 NVS Novartis AG 373,705 177,933 195,772 1,483 706 7771843 NVTL Novatel Wireless, Inc. (New) 17,371 10,574 6,797 69 42 271844 NVAX Novavax, Inc. (New) 20,391 17,288 3,103 81 69 121845 NOVL Novell, Inc. 10,704 6,803 3,901 42 27 151846 NVLS Novellus Systems, Inc. 139,580 83,802 55,778 554 333 2211847 NVO Novo Nordisk 12,857 7,649 5,208 51 30 211848 NPSP NPS Pharmaceuticals, Inc. 73,748 53,289 20,459 293 211 811849 NRG NRG Energy, Inc. (New) 82,251 33,007 49,244 326 131 1951850 NST NSTAR 1,840 1,197 643 7 5 31851 NTLS Ntelos Holdings Corp. 30 17 13 0 0 01852 DCM NTT DOCOMO, Inc. 632 367 265 3 1 11853 NUS Nu Skin Enterprises, Inc. 15,615 6,321 9,294 62 25 371854 NUAN Nuance Communications, Inc. 173,340 145,433 27,907 688 577 1111855 NUE Nucor Corporation 353,964 206,153 147,811 1,405 818 5871856 NS NuStar Energy L.P. 6,074 3,940 2,134 24 16 8
CBOE HOLDINGS, INC. Page 36 2011 MARKET STATISTICS

Standard Symbol Stock Total Call Put Total Call Put
CBOE Equity Options Volume (Includes LEAPS)
Contract Volume Average Daily Volume
1857 NSH NuStar GP Holdings, LLC 1,074 661 413 4 3 21858 NTRI NutriSystem, Inc. 93,756 52,630 41,126 372 209 1631859 NUVA NuVasive, Inc. 22,067 12,444 9,623 88 49 381860 NVDA NVIDIA Corporation 2,117,450 1,387,821 729,629 8,403 5,507 2,8951861 NXPI NXP Semiconductors NV 141,107 102,209 38,898 560 406 1541862 NXTM NxStage Medical, Inc. 4,427 2,463 1,964 18 10 81863 NYX NYSE Euronext 529,182 363,887 165,295 2,100 1,444 6561864 OAS Oasis Petroleum, Inc. 38,612 30,739 7,873 153 122 311865 OXY Occidental Petroleum Corporation 763,664 416,967 346,697 3,030 1,655 1,3761866 ORIG Ocean Rig UDW, Inc. 128 64 64 2 1 11867 OII Oceaneering International, Inc. 38,322 20,882 17,440 152 83 691868 OCNF OceanFreight, Inc. 15 15 0 0 0 01869 CHUX O'Charley's, Inc. 3,199 2,941 258 13 12 11870 OZM Och-Ziff Capital Management Group 8,158 4,362 3,796 32 17 151871 OCLR Oclaro, Inc. 56,234 35,135 21,099 223 139 841872 OCLS Oculus Innovative Sciences, Inc. 1,451 1,447 4 6 6 01873 OCN Ocwen Financial Corporation 19,044 10,810 8,234 76 43 331874 OCZ OCZ Technology Group, Inc. 228,261 109,458 118,803 1,006 482 5231875 OMEX Odyssey Marine Exploration, Inc. 58,992 41,269 17,723 234 164 701876 ODP Office Depot, Inc. 127,685 109,473 18,212 507 434 721877 OMX OfficeMax, Incorporated 81,038 43,388 37,650 322 172 1491878 OIS Oil States International, Inc. 8,067 5,070 2,997 32 20 121879 BQI Oilsands Quest, Inc. 1,092 951 141 4 4 11880 OILT Oiltanking Partners LP 319 211 108 3 2 11881 ODFL Old Dominion Freight Line, Inc. 6,022 2,551 3,471 24 10 141882 ONB Old National Bancorp 979 586 393 4 2 21883 ORI Old Republic International Corporation 9,151 4,749 4,402 36 19 171884 OLN Olin Corporation 22,149 15,824 6,325 88 63 251885 ZEUS Olympic Steel, Inc. 5,083 2,567 2,516 20 10 101886 OMG OM Group, Inc. (New) 5,193 2,760 2,433 21 11 101887 OHI OMEGA Healthcare Investors, Inc. 7,397 4,894 2,503 29 19 101888 OME Omega Protein Corporation 6,765 4,671 2,094 27 19 81889 OMER Omeros Corporation 10,383 4,335 6,048 49 20 281890 OCR Omnicare, Inc. 59,732 37,824 21,908 237 150 871891 OMCL Omnicell, Inc. 907 447 460 4 2 21892 OMC Omnicom Group, Inc. 18,195 10,341 7,854 72 41 311893 OVTI OmniVision Technologies, Inc. 524,251 339,633 184,618 2,080 1,348 7331894 OMN Omnova Solutions, Inc. 4,435 3,847 588 18 15 21895 ONNN ON Semiconductor Corporation (New) 103,515 83,256 20,259 411 330 801896 OGXI OncoGenex Pharmaceutical, Inc. 1,958 1,572 386 8 6 21897 ONCY Oncolytics Biotech, Inc. 13,770 10,766 3,004 55 43 121898 ONTY Oncothyreon, Inc. 172,883 125,094 47,789 686 496 1901899 OKS ONEOK Partners, L.P. 14,435 10,354 4,081 57 41 161900 OKE ONEOK, Inc. 14,705 13,341 1,364 58 53 51901 ORCC Online Resources Corporation 370 218 152 1 1 11902 ONXX Onyx Pharmaceuticals 108,755 55,211 53,544 432 219 2121903 OTEX Open Text Corporation 21,593 8,871 12,722 86 35 501904 OPEN OpenTable, Inc. 358,635 174,614 184,021 1,423 693 7301905 OPXA Opexa Therapeutics, Inc. 7,552 7,354 198 30 29 11906 OPK Opko Health, Inc. 47,249 38,803 8,446 194 160 351907 OPLK Oplink Communications, Inc. (New) 12,144 7,154 4,990 48 28 201908 OPNT Opnet Technologies, Inc. 2,970 2,227 743 28 21 71909 OPXT Opnext, Inc. 5,174 3,773 1,401 25 18 71910 OPTR Optimer Pharmaceuticals, Inc. 154,867 107,383 47,484 615 426 1881911 OXPS optionsXpress Holdings, Inc. 26,845 14,956 11,889 107 59 471912 ORCL Oracle Corporation 2,339,513 1,366,433 973,080 9,284 5,422 3,8611913 OSUR Orasure Technologies 2,875 2,101 774 11 8 31914 ORB Orbital Sciences Corporation 3,628 3,223 405 14 13 21915 OWW Orbitz Worldwide, Inc. 4,723 4,136 587 19 16 21916 ORLY O'Reilly Automotive, Inc. 33,402 16,237 17,165 133 64 681917 OREX Orexigen Therapeutics, Inc. 268,269 146,970 121,299 1,065 583 4811918 ONP Orient Paper, Inc. 18,855 6,865 11,990 75 27 481919 OFG Oriental Financial Group, Inc. 3,523 1,307 2,216 14 5 91920 OEH Orient-Express Hotels Ltd. 4,606 1,471 3,135 18 6 12
CBOE HOLDINGS, INC. Page 37 2011 MARKET STATISTICS

Standard Symbol Stock Total Call Put Total Call Put
CBOE Equity Options Volume (Includes LEAPS)
Contract Volume Average Daily Volume
1921 SEED Origin Agritech Limited 33,001 23,704 9,297 131 94 371922 ORN Orion Marine Group, Inc. 1,537 1,285 252 6 5 11923 ORIT Oritani Financial Corporation 207 161 46 1 1 01924 OSK Oshkosh Corporation 71,835 43,162 28,673 285 171 1141925 OSIS OSI Systems, Inc. 3,465 2,628 837 14 10 31926 OSIR Osiris Therapeutics, Inc. 11,675 7,570 4,105 46 30 161927 OSG Overseas Shipholding Group, Inc. 124,784 59,601 65,183 495 237 2591928 OSTK Overstock.com, Inc. 18,035 9,314 8,721 72 37 351929 OC Owens Corning, Inc. 70,867 34,361 36,506 281 136 1451930 OI Owens-Illinois, Inc. 86,655 51,508 35,147 344 204 1391931 OXM Oxford Industries, Inc. 8,469 5,834 2,635 34 23 101932 PFCB P.F. Chang's China Bistro 26,587 12,099 14,488 106 48 571933 PNG PAA Natural Gas Storage LP 8,828 7,262 1,566 35 29 61934 PCAR PACCAR, Inc. 129,977 86,166 43,811 516 342 1741935 PACB Pacific Biosciences of California, Inc. 10,201 6,582 3,619 40 26 141936 PCBC Pacific Capital Bancorp. 4,282 2,182 2,100 17 9 81937 PSUN Pacific Sunwear of California, Inc. 8,813 4,384 4,429 35 17 181938 PKG Packaging Corp. of America 18,017 11,593 6,424 71 46 251939 PACW PacWest Bancorp 1,110 869 241 4 3 11940 PAET PAETEC Holding Corp. Class A 6,190 4,719 1,471 25 19 61941 PTIE Pain Therapeutics, Inc. 31,119 19,586 11,533 123 78 461942 PLL Pall Corporation 9,068 6,029 3,039 36 24 121943 PMTI Palomar Medical Technologies, Inc. 3,825 2,882 943 15 11 41944 PAAS Pan American Silver Corporation 305,491 204,779 100,712 1,212 813 4001945 P Pandora Media, Inc. 121,057 46,131 74,926 910 347 5631946 PNRA Panera Bread Company, Class A 105,309 53,711 51,598 418 213 2051947 PZZA Papa John's International, Inc. 4,542 2,973 1,569 18 12 61948 PRX Par Pharmaceutical Companies, Inc. 10,705 5,119 5,586 42 20 221949 PRGN Paragon Shipping, Inc. 7,021 5,979 1,042 28 24 41950 PMTC Parametric Technology Corporation (New) 8,211 4,651 3,560 33 18 141951 PRXL PAREXEL International Corp. 5,130 2,853 2,277 20 11 91952 PKD Parker Drilling Company (New) 9,749 8,980 769 39 36 31953 PH Parker-Hannifin Corporation 68,943 38,855 30,088 274 154 1191954 PKY Parkway Properties, Inc. 1,429 915 514 6 4 21955 PRE PartnerRE Ltd. 5,132 2,914 2,218 20 12 91956 PTI Patni Computer Systems Ltd. 2,781 1,583 1,198 11 6 51957 PCX Patriot Coal Corporation 1,073,070 741,505 331,565 4,258 2,942 1,3161958 PDCO Patterson Companies, Inc. 9,494 6,946 2,548 38 28 101959 PTEN Patterson UTI Energy, Inc. 127,707 76,434 51,273 507 303 2031960 PAYX Paychex, Inc. 101,000 72,161 28,839 401 286 1141961 PDLI PDL BioPharma, Inc. 31,534 24,140 7,394 125 96 291962 BTU Peabody Energy Corporation 840,614 475,589 365,025 3,336 1,887 1,4491963 PEB Pebblebrook Hotel Trust 2,896 897 1,999 18 6 121964 PEET Peet's Coffee & Tea, Inc. 24,557 16,601 7,956 97 66 321965 PEGA Pegasystems, Inc. 11,739 7,011 4,728 47 28 191966 PGH Pengrowth Energy Corporation 44,916 39,533 5,383 178 157 211967 PENN Penn National Gaming, Inc. 27,806 22,195 5,611 110 88 221968 PEI Penn Real Estate Investment Trust 6,485 5,242 1,243 26 21 51969 PVA Penn Virginia Corporation 10,026 7,794 2,232 40 31 91970 PVG Penn Virginia GP Holdings LP 2,018 284 1,734 8 1 71971 PVR Penn Virginia Resource Partners, LP 13,884 7,134 6,750 55 28 271972 PWE Penn West Petroleum Ltd. 68,566 49,913 18,653 272 198 741973 JCP Penney (J.C.) Company, Inc. 513,509 256,098 257,411 2,038 1,016 1,0211974 PMT Pennymac Mortgage Investment Trust 6,199 3,996 2,203 25 16 91975 PAG Penske Automotive Group 7,373 2,424 4,949 29 10 201976 PNR Pentair, Inc. 3,331 2,685 646 13 11 31977 PBCT People's United Financial, Inc. 23,257 16,024 7,233 92 64 291978 PBY Pep Boys--Manny, Moe, & Jack (The) 11,515 6,941 4,574 46 28 181979 POM Pepco Holdings, Inc. 5,865 4,938 927 23 20 41980 PEP PepsiCo, Inc. 868,885 502,783 366,102 3,448 1,995 1,4531981 PPHM Peregrine Pharmaceuticals, Inc. 18,279 11,934 6,345 73 47 251982 PWRD Perfect World Co. Ltd. - ADR 61,410 38,363 23,047 244 152 911983 PSEM Pericom Semiconductor Corporation (New) 1,359 1,172 187 5 5 11984 PKI Perkin-Elmer, Inc. 4,736 3,772 964 19 15 4
CBOE HOLDINGS, INC. Page 38 2011 MARKET STATISTICS

Standard Symbol Stock Total Call Put Total Call Put
CBOE Equity Options Volume (Includes LEAPS)
Contract Volume Average Daily Volume
1985 PBT Permian Basin Royalty Trust 9,624 5,948 3,676 38 24 151986 PRGO Perrigo Company 29,789 16,387 13,402 118 65 531987 PETS PetMed Express, Inc. 8,487 3,852 4,635 34 15 181988 PZE Petrobras Argentina S.A. 8,469 5,964 2,505 34 24 101989 PTR PetroChina Company Limited 40,288 21,809 18,479 160 87 731990 HK Petrohawk Energy Corporation 1,125,181 894,543 230,638 4,465 3,550 9151991 PBR Petroleo Brasileiro S.A.-ADR 2,182,246 1,395,157 787,089 8,660 5,536 3,1231992 PBR/A Petroleo Brasileiro S.A 5,261 3,488 1,773 21 14 71993 PETD Petroleum Development Corporation 6,186 4,610 1,576 25 18 61994 PQ PetroQuest Energy, Inc. 8,810 7,228 1,582 35 29 61995 PETM PETsMART, Inc. 17,566 10,966 6,600 70 44 261996 PFE Pfizer, Inc. 3,839,002 2,312,224 1,526,778 15,234 9,175 6,0591997 PFSW Pfsweb, Inc. 4,964 3,717 1,247 20 15 51998 PCG PG&E Corporation 15,539 7,171 8,368 62 28 331999 PPDI Pharmaceutical Product Development 31,580 19,291 12,289 125 77 492000 PCYC Pharmacyclics, Inc. (New) 89,127 37,329 51,798 354 148 2062001 VRUS Pharmasset, Inc. 149,387 88,874 60,513 593 353 2402002 PIP PharmAthene, Inc. 79,425 69,920 9,505 315 277 382003 PMC PharMerica Corporation 36,255 21,060 15,195 144 84 602004 PHH PHH Corporation 11,764 4,801 6,963 47 19 282005 PM Philip Morris International, Inc. 710,181 369,248 340,933 2,818 1,465 1,3532006 PVH Phillips-Van Heusen Corporation 40,389 18,648 21,741 160 74 862007 PNX Phoenix Companies, Inc. 1,483 1,482 1 6 6 02008 PLAB Photronics, Inc. 15,049 9,731 5,318 60 39 212009 PICO PICO Holdings, Inc. 10,034 4,161 5,873 40 17 232010 PNY Piedmont Natural Gas Company 1,136 900 236 5 4 12011 PDM Piedmont Office Realty Trust, Inc. 4,602 3,349 1,253 18 13 52012 PIR Pier 1 Imports, Inc. 44,793 32,539 12,254 178 129 492013 PPC Pilgrim's Pride Corporation 76,154 61,291 14,863 302 243 592014 PNK Pinnacle Entertainment, Inc. 9,292 5,605 3,687 37 22 152015 PNFP Pinnacle Financial Partners, Inc. 9,925 5,437 4,488 39 22 182016 PDC Pioneer Drilling Company 17,793 13,640 4,153 71 54 162017 PXD Pioneer Natural Resources Company 136,435 95,544 40,891 541 379 1622018 PJC Piper Jaffray Companies, Inc. 4,374 1,707 2,667 17 7 112019 PBI Pitney Bowes, Inc. 68,464 50,757 17,707 272 201 702020 PAA Plains All American Pipeline, L.P. 29,559 20,689 8,870 117 82 352021 PXP Plains Exploration & Production Company 587,063 334,233 252,830 2,330 1,326 1,0032022 PLT Plantronics, Inc. 3,979 2,311 1,668 16 9 72023 PTP Platinum Underwriters Holdings Ltd. 3,605 2,397 1,208 14 10 52024 PLXS Plexus Corporation, Inc. 4,725 3,561 1,164 19 14 52025 PCL Plum Creek Timber Company, LP 73,554 39,884 33,670 292 158 1342026 PSTI Pluristem Therapeutics, Inc. 6,015 5,041 974 26 22 42027 PLXT PLX Technology, I Inc. 423 362 61 2 1 02028 PMCS PMC-Sierra, Inc. 34,260 29,056 5,204 136 115 212029 PPMIQ PMI Group, Inc. 40,605 30,329 10,276 161 120 412030 PNC PNC Bank Corporation 439,688 221,477 218,211 1,745 879 8662031 PNM PNM Resources, Inc. (New) 1,310 1,105 205 5 4 12032 PII Polaris Industries, Inc. 53,472 28,312 25,160 212 112 1002033 RL Polo Ralph Lauren Corp. 182,245 84,679 97,566 723 336 3872034 PLCM Polycom, Inc. 90,853 59,770 31,083 361 237 1232035 POL PolyOne Corporation (New) 8,659 7,588 1,071 34 30 42036 PPO Polypore International, Inc. 81,879 53,916 27,963 325 214 1112037 PARD Poniard Pharmaceuticals, Inc. 1,211 1,181 30 5 5 02038 POOL Pool Corporation 3,717 1,254 2,463 15 5 102039 BPOP Popular, Inc. 81,840 50,350 31,490 325 200 1252040 PRAA Portfolio Recovery Associates, Inc. 1,160 472 688 5 2 32041 POR Portland General Electric Company 877 631 246 3 3 12042 PKX POSCO 25,955 11,216 14,739 103 45 582043 PPS Post Properties, Inc. 1,385 736 649 5 3 32044 POT Potash Corporation of Saskatchewan, Inc. 2,314,459 1,417,076 897,383 9,184 5,623 3,5612045 PCH Potlatch Holdings, Inc. 4,314 3,332 982 17 13 42046 POWL Powell Industries, Inc. 3,392 2,299 1,093 13 9 42047 POWI Power Integrations, Inc. 1,292 939 353 5 4 12048 PWER Power-One, Inc. 216,172 119,170 97,002 858 473 385
CBOE HOLDINGS, INC. Page 39 2011 MARKET STATISTICS

Standard Symbol Stock Total Call Put Total Call Put
CBOE Equity Options Volume (Includes LEAPS)
Contract Volume Average Daily Volume
2049 PWAV Powerwave Technologies, Inc. 26,373 14,741 11,632 105 58 462050 POZN POZEN, Inc. 3,591 2,940 651 14 12 32051 PPG PPG Industries, Inc. 48,185 27,744 20,441 191 110 812052 PPL PPL Corporation 89,269 49,066 40,203 354 195 1602053 PX Praxair, Inc. 45,854 26,818 19,036 182 106 762054 PCP Precision Castparts Corp. 51,087 28,529 22,558 203 113 902055 PDS Precision Drilling Corporation 13,886 11,489 2,397 55 46 102056 PPD Pre-Paid Legal Services, Inc. 6,100 1,449 4,651 24 6 182057 PCLN Priceline.com, Inc. 1,294,732 626,155 668,577 5,138 2,485 2,6532058 PSMT PriceSmart, Inc. 18,527 11,868 6,659 74 47 262059 PDE Pride International 35,453 23,937 11,516 141 95 462060 PRI Primerica, Inc. 1,593 1,133 460 6 4 22061 PFG Principal Financial Group, Inc. 16,924 7,854 9,070 67 31 362062 PVTB PrivateBancorp, Inc. 2,338 1,700 638 9 7 32063 PRA ProAssurance Corporation 2,059 1,074 985 8 4 42064 PKT Procera Networks, Inc. 42,944 32,326 10,618 193 146 482065 PG Procter & Gamble Company (The) 1,462,553 833,110 629,443 5,804 3,306 2,4982066 PGNX Progenics Pharmaceuticals, Inc. 15,044 11,371 3,673 60 45 152067 PGN Progress Energy, Inc. 29,049 19,617 9,432 115 78 372068 BIN Progressive Waste Solutions Ltd. 106 59 47 0 0 02069 AMB ProLogis, Inc. 1,924 634 1,290 8 3 52070 PLD ProLogis, Inc. 45,011 25,408 19,603 179 101 782071 PSEC Prospect Capital Corporation 26,376 19,284 7,092 105 77 282072 PB Prosperity Bancshares, Inc. 3,557 2,746 811 14 11 32073 PLX Protalix BioTherapeutics, Inc. 56,456 33,574 22,882 224 133 912074 PL Protective Life Corporation 6,017 4,118 1,899 24 16 82075 PVX Provident Energy Ltd. 29,206 27,024 2,182 116 107 92076 PRU Prudential Financial, Inc. 283,299 161,654 121,645 1,124 641 4832077 PUK Prudential PLC 3,618 1,952 1,666 14 8 72078 PSB PS Business Parks, Inc. 3,760 1,067 2,693 15 4 112079 PSDV pSivida Corporation 18,247 15,051 3,196 72 60 132080 PSSI PSS World Medical 7,907 5,761 2,146 31 23 92081 PEG Public Service Enterprise Group, Incorporated 21,732 11,934 9,798 86 47 392082 PSA Public Storage 19,899 9,493 10,406 79 38 412083 PUDA Puda Coal, Inc. 120,211 63,147 57,064 477 251 2262084 PHM PulteGroup, Inc. 387,245 266,114 121,131 1,537 1,056 4812085 QEP QEP Resources, Inc. 13,280 10,783 2,497 53 43 102086 QGEN Qiagen N.V. 4,530 2,118 2,412 18 8 102087 XING Qiao Xing Universal Resources, Inc. 53,560 32,241 21,319 213 128 852088 QIHU Qihoo 360 Technology Company Limited 157,045 73,548 83,497 844 395 4492089 QLIK QLIK Technologies, Inc. 120,044 90,065 29,979 476 357 1192090 QLGC QLogic Corporation 37,239 30,312 6,927 148 120 272091 QLTI QLT, Inc. 19,906 7,789 12,117 79 31 482092 QRE QR Energy LP 8,515 6,860 1,655 34 28 72093 QCOM QUALCOMM, Inc. 2,649,352 1,653,282 996,070 10,513 6,561 3,9532094 QSII Quality Systems, Inc. 21,906 9,479 12,427 87 38 492095 NX Quanex Corporation 608 291 317 2 1 12096 PWR Quanta Services, Inc. 41,815 26,072 15,743 166 103 622097 QTM Quantum Corporation 2,871 2,435 436 11 10 22098 QPSA Quepasa Corporation 58,239 41,799 16,440 262 188 742099 DGX Quest Diagnostics, Incorporated 27,069 14,680 12,389 107 58 492100 QRM Quest Rare Minerals Ltd. 14,908 10,285 4,623 110 76 342101 QSFT Quest Software, Inc. 3,130 1,294 1,836 12 5 72102 STR Questar Corporation 11,348 8,000 3,348 45 32 132103 QCOR Questor Pharmaceuticals, Inc. 56,037 37,177 18,860 222 148 752104 KWK Quicksilver Resources, Inc. 171,070 124,380 46,690 679 494 1852105 QDEL Quidel Corporation 7,394 4,228 3,166 29 17 132106 ZQK Quiksilver, Inc. 22,333 18,070 4,263 89 72 172107 Q Qwest Communications Int'l. 12,524 8,967 3,557 50 36 142108 RAX Rackspace Hosting, Inc. 204,844 105,469 99,375 813 419 3942109 RDN Radian Group, Inc. 223,847 131,770 92,077 888 523 3652110 RADS Radiant Systems, Inc. 10,954 7,990 2,964 43 32 122111 RSH RadioShack 249,501 164,197 85,304 990 652 3392112 RDNT RadNet, Inc. 2,556 2,323 233 10 9 1
CBOE HOLDINGS, INC. Page 40 2011 MARKET STATISTICS

Standard Symbol Stock Total Call Put Total Call Put
CBOE Equity Options Volume (Includes LEAPS)
Contract Volume Average Daily Volume
2113 RVSN Radvision Ltd. 14,364 9,015 5,349 57 36 212114 RDWR RADWARE Ltd. 78,100 51,199 26,901 310 203 1072115 RA RailAmerica, Inc. 5,960 4,492 1,468 24 18 62116 RAS RAIT Financial Trust 30,335 22,173 8,162 120 88 322117 RAH Ralcorp Holdings, Inc. 55,311 38,384 16,927 219 152 672118 RMBS Rambus, Inc. 574,853 400,544 174,309 2,281 1,589 6922119 RPT Ramco-Gershenson Properties Trust 4,967 70 4,897 20 0 192120 GOLD Randgold Resources Limited 125,332 77,131 48,201 497 306 1912121 RRC Range Resources Corporation 365,915 230,030 135,885 1,452 913 5392122 RPTP Raptor Pharmaceuticals Corporation 49,081 34,454 14,627 195 137 582123 REE Rare Element Resources Ltd. 447,755 255,270 192,485 1,777 1,013 7642124 RZTIE RASER Technologies, Inc. 1 0 1 0 0 02125 RJF Raymond James Financial, Inc. 7,601 5,876 1,725 30 23 72126 RYN Rayonier, Inc. 15,821 10,309 5,512 63 41 222127 RTN Raytheon Company 121,156 62,821 58,335 481 249 2312128 RCRC RC2 Corporation 4,175 2,005 2,170 17 8 92129 RLOC ReachLocal, Inc. 11,896 8,403 3,493 52 37 152130 RDA Reader's Digest Association, Inc. (Class A) 534 317 217 2 1 12131 RLD RealD, Inc. 45,367 28,189 17,178 180 112 682132 RNWK RealNetworks, Inc. 498 302 196 2 1 12133 RP RealPage, Inc. 2,832 1,545 1,287 11 6 52134 O Realty Income Corporation 31,528 19,959 11,569 125 79 462135 RHT Red Hat, Inc. 138,103 87,561 50,542 548 347 2012136 RRGB Red Robin Gourmet Burgers, Inc. 54,588 44,454 10,134 217 176 402137 RDDY Reddy Ice Holdings, Inc. 185 171 14 1 1 02138 REDF Rediff.com India 50,495 31,629 18,866 200 126 752139 RWT Redwood Trust, Inc. 2,180 1,702 478 9 7 22140 RBC Regal Beloit 2,152 1,028 1,124 9 4 42141 RGC Regal Entertainment Group, Class A 21,796 16,422 5,374 86 65 212142 REG Regency Centers Corporation 1,477 915 562 6 4 22143 RGP Regency Energy Partners LP 12,347 7,961 4,386 49 32 172144 REGN Regeneron Pharmaceuticals, Inc. 116,496 58,508 57,988 462 232 2302145 RF Regions Financial Corp. 402,344 236,761 165,583 1,597 940 6572146 RGS Regis Corporation 7,183 4,811 2,372 29 19 92147 RHB RehabCare Group, Inc. 949 540 409 4 2 22148 RGA Reinsurance Group of America 2,612 1,459 1,153 10 6 52149 RS Reliance Steel & Aluminum Co. 24,001 14,947 9,054 95 59 362150 RNR RenaissanceRe Holdings Ltd. 7,779 5,147 2,632 31 20 102151 SOL Renesola Limited 127,582 89,121 38,461 506 354 1532152 RENN Renren, Inc. 283,806 144,317 139,489 1,752 891 8612153 RCII Rent-A-Center, Inc. 3,461 2,381 1,080 14 9 42154 RNF Rentech Nitrogen Partners LP 778 384 394 26 13 132155 RGEN Repligen Corp. 34,567 6,487 28,080 137 26 1112156 RPRX Repros Therapeutics, Inc. 22,647 10,825 11,822 90 43 472157 REP Repsol, S.A. ADR 3,238 1,931 1,307 13 8 52158 RJET Republic Airways Holdings, Inc. 21,716 19,646 2,070 86 78 82159 RSG Republic Services, Inc.-CL A 8,473 6,329 2,144 34 25 92160 RIMM Research in Motion Limited 5,967,119 3,103,181 2,863,938 23,679 12,314 11,3652161 RMD ResMed, Inc. 14,584 9,944 4,640 58 39 182162 REN Resolute Energy Corporation 46,159 27,694 18,465 183 110 732163 RSO Resource Capital Corporation 10,887 7,826 3,061 43 31 122164 RECN Resources Connection, Inc. (New) 2,836 1,919 917 11 8 42165 ROIC Retail Opportunity Investments Corp. 1,660 1,176 484 8 6 22166 REV Revlon, Inc. 14,624 11,527 3,097 58 46 122167 REXX Rex Energy Corporation 34,439 25,427 9,012 137 101 362168 RAI Reynolds American, Inc. 109,308 59,695 49,613 434 237 1972169 RFMD RF Micro Devices, Inc. 107,970 66,514 41,456 428 264 1652170 RIC Richmont Mines, Inc. 10,667 7,814 2,853 63 46 172171 RICK Rick's Cabaret Incorp., Inc. 3,787 2,995 792 15 12 32172 RIGL Rigel Pharmaceuticals, Inc. 2,727 2,447 280 11 10 12173 RNOW RightNow Technologies, Inc. 11,109 4,566 6,543 44 18 262174 RINO Rino International Corporation 2,175 244 1,931 9 1 82175 RIO Rio Tinto plc 218,198 117,933 100,265 866 468 3982176 RBA Ritchie Bros. Auctioneers, Inc. 13,052 4,535 8,517 52 18 34
CBOE HOLDINGS, INC. Page 41 2011 MARKET STATISTICS

Standard Symbol Stock Total Call Put Total Call Put
CBOE Equity Options Volume (Includes LEAPS)
Contract Volume Average Daily Volume
2177 RAD Rite Aid Corporation 24,109 19,096 5,013 96 76 202178 RVBD Riverbed Technology, Inc. 734,702 431,945 302,757 2,915 1,714 1,2012179 RLI RLI Corporation 4,119 3,223 896 16 13 42180 RLJ RLJ Lodging Trust 899 843 56 6 6 02181 RBN Robbins & Myers, Inc. 12,368 7,881 4,487 49 31 182182 RHI Robert Half International, Inc. 5,600 3,590 2,010 22 14 82183 RKT Rock-Tenn Company 18,931 12,044 6,887 75 48 272184 ROK Rockwell Automation, Inc. 42,850 30,104 12,746 170 119 512185 COL Rockwell Collins 26,605 19,827 6,778 106 79 272186 RMTI Rockwell Medical Technologies, Inc. 12,438 8,346 4,092 49 33 162187 ROC Rockwood Holdings, Inc. 60,138 40,851 19,287 239 162 772188 RODM Rodman & Renshaw Capital Group, Inc. 2,644 2,584 60 10 10 02189 RSTI Rofin-Sinar Technologies, Inc. 3,027 2,150 877 12 9 32190 RCI Rogers Communications-CL B 3,149 1,488 1,661 12 6 72191 ROG Rogers Corporation 1,645 1,140 505 7 5 22192 ROL Rollins, Inc. 653 368 285 3 1 12193 ROSE Rosetta Resources, Inc. 46,851 28,518 18,333 186 113 732194 RST Rosetta Stone, Inc. 21,021 7,706 13,315 83 31 532195 ROST Ross Stores, Inc. 98,304 63,952 34,352 390 254 1362196 ROVI Rovi Corporation 65,113 42,146 22,967 258 167 912197 RDC Rowan Companies, Inc. 94,747 59,911 34,836 376 238 1382198 RY Royal Bank of Canada 52,399 30,398 22,001 208 121 872199 RBS Royal Bank of Scotland Group plc 39,898 14,462 25,436 158 57 1012200 RCL Royal Caribbean Cruises Ltd. 262,413 126,111 136,302 1,041 500 5412201 RDSB Royal Dutch Shell plc 18,722 16,046 2,676 74 64 112202 RDSA Royal Dutch Shell PLC 104,623 60,747 43,876 415 241 1742203 RGLD Royal Gold, Inc. 116,386 61,184 55,202 462 243 2192204 RES RPC, Inc. 68,495 54,606 13,889 272 217 552205 RPM RPM International, Inc. 8,804 7,202 1,602 35 29 62206 RPXC RPX Corp. 3,132 2,361 771 20 15 52207 RRR RSC Holdings, Inc. 20,380 17,985 2,395 81 71 102208 RTIX RTI Biologics, Inc. 251 76 175 2 1 22209 RTI RTI International Metals 21,262 13,483 7,779 84 54 312210 RBY Rubicon Minerals Corporation 97,039 82,146 14,893 385 326 592211 RBCN Rubicon Technology, Inc. 112,205 64,721 47,484 445 257 1882212 RT Ruby Tuesday, Inc. 13,838 7,400 6,438 55 29 262213 RTEC Rudolph Technologies, Inc. 1,023 778 245 4 3 12214 RUE Rue 21, Inc. 6,683 4,445 2,238 27 18 92215 RUTH Ruth's Hospitality Group, Inc. 16,966 13,607 3,359 67 54 132216 RYAAY Ryanair Holdings plc. 1,945 1,068 877 8 4 32217 R Ryder System, Inc. 11,909 6,308 5,601 47 25 222218 SONE S1 Corporation 1,577 290 1,287 6 1 52219 SFE Safeguard Securities, Inc. 12,308 7,225 5,083 49 29 202220 SWY Safeway, Inc. 122,798 56,722 66,076 487 225 2622221 SAIA Saia, Inc. 707 538 169 3 2 12222 SAI SAIC, Inc. 19,150 10,465 8,685 76 42 342223 SKS Saks, Incorporated 78,542 36,024 42,518 312 143 1692224 CRM Salesforce.com 1,387,639 663,133 724,506 5,507 2,631 2,8752225 SLXP Salix Pharmaceuticals, Ltd 50,741 23,321 27,420 201 93 1092226 SBH Sally Beauty Holdings, Inc. 12,524 5,978 6,546 50 24 262227 SJT San Juan Basin Royalty Trust 20,525 11,255 9,270 81 45 372228 SAFM Sanderson Farms, Inc. 26,383 10,852 15,531 105 43 622229 SNDK SanDisk Corporation 1,116,798 658,017 458,781 4,432 2,611 1,8212230 SD SandRidge Energy, Inc. 1,264,581 915,278 349,303 5,018 3,632 1,3862231 SGMO Sangamo BioSciences, Inc. 39,634 32,328 7,306 157 128 292232 SANM Sanmina SCI Corporation 21,356 16,546 4,810 85 66 192233 SNY Sanofi 116,351 55,343 61,008 462 220 2422234 SNTS Santarus, Inc. (New) 3,785 2,339 1,446 15 9 62235 SAP SAP AG 91,008 53,696 37,312 361 213 1482236 SAPE Sapient Corporation (New) 5,135 2,993 2,142 20 12 92237 SLE Sara Lee Corporation 377,861 234,295 143,566 1,499 930 5702238 SSL SASOL LTD. 7,874 4,718 3,156 31 19 132239 SATC Satcon Technology Corp. 22,609 17,613 4,996 90 70 202240 SAY Satyam Computer Services Limited 202 31 171 1 0 1
CBOE HOLDINGS, INC. Page 42 2011 MARKET STATISTICS

Standard Symbol Stock Total Call Put Total Call Put
CBOE Equity Options Volume (Includes LEAPS)
Contract Volume Average Daily Volume
2241 SHS Sauer-Danfoss, Inc. 6,793 4,768 2,025 40 28 122242 SVNT Savient Pharmaceuticals, Inc. 182,541 114,017 68,524 724 452 2722243 SVVS SAVVIS, Inc. 35,207 19,785 15,422 140 79 612244 SBAC SBA Communications Corporation 13,694 7,338 6,356 54 29 252245 SCG SCANA Corporation (New) 7,579 5,915 1,664 30 23 72246 HSIC Schein (Henry), Inc. 2,939 2,708 231 12 11 12247 SLB Schlumberger Limited 1,551,387 866,693 684,694 6,156 3,439 2,7172248 SCHN Schnitzer Steel Industries, Inc. 27,095 14,815 12,280 108 59 492249 SCHL Scholastic Corporation 10,108 7,043 3,065 40 28 122250 SCHW Schwab Corporation (The Charles) 175,728 113,529 62,199 697 451 2472251 SWM Schweitzer-Mauduit Int'l, Inc. 11,904 5,284 6,620 47 21 262252 SCLN SciClone Pharmaceuticals, Inc. 15,397 6,164 9,233 61 24 372253 SGMS Scientific Games Corporation 16,799 11,773 5,026 67 47 202254 SNI Scripps Networks Interactive, Inc. 26,710 13,343 13,367 106 53 532255 SA Seabridge Gold, Inc. 85,507 57,647 27,860 339 229 1112256 SDRL Seadrill Ltd. 139,685 90,780 48,905 554 360 1942257 STX Seagate Technology 914,650 627,654 286,996 3,630 2,491 1,1392258 HAWK Seahawk Drilling, Inc. 16,557 6,524 10,033 66 26 402259 SEE Sealed Air Corporation "New" 15,641 9,406 6,235 62 37 252260 ZZ Sealy Corporation 2,489 1,177 1,312 10 5 52261 SHLD Sears Holdings Corporation 427,853 215,704 212,149 1,698 856 8422262 SSW Seaspan Corporation 37,924 21,576 16,348 150 86 652263 SGEN Seattle Genetics, Inc. (New) 154,972 88,924 66,048 615 353 2622264 SEIC SEI Investments Company 495 200 295 2 1 12265 SCSS Select Comfort Corporation 27,712 16,600 11,112 110 66 442266 SEM Select Medical Holdings Corporation 1,634 1,518 116 6 6 02267 SIGI Selective Insurance Group, Inc. 36 36 0 0 0 02268 SRE Sempra Energy 32,488 12,935 19,553 129 51 782269 SMTC Semtech Corporation 12,515 10,585 1,930 50 42 82270 SNH Senior Housing Properties Trust 10,593 8,476 2,117 42 34 82271 ST Sensata Technologies Holding 27,759 8,098 19,661 110 32 782272 SXT Sensient Technologies Corporation 327 123 204 1 0 12273 SQNM Sequenom, Inc. 206,048 152,901 53,147 818 607 2112274 SVM ServiceMaster Co. 493,226 260,125 233,101 1,957 1,032 9252275 SREV ServiceSource Int'l. Inc. 12,399 7,992 4,407 69 44 242276 SFN SFN Group Inc. 11,523 7,181 4,342 46 28 172277 GAME Shanda Games Ltd. 16,186 13,409 2,777 64 53 112278 SNDA Shanda Interactive Entertainment Ltd. 70,534 40,271 30,263 280 160 1202279 SJR Shaw Communications, Inc. 272 204 68 1 1 02280 SPSC Shaw Communications, Inc. 234 181 53 3 2 12281 SHW Sherwin-Williams Company (The) 31,392 18,935 12,457 125 75 492282 SFL Ship Finance International Limited 30,308 12,268 18,040 120 49 722283 SHPGY Shire plc 32,866 20,036 12,830 130 80 512284 SHFL Shuffle Master, Inc. 5,811 3,579 2,232 23 14 92285 SFLY Shutterfly, Inc. 12,226 7,769 4,457 49 31 182286 SI Siemens AG 41,061 19,404 21,657 163 77 862287 SWIR Sierra Wireless, Inc. 8,401 2,872 5,529 33 11 222288 SIFY Sify Technologies Limited 74,442 41,695 32,747 295 165 1302289 SIGA SIGA Technologies, Inc. 79,863 58,726 21,137 317 233 842290 SIGM Sigma Designs, Inc. 37,162 24,079 13,083 147 96 522291 SIAL Sigma-Aldrich Corporation 13,951 9,229 4,722 55 37 192292 SBNY Signature Bank 1,622 781 841 6 3 32293 SIG Signet Jewelers Ltd. 7,618 4,529 3,089 30 18 122294 SLGN Silgan Holdings, Inc. 9,467 6,164 3,303 38 24 132295 SGI Silicon Graphics International Corp. 86,973 69,466 17,507 345 276 692296 SIMG Silicon Image, Inc. 41,782 36,345 5,437 166 144 222297 SLAB Silicon Laboratories, Inc. 24,804 17,397 7,407 98 69 292298 SIMO Silicon Motion Technology Corporation 24,976 21,474 3,502 99 85 142299 SSRI Silver Standard Resources, Inc. 266,721 197,865 68,856 1,058 785 2732300 SLW Silver Wheaton Corporation 3,036,146 2,082,376 953,770 12,048 8,263 3,7852301 SCR Simcere Pharmaceutical Group 370 274 96 1 1 02302 SPG Simon Property Group, Inc. 200,554 79,994 120,560 796 317 4782303 SSD Simpson Manufacturing Co., Inc. 4,432 2,331 2,101 18 9 82304 SMS Sims Metal Management Limited 3,042 2,048 994 12 8 4
CBOE HOLDINGS, INC. Page 43 2011 MARKET STATISTICS

Standard Symbol Stock Total Call Put Total Call Put
CBOE Equity Options Volume (Includes LEAPS)
Contract Volume Average Daily Volume
2305 SINA SINA Corporation 1,729,558 1,062,216 667,342 6,863 4,215 2,6482306 SCEI Sino Clean Energy, Inc. 40,075 19,379 20,696 237 115 1222307 SCOK SinoCoking Coal & Coke Chemical Inds. 43,096 25,660 17,436 171 102 692308 SHI Sinopec Shanghai Petrochemical Co. Ltd. 6,094 2,383 3,711 24 9 152309 CTESY Sinotech Energy Ltd. 8,449 2,412 6,037 34 10 242310 SVA Sinovac Biotech Ltd. 3,455 3,229 226 14 13 12311 SIRI SIRIUS XM Radio 1,406,710 1,194,392 212,318 5,582 4,740 8432312 SIRO Sirona Dental Systems, Inc. 2,659 1,476 1,183 11 6 52313 SIX Six Flags, Inc. 12,741 6,531 6,210 51 26 252314 SKX Skechers U.S.A., Inc. 95,291 55,260 40,031 378 219 1592315 SKH Skilled Healthcare Group, Inc. 59,575 38,037 21,538 236 151 852316 SKUL Skullcandy, Inc. 8,819 5,566 3,253 83 53 312317 SPU SkyPeople Fruit Juice, Inc. 30,768 10,877 19,891 122 43 792318 SKYW SkyWest Inc. 1,378 697 681 5 3 32319 SWKS Skyworks Solutions, Inc.. 602,188 411,683 190,505 2,390 1,634 7562320 SLG SL Green Realty Corp. 23,439 11,647 11,792 93 46 472321 SLM SLM Corporation 168,690 85,763 82,927 669 340 3292322 SM SM Energy Company 25,973 15,718 10,255 103 62 412323 SMBL Smart Balance, Inc. 3,445 2,900 545 14 12 22324 SMOD Smart Modular Technologies WWH, Inc. 23,545 18,077 5,468 93 72 222325 SMT Smart Technologies, Inc. 13,057 9,277 3,780 52 37 152326 HEAT Smartheat, Incorp. 11,609 8,158 3,451 46 32 142327 SWHC Smith & Wesson Holding Corporation 16,487 14,953 1,534 65 59 62328 SMSI Smith Micro Software, Inc. 9,841 6,223 3,618 39 25 142329 SFD Smithfield Foods, Inc. 97,834 73,825 24,009 388 293 952330 SMTX SMTC Corporation 557 498 59 2 2 02331 SSCC Smurfit Stone Container Corporation 29,415 16,272 13,143 117 65 522332 SNA Snap-On, Inc. 6,648 4,217 2,431 26 17 102333 SQM Sociedad Quimica Y Minera de Chile SA 25,051 16,657 8,394 99 66 332334 SODA SodaStream Int'l. Ltd. 241,394 148,456 92,938 1,349 829 5192335 SOHU Sohu.com, Inc. 327,795 196,138 131,657 1,301 778 5222336 SLRC Solar Capital Ltd. 11,188 9,876 1,312 46 41 52337 SWI Solarwinds, Inc. 50,149 18,877 31,272 199 75 1242338 SZYM Solazyme, Inc. 19,161 16,377 2,784 135 115 202339 SLH Solera Holdings, Inc. 614 441 173 2 2 12340 SOA Solutia, Inc. 39,453 22,678 16,775 157 90 672341 SOMX Somaxon Pharmaceuticals, Inc. 112,050 101,189 10,861 445 402 432342 SAH Sonic Automotive, Inc. 12,973 10,691 2,282 51 42 92343 SONC Sonic Corp. 5,664 3,477 2,187 22 14 92344 SNIC Sonic Solutions 10,379 5,212 5,167 41 21 212345 SON Sonoco Products Company 6,977 5,707 1,270 28 23 52346 SONO SonoSite, Inc. 6,990 4,010 2,980 28 16 122347 SONS Sonus Networks, Inc. 76,360 71,972 4,388 303 286 172348 SNE Sony Corporation ADR 108,381 50,428 57,953 430 200 2302349 SORL SORL Auto Parts, Inc. 1,823 869 954 7 3 42350 BID Sotheby's 76,731 39,136 37,595 304 155 1492351 FIRE Sourcefire, Incorp. 36,402 26,096 10,306 144 104 412352 SJI South Jersey Industries, Inc. 2,075 1,730 345 8 7 12353 SO Southern Company (The) 158,779 92,136 66,643 630 366 2642354 PCU Southern Copper Corporation 186,826 107,071 79,755 741 425 3162355 SUG Southern Union Company 89,115 66,652 22,463 354 264 892356 LUV Southwest Airlines Co. 105,504 76,836 28,668 419 305 1142357 SWN Southwestern Energy Company 477,196 338,331 138,865 1,894 1,343 5512358 SSS Sovran Self Storage, Inc. 1,675 1,406 269 7 6 12359 SPAR Spartan Motors, Inc. 2,259 1,404 855 9 6 32360 SEH Spartech Corporation 4,715 489 4,226 19 2 172361 SE Spectra Energy Corporation 54,479 40,208 14,271 216 160 572362 SEP Spectra Energy Partners LP 5,186 3,734 1,452 21 15 62363 SPB Spectrum Brands Holdings, Inc. 2,000 747 1,253 19 7 122364 SPPI Spectrum Pharmaceuticals, Inc. 256,451 151,324 105,127 1,018 600 4172365 SPR Spirit Aerosystems Holdings, Inc. 9,747 6,650 3,097 39 26 122366 SPRD Spreadtrum Communications, Inc. 329,098 149,043 180,055 1,306 591 7152367 S Sprint Nextel Corporation 1,998,517 1,510,617 487,900 7,931 5,995 1,9362368 SPW SPX Corporation 20,105 8,566 11,539 80 34 46
CBOE HOLDINGS, INC. Page 44 2011 MARKET STATISTICS

Standard Symbol Stock Total Call Put Total Call Put
CBOE Equity Options Volume (Includes LEAPS)
Contract Volume Average Daily Volume
2369 SRX SRA International, Inc. 108,101 79,685 28,416 429 316 1132370 SSNC SS&C Technologies Holdings, Inc. 1,617 917 700 6 4 32371 STJ St. Jude Medical, Inc. 105,094 66,323 38,771 417 263 1542372 STAG STAG Industrial, Inc. 844 671 173 5 4 12373 STMP Stamps.com, Inc. (New) 17,718 11,646 6,072 70 46 242374 SMSC Standard Microsystems Corp. 3,338 1,164 2,174 13 5 92375 SMP Standard Motor Products, Inc. 3,517 2,142 1,375 14 9 52376 SPF Standard Pacific Corp. 31,910 24,469 7,441 127 97 302377 SWK Stanley Works (The) 52,477 26,318 26,159 208 104 1042378 SPLS Staples, Inc. 148,743 93,670 55,073 590 372 2192379 SBLK Star Bulk Carriers Corp. 597 454 143 2 2 12380 CIGX Star Scientific, Inc. 334,423 265,749 68,674 1,327 1,055 2732381 SBUX Starbucks Corporation 699,984 323,555 376,429 2,778 1,284 1,4942382 SRT StarTek, Inc. 242 221 21 1 1 02383 HOT Starwood Hotels & Resorts Worldwide, Inc. 326,616 181,118 145,498 1,296 719 5772384 STWD Starwood Property Trust, Inc. 9,158 6,541 2,617 36 26 102385 STT State Street Corporation 195,918 105,225 90,693 777 418 3602386 STO Statoil ASA 44,333 30,206 14,127 176 120 562387 STEC STEC, Inc. 418,833 254,926 163,907 1,662 1,012 6502388 STLD Steel Dynamics, Inc. 162,620 117,313 45,307 645 466 1802389 SCS Steelcase, Inc.-Class A 4,227 3,762 465 17 15 22390 SMRT Stein Mart, Inc. 1,649 625 1,024 7 2 42391 SRCL Stericycle, Inc. 24,773 12,728 12,045 98 51 482392 STE STERIS Corporation 627 454 173 2 2 12393 SBIB Sterling Bancshares, Inc. 749 496 253 3 2 12394 STRL Sterling Construction Company, Inc. 686 301 385 3 1 22395 STSA Sterling Financial Corporation 6,444 1,191 5,253 26 5 212396 SLT Sterlite Industries (India) Ltd. 20,586 7,726 12,860 82 31 512397 STXS Sterotaxis, Inc. 1,426 1,301 125 6 5 02398 SHOO Steven Madden, Ltd. 3,427 2,605 822 14 10 32399 STEI Stewart Enterprises, Inc. 446 333 113 2 1 02400 SF Stifel Financial Corp. 8,187 6,274 1,913 32 25 82401 SWC Stillwater Mining Company 307,219 199,430 107,789 1,219 791 4282402 STM STMicroelectronics N.V. 13,904 11,535 2,369 55 46 92403 SGY Stone Energy Corp. 47,501 31,221 16,280 188 124 652404 STON Stonemor Partners LP 21,299 8,628 12,671 85 34 502405 SRI Stoneridge, Inc. 2,342 1,392 950 9 6 42406 STRI STR Holdings, Inc. 19,727 6,725 13,002 78 27 522407 SSYS Stratasys, Inc. 7,755 3,790 3,965 31 15 162408 BEE Strategic Hotels & Resorts, Inc. 4,189 2,969 1,220 17 12 52409 STRA Strayer Education, Inc. 17,749 8,114 9,635 70 32 382410 SYK Stryker Corporation 72,236 42,100 30,136 287 167 1202411 RGR Sturm, Ruger & Company, Inc. 13,304 8,498 4,806 53 34 192412 SPH Suburban Propane Partners LP 3,255 1,488 1,767 13 6 72413 SFSF SuccessFactors, Inc. 142,445 87,190 55,255 565 346 2192414 INN Summit Hotel Properties, Inc. 349 85 264 2 0 12415 SNBC Sun Bancorp, Inc. 1,410 986 424 8 5 22416 SLF Sun Life Financial Services of Canada, Inc. 7,703 5,372 2,331 31 21 92417 SXC SunCoke Energy, Inc. 866 480 386 8 5 42418 SU Suncor Energy, Inc. 1,030,819 692,436 338,383 4,091 2,748 1,3432419 SXL Sunoco Logistics Partners LP 9,564 6,207 3,357 38 25 132420 SUN Sunoco, Inc. 208,259 116,879 91,380 826 464 3632421 SPWR SunPower Corp. 465,722 186,549 279,173 1,848 740 1,1082422 SPWRA SunPower Corporation 563,422 290,763 272,659 2,236 1,154 1,0822423 SRZ Sunrise Senior Living, Inc. 24,766 14,003 10,763 98 56 432424 STP Suntech Power Holdings Co., Ltd. 388,562 196,992 191,570 1,542 782 7602425 STI SunTrust Banks, Inc. 309,946 190,085 119,861 1,230 754 4762426 SMCI Super Micro Computer, Inc. 4,257 3,268 989 17 13 42427 SPN Superior Energy Services, Inc. (New) 55,900 31,838 24,062 222 126 952428 SPMD SuperMedia, Inc. 1,539 1,251 288 7 6 12429 SUPX Supertex, Inc. (New) 1,145 289 856 5 1 32430 SVU SUPERVALU, Inc. 416,251 234,546 181,705 1,652 931 7212431 SPRT Support.com, Inc. 10,793 10,622 171 43 42 12432 SRDX SurModics, Inc. 1,453 506 947 6 2 4
CBOE HOLDINGS, INC. Page 45 2011 MARKET STATISTICS

Standard Symbol Stock Total Call Put Total Call Put
CBOE Equity Options Volume (Includes LEAPS)
Contract Volume Average Daily Volume
2433 SUSQ Susquehanna Bancshares, Inc. 12,691 9,765 2,926 50 39 122434 SUTR Sutor Technology Group 1,074 330 744 4 1 32435 SIVB SVB Financial Group 2,596 1,462 1,134 10 6 52436 SFY Swift Energy Company (New) 14,171 10,792 3,379 56 43 132437 SWFT Swift Transporation Co., Inc. 38,245 31,935 6,310 152 127 252438 SWSH Swisher Hygiene, Inc. 40,820 24,983 15,837 226 138 872439 SXCI SXC Health Solutions Corporation 8,699 5,236 3,463 35 21 142440 SYKE Sykes Enterprises, Inc. 1,690 1,030 660 7 4 32441 SYMC Symantec Corporation 293,162 217,212 75,950 1,163 862 3012442 SYA Symetra Financial Corporation 630 57 573 3 0 22443 SYNA Synaptics, Incorporated 92,410 37,454 54,956 367 149 2182444 SNCR Synchronoss Technologies, Inc. 10,416 8,185 2,231 41 32 92445 SURG Synergetics USA, Inc. 652 380 272 3 2 12446 ELOS Syneron Medical Ltd. 7,017 5,619 1,398 28 22 62447 SYT Syngenta AG 6,431 4,437 1,994 26 18 82448 SNX SYNNEX Corporation 6,017 4,713 1,304 24 19 52449 SNPS Synopsys, Inc. 11,226 7,358 3,868 45 29 152450 SYNO Synovis Life Technologies, Inc. 5,692 3,260 2,432 23 13 102451 SNV Synovous Financial Corp. 52,486 35,006 17,480 208 139 692452 SNTA Synta Pharmaceuticals Corporation 25,823 17,650 8,173 102 70 322453 SYY Sysco Corporation 151,410 93,937 57,473 601 373 2282454 SYX Systemax, Inc. 4,057 3,003 1,054 16 12 42455 TROW T. Rowe Price Group, Inc. 50,501 33,563 16,938 200 133 672456 TTES T-3 Energy Services, Inc. 142 66 76 1 0 02457 TSM Taiwan Semiconductor Manufacturing Company Ltd. 54,120 32,744 21,376 215 130 852458 TTWO Take-Two Interactive Software 133,912 97,475 36,437 531 387 1452459 XRS Tal Education Group 1,816 1,362 454 7 5 22460 TAL TAL Int'l Group, Inc. 8,267 5,484 2,783 46 30 152461 TLB Talbots, Inc. (The) 105,386 60,803 44,583 418 241 1772462 TLCR Talecris Biotherapeutics Holding Company 73,846 32,384 41,462 293 129 1652463 TLEO Taleo Corporation 8,533 6,074 2,459 34 24 102464 TLM Talisman Energy, Inc. 53,480 29,398 24,082 212 117 962465 TAM Tam SA 4,159 1,334 2,825 17 5 112466 SKT Tanger Factory Outlet Centers, Inc. 2,812 1,854 958 11 7 42467 TRX Tanzanian Royalty Exploration Corporation 76,973 35,182 41,791 305 140 1662468 TAOM Taomee Holdings Ltd. 969 660 309 11 7 32469 NGLS Targa Resources Partners LP 26,129 20,619 5,510 104 82 222470 TRGT Targacept, Inc. 196,356 138,663 57,693 779 550 2292471 TGT Target Corporation 1,077,394 612,350 465,044 4,275 2,430 1,8452472 TGB Taseko Mines, Ltd. 78,354 61,090 17,264 311 242 692473 TASR TASER International, Inc. 22,656 20,551 2,105 90 82 82474 TCL Tata Communications Limited 1,230 1,109 121 5 4 02475 TTM Tata Motors Limited 89,495 49,357 40,138 355 196 1592476 TCO Taubman Centers, Inc. 3,785 1,442 2,343 15 6 92477 TBSI TBS International Limited 3,330 1,979 1,351 13 8 52478 TCP TC Pipelines LP 3,664 2,185 1,479 15 9 62479 TCB TCF Financial Corporation 37,280 16,002 21,278 148 64 842480 AMTD TD Ameritrade Holding Corp. 100,738 67,554 33,184 400 268 1322481 TEL TE Connectivity Ltd. 19,912 14,429 5,483 79 57 222482 TISI Team, Inc. 1,409 1,065 344 6 4 12483 TEA Teavana Holdings, Inc. 5,225 3,047 2,178 59 34 242484 TECD Tech Data Corporation 11,660 5,165 6,495 46 20 262485 TECH Techne Corporation 1,850 1,184 666 7 5 32486 TCK Teck Resources Limited 453,845 283,327 170,518 1,801 1,124 6772487 TE TECO Energy, Inc. 9,583 5,420 4,163 38 22 172488 TK Teekay Corporation 28,897 17,135 11,762 115 68 472489 TGP Teekay LNG Partners LP 11,855 7,784 4,071 47 31 162490 TOO Teekay Offshore Partners LP 8,864 2,806 6,058 84 26 572491 TNK Teekay Tankers Ltd. 13,995 7,665 6,330 56 30 252492 TRC Tejon Ranch Co. 174 43 131 2 1 22493 TKLC Tekelec 46,181 25,543 20,638 183 101 822494 TNE Tele Norte Leste Participacoes SA 3,520 1,793 1,727 14 7 72495 TEO Telecom Argentina SA 9,493 7,604 1,889 38 30 72496 NZT Telecom Corporation of New Zealand Limited ADR 7,469 4,804 2,665 30 19 11
CBOE HOLDINGS, INC. Page 46 2011 MARKET STATISTICS

Standard Symbol Stock Total Call Put Total Call Put
CBOE Equity Options Volume (Includes LEAPS)
Contract Volume Average Daily Volume
2497 TI Telecom Italia SpA ADS 1,264 840 424 5 3 22498 TSP Telecommunicacoes de Sao Paulo SA 289 159 130 1 1 12499 TSYS TeleCommunication Systems, Inc. 8,078 7,939 139 32 32 12500 VIV Telefonica Brasil, S.A. 9,433 4,830 4,603 37 19 182501 TEF Telefonica de Espana, S.A. ADR 95,187 54,858 40,329 378 218 1602502 TMX Telefonos de Mexico, S.A. de C.V. ADR 15,744 8,228 7,516 62 33 302503 TDS Telephone & Data Systems, Inc. 61,909 31,086 30,823 246 123 1222504 TSTC Telestone Technologies Corporation 43,202 19,491 23,711 171 77 942505 TTEC TeleTech Holdings, Inc. 2,543 1,616 927 10 6 42506 TLAB Tellabs, Inc. 132,382 85,723 46,659 525 340 1852507 TSLA Telsa Motors, Inc. 296,624 187,002 109,622 1,177 742 4352508 TIN Temple-Inland, Inc. 264,679 156,487 108,192 1,050 621 4292509 TPX Tempur-Pedic International, Inc. 74,921 31,597 43,324 297 125 1722510 TS Tenaris S.A. 45,003 23,483 21,520 179 93 852511 THC Tenet Healthcare Corporation 181,362 109,890 71,472 720 436 2842512 TEN Tenneco, Inc. 30,424 18,518 11,906 121 73 472513 TDC Teradata Corporation 66,903 40,650 26,253 265 161 1042514 TER Teradyne, Inc. 85,211 61,387 23,824 338 244 952515 TEX Terex Corporation 159,753 109,877 49,876 634 436 1982516 TX Ternium S.A. 28,334 24,897 3,437 112 99 142517 TMRK Terremark Worldwide, Inc. 25,702 13,198 12,504 102 52 502518 TESO Tesco Corporation 7,022 3,356 3,666 28 13 152519 TSO Tesoro Corporation 391,048 260,839 130,209 1,552 1,035 5172520 TLLP Tesoro Logistics LP 1,790 795 995 11 5 62521 TSRA Tessera Technologies, Inc. 43,627 29,600 14,027 173 117 562522 TTEK Tetra Tech, Inc. 3,340 2,614 726 13 10 32523 TTI TETRA Technologies, Inc. (New) 11,420 7,061 4,359 45 28 172524 TEVA Teva Pharmaceutical Industries Limited ADR 1,105,323 660,359 444,964 4,386 2,620 1,7662525 TCBI Texas Capital Bancshares, Inc. 361 305 56 1 1 02526 TXI Texas Industries, Inc. 46,142 14,028 32,114 183 56 1272527 TXN Texas Instruments, Incorporated 577,871 298,922 278,949 2,293 1,186 1,1072528 TXRH Texas Roadhouse, Inc. 6,519 3,584 2,935 26 14 122529 TXT Textron, Inc. 203,821 145,079 58,742 809 576 2332530 TFSL TFS Financial Corp. 6,329 3,591 2,738 25 14 112531 ANDE The Andersons, Inc. 14,205 10,217 3,988 56 41 162532 BK The Bank of New York Mellon Corporation 463,025 257,780 205,245 1,837 1,023 8142533 BX The Blackstone Group LP 364,564 267,047 97,517 1,447 1,060 3872534 BONT The Bon-Ton Stores, Inc. 8,239 7,035 1,204 33 28 52535 BCO The Brink's Company 5,552 3,429 2,123 22 14 82536 BKE The Buckle, Inc. 37,238 10,415 26,823 148 41 1062537 CATO The Cato Corporation 1,951 879 1,072 8 3 42538 DTV The DIRECTV Group, Inc. 346,229 190,511 155,718 1,374 756 6182539 DM The Dolan Company 9,905 5,030 4,875 39 20 192540 FINL The Finish Line - CL A 24,293 16,534 7,759 96 66 312541 GEO The GEO Group, Inc. 263 33 230 1 0 12542 GS The Goldman Sachs Group, Inc. 3,231,331 1,616,698 1,614,633 12,823 6,415 6,4072543 GRC The Gorman-Rupp Company 296 184 112 2 1 12544 GBX The Greenbrier Companies, Inc. 4,224 2,734 1,490 17 11 62545 HSY The Hershey Company 56,669 38,296 18,373 225 152 732546 SJM The J.M. Smucker Company 21,863 8,396 13,467 87 33 532547 LG The Laclede Group, Inc. 1,452 1,068 384 6 4 22548 MSG The Madison Square Garden Company 4,570 2,762 1,808 18 11 72549 MIDD The Middleby Corporation 5,818 2,725 3,093 23 11 122550 NDAQ The Nasdaq OMX Group, Inc. 120,088 84,892 35,196 477 337 1402551 PTRY The Pantry, Inc. 6,786 5,180 1,606 27 21 62552 PGR The Progressive Corporation 34,698 26,925 7,773 138 107 312553 RYL The Ryland Group, Inc. 37,538 16,199 21,339 149 64 852554 SMG The Scotts Miracle-Gro Company 17,671 10,269 7,402 70 41 292555 SHAW The Shaw Group, Inc. 135,653 73,246 62,407 538 291 2482556 SPNC The Spectranetics Corporation 287 204 83 1 1 02557 JOE The St Joe Company 248,821 99,152 149,669 987 393 5942558 TBL The Timberland Company 19,330 14,332 4,998 77 57 202559 TRV The Travelers Companies, Inc. 102,112 59,766 42,346 405 237 1682560 ULTI The Ultimate Software Group, Inc. 2,160 1,533 627 9 6 2
CBOE HOLDINGS, INC. Page 47 2011 MARKET STATISTICS
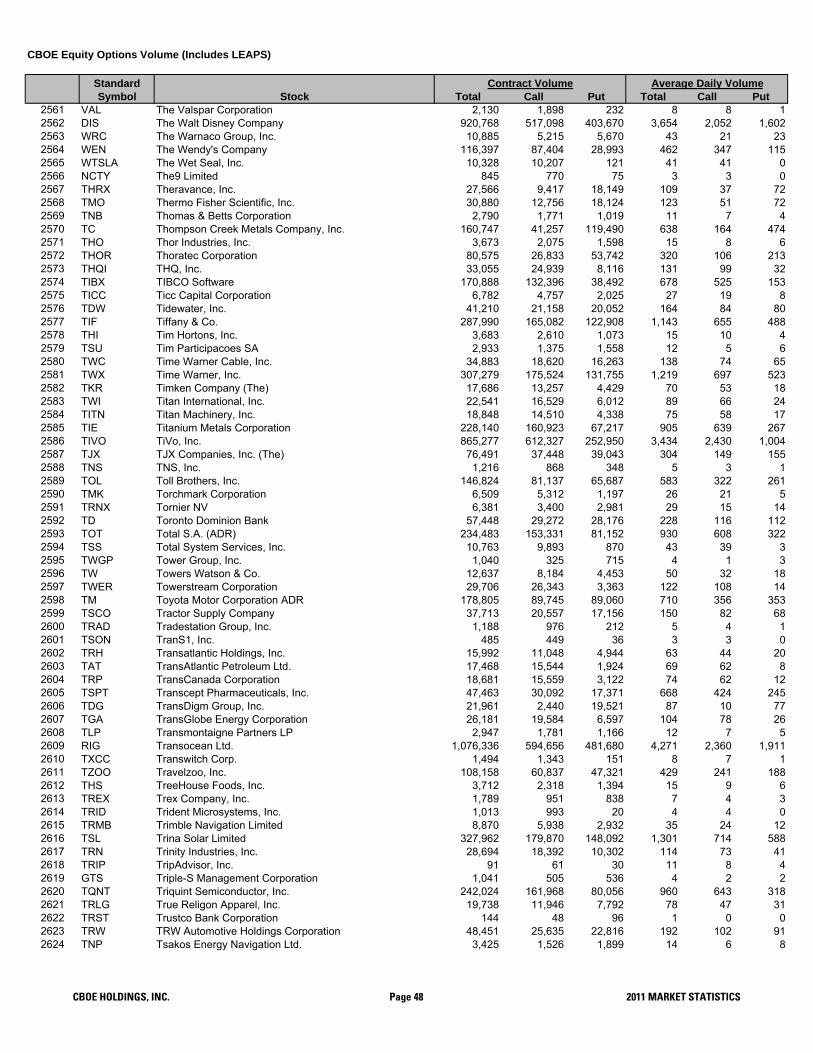
Standard Symbol Stock Total Call Put Total Call Put
CBOE Equity Options Volume (Includes LEAPS)
Contract Volume Average Daily Volume
2561 VAL The Valspar Corporation 2,130 1,898 232 8 8 12562 DIS The Walt Disney Company 920,768 517,098 403,670 3,654 2,052 1,6022563 WRC The Warnaco Group, Inc. 10,885 5,215 5,670 43 21 232564 WEN The Wendy's Company 116,397 87,404 28,993 462 347 1152565 WTSLA The Wet Seal, Inc. 10,328 10,207 121 41 41 02566 NCTY The9 Limited 845 770 75 3 3 02567 THRX Theravance, Inc. 27,566 9,417 18,149 109 37 722568 TMO Thermo Fisher Scientific, Inc. 30,880 12,756 18,124 123 51 722569 TNB Thomas & Betts Corporation 2,790 1,771 1,019 11 7 42570 TC Thompson Creek Metals Company, Inc. 160,747 41,257 119,490 638 164 4742571 THO Thor Industries, Inc. 3,673 2,075 1,598 15 8 62572 THOR Thoratec Corporation 80,575 26,833 53,742 320 106 2132573 THQI THQ, Inc. 33,055 24,939 8,116 131 99 322574 TIBX TIBCO Software 170,888 132,396 38,492 678 525 1532575 TICC Ticc Capital Corporation 6,782 4,757 2,025 27 19 82576 TDW Tidewater, Inc. 41,210 21,158 20,052 164 84 802577 TIF Tiffany & Co. 287,990 165,082 122,908 1,143 655 4882578 THI Tim Hortons, Inc. 3,683 2,610 1,073 15 10 42579 TSU Tim Participacoes SA 2,933 1,375 1,558 12 5 62580 TWC Time Warner Cable, Inc. 34,883 18,620 16,263 138 74 652581 TWX Time Warner, Inc. 307,279 175,524 131,755 1,219 697 5232582 TKR Timken Company (The) 17,686 13,257 4,429 70 53 182583 TWI Titan International, Inc. 22,541 16,529 6,012 89 66 242584 TITN Titan Machinery, Inc. 18,848 14,510 4,338 75 58 172585 TIE Titanium Metals Corporation 228,140 160,923 67,217 905 639 2672586 TIVO TiVo, Inc. 865,277 612,327 252,950 3,434 2,430 1,0042587 TJX TJX Companies, Inc. (The) 76,491 37,448 39,043 304 149 1552588 TNS TNS, Inc. 1,216 868 348 5 3 12589 TOL Toll Brothers, Inc. 146,824 81,137 65,687 583 322 2612590 TMK Torchmark Corporation 6,509 5,312 1,197 26 21 52591 TRNX Tornier NV 6,381 3,400 2,981 29 15 142592 TD Toronto Dominion Bank 57,448 29,272 28,176 228 116 1122593 TOT Total S.A. (ADR) 234,483 153,331 81,152 930 608 3222594 TSS Total System Services, Inc. 10,763 9,893 870 43 39 32595 TWGP Tower Group, Inc. 1,040 325 715 4 1 32596 TW Towers Watson & Co. 12,637 8,184 4,453 50 32 182597 TWER Towerstream Corporation 29,706 26,343 3,363 122 108 142598 TM Toyota Motor Corporation ADR 178,805 89,745 89,060 710 356 3532599 TSCO Tractor Supply Company 37,713 20,557 17,156 150 82 682600 TRAD Tradestation Group, Inc. 1,188 976 212 5 4 12601 TSON TranS1, Inc. 485 449 36 3 3 02602 TRH Transatlantic Holdings, Inc. 15,992 11,048 4,944 63 44 202603 TAT TransAtlantic Petroleum Ltd. 17,468 15,544 1,924 69 62 82604 TRP TransCanada Corporation 18,681 15,559 3,122 74 62 122605 TSPT Transcept Pharmaceuticals, Inc. 47,463 30,092 17,371 668 424 2452606 TDG TransDigm Group, Inc. 21,961 2,440 19,521 87 10 772607 TGA TransGlobe Energy Corporation 26,181 19,584 6,597 104 78 262608 TLP Transmontaigne Partners LP 2,947 1,781 1,166 12 7 52609 RIG Transocean Ltd. 1,076,336 594,656 481,680 4,271 2,360 1,9112610 TXCC Transwitch Corp. 1,494 1,343 151 8 7 12611 TZOO Travelzoo, Inc. 108,158 60,837 47,321 429 241 1882612 THS TreeHouse Foods, Inc. 3,712 2,318 1,394 15 9 62613 TREX Trex Company, Inc. 1,789 951 838 7 4 32614 TRID Trident Microsystems, Inc. 1,013 993 20 4 4 02615 TRMB Trimble Navigation Limited 8,870 5,938 2,932 35 24 122616 TSL Trina Solar Limited 327,962 179,870 148,092 1,301 714 5882617 TRN Trinity Industries, Inc. 28,694 18,392 10,302 114 73 412618 TRIP TripAdvisor, Inc. 91 61 30 11 8 42619 GTS Triple-S Management Corporation 1,041 505 536 4 2 22620 TQNT Triquint Semiconductor, Inc. 242,024 161,968 80,056 960 643 3182621 TRLG True Religon Apparel, Inc. 19,738 11,946 7,792 78 47 312622 TRST Trustco Bank Corporation 144 48 96 1 0 02623 TRW TRW Automotive Holdings Corporation 48,451 25,635 22,816 192 102 912624 TNP Tsakos Energy Navigation Ltd. 3,425 1,526 1,899 14 6 8
CBOE HOLDINGS, INC. Page 48 2011 MARKET STATISTICS

Standard Symbol Stock Total Call Put Total Call Put
CBOE Equity Options Volume (Includes LEAPS)
Contract Volume Average Daily Volume
2625 TTMI TTM Technologies, Inc. 30,093 18,875 11,218 119 75 452626 TA Tucker Anthony Sutro 11,544 9,201 2,343 46 37 92627 TUES Tuesday Morning Corporation 3,992 3,250 742 16 13 32628 TUP Tupperware Brands 22,221 13,938 8,283 88 55 332629 TKC Turkcell Iietisim Hizmetler AS 7,911 2,933 4,978 31 12 202630 TPC Tutor Perini Corporation 5,176 3,439 1,737 21 14 72631 TWTC TW Telecom, Inc. 5,703 4,321 1,382 23 17 52632 TWO Two Harbors Investment Corporation 43,629 26,542 17,087 173 105 682633 TYC Tyco International Limited 346,656 258,999 87,657 1,376 1,028 3482634 TYL Tyler Technologioes, Inc. 269 147 122 1 1 02635 TSN Tyson Foods, Inc. (Class A) 153,722 111,876 41,846 610 444 1662636 USB U.S. Bancorp 1,018,908 575,206 443,702 4,043 2,283 1,7612637 GROW U.S. Global Investors, Inc. 2,087 1,413 674 8 6 32638 UBNT Ubiquiti Networks, Inc. 121 64 57 4 2 22639 UBS UBS AG 130,866 85,532 45,334 519 339 1802640 UGI UGI Corporation 5,299 4,453 846 21 18 32641 UIL UIL Holdings Corporation 2,626 1,964 662 10 8 32642 ULTA Ulta Salon, Cosmetics & Fragrance, Inc. 42,028 20,475 21,553 167 81 862643 UCTT Ultra Clean Holdings, Inc. 3,146 2,418 728 12 10 32644 UPL Ultra Petroleum Corp. 254,745 168,866 85,879 1,011 670 3412645 UGP Ultrapar Participacoes SA 4,560 3,654 906 18 15 42646 UTEK Ultratech, Inc. 22,244 17,874 4,370 88 71 172647 UMBF UMB Financial Corporation 754 526 228 3 2 12648 UMPQ Umpqua Holdings Corporation 807 399 408 3 2 22649 UA Under Armour, Inc. 147,590 85,746 61,844 586 340 2452650 UNF UniFirst Corporation 1,881 1,008 873 7 4 32651 UN Unilever N.V. 19,284 15,986 3,298 77 63 132652 UL Unilever Plc 7,617 5,621 1,996 30 22 82653 UNP Union Pacific Corporation 391,804 183,234 208,570 1,555 727 8282654 UIS Unisys Corporation 82,356 42,206 40,150 327 167 1592655 UNT Unit Corporation 9,166 4,626 4,540 36 18 182656 UCBI United Community Banks, Inc. 115,554 115,554 0 459 459 02657 UAL United Continental Holdings, Inc. 1,093,380 758,817 334,563 4,339 3,011 1,3282658 UDR United Dominion Realty Trust 3,006 1,816 1,190 12 7 52659 UBNK United Financial Bancorp, Inc. 70 0 70 0 0 02660 UMC United Microelectronics Corporation 766 560 206 3 2 12661 UNFI United Natural Foods, Inc. (New) 4,452 1,433 3,019 18 6 122662 UNTD United Online, Inc. 21,372 4,239 17,133 85 17 682663 UPS United Parcel Service, Inc. 1,079,874 724,102 355,772 4,285 2,873 1,4122664 URI United Rentals, Inc. 69,657 46,946 22,711 276 186 902665 X United States Seel Corporation 2,320,145 1,412,523 907,622 9,207 5,605 3,6022666 USTR United Stationers, Inc. 7,375 5,171 2,204 29 21 92667 UTX United Technologies Corporation 474,525 285,128 189,397 1,883 1,131 7522668 UTHR United Therapeutics Corp. 252,801 140,192 112,609 1,003 556 4472669 UNH UnitedHealth Group 572,555 295,836 276,719 2,272 1,174 1,0982670 UAM Universal American Financial Corp. 2,263 1,099 1,164 9 4 52671 UVV Universal Corporation 11,901 7,469 4,432 47 30 182672 PANL Universal Display Corporation 157,258 105,052 52,206 624 417 2072673 UFPI Universal Forest Products, Inc. 6,081 4,528 1,553 24 18 62674 UHS Universal Health Services, Inc. 29,737 6,959 22,778 118 28 902675 UTA Universal Travel Group 25,744 11,755 13,989 102 47 562676 UNM Unum Group 20,793 9,581 11,212 83 38 442677 UQM UQM Technologies, Inc. 23,069 10,954 12,115 92 43 482678 URRE Uranium Resources, Inc. 6,296 4,705 1,591 25 19 62679 URBN Urban Outfitters, Inc. 167,071 85,795 81,276 663 340 3232680 UPI Uroplasty, Inc. 3,711 2,721 990 15 11 42681 URS URS Corporation 8,202 6,256 1,946 33 25 82682 LCC US Airways Group, Inc, (New) 330,390 236,553 93,837 1,311 939 3722683 USEG US Energy Corporation 22,076 15,819 6,257 88 63 252684 USNA USANA Health Sciences, Inc. 21,746 7,267 14,479 86 29 572685 USU USEC, Inc. 138,892 89,971 48,921 551 357 1942686 USG USG Corporation 128,990 78,130 50,860 512 310 2022687 UTSI UTStarcom Holdings Corp. 6,280 4,263 2,017 25 17 82688 VFC V.F. Corporation 43,499 17,401 26,098 173 69 104
CBOE HOLDINGS, INC. Page 49 2011 MARKET STATISTICS

Standard Symbol Stock Total Call Put Total Call Put
CBOE Equity Options Volume (Includes LEAPS)
Contract Volume Average Daily Volume
2689 EGY VAALCO Energy, Inc. 8,879 7,614 1,265 35 30 52690 MTN Vail Resorts, Inc. (New) 4,771 2,219 2,552 19 9 102691 VCI Valassis Communications, Inc. 54,850 31,845 23,005 218 126 912692 VALE/P Vale SA 1,799 749 1,050 7 3 42693 VALE Vale SA 1,805,654 1,052,340 753,314 7,165 4,176 2,9892694 VRX Valeant Pharmaceuticals International 327,199 232,312 94,887 1,298 922 3772695 VLNC Valence Technology, Inc. 875 865 10 3 3 02696 VLO Valero Energy Corp. 1,509,804 1,060,786 449,018 5,991 4,209 1,7822697 VR Validus Holdings Limited 1,899 1,678 221 8 7 12698 VLY Valley National Bancorp 6,345 4,163 2,182 25 17 92699 VMI Valmont Industries, Inc. 5,389 2,725 2,664 21 11 112700 VCLK ValueClick, Inc. 28,500 20,278 8,222 113 80 332701 VVTV ValueVision Media, Inc. CL A 3,639 2,627 1,012 14 10 42702 VIT Vanceinfo Technologies, Inc. 86,933 29,345 57,588 345 116 2292703 VNDA Vanda Pharmaceuticals, Inc. 7,099 5,380 1,719 28 21 72704 VHS Vanguard Health Systems 1,673 1,201 472 13 9 42705 VNR Vanguard Natural Resources LLC 26,020 15,440 10,580 103 61 422706 VAR Varian Associates, Inc. 22,789 13,532 9,257 90 54 372707 VSEA Varian Semiconductor Equipment Associates, Inc. 79,711 39,380 40,331 316 156 1602708 VDSI VASCO Data Security International, Inc. 10,021 7,670 2,351 40 30 92709 VASC Vascular Solutions, Inc. (New) 1,852 1,158 694 7 5 32710 WOOF VCA Antech, Inc. 7,415 2,813 4,602 29 11 182711 VGR Vector Group Ltd. 12,644 8,446 4,198 50 34 172712 VVC Vectren Corporation 1,510 1,156 354 6 5 12713 VECO Veeco Instruments, Inc. 307,604 148,751 158,853 1,221 590 6302714 VELT Velti PLC 4,883 3,564 1,319 43 31 122715 VQ Venoco, Inc. 28,270 17,970 10,300 112 71 412716 VTR Ventas, Inc. 24,793 13,339 11,454 98 53 452717 VTUS Ventrus Biosciences, Inc. 416 359 57 52 45 72718 VE Veolia Environnment 20,950 12,254 8,696 83 49 352719 VRA Vera Bradley, Inc. 12,514 4,727 7,787 50 19 312720 VRNM Verenium Corporation 4,200 2,004 2,196 17 8 92721 PAY VeriFone Systems, Inc. 290,016 165,030 124,986 1,151 655 4962722 VRGY Verigy Ltd. 107,989 57,120 50,869 429 227 2022723 VRNT Verint Systems, Inc. 7,811 5,931 1,880 31 24 72724 VRSN Verisign, Inc. 128,430 93,863 34,567 510 372 1372725 VRSK Verisk Analytics, Inc. 3,932 1,821 2,111 16 7 82726 VZ Verizon Communications, Inc. 1,831,476 1,116,850 714,626 7,268 4,432 2,8362727 VRS Verso Paper Co. 5,029 4,147 882 20 16 42728 VRTX Vertex Pharmaceuticals, Inc. 341,431 182,057 159,374 1,355 722 6322729 VIA Viacom, Inc. Class A 3,245 1,303 1,942 13 5 82730 VIA.B Viacom, Inc. Class B 126,446 92,144 34,302 502 366 1362731 VSAT ViaSat, Inc 8,746 6,060 2,686 35 24 112732 VICL Vical, Incorporated (New) 46,454 37,776 8,678 184 150 342733 VICR Vicor Corporation (New) 5,024 3,230 1,794 20 13 72734 VPFG ViewPoints Financial Group 199 109 90 1 1 02735 VIP VimpelCom 50,988 24,919 26,069 202 99 1032736 VMED Virgin Media, Inc. 106,982 73,466 33,516 425 292 1332737 VHC VirnetX Holding Corporation 287,046 215,606 71,440 1,139 856 2832738 VPHM ViroPharma, Incorporated 25,852 19,046 6,806 103 76 272739 V Visa, Inc. 1,415,269 849,240 566,029 5,616 3,370 2,2462740 VSH Vishay Intertechnology, Inc. 34,141 20,049 14,092 135 80 562741 VPG Vishay Precision Group, Inc. 2,457 824 1,633 10 3 62742 VISN VisionChina Media, Inc. 12,520 10,753 1,767 50 43 72743 VGZ Vista Gold Corp. 13,117 10,672 2,445 52 42 102744 VPRT VistaPrint Limited 29,856 14,418 15,438 118 57 612745 VC Visteon Corp. 11,497 7,110 4,387 46 28 172746 VSI Vitamin Shoppe, Inc. 25,598 12,524 13,074 102 50 522747 VVUS VIVUS, Inc. 372,651 250,608 122,043 1,479 994 4842748 VMW Vmware, Inc. 436,929 264,382 172,547 1,734 1,049 6852749 CALL Vocaltec Communications Ltd. 62,296 29,253 33,043 247 116 1312750 VOD Vodafone Group PLC ADR 189,574 128,041 61,533 752 508 2442751 VOLC Volcano Corporation 5,823 2,591 3,232 23 10 132752 VLCM Volcom, Inc. 2,332 1,111 1,221 9 4 5
CBOE HOLDINGS, INC. Page 50 2011 MARKET STATISTICS

Standard Symbol Stock Total Call Put Total Call Put
CBOE Equity Options Volume (Includes LEAPS)
Contract Volume Average Daily Volume
2753 VOL Volt Information Sciences, Inc. 1,410 1,221 189 6 5 12754 VLTR Volterra Semiconductor Corporation 6,312 4,182 2,130 25 17 82755 VG Vonage Holdings Corporation 1,060 817 243 4 3 12756 VNO Vornado Realty Trust 32,454 14,369 18,085 129 57 722757 VMC Vulcan Materials 137,986 70,176 67,810 548 278 2692758 WTI W&T Offshore, Inc. 21,773 9,920 11,853 86 39 472759 GRA W.R. Grace & Co. 38,784 23,102 15,682 154 92 622760 WNC Wabash National Corporation (New) 14,558 8,081 6,477 58 32 262761 WBC WABCO Holdings, Inc. 16,931 11,284 5,647 67 45 222762 WAB Wabtec Corp. 8,943 6,056 2,887 35 24 112763 WDR Waddell & Reed Financial, Inc. 4,168 2,304 1,864 17 9 72764 WAG Walgreen Company 886,099 553,842 332,257 3,516 2,198 1,3182765 WMT Wal-Mart Stores, Inc. 1,645,449 930,949 714,500 6,530 3,694 2,8352766 WLT Walter Energy, Inc. 786,178 491,465 294,713 3,120 1,950 1,1692767 WAC Walter Investment Management Corporation 38,407 15,176 23,231 152 60 922768 WCRX Warner Chilcott Limited 57,055 28,898 28,157 226 115 1122769 WMG Warner Music Group Corp. (New) 9,148 3,453 5,695 36 14 232770 WRES Warren Resources, Inc. 5,204 4,474 730 21 18 32771 WFSL Washington Federal, Inc. 477 337 140 2 1 12772 WRE Washington Real Estate Investment Trust 6,791 3,982 2,809 27 16 112773 WCN Waste Connections, Inc. 974 662 312 4 3 12774 WM Waste Management, Inc. 397,819 222,729 175,090 1,579 884 6952775 WAT Waters Corporation 14,696 8,495 6,201 58 34 252776 WSO Watsco, Inc. 2,939 1,721 1,218 12 7 52777 WPI Watson Pharmaceuticals, Inc. 47,394 34,588 12,806 188 137 512778 WTS Watts Water Technologies, Inc. 4,139 3,323 816 16 13 32779 WPP Wausau Paper Corporation 3,681 1,319 2,362 15 5 92780 WAVX Wave Systems Corp. 51,651 44,556 7,095 205 177 282781 WFT Weatherford International Ltd. 1,151,823 760,266 391,557 4,571 3,017 1,5542782 WWWW Web.com Group, Inc. 8,842 6,604 2,238 42 32 112783 WBMD WebMD Health Corp. 95,381 69,046 26,335 378 274 1052784 WBSN Websense, Inc. 12,665 5,464 7,201 50 22 292785 WBS Webster Financial Corp. 6,292 3,738 2,554 25 15 102786 WTW Weight Watchers International, Inc. 137,321 77,309 60,012 545 307 2382787 WRI Weingarten Realty Investors 3,503 2,002 1,501 14 8 62788 WCG Wellcare Health Plans, Inc. 19,237 11,684 7,553 76 46 302789 WLP WellPoint Health Networks, Inc. 340,453 157,637 182,816 1,351 626 7252790 WFC Wells Fargo & Company 3,859,881 2,161,265 1,698,616 15,317 8,576 6,7412791 WERN Werner Enterprises, Inc. 2,062 1,409 653 8 6 32792 WAIR Wesco Aircraft Holdings, Inc. 582 492 90 6 5 12793 WCC WESCO Interntional, Inc. 4,666 3,964 702 19 16 32794 WCBO West Coast Bancorp 4 4 0 0 0 02795 WABC WestAmerica Bancorporation 338 74 264 1 0 12796 WR Westar Energy, Inc. 1,158 442 716 5 2 32797 WAL Western Alliance Bancorp 1,363 1,149 214 5 5 12798 WDC Western Digital Corporation 384,054 244,492 139,562 1,524 970 5542799 WES Western Gas Partners LP 17,459 11,850 5,609 69 47 222800 WNR Western Refining, Inc. 346,951 234,054 112,897 1,377 929 4482801 WU Western Union Company 58,086 28,094 29,992 231 111 1192802 WLK Westlake Chemical Corporation 4,222 1,978 2,244 17 8 92803 WPRT Westport Innovations, Inc. 90,977 66,949 24,028 361 266 952804 WY Weyerhaeuser Company 157,765 84,695 73,070 626 336 2902805 WGL WGL Holdings, Inc. 1,700 1,284 416 7 5 22806 WHR Whirlpool Corporation 253,302 128,015 125,287 1,005 508 4972807 WLL Whiting Petroleum Corporation 165,025 110,896 54,129 655 440 2152808 WHX Whiting USA Trust 4,558 2,285 2,273 43 22 212809 WTNY Whitney Holding Corporation 357 253 104 1 1 02810 WFM Whole Foods Market, Inc. 271,952 160,597 111,355 1,079 637 4422811 WG Willbros Group, Inc. 6,599 3,109 3,490 26 12 142812 WMB Williams Companies, Inc. (The) 1,011,961 686,360 325,601 4,016 2,724 1,2922813 WPZ Williams Partners LP 47,497 25,741 21,756 188 102 862814 WSM Williams-Sonoma, Inc. 58,997 23,674 35,323 234 94 1402815 WSH Willis Group Holdings Limited 1,651 752 899 7 3 42816 WL Wilmington Trust Corporation 810 682 128 3 3 1
CBOE HOLDINGS, INC. Page 51 2011 MARKET STATISTICS

Standard Symbol Stock Total Call Put Total Call Put
CBOE Equity Options Volume (Includes LEAPS)
Contract Volume Average Daily Volume
2817 WBD Wimm-Bill-Dann Foods 2,144 1,091 1,053 9 4 42818 WIN Windstream Corporation 62,330 49,781 12,549 247 198 502819 WINN Winn-Dixie Stores, Inc. 20,372 17,612 2,760 81 70 112820 WGO Winnebago Industries, Inc. 10,394 6,464 3,930 41 26 162821 WTFC Wintrust Financial Corporation 421 298 123 2 1 02822 WIT Wipro Limited 4,522 1,860 2,662 18 7 112823 WEC Wisconsin Energy Corporation 3,849 3,293 556 15 13 22824 WMS WMS Industries, Inc. 24,775 11,953 12,822 98 47 512825 WATG Wonder Auto Technology, Inc. 15,466 9,238 6,228 61 37 252826 WWD Woodward, Inc. 4,575 3,392 1,183 18 13 52827 WRLD World Acceptance Corporation 22,274 5,793 16,481 88 23 652828 INT World Fuel Services Corporation 16,659 10,534 6,125 66 42 242829 WOR Worthington Industries, Inc. 8,930 7,249 1,681 35 29 72830 WPPGY WPP Group, plc 1,688 852 836 7 3 32831 WMGI Wright Medical Group, Inc. 9,817 5,311 4,506 39 21 182832 WX WuXi PharaTech Cayman, Inc. 2,151 1,691 460 9 7 22833 WYN Wyndham Worldwide Corporation 59,437 33,412 26,025 236 133 1032834 WYNN Wynn Resorts, Limited 1,053,889 552,261 501,628 4,182 2,192 1,9912835 XEL Xcel Energy, Inc. 7,720 6,596 1,124 31 26 42836 XNPT Xenoport, Inc. 111,346 81,400 29,946 442 323 1192837 XRX Xerox Corporation 305,965 187,615 118,350 1,214 745 4702838 XLNX Xilinix, Inc. 300,187 116,754 183,433 1,191 463 7282839 XIN Xinyuan Real Estate Company Ltd. 3,095 1,720 1,375 12 7 52840 XL XL Group plc. 112,131 71,440 40,691 445 283 1612841 XUE Xueda Education Group 761 255 506 3 1 22842 XYL Xylem, Inc. 1,251 1,114 137 30 27 32843 XRTX Xyratek Ltd. 34,164 24,341 9,823 136 97 392844 YHOO Yahoo!, Inc. 4,448,184 3,263,412 1,184,772 17,652 12,950 4,7012845 AUY Yamana Gold, Inc. 1,022,562 799,117 223,445 4,058 3,171 8872846 YNDX Yandex NV 135,050 82,006 53,044 913 554 3582847 YZC Yanzhou Coal Mining Company 13,979 8,138 5,841 55 32 232848 YGE Yingli Green Energy Holding Company 217,041 148,729 68,312 861 590 2712849 YMI YM Biosciences, Inc. 20,620 17,670 2,950 82 70 122850 YONG Yongye International, Inc. 156,178 70,365 85,813 620 279 3412851 YOKU Youku, Inc. 38,098 26,559 11,539 151 105 462852 YPF YPF SA 7,925 5,286 2,639 31 21 102853 YRCW YRC Worldwide, Inc. 992,293 334,473 657,820 3,938 1,327 2,6102854 YTEC Yucheng Technologies Ltd. 917 787 130 4 3 12855 YUII Yuhe International, Inc. 17,270 7,718 9,552 69 31 382856 YUM YUM! Brands, Inc. 249,929 150,509 99,420 992 597 3952857 ZAGG Zagg, Incorp. 418,257 266,179 152,078 1,660 1,056 6032858 ZLC Zale Corporation 29,226 16,636 12,590 116 66 502859 ZBRA Zebra Technologies, Inc. 2,080 1,775 305 8 7 12860 HOGS Zhongpin, Inc. 138,344 56,025 82,319 549 222 3272861 ZMH Zimmer Holdings, Inc. 100,919 49,727 51,192 400 197 2032862 ZION Zions Bancorporation 215,730 109,762 105,968 856 436 4212863 ZIOP Ziopharm Oncology, Inc. 54,125 44,378 9,747 215 176 392864 ZIP Zipcar, Inc. 32,151 17,753 14,398 184 101 822865 ZOLT Zoltek Companies, Inc. (New) 22,174 12,518 9,656 88 50 382866 ZRAN Zoran Corp. 12,819 5,774 7,045 51 23 282867 ZUMZ Zumiez, Inc. 20,017 10,988 9,029 79 44 362868 ZNGA Zynga Inc. 432 367 65 108 92 16
CBOE HOLDINGS, INC. Page 52 2011 MARKET STATISTICS
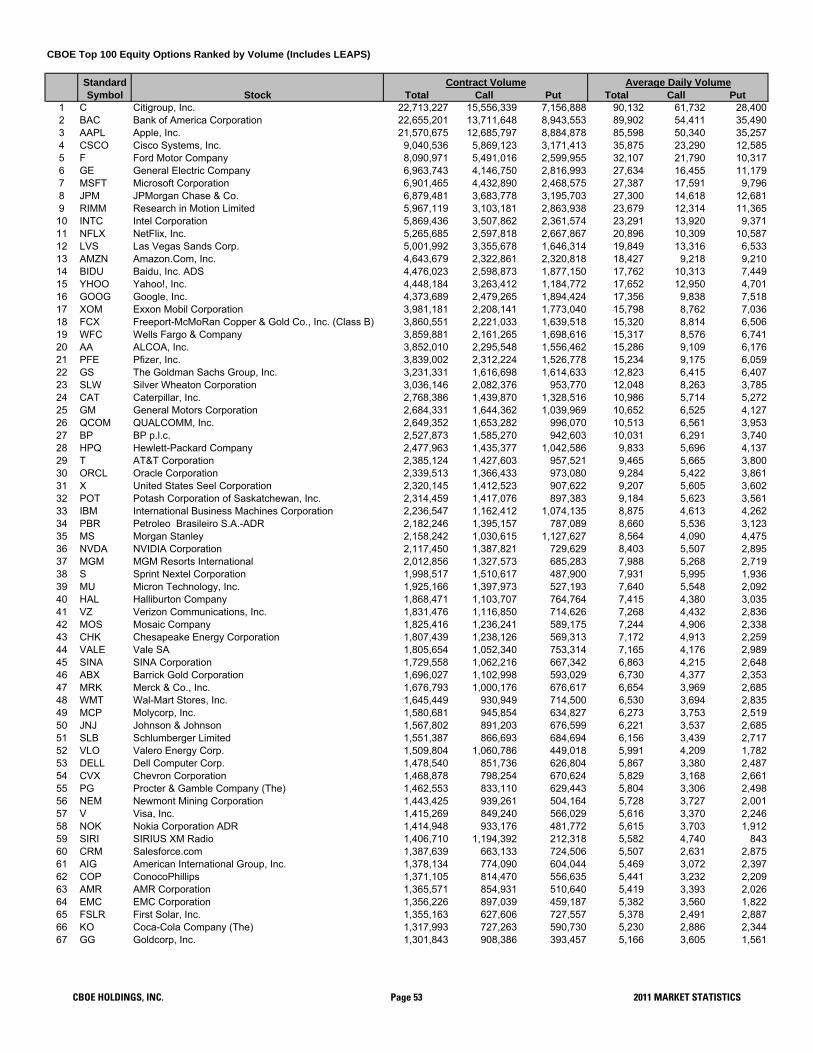
CBOE Top 100 Equity Options Ranked by Volume (Includes LEAPS)
Standard Symbol Stock Total Call Put Total Call Put
1 C Citigroup, Inc. 22,713,227 15,556,339 7,156,888 90,132 61,732 28,4002 BAC Bank of America Corporation 22,655,201 13,711,648 8,943,553 89,902 54,411 35,4903 AAPL Apple, Inc. 21,570,675 12,685,797 8,884,878 85,598 50,340 35,2574 CSCO Cisco Systems, Inc. 9,040,536 5,869,123 3,171,413 35,875 23,290 12,5855 F Ford Motor Company 8,090,971 5,491,016 2,599,955 32,107 21,790 10,3176 GE General Electric Company 6,963,743 4,146,750 2,816,993 27,634 16,455 11,1797 MSFT Microsoft Corporation 6,901,465 4,432,890 2,468,575 27,387 17,591 9,7968 JPM JPMorgan Chase & Co. 6,879,481 3,683,778 3,195,703 27,300 14,618 12,6819 RIMM Research in Motion Limited 5,967,119 3,103,181 2,863,938 23,679 12,314 11,36510 INTC Intel Corporation 5,869,436 3,507,862 2,361,574 23,291 13,920 9,37111 NFLX NetFlix, Inc. 5,265,685 2,597,818 2,667,867 20,896 10,309 10,58712 LVS Las Vegas Sands Corp. 5,001,992 3,355,678 1,646,314 19,849 13,316 6,53313 AMZN Amazon.Com, Inc. 4,643,679 2,322,861 2,320,818 18,427 9,218 9,21014 BIDU Baidu, Inc. ADS 4,476,023 2,598,873 1,877,150 17,762 10,313 7,44915 YHOO Yahoo!, Inc. 4,448,184 3,263,412 1,184,772 17,652 12,950 4,70116 GOOG Google, Inc. 4,373,689 2,479,265 1,894,424 17,356 9,838 7,51817 XOM Exxon Mobil Corporation 3,981,181 2,208,141 1,773,040 15,798 8,762 7,03618 FCX Freeport-McMoRan Copper & Gold Co., Inc. (Class B) 3,860,551 2,221,033 1,639,518 15,320 8,814 6,50619 WFC Wells Fargo & Company 3,859,881 2,161,265 1,698,616 15,317 8,576 6,74120 AA ALCOA, Inc. 3,852,010 2,295,548 1,556,462 15,286 9,109 6,17621 PFE Pfizer, Inc. 3,839,002 2,312,224 1,526,778 15,234 9,175 6,05922 GS The Goldman Sachs Group, Inc. 3,231,331 1,616,698 1,614,633 12,823 6,415 6,40723 SLW Silver Wheaton Corporation 3,036,146 2,082,376 953,770 12,048 8,263 3,78524 CAT Caterpillar, Inc. 2,768,386 1,439,870 1,328,516 10,986 5,714 5,27225 GM General Motors Corporation 2,684,331 1,644,362 1,039,969 10,652 6,525 4,12726 QCOM QUALCOMM, Inc. 2,649,352 1,653,282 996,070 10,513 6,561 3,95327 BP BP p.l.c. 2,527,873 1,585,270 942,603 10,031 6,291 3,74028 HPQ Hewlett-Packard Company 2,477,963 1,435,377 1,042,586 9,833 5,696 4,13729 T AT&T Corporation 2,385,124 1,427,603 957,521 9,465 5,665 3,80030 ORCL Oracle Corporation 2,339,513 1,366,433 973,080 9,284 5,422 3,86131 X United States Seel Corporation 2,320,145 1,412,523 907,622 9,207 5,605 3,60232 POT Potash Corporation of Saskatchewan, Inc. 2,314,459 1,417,076 897,383 9,184 5,623 3,56133 IBM International Business Machines Corporation 2,236,547 1,162,412 1,074,135 8,875 4,613 4,26234 PBR Petroleo Brasileiro S.A.-ADR 2,182,246 1,395,157 787,089 8,660 5,536 3,12335 MS Morgan Stanley 2,158,242 1,030,615 1,127,627 8,564 4,090 4,47536 NVDA NVIDIA Corporation 2,117,450 1,387,821 729,629 8,403 5,507 2,89537 MGM MGM Resorts International 2,012,856 1,327,573 685,283 7,988 5,268 2,71938 S Sprint Nextel Corporation 1,998,517 1,510,617 487,900 7,931 5,995 1,93639 MU Micron Technology, Inc. 1,925,166 1,397,973 527,193 7,640 5,548 2,09240 HAL Halliburton Company 1,868,471 1,103,707 764,764 7,415 4,380 3,03541 VZ Verizon Communications, Inc. 1,831,476 1,116,850 714,626 7,268 4,432 2,83642 MOS Mosaic Company 1,825,416 1,236,241 589,175 7,244 4,906 2,33843 CHK Chesapeake Energy Corporation 1,807,439 1,238,126 569,313 7,172 4,913 2,25944 VALE Vale SA 1,805,654 1,052,340 753,314 7,165 4,176 2,98945 SINA SINA Corporation 1,729,558 1,062,216 667,342 6,863 4,215 2,64846 ABX Barrick Gold Corporation 1,696,027 1,102,998 593,029 6,730 4,377 2,35347 MRK Merck & Co., Inc. 1,676,793 1,000,176 676,617 6,654 3,969 2,68548 WMT Wal-Mart Stores, Inc. 1,645,449 930,949 714,500 6,530 3,694 2,83549 MCP Molycorp, Inc. 1,580,681 945,854 634,827 6,273 3,753 2,51950 JNJ Johnson & Johnson 1,567,802 891,203 676,599 6,221 3,537 2,68551 SLB Schlumberger Limited 1,551,387 866,693 684,694 6,156 3,439 2,71752 VLO Valero Energy Corp. 1,509,804 1,060,786 449,018 5,991 4,209 1,78253 DELL Dell Computer Corp. 1,478,540 851,736 626,804 5,867 3,380 2,48754 CVX Chevron Corporation 1,468,878 798,254 670,624 5,829 3,168 2,66155 PG Procter & Gamble Company (The) 1,462,553 833,110 629,443 5,804 3,306 2,49856 NEM Newmont Mining Corporation 1,443,425 939,261 504,164 5,728 3,727 2,00157 V Visa, Inc. 1,415,269 849,240 566,029 5,616 3,370 2,24658 NOK Nokia Corporation ADR 1,414,948 933,176 481,772 5,615 3,703 1,91259 SIRI SIRIUS XM Radio 1,406,710 1,194,392 212,318 5,582 4,740 84360 CRM Salesforce.com 1,387,639 663,133 724,506 5,507 2,631 2,87561 AIG American International Group, Inc. 1,378,134 774,090 604,044 5,469 3,072 2,39762 COP ConocoPhillips 1,371,105 814,470 556,635 5,441 3,232 2,20963 AMR AMR Corporation 1,365,571 854,931 510,640 5,419 3,393 2,02664 EMC EMC Corporation 1,356,226 897,039 459,187 5,382 3,560 1,82265 FSLR First Solar, Inc. 1,355,163 627,606 727,557 5,378 2,491 2,88766 KO Coca-Cola Company (The) 1,317,993 727,263 590,730 5,230 2,886 2,34467 GG Goldcorp, Inc. 1,301,843 908,386 393,457 5,166 3,605 1,561
Contract Volume Average Daily Volume
CBOE HOLDINGS, INC. Page 53 2011 MARKET STATISTICS

CBOE Top 100 Equity Options Ranked by Volume (Includes LEAPS)
Standard Symbol Stock Total Call Put Total Call Put
Contract Volume Average Daily Volume
68 PCLN Priceline.com, Inc. 1,294,732 626,155 668,577 5,138 2,485 2,65369 BMY Bristol-Myers Squibb Company 1,293,145 810,378 482,767 5,132 3,216 1,91670 SD SandRidge Energy, Inc. 1,264,581 915,278 349,303 5,018 3,632 1,38671 EK Eastman Kodak Company 1,255,667 732,418 523,249 4,983 2,906 2,07672 BA Boeing Company (The) 1,228,708 674,545 554,163 4,876 2,677 2,19973 HRBN Harbin Electric, Inc. 1,211,514 622,757 588,757 4,808 2,471 2,33674 MRVL Marvell Technology Group Ltd. 1,204,964 855,346 349,618 4,782 3,394 1,38775 EBAY eBay, Inc. 1,200,080 693,207 506,873 4,762 2,751 2,01176 DE Deere & Company 1,163,712 690,300 473,412 4,618 2,739 1,87977 GLW Corning, Incorporated 1,161,748 698,692 463,056 4,610 2,773 1,83878 MCD McDonald's Corporation 1,155,447 660,613 494,834 4,585 2,621 1,96479 WFT Weatherford International Ltd. 1,151,823 760,266 391,557 4,571 3,017 1,55480 FFIV F5 Networks, Inc. 1,128,914 626,139 502,775 4,480 2,485 1,99581 HK Petrohawk Energy Corporation 1,125,181 894,543 230,638 4,465 3,550 91582 SNDK SanDisk Corporation 1,116,798 658,017 458,781 4,432 2,611 1,82183 TEVA Teva Pharmaceutical Industries Limited ADR 1,105,323 660,359 444,964 4,386 2,620 1,76684 AMGN Amgen, Inc. 1,100,929 597,395 503,534 4,369 2,371 1,99885 AXP American Express Company 1,094,446 578,760 515,686 4,343 2,297 2,04686 UAL United Continental Holdings, Inc. 1,093,380 758,817 334,563 4,339 3,011 1,32887 CREE Cree, Inc. 1,087,928 686,836 401,092 4,317 2,726 1,59288 UPS United Parcel Service, Inc. 1,079,874 724,102 355,772 4,285 2,873 1,41289 TGT Target Corporation 1,077,394 612,350 465,044 4,275 2,430 1,84590 RIG Transocean Ltd. 1,076,336 594,656 481,680 4,271 2,360 1,91191 PCX Patriot Coal Corporation 1,073,070 741,505 331,565 4,258 2,942 1,31692 GMCR Green Mountain Coffee Roasters, Inc. 1,070,251 535,234 535,017 4,247 2,124 2,12393 WYNN Wynn Resorts, Limited 1,053,889 552,261 501,628 4,182 2,192 1,99194 ALL Allstate Corporation (The) 1,047,679 925,605 122,074 4,157 3,673 48495 ABT Abbott Laboratories 1,032,527 615,457 417,070 4,097 2,442 1,65596 SU Suncor Energy, Inc. 1,030,819 692,436 338,383 4,091 2,748 1,34397 ANR Alpha Natural Resources, Inc. 1,023,010 602,457 420,553 4,060 2,391 1,66998 AUY Yamana Gold, Inc. 1,022,562 799,117 223,445 4,058 3,171 88799 USB U.S. Bancorp 1,018,908 575,206 443,702 4,043 2,283 1,761
100 WMB Williams Companies, Inc. (The) 1,011,961 686,360 325,601 4,016 2,724 1,292
CBOE HOLDINGS, INC. Page 54 2011 MARKET STATISTICS

CASH INDEX OPTIONS - 2011
Standard & Poor’s IndexesStandard & Poor’s 100 Index Options (OEX® ): March 11, 1983.European-Style Standard & Poor’s 100 Index Options (XEO® ): July 23, 2001.Standard & Poor’s 500 Index Options (SPXTM ): July 1, 1983 (American-style), April 2, 1986 (European-style).Standard & Poor’s Long-Dated Options (SPL): October 19, 1987.Mini S&P 500 Index (XSP): October 25, 2005.
Dow Jones AveragesOptions on the Dow Jones Industrial AverageSM (DJX): October 6, 1997.
Nasdaq IndexesNasdaq-100 Index® Options (NDX): February 7, 1994.Mini Nasdaq-100 Index® Options (MNX): August 14, 2000.
Russell IndexesRussell 2000® Index (RUT): November 11, 1992.
Volatility & BuyWrite IndexesCBOE Volatility Index® (VIX®): February 24, 2006.
FLEX OptionsCBOE trades options on Equity and Index FLexible Exchange Options®. FLEX® Options allow users to custom-tailor most contract terms, such as expiration date, exercise style, exercise price, type, size, settlement and position limits. Visit www.cboe.com/
Binary Options
CBOE trades Binary Options on the S&P 500 Index (SPX) and the CBOE Volatility Index (VIX). Binary contracts, at expiration, pay out a pre-determined, fixed amount or nothing at all. Expirationdates and settlement values are the same as for standard opti
CBOE HOLDINGS, INC. Page 55 2011 Market Statistics

CHICAGO BOARD OPTIONS EXCHANGE Page 56 2011 Market Statistics
ost Active Cash Indexes—2011
ly traded during 2011. Please refer to ww.cboe.com for a complete description of each product.
ican--style option on April 2, 1986. SPX FLEX and LEAPS and
fore
very of cash on the business day following expiration. OEX & XEO FLEX and EAPS are also traded.
e
tion.
e of opening prices of the SPX options used to calculate VIX at settlement. VIX LEAPS are also
y) before the expiration date. DJX LEX and LEAPS (based on 1/100th of the DJIA level) are also traded.
p to three
tion.
stock on the last business day (usually a Friday) before the expiration ate. NDX FLEX are also traded.
M The following is a description of the index options most activew Standard & Poor’s 500 Index Options - SPXTM The Standard & Poor’s 500 Index is a capitalization-weighted index of 500 stocks from a broad range of industries. SPX options are available in the four near-term months followed by up to three additional monthsfrom the March quarterly cycle (March, June, September and December). SPX options are European-styleexercise (they generally may be exercised only on the last business day before the expiration date). The exercise-settlement value, SET, is calculated using the first (opening) reported sales price in the primary market of each component stock on the last business day before the expiration date. Exercise will result in delivery of cash on the business day following expiration. SPX, which was originally introduced an Amerstyle option, was reintroduced as a EuropeanLong-Dated options (SPL) are also traded. Standard & Poor’s 100 Index Options - OEX® & XEO® The Standard & Poor’s 100 Index is a capitalization-weighted index of 100 stocks from a broad range of industries. OEX and XEO options are available in the four near-term months plus 1 month from the March cycle. OEX options are American-style exercise (they may be exercised on any business day before the expiration date). XEO options are European-style exercise (they generally may be exercised only on the last business day before the expiration date). The exercise-settlement value, OEX, is calculated using the last (closing) reported sales price in the primary market of each component stock on the last business day bethe expiration date or on the day the exercise notice is properly submitted if exercised before expiration.Exercise will result in deliL Options on the CBOE Volatility Index® – VIX® The CBOE Volatility Index - more commonly referred to as “VIX” - is an up-to-the-minute market estimate of expected volatility that is calculated by using real-time S&P 500® Index (SPX) option bid/ask quotes. VIX uses nearby and second nearby options with at least 8 days left to expiration and then weights them to yield a constant, 30-day measure of the expected volatility of the S&P 500 Index. VIX options are European-styland are available in three near-term months plus three months on the February quarterly cycle (February, May, August and November). Exercise will result in delivery of cash on the business day following expiraThe exercise-settlement value, VRO, is a Special Opening Quotation (SOQ) of VIX calculated from the sequenctraded. Options on the Dow Jones Industrial AverageSM - DJX The Dow Jones Industrial Average (DJIA) is a price-weighted index of 30 of the largest, most liquid NYSE & Nasdaq-listed stocks. Options are based on 1/100th of the DJIA level. Options are European-style and are available in three near-term months plus three months on the March quarterly cycle (March, June, September and December). Exercise will result in delivery of cash on the business day following expiration. The exercise-settlement value, DJS, is calculated using the first (opening) reported sales price in the primary market of each component stock on the last business day (usually a FridaF Nasdaq-100 Index® Options - NDX The Nasdaq-100 Index is a capitalization-weighted index composed of 100 of the largest non-financial securities listed on the Nasdaq Stock MarketSM. Options are European-style and are available in unear-term months plus up to three additional months from the March quarterly cycle (March, June, September and December). Exercise will result in delivery of cash on the business day following expiraNDX exercise-settlement value, NDS, is calculated using the first (opening) reported sales price in the primary market of each componentd

CHICAGO BOARD OPTIONS EXCHANGE Page 57 2011 Market Statistics
y a Thursday) preceding the day on which the exercise-settlement value is calculated. The exercise-settlement value for MNX options, XMS, is computed by dividing the NDX settlement value, NDS, by a factor of 10.
CBOE Mini Nasdaq-100 Index® Options - MNX The CBOE Mini-NDX Index is based on 1/10th the value of the Nasdaq-100 Index® (NDX). MNX options are available in up to three near-term months plus up to three additional months from the March quarterly cycle (March, June, September and December) and are European-style options (they generally may be exercisedonly on the last business day before the expiration date). Trading will ordinarily cease on the business day (usuall
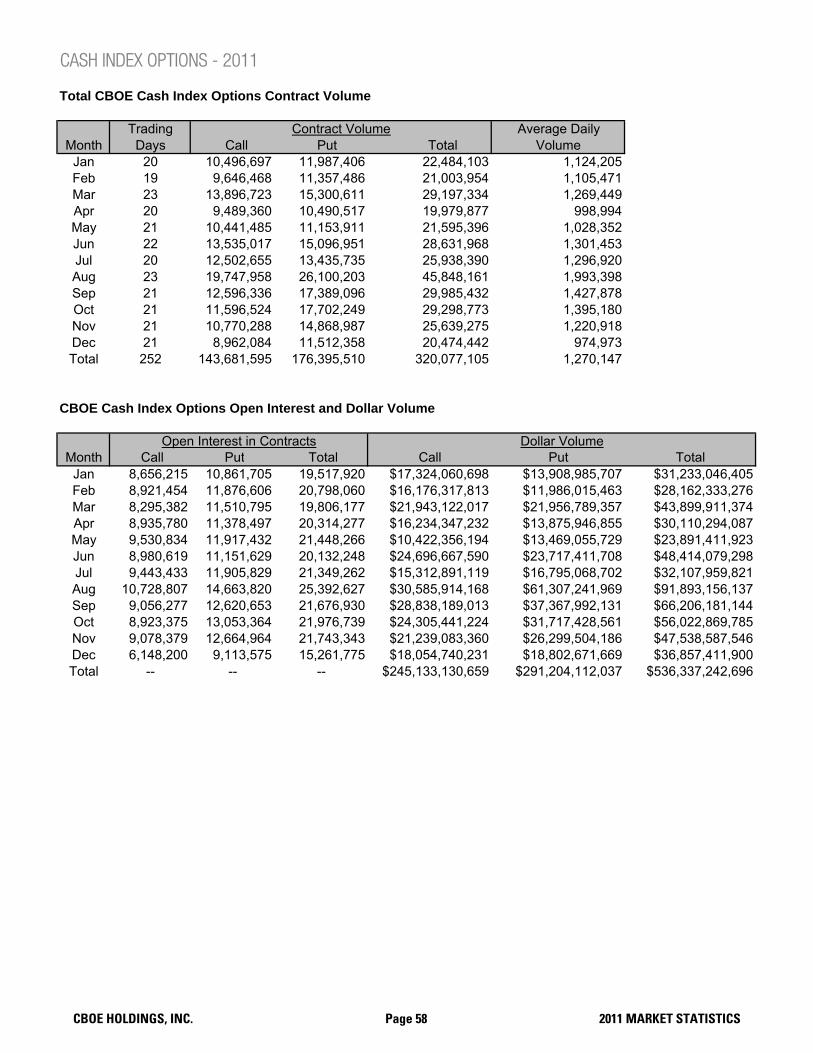
CASH INDEX OPTIONS - 2011
Total CBOE Cash Index Options Contract Volume
Trading Average DailyMonth Days Call Put Total Volume
Jan 20 10,496,697 11,987,406 22,484,103 1,124,205Feb 19 9,646,468 11,357,486 21,003,954 1,105,471Mar 23 13,896,723 15,300,611 29,197,334 1,269,449Apr 20 9,489,360 10,490,517 19,979,877 998,994May 21 10,441,485 11,153,911 21,595,396 1,028,352Jun 22 13,535,017 15,096,951 28,631,968 1,301,453Jul 20 12,502,655 13,435,735 25,938,390 1,296,920Aug 23 19,747,958 26,100,203 45,848,161 1,993,398Sep 21 12,596,336 17,389,096 29,985,432 1,427,878Oct 21 11,596,524 17,702,249 29,298,773 1,395,180Nov 21 10,770,288 14,868,987 25,639,275 1,220,918Dec 21 8,962,084 11,512,358 20,474,442 974,973Total 252 143,681,595 176,395,510 320,077,105 1,270,147
CBOE Cash Index Options Open Interest and Dollar Volume
Month Call Put Total Call Put TotalJan 8,656,215 10,861,705 19,517,920 $17,324,060,698 $13,908,985,707 $31,233,046,405Feb 8,921,454 11,876,606 20,798,060 $16,176,317,813 $11,986,015,463 $28,162,333,276Mar 8,295,382 11,510,795 19,806,177 $21,943,122,017 $21,956,789,357 $43,899,911,374Apr 8,935,780 11,378,497 20,314,277 $16,234,347,232 $13,875,946,855 $30,110,294,087May 9,530,834 11,917,432 21,448,266 $10,422,356,194 $13,469,055,729 $23,891,411,923Jun 8,980,619 11,151,629 20,132,248 $24,696,667,590 $23,717,411,708 $48,414,079,298Jul 9,443,433 11,905,829 21,349,262 $15,312,891,119 $16,795,068,702 $32,107,959,821Aug 10,728,807 14,663,820 25,392,627 $30,585,914,168 $61,307,241,969 $91,893,156,137Sep 9,056,277 12,620,653 21,676,930 $28,838,189,013 $37,367,992,131 $66,206,181,144Oct 8,923,375 13,053,364 21,976,739 $24,305,441,224 $31,717,428,561 $56,022,869,785Nov 9,078,379 12,664,964 21,743,343 $21,239,083,360 $26,299,504,186 $47,538,587,546Dec 6,148,200 9,113,575 15,261,775 $18,054,740,231 $18,802,671,669 $36,857,411,900Total -- -- -- $245,133,130,659 $291,204,112,037 $536,337,242,696
Contract Volume
Open Interest in Contracts Dollar Volume
CBOE HOLDINGS, INC. Page 58 2011 MARKET STATISTICS

Total CBOE Cash Index Options Average Premium Per Contract, Average Contracts Per Trade and Transactions
Month Call Put Total Call Put Total Call Put TotalJan $1,650 $1,160 $1,389 55 63 59 192,523 191,650 384,173Feb $1,677 $1,055 $1,341 45 56 51 213,922 201,119 415,041Mar $1,579 $1,435 $1,504 46 52 49 302,917 293,235 596,152Apr $1,711 $1,323 $1,507 40 51 45 234,701 205,914 440,615May $998 $1,208 $1,106 46 51 48 227,688 219,280 446,968Jun $1,825 $1,571 $1,691 48 54 51 281,498 278,948 560,446Jul $1,225 $1,250 $1,238 49 55 52 255,748 242,622 498,370Aug $1,549 $2,349 $2,004 54 64 59 368,259 405,161 773,420Sep $2,289 $2,149 $2,208 49 59 55 255,520 294,622 550,142Oct $2,096 $1,792 $1,912 43 60 52 270,025 293,260 563,285Nov $1,972 $1,769 $1,854 43 53 49 248,083 278,970 527,053Dec $2,015 $1,633 $1,800 43 54 49 206,299 212,192 418,491Total $1,706 $1,651 $1,676 47 57 52 3,057,183 3,116,973 6,174,156
Average Premium Per Contract Average Contracts Per Trade Transactions
CBOE HOLDINGS, INC. Page 59 2011 MARKET STATISTICS

Total CBOE Cash Index FLEX (NDX, RUT, SPX) Contract Volume
Trading Average DailyMonth Days Call Put Total Volume
Jan 20 41,680 49,172 90,852 4,543Feb 19 49,959 62,254 112,213 5,906Mar 23 40,850 54,478 95,328 4,145Apr 20 42,289 62,020 104,309 5,215May 21 46,352 70,090 116,442 5,545Jun 22 49,275 85,912 135,187 6,145Jul 20 62,581 81,848 144,429 7,221Aug 23 42,574 111,036 153,610 6,679Sep 21 44,391 64,439 108,830 5,182Oct 21 62,085 98,891 160,976 7,666Nov 21 57,265 73,036 130,301 6,205Dec 21 61,918 69,523 131,441 6,259Total 252 601,219 882,699 1,483,918 5,889
Total CBOE Cash Index FLEX (NDX, RUT, SPX) Open Interest and Dollar Volume
Month Call Put Total Call Put TotalJan 78,540 156,587 235,127 $25,623,790 $68,182,620 $93,806,410Feb 82,611 154,423 237,034 $42,175,568 $49,166,522 $91,342,090Mar 85,775 157,881 243,656 $40,745,627 $65,161,572 $105,907,199Apr 85,805 140,571 226,376 $24,754,039 $46,169,063 $70,923,102May 88,013 164,546 252,559 $42,398,106 $72,608,922 $115,007,028Jun 91,373 179,176 270,549 $32,693,782 $87,950,470 $120,644,252Jul 100,341 170,749 271,090 $90,834,812 $112,493,882 $203,328,694Aug 75,584 141,331 216,915 $46,891,267 $365,857,013 $412,748,280Sep 74,069 132,605 206,674 $48,628,377 $131,295,391 $179,923,768Oct 80,368 179,630 259,998 $99,791,196 $142,120,351 $241,911,547Nov 80,468 124,321 204,789 $74,769,625 $105,625,938 $180,395,563Dec 93,248 108,446 201,694 $50,000,587 $59,077,404 $109,077,991Total -- -- -- $619,306,776 $1,305,709,148 $1,925,015,924
Contract Volume
Open Interest in Contracts Dollar Volume
CBOE HOLDINGS, INC. Page 60 2011 MARKET STATISTICS
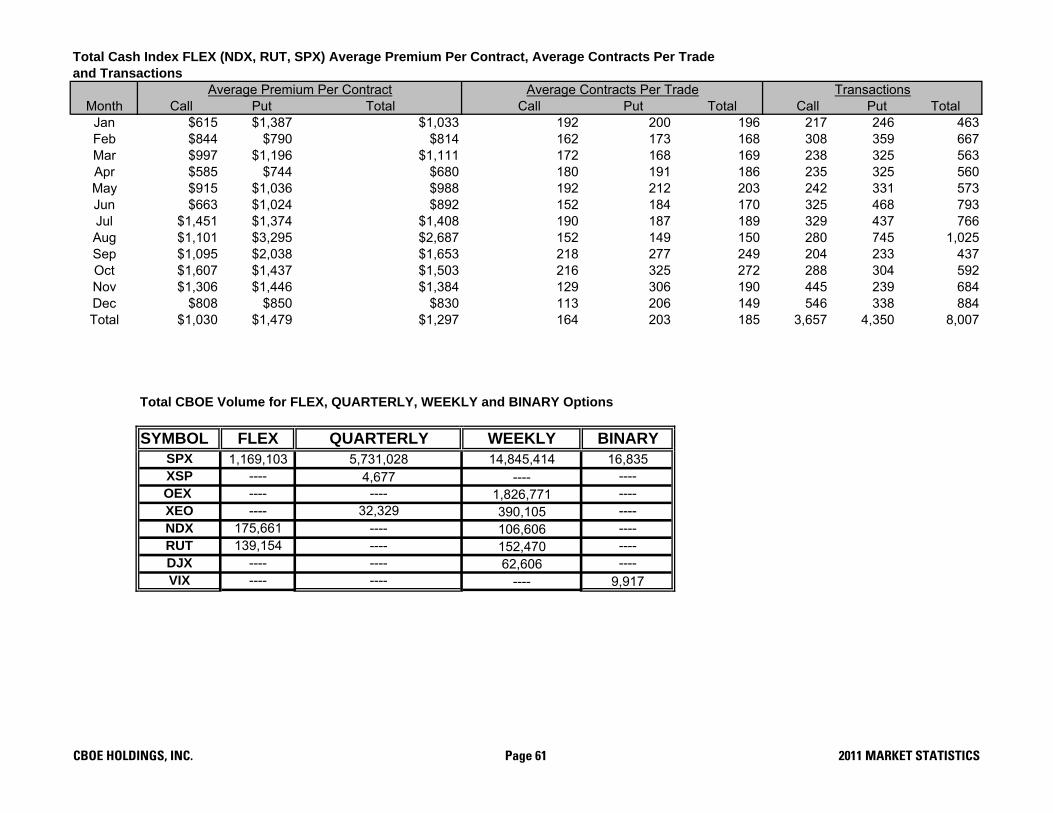
Total Cash Index FLEX (NDX, RUT, SPX) Average Premium Per Contract, Average Contracts Per Trade and Transactions
Month Call Put Total Call Put Total Call Put TotalJan $615 $1,387 $1,033 192 200 196 217 246 463Feb $844 $790 $814 162 173 168 308 359 667Mar $997 $1,196 $1,111 172 168 169 238 325 563Apr $585 $744 $680 180 191 186 235 325 560May $915 $1,036 $988 192 212 203 242 331 573Jun $663 $1,024 $892 152 184 170 325 468 793Jul $1,451 $1,374 $1,408 190 187 189 329 437 766Aug $1,101 $3,295 $2,687 152 149 150 280 745 1,025Sep $1,095 $2,038 $1,653 218 277 249 204 233 437Oct $1,607 $1,437 $1,503 216 325 272 288 304 592Nov $1,306 $1,446 $1,384 129 306 190 445 239 684Dec $808 $850 $830 113 206 149 546 338 884Total $1,030 $1,479 $1,297 164 203 185 3,657 4,350 8,007
Total CBOE Volume for FLEX, QUARTERLY, WEEKLY and BINARY Options
SYMBOL FLEX QUARTERLY WEEKLY BINARYSPX 1,169,103 5,731,028 14,845,414 16,835XSP ---- 4,677 ---- ----OEX ---- ---- 1,826,771 ----XEO ---- 32,329 390,105 ----NDX 175,661 ---- 106,606 ----RUT 139,154 ---- 152,470 ----DJX ---- ---- 62,606 ----VIX ---- ---- ---- 9,917
TransactionsAverage Premium Per Contract Average Contracts Per Trade
CBOE HOLDINGS, INC. Page 61 2011 MARKET STATISTICS

SPX (S&P 500) Contract Volume (includes LEAPS, FLEX and BINARIES)
Trading Average DailyMonth Days Call Put Total Volume
Jan 20 4,772,061 8,119,300 12,891,361 644,568Feb 19 4,409,589 7,819,984 12,229,573 643,662Mar 23 5,542,111 10,659,642 16,201,753 704,424Apr 20 4,500,580 7,472,894 11,973,474 598,674May 21 4,650,672 7,991,704 12,642,376 602,018Jun 22 6,378,503 11,437,790 17,816,293 809,832Jul 20 5,379,634 9,836,377 15,216,011 760,801Aug 23 9,949,773 19,127,399 29,077,172 1,264,225Sep 21 6,988,200 12,734,258 19,722,458 939,165Oct 21 6,681,798 12,313,569 18,995,367 904,541Nov 21 5,878,843 11,144,048 17,022,891 810,614Dec 21 5,197,102 8,523,618 13,720,720 653,368Total 252 70,328,866 127,180,583 197,509,449 783,768
SPX (S&P 500) Open Interest and Dollar Volume (includes LEAPS, FLEX and BINARIES)
Month Call Put Total Call Put TotalJan 4,511,136 7,794,436 12,305,572 $15,562,882,677 $12,539,303,727 $28,102,186,404Feb 4,785,672 8,314,097 13,099,769 $13,716,874,901 $10,781,091,805 $24,497,966,706Mar 4,483,650 8,178,367 12,662,017 $19,021,758,956 $19,920,544,642 $38,942,303,598Apr 5,023,026 8,305,130 13,328,156 $14,567,012,399 $12,642,094,792 $27,209,107,191May 5,295,521 8,923,956 14,219,477 $9,391,729,070 $12,389,880,419 $21,781,609,489Jun 5,022,756 8,599,266 13,622,022 $22,671,383,279 $22,242,240,447 $44,913,623,726Jul 5,347,050 9,042,580 14,389,630 $13,681,677,555 $15,393,001,089 $29,074,678,644Aug 6,779,765 10,997,558 17,777,323 $26,250,013,029 $56,403,874,589 $82,653,887,618Sep 5,812,298 9,290,048 15,102,346 $25,661,386,665 $34,577,996,982 $60,239,383,647Oct 5,977,741 9,649,641 15,627,382 $21,861,061,563 $28,836,436,267 $50,697,497,830Nov 6,046,117 9,840,724 15,886,841 $19,390,581,809 $24,114,974,729 $43,505,556,538Dec 3,929,616 6,873,228 10,802,844 $16,695,355,629 $17,425,882,483 $34,121,238,112Total -- -- -- $218,471,717,532 $267,267,321,971 $485,739,039,503
Contract Volume
Open Interest in Contracts Dollar Volume
CBOE HOLDINGS, INC. Page 62 2011 MARKET STATISTICS

SPX (S&P 500) Average Premium Per Contract, Average Contracts Per Trade and Transactions (includes LEAPS, FLEX and BINARIES)
Month Call Put Total Call Put Total Call Put TotalJan $3,261 $1,544 $2,180 55 66 62 87,096 122,195 209,291Feb $3,111 $1,379 $2,003 46 63 56 96,387 123,386 219,773Mar $3,432 $1,869 $2,404 42 61 53 130,831 175,464 306,295Apr $3,237 $1,692 $2,272 42 58 51 107,078 129,904 236,982May $2,019 $1,550 $1,723 42 56 50 110,215 141,528 251,743Jun $3,554 $1,945 $2,521 44 61 54 143,677 187,215 330,892Jul $2,543 $1,565 $1,911 45 64 55 120,643 154,126 274,769Aug $2,638 $2,949 $2,843 56 77 69 176,428 247,084 423,512Sep $3,672 $2,715 $3,054 51 66 60 137,884 193,148 331,032Oct $3,272 $2,342 $2,669 44 65 56 152,720 189,038 341,758Nov $3,298 $2,164 $2,556 43 60 53 135,671 187,209 322,880Dec $3,212 $2,044 $2,487 45 59 53 114,994 144,440 259,434Total $3,106 $2,101 $2,459 46 64 56 1,513,624 1,994,737 3,508,361
Average Premium Per Contract Average Contracts Per Trade Transactions
CBOE HOLDINGS, INC. Page 63 2011 MARKET STATISTICS

XSP (Mini S&P 500 Index) Contract Volume (includes LEAPS)
Trading Average DailyMonth Days Call Put Total Volume
Jan 20 3,706 4,987 8,693 435Feb 19 2,646 5,038 7,684 404Mar 23 6,117 7,216 13,333 580Apr 20 1,207 2,279 3,486 174May 21 1,536 1,615 3,151 150Jun 22 1,359 3,771 5,130 233Jul 20 1,271 1,707 2,978 149Aug 23 3,724 12,284 16,008 696Sep 21 1,922 6,371 8,293 395Oct 21 4,226 9,364 13,590 647Nov 21 1,217 3,090 4,307 205Dec 21 2,337 3,514 5,851 279Total 252 31,268 61,236 92,504 367
XSP (Mini S&P 500 Index) Open Interest and Dollar Volume (includes LEAPS)
Month Call Put Total Call Put TotalJan 19,425 23,354 42,779 $1,364,971 $1,593,792 $2,958,763Feb 17,866 26,466 44,332 $922,832 $1,293,261 $2,216,093Mar 15,645 29,000 44,645 $3,278,819 $2,007,933 $5,286,752Apr 10,629 26,258 36,887 $321,932 $544,883 $866,815May 10,455 25,227 35,682 $304,071 $318,697 $622,768Jun 9,273 21,663 30,936 $474,349 $1,834,986 $2,309,335Jul 8,910 21,921 30,831 $269,883 $340,216 $610,099Aug 10,888 25,884 36,772 $1,762,598 $5,299,883 $7,062,481Sep 10,989 24,488 35,477 $1,433,671 $3,920,408 $5,354,079Oct 10,544 25,191 35,735 $1,703,639 $2,024,022 $3,727,661Nov 10,301 22,351 32,652 $785,024 $1,449,379 $2,234,403Dec 7,815 17,918 25,733 $1,614,560 $2,503,511 $4,118,071Total -- -- -- $14,236,349 $23,130,971 $37,367,320
Contract Volume
Open Interest in Contracts Dollar Volume
CBOE HOLDINGS, INC. Page 64 2011 MARKET STATISTICS

XSP (Mini S&P 500 Index) Average Premium Per Contract, Average Contracts Per Trade and Transactions (includes LEAPS)
Month Call Put Total Call Put Total Call Put TotalJan $368 $320 $340 8 15 11 453 324 777Feb $349 $257 $288 6 16 10 459 309 768Mar $536 $278 $397 11 14 13 538 516 1,054Apr $267 $239 $249 5 7 6 238 325 563May $198 $197 $198 7 6 6 223 263 486Jun $349 $487 $450 5 11 8 275 357 632Jul $212 $199 $205 6 5 5 228 364 592Aug $473 $431 $441 11 7 8 333 1,744 2,077Sep $746 $615 $646 9 14 13 204 443 647Oct $403 $216 $274 18 25 22 236 378 614Nov $645 $469 $519 6 10 8 221 300 521Dec $691 $712 $704 15 13 14 152 270 422Total $455 $378 $404 9 11 10 3,560 5,593 9,153
TransactionsAverage Premium Per Contract Average Contracts Per Trade
CBOE HOLDINGS, INC. Page 65 2011 MARKET STATISTICS

OEX (S&P 100) Contract Volume (includes LEAPS)
Trading Average DailyMonth Days Call Put Total Volume
Jan 20 212,550 306,785 519,335 25,967Feb 19 211,190 334,578 545,768 28,725Mar 23 283,135 478,197 761,332 33,101Apr 20 197,879 354,171 552,050 27,603May 21 215,656 366,962 582,618 27,744Jun 22 269,973 430,954 700,927 31,860Jul 20 225,980 329,226 555,206 27,760Aug 23 314,224 416,720 730,944 31,780Sep 21 198,294 270,266 468,560 22,312Oct 21 212,987 304,224 517,211 24,629Nov 21 197,117 272,936 470,053 22,383Dec 21 161,338 251,098 412,436 19,640Total 252 2,700,323 4,116,117 6,816,440 27,049
OEX (S&P 100) Open Interest and Dollar Volume (includes LEAPS)
Month Call Put Total Call Put TotalJan 63,026 74,532 137,558 $175,497,660 $65,254,278 $240,751,938Feb 49,082 83,680 132,762 $437,652,320 $77,613,673 $515,265,993Mar 57,041 94,697 151,738 $118,793,160 $167,555,532 $286,348,692Apr 52,960 93,616 146,576 $79,520,774 $91,796,472 $171,317,246May 47,723 71,618 119,341 $63,384,797 $104,998,155 $168,382,952Jun 55,375 95,736 151,111 $87,734,732 $155,461,365 $243,196,097Jul 55,337 77,095 132,432 $117,514,495 $107,211,767 $224,726,262Aug 57,131 77,515 134,646 $146,423,778 $358,466,164 $504,889,942Sep 57,186 70,757 127,943 $106,555,788 $170,120,780 $276,676,568Oct 45,776 69,312 115,088 $146,820,400 $146,871,896 $293,692,296Nov 48,485 64,304 112,789 $102,581,245 $128,164,774 $230,746,019Dec 36,321 62,352 98,673 $68,282,510 $87,667,430 $155,949,940Total -- -- -- $1,650,761,659 $1,661,182,286 $3,311,943,945
Contract Volume
Open Interest in Contracts Dollar Volume
CBOE HOLDINGS, INC. Page 66 2011 MARKET STATISTICS

OEX (S&P 100) Average Premium Per Contract, Average Contracts Per Trade and Transactions (includes LEAPS)
Month Call Put Total Call Put Total Call Put TotalJan $826 $213 $464 14 16 15 14,686 19,017 33,703Feb $2,072 $232 $944 15 17 16 14,146 19,380 33,526Mar $420 $350 $376 14 17 16 20,303 28,270 48,573Apr $402 $259 $310 12 17 15 16,387 20,635 37,022May $294 $286 $289 12 16 14 17,489 22,841 40,330Jun $325 $361 $347 12 15 14 22,840 28,087 50,927Jul $520 $326 $405 12 15 13 19,305 22,562 41,867Aug $466 $860 $691 12 12 12 25,500 33,722 59,222Sep $537 $629 $590 12 12 12 16,849 22,152 39,001Oct $689 $483 $568 12 14 13 18,074 21,529 39,603Nov $520 $470 $491 12 14 13 16,997 19,202 36,199Dec $423 $349 $378 12 16 14 13,580 16,139 29,719Total $611 $404 $486 12 15 14 216,156 273,536 489,692
TransactionsAverage Premium Per Contract Average Contracts Per Trade
CBOE HOLDINGS, INC. Page 67 2011 MARKET STATISTICS

XEO (S&P 100 European Style) Contract Volume (includes LEAPS)
Trading Average DailyMonth Days Call Put Total Volume
Jan 20 45,083 48,448 93,531 4,677Feb 19 39,434 56,392 95,826 5,043Mar 23 47,710 60,073 107,783 4,686Apr 20 33,495 39,434 72,929 3,646May 21 39,619 33,135 72,754 3,464Jun 22 53,444 58,566 112,010 5,091Jul 20 60,931 59,789 120,720 6,036Aug 23 64,982 71,709 136,691 5,943Sep 21 67,367 41,769 109,136 5,197Oct 21 64,619 69,939 134,558 6,408Nov 21 44,958 66,760 111,718 5,320Dec 21 30,755 50,654 81,409 3,877Total 252 592,397 656,668 1,249,065 4,957
XEO (S&P 100 European Style) Open Interest and Dollar Volume (includes LEAPS)
Month Call Put Total Call Put TotalJan 18,875 20,208 39,083 $22,206,135 $17,285,116 $39,491,251Feb 17,372 19,482 36,854 $21,439,787 $16,993,576 $38,433,363Mar 19,149 19,502 38,651 $28,046,851 $36,649,306 $64,696,157Apr 21,028 18,468 39,496 $20,512,769 $19,021,119 $39,533,888May 24,996 17,072 42,068 $29,925,813 $15,862,120 $45,787,933Jun 39,491 28,077 67,568 $36,184,611 $25,558,229 $61,742,840Jul 33,380 23,703 57,083 $29,169,528 $20,613,349 $49,782,877Aug 30,602 28,047 58,649 $44,170,055 $56,919,048 $101,089,103Sep 36,975 18,597 55,572 $41,892,733 $38,550,293 $80,443,026Oct 35,931 30,982 66,913 $58,663,599 $54,803,619 $113,467,218Nov 24,207 24,641 48,848 $33,940,293 $48,997,497 $82,937,790Dec 17,894 28,734 46,628 $24,862,015 $23,386,891 $48,248,906Total -- -- -- $391,014,189 $374,640,163 $765,654,352
Contract Volume
Open Interest in Contracts Dollar Volume
CBOE HOLDINGS, INC. Page 68 2011 MARKET STATISTICS

XEO (S&P 100 European Style) Average Premium Per Contract, Average Contracts Per Trade and Transactions (includes LEAPS)
Month Call Put Total Call Put Total Call Put TotalJan $493 $357 $422 23 24 23 1,955 2,034 3,989Feb $544 $301 $401 25 26 25 1,606 2,182 3,788Mar $588 $610 $600 26 22 24 1,843 2,721 4,564Apr $612 $482 $542 21 20 21 1,609 1,925 3,534May $755 $479 $629 23 17 20 1,698 1,964 3,662Jun $677 $436 $551 19 22 21 2,772 2,640 5,412Jul $479 $345 $412 17 29 21 3,565 2,083 5,648Aug $680 $794 $740 24 29 27 2,658 2,481 5,139Sep $622 $923 $737 24 17 21 2,812 2,472 5,284Oct $908 $784 $843 20 29 24 3,311 2,398 5,709Nov $755 $734 $742 23 34 28 1,992 1,984 3,976Dec $808 $462 $593 21 34 28 1,453 1,471 2,924Total $660 $571 $613 22 25 23 27,274 26,355 53,629
TransactionsAverage Premium Per Contract Average Contracts Per Trade
CBOE HOLDINGS, INC. Page 69 2011 MARKET STATISTICS

DJX (Dow Jones Industrial Average) Contract Volume (includes LEAPS)
Trading Average DailyMonth Days Call Put Total Volume
Jan 20 51,031 74,638 125,669 6,283Feb 19 64,644 60,577 125,221 6,591Mar 23 71,997 106,846 178,843 7,776Apr 20 60,935 68,278 129,213 6,461May 21 49,978 42,766 92,744 4,416Jun 22 93,546 77,157 170,703 7,759Jul 20 48,733 49,130 97,863 4,893Aug 23 105,534 101,627 207,161 9,007Sep 21 69,357 84,563 153,920 7,330Oct 21 58,990 80,679 139,669 6,651Nov 21 75,540 77,506 153,046 7,288Dec 21 45,668 54,045 99,713 4,748Total 252 795,953 877,812 1,673,765 6,642
DJX (Dow Jones Industrial Average) Open Interest and Dollar Volume (includes LEAPS)
Month Call Put Total Call Put TotalJan 153,081 209,493 362,574 $14,377,082 $12,669,999 $27,047,081Feb 164,602 224,369 388,971 $22,233,274 $7,818,324 $30,051,598Mar 155,688 189,470 345,158 $20,082,197 $22,557,227 $42,639,424Apr 177,541 216,142 393,683 $14,790,098 $11,126,869 $25,916,967May 190,548 212,054 402,602 $16,409,480 $10,530,321 $26,939,801Jun 150,571 131,612 282,183 $26,246,695 $17,073,695 $43,320,390Jul 156,437 143,030 299,467 $17,622,128 $9,199,666 $26,821,794Aug 187,539 169,416 356,955 $24,248,806 $30,044,223 $54,293,029Sep 163,645 128,826 292,471 $21,793,949 $45,903,770 $67,697,719Oct 180,448 147,722 328,170 $32,121,697 $20,496,356 $52,618,053Nov 202,133 152,864 354,997 $43,215,930 $30,702,839 $73,918,769Dec 126,545 100,403 226,948 $23,063,095 $13,452,786 $36,515,881Total -- -- -- $276,204,431 $231,576,075 $507,780,506
Contract Volume
Open Interest in Contracts Dollar Volume
CBOE HOLDINGS, INC. Page 70 2011 MARKET STATISTICS

DJX (Dow Jones Industrial Average) Average Premium Per Contract, Average Contracts Per Trade and Transactions (includes LEAPS)
Month Call Put Total Call Put Total Call Put TotalJan $282 $170 $215 26 26 26 1,938 2,825 4,763Feb $344 $129 $240 27 21 24 2,369 2,898 5,267Mar $279 $211 $238 25 23 24 2,892 4,571 7,463Apr $243 $163 $201 32 32 32 1,899 2,123 4,022May $328 $246 $290 27 23 25 1,831 1,872 3,703Jun $281 $221 $254 47 27 35 1,997 2,833 4,830Jul $362 $187 $274 24 19 21 2,011 2,554 4,565Aug $230 $296 $262 27 19 22 3,941 5,491 9,432Sep $314 $543 $440 29 21 24 2,373 3,951 6,324Oct $545 $254 $377 30 22 25 1,967 3,590 5,557Nov $572 $396 $483 30 21 25 2,559 3,614 6,173Dec $505 $249 $366 29 23 26 1,568 2,332 3,900Total $347 $264 $303 29 23 25 27,345 38,654 65,999
Average Premium Per Contract Average Contracts Per Trade Transactions
CBOE HOLDINGS, INC. Page 71 2011 MARKET STATISTICS
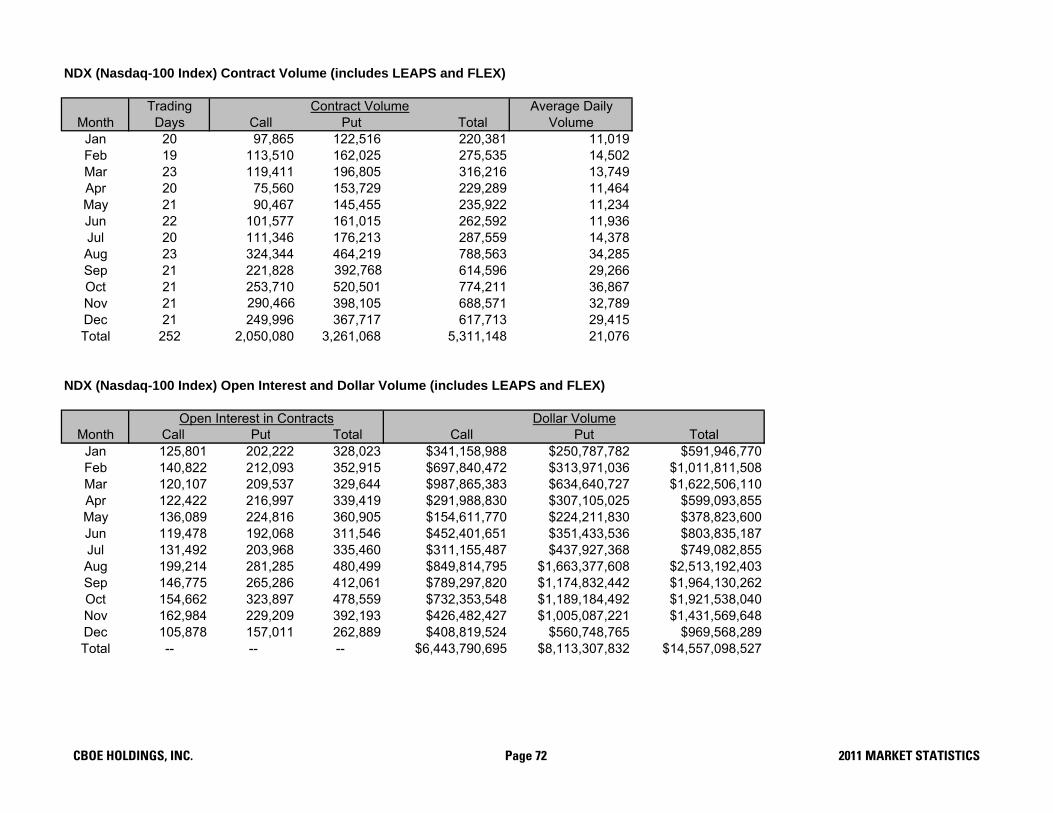
NDX (Nasdaq-100 Index) Contract Volume (includes LEAPS and FLEX)
Trading Average DailyMonth Days Call Put Total Volume
Jan 20 97,865 122,516 220,381 11,019Feb 19 113,510 162,025 275,535 14,502Mar 23 119,411 196,805 316,216 13,749Apr 20 75,560 153,729 229,289 11,464May 21 90,467 145,455 235,922 11,234Jun 22 101,577 161,015 262,592 11,936Jul 20 111,346 176,213 287,559 14,378Aug 23 324,344 464,219 788,563 34,285Sep 21 221,828 392,768 614,596 29,266Oct 21 253,710 520,501 774,211 36,867Nov 21 290,466 398,105 688,571 32,789Dec 21 249,996 367,717 617,713 29,415Total 252 2,050,080 3,261,068 5,311,148 21,076
NDX (Nasdaq-100 Index) Open Interest and Dollar Volume (includes LEAPS and FLEX)
Month Call Put Total Call Put TotalJan 125,801 202,222 328,023 $341,158,988 $250,787,782 $591,946,770Feb 140,822 212,093 352,915 $697,840,472 $313,971,036 $1,011,811,508Mar 120,107 209,537 329,644 $987,865,383 $634,640,727 $1,622,506,110Apr 122,422 216,997 339,419 $291,988,830 $307,105,025 $599,093,855May 136,089 224,816 360,905 $154,611,770 $224,211,830 $378,823,600Jun 119,478 192,068 311,546 $452,401,651 $351,433,536 $803,835,187Jul 131,492 203,968 335,460 $311,155,487 $437,927,368 $749,082,855Aug 199,214 281,285 480,499 $849,814,795 $1,663,377,608 $2,513,192,403Sep 146,775 265,286 412,061 $789,297,820 $1,174,832,442 $1,964,130,262Oct 154,662 323,897 478,559 $732,353,548 $1,189,184,492 $1,921,538,040Nov 162,984 229,209 392,193 $426,482,427 $1,005,087,221 $1,431,569,648Dec 105,878 157,011 262,889 $408,819,524 $560,748,765 $969,568,289Total -- -- -- $6,443,790,695 $8,113,307,832 $14,557,098,527
Contract Volume
Open Interest in Contracts Dollar Volume
CBOE HOLDINGS, INC. Page 72 2011 MARKET STATISTICS

NDX (Nasdaq-100 Index) Average Premium Per Contract, Average Contracts Per Trade and Transactions (includes LEAPS and FLEX)
Month Call Put Total Call Put Total Call Put TotalJan $3,486 $2,047 $2,686 10 14 12 9,874 8,473 18,347Feb $6,148 $1,938 $3,672 12 15 13 9,671 11,082 20,753Mar $8,273 $3,225 $5,131 11 14 13 10,902 13,937 24,839Apr $3,864 $1,998 $2,613 11 19 15 7,083 8,062 15,145May $1,709 $1,541 $1,606 12 17 15 7,696 8,357 16,053Jun $4,454 $2,183 $3,061 16 17 17 6,511 9,347 15,858Jul $2,794 $2,485 $2,605 15 22 18 7,390 8,179 15,569Aug $2,620 $3,583 $3,187 22 29 26 14,638 15,742 30,380Sep $3,558 $2,991 $3,196 26 36 32 8,444 10,787 19,231Oct $2,887 $2,285 $2,482 27 46 37 9,487 11,437 20,924Nov $1,468 $2,525 $2,079 33 35 34 8,808 11,280 20,088Dec $1,635 $1,525 $1,570 32 40 36 7,745 9,236 16,981Total $3,143 $2,488 $2,741 19 26 23 108,249 125,919 234,168
Average Premium Per Contract Average Contracts Per Trade Transactions
CBOE HOLDINGS, INC. Page 73 2011 MARKET STATISTICS

MNX (Mini Nasdaq-100 Index) Contract Volume (includes LEAPS)
Trading Average DailyMonth Days Call Put Total Volume
Jan 20 13,121 13,839 26,960 1,348Feb 19 11,333 16,833 28,166 1,482Mar 23 12,218 14,803 27,021 1,175Apr 20 20,688 5,990 26,678 1,334May 21 9,951 9,918 19,869 946Jun 22 10,599 8,821 19,420 883Jul 20 13,920 10,721 24,641 1,232Aug 23 29,948 12,292 42,240 1,837Sep 21 17,889 3,090 20,979 999Oct 21 25,873 3,599 29,472 1,403Nov 21 3,190 715 3,905 186Dec 21 1,382 1,168 2,550 121Total 252 170,112 101,789 271,901 1,079
MNX (Mini Nasdaq-100 Index) Open Interest and Dollar Volume (includes LEAPS)
Month Call Put Total Call Put TotalJan 181,060 191,265 372,325 $10,006,151 $16,665,482 $26,671,633Feb 185,129 210,558 395,687 $7,167,570 $18,744,722 $25,912,292Mar 155,236 183,312 338,548 $4,584,510 $5,767,863 $10,352,373Apr 164,071 181,635 345,706 $10,974,483 $3,501,195 $14,475,678May 166,385 182,001 348,386 $5,497,832 $4,723,867 $10,221,699Jun 124,615 166,651 291,266 $3,915,875 $3,177,098 $7,092,973Jul 124,249 181,788 306,037 $14,625,090 $9,153,212 $23,778,302Aug 129,915 182,933 312,848 $12,254,306 $5,539,226 $17,793,532Sep 126,015 177,004 303,019 $19,259,904 $1,946,564 $21,206,468Oct 125,457 166,502 291,959 $30,736,599 $1,065,890 $31,802,489Nov 126,420 168,401 294,821 $3,210,080 $414,378 $3,624,458Dec 62,292 95,062 157,354 $756,441 $180,851 $937,292Total -- -- -- $122,988,841 $70,880,348 $193,869,189
Contract Volume
Open Interest in Contracts Dollar Volume
CBOE HOLDINGS, INC. Page 74 2011 MARKET STATISTICS
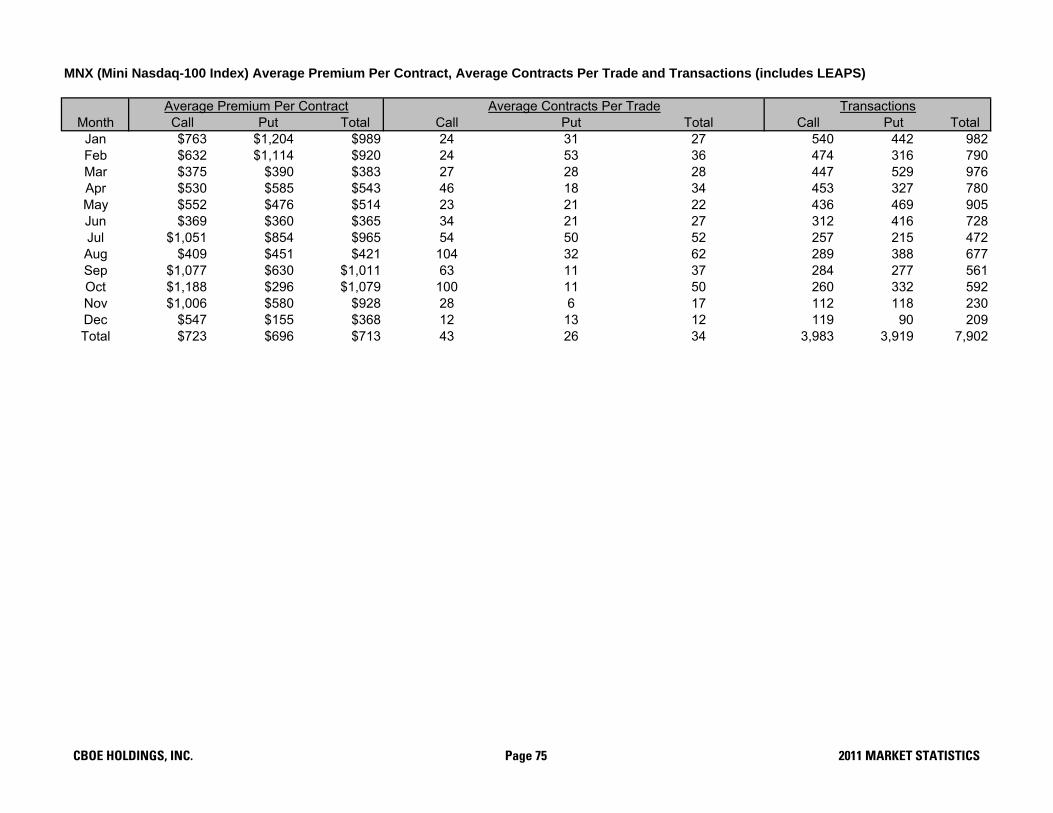
MNX (Mini Nasdaq-100 Index) Average Premium Per Contract, Average Contracts Per Trade and Transactions (includes LEAPS)
Month Call Put Total Call Put Total Call Put TotalJan $763 $1,204 $989 24 31 27 540 442 982Feb $632 $1,114 $920 24 53 36 474 316 790Mar $375 $390 $383 27 28 28 447 529 976Apr $530 $585 $543 46 18 34 453 327 780May $552 $476 $514 23 21 22 436 469 905Jun $369 $360 $365 34 21 27 312 416 728Jul $1,051 $854 $965 54 50 52 257 215 472Aug $409 $451 $421 104 32 62 289 388 677Sep $1,077 $630 $1,011 63 11 37 284 277 561Oct $1,188 $296 $1,079 100 11 50 260 332 592Nov $1,006 $580 $928 28 6 17 112 118 230Dec $547 $155 $368 12 13 12 119 90 209Total $723 $696 $713 43 26 34 3,983 3,919 7,902
Average Premium Per Contract Average Contracts Per Trade Transactions
CBOE HOLDINGS, INC. Page 75 2011 MARKET STATISTICS
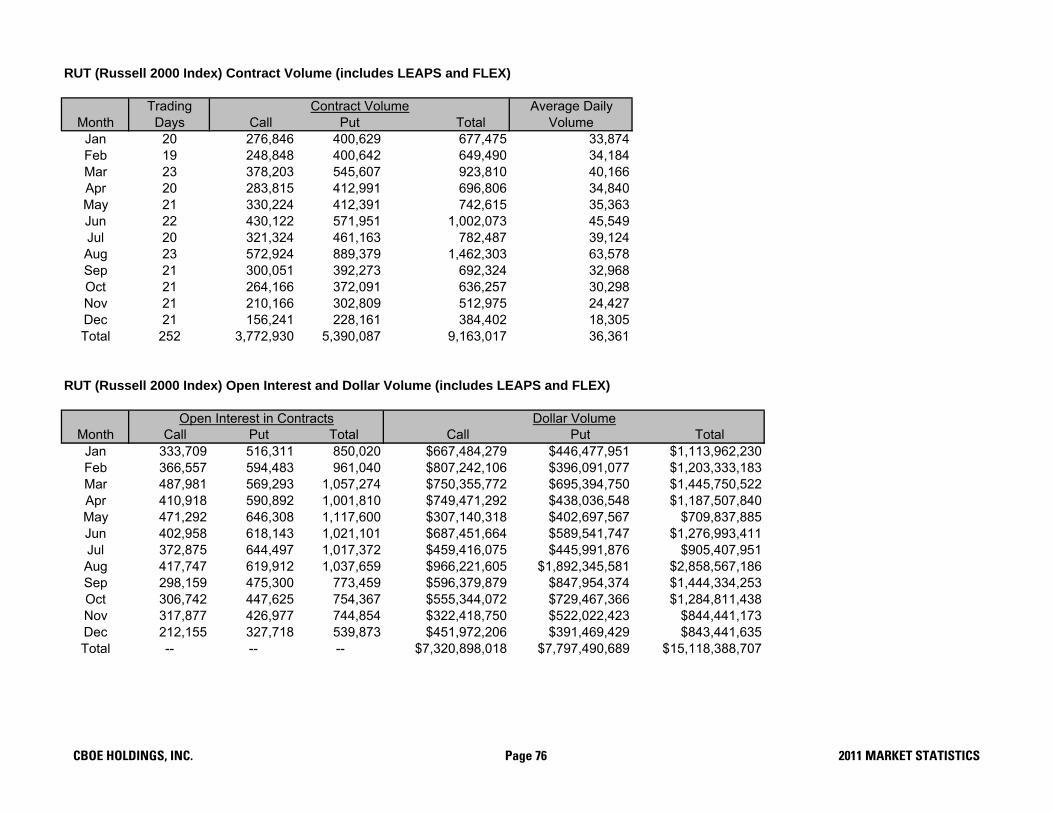
RUT (Russell 2000 Index) Contract Volume (includes LEAPS and FLEX)
Trading Average DailyMonth Days Call Put Total Volume
Jan 20 276,846 400,629 677,475 33,874Feb 19 248,848 400,642 649,490 34,184Mar 23 378,203 545,607 923,810 40,166Apr 20 283,815 412,991 696,806 34,840May 21 330,224 412,391 742,615 35,363Jun 22 430,122 571,951 1,002,073 45,549Jul 20 321,324 461,163 782,487 39,124Aug 23 572,924 889,379 1,462,303 63,578Sep 21 300,051 392,273 692,324 32,968Oct 21 264,166 372,091 636,257 30,298Nov 21 210,166 302,809 512,975 24,427Dec 21 156,241 228,161 384,402 18,305Total 252 3,772,930 5,390,087 9,163,017 36,361
RUT (Russell 2000 Index) Open Interest and Dollar Volume (includes LEAPS and FLEX)
Month Call Put Total Call Put TotalJan 333,709 516,311 850,020 $667,484,279 $446,477,951 $1,113,962,230Feb 366,557 594,483 961,040 $807,242,106 $396,091,077 $1,203,333,183Mar 487,981 569,293 1,057,274 $750,355,772 $695,394,750 $1,445,750,522Apr 410,918 590,892 1,001,810 $749,471,292 $438,036,548 $1,187,507,840May 471,292 646,308 1,117,600 $307,140,318 $402,697,567 $709,837,885Jun 402,958 618,143 1,021,101 $687,451,664 $589,541,747 $1,276,993,411Jul 372,875 644,497 1,017,372 $459,416,075 $445,991,876 $905,407,951Aug 417,747 619,912 1,037,659 $966,221,605 $1,892,345,581 $2,858,567,186Sep 298,159 475,300 773,459 $596,379,879 $847,954,374 $1,444,334,253Oct 306,742 447,625 754,367 $555,344,072 $729,467,366 $1,284,811,438Nov 317,877 426,977 744,854 $322,418,750 $522,022,423 $844,441,173Dec 212,155 327,718 539,873 $451,972,206 $391,469,429 $843,441,635Total -- -- -- $7,320,898,018 $7,797,490,689 $15,118,388,707
Contract Volume
Open Interest in Contracts Dollar Volume
CBOE HOLDINGS, INC. Page 76 2011 MARKET STATISTICS

RUT (Russell 2000 Index) Average Premium Per Contract, Average Contracts Per Trade and Transactions (includes LEAPS and FLEX)
Month Call Put Total Call Put Total Call Put TotalJan $2,411 $1,114 $1,644 22 30 27 12,334 13,156 25,490Feb $3,244 $989 $1,853 19 29 24 12,779 13,897 26,676Mar $1,984 $1,275 $1,565 18 24 21 21,561 22,307 43,868Apr $2,641 $1,061 $1,704 19 24 22 14,961 16,883 31,844May $930 $976 $956 20 22 21 16,433 18,572 35,005Jun $1,598 $1,031 $1,274 25 30 28 17,039 18,965 36,004Jul $1,430 $967 $1,157 22 24 23 14,676 19,333 34,009Aug $1,686 $2,128 $1,955 26 27 26 22,096 33,561 55,657Sep $1,988 $2,162 $2,086 17 19 18 17,289 20,712 38,001Oct $2,102 $1,960 $2,019 16 22 19 16,901 17,163 34,064Nov $1,534 $1,724 $1,646 13 17 15 16,253 17,601 33,854Dec $2,893 $1,716 $2,194 13 19 16 12,314 11,886 24,200Total $1,940 $1,447 $1,650 19 24 22 194,636 224,036 418,672
Average Premium Per Contract Average Contracts Per Trade Transactions
CBOE HOLDINGS, INC. Page 77 2011 MARKET STATISTICS

VIX (CBOE Volatility Index) Contract Volume (includes FLEX)
Trading Average DailyMonth Days Call Put Total Volume
Jan 20 5,024,434 2,896,264 7,920,698 396,035Feb 19 4,545,274 2,501,417 7,046,691 370,878Mar 23 7,435,821 3,231,422 10,667,243 463,793Apr 20 4,315,104 1,980,721 6,295,825 314,791May 21 5,053,357 2,149,945 7,203,302 343,014Jun 22 6,195,874 2,346,924 8,542,798 388,309Jul 20 6,339,449 2,511,408 8,850,857 442,543Aug 23 8,382,434 5,004,065 13,386,499 582,022Sep 21 4,731,418 3,463,730 8,195,148 390,245Oct 21 4,030,155 4,028,278 8,058,433 383,735Nov 21 4,068,791 2,603,018 6,671,809 317,705Dec 21 3,117,265 2,032,383 5,149,648 245,221Total 252 63,239,376 34,749,575 97,988,951 388,845
VIX (CBOE Volatility Index) Open Interest and Dollar Volume (includes FLEX)
Month Call Put Total Call Put TotalJan 3,248,817 1,825,965 5,074,782 $529,082,755 $558,947,580 $1,088,030,335Feb 3,193,175 2,186,657 5,379,832 $464,944,551 $372,397,989 $837,342,540Mar 2,800,275 2,035,679 4,835,954 $1,008,356,369 $471,671,377 $1,480,027,746Apr 2,952,387 1,728,759 4,681,146 $499,742,094 $362,718,754 $862,460,848May 3,187,008 1,613,610 4,800,618 $453,348,878 $315,832,483 $769,181,361Jun 3,056,063 1,298,355 4,354,418 $730,874,134 $331,090,375 $1,061,964,509Jul 3,213,624 1,567,233 4,780,857 $681,428,978 $371,630,149 $1,053,059,127Aug 2,915,967 2,280,745 5,196,712 $2,290,986,246 $891,265,212 $3,182,251,458Sep 2,404,219 2,170,214 4,574,433 $1,600,183,859 $506,766,228 $2,106,950,087Oct 2,086,057 2,192,376 4,278,433 $886,636,107 $737,078,093 $1,623,714,200Nov 2,139,840 1,735,455 3,875,295 $915,867,802 $447,690,946 $1,363,558,748Dec 1,649,676 1,451,138 3,100,814 $380,014,251 $297,379,523 $677,393,774Total -- -- -- $10,441,466,024 $5,664,468,709 $16,105,934,733
Contract Volume
Open Interest in Contracts Dollar Volume
CBOE HOLDINGS, INC. Page 78 2011 MARKET STATISTICS

VIX (CBOE Volatility Index) Average Premium Per Contract, Average Contracts Per Trade and Transactions (includes FLEX)
Month Call Put Total Call Put Total Call Put TotalJan $105 $193 $137 79 125 91 63,647 23,184 86,831Feb $102 $149 $119 60 90 68 76,031 27,669 103,700Mar $136 $146 $139 65 72 67 113,600 44,920 158,520Apr $116 $183 $137 51 77 57 84,969 25,725 110,694May $90 $147 $107 71 92 76 71,662 23,410 95,072Jun $118 $141 $124 72 81 74 86,074 29,087 115,161Jul $107 $148 $119 72 76 73 87,653 33,205 120,858Aug $273 $178 $238 69 77 71 122,362 64,918 187,280Sep $338 $146 $257 68 85 74 69,372 40,677 110,049Oct $220 $183 $201 60 85 70 67,069 47,392 114,461Nov $225 $172 $204 62 69 65 65,470 37,662 103,132Dec $122 $146 $132 57 77 64 54,374 26,328 80,702Total $165 $163 $164 66 82 71 962,283 424,177 1,386,460
Average Premium Per Contract Average Contracts Per Trade Transactions
CBOE HOLDINGS, INC. Page 79 2011 MARKET STATISTICS

Other Cash Index Options Products Contract Volume
Trading Average DailyMonth Days Call Put Total Volume
Jan 20 0 0 0 0Feb 19 0 0 0 0Mar 23 0 0 0 0Apr 20 97 30 127 6May 21 25 20 45 2Jun 22 20 2 22 1Jul 20 67 1 68 3Aug 23 71 509 580 25Sep 21 10 8 18 1Oct 21 0 5 5 0Nov 21 0 0 0 0Dec 21 0 0 0 0Total 190 290 575 865 5
Other Cash Index Options Products Open Interest and Dollar Volume
Month Call Put Total Call Put TotalJan 1,285 3,919 5,204 $0 $0 $0Feb 1,177 4,721 5,898 $0 $0 $0Mar 610 1,938 2,548 $0 $0 $0Apr 798 600 1,398 $12,561 $1,198 $13,759May 817 770 1,587 $4,165 $270 $4,435Jun 39 58 97 $600 $230 $830Jul 79 14 93 $11,900 $10 $11,910Aug 39 525 564 $18,950 $110,435 $129,385Sep 16 133 149 $4,745 $290 $5,035Oct 17 116 133 $0 $560 $560Nov 15 38 53 $0 $0 $0Dec 8 11 19 $0 $0 $0Total -- -- -- $52,921 $112,993 $165,914
Open Interest in Contracts Dollar Volume
Includes GVZ, MVR, RMN, RUI
Contract Volume
CBOE HOLDINGS, INC. Page 80 2011 MARKET STATISTICS
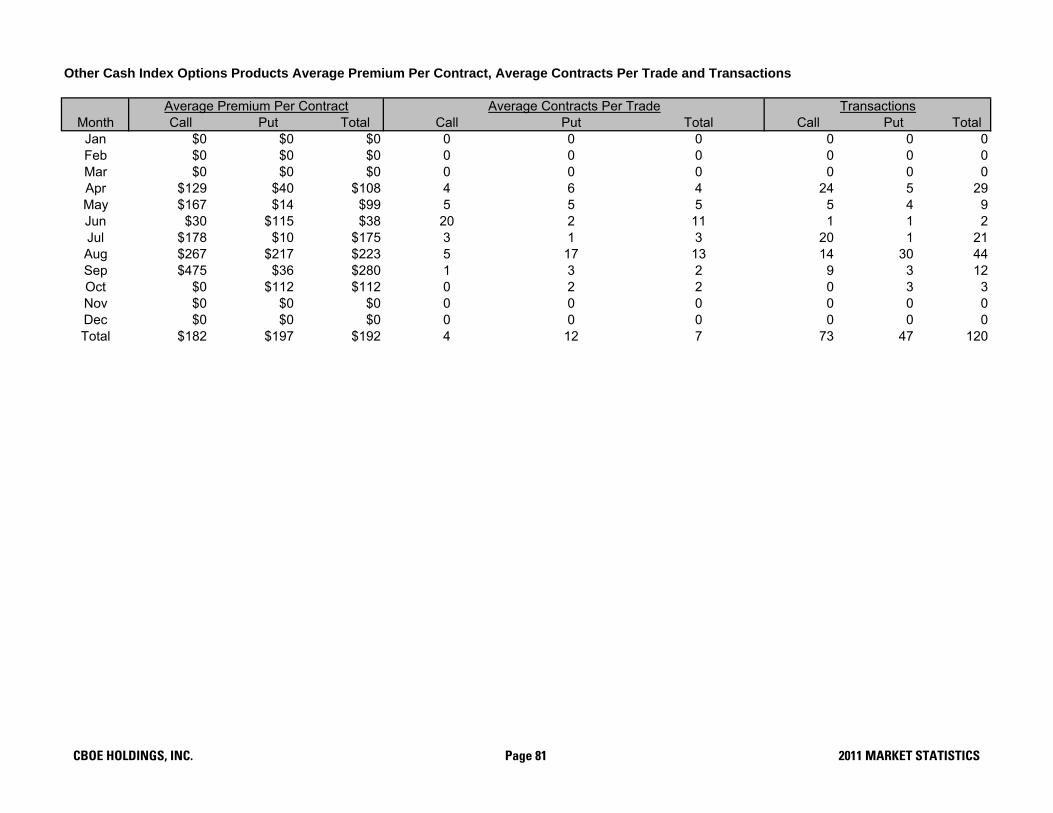
Other Cash Index Options Products Average Premium Per Contract, Average Contracts Per Trade and Transactions
Month Call Put Total Call Put Total Call Put TotalJan $0 $0 $0 0 0 0 0 0 0Feb $0 $0 $0 0 0 0 0 0 0Mar $0 $0 $0 0 0 0 0 0 0Apr $129 $40 $108 4 6 4 24 5 29May $167 $14 $99 5 5 5 5 4 9Jun $30 $115 $38 20 2 11 1 1 2Jul $178 $10 $175 3 1 3 20 1 21Aug $267 $217 $223 5 17 13 14 30 44Sep $475 $36 $280 1 3 2 9 3 12Oct $0 $112 $112 0 2 2 0 3 3Nov $0 $0 $0 0 0 0 0 0 0Dec $0 $0 $0 0 0 0 0 0 0Total $182 $197 $192 4 12 7 73 47 120
TransactionsAverage Premium Per Contract Average Contracts Per Trade
CBOE HOLDINGS, INC. Page 81 2011 MARKET STATISTICS

OTHER CASH INDEX OPTIONS CONTRACT VOLUME DETAIL
Month GVZJanFebMarApr 127May 45Jun 22Jul 68Aug 580Sep 18Oct 5NovDecTotal 865
CBOE
CBOE HOLDINGS, INC. Page 82 2011 MARKET STATISTICS

CBOE BINARY OPTIONS - 2011
BSZ CBOE Binary Options (SPX) Contract Volume
Trading Average DailyMonth Days Call Put Total Volume
Jan 20 447 1,450 1,897 95Feb 19 862 2,214 3,076 162Mar 23 8,413 2,619 11,032 480Apr 20 10 0 10 1May 21 0 182 182 9Jun 22 0 10 10 0Jul 20 30 105 135 7Aug 23 0 30 30 1Sep 21 0 8 8 0Oct 21 0 199 199 9Nov 21 6 50 56 3Dec 21 0 200 200 10Total 252 9,768 7,067 16,835 67
BSZ CBOE Binary Options (SPX) Open Interest and Dollar Volume
Month Call Put Total Call Put TotalJan 14,850 4,073 18,923 $37,447 $67,045 $104,492Feb 15,592 5,123 20,715 $68,208 $51,307 $119,515Mar 200 410 610 $116,491 $175,095 $291,586Apr 10 0 10 $590 $0 $590May 0 130 130 $0 $4,863 $4,863Jun 0 0 0 $0 $50 $50Jul 0 100 100 $405 $2,075 $2,480Aug 0 10 10 $0 $1,340 $1,340Sep 0 0 0 $0 $696 $696Oct 0 0 0 $0 $2,880 $2,880Nov 0 0 0 $270 $675 $945Dec 0 200 200 $0 $11,190 $11,190Total -- -- -- $223,411 $317,216 $540,627
BSZ CBOE Binary Options (SPX) Average Premium Per Contract, Average Contracts Per Trade and Transactions
Month Call Put Total Call Put Total Call Put TotalJan $84 $46 $55 37 97 70 12 15 27Feb $79 $23 $39 78 105 96 11 21 32Mar $14 $67 $26 324 105 216 26 25 51Apr $59 $0 $59 10 0 10 1 0 1May $0 $27 $27 0 20 20 0 9 9Jun $0 $5 $5 0 10 10 0 1 1Jul $14 $20 $18 15 53 34 2 2 4Aug $0 $45 $45 0 15 15 0 2 2Sep $0 $87 $87 0 4 4 0 2 2Oct $0 $14 $14 0 28 28 0 7 7Nov $45 $14 $17 3 25 14 2 2 4Dec $0 $56 $56 0 50 50 0 4 4Total $23 $45 $32 181 79 117 54 90 144
Contract Volume
Open Interest in Contracts Dollar Volume
Average Premium Per Contract Average Contracts Per Trade Transactions
CBOE HOLDINGS, INC. Page 83 2011 MARKET STATISTICS

BVZ CBOE Binary Options (VIX) Contract Volume
Trading Average DailyMonth Days Call Put Total Volume
Jan 20 1,716 19 1,735 87Feb 19 1,238 1 1,239 65Mar 23 514 1,101 1,615 70Apr 20 1,448 115 1,563 78May 21 56 21 77 4Jun 22 141 1 142 6Jul 20 60 0 60 3Aug 23 1,326 173 1,499 65Sep 21 156 82 238 11Oct 21 294 600 894 43Nov 21 374 409 783 37Dec 21 32 40 72 3Total 252 7,355 2,562 9,917 39
BVZ CBOE Binary Options (VIX) Open Interest and Dollar Volume
Month Call Put Total Call Put TotalJan 1,651 4 1,655 $48,968 $741 $49,709Feb 793 1 794 $78,271 $34 $78,305Mar 300 1,000 1,300 $31,945 $24,014 $55,959Apr 34 0 34 $77,560 $3,240 $80,800May 34 0 34 $3,208 $677 $3,885Jun 9 1 10 $9,318 $40 $9,358Jul 0 0 0 $3,065 $0 $3,065Aug 70 12 82 $19,788 $7,530 $27,318Sep 11 4 15 $7,144 $5,918 $13,062Oct 85 0 85 $22,899 $7,150 $30,049Nov 76 90 166 $13,913 $9,660 $23,573Dec 1 10 11 $1,770 $1,950 $3,720Total -- -- -- $317,849 $60,954 $378,803
BVZ CBOE Binary Options (VIX) Average Premium Per Contract, Average Contracts Per Trade and Transactions
Month Call Put Total Call Put Total Call Put TotalJan $29 $39 $29 49 5 44 35 4 39Feb $63 $34 $63 32 1 31 39 1 40Mar $62 $22 $35 22 220 58 23 5 28Apr $54 $28 $52 24 29 24 60 4 64May $57 $32 $50 7 7 7 8 3 11Jun $66 $40 $66 20 1 18 7 1 8Jul $51 $0 $51 10 0 10 6 0 6Aug $15 $44 $18 102 10 48 13 18 31Sep $46 $72 $55 26 16 22 6 5 11Oct $78 $12 $34 49 200 99 6 3 9Nov $37 $24 $30 34 45 39 11 9 20Dec $55 $49 $52 11 20 14 3 2 5Total $43 $24 $38 34 47 36 217 55 272
Average Premium Per Contract Average Contracts Per Trade Transactions
Contract Volume
Open Interest in Contracts Dollar Volume
CBOE HOLDINGS, INC. Page 84 2011 MARKET STATISTICS
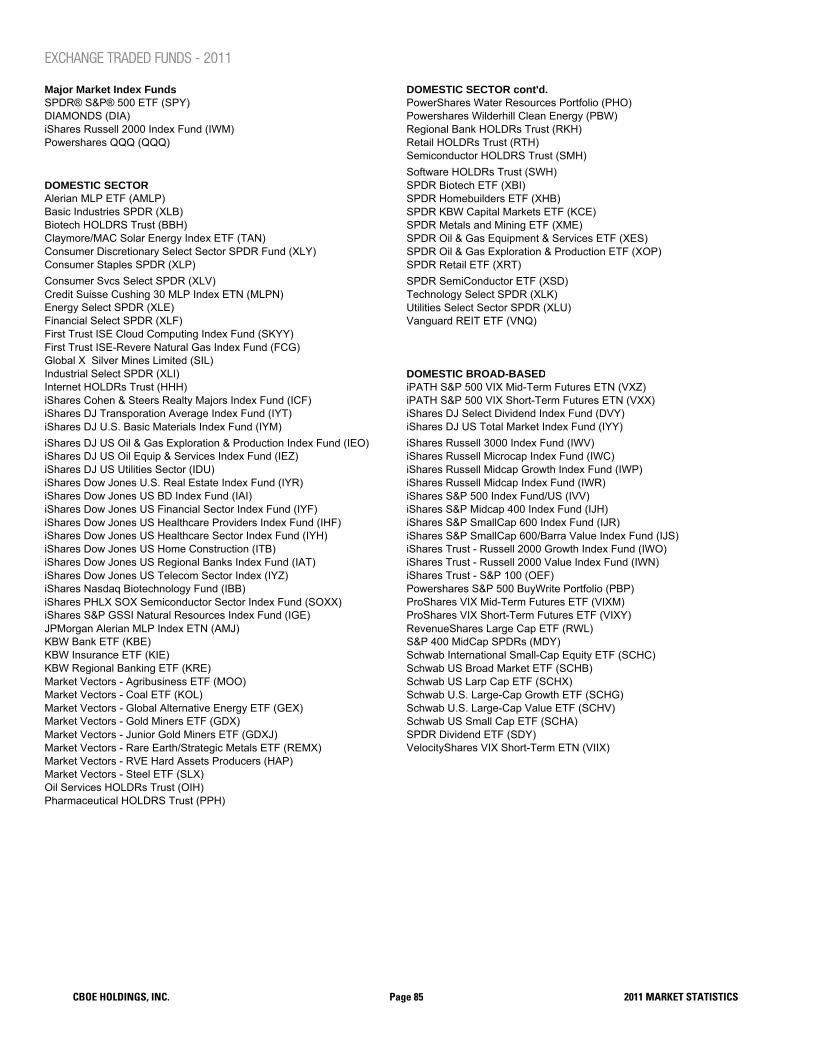
EXCHANGE TRADED FUNDS - 2011
Major Market Index Funds DOMESTIC SECTOR cont'd.SPDR® S&P® 500 ETF (SPY) PowerShares Water Resources Portfolio (PHO)DIAMONDS (DIA) Powershares Wilderhill Clean Energy (PBW)iShares Russell 2000 Index Fund (IWM) Regional Bank HOLDRs Trust (RKH)Powershares QQQ (QQQ) Retail HOLDRs Trust (RTH)
Semiconductor HOLDRS Trust (SMH)Software HOLDRs Trust (SWH)
DOMESTIC SECTOR SPDR Biotech ETF (XBI)Alerian MLP ETF (AMLP) SPDR Homebuilders ETF (XHB)Basic Industries SPDR (XLB) SPDR KBW Capital Markets ETF (KCE)Biotech HOLDRS Trust (BBH) SPDR Metals and Mining ETF (XME)Claymore/MAC Solar Energy Index ETF (TAN) SPDR Oil & Gas Equipment & Services ETF (XES)Consumer Discretionary Select Sector SPDR Fund (XLY) SPDR Oil & Gas Exploration & Production ETF (XOP)Consumer Staples SPDR (XLP) SPDR Retail ETF (XRT)Consumer Svcs Select SPDR (XLV) SPDR SemiConductor ETF (XSD)Credit Suisse Cushing 30 MLP Index ETN (MLPN) Technology Select SPDR (XLK)Energy Select SPDR (XLE) Utilities Select Sector SPDR (XLU)Financial Select SPDR (XLF) Vanguard REIT ETF (VNQ)First Trust ISE Cloud Computing Index Fund (SKYY)First Trust ISE-Revere Natural Gas Index Fund (FCG)Global X Silver Mines Limited (SIL)Industrial Select SPDR (XLI) DOMESTIC BROAD-BASEDInternet HOLDRs Trust (HHH) iPATH S&P 500 VIX Mid-Term Futures ETN (VXZ)iShares Cohen & Steers Realty Majors Index Fund (ICF) iPATH S&P 500 VIX Short-Term Futures ETN (VXX)iShares DJ Transporation Average Index Fund (IYT) iShares DJ Select Dividend Index Fund (DVY)iShares DJ U.S. Basic Materials Index Fund (IYM) iShares DJ US Total Market Index Fund (IYY)iShares DJ US Oil & Gas Exploration & Production Index Fund (IEO) iShares Russell 3000 Index Fund (IWV)iShares DJ US Oil Equip & Services Index Fund (IEZ) iShares Russell Microcap Index Fund (IWC)iShares DJ US Utilities Sector (IDU) iShares Russell Midcap Growth Index Fund (IWP)iShares Dow Jones U.S. Real Estate Index Fund (IYR) iShares Russell Midcap Index Fund (IWR)iShares Dow Jones US BD Index Fund (IAI) iShares S&P 500 Index Fund/US (IVV)iShares Dow Jones US Financial Sector Index Fund (IYF) iShares S&P Midcap 400 Index Fund (IJH)iShares Dow Jones US Healthcare Providers Index Fund (IHF) iShares S&P SmallCap 600 Index Fund (IJR)iShares Dow Jones US Healthcare Sector Index Fund (IYH) iShares S&P SmallCap 600/Barra Value Index Fund (IJS)iShares Dow Jones US Home Construction (ITB) iShares Trust - Russell 2000 Growth Index Fund (IWO)iShares Dow Jones US Regional Banks Index Fund (IAT) iShares Trust - Russell 2000 Value Index Fund (IWN)iShares Dow Jones US Telecom Sector Index (IYZ) iShares Trust - S&P 100 (OEF)iShares Nasdaq Biotechnology Fund (IBB) Powershares S&P 500 BuyWrite Portfolio (PBP)iShares PHLX SOX Semiconductor Sector Index Fund (SOXX) ProShares VIX Mid-Term Futures ETF (VIXM)iShares S&P GSSI Natural Resources Index Fund (IGE) ProShares VIX Short-Term Futures ETF (VIXY)JPMorgan Alerian MLP Index ETN (AMJ) RevenueShares Large Cap ETF (RWL)KBW Bank ETF (KBE) S&P 400 MidCap SPDRs (MDY)KBW Insurance ETF (KIE) Schwab International Small-Cap Equity ETF (SCHC)KBW Regional Banking ETF (KRE) Schwab US Broad Market ETF (SCHB)Market Vectors - Agribusiness ETF (MOO) Schwab US Larp Cap ETF (SCHX)Market Vectors - Coal ETF (KOL) Schwab U.S. Large-Cap Growth ETF (SCHG)Market Vectors - Global Alternative Energy ETF (GEX) Schwab U.S. Large-Cap Value ETF (SCHV)Market Vectors - Gold Miners ETF (GDX) Schwab US Small Cap ETF (SCHA)Market Vectors - Junior Gold Miners ETF (GDXJ) SPDR Dividend ETF (SDY)Market Vectors - Rare Earth/Strategic Metals ETF (REMX) VelocityShares VIX Short-Term ETN (VIIX)Market Vectors - RVE Hard Assets Producers (HAP)Market Vectors - Steel ETF (SLX)Oil Services HOLDRs Trust (OIH)Pharmaceutical HOLDRS Trust (PPH)
CBOE HOLDINGS, INC. Page 85 2011 MARKET STATISTICS

EXCHANGE TRADED FUNDS - 2011 cont'd.
FOREIGN COMMODITY POOLS cont'd.Claymore/BNY BRIC ETF (EEB) GreenHaven Continuous Commodity Index fund (GCC)Claymore/Alpha Shares China All-Cap ETF (YAO) iPath Dow Jones-UBS Commodity Index Total Return ETN (DJP)Claymore/AlphaShares China Small Cap Index ETF (HAO) iPath Dow Jones-UBS Copper Subindex Total Return ETN (JJC)DJ EURO STOXX 50 Fund (FEZ) iPath Dow Jones-UBS Cotton Subindex Total Return ETN (BAL)iPath MSCI India Index ETN (INP) iPath Dow Jones-UBS Livestock Subindex Total Return ETN (COW)IQ Global Agribusiness Small Cap ETF (CROP) iPath Dow Jones-UBS Natural Gas Subindex Total Return ETN (GAZ)iShares FTSE/Xinhua China Index Fund (FXI) iPath Dow Jones-UBS Sugar Total Return Sub-IndexSM ETN (SGG)iShares MSCI ACWI Index ETF (ACWI) iPath Goldman Sachs Crude Oil Total Return Index ETN (OIL)iShares MSCI All Peru Capped Index Fund (EPU) iShares COMEX Gold Trust (IAU)iShares MSCI Australia Index (EWA) iShares GSCI Commodity-Indexed Trust (GSG)iShares MSCI Brazil Index Fund (EWZ) iShares Silver Trust (SLV)iShares MSCI BRIC Index Fund (BKF) Physical Silver Shares ETFS (SIVR)iShares MSCI Canada Index Fund (EWC) PowerShares DB Agriculture Fund (DBA)iShares MSCI Chile Investable Market Index Fund (ECH) PowerShares DB Base Metals Fund (DBB)iShares MSCI EAFE Index Fund (EFA) PowerShares DB Commodity Index Tracking Fund (DBC)iShares MSCI Emerging Markets Index (EEM) PowerShares DB Energy Fund (DBE)iShares MSCI EMU Index Fund (EZU) PowerShares DB Gold Fund (DGL)iShares MSCI Germany Index (EWG) PowerShares DB Oil Fund (DBO)iShares MSCI Hong Kong Index Fund (EWH) PowerShares DB Precious Metals Fund (DBP)iShares MSCI Italy Index Fund (EWI) PowerShares DB Silver Fund (DBS)iShares MSCI Japan Index Fund (EWJ) ProShares UltraShort DJ-AIG Crude Oil (SCO)iShares MSCI Malaysia Index Fund (EWM) SPDR Gold Trust (GLD)iShares MSCI Mexico Index Fund (EWW) Teucrium Corn Fund (CORN)iShares MSCI Pacific ex-Japan Index Fund (EPP) Teucrium Crude Oil Fund (CRUD)iShares MSCI Singapore Index Fund (EWS) United States 12 Month Oil Fund LP (USL)iShares MSCI South Africa Index Fund (EZA) United States Brent Oil Fund (BNO)iShares MSCI South Korea Index Fund (EWY) United States Gasoline Fund (UGA)iShares MSCI Spain Index (EWP) United States Natural Gas Fund LP (UNG)iShares MSCI Switzerland Index Fund (EWL) United States Oil Fund LP (USO)iShares MSCI Taiwan Index Fund (EWT) WisdomTree Dreyfus Commodity Currency Fund (CCX)iShares S&P Europe 350 Index Fund (IEV)iShares S&P Latin America 40 Index (ILF)Market Vectors Brazil Small Cap ETF (BRF)Market Vectors Russia ETF Trust (RSX)PowerShares DWA Emerging Markets Technical Leaders (PIE) LEVERAGED & INVERSEPowerShares Golden Dragon Halter USX China Portfolio (PGJ) Credit Suisse 130/30 ProShares (CSM)PowerShares India Portfolio (PIN) Direxion Daily 10-Year Treasury Bear 3X (TYO)Schwab Emerging Markets Equity ETF (SCHE) Direxion Daily 10-Year Treasury Bull 3X (TYD)Schwab International Equity ETF (SCHF) Direxion Daily 30-Year Treasury Bear 3X (TMV)SPDR S&P China ETF (GXC) Direxion Daily 30-Year Treasury Bull 3X (TMF)SPDR S&P Emerging Europe ETF (GUR) Direxion Daily Gold Miners Bear 2x Shares (DUST)Vanguard Emerging Markets ETF (VWO) Direxion Daily Gold Miners Bull 2x Shares (NUGT)Wisdom Tree Emerging Markets Equity Income Fund (DEM) Direxion Daily Latin America Bear 3X Shares (LHB)WisdomTree Emerging Markets Local Debt Fund (ELD) Direxion Daily Latin America Bull 3X Shares (LBJ)WisdomTree Emerging Markets SmallCap Dividend Fund (DGS) Direxion Daily Real Estate Bear 3x Shares (DRV)WisdomTree India Earnings Fund (EPI) Direxion Daily Real Estate Bull 3x Shares (DRN)
Direxion Daily Russia Bull 3X Shares (RUSL)Direxion Daily Russia Bear 3X Shares (RUSS)
COMMODITY POOLS Direxion Daily Technology Bear 3X Shares (TYP)CurrencyShares Canadian Dollar Trust (FXC) Direxion Daily Technology Bull 3X Shares (TYH)CurrencyShares Swiss Franc Trust (FXF) Direxionshares Daily Developed Markets Bull 3X Shares (DZK)Direxion Daily China 3X Bear Shares (CZI) Direxionshares Developed Markets Bear 3X Shares (DPK)Direxion Daily China 3X Bear Shares (YANG) Direxionshares Emerging Markets Bear 3X Shares (EDZ)Direxion Daily China 3X Bull Shares (CZM) Direxionshares Emerging Markets Bull 3X Shares (EDC)Direxion Daily China 3X Bull Shares (YINN) Direxionshares Energy Bear 3X Shares (ERY)E-TRACS UBS Long Platinum ETN (PTM) Direxionshares Energy Bull 3X Shares (ERX)ELEMENTS Linked to the MLCX Grains Index (GRU) Direxionshares Financial Bear 3X Shares (FAZ)ELEMENTS Rogers Agri Total Return ETN (RJA) Direxionshares Financial Bull 3X Shares (FAS)ELEMENTS Rogers Energy Total Return ETN (RJN) Direxionshares Large Cap Bear 3X Shares (BGZ)ELEMENTS Rogers Total Return ETN (RJI) Direxionshares Large Cap Bull 3X Shares (BGU)Global X Uranium ETF (URA) Direxionshares Mid Cap Bear 3X Shares (MWN)Gold Trust ETFS (SGOL) Direxionshares Mid Cap Bull 3X Shares (MWJ)
CBOE HOLDINGS, INC. Page 86 2011 MARKET STATISTICS

EXCHANGE TRADED FUNDS - 2011 cont'd.
LEVERAGED & INVERSE cont'd. CURRENCYDirexionshares Small Cap Bear 3X Shares (TZA) CurrencyShares Australian Dollar Trust (FXA)Direxionshares Small Cap Bull 3X Shares (TNA) CurrencyShares British Pound Sterling Trust (FXB)ProShares UltraShort MSCI Japan (EWV) CurrencyShares Euro Trust (FXE)Rydex 2x S&P 500 ETF (RSU) CurrencyShares Japanese Yen Trust (FXY)Rydex Inverse 2x S&P 500 ETF (RSW) PowerShares DB G10 Currency Harvest Fund (DBV)Short 20+ Year Treasury ProShares (TBF) PowerShares US Dollar IDX Bearish Fund (UDN)Short Dow30 ProShares (DOG) PowerShares US Dollar IDX Bullish Fund (UUP)Short QQQ ProShares (PSQ) WisdomTree Dreyfus China Yuan Fund (CYB)Short Russell2000 ProShares (RWM) WisdomTree Dreyfus Emerging Currency Fund (CEW)Short S&P500 ProShares (SH)The Active Bear (HDGE)Ultra 20+ Year Treasury ProShares (UBT)Ultra Basic Materials ProShares (UYM) FIXED INCOMEUltra Dow30 ProShares (DDM) iShares Barclays 3-7 Year Treasury Bond Fund (IEI)Ultra DJ-UBS Crude Oil ProShares (UCO) iShares iBoxx $ High Yield Corporate Bond Fund (HYG)Ultra Financials ProShares (UYG) iShares GS InvesTop Corporate Bond Fund (LQD)Ultra FTSE China 25 ProShares (XPP) iShares JPMorgan USD Emerging Markets Bond Fund (EMB)Ultra Gold ProShares (UGL) iShares Lehman 1-3 Year Treasury Bond Fund (SHY)Ultra Industrials ProShares (UXI) iShares Lehman 7-10 Year Treasury Bond Fund (IEF)Ultra MSCI Emerging Markets ProShares (EET) iShares Lehman 20+Year Treasury Bond Fund (TLT)Ultra Oil & Gas ProShares (DIG) iShares Lehman US Treasury Inflation Protected Securities Fund (TIP)Ultra QQQ ProShares (QLD) iShares S&P National Municipal Bond Fund (MUB)Ultra Real Estate ProShares (URE) iShares S&P U.S. Preferred Stock Index Fund (PFF)Ultra Russell2000 ProShares (UWM) PowerShares CEF Income Composite Portfolio (PCEF)Ultra S&P500 ProShares (SSO) PowerShares Emerging Markets Sovereign Debt Portfolio (PCY)Ultra Semiconductor (USD) PowerShares Financial Preferred Portfolio (PGF)Ultra Silver ProShares (AGQ) PowerShares Fundamental High Yield Corporate Bond Portfolio (PHB)Ultra SmallCap600 ProShares (SAA) PowerShares Preferred Portfolio (PGX)Ultra Technology ProShares (ROM) ProShares Short High Yield (SJB)UltraPro QQQ ProShares (TQQQ) Schwab Intermediate-Term U.S. Treasury ETF (SCHR)UltraPro S&P 500 ProShares (UPRO) Schwab Short-Term U.S. Treasury ETF (SCHO)UltraPro Short QQQ ProShares (SQQQ) Schwab U.S. TIPs ETF (SCHP)UltraPro Short S&P 500 ProShares (SPXU) SPDR Barclays Capital International Treasury Bond ETF (BWX)UltraShort Basic Materials ProShares (SMN) SPDR Lehman High Yield Bond ETF (JNK)UltraShort Dow30 ProShares (DXD) WisdomTree Asia Local Debt Fund (ALD)UltraShort Euro ProShares (EUO)UltraShort Financials ProShares (SKF)UltraShort FTSE/Xinhua China 25 ProShares (FXP)UltraShort Gold ProShares (GLL)UltraShort Industrials ProShares (SIJ)UltraShort Lehman 20+Year Treasury ProShares (TBT)UltraShort Lehman 7-10 Treasury ProShares (PST)UltraShort MidCap400 ProShares (MZZ)UltraShort MSCI Brazil ProShares (BZQ)UltraShort MSCI EAFE ProShares (EFU)UltraShort MSCI Emerging Markets ProShares (EEV)UltraShort MSCI Europe ProShares (EPV)UltraShort Oil & Gas ProShares (DUG)UltraShort QQQ ProShares (QID)UltraShort Real Estate ProShares (SRS)UltraShort Russell2000 ProShares (TWM)UltraShort S&P500 ProShares (SDS)UltraShort Semiconductors ProShares (SSG)UltraShort Silver ProShares (ZSL)UltraShort Technology ProShares (REW)UltraShort Yen ProShares (YCS)United States Short Oil Fund LP (DNO)
CBOE HOLDINGS, INC. Page 87 2011 MARKET STATISTICS

MOST ACTIVE EXCHANGE TRADED FUNDS - 2011
SPDR® S&P® 500 ETF (Ticker: SPY)
The SPDR S&P 500 ETF represents ownership in the SPDR Trust Series 1, a unit investment trust established to accumulate and hold a portfolio of the equity securities that comprise the Standard & Poor's 500 Composite Stock Price Index. SPDRs seek investment results that, before expenses, generally correspond to the price and yield performance of the Standard & Poor's 500 Composite Stock Price Index. The S&P 500® Index is composed of 500 selected stocks, all of which are listed on the NYSE, AMEX or NASDAQ, and spans over 24 separate industry groups.
iShares Russell 2000 Index Fund (Ticker: IWM)
The iShares Russell 2000 Index Fund seeks investment results that correspond generally to the price and yield performance, before fees and expenses, of the small capitalization sector of the U.S. equity market as represented by the Russell 2000 Index. The index represents the approximately 2,000 smallest companies in the Russell 3000 Index.
DIAMONDS (Ticker: DIA)
DIAMONDS represent ownership in the DIAMONDS, Trust Series 1, a unit investment trust established to accumulate and hold a portfolio of the equity securities that comprise the Dow Jones Industrial Average. DIAMONDS seek investment results that, before expenses, generally correspond to the price and yield performance of the DJIA. The Dow Jones Industrial Average is the oldest continuous barometer of the U.S. stock market, and the most widely quoted indicator of U.S. stock market activity. The 30 stocks now comprising the DJIA are all leaders in their respective industries, and their stocks are widely held by individuals and institutional investors.
PowerShares QQQ™ (Ticker: QQQ)
PowerShares QQQ™, formerly known as "QQQ" or the "NASDAQ- 100 Index Tracking Stock®", is based on the Nasdaq-100 Index®. The Index includes 100 of the largest domestic and international non-financial companies listed on the Nasdaq Stock Market based on market capitalization. The portfolio is rebalanced quarterly and reconstituted annually.
CBOE HOLDINGS, INC. Page 88 2011 MARKET STATISTICS

CBOE EXCHANGE TRADED FUNDS OPTIONS - 2011
Total CBOE Exchange Traded Funds Contract Volume
Trading Average DailyMonth Days Call Put Total Volume
Jan 20 8,297,711 13,906,069 22,203,780 1,110,189Feb 19 8,704,041 13,326,365 22,030,406 1,159,495Mar 23 11,690,386 17,159,689 28,850,075 1,254,351Apr 20 9,506,087 14,598,001 24,104,088 1,205,204May 21 9,964,238 14,156,518 24,120,756 1,148,607Jun 22 11,051,177 17,693,421 28,744,598 1,306,573Jul 20 9,669,370 14,695,563 24,364,933 1,218,247Aug 23 17,827,112 30,964,414 48,791,526 2,121,371Sep 21 13,255,014 21,186,254 34,441,268 1,640,060Oct 21 12,289,356 19,263,201 31,552,557 1,502,503Nov 21 9,518,015 15,435,043 24,953,058 1,188,241Dec 21 9,048,284 11,875,049 20,923,333 996,349Total 252 130,820,791 204,259,587 335,080,378 1,329,684
CBOE Exchange Traded Funds Open Interest and Dollar Volume
Month Call Put Total Call Put TotalJan 22,619,365 36,316,804 58,936,169 $1,429,852,496 $1,684,957,840 $3,114,810,336Feb 27,080,978 40,632,430 67,713,408 $1,640,820,187 $1,635,162,023 $3,275,982,210Mar 29,395,765 42,695,455 72,091,220 $1,848,857,491 $2,496,169,931 $4,345,027,422Apr 29,908,859 44,209,679 74,118,538 $1,799,722,335 $1,894,809,389 $3,694,531,724May 31,327,283 46,916,801 78,244,084 $1,508,282,727 $2,004,339,109 $3,512,621,836Jun 32,454,524 47,478,383 79,932,907 $1,518,047,936 $2,561,634,204 $4,079,682,140Jul 32,607,831 48,690,380 81,298,211 $1,519,842,012 $1,970,670,280 $3,490,512,292Aug 40,753,869 57,594,263 98,348,132 $3,843,644,052 $8,252,304,265 $12,095,948,317Sep 39,541,959 54,569,923 94,111,882 $2,685,279,323 $4,653,496,887 $7,338,776,210Oct 37,803,392 49,410,428 87,213,820 $2,548,884,011 $3,730,376,370 $6,279,260,381Nov 37,686,391 51,147,156 88,833,547 $1,809,528,332 $2,783,904,907 $4,593,433,239Dec 32,617,477 41,091,831 73,709,308 $1,642,911,513 $1,953,123,415 $3,596,034,928Total -- -- -- $23,795,672,415 $35,620,948,620 $59,416,621,035
Contract Volume
Open Interest in Contracts Dollar Volume
CBOE HOLDINGS, INC. Page 89 2011 MARKET STATISTICS
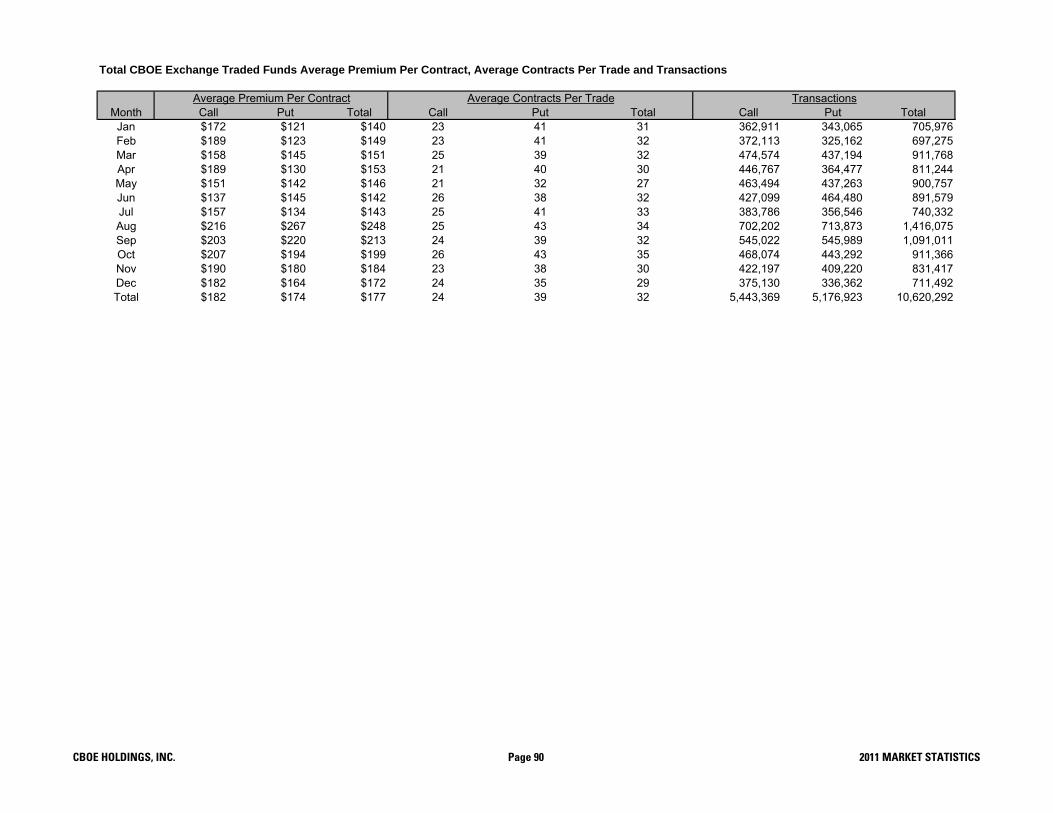
Total CBOE Exchange Traded Funds Average Premium Per Contract, Average Contracts Per Trade and Transactions
Month Call Put Total Call Put Total Call Put TotalJan $172 $121 $140 23 41 31 362,911 343,065 705,976Feb $189 $123 $149 23 41 32 372,113 325,162 697,275Mar $158 $145 $151 25 39 32 474,574 437,194 911,768Apr $189 $130 $153 21 40 30 446,767 364,477 811,244May $151 $142 $146 21 32 27 463,494 437,263 900,757Jun $137 $145 $142 26 38 32 427,099 464,480 891,579Jul $157 $134 $143 25 41 33 383,786 356,546 740,332Aug $216 $267 $248 25 43 34 702,202 713,873 1,416,075Sep $203 $220 $213 24 39 32 545,022 545,989 1,091,011Oct $207 $194 $199 26 43 35 468,074 443,292 911,366Nov $190 $180 $184 23 38 30 422,197 409,220 831,417Dec $182 $164 $172 24 35 29 375,130 336,362 711,492Total $182 $174 $177 24 39 32 5,443,369 5,176,923 10,620,292
TransactionsAverage Premium Per Contract Average Contracts Per Trade
CBOE HOLDINGS, INC. Page 90 2011 MARKET STATISTICS

Total CBOE Exchange Traded Funds FLEX Contract Volume *
Trading Average DailyMonth Days Call Put Total Volume
Jan 20 1,364 3,488 4,852 243Feb 19 139 615 754 40Mar 23 362 17,609 17,971 781Apr 20 0 78,543 78,543 3,927May 21 685 0 685 33Jun 22 5,271 3,514 8,785 399Jul 20 1,255 6,250 7,505 375Aug 23 0 7,858 7,858 342Sep 21 0 0 0 0Oct 21 2,875 439,116 441,991 21,047Nov 21 2,325 0 2,325 111Dec 21 6,744 434,370 441,114 21,005Total 252 21,020 991,363 1,012,383 4,017
Total CBOE Exchange Traded Funds FLEX Open Interest and Dollar Volume
Month Call Put Total Call Put TotalJan 70,098 45,084 115,182 $986,430 $465,630 $1,452,060Feb 72,056 51,915 123,971 $210,880 $158,260 $369,140Mar 60,381 67,824 128,205 $164,008 $2,700,345 $2,864,353Apr 75,090 198,064 273,154 $0 $21,058,939 $21,058,939May 81,860 156,331 238,191 $746,650 $0 $746,650Jun 92,894 162,246 255,140 $3,619,420 $3,002,713 $6,622,133Jul 95,292 212,624 307,916 $912,270 $95,000 $1,007,270Aug 98,746 220,599 319,345 $0 $2,533,717 $2,533,717Sep 93,748 220,742 314,490 $0 $0 $0Oct 101,848 375,482 477,330 $37,375 $134,767,560 $134,804,935Nov 103,176 378,072 481,248 $18,600 $0 $18,600Dec 96,240 661,039 757,279 $578,997 $21,284,130 $21,863,127Total -- -- -- $7,274,630 $186,066,294 $193,340,924
Open Interest in Contracts Dollar Volume
Contract Volume
CBOE HOLDINGS, INC. Page 91 2011 MARKET STATISTICS
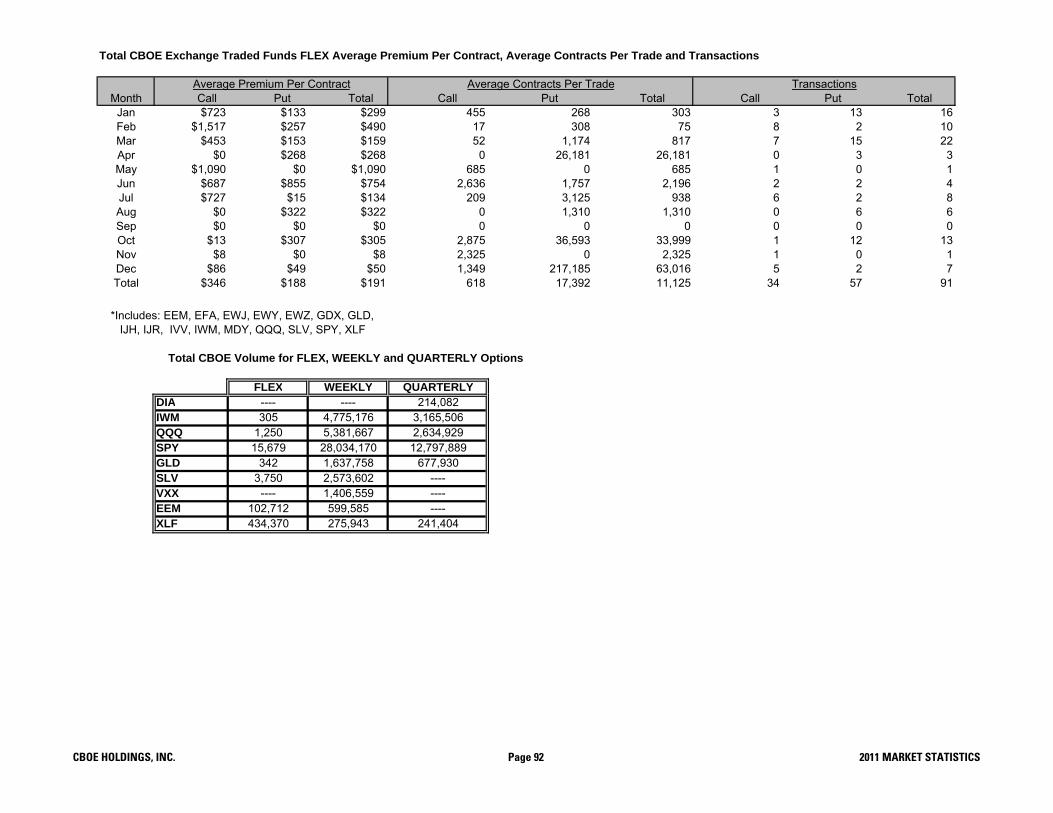
Total CBOE Exchange Traded Funds FLEX Average Premium Per Contract, Average Contracts Per Trade and Transactions
Month Call Put Total Call Put Total Call Put TotalJan $723 $133 $299 455 268 303 3 13 16Feb $1,517 $257 $490 17 308 75 8 2 10Mar $453 $153 $159 52 1,174 817 7 15 22Apr $0 $268 $268 0 26,181 26,181 0 3 3May $1,090 $0 $1,090 685 0 685 1 0 1Jun $687 $855 $754 2,636 1,757 2,196 2 2 4Jul $727 $15 $134 209 3,125 938 6 2 8Aug $0 $322 $322 0 1,310 1,310 0 6 6Sep $0 $0 $0 0 0 0 0 0 0Oct $13 $307 $305 2,875 36,593 33,999 1 12 13Nov $8 $0 $8 2,325 0 2,325 1 0 1Dec $86 $49 $50 1,349 217,185 63,016 5 2 7Total $346 $188 $191 618 17,392 11,125 34 57 91
FLEX WEEKLY QUARTERLYDIA ---- ---- 214,082IWM 305 4,775,176 3,165,506QQQ 1,250 5,381,667 2,634,929SPY 15,679 28,034,170 12,797,889GLD 342 1,637,758 677,930SLV 3,750 2,573,602 ----VXX ---- 1,406,559 ----EEM 102,712 599,585 ----XLF 434,370 275,943 241,404
Average Premium Per Contract Average Contracts Per Trade Transactions
Total CBOE Volume for FLEX, WEEKLY and QUARTERLY Options
*Includes: EEM, EFA, EWJ, EWY, EWZ, GDX, GLD, IJH, IJR, IVV, IWM, MDY, QQQ, SLV, SPY, XLF
CBOE HOLDINGS, INC. Page 92 2011 MARKET STATISTICS

QQQ (PowerShares QQQ) Contract Volume (includes LEAPS)
Trading Average DailyMonth Days Call Put Total Volume
Jan 20 754,531 1,593,267 2,347,798 117,390Feb 19 594,270 1,216,806 1,811,076 95,320Mar 23 1,190,699 1,971,739 3,162,438 137,497Apr 20 800,698 1,286,134 2,086,832 104,342May 21 710,377 982,414 1,692,791 80,609Jun 22 975,488 1,548,098 2,523,586 114,708Jul 20 796,039 1,567,324 2,363,363 118,168Aug 23 1,639,943 3,136,156 4,776,099 207,656Sep 21 1,326,852 2,254,124 3,580,976 170,523Oct 21 1,279,113 1,739,350 3,018,463 143,736Nov 21 854,689 1,160,897 2,015,586 95,980Dec 21 941,510 1,117,030 2,058,540 98,026Total 252 11,864,209 19,573,339 31,437,548 124,752
QQQ (PowerShares QQQ) Open Interest and Dollar Volume (includes LEAPS)
Month Call Put Total Call Put TotalJan 1,423,951 2,806,024 4,229,975 $115,558,705 $112,724,984 $228,283,689Feb 1,404,124 2,747,119 4,151,243 $76,484,255 $85,476,087 $161,960,342Mar 1,751,292 3,202,670 4,953,962 $133,404,006 $182,651,353 $316,055,359Apr 1,651,045 2,549,998 4,201,043 $95,321,905 $98,444,117 $193,766,022May 1,506,526 2,694,765 4,201,291 $72,115,512 $80,146,801 $152,262,313Jun 1,898,540 2,754,818 4,653,358 $101,469,002 $139,451,367 $240,920,369Jul 1,681,858 2,781,184 4,463,042 $115,548,138 $143,522,163 $259,070,301Aug 2,421,099 3,373,337 5,794,436 $220,443,835 $424,902,660 $645,346,495Sep 2,287,213 3,744,308 6,031,521 $233,684,868 $309,593,384 $543,278,252Oct 1,927,306 2,741,162 4,668,468 $248,753,262 $243,995,487 $492,748,749Nov 1,993,897 2,860,968 4,854,865 $117,856,251 $117,625,394 $235,481,645Dec 1,607,500 2,136,421 3,743,921 $78,046,796 $89,828,576 $167,875,372Total -- -- -- $1,608,686,535 $2,028,362,373 $3,637,048,908
Contract Volume
Dollar VolumeOpen Interest in Contracts
CBOE HOLDINGS, INC. Page 93 2011 MARKET STATISTICS
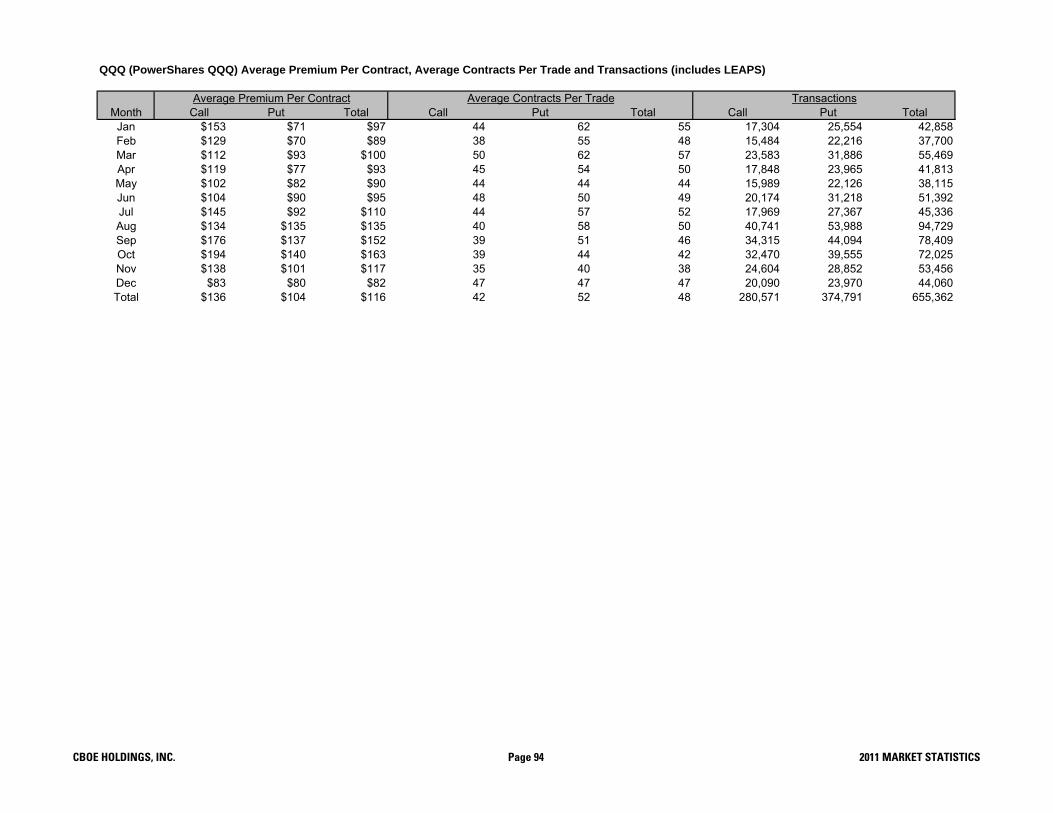
QQQ (PowerShares QQQ) Average Premium Per Contract, Average Contracts Per Trade and Transactions (includes LEAPS)
Month Call Put Total Call Put Total Call Put TotalJan $153 $71 $97 44 62 55 17,304 25,554 42,858Feb $129 $70 $89 38 55 48 15,484 22,216 37,700Mar $112 $93 $100 50 62 57 23,583 31,886 55,469Apr $119 $77 $93 45 54 50 17,848 23,965 41,813May $102 $82 $90 44 44 44 15,989 22,126 38,115Jun $104 $90 $95 48 50 49 20,174 31,218 51,392Jul $145 $92 $110 44 57 52 17,969 27,367 45,336Aug $134 $135 $135 40 58 50 40,741 53,988 94,729Sep $176 $137 $152 39 51 46 34,315 44,094 78,409Oct $194 $140 $163 39 44 42 32,470 39,555 72,025Nov $138 $101 $117 35 40 38 24,604 28,852 53,456Dec $83 $80 $82 47 47 47 20,090 23,970 44,060Total $136 $104 $116 42 52 48 280,571 374,791 655,362
Average Premium Per Contract Average Contracts Per Trade Transactions
CBOE HOLDINGS, INC. Page 94 2011 MARKET STATISTICS

DIA (DIAMONDS) Contract Volume (includes LEAPS)
Trading Average DailyMonth Days Call Put Total Volume
Jan 20 59,071 82,914 141,985 7,099Feb 19 73,845 83,428 157,273 8,278Mar 23 91,639 123,067 214,706 9,335Apr 20 63,173 82,978 146,151 7,308May 21 69,189 88,056 157,245 7,488Jun 22 78,716 108,605 187,321 8,515Jul 20 65,729 79,335 145,064 7,253Aug 23 130,097 112,637 242,734 10,554Sep 21 70,062 83,908 153,970 7,332Oct 21 68,672 83,528 152,200 7,248Nov 21 98,640 82,646 181,286 8,633Dec 21 88,695 101,072 189,767 9,037Total 252 957,528 1,112,174 2,069,702 8,213
DIA (DIAMONDS) Open Interest and Dollar Volume (includes LEAPS)
Month Call Put Total Call Put TotalJan 306,687 392,844 699,531 $14,655,541 $13,158,841 $27,814,382Feb 306,956 401,385 708,341 $19,361,086 $11,615,628 $30,976,714Mar 316,775 346,967 663,742 $21,467,226 $20,920,990 $42,388,216Apr 346,769 351,110 697,879 $13,626,599 $11,369,314 $24,995,913May 328,314 356,933 685,247 $15,193,719 $13,823,195 $29,016,914Jun 308,786 342,374 651,160 $14,118,717 $19,695,332 $33,814,049Jul 329,056 348,343 677,399 $17,892,907 $16,099,656 $33,992,563Aug 397,229 423,990 821,219 $34,980,168 $36,105,121 $71,085,289Sep 360,360 411,389 771,749 $19,189,487 $23,281,016 $42,470,503Oct 308,803 374,716 683,519 $20,665,404 $23,597,565 $44,262,969Nov 353,162 423,359 776,521 $26,152,363 $30,531,242 $56,683,605Dec 323,605 440,922 764,527 $24,232,742 $23,127,218 $47,359,960Total -- -- -- $241,535,959 $243,325,118 $484,861,077
Dollar VolumeOpen Interest in Contracts
Contract Volume
CBOE HOLDINGS, INC. Page 95 2011 MARKET STATISTICS

DIA (DIAMONDS) Average Premium Per Contract, Average Contracts Per Trade and Transactions (includes LEAPS)
Month Call Put Total Call Put Total Call Put TotalJan $248 $159 $196 20 18 19 2,953 4,656 7,609Feb $262 $139 $197 21 18 19 3,518 4,568 8,086Mar $234 $170 $197 17 18 17 5,415 7,008 12,423Apr $216 $137 $171 20 22 21 3,230 3,791 7,021May $220 $157 $185 18 18 18 3,782 4,971 8,753Jun $179 $181 $181 18 19 19 4,384 5,731 10,115Jul $272 $203 $234 16 16 16 4,025 4,916 8,941Aug $269 $321 $293 16 14 15 8,239 8,018 16,257Sep $274 $277 $276 14 12 13 5,017 7,087 12,104Oct $301 $283 $291 14 13 13 4,945 6,424 11,369Nov $265 $369 $313 18 14 16 5,551 5,997 11,548Dec $273 $229 $250 20 22 21 4,421 4,645 9,066Total $252 $219 $234 17 16 17 55,480 67,812 123,292
Average Premium Per Contract Average Contracts Per Trade Transactions
CBOE HOLDINGS, INC. Page 96 2011 MARKET STATISTICS
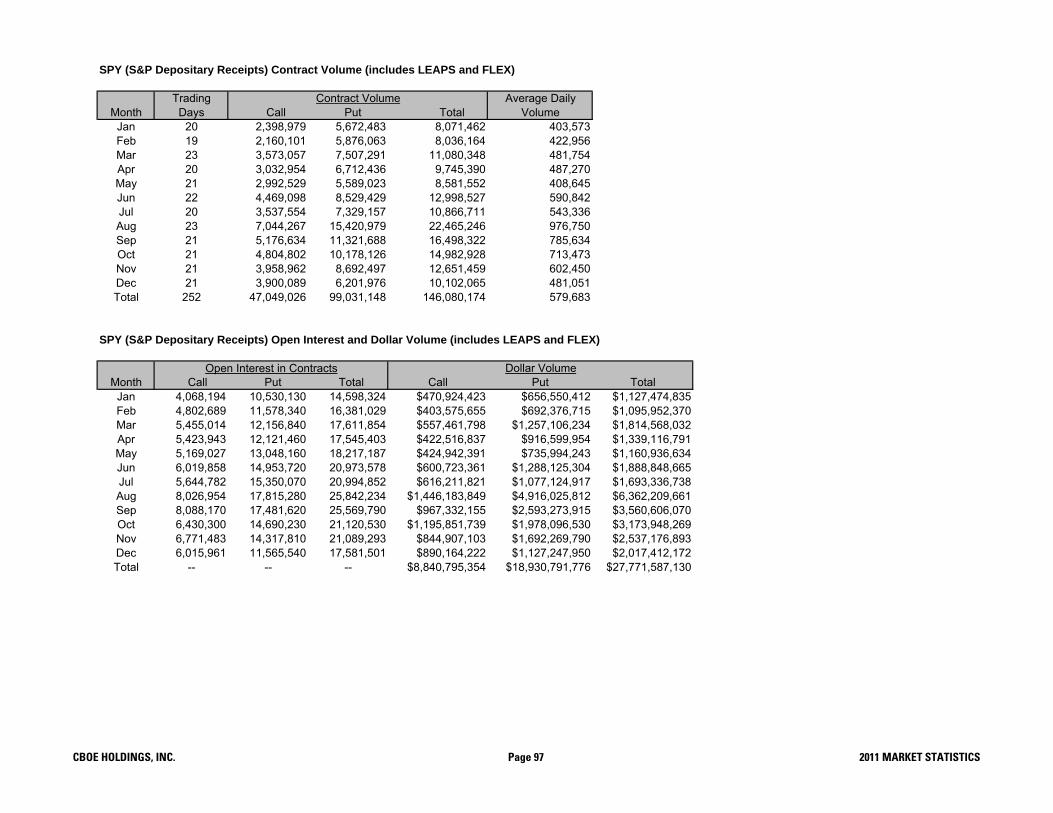
SPY (S&P Depositary Receipts) Contract Volume (includes LEAPS and FLEX)
Trading Average DailyMonth Days Call Put Total Volume
Jan 20 2,398,979 5,672,483 8,071,462 403,573Feb 19 2,160,101 5,876,063 8,036,164 422,956Mar 23 3,573,057 7,507,291 11,080,348 481,754Apr 20 3,032,954 6,712,436 9,745,390 487,270May 21 2,992,529 5,589,023 8,581,552 408,645Jun 22 4,469,098 8,529,429 12,998,527 590,842Jul 20 3,537,554 7,329,157 10,866,711 543,336Aug 23 7,044,267 15,420,979 22,465,246 976,750Sep 21 5,176,634 11,321,688 16,498,322 785,634Oct 21 4,804,802 10,178,126 14,982,928 713,473Nov 21 3,958,962 8,692,497 12,651,459 602,450Dec 21 3,900,089 6,201,976 10,102,065 481,051Total 252 47,049,026 99,031,148 146,080,174 579,683
SPY (S&P Depositary Receipts) Open Interest and Dollar Volume (includes LEAPS and FLEX)
Month Call Put Total Call Put TotalJan 4,068,194 10,530,130 14,598,324 $470,924,423 $656,550,412 $1,127,474,835Feb 4,802,689 11,578,340 16,381,029 $403,575,655 $692,376,715 $1,095,952,370Mar 5,455,014 12,156,840 17,611,854 $557,461,798 $1,257,106,234 $1,814,568,032Apr 5,423,943 12,121,460 17,545,403 $422,516,837 $916,599,954 $1,339,116,791May 5,169,027 13,048,160 18,217,187 $424,942,391 $735,994,243 $1,160,936,634Jun 6,019,858 14,953,720 20,973,578 $600,723,361 $1,288,125,304 $1,888,848,665Jul 5,644,782 15,350,070 20,994,852 $616,211,821 $1,077,124,917 $1,693,336,738Aug 8,026,954 17,815,280 25,842,234 $1,446,183,849 $4,916,025,812 $6,362,209,661Sep 8,088,170 17,481,620 25,569,790 $967,332,155 $2,593,273,915 $3,560,606,070Oct 6,430,300 14,690,230 21,120,530 $1,195,851,739 $1,978,096,530 $3,173,948,269Nov 6,771,483 14,317,810 21,089,293 $844,907,103 $1,692,269,790 $2,537,176,893Dec 6,015,961 11,565,540 17,581,501 $890,164,222 $1,127,247,950 $2,017,412,172Total -- -- -- $8,840,795,354 $18,930,791,776 $27,771,587,130
Open Interest in Contracts
Contract Volume
Dollar Volume
CBOE HOLDINGS, INC. Page 97 2011 MARKET STATISTICS

SPY (S&P Depositary Receipts) Average Premium Per Contract, Average Contracts Per Trade and Transactions (includes LEAPS and FLEX)
Month Call Put Total Call Put Total Call Put TotalJan $196 $116 $140 37 58 50 65,213 97,772 162,985Feb $187 $118 $136 33 55 47 65,290 106,236 171,526Mar $156 $167 $164 43 56 51 83,273 133,732 217,005Apr $139 $137 $137 41 65 55 73,677 103,003 176,680May $142 $132 $135 43 57 51 69,409 97,912 167,321Jun $134 $151 $145 43 57 51 104,515 148,626 253,141Jul $174 $147 $156 45 63 56 78,901 116,061 194,962Aug $205 $319 $283 48 69 61 145,962 222,548 368,510Sep $187 $229 $216 43 58 52 120,839 195,776 316,615Oct $249 $194 $212 47 67 59 102,391 153,052 255,443Nov $213 $195 $201 39 58 51 100,526 149,158 249,684Dec $228 $182 $200 44 59 52 88,733 105,120 193,853Total $188 $191 $190 43 61 54 1,098,729 1,628,996 2,727,725
Average Premium Per Contract Average Contracts Per Trade Transactions
CBOE HOLDINGS, INC. Page 98 2011 MARKET STATISTICS

IWM (iShares Russell 2000 Index Fund) Contract Volume (includes LEAPS)
Trading Average DailyMonth Days Call Put Total Volume
Jan 20 524,037 1,489,573 2,013,610 100,681Feb 19 551,394 1,699,329 2,250,723 118,459Mar 23 730,901 2,680,802 3,411,703 148,335Apr 20 427,244 1,624,449 2,051,693 102,585May 21 531,469 1,581,989 2,113,458 100,641Jun 22 894,000 2,591,081 3,485,081 158,413Jul 20 767,503 2,164,488 2,931,991 146,600Aug 23 1,536,036 4,556,071 6,092,107 264,874Sep 21 836,471 2,420,369 3,256,840 155,088Oct 21 853,632 2,634,510 3,488,142 166,102Nov 21 475,079 1,499,373 1,974,452 94,022Dec 21 474,903 1,098,856 1,573,759 74,941Total 252 8,602,669 26,040,890 34,643,559 137,474
IWM (iShares Russell 2000 Index Fund) Open Interest and Dollar Volume (includes LEAPS)
Month Call Put Total Call Put TotalJan 1,419,417 3,439,328 4,858,745 $128,268,958 $225,107,423 $353,376,381Feb 1,625,597 4,293,418 5,919,015 $125,195,913 $278,931,879 $404,127,792Mar 1,527,053 4,498,226 6,025,279 $115,913,710 $376,957,340 $492,871,050Apr 1,432,241 4,361,235 5,793,476 $75,820,543 $216,705,255 $292,525,798May 1,565,019 4,372,520 5,937,539 $79,771,990 $217,156,369 $296,928,359Jun 1,892,072 4,805,361 6,697,433 $124,824,260 $408,222,961 $533,047,221Jul 1,864,837 5,219,331 7,084,168 $109,370,404 $296,512,953 $405,883,357Aug 2,264,952 5,557,130 7,822,082 $245,562,337 $1,267,951,784 $1,513,514,121Sep 1,853,784 4,903,182 6,756,966 $156,410,500 $562,714,610 $719,125,110Oct 1,795,715 3,733,705 5,529,420 $199,956,503 $523,576,373 $723,532,876Nov 1,368,777 3,247,509 4,616,286 $88,114,266 $255,458,403 $343,572,669Dec 1,145,866 2,623,604 3,769,470 $105,372,888 $149,854,896 $255,227,784Total -- -- -- $1,554,582,272 $4,779,150,246 $6,333,732,518
Dollar Volume
Contract Volume
Open Interest in Contracts
CBOE HOLDINGS, INC. Page 99 2011 MARKET STATISTICS

IWM (iShares Russell 2000 Index Fund) Average Premium Per Contract, Average Contracts Per Trade and Transactions (includes LEAPS and FLEX)
Month Call Put Total Call Put Total Call Put TotalJan $245 $151 $175 40 69 58 13,079 21,512 34,591Feb $227 $164 $180 40 80 64 13,778 21,319 35,097Mar $159 $141 $144 38 83 66 19,134 32,485 51,619Apr $177 $133 $143 31 83 61 13,957 19,622 33,579May $150 $137 $140 33 68 54 15,966 23,297 39,263Jun $140 $158 $153 39 54 49 23,082 47,962 71,044Jul $143 $137 $138 34 75 57 22,683 28,690 51,373Aug $160 $278 $248 36 76 59 42,713 59,781 102,494Sep $187 $232 $221 37 64 54 22,407 37,786 60,193Oct $234 $199 $207 38 79 63 22,377 33,239 55,616Nov $185 $170 $174 25 52 41 19,104 28,627 47,731Dec $222 $136 $162 29 49 41 16,115 22,470 38,585Total $181 $184 $183 35 69 56 244,395 376,790 621,185
Average Premium Per Contract Average Contracts Per Trade Transactions
CBOE HOLDINGS, INC. Page 100 2011 MARKET STATISTICS

Other CBOE Exchange Traded Funds Contract Volume
Trading Average DailyMonth Days Call Put Total Volume
Jan 20 4,561,093 5,067,832 9,628,925 481,446Feb 19 5,324,431 4,450,739 9,775,170 514,483Mar 23 6,104,090 4,876,790 10,980,880 477,430Apr 20 5,182,018 4,892,004 10,074,022 503,701May 21 5,660,674 5,915,036 11,575,710 551,224Jun 22 4,633,875 4,916,208 9,550,083 434,095Jul 20 4,502,545 3,555,259 8,057,804 402,890Aug 23 7,476,769 7,738,571 15,215,340 661,537Sep 21 5,844,995 5,106,165 10,951,160 521,484Oct 21 5,283,137 4,627,687 9,910,824 471,944Nov 21 4,130,645 3,999,630 8,130,275 387,156Dec 21 3,643,087 3,356,115 6,999,202 333,295Total 252 62,347,359 58,502,036 120,849,395 479,561
Other CBOE Exchange Traded Funds Open Interest and Dollar Volume
Month Call Put Total Call Put TotalJan 15,401,116 19,148,478 34,549,594 $700,444,869 $677,416,180 $1,377,861,049Feb 18,941,612 21,612,168 40,553,780 $1,016,203,278 $566,761,714 $1,582,964,992Mar 20,345,631 22,490,752 42,836,383 $1,020,610,751 $658,534,014 $1,679,144,765Apr 21,054,861 24,825,876 45,880,737 $1,192,436,451 $651,690,749 $1,844,127,200May 22,758,397 26,444,423 49,202,820 $916,259,115 $957,218,501 $1,873,477,616Jun 22,335,268 24,622,110 46,957,378 $676,912,596 $706,139,240 $1,383,051,836Jul 23,087,298 24,991,452 48,078,750 $660,818,742 $437,410,591 $1,098,229,333Aug 27,643,635 30,424,526 58,068,161 $1,896,473,863 $1,607,318,888 $3,503,792,751Sep 26,952,432 28,029,424 54,981,856 $1,308,662,313 $1,164,633,962 $2,473,296,275Oct 27,341,268 27,870,615 55,211,883 $883,657,103 $961,110,415 $1,844,767,518Nov 27,199,072 30,297,510 57,496,582 $732,498,349 $688,020,078 $1,420,518,427Dec 23,524,545 24,325,344 47,849,889 $545,094,865 $563,064,775 $1,108,159,640Total -- -- -- $11,550,072,295 $9,639,319,107 $21,189,391,402
Contract Volume
Open Interest in Contracts Dollar Volume
CBOE HOLDINGS, INC. Page 101 2011 MARKET STATISTICS

Other CBOE Exchange Traded Funds Average Premium Per Contract, Average Contracts Per Trade and Transactions
Month Call Put Total Call Put Total Call Put TotalJan $154 $134 $143 17 26 21 264,362 193,571 457,933Feb $191 $127 $162 19 26 22 274,043 170,823 444,866Mar $167 $135 $153 18 21 19 343,169 232,083 575,252Apr $230 $133 $183 15 23 18 338,055 214,096 552,151May $162 $162 $162 16 20 18 358,348 288,957 647,305Jun $146 $144 $145 17 21 19 274,944 230,943 505,887Jul $147 $123 $136 17 20 18 260,208 179,512 439,720Aug $254 $208 $230 16 21 18 464,547 369,538 834,085Sep $224 $228 $226 16 20 18 362,444 261,246 623,690Oct $167 $208 $186 17 22 19 305,891 211,022 516,913Nov $177 $172 $175 15 20 17 272,412 196,586 468,998Dec $150 $168 $158 15 19 16 245,771 180,157 425,928Total $185 $165 $175 17 21 19 3,764,194 2,728,534 6,492,728
SCHR, SCHV, SCHX, SCO, SDS, SDY, SGG, SGOL, SH, SHY, SIJ, SIL, SIVR, SJB, SKF, SKYY, SLV, SLX, SMH, SMN, SOXX, SPXU, SQQQ, SRS, SSG, SSO, SWH, TAN, TBF, TBT, TIP, TLT, TMF, TMV, TNA, TQQQ, TWM, TYD, TYH, TYO, TYP, TZA, UBT, UCO, UDN, UGA, UGL, UNG, UPRO, URA, URE, USD, USL, USO, UUP, UWM, UXI, UYG, UYM, VIIX, VIXM, VIXY, VNQ, VWO, VXX, VXZ, XBI, XES, XHB, XLB, XLE, XLF, XLI, XLK, XLP, XLU, XLV, XLY, XME, XOP, XPP, XRT, XSD, YANG, YAO, YCS, YINN, ZSL
Average Premium Per Contract Average Contracts Per Trade Transactions
Includes ACWI, AGQ, ALD, AMJ, AMLP, BAL, BBH, BGU, BGZ, BKF, BNO, BRF, BWX, BZQ, CCX, CEW, CORN, COW, CROP, CRUD, CSM, CYB, CZI, CZM, DBA, DBB, DBC, DBE, DBO, DBP, DBS, DBV, DDM, DEM, DGL, DGS, DIG, DJP, DNO, DOG, DPK, DRN, DRV, DUG, DUST, DVY, DXD, DZK, ECH, EDC, EDZ, EEB, EEM, EET, EEV, EFA, EFU, ELD, EMB, EPI, EPP, EPU, EPV, ERX, ERY, EUO, EWA, EWC, EWG, EWH, EWI, EWJ, EWL, EWM, EWP, EWS, EWT, EWV, EWW, EWY, EWZ, EZA, EZU, FAS, FAZ, FCG, FEX, FXA, FXB, FXC, FXE, FXF, FXI, FXP, FXY, FAZ, GCC, GDX, GDXJ, GEX, GLD, GLL, GRU, GSG, GUR, GXC, HAO, HAP, HDGE, HHH, HYG, IAH, IAT, IAU, IBB, ICF, IDU, IEF, IEI, IEO, IEV, IEZ, IGE, IHF, IJH, IJR, IJS, ILF, INP, ITB, IVV, IWC, IWN, IWO, IWP, IWR, IWV, IYF, IYH, IYM, IYR, IYT, IYY, IYZ, JJC, JNK, KBE, KCE, KIE, KOL, KRE, LBJ, LHB, LQD, MDY, MLPN, MOO, MUB, MWJ, MWN, MZZ, NUGT, OEF, OIH, OIL, PBP, PBW, PCEF, PCY, PFF, PGF, PGJ, PGX, PHB, PHO, PIE, PIN, PPH, PSQ, PST, PTM, QID, QLD, REMX, REW, RJA, RJI, RJN, RKH, ROM, RSU, RSW, RSX, RTH, RUSL, RUSS, RWL, RWM, SAA, SCHA, SCHB, SCHC, SCHE, SCHF, SCHG, SCHO, SCHP,
CBOE HOLDINGS, INC. Page 102 2011 MARKET STATISTICS

CBOE Other Exchange Traded Funds Contract Volume Detail
Month AMJ AMLP BBH FCG GDX GDXJ GEX HAP HHH IAI IAT IBB ICF IDU IEO IEZJan 230 377 538 320,455 66,293 79 3 127 108 101 5,994 1,581 184 345 2,600Feb 21,589 496 422 269,639 43,901 174 161 143 48 3,488 1,598 287 803 834Mar 12,021 335 1,379 266,940 47,200 905 451 84 127 10,636 1,172 97 843 1,769Apr 917 2,446 759 252,174 35,164 264 45 51 70 13,871 892 0 489 843May 2,744 282 1,094 650 274,102 65,915 128 124 39 136 8,212 449 0 220 771Jun 7,117 847 188 757 285,093 48,484 69 308 226 80 15,449 1,540 0 451 653Jul 4,943 609 117 335 322,655 43,392 38 144 170 76 13,607 1,710 0 298 679Aug 13,210 252 372 450 377,509 74,659 76 352 197 545 40,786 2,004 10 1,323 2,030Sep 15,166 51 241 199 407,951 82,549 43 0 221 8,285 1,216 0 65 974Oct 5,287 346 179 547 255,609 54,872 29 175 574 13,812 984 0 300 380Nov 313 246 73 238 282,106 57,338 2 346 59 4,960 749 0 206 235Dec 264 4,172 274 181 328,870 64,725 117 179 84 4,086 1,246 0 138 277Total 83,801 6,805 6,192 6,455 3,643,103 684,492 1,924 3 1,712 1,718 2,121 143,186 15,141 578 5,481 12,045
Month IGE IHF ITB IYF IYH IYM IYR IYT IYZ KBE KCE KIE KOL KRE MLPN MOOJan 906 191 1,293 250 80 260 61,628 12,663 337 34,443 118 111 2,638 23,234 32 14,745Feb 1,563 239 663 188 28 277 52,194 16,130 338 5,495 135 359 1,427 10,543 18 15,275Mar 3,221 611 3,225 534 109 1,328 59,990 9,819 274 4,563 241 487 4,658 3,231 0 13,543Apr 1,930 404 1,613 353 111 666 41,464 3,696 145 1,671 163 394 6,359 5,809 110 4,821May 2,495 223 503 247 107 241 61,042 1,580 33 2,526 54 503 4,767 2,826 32 9,145Jun 1,270 686 720 337 40 483 103,089 997 220 8,463 930 934 3,975 11,417 25 6,773Jul 1,485 292 362 188 164 378 114,158 1,001 107 1,290 526 454 1,569 10,211 10 4,874Aug 1,054 272 1,109 2,504 117 660 213,479 2,057 207 1,825 1,271 2,342 1,717 12,587 34 10,755Sep 928 607 282 275 116 148 76,802 767 151 1,754 116 600 1,685 5,833 100 6,925Oct 3,135 134 602 883 99 404 121,157 5,286 179 2,052 155 1,085 5,730 6,446 26 4,655Nov 527 273 2,596 368 82 448 42,982 4,462 72 1,087 354 1,931 1,671 16,389 0 1,828Dec 175 55 1,761 333 66 138 42,192 4,559 770 611 237 204 807 4,878 0 2,695Total 18,689 3,987 14,729 6,460 1,119 5,431 990,177 63,017 2,833 65,780 4,300 9,404 37,003 113,404 387 96,034
Month OIH PBW PHO PPH REMX RKH RTH SIL SKYY SLX SMH SOXX SWH TAN VNQ XBI Jan 123,690 49 589 4,069 7,891 2,168 5,615 3,421 1,443 72,919 788 1 2,514 2,960 1,036Feb 123,664 279 634 3,870 3,220 1,762 5,112 3,410 758 44,954 381 102 1,995 1,890 947Mar 108,432 434 261 1,193 3,217 1,949 8,380 11,128 847 59,686 997 40 3,754 2,449 1,255Apr 109,598 286 369 701 5,286 2,525 6,661 9,699 563 76,828 666 32 1,713 1,460 1,722May 125,628 57 297 758 2,011 3,542 7,072 14,540 507 85,365 360 20 431 2,319 1,725Jun 101,762 420 274 705 1,565 2,475 4,380 6,554 272 63,143 569 40 702 2,112 3,453Jul 74,784 108 196 305 1,848 1,565 4,770 6,294 23 189 46,051 287 124 504 1,735 1,824Aug 167,802 66 97 849 1,821 2,167 3,607 9,499 97 359 84,575 612 294 644 3,040 3,779Sep 101,250 8 147 627 1,511 692 1,077 7,947 103 900 0 837 74 1,226 1,156 815Oct 76,880 1 252 368 1,117 174 928 4,150 27 542 0 262 60 1,243 1,832 607Nov 46,791 5 181 249 1,150 135 1,012 1,363 218 236 0 81,779 0 219 2,396 632Dec 21,671 33 311 16 325 0 2,048 2,549 33 220 1 4,147 50 722 2,598 334Total 1,181,952 1,746 3,608 13,710 30,962 19,154 50,662 80,554 501 6,836 533,522 91,685 837 15,667 25,947 18,129
DOMESTIC SECTOR
CBOE HOLDINGS, INC. Page 103 2011 MARKET STATISTICS

Month XES XHB XLB XLE XLF XLI XLK XLP XLU XLV XLY XME XOP XRT XSDJan 554 63,944 114,520 211,870 551,040 69,526 163,871 34,725 27,737 33,780 49,066 49,510 9,684 113,255 2Feb 894 29,901 59,864 200,093 641,122 90,817 91,082 12,425 25,253 28,951 45,786 74,483 19,766 80,616 2Mar 1,465 31,387 98,392 216,814 776,692 147,217 80,490 9,836 39,078 30,765 42,526 75,249 15,631 98,539 1Apr 916 14,312 104,621 234,283 563,474 196,449 28,794 16,887 29,719 30,073 31,899 64,955 10,645 94,872May 636 14,399 112,930 409,584 622,901 129,744 69,279 22,084 35,673 39,562 20,191 53,412 25,848 60,483Jun 1,539 34,990 129,634 314,240 641,523 116,437 60,522 55,261 44,077 113,125 45,683 61,581 25,122 116,795Jul 402 12,544 57,222 211,213 677,441 136,658 81,952 29,922 21,697 71,595 47,361 42,532 33,077 59,938Aug 3,351 20,869 135,274 408,437 1,797,496 167,376 98,992 41,717 76,481 102,505 74,399 74,917 79,077 191,310Sep 859 45,975 111,832 245,090 1,009,721 144,907 47,568 23,438 41,149 57,076 56,747 51,172 58,856 158,145Oct 1,830 23,568 128,402 296,965 1,309,433 120,890 79,093 30,537 46,232 23,073 60,324 33,987 40,406 104,656Nov 1,363 20,879 88,572 251,702 1,028,541 118,199 44,919 33,047 43,510 47,943 36,957 40,275 32,840 186,417Dec 697 20,371 71,433 175,170 1,077,450 125,468 46,840 28,793 34,043 16,360 27,691 40,722 23,331 81,882Total 14,506 333,139 1,212,696 3,175,461 10,696,834 1,563,688 893,402 338,672 464,649 594,808 538,630 662,795 374,283 1,346,908 5
DOMESTIC SECTOR (Continued)
CBOE HOLDINGS, INC. Page 104 2011 MARKET STATISTICS

Month DVY IJH IJR IJS IVV IWC IWN IWO IWP IWR IWV IYY MDY OEFJan 347 1,483 872 532 2,310 838 983 6,925 20 1,938 671 83 35,429 764Feb 1,152 2,087 1,260 372 1,003 4,023 914 2,287 233 1,951 1,078 1 14,981 864Mar 1,879 2,570 1,191 1,256 8,260 4,048 771 1,985 4,117 1,154 6 40,305 1,234Apr 608 2,261 909 598 3,143 851 1,230 774 2,978 513 30,341 219May 1,089 2,445 1,696 845 945 613 1,444 8,345 3,832 997 15,269 510Jun 1,880 2,208 2,067 1,455 1,748 672 1,306 1,787 2,382 603 18,466 2,242Jul 2,763 2,514 1,493 545 892 870 758 2,386 1,492 486 12,749 374Aug 8,594 6,701 1,772 1,231 3,665 740 2,114 4,563 5,073 2,454 26,482 2,306Sep 2,103 2,585 1,197 701 1,316 655 1,907 1,771 1,455 889 11,903 2,164Oct 5,174 1,349 1,033 749 2,334 519 1,350 2,250 2,422 736 14,422 3,326Nov 6,979 1,142 1,422 1,407 1,623 423 984 2,198 1,676 215 12,496 813Dec 5,596 2,552 1,050 291 1,070 201 781 920 455 238 11,864 2,538Total 38,164 29,897 15,962 9,982 28,309 14,453 14,542 36,191 253 29,771 10,034 90 244,707 17,354
Month PBP RWL SCHA SCHB SCHC SCHG SCHV SCHX SDY VXX VXZ VIIX VIXM VIXYJan 2 484 139 52 3 10 3 14 161 933,938 8,637 38 166Feb 975 63 33 74 0 1 72 299 733,197 4,393 62 553Mar 0 146 39 74 114 20 0 713 635,715 7,486 33 1,743Apr 539 113 40 42 0 95 30 347 570,724 1,913 394 120 7,935May 0 107 24 44 1 93 68 475 520,717 2,040 2,693 56 7,344Jun 30 235 69 64 57 120 25 1,054 744,790 1,354 3,366 24 7,879Jul 30 114 202 1 74 165 70 486 623,955 1,550 3,127 208 7,996Aug 0 456 676 310 19 110 1,049 2,770 1,111,819 1,959 3,658 436 9,239Sep 13 208 111 312 40 118 245 1,074 751,287 290 728 81 1,960Oct 40 224 67 2 0 51 20 1,716 403,699 265 727 363 1,690Nov 0 160 285 25 0 30 77 2,886 328,105 177 661 53 1,310Dec 0 3 6 55 0 13 11 1,722 299,580 298 844 114 1,683Total 2 2,111 1,968 1,604 1,006 315 819 1,681 13,703 7,657,526 30,362 16,198 1,588 49,498
DOMESTIC BROAD-BASED
CBOE HOLDINGS, INC. Page 105 2011 MARKET STATISTICS

Month ACWI BKF BRF CROP DEM DGS ECH EEB EEM EFA ELD EPI EPP EPU EWA EWCJan 81 1,352 1,204 407 1,289,201 88,790 2,882 501 3,924 1,073Feb 21 843 632 752 1,056,682 111,591 3,557 485 175 5,223 1,260Mar 1,565 609 227 1,364,599 236,470 2,337 1,778 1,093 4,078 3,255Apr 1,367 562 359 715,834 189,805 1,153 1,539 10,892 8,067 2,469May 838 122 1,017 373 888,145 133,031 2,570 1,862 18,114 2,696 1,704Jun 1,264 72 1,016 219 832,538 213,806 627 2,592 44,587 2,291 5,537Jul 326 38 256 177 755,841 135,851 1,717 671 4,865 10,950 1,420Aug 1,175 69 176 552 970 1,300,775 274,605 1,787 2,440 3,081 6,360 4,846Sep 1 503 87 298 279 597 747,000 236,295 897 504 615 2,876 5,076Oct 8 961 141 475 261 212 994,980 524,421 1,680 1,041 359 5,485 5,776Nov 8 738 18 407 18 171 373 728,400 145,072 27 2,505 1,788 671 2,251 4,170Dec 88 742 0 303 20 178 69 314,111 101,372 93 1,721 285 103 4,701 1,165Total 105 102 11,674 547 1,659 38 6,737 4,735 10,988,106 2,391,109 120 23,433 15,486 84,555 58,902 37,751
Month EWG EWH EWI EWJ EWL EWM EWP EWS EWT EWW EWY EWZ EZA EZU FEZ FXIJan 2,983 11,848 765 146,485 1,024 6,056 302 13,968 21,397 10,511 270,541 502 2 5 237,305Feb 1,436 7,255 1,153 56,000 6,198 6,178 275 3,777 16,247 15,883 266,792 350 0 356,446Mar 2,963 19,972 952 574,049 1,086 4,417 301 9,551 17,432 31,375 263,073 505 21 152,225Apr 3,166 13,376 421 168,648 1,826 2,636 535 11,826 8,361 22,616 181,516 740 2 132,417May 4,681 3,888 458 43,151 684 3,407 1,937 8,477 9,619 17,696 222,745 890 0 195,797Jun 2,539 6,084 5,279 61,875 1,596 6,598 483 23,127 10,403 21,812 293,191 407 0 251,024Jul 3,313 3,874 6,785 73,849 487 4,381 644 16,483 9,439 11,911 264,675 1,031 30 172,044Aug 11,478 7,663 11,520 77,314 5,676 9,904 694 10,221 15,317 19,194 386,812 1,199 139 343,615Sep 20,757 62,095 5,686 38,389 31 2,607 12,458 830 10,127 20,030 15,205 281,646 1,020 168 176,698Oct 21,049 10,418 2,136 20,150 65 1,372 12,288 580 6,587 8,585 19,590 197,736 509 72 304,288Nov 18,843 25,737 4,867 21,877 225 508 6,595 416 20,370 17,543 10,568 129,748 517 240 267,196Dec 12,353 7,728 2,661 40,672 217 402 3,882 247 13,259 3,693 7,400 136,871 311 1,087 188,645Total 105,561 179,938 42,683 1,322,459 538 23,466 78,800 7,244 147,773 158,066 203,761 2,895,346 7,981 1,761 5 2,777,700
Month GUR GXC HAO IEV ILF INP PGJ PIE PIN RSX SCHE SCHF VWO YAOJan 174 345 1,742 342 539 1,835 57 1,030 37,522 88 10 9,879 132Feb 49 317 182 185 465 2,455 24 1,856 20,392 87 5 6,434 35Mar 166 302 37 845 908 3,907 210 643 18,197 246 72 7,828 0Apr 445 753 1,123 564 939 1,254 105 1,457 19,586 47 154 2,955 35May 335 947 209 501 1,364 1,166 528 109 32,300 90 165 5,739 36Jun 324 2,088 539 537 1,306 1,366 279 249 19,381 91 208 4,582 5Jul 130 499 91 429 590 563 70 42 15,612 51 7 3,858 0Aug 208 344 437 829 1,949 673 60 258 75,251 609 317 4,356 109Sep 133 432 120 829 1,170 235 46 52 112 22,964 718 342 17,195 103Oct 117 164 316 559 509 291 31 107 200 13,616 234 52 3,767 251Nov 67 141 23 781 180 589 6 1 62 13,485 72 323 3,796 103Dec 47 289 59 592 561 253 7 30 17 22,466 54 6 2,745 501Total 2,195 6,621 4,878 6,993 10,480 14,587 1,423 190 6,035 310,772 2,387 1,661 73,134 1,310
FOREIGN
CBOE HOLDINGS, INC. Page 106 2011 MARKET STATISTICS

Month BAL BNO CCX CRUD CZI CZM CORN COW DBA DBB DBC DBE DBO DBP DBSJan 1,209 2,760 48,033 3,853 14,103 750 1,662 564 617Feb 2,731 7,515 54,897 1,703 8,623 1,642 6,507 584 1,132Mar 490 90 5,162 2,668 59,082 3,180 10,071 1,691 7,563 387 1,611Apr 1,486 26 3,772 1,194 58,022 6,256 9,021 1,351 4,093 1,025 3,323May 2,048 254 80 424 3,884 838 25,012 1,077 11,051 831 6,754 2,003 3,917Jun 2,187 75 132 75 315 8,730 930 31,333 1,350 11,062 2,328 1,723 464 1,230Jul 1,513 159 30 7,142 714 43,968 1,543 5,278 258 913 1,004 668Aug 538 1,236 373 5,577 184 25,877 1,209 7,643 409 5,207 450 554Sep 837 1,222 222 6,523 870 37,831 1,233 11,658 2,380 2,063 809 1,166Oct 364 883 329 2,604 846 23,482 4,209 9,692 232 1,435 268 352Nov 255 591 1,207 97 26,723 593 5,232 394 603 57 291Dec 187 671 100 926 76 18,389 500 5,413 84 804 208 82Total 9,905 4,837 100 1,456 155 739 49,467 18,692 452,649 26,706 108,847 12,350 39,327 7,823 14,943
Month DGL DJP FXC FXF GAZ GCC GLD GRU GSG IAU JJC OIL PTM RJA RJIJan 660 1,220 6,205 345 30 1,016,744 7,670 6,739 3,815 1,791 2,837 165Feb 102 1,490 6,775 305 142 854,865 1,043 3,282 3,730 6,655 6,542 449Mar 279 7,813 10,381 870 290 1,036,063 2,588 3,101 5,327 10,784 4,637 387Apr 229 1,581 14,048 776 131 1,044,580 473 7,166 1,515 2,588 2,508 373May 213 1,767 34,579 358 419 1,030,689 196 2,514 5,077 4,876 4,931 101 2,732 310Jun 271 706 29,310 243 166 938,392 196 442 3,681 2,172 2,721 56 2,599 148Jul 220 1,128 2,279 53 287 964,285 59 597 6,464 1,454 2,780 68 2,766 164Aug 878 411 26,090 2,753 400 190 2,124,152 443 2,034 45,011 1,540 5,640 409 1,875 534Sep 421 530 3,579 5,669 261 204 1,565,388 253 4,200 27,755 2,193 1,948 325 2,888 239Oct 412 757 4,143 664 131 72 870,543 51 4,432 14,658 3,803 2,817 168 432 163Nov 74 257 2,777 421 290 8 837,748 28 1,670 13,194 1,141 2,873 181 748 3Dec 424 182 2,375 3,356 39 29 970,959 53 337 8,337 760 4,806 102 727 25Total 4,183 17,842 142,541 12,863 4,071 1,968 13,254,408 1,279 28,000 144,465 32,326 50,334 1,410 31,291 2,960
Month RJN SCO SGG SGOL SIVR SLV UGA UNG URA USL USO YANG YINNJan 8 1,151 3,002 1,087 670,672 875 300,118 1,757 271 310,555Feb 38 2,398 27 1,478 1,159 1,269,676 1,966 389,639 2,312 615 580,089Mar 80 3,683 229 1,035 3,737 1,065,796 2,892 295,202 9,003 741 725,819Apr 95 3,170 128 589 10,806 2,591,168 1,592 173,544 2,551 272 363,328May 54 5,237 397 2,208 8,472 3,432,771 16,649 154,928 2,067 109 528,890Jun 21 3,679 612 606 3,872 932,292 3,375 168,550 2,444 133 403,307 79 178Jul 50 2,141 779 1,354 2,157 815,490 1,917 101,234 1,613 72 191,918 76 444Aug 31 7,313 713 3,184 4,124 1,089,562 2,009 153,643 1,939 2,032 484,836 164 181Sep 5 1,964 463 1,030 2,613 1,086,167 1,455 105,800 863 137 313,099 49 2Oct 48 2,524 343 1,003 1,101 630,433 1,159 110,616 1,249 126 306,722 94 76Nov 28 3,458 121 779 2,219 522,993 1,386 129,397 440 68 312,888 65 1Dec 110 5,020 198 1,024 1,144 582,091 500 114,852 674 25 287,259Total 568 41,738 4,010 17,292 42,491 14,689,111 35,775 2,197,523 26,912 4,601 4,808,710 527 882
COMMODITY POOLS
CBOE HOLDINGS, INC. Page 107 2011 MARKET STATISTICS

Month AGQ BGU BGZ BZQ CSM DDM DIG DNO DOG DPK DRN DRV DUG DUST DXD DZKJan 8,837 7,547 13,702 88 95 2,247 8,990 596 547 116 1,763 1,369 2,477 881 8,278 372Feb 8,838 11,410 14,770 244 42 1,058 11,968 1,160 566 130 2,084 1,321 4,201 939 7,266 437Mar 11,800 15,448 9,754 149 96 4,459 11,253 769 2,886 534 1,622 596 6,191 733 11,551 810Apr 30,768 11,261 5,921 70 94 2,463 7,537 214 1,133 239 2,258 483 3,662 576 5,883 488May 33,426 7,156 7,491 145 77 2,949 7,889 730 764 729 1,441 427 6,532 565 8,254 931Jun 11,502 7,186 13,676 200 486 3,172 8,018 341 1,541 576 3,334 777 6,197 430 10,499 497Jul 10,367 11,045 8,199 135 165 3,373 8,243 178 637 338 2,202 852 4,306 659 8,840 189Aug 14,715 16,663 24,201 1,411 338 5,126 12,836 1,006 2,722 1,392 3,413 2,914 6,720 3,869 21,821 362Sep 15,458 11,119 11,994 1,163 202 2,467 6,262 212 1,710 1,262 2,200 590 3,031 1,992 24,226 557Oct 13,909 13,634 24,073 252 100 3,259 7,451 301 1,351 338 2,149 1,438 6,238 88 23,605 1,265Nov 11,953 11,234 13,053 64 5 3,551 6,089 181 590 669 1,170 789 4,546 840 16,385 572Dec 15,470 6,503 7,250 72 49 1,909 4,362 123 1,017 365 921 209 3,053 1,878 9,407 387Total 187,043 130,206 154,084 3,993 1,749 36,033 100,898 5,811 15,464 6,688 24,557 11,765 57,154 13,450 156,015 6,867
Month EDC EDZ EET EEV EFU EPV ERX ERY EUO EWV FAS FAZ FXP GLL HDGE LBJJan 8,821 4,706 659 711 51 608 15,930 1,344 15,853 292,678 157,096 1,342 3,212Feb 10,088 8,122 381 2,575 10 231 19,963 2,340 9,566 230,060 133,773 1,697 1,674Mar 16,984 8,366 377 2,757 187 514 24,358 3,493 8,821 285,268 95,337 2,619 1,082Apr 9,832 7,335 634 325 104 423 20,829 6,130 9,176 230,665 66,925 1,545 1,497May 9,972 5,156 986 824 66 821 30,424 5,214 16,507 97 173,856 100,136 1,639 3,965 190Jun 10,044 5,946 539 1,768 55 763 26,509 4,161 18,859 90 234,523 117,733 6,197 1,060 279Jul 8,754 6,449 280 1,250 0 489 25,605 5,281 26,452 6 198,675 82,468 1,708 2,864 415Aug 16,391 20,193 478 4,846 362 599 40,225 8,737 32,256 124 389,357 174,799 6,495 23,464 662Sep 9,525 12,827 521 4,196 491 1,439 32,353 6,960 61,070 177 294,515 95,075 5,926 16,843 74 388Oct 9,432 8,288 169 1,182 255 1,516 30,329 8,296 47,521 120 391,255 112,432 7,337 7,160 293 448Nov 3,929 6,279 203 1,238 145 2,440 28,932 32,933 42,824 205,747 112,351 5,574 3,271 2,164 656Dec 2,754 5,618 68 436 256 2,408 24,555 9,621 21,979 98,751 107,451 2,370 5,593 636 1,295Total 116,526 99,285 5,295 22,108 1,982 12,251 320,012 94,510 310,884 614 3,025,350 1,355,576 44,449 71,685 3,167 4,333
Month LHB MWJ MWN MZZ NUGT PSQ PST QID QLD REW ROM RSU RSW RUSL RUSS RWMJan 604 252 66 376 338 572 38,017 28,612 13 582 102 763Feb 648 188 114 624 290 1,012 30,180 20,998 158 814 72 25 771Mar 1,013 1,001 639 346 948 1,298 33,106 30,191 586 667 64 142 1,197Apr 618 204 196 606 704 2,050 19,193 19,099 326 527 68 147 784May 125 587 332 83 708 319 768 15,789 22,621 466 601 134 94 941Jun 21 970 95 614 179 474 728 24,844 28,659 922 235 70 90 2,113Jul 40 565 262 62 1,381 774 703 20,394 15,272 919 342 159 255 1,188Aug 260 1,055 1,185 642 1,555 1,351 1,925 36,401 29,009 285 638 251 598 3,371Sep 113 329 1,068 664 2,556 1,837 1,366 20,501 13,433 1,010 283 84 602 3,289Oct 34 1,191 732 306 616 1,208 343 15,125 12,401 160 98 198 1,048 2,676Nov 16 940 180 185 983 98 93 10,490 12,515 119 274 40 2,231 44 1 1,630Dec 58 711 264 28 1,243 73 135 9,606 9,499 280 253 50 115 621 135 843Total 667 9,231 5,763 3,599 11,173 8,414 10,993 273,646 242,309 5,244 5,314 1,292 5,347 665 136 19,566
LEVERAGED & INVERSE
CBOE HOLDINGS, INC. Page 108 2011 MARKET STATISTICS

Month SAA SDS SH SIJ SKF SMN SPXU SQQQ SRS SSG SSO TBF TBT TMF TMV TNAJan 47 147,164 4,589 71 8,914 1,493 8,131 1,535 3,121 20 86,871 2,943 262,582 861 6,052 33,564Feb 196 158,149 2,440 17 4,085 957 9,912 1,801 2,291 66 70,341 2,603 420,599 987 8,431 29,689Mar 462 229,977 10,108 265 8,188 1,039 22,781 7,054 2,646 980 105,432 2,226 275,731 2,855 10,695 44,135Apr 688 121,278 4,405 231 3,219 770 7,921 4,155 913 350 68,804 1,531 272,133 1,276 7,977 32,672May 190 118,218 1,553 14 3,906 580 11,097 3,827 3,945 106 103,440 855 189,059 1,064 5,887 37,025Jun 492 163,578 6,404 191 7,192 1,309 17,635 3,742 9,503 193 124,292 3,543 206,148 1,132 4,479 51,720Jul 1,165 165,453 2,855 387 5,617 407 13,210 3,049 4,495 180 83,731 886 215,881 715 6,075 45,222Aug 804 307,195 18,342 231 17,176 1,577 54,186 8,533 12,538 1,018 143,753 2,965 449,263 2,627 21,434 110,509Sep 397 255,998 10,854 255 9,953 1,854 41,252 4,094 8,016 164 76,519 2,814 304,990 1,711 9,735 74,583Oct 167 279,611 8,458 266 13,967 1,684 63,008 6,286 7,046 47 96,339 2,744 217,831 1,534 7,980 87,111Nov 122 291,012 8,346 119 5,556 1,649 66,163 4,319 2,433 61 104,871 1,403 167,520 1,327 2,477 82,230Dec 78 196,549 3,813 273 4,984 903 29,674 2,620 1,432 111 81,659 741 164,119 698 3,385 71,634Total 4,808 2,434,182 82,167 2,320 92,757 14,222 344,970 51,015 58,379 3,296 1,146,052 25,254 3,145,856 16,787 94,607 700,094
Month TQQQ TWM TYD TYH TYO TYP TZA UBT UCO UGL UPRO URE USD UWM UXI UYGJan 1,247 5,346 280 5,481 914 355 114,839 841 64,444 2,771 1,883 1,969 864 6,208 18 22,210Feb 724 7,797 829 5,725 657 534 96,070 1,083 109,144 2,895 1,972 2,490 449 4,120 51 18,292Mar 3,397 5,712 1,068 6,834 329 1,058 86,364 656 67,217 2,788 8,863 2,492 196 9,471 18 17,839Apr 4,974 2,992 239 4,193 4,268 1,115 66,646 678 40,238 6,071 7,785 2,027 263 5,747 255 11,675May 2,059 4,128 589 2,049 1,263 641 85,034 706 31,608 5,877 5,058 2,214 140 5,214 76 10,867Jun 2,327 6,226 349 3,289 1,065 774 159,079 667 33,885 2,729 3,012 2,887 506 4,535 305 14,098Jul 1,862 4,008 302 4,078 960 1,008 119,208 1,194 29,415 3,389 3,157 1,541 250 5,484 88 9,001Aug 2,328 5,900 1,232 4,393 936 1,188 144,014 2,160 58,242 7,632 5,487 2,185 311 5,717 149 24,570Sep 1,456 4,429 970 2,873 1,002 384 97,336 1,352 47,851 4,231 2,801 1,324 330 3,033 112 12,398Oct 4,067 4,264 492 4,593 421 1,122 119,134 414 14,590 1,401 5,412 751 68 5,469 26 11,434Nov 2,072 3,772 125 4,293 71 978 95,340 423 13,315 1,117 3,674 626 114 3,133 31 8,679Dec 3,212 4,080 204 2,785 52 727 100,160 77 11,276 1,305 3,524 1,507 50 2,943 13 6,246Total 29,725 58,654 6,679 50,586 11,938 9,884 1,283,224 10,251 521,225 42,206 52,628 22,013 3,541 61,074 1,142 167,309
Month UYM XPP YCS ZSLJan 5,191 1,204 15,546Feb 4,908 803 9,293Mar 7,823 1,682 555 19,697Apr 5,496 542 8,853 42,057May 7,153 691 4,029 153,740Jun 6,136 665 1,451 35,602Jul 3,178 454 2,835 27,741Aug 8,755 638 2,435 31,833Sep 3,933 362 2,449 30,342Oct 4,347 555 2,233 19,651Nov 3,807 321 641 22,647Dec 3,289 196 514 27,275Total 64,016 8,113 25,995 435,424
LEVERAGED & INVERSE (Continued)
CBOE HOLDINGS, INC. Page 109 2011 MARKET STATISTICS
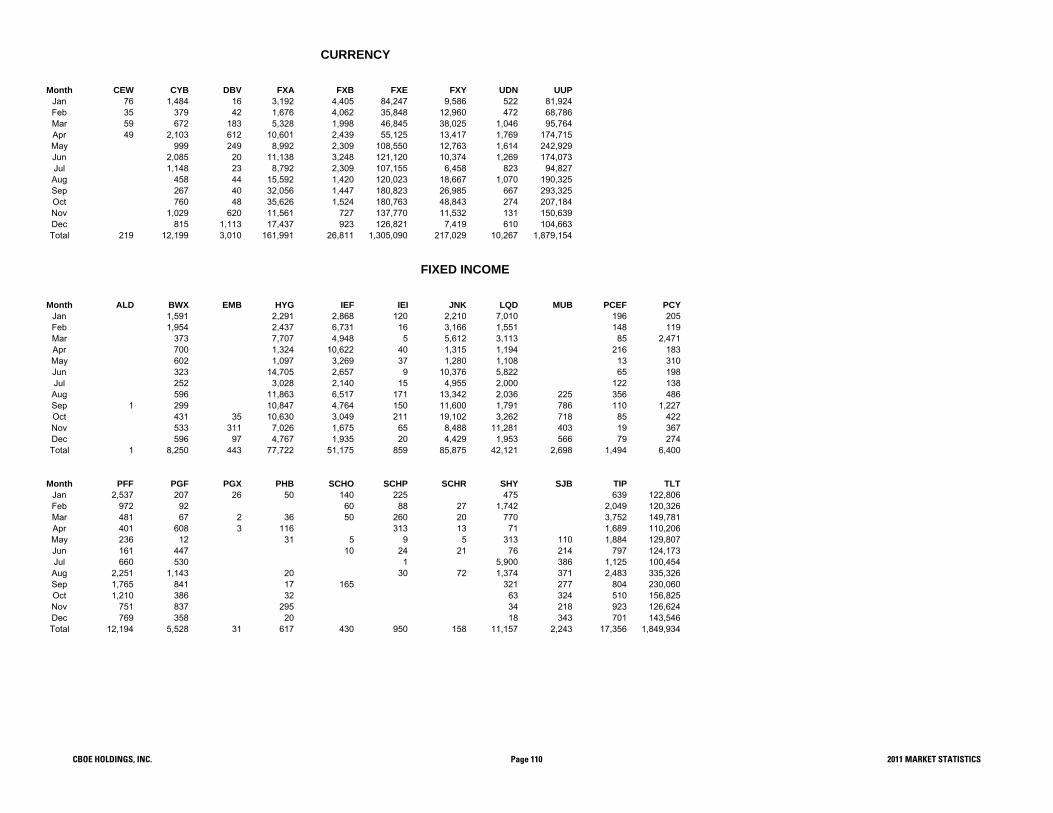
Month CEW CYB DBV FXA FXB FXE FXY UDN UUPJan 76 1,484 16 3,192 4,405 84,247 9,586 522 81,924Feb 35 379 42 1,676 4,062 35,848 12,960 472 68,786Mar 59 672 183 5,328 1,998 46,845 38,025 1,046 95,764Apr 49 2,103 612 10,601 2,439 55,125 13,417 1,769 174,715May 999 249 8,992 2,309 108,550 12,763 1,614 242,929Jun 2,085 20 11,138 3,248 121,120 10,374 1,269 174,073Jul 1,148 23 8,792 2,309 107,155 6,458 823 94,827Aug 458 44 15,592 1,420 120,023 18,667 1,070 190,325Sep 267 40 32,056 1,447 180,823 26,985 667 293,325Oct 760 48 35,626 1,524 180,763 48,843 274 207,184Nov 1,029 620 11,561 727 137,770 11,532 131 150,639Dec 815 1,113 17,437 923 126,821 7,419 610 104,663Total 219 12,199 3,010 161,991 26,811 1,305,090 217,029 10,267 1,879,154
Month ALD BWX EMB HYG IEF IEI JNK LQD MUB PCEF PCYJan 1,591 2,291 2,868 120 2,210 7,010 196 205Feb 1,954 2,437 6,731 16 3,166 1,551 148 119Mar 373 7,707 4,948 5 5,612 3,113 85 2,471Apr 700 1,324 10,622 40 1,315 1,194 216 183May 602 1,097 3,269 37 1,280 1,108 13 310Jun 323 14,705 2,657 9 10,376 5,822 65 198Jul 252 3,028 2,140 15 4,955 2,000 122 138Aug 596 11,863 6,517 171 13,342 2,036 225 356 486Sep 1 299 10,847 4,764 150 11,600 1,791 786 110 1,227Oct 431 35 10,630 3,049 211 19,102 3,262 718 85 422Nov 533 311 7,026 1,675 65 8,488 11,281 403 19 367Dec 596 97 4,767 1,935 20 4,429 1,953 566 79 274Total 1 8,250 443 77,722 51,175 859 85,875 42,121 2,698 1,494 6,400
Month PFF PGF PGX PHB SCHO SCHP SCHR SHY SJB TIP TLTJan 2,537 207 26 50 140 225 475 639 122,806Feb 972 92 60 88 27 1,742 2,049 120,326Mar 481 67 2 36 50 260 20 770 3,752 149,781Apr 401 608 3 116 313 13 71 1,689 110,206May 236 12 31 5 9 5 313 110 1,884 129,807Jun 161 447 10 24 21 76 214 797 124,173Jul 660 530 1 5,900 386 1,125 100,454Aug 2,251 1,143 20 30 72 1,374 371 2,483 335,326Sep 1,765 841 17 165 321 277 804 230,060Oct 1,210 386 32 63 324 510 156,825Nov 751 837 295 34 218 923 126,624Dec 769 358 20 18 343 701 143,546Total 12,194 5,528 31 617 430 950 158 11,157 2,243 17,356 1,849,934
FIXED INCOME
CURRENCY
CBOE HOLDINGS, INC. Page 110 2011 MARKET STATISTICS

CBOE INTEREST RATE OPTIONS - 2011
Total Interest Rate Options Contract Volume
Trading Average DailyMonth Days Call Put Total Volume
Jan 20 1 0 1 0Feb 19 8 0 8 0Mar 23Apr 20May 21Jun 22Jul 20Aug 23Sep 21Oct 21Nov 21Dec 21Total 252 9 0 9 0
Total Interest Rate Options Open Interest and Dollar Volume
Month Call Put Total Call Put TotalJan 48 1 49 $140 $0 $140Feb 40 1 41 $850 $0 $850Mar 0 0 0 $0 $0 $0AprMayJunJulAugSepOctNovDecTotal -- -- -- $990 $0 $990
In 2011, the Chicago Board Options Exchange traded options on four interest rate measures---IRX, FVX, TNX and TYX. IRX is based on 10 times the discount rate of the most recently auctioned 13-week U.S. Treasury Bill. FVX, TNX and TYX are based on 10 times the yield-to-maturity on the most recently auctioned 5-year Treasury note, 10-year Treasury note and 30-year Treasury bond, respectively.
Contract Volume
Open Interest in Contracts Dollar Volume
CBOE HOLDINGS, INC. Page 111 2011 MARKET STATISTICS

Total Interest Rate Options Average Premium Per Contract, Average Contracts Per Trade and Transactions
Month Call Put Total Call Put Total Call Put TotalJan $140 $0 $140 1 0 1 1 0 1Feb $106 $0 $106 3 0 3 3 0 3Mar $0 $0 $0 0 0 0 0 0 0AprMayJunJulAugSepOctNovDecTotal $110 $0 $110 2 0 2 4 0 4
Average Premium Per Contract Average Contracts Per Trade Transactions
CBOE HOLDINGS, INC. Page 112 2011 MARKET STATISTICS

TNX Options Contract Volume
Trading Average DailyMonth Days Call Put Total Volume
Jan 20 1 0 1 0Feb 19 8 0 8 0Mar 23 0 0 0 0Apr 20May 21Jun 22Jul 20Aug 23Sep 21Oct 21Nov 21Dec 21Total 252 9 0 9 0
TNX Options Open Interest and Dollar Volume
Month Call Put Total Call Put TotalJan 48 1 49 $140 $0 $140Feb 40 1 41 $850 $0 $850Mar 0 0 0 $0 $0 $0AprMayJunJulAugSepOctNovDecTotal
Contract Volume
Open Interest in Contracts Dollar Volume
CBOE HOLDINGS, INC. Page 113 2011 MARKET STATISTICS

TNX Options Average Premium Per Contract, Average Contracts Per Trade and Transactions
Month Call Put Total Call Put Total Call Put TotalJan $140 $0 $140 1 0 1 1 0 1Feb $106 $0 $106 3 0 3 3 0 3Mar $0 $0 $0 0 0 0 0 0 0AprMayJunJulAugSepOctNovDecTotal $110 $0 $110 2 0 2 4 0 4
TransactionsAverage Premium Per Contract Average Contracts Per Trade
CBOE HOLDINGS, INC. Page 114 2011 MARKET STATISTICS

CREDIT OPTIONS - 2011
In 2007, CBOE became the first U.S. exchange to list credit default options. These options, known as “Credit Event Binary Options” or “CEBOs,” have been designed to pay fixed cash amounts in the case of a “credit event” such as a default, bankruptcy or failure to pay on a debt obligation.
Single-Name CEBOs are options that pay a fixed amount—$1,000 per contract—in the case where a credit event on an individualissuer or guarantor of debt securities is declared prior to the option's expiration. If there is no credit event declared before expiration,the option pays nothing.
Total Single-Name CEBOs Contract Volume, Dollar Volume and Transactions
Month Days Contract Volume Dollar Volume Transactions Open InterestJan 20 0 $0 0Feb 19 0 $0 0Mar 23 0 $0 0Apr 20 0 $0 0May 21 7 $550 3 5Jun 22 10 $700 1 15Jul 20 53 $3,650 2 68Aug 23 10 $1,550 2 68Sep 21 40 $5,000 2 108Oct 21 0 $0 0 108Nov 21 2 $480 2 108Dec 21 0 $0 0 108Total 252 122 $11,930 12 ---
CBOE HOLDINGS, INC. Page 115 2011 MARKET STATISTICS

C2 TRADING ACTIVITY - 2011
Total C2 Options Trading Summary
Call Put TotalNo. of Contracts 25,140,382 27,678,234 52,818,616Average Daily Volume 99,763 109,834 209,598Dollar Volume $4,053,703,505 $3,906,027,066 $7,959,730,571Open Interest 118,413,756 103,713,612 222,127,368Transactions 1,695,881 1,431,930 3,127,811
Trading Average Daily Total Dollar Month Days Call Put Total Total Call Put Total Volume
Jan 20 1,632,880 1,487,287 3,120,167 156,008 93,309,799 83,768,639 177,078,438 $441,072,310Feb 19 1,436,547 1,390,107 2,826,654 148,771 105,338,852 93,634,912 198,973,764 $336,399,733Mar 23 2,036,729 2,089,981 4,126,710 179,422 113,689,616 101,299,745 214,989,361 $472,493,618Apr 20 1,722,738 1,768,992 3,491,730 174,587 114,375,767 103,719,652 218,095,419 $375,276,727May 21 1,849,377 2,066,046 3,915,423 186,449 114,237,223 107,215,843 221,453,066 $438,216,268Jun 22 2,094,217 2,545,492 4,639,709 210,896 116,724,743 108,744,611 225,469,354 $540,738,899Jul 20 1,896,413 2,505,895 4,402,308 220,115 118,741,410 111,111,860 229,853,270 $561,422,221Aug 23 3,301,303 3,847,332 7,148,635 310,810 129,935,827 124,033,508 253,969,335 $1,262,689,145Sep 21 2,307,310 2,493,195 4,800,505 228,595 127,226,676 121,283,979 248,510,655 $910,942,312Oct 21 2,753,593 2,874,539 5,628,132 268,006 124,842,723 113,760,023 238,602,746 $1,181,303,348Nov 21 2,179,980 2,656,066 4,836,046 230,288 125,376,666 116,499,708 241,876,374 $873,722,860Dec 21 1,929,295 1,953,302 3,882,597 184,886 118,413,756 103,713,612 222,127,368 $565,453,130Total 252 25,140,382 27,678,234 52,818,616 209,598 -- -- -- $7,959,730,571
Contract Volume Open Interest
CBOE HOLDINGS, INC. Page 116 2011 MARKET STATISTICS

Total C2 Options Average Premium Per Contract, Average Contracts Per Trade and Transactions
TradingMonth Days Call Put Total Call Put Total Call Put Total
Jan 20 $165 $115 $141 11 13 11 154,904 117,622 272,526Feb 19 $138 $100 $119 13 16 14 114,040 84,253 198,293Mar 23 $124 $106 $114 15 19 16 140,324 110,290 250,614Apr 20 $119 $97 $107 16 21 18 110,197 84,640 194,837May 21 $112 $112 $112 16 21 18 116,535 99,506 216,041Jun 22 $118 $116 $117 18 25 21 114,265 103,239 217,504Jul 20 $147 $113 $128 18 29 23 102,923 86,728 189,651Aug 23 $173 $179 $177 17 21 19 190,343 184,654 374,997Sep 21 $200 $180 $190 16 19 17 147,650 132,830 280,480Oct 21 $227 $193 $210 14 17 15 198,198 166,271 364,469Nov 21 $205 $161 $181 14 20 17 155,237 136,192 291,429Dec 21 $151 $140 $146 13 16 14 151,265 125,705 276,970Total 252 $161 $141 $151 15 19 17 1,695,881 1,431,930 3,127,811
Total C2 Options Contract Volume - All Options
MonthTradingDays
TotalVolume
EquityVolume
ETFVolume
IndexVolume
Jan 20 3,120,167 1,729,207 1,390,960Feb 19 2,826,654 1,431,521 1,395,133Mar 23 4,126,710 1,725,969 2,400,741Apr 20 3,491,730 1,502,697 1,989,033May 21 3,915,423 1,342,470 2,572,953Jun 22 4,639,709 1,233,765 3,405,944Jul 20 4,402,308 1,211,472 3,190,836Aug 23 7,148,635 2,212,628 4,936,007Sep 21 4,800,505 1,421,086 3,379,419Oct 21 5,628,132 2,110,354 3,417,496 100,282Nov 21 4,836,046 1,604,586 3,120,915 110,545Dec 21 3,882,597 1,706,134 2,071,004 105,459Total 252 52,818,616 19,231,889 33,270,441 316,286
Average Premium Per Contract Average Contracts Per Trade Transactions
CBOE HOLDINGS, INC. Page 117 2011 MARKET STATISTICS

C2 EQUITY OPTIONS - 2011
C2 Equity Options Contract Volume
Trading Average DailyMonth Days Call Put Total Volume
Jan 20 1,080,121 649,086 1,729,207 86,460Feb 19 900,438 531,083 1,431,521 75,343Mar 23 1,034,037 691,932 1,725,969 75,042Apr 20 933,699 568,998 1,502,697 75,135May 21 781,394 561,076 1,342,470 63,927Jun 22 707,820 525,945 1,233,765 56,080Jul 20 715,646 495,826 1,211,472 60,574Aug 23 1,162,890 1,049,738 2,212,628 96,201Sep 21 796,977 624,109 1,421,086 67,671Oct 21 1,200,703 909,651 2,110,354 100,493Nov 21 938,889 665,697 1,604,586 76,409Dec 21 1,010,720 695,414 1,706,134 81,244Total 252 11,263,334 7,968,555 19,231,889 76,317
C2 Equity Options Open Interest and Dollar Volume
Month Call Put Total Call Put TotalJan 72,222,195 48,805,030 121,027,225 $208,227,510 $92,254,502 $300,482,012Feb 79,915,293 54,627,436 134,542,729 $139,743,024 $66,755,977 $206,499,001Mar 85,959,448 60,298,597 146,258,045 $146,400,517 $85,367,263 $231,767,780Apr 86,206,561 61,140,939 147,347,500 $119,457,393 $69,279,214 $188,736,607May 84,700,765 62,011,282 146,712,047 $88,631,429 $64,556,825 $153,188,254Jun 86,105,445 62,968,322 149,073,767 $98,333,608 $73,747,837 $172,081,445Jul 88,026,525 64,169,581 152,196,106 $120,754,765 $63,237,199 $183,991,964Aug 91,353,525 68,327,465 159,680,990 $183,636,779 $188,321,714 $371,958,493Sep 89,979,979 68,455,956 158,435,935 $166,782,767 $123,821,313 $290,604,080Oct 89,301,762 66,059,255 155,361,017 $247,845,224 $166,844,534 $414,689,758Nov 89,875,531 67,144,552 157,020,083 $182,832,735 $134,317,023 $317,149,758Dec 87,871,687 64,186,631 152,058,318 $161,391,160 $108,082,231 $269,473,391Total -- -- -- $1,864,036,911 $1,236,585,632 $3,100,622,543
During 2011, 19.2 million equity contracts were traded on the C2, representing options on 1.9 billion shares of underlying stock.
Open interest represents the number of outstanding options contracts at any point in time. It is the total number of options which have been purchased but not liquidated in the secondary market, exercised or expired. At year-end 2011, open interest in equity options on C2 was 152,058,318 contracts.
Open Interest Dollar Volume
Contract Volume
CBOE HOLDINGS, INC. Page 118 2011 MARKET STATISTICS

C2 Equity Options Average Premium Per Contract, Average Contracts Per Trade and Transactions
Month Call Put Total Call Put Total Call Put TotalJan $193 $142 $174 9 9 9 113,778 70,273 184,051Feb $155 $126 $144 12 12 12 78,084 45,020 123,104Mar $142 $123 $134 12 13 12 85,432 53,918 139,350Apr $128 $122 $126 13 13 13 70,159 43,632 113,791May $113 $115 $114 12 12 12 63,932 45,147 109,079Jun $139 $140 $139 11 12 11 61,780 45,525 107,305Jul $169 $128 $152 12 12 12 60,687 41,179 101,866Aug $158 $179 $168 13 13 13 92,319 78,969 171,288Sep $209 $198 $204 11 11 11 73,936 54,756 128,692Oct $206 $183 $197 10 11 11 115,892 82,964 198,856Nov $195 $202 $198 9 9 9 102,112 76,345 178,457Dec $160 $155 $158 9 9 9 107,929 77,159 185,088Total $165 $155 $161 11 11 11 1,026,040 714,887 1,740,927
Average Premium Per Contract Average Contracts Per Trade Transactions
CBOE HOLDINGS, INC. Page 119 2011 MARKET STATISTICS

Standard Symbol Stock Total Call Put Total Call Put
1 ABT Abbott Laboratories 38,459 21,551 16,908 153 86 672 ANF Abercrombie & Fitch Company 28,422 15,033 13,389 113 60 533 ATVI Activision, Inc. 7,104 5,066 2,038 28 20 84 ADBE Adobe Systems, Inc. 22,174 12,126 10,048 88 48 405 AMD Advanced Micro Devices, Inc. 35,858 24,936 10,922 142 99 436 AET Aetna, Inc. 12,081 6,708 5,373 48 27 217 AFL AFLAC Incorporated 16,497 8,454 8,043 65 34 328 A Agilent Technologies, Corporation 10,063 6,189 3,874 40 25 159 AEM Agnico-Eagle Mines Ltd. 26,226 17,988 8,238 104 71 33
10 ARG Airgas, Inc. 6,986 4,368 2,618 28 17 1011 AKS AK Steel Holding Corporation 40,341 27,062 13,279 160 107 5312 AKAM Akamai Technologies, Inc 56,767 39,116 17,651 225 155 7013 AA ALCOA, Inc. 163,549 107,810 55,739 649 428 22114 ACL Alcon, Inc. 420 177 243 2 1 115 ALL Allstate Corporation (The) 9,851 6,091 3,760 39 24 1516 ANR Alpha Natural Resources, Inc. 45,194 26,060 19,134 179 103 7617 MO Altria Group, Inc. 29,843 15,104 14,739 118 60 5818 AMZN Amazon.Com, Inc. 193,813 102,073 91,740 769 405 36419 AMED Amedisys, Inc. 3,033 1,978 1,055 12 8 420 ACAS American Capital Strategies, Ltd. 6,528 4,787 1,741 26 19 721 AXP American Express Company 51,301 27,260 24,041 204 108 9522 AIG American International Group, Inc. 62,496 38,274 24,222 248 152 9623 AMGN Amgen, Inc. 30,294 17,655 12,639 120 70 5024 AMR AMR Corporation 65,241 38,134 27,107 259 151 10825 AMLN Amylin Pharmaceuticals, Inc. 5,731 3,820 1,911 23 15 826 APC Anadarko Petroleum Corporation 38,614 21,099 17,515 153 84 7027 NLY Annaly Mortgage Management, Inc. 46,270 23,180 23,090 184 92 9228 APA Apache Corporation 33,006 19,033 13,973 131 76 5529 APOL Apollo Group, Inc. 22,517 11,127 11,390 89 44 4530 AAPL Apple Computer, Inc. 1,104,428 680,934 423,494 4,383 2,702 1,68131 AMAT Applied Materials, Inc. 16,848 9,551 7,297 67 38 2932 MT Arcelor Mittal 25,484 15,775 9,709 101 63 3933 ACI Arch Coal, Inc 22,044 12,765 9,279 87 51 3734 ADM Archer-Daniels-Midland Company 29,134 17,780 11,354 116 71 4535 ARNA Arena Pharmaceuticals, Inc. 4,155 3,455 700 16 14 336 AGO Assured Guaranty Ltd. 15,070 9,668 5,402 60 38 2137 APWR AstroPower, Inc. 531 334 197 2 1 138 T AT&T Corporation 171,284 93,507 77,777 680 371 30939 ATPG ATP Oil & Gas Corporation 31,073 18,801 12,272 123 75 4940 ADSK Autodesk, Inc. 9,811 5,559 4,252 39 22 1741 BIDU Baidu, Inc. ADS 180,075 107,296 72,779 715 426 28942 BHI Baker Hughes Incorporated 26,585 15,506 11,079 105 62 4443 BBD Banco Bradesco 2,628 1,353 1,275 10 5 544 BAC Bank of America Corporation 2,259,194 1,207,904 1,051,290 8,965 4,793 4,17245 BK Bank of New York Company, Inc. (The) 15,089 7,518 7,571 60 30 3046 ABX Barrick Gold Corporation 98,261 58,220 40,041 390 231 15947 BAX Baxter International, Inc. 10,723 5,695 5,028 43 23 2048 BBT BB&T Corporation 13,475 7,860 5,615 53 31 2249 BBBY Bed Bath & Beyond, Inc. 13,025 7,355 5,670 52 29 2350 BRKB Berkshire Hathaway, Inc. 40,626 19,864 20,762 161 79 8251 BBY Best Buy Co., Inc. 66,025 40,210 25,815 262 160 10252 BHP BHP Billiton Limited 30,020 13,958 16,062 119 55 6453 BCRX Biocryst Pharmaceuticals, Inc. 648 633 15 3 3 054 BA Boeing Company (The) 53,644 29,317 24,327 213 116 9755 BSX Boston Scientific Corporation 6,778 4,143 2,635 27 16 1056 BP BP p.l.c. 104,393 60,488 43,905 414 240 17457 BMY Bristol-Myers Squibb Company 33,571 21,134 12,437 133 84 4958 BRCM Broadcom, Inc. 49,452 30,845 18,607 196 122 7459 BRCD Brocade Communications 20,459 15,177 5,282 81 60 2160 BUCY Bucyrus International, Inc. 1,534 1,022 512 6 4 261 COF Capital One Financial Corporation 20,795 9,755 11,040 83 39 4462 CAT Caterpillar, Inc. 207,110 116,035 91,075 822 460 36163 CELG Celgene Corporation 24,866 16,639 8,227 99 66 3364 CTIC Cell Therapeutics, Inc. 989 979 10 4 4 0
C2 Equity Options Volume (Includes LEAPS)
Contract Volume Average Daily Volume
CBOE HOLDINGS, INC. Page 120 2011 MARKET STATISTICS

Standard Symbol Stock Total Call Put Total Call Put
C2 Equity Options Volume (Includes LEAPS)
Contract Volume Average Daily Volume
65 CX Cemex S.A. de C.V. 10,451 4,998 5,453 41 20 2266 CENX Century Aluminum Company 5,858 3,467 2,391 23 14 967 CF Charter One Financial, Inc. 42,368 27,368 15,000 168 109 6068 CHK Chesapeake Energy Corporation 92,421 61,455 30,966 367 244 12369 CVX ChevronTexaco Corporation 83,058 40,326 42,732 330 160 17070 CB Chubb Corporation (The) 3,425 1,999 1,426 14 8 671 CIEN Ciena Corporation 34,536 19,623 14,913 137 78 5972 CI CIGNA Corporation 4,894 2,718 2,176 19 11 973 CSCO Cisco Systems, Inc. 333,454 217,373 116,081 1,323 863 46174 CIT CIT Group, Inc. 3,831 2,053 1,778 15 8 775 C Citigroup, Inc. 1,128,699 667,574 461,125 4,479 2,649 1,83076 CLF Cliffs Natural Resources, Inc. 46,327 29,929 16,398 184 119 6577 KO Coca-Cola Company (The) 50,863 28,946 21,917 202 115 8778 CL Colgate-Palmolive Company 10,563 6,144 4,419 42 24 1879 CMCSA Comcast Corp. (Class A) 26,763 12,444 14,319 106 49 5780 CMA Comerica Incorporated 8,696 5,580 3,116 35 22 1281 COP ConocoPhillips 58,666 32,998 25,668 233 131 10282 CNX Consol Energy, Inc. 19,341 12,210 7,131 77 48 2883 GLW Corning Incorporated 38,516 24,113 14,403 153 96 5784 COST Costco Wholesale Corp. 18,556 10,778 7,778 74 43 3185 CREE Cree, Inc. 54,827 34,665 20,162 218 138 8086 CSX CSX Corporation 20,708 12,147 8,561 82 48 3487 CVS CVS Corporation 27,519 16,162 11,357 109 64 4588 DHI D.R. Horton, Inc. 5,364 2,946 2,418 21 12 1089 DE Deere & Company 54,464 33,157 21,307 216 132 8590 DCTH Delcath Systems, Inc. 3,666 2,309 1,357 15 9 591 DELL Dell Computer Corp. 70,182 35,590 34,592 279 141 13792 DAL Delta Air Lines, Inc. 32,787 22,749 10,038 130 90 4093 DNDN Dendreon Corporation 50,135 36,501 13,634 199 145 5494 DVN Devon Energy Corporation 19,008 11,518 7,490 75 46 3095 DO Diamond Offshore Drilling, Inc. 15,920 9,487 6,433 63 38 2696 DIS Disney (The Walt) Holding Co. 45,079 23,931 21,148 179 95 8497 DOW Dow Chemical Company (The) 37,318 19,407 17,911 148 77 7198 DRYS DryShip, Inc. 42,109 33,787 8,322 167 134 3399 DD du Pont (E.I.) de Nemours & Company 36,595 20,203 16,392 145 80 65100 ETFC E*Trade Financial Corporation 7,795 5,227 2,568 31 21 10101 EK Eastman Kodak Company 78,205 44,404 33,801 310 176 134102 EBAY eBay, Inc. 64,497 33,953 30,544 256 135 121103 EP El Paso Corporation 15,015 9,324 5,691 60 37 23104 EA Electronic Arts, Inc. 290 228 62 1 1 0105 ERTS Electronic Arts, Inc. 25,406 14,662 10,744 101 58 43106 EMC EMC Corporation 65,201 37,992 27,209 259 151 108107 PCX EnCana Corporation 52,599 34,785 17,814 209 138 71108 ENER Energy Conversion Devices, Inc. 1,480 537 943 6 2 4109 EOG EOG Resources, Inc. 16,436 9,456 6,980 65 38 28110 ESRX Express Scripts Inc-Cl A 23,486 13,796 9,690 93 55 38111 XOM Exxon Mobil Corporation 206,079 110,454 95,625 818 438 379112 FFIV F5 Networks, Inc. 28,761 15,588 13,173 114 62 52113 FDX FedEx Corporation 41,752 22,467 19,285 166 89 77114 FIS Fidelity National Information Services, Inc. 344 181 163 1 1 1115 FITB Fifth Third Bancorp. 9,299 5,550 3,749 37 22 15116 FSLR First Solar, Inc. 68,791 35,290 33,501 273 140 133117 FLEX Flextronics International Ltd. 1,375 954 421 5 4 2118 F Ford Motor Company 369,650 237,450 132,200 1,467 942 525119 FWLT Foster Wheeler AG 7,434 4,764 2,670 30 19 11120 FCX Freeport-McMoRan Copper & Gold Co., Inc. (Class B) 341,130 198,552 142,578 1,354 788 566121 GME GameStop Corporation 15,994 11,131 4,863 63 44 19122 GPS Gap, Inc. (The) 11,709 5,802 5,907 46 23 23123 GRMN Garmin Ltd. 10,213 5,405 4,808 41 21 19124 GE General Electric Company 319,808 190,327 129,481 1,269 755 514125 GGP General Growth Properties, Inc. 1,271 754 517 5 3 2126 GIS General Mills, Inc. 12,587 7,908 4,679 50 31 19127 GM General Motors Corporation 63,720 41,927 21,793 253 166 86128 GNW Genworth Financial, Inc. 13,585 9,848 3,737 54 39 15
CBOE HOLDINGS, INC. Page 121 2011 MARKET STATISTICS

Standard Symbol Stock Total Call Put Total Call Put
C2 Equity Options Volume (Includes LEAPS)
Contract Volume Average Daily Volume
129 GENZ Genzyme Corporation 8,310 3,340 4,970 33 13 20130 GILD Gilead Sciences, Inc. 26,818 15,024 11,794 106 60 47131 GFI Gold Fields Limited 6,303 4,104 2,199 25 16 9132 GG Goldcorp, Inc. 49,668 31,236 18,432 197 124 73133 GOOG Google, Inc. 317,221 159,835 157,386 1,259 634 625134 GMCR Green Mountain Coffee Roasters, Inc. 76,012 36,698 39,314 302 146 156135 GRPN Groupon, Inc. 21,664 10,765 10,899 86 43 43136 HK Halcon Resources Corporation 28,591 18,393 10,198 113 73 40137 HAL Halliburton Company 82,170 49,587 32,583 326 197 129138 HOG Harley-Davidson, Inc. 10,944 5,669 5,275 43 22 21139 HIG Hartford Financial Services Group, Inc.(The) 20,142 11,698 8,444 80 46 34140 HL Hecla Mining Company 56,517 43,859 12,658 224 174 50141 HSY Hershey Foods Corporation 4,528 3,138 1,390 18 12 6142 HES Hess Corporation 25,565 15,450 10,115 101 61 40143 HPQ Hewlett-Packard Company 105,503 62,031 43,472 419 246 173144 HD Home Depot, Inc. (The) 36,280 19,622 16,658 144 78 66145 HON Honeywell International, Inc. 24,672 13,821 10,851 98 55 43146 HBC HSBC Holdings plc 17,414 7,340 10,074 69 29 40147 HGSI Human Genome Sciences, Inc. 22,546 15,050 7,496 89 60 30148 HBAN Huntington Bancshares, Inc. 11,728 7,769 3,959 47 31 16149 IBN ICICI Bank Limited 7,923 3,925 3,998 31 16 16150 INTC Intel Corporation 324,358 197,322 127,036 1,287 783 504151 ITMN InterMune, Inc. 8,279 5,137 3,142 33 20 12152 IBM International Business Machines Corporation 165,483 83,821 81,662 657 333 324153 IP International Paper Company 17,862 8,634 9,228 71 34 37154 IOC InterOil Corporation 15,847 10,035 5,812 63 40 23155 ESI ITT Educational Services, Inc. 10,226 4,975 5,251 41 20 21156 JPM J.P. Morgan Chase & Co. 393,194 210,688 182,506 1,560 836 724157 JDSU JDS Uniphase Corp. 50,600 34,279 16,321 201 136 65158 JNJ Johnson & Johnson 51,167 29,027 22,140 203 115 88159 JOY Joy Global, Inc. 2,063 1,146 917 8 5 4160 JOYG Joy Global, Inc. 23,137 13,064 10,073 92 52 40161 JNPR Juniper Networks, Inc. 46,645 30,102 16,543 185 119 66162 KBH KB HOME 11,335 6,940 4,395 45 28 17163 KEY KeyCorp 5,992 3,828 2,164 24 15 9164 KMP Kinder Morgan Energy Partners 6,681 2,471 4,210 27 10 17165 KGC Kinross Gold Corporation 33,659 26,042 7,617 134 103 30166 KFT Kraft Foods, Inc. 20,961 10,477 10,484 83 42 42167 LVS Las Vegas Sands Corp. 356,753 227,366 129,387 1,416 902 513168 LDK LDK Solar Company Ltd. 41,034 23,910 17,124 163 95 68169 LEAP Leap Wireless International, Inc. 5,611 4,095 1,516 22 16 6170 LEN Lennar Corporation 12,102 6,021 6,081 48 24 24171 LLY Lilly (Eli) and Company 20,618 13,379 7,239 82 53 29172 LNC Lincoln National Corporation 6,630 4,412 2,218 26 18 9173 LNKD Linkedln Corporation 78,883 29,106 49,777 313 116 198174 LO Lorillard, Inc. 21,363 9,761 11,602 85 39 46175 LOW Lowe's Companies, Inc. 19,808 12,400 7,408 79 49 29176 M Macy's, Inc. 25,218 16,956 8,262 100 67 33177 MNKD Mannkind Corporation 14,361 9,010 5,351 57 36 21178 MRO Marathon Oil Corporation 34,098 19,826 14,272 135 79 57179 MRVL Marvell Technology Group Ltd. 64,555 44,259 20,296 256 176 81180 MEE Massey Energy Company 12,164 6,324 5,840 48 25 23181 MA MasterCard, Inc. 35,941 19,366 16,575 143 77 66182 MBI MBIA, Inc. 20,799 13,463 7,336 83 53 29183 MCD McDonald's Corporation 59,498 32,099 27,399 236 127 109184 MMR McMoran Exploration Co. 23,909 17,096 6,813 95 68 27185 MJN Mead Johnson Nutrition Company 4,813 3,070 1,743 19 12 7186 MDVN Medivation, Inc. 3,694 1,374 2,320 15 5 9187 MDT Medtronic, Inc. 17,515 9,580 7,935 70 38 31188 WFR MEMC Electronic Materials, Inc. 20,370 13,376 6,994 81 53 28189 MRK Merck & Co., Inc. 67,037 36,676 30,361 266 146 120190 MET MetLife, Inc. 27,312 13,789 13,523 108 55 54191 MGM Metro-Goldwyn-Mayer, Inc. 84,357 55,024 29,333 335 218 116192 MTG MGIC Investment Corporation 21,600 13,717 7,883 86 54 31
CBOE HOLDINGS, INC. Page 122 2011 MARKET STATISTICS

Standard Symbol Stock Total Call Put Total Call Put
C2 Equity Options Volume (Includes LEAPS)
Contract Volume Average Daily Volume
193 MU Micron Technology, Inc. 99,984 68,880 31,104 397 273 123194 MSFT Microsoft Corporation 312,505 183,792 128,713 1,240 729 511195 MMM Minnesota Mining & Manufacturing Company 23,872 12,579 11,293 95 50 45196 MCP Molycorp, Inc. 59,673 37,835 21,838 237 150 87197 MON Monsanto Company/New 52,905 31,293 21,612 210 124 86198 MCO Moody's Corporation 7,085 3,334 3,751 28 13 15199 MS Morgan Stanley 140,184 71,040 69,144 556 282 274200 MOS Mosaic Company 90,823 59,651 31,172 360 237 124201 MSI Motorola Solutions, Inc. 4,281 2,804 1,477 17 11 6202 MOT Motorola, Inc. 182 153 29 1 1 0203 MYL Mylan Laboratories, Inc. 7,530 5,061 2,469 30 20 10204 NBR Nabors Industries, Ltd. 17,759 12,755 5,004 70 51 20205 NOV National Oilwell Varco, Inc. 18,605 9,330 9,275 74 37 37206 NFLX NetFlix, Inc. 198,683 103,619 95,064 788 411 377207 NTAP Network Appliance Corp. 37,640 23,310 14,330 149 93 57208 NEM Newmont Mining Corporation 74,840 47,403 27,437 297 188 109209 NKE NIKE, Inc. (Class B) 24,538 13,359 11,179 97 53 44210 NE Noble Corporation 11,128 6,152 4,976 44 24 20211 NOK Nokia Corporation ADR 55,680 35,334 20,346 221 140 81212 JWN Nordstrom, Inc. 12,212 5,871 6,341 48 23 25213 NUE Nucor Corporation 15,929 9,316 6,613 63 37 26214 NVDA NVIDIA Corporation 123,231 78,729 44,502 489 312 177215 NYX NYSE Euronext 18,437 12,299 6,138 73 49 24216 OXY Occidental Petroleum Corporation 36,720 18,871 17,849 146 75 71217 ORCL Oracle Corporation 93,551 54,834 38,717 371 218 154218 SEED Origin Agritech Limited 1,516 1,252 264 6 5 1219 BTU Peabody Energy Corporation 35,236 22,272 12,964 140 88 51220 JCP Penney (J.C.) Company, Inc. 26,367 13,388 12,979 105 53 52221 PEP PepsiCo, Inc. 28,641 16,612 12,029 114 66 48222 PBR Petroleo Brasileiro S.A.-ADR 107,028 67,146 39,882 425 266 158223 PFE Pfizer, Inc. 92,680 54,313 38,367 368 216 152224 PM Philip Morris International, Inc. 33,070 15,067 18,003 131 60 71225 PXP Plains Exploration & Production Company 14,236 8,922 5,314 56 35 21226 PCL Plum Creek Timber Company, LP 2,989 1,529 1,460 12 6 6227 PNC PNC Bank Corporation 22,156 11,001 11,155 88 44 44228 PARD Poniard Pharmaceuticals, Inc. 32 31 1 0 0 0229 BPOP Popular, Inc. 2,617 2,009 608 10 8 2230 POT Potash Corporation of Saskatchewan, Inc. 104,439 70,669 33,770 414 280 134231 PG Procter & Gamble Company (The) 45,721 23,724 21,997 181 94 87232 PRU Prudential Financial, Inc. 11,481 6,366 5,115 46 25 20233 PHM Pulte Homes, Inc. 8,723 5,478 3,245 35 22 13234 QCOM QUALCOMM, Inc. 170,685 101,396 69,289 677 402 275235 RSH RadioShack 9,703 6,695 3,008 39 27 12236 RMBS Rambus, Inc. 27,825 17,113 10,712 110 68 43237 RTN Raytheon Company 6,684 3,537 3,147 27 14 12238 RF Regions Financial Corp. 14,317 8,353 5,964 57 33 24239 RIMM Research in Motion 464,477 260,364 204,113 1,843 1,033 810240 RVBD Riverbed Technology, Inc. 11,870 8,465 3,405 47 34 14241 RCL Royal Caribbean Cruises Ltd. 10,138 5,514 4,624 40 22 18242 CRM Salesforce.com 73,051 33,475 39,576 290 133 157243 SNDK SanDisk Corporation 81,628 46,040 35,588 324 183 141244 SD SandRidge Energy, Inc. 44,808 31,109 13,699 178 123 54245 SVNT Savient Pharmaceuticals, Inc. 3,773 2,667 1,106 15 11 4246 SLB Schlumberger Limited 63,252 34,701 28,551 251 138 113247 STX Seagate Technology 40,553 26,065 14,488 161 103 57248 SHLD Sears Holdings Corporation 16,218 7,296 8,922 64 29 35249 S Sears, Roebuck and Company 101,973 80,108 21,865 405 318 87250 SQNM Sequenom, Inc. 5,163 3,334 1,829 20 13 7251 SLW Silver Wheaton Corporation 140,828 87,485 53,343 559 347 212252 SPG Simon Property Group, Inc. 10,011 3,876 6,135 40 15 24253 STEC SimpleTech, Inc. 17,786 10,540 7,246 71 42 29254 SIRI Sirius Satellite Radio 35,233 27,883 7,350 140 111 29255 SO Southern Company (The) 7,030 4,483 2,547 28 18 10256 SWN Southwestern Energy Company 24,182 16,951 7,231 96 67 29
CBOE HOLDINGS, INC. Page 123 2011 MARKET STATISTICS

Standard Symbol Stock Total Call Put Total Call Put
C2 Equity Options Volume (Includes LEAPS)
Contract Volume Average Daily Volume
257 SBUX Starbucks Corporation 29,503 16,912 12,591 117 67 50258 HOT Starwood Hotels & Resorts Worldwide, Inc. 11,643 6,088 5,555 46 24 22259 STT State Street Corporation 8,517 4,337 4,180 34 17 17260 SU Suncor Energy, Inc. 40,604 24,873 15,731 161 99 62261 SUN Sunoco, Inc. 10,011 5,526 4,485 40 22 18262 SPWR SunPower Corp. 387 80 307 2 0 1263 SPWRA SunPower Corporation 14,322 8,685 5,637 57 34 22264 STP Suntech Power Holdings Co., Ltd. 16,694 9,288 7,406 66 37 29265 STI SunTrust Banks, Inc. 11,740 6,563 5,177 47 26 21266 SYMC Symantec Corporation 12,014 7,817 4,197 48 31 17267 TLB Talbots, Inc. (The) 6,451 4,259 2,192 26 17 9268 TGT Target Corporation 42,368 26,916 15,452 168 107 61269 TCK Teck Resources Limited 24,117 14,856 9,261 96 59 37270 TSO Tesoro Petroleum Corporation 16,978 10,424 6,554 67 41 26271 TEVA Teva Pharmaceutical Industries Ltd. ADR 53,821 31,357 22,464 214 124 89272 TXN Texas Instruments Incorporated 29,143 13,082 16,061 116 52 64273 TXT Textron, Inc. 8,885 6,038 2,847 35 24 11274 BX The Blackstone Group LP 10,035 6,427 3,608 40 26 14275 DTV The DIRECTV Group, Inc. 6,399 3,571 2,828 25 14 11276 GS The Goldman Sachs Group, Inc. 163,580 85,579 78,001 649 340 310277 TIF Tiffany & Co. 13,182 7,525 5,657 52 30 22278 TWX Time Warner, Inc. 14,137 8,878 5,259 56 35 21279 TIVO TiVo, Inc. 27,250 18,083 9,167 108 72 36280 TM Toyota Motor Corporation ADR 11,321 4,714 6,607 45 19 26281 RIG Transocean, Inc. 60,096 36,168 23,928 238 144 95282 TSL Trina Solar Limited 9,255 5,288 3,967 37 21 16283 TYC Tyco International Limited 13,329 9,274 4,055 53 37 16284 USB U.S. Bancorp 25,590 14,069 11,521 102 56 46285 UAL UAL Corporation 55,223 35,006 20,217 219 139 80286 UNP Union Pacific Corporation 18,587 9,866 8,721 74 39 35287 UNH United HealthCare Corporation 20,989 10,261 10,728 83 41 43288 UPS United Parcel Service, Inc. 42,750 26,522 16,228 170 105 64289 X United States Seel Corporation 183,338 117,003 66,335 728 464 263290 UTX United Technologies Corporation 21,708 11,413 10,295 86 45 41291 LCC US Airways Group, Inc. (New) 18,689 13,170 5,519 74 52 22292 SLM USA Education, Inc. 7,329 3,932 3,397 29 16 13293 VALE Vale SA 82,496 44,566 37,930 327 177 151294 VLO Valero Energy Corporation 53,290 35,940 17,350 211 143 69295 VRSN Verisign, Inc. 5,973 4,080 1,893 24 16 8296 VZ Verizon Communications, Inc. 106,283 67,001 39,282 422 266 156297 V Vivendi SA 89,180 52,748 36,432 354 209 145298 VVUS VIVUS, Inc. 11,275 7,307 3,968 45 29 16299 WAG Walgreen Company 35,325 23,475 11,850 140 93 47300 WMT Wal-Mart Stores, Inc. 60,225 33,093 27,132 239 131 108301 WLT Walter Energy, Inc. 33,598 20,181 13,417 133 80 53302 WFT Weatherford International, Inc. 57,437 40,624 16,813 228 161 67303 WLP WellPoint Health Networks, Inc. (Class A) 13,592 7,113 6,479 54 28 26304 WFC Wells Fargo & Company 182,173 98,855 83,318 723 392 331305 WDC Western Digital Corporation 21,060 12,986 8,074 84 52 32306 WHR Whirlpool Corporation 9,521 4,659 4,862 38 18 19307 WFM Whole Foods Market, Inc. 7,849 4,242 3,607 31 17 14308 WFMI Whole Foods Market, Inc. 5,262 3,021 2,241 21 12 9309 WMB Williams Companies, Inc. (The) 43,903 25,361 18,542 174 101 74310 WIN Winn-Dixie Stores, Inc. 2,600 1,966 634 10 8 3311 WYNN Wynn Resorts, Limited 54,208 28,773 25,435 215 114 101312 XRX Xerox Corporation 11,093 7,116 3,977 44 28 16313 XLNX Xilinix, Inc. 17,753 7,449 10,304 70 30 41314 XL XL Capital LTD 3,891 2,666 1,225 15 11 5315 YHOO Yahoo!, Inc. 266,592 186,567 80,025 1,058 740 318316 AUY Yamana Gold, Inc. 28,784 19,595 9,189 114 78 36317 YRCW YRC Worldwide, Inc. 17,090 9,051 8,039 68 36 32318 YUM YUM! Brands, Inc. 9,356 5,131 4,225 37 20 17319 ZION Zions Bancorporation 8,562 4,623 3,939 34 18 16
CBOE HOLDINGS, INC. Page 124 2011 MARKET STATISTICS

C2 Top 100 Equity Options Ranked by Volume (Includes LEAPS)
Standard Symbol Stock Total Call Put Total Call Put
1 BAC Bank of America Corporation 2,259,194 1,207,904 1,051,290 8,965 4,793 4,1722 C Citigroup, Inc. 1,128,699 667,574 461,125 4,479 2,649 1,8303 AAPL Apple Computer, Inc. 1,104,428 680,934 423,494 4,383 2,702 1,6814 RIMM Research in Motion 464,477 260,364 204,113 1,843 1,033 8105 JPM J.P. Morgan Chase & Co. 393,194 210,688 182,506 1,560 836 7246 F Ford Motor Company 369,650 237,450 132,200 1,467 942 5257 LVS Las Vegas Sands Corp. 356,753 227,366 129,387 1,416 902 5138 FCX Freeport-McMoRan Copper & Gold Co., Inc. (Class B) 341,130 198,552 142,578 1,354 788 5669 CSCO Cisco Systems, Inc. 333,454 217,373 116,081 1,323 863 46110 INTC Intel Corporation 324,358 197,322 127,036 1,287 783 50411 GE General Electric Company 319,808 190,327 129,481 1,269 755 51412 GOOG Google, Inc. 317,221 159,835 157,386 1,259 634 62513 MSFT Microsoft Corporation 312,505 183,792 128,713 1,240 729 51114 YHOO Yahoo!, Inc. 266,592 186,567 80,025 1,058 740 31815 CAT Caterpillar, Inc. 207,110 116,035 91,075 822 460 36116 XOM Exxon Mobil Corporation 206,079 110,454 95,625 818 438 37917 NFLX NetFlix, Inc. 198,683 103,619 95,064 788 411 37718 AMZN Amazon.Com, Inc. 193,813 102,073 91,740 769 405 36419 X United States Seel Corporation 183,338 117,003 66,335 728 464 26320 WFC Wells Fargo & Company 182,173 98,855 83,318 723 392 33121 BIDU Baidu, Inc. ADS 180,075 107,296 72,779 715 426 28922 T AT&T Corporation 171,284 93,507 77,777 680 371 30923 QCOM QUALCOMM, Inc. 170,685 101,396 69,289 677 402 27524 IBM International Business Machines Corporation 165,483 83,821 81,662 657 333 32425 GS The Goldman Sachs Group, Inc. 163,580 85,579 78,001 649 340 31026 AA ALCOA, Inc. 163,549 107,810 55,739 649 428 22127 SLW Silver Wheaton Corporation 140,828 87,485 53,343 559 347 21228 MS Morgan Stanley 140,184 71,040 69,144 556 282 27429 NVDA NVIDIA Corporation 123,231 78,729 44,502 489 312 17730 PBR Petroleo Brasileiro S.A.-ADR 107,028 67,146 39,882 425 266 15831 VZ Verizon Communications, Inc. 106,283 67,001 39,282 422 266 15632 HPQ Hewlett-Packard Company 105,503 62,031 43,472 419 246 17333 POT Potash Corporation of Saskatchewan, Inc. 104,439 70,669 33,770 414 280 13434 BP BP p.l.c. 104,393 60,488 43,905 414 240 17435 S Sears, Roebuck and Company 101,973 80,108 21,865 405 318 8736 MU Micron Technology, Inc. 99,984 68,880 31,104 397 273 12337 ABX Barrick Gold Corporation 98,261 58,220 40,041 390 231 15938 ORCL Oracle Corporation 93,551 54,834 38,717 371 218 15439 PFE Pfizer, Inc. 92,680 54,313 38,367 368 216 15240 CHK Chesapeake Energy Corporation 92,421 61,455 30,966 367 244 12341 MOS Mosaic Company 90,823 59,651 31,172 360 237 12442 V Vivendi SA 89,180 52,748 36,432 354 209 14543 MGM Metro-Goldwyn-Mayer, Inc. 84,357 55,024 29,333 335 218 11644 CVX ChevronTexaco Corporation 83,058 40,326 42,732 330 160 17045 VALE Vale SA 82,496 44,566 37,930 327 177 15146 HAL Halliburton Company 82,170 49,587 32,583 326 197 12947 SNDK SanDisk Corporation 81,628 46,040 35,588 324 183 14148 LNKD Linkedln Corporation 78,883 29,106 49,777 313 116 19849 EK Eastman Kodak Company 78,205 44,404 33,801 310 176 13450 GMCR Green Mountain Coffee Roasters, Inc. 76,012 36,698 39,314 302 146 15651 NEM Newmont Mining Corporation 74,840 47,403 27,437 297 188 10952 CRM Salesforce.com 73,051 33,475 39,576 290 133 15753 DELL Dell Computer Corp. 70,182 35,590 34,592 279 141 13754 FSLR First Solar, Inc. 68,791 35,290 33,501 273 140 13355 MRK Merck & Co., Inc. 67,037 36,676 30,361 266 146 12056 BBY Best Buy Co., Inc. 66,025 40,210 25,815 262 160 10257 AMR AMR Corporation 65,241 38,134 27,107 259 151 10858 EMC EMC Corporation 65,201 37,992 27,209 259 151 10859 MRVL Marvell Technology Group Ltd. 64,555 44,259 20,296 256 176 8160 EBAY eBay, Inc. 64,497 33,953 30,544 256 135 12161 GM General Motors Corporation 63,720 41,927 21,793 253 166 8662 SLB Schlumberger Limited 63,252 34,701 28,551 251 138 11363 AIG American International Group, Inc. 62,496 38,274 24,222 248 152 9664 WMT Wal-Mart Stores, Inc. 60,225 33,093 27,132 239 131 10865 RIG Transocean, Inc. 60,096 36,168 23,928 238 144 9566 MCP Molycorp, Inc. 59,673 37,835 21,838 237 150 8767 MCD McDonald's Corporation 59,498 32,099 27,399 236 127 109
Contract Volume Average Daily Volume
CBOE HOLDINGS, INC. Page 125 2011 MARKET STATISTICS
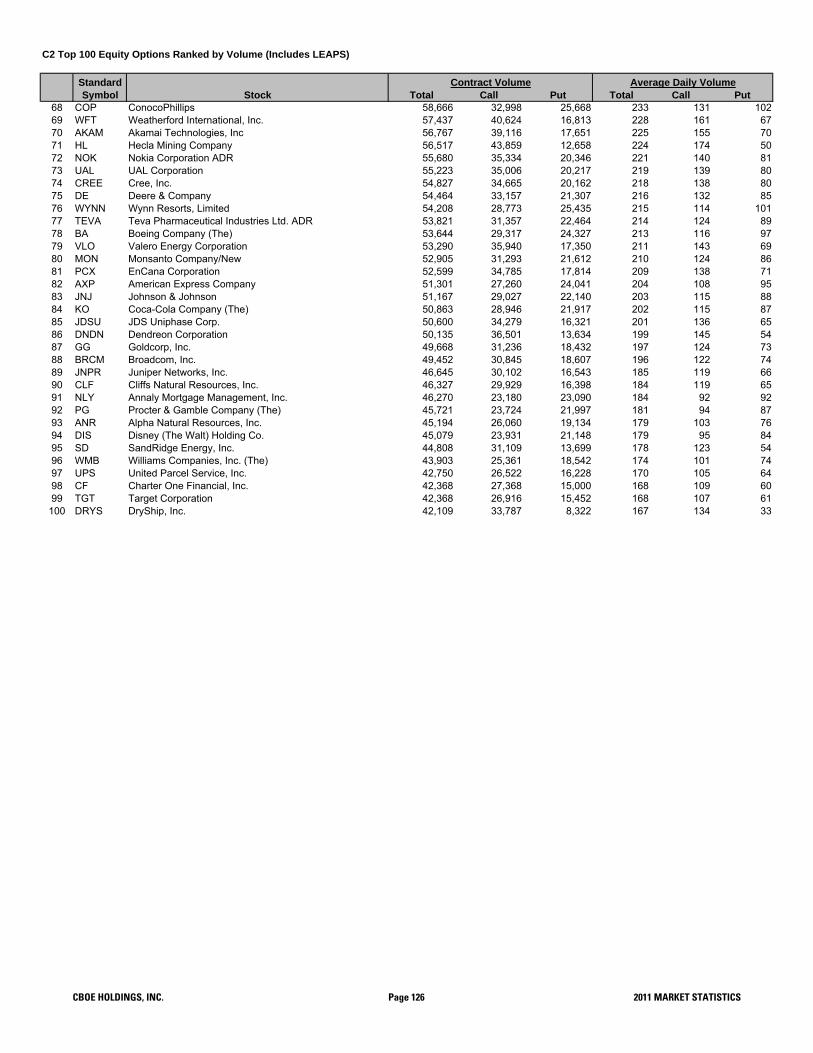
C2 Top 100 Equity Options Ranked by Volume (Includes LEAPS)
Standard Symbol Stock Total Call Put Total Call Put
Contract Volume Average Daily Volume
68 COP ConocoPhillips 58,666 32,998 25,668 233 131 10269 WFT Weatherford International, Inc. 57,437 40,624 16,813 228 161 6770 AKAM Akamai Technologies, Inc 56,767 39,116 17,651 225 155 7071 HL Hecla Mining Company 56,517 43,859 12,658 224 174 5072 NOK Nokia Corporation ADR 55,680 35,334 20,346 221 140 8173 UAL UAL Corporation 55,223 35,006 20,217 219 139 8074 CREE Cree, Inc. 54,827 34,665 20,162 218 138 8075 DE Deere & Company 54,464 33,157 21,307 216 132 8576 WYNN Wynn Resorts, Limited 54,208 28,773 25,435 215 114 10177 TEVA Teva Pharmaceutical Industries Ltd. ADR 53,821 31,357 22,464 214 124 8978 BA Boeing Company (The) 53,644 29,317 24,327 213 116 9779 VLO Valero Energy Corporation 53,290 35,940 17,350 211 143 6980 MON Monsanto Company/New 52,905 31,293 21,612 210 124 8681 PCX EnCana Corporation 52,599 34,785 17,814 209 138 7182 AXP American Express Company 51,301 27,260 24,041 204 108 9583 JNJ Johnson & Johnson 51,167 29,027 22,140 203 115 8884 KO Coca-Cola Company (The) 50,863 28,946 21,917 202 115 8785 JDSU JDS Uniphase Corp. 50,600 34,279 16,321 201 136 6586 DNDN Dendreon Corporation 50,135 36,501 13,634 199 145 5487 GG Goldcorp, Inc. 49,668 31,236 18,432 197 124 7388 BRCM Broadcom, Inc. 49,452 30,845 18,607 196 122 7489 JNPR Juniper Networks, Inc. 46,645 30,102 16,543 185 119 6690 CLF Cliffs Natural Resources, Inc. 46,327 29,929 16,398 184 119 6591 NLY Annaly Mortgage Management, Inc. 46,270 23,180 23,090 184 92 9292 PG Procter & Gamble Company (The) 45,721 23,724 21,997 181 94 8793 ANR Alpha Natural Resources, Inc. 45,194 26,060 19,134 179 103 7694 DIS Disney (The Walt) Holding Co. 45,079 23,931 21,148 179 95 8495 SD SandRidge Energy, Inc. 44,808 31,109 13,699 178 123 5496 WMB Williams Companies, Inc. (The) 43,903 25,361 18,542 174 101 7497 UPS United Parcel Service, Inc. 42,750 26,522 16,228 170 105 6498 CF Charter One Financial, Inc. 42,368 27,368 15,000 168 109 6099 TGT Target Corporation 42,368 26,916 15,452 168 107 61
100 DRYS DryShip, Inc. 42,109 33,787 8,322 167 134 33
CBOE HOLDINGS, INC. Page 126 2011 MARKET STATISTICS
C2 CASH INDEX OPTIONS - 2011
Standard & Poor’s IndexesStandard & Poor’s 500 Index Options - P.M. Settled (SPXpmTM ): October 4, 2011 (European-style).
Standard & Poor’s 500 Index Options - P.M. Settled - SPXpm
The Standard & Poor's 500 Index is a capitalization-weighted index of 500 stocks from a broad range of industries. The component stocks are weighted according to the total market value of their outstanding shares. The impact of a component's price change is proportional to the issue's total market value, which is the share price times the number of shares outstanding. These are summed for all 500 stocks and divided by a predetermined base value. The base value for the S&P 500 Index is adjusted to reflect changes in capitalization resulting from mergers, acquisitions, stock rights, substitutions, etc. SPXpm options are European-style and generally may be exercised only on the last business day before expiration. The exercise-settlement value, SPXpm, is the official closing price of the S&P 500 Index as reported by Standard & Poors on the last business day before the expiration date. Exercise will result in delivery of cash on the business day following expiration. Trading in SPXpm options will ordinarily cease on the business day (usually a Friday) preceding the expiration date.
CBOE HOLDINGS, INC. Page 127 2011 Market Statistics

C2 CASH INDEX OPTIONS - 2011
Total SPXpm Index Options Contract Volume
Trading Average DailyMonth Days Call Put Total Volume
JanFebMarAprMayJunJulAugSepOct 20 40,956 59,326 100,282 5,014Nov 21 44,525 66,020 110,545 5,264Dec 21 37,023 68,436 105,459 5,022Total 62 122,504 193,782 316,286 5,101
SPXpm Index Options Open Interest and Dollar Volume
Month Call Put Total Call Put TotalJanFebMarAprMayJunJulAugSepOct 13,337 30,127 43,464 $79,858,209 $81,075,597 $160,933,806Nov 16,404 25,275 41,679 $88,164,269 $49,852,532 $138,016,801Dec 11,922 29,651 41,573 $26,175,887 $36,892,883 $63,068,770Total -- -- -- $194,198,365 $167,821,012 $362,019,377
Total SPXpm Index Options Average Premium Per Contract, Average Contracts Per Trade and Transactions
Month Call Put Total Call Put Total Call Put TotalJanFebMarAprMayJunJulAugSepOct $1,950 $1,367 $1,605 7 8 8 5,990 7,216 13,206Nov $1,980 $755 $1,249 8 9 9 5,334 7,397 12,731Dec $707 $539 $598 9 11 10 3,999 6,163 10,162Total $1,585 $866 $1,145 8 9 9 15,323 20,776 36,099
Transactions
Contract Volume
Open Interest in Contracts Dollar Volume
Average Premium Per Contract Average Contracts Per Trade
CBOE HOLDINGS, INC. Page 128 2011 MARKET STATISTICS

C2 EXCHANGE TRADED FUNDS OPTIONS - 2011
Total C2 Exchange Traded Funds Contract Volume
Trading Average DailyMonth Days Call Put Total Volume
Jan 20 552,759 838,201 1,390,960 69,548Feb 19 536,109 859,024 1,395,133 73,428Mar 23 1,002,692 1,398,049 2,400,741 104,380Apr 20 789,039 1,199,994 1,989,033 99,452May 21 1,067,983 1,504,970 2,572,953 122,522Jun 22 1,386,397 2,019,547 3,405,944 154,816Jul 20 1,180,767 2,010,069 3,190,836 159,542Aug 23 2,138,413 2,797,594 4,936,007 214,609Sep 21 1,510,333 1,869,086 3,379,419 160,925Oct 21 1,511,934 1,905,562 3,417,496 162,738Nov 21 1,196,566 1,924,349 3,120,915 148,615Dec 21 881,552 1,189,452 2,071,004 98,619Total 252 13,754,544 19,515,897 33,270,441 132,026
C2 Exchange Traded Funds Open Interest and Dollar Volume
Month Call Put Total Call Put TotalJan 21,087,604 34,963,609 56,051,213 $61,769,043 $78,821,255 $140,590,298Feb 25,423,559 39,007,476 64,431,035 $58,079,639 $71,821,093 $129,900,732Mar 27,730,168 41,001,148 68,731,316 $105,511,477 $135,214,361 $240,725,838Apr 28,169,206 42,578,713 70,747,919 $84,894,939 $101,645,181 $186,540,120May 29,536,458 45,204,561 74,741,019 $118,125,853 $166,902,161 $285,028,014Jun 30,619,298 45,776,289 76,395,587 $147,955,355 $220,702,099 $368,657,454Jul 30,714,885 46,942,279 77,657,164 $157,938,767 $219,491,490 $377,430,257Aug 38,582,302 55,706,043 94,288,345 $388,988,678 $501,741,974 $890,730,652Sep 37,246,697 52,828,023 90,074,720 $294,538,539 $325,799,693 $620,338,232Oct 35,527,624 47,670,641 83,198,265 $298,356,215 $307,323,569 $605,679,784Nov 35,484,731 49,329,881 84,814,612 $175,333,097 $243,223,204 $418,556,301Dec 30,530,147 39,497,330 70,027,477 $103,976,627 $128,934,342 $232,910,969Total -- -- -- $1,995,468,229 $2,501,620,422 $4,497,088,651
Contract Volume
Open Interest in Contracts Dollar Volume
CBOE HOLDINGS, INC. Page 129 2011 MARKET STATISTICS
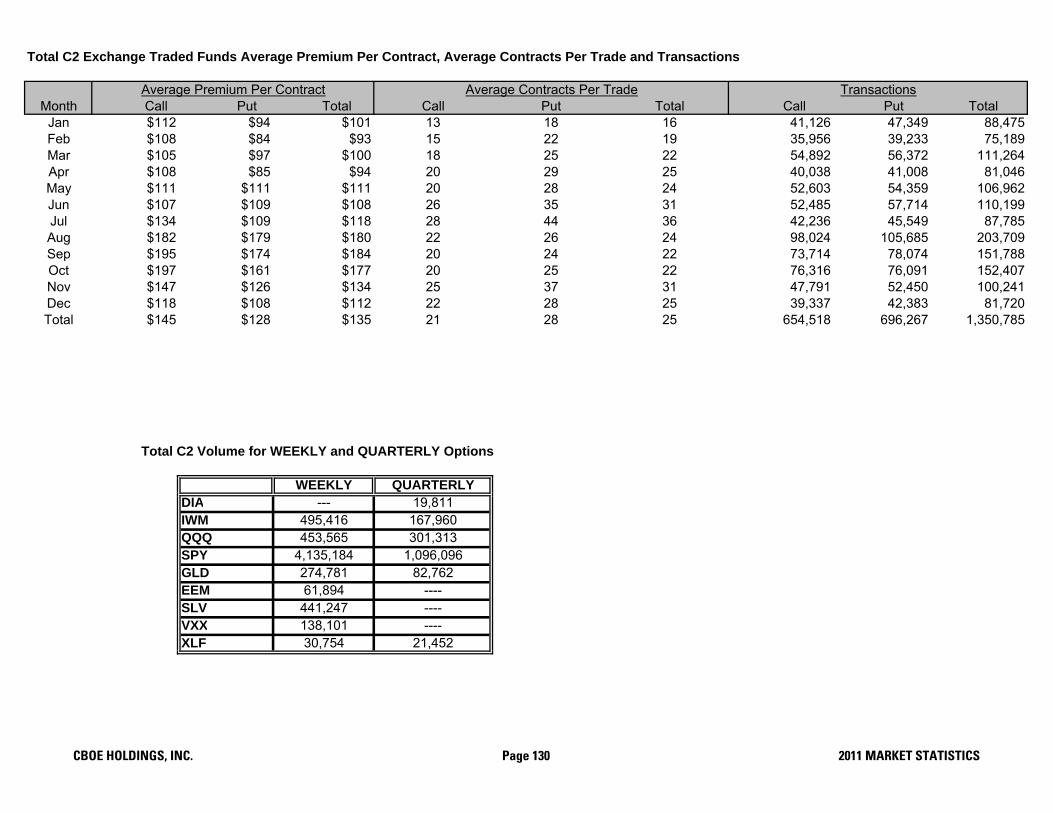
Total C2 Exchange Traded Funds Average Premium Per Contract, Average Contracts Per Trade and Transactions
Month Call Put Total Call Put Total Call Put TotalJan $112 $94 $101 13 18 16 41,126 47,349 88,475Feb $108 $84 $93 15 22 19 35,956 39,233 75,189Mar $105 $97 $100 18 25 22 54,892 56,372 111,264Apr $108 $85 $94 20 29 25 40,038 41,008 81,046May $111 $111 $111 20 28 24 52,603 54,359 106,962Jun $107 $109 $108 26 35 31 52,485 57,714 110,199Jul $134 $109 $118 28 44 36 42,236 45,549 87,785Aug $182 $179 $180 22 26 24 98,024 105,685 203,709Sep $195 $174 $184 20 24 22 73,714 78,074 151,788Oct $197 $161 $177 20 25 22 76,316 76,091 152,407Nov $147 $126 $134 25 37 31 47,791 52,450 100,241Dec $118 $108 $112 22 28 25 39,337 42,383 81,720Total $145 $128 $135 21 28 25 654,518 696,267 1,350,785
WEEKLY QUARTERLYDIA --- 19,811IWM 495,416 167,960QQQ 453,565 301,313SPY 4,135,184 1,096,096GLD 274,781 82,762EEM 61,894 ----SLV 441,247 ----VXX 138,101 ----XLF 30,754 21,452
Average Premium Per Contract Average Contracts Per Trade
Total C2 Volume for WEEKLY and QUARTERLY Options
Transactions
CBOE HOLDINGS, INC. Page 130 2011 MARKET STATISTICS

QQQ (PowerShares QQQ) Contract Volume (includes LEAPS)
Trading Average DailyMonth Days Call Put Total Volume
Jan 20 63,698 122,750 186,448 9,322Feb 19 47,803 85,452 133,255 7,013Mar 23 120,695 184,619 305,314 13,275Apr 20 64,568 94,219 158,787 7,939May 21 55,513 91,405 146,918 6,996Jun 22 89,080 163,885 252,965 11,498Jul 20 79,715 141,039 220,754 11,038Aug 23 121,396 169,165 290,561 12,633Sep 21 106,024 134,431 240,455 11,450Oct 21 88,061 124,239 212,300 10,110Nov 21 109,015 167,132 276,147 13,150Dec 21 95,193 121,965 217,158 10,341Total 252 1,040,761 1,600,301 2,641,062 10,480
QQQ (PowerShares QQQ) Open Interest and Dollar Volume (includes LEAPS)
Month Call Put Total Call Put TotalJan 1,423,951 2,806,024 4,229,975 $5,955,308 $8,148,170 $14,103,478Feb 1,404,124 2,747,119 4,151,243 $4,271,468 $4,995,145 $9,266,613Mar 1,751,292 3,202,670 4,953,962 $9,311,094 $12,128,711 $21,439,805Apr 1,651,045 2,549,998 4,201,043 $6,691,920 $6,391,837 $13,083,757May 1,506,526 2,694,765 4,201,291 $3,572,513 $5,995,926 $9,568,439Jun 1,898,540 2,754,818 4,653,358 $6,472,132 $10,456,242 $16,928,374Jul 1,681,858 2,781,184 4,463,042 $5,312,286 $8,414,504 $13,726,790Aug 2,421,099 3,373,337 5,794,436 $13,382,956 $17,728,308 $31,111,264Sep 2,287,213 3,744,308 6,031,521 $13,741,791 $15,575,380 $29,317,171Oct 1,927,306 2,741,162 4,668,468 $13,731,180 $13,988,411 $27,719,591Nov 1,993,897 2,860,968 4,854,865 $9,554,396 $15,960,104 $25,514,500Dec 1,607,500 2,136,421 3,743,921 $5,669,529 $7,595,768 $13,265,297Total -- -- -- $97,666,573 $127,378,506 $225,045,079
Dollar VolumeOpen Interest in Contracts
Contract Volume
CBOE HOLDINGS, INC. Page 131 2011 MARKET STATISTICS

QQQ (PowerShares QQQ) Average Premium Per Contract, Average Contracts Per Trade and Transactions (includes LEAPS)
Month Call Put Total Call Put Total Call Put TotalJan $93 $66 $76 19 26 23 3,343 4,754 8,097Feb $89 $58 $70 21 28 25 2,264 3,095 5,359Mar $77 $66 $70 31 39 35 3,950 4,764 8,714Apr $104 $68 $82 40 46 43 1,634 2,033 3,667May $64 $66 $65 54 63 59 1,028 1,461 2,489Jun $73 $64 $67 56 63 61 1,587 2,587 4,174Jul $67 $60 $62 52 61 57 1,542 2,322 3,864Aug $110 $105 $107 32 34 33 3,796 4,934 8,730Sep $130 $116 $122 29 29 29 3,708 4,632 8,340Oct $156 $113 $131 26 31 29 3,335 3,956 7,291Nov $88 $95 $92 48 59 54 2,275 2,835 5,110Dec $60 $62 $61 64 70 67 1,484 1,749 3,233Total $94 $80 $85 35 41 38 29,946 39,122 69,068
Average Premium Per Contract Average Contracts Per Trade Transactions
CBOE HOLDINGS, INC. Page 132 2011 MARKET STATISTICS

DIA (DIAMONDS) Contract Volume (includes LEAPS)
Trading Average DailyMonth Days Call Put Total Volume
Jan 20 8,884 14,075 22,959 1,148Feb 19 8,994 12,734 21,728 1,144Mar 23 12,770 16,192 28,962 1,259Apr 20 10,144 11,052 21,196 1,060May 21 9,237 10,940 20,177 961Jun 22 11,180 8,987 20,167 917Jul 20 5,861 5,924 11,785 589Aug 23 14,680 9,112 23,792 1,034Sep 21 6,630 8,480 15,110 720Oct 21 6,113 8,801 14,914 710Nov 21 4,864 5,529 10,393 495Dec 21 7,371 8,087 15,458 736Total 252 106,728 119,913 226,641 899
DIA (DIAMONDS) Open Interest and Dollar Volume (includes LEAPS)
Month Call Put Total Call Put TotalJan 306,687 392,844 699,531 $1,112,067 $1,472,417 $2,584,484Feb 306,956 401,385 708,341 $1,268,695 $1,350,370 $2,619,065Mar 316,775 346,967 663,742 $1,922,596 $2,263,534 $4,186,130Apr 346,769 351,110 697,879 $1,320,942 $1,182,563 $2,503,505May 328,314 356,933 685,247 $1,319,666 $1,689,660 $3,009,326Jun 308,786 342,374 651,160 $1,721,254 $1,481,159 $3,202,413Jul 329,056 348,343 677,399 $1,012,173 $915,012 $1,927,185Aug 397,229 423,990 821,219 $3,573,912 $2,984,610 $6,558,522Sep 360,360 411,389 771,749 $1,370,460 $2,243,038 $3,613,498Oct 308,803 374,716 683,519 $1,999,793 $2,360,081 $4,359,874Nov 353,162 423,359 776,521 $1,206,227 $1,417,738 $2,623,965Dec 323,605 440,922 764,527 $1,463,696 $1,479,389 $2,943,085Total -- -- -- $19,291,481 $20,839,571 $40,131,052
Contract Volume
Open Interest in Contracts Dollar Volume
CBOE HOLDINGS, INC. Page 133 2011 MARKET STATISTICS

DIA (DIAMONDS) Average Premium Per Contract, Average Contracts Per Trade and Transactions (includes LEAPS)
Month Call Put Total Call Put Total Call Put TotalJan $125 $105 $113 9 10 10 964 1,392 2,356Feb $141 $106 $121 9 9 9 993 1,434 2,427Mar $151 $140 $145 8 8 8 1,603 1,914 3,517Apr $130 $107 $118 9 9 9 1,128 1,226 2,354May $143 $154 $149 10 11 11 882 961 1,843Jun $154 $165 $159 11 10 11 994 914 1,908Jul $173 $154 $164 8 9 9 691 684 1,375Aug $243 $328 $276 9 7 8 1,606 1,330 2,936Sep $207 $265 $239 7 7 7 959 1,225 2,184Oct $327 $268 $292 8 9 9 725 969 1,694Nov $248 $256 $252 8 9 9 591 608 1,199Dec $199 $183 $190 8 10 9 876 813 1,689Total $181 $174 $177 9 9 9 12,012 13,470 25,482
TransactionsAverage Premium Per Contract Average Contracts Per Trade
CBOE HOLDINGS, INC. Page 134 2011 MARKET STATISTICS

SPY (S&P Depositary Receipts) Contract Volume (includes LEAPS and FLEX)
Trading Average DailyMonth Days Call Put Total Volume
Jan 20 194,559 369,491 564,050 28,203Feb 19 197,097 457,595 654,692 34,457Mar 23 452,473 780,811 1,233,284 53,621Apr 20 351,924 705,265 1,057,189 52,859May 21 448,008 777,845 1,225,853 58,374Jun 22 813,297 1,282,125 2,095,422 95,246Jul 20 716,372 1,438,518 2,154,890 107,745Aug 23 1,299,052 1,861,584 3,160,636 137,419Sep 21 906,693 1,190,831 2,097,524 99,882Oct 21 841,643 1,194,119 2,035,762 96,941Nov 21 681,085 1,258,684 1,939,769 92,370Dec 21 457,557 705,104 1,162,661 55,365Total 252 7,359,760 12,021,972 19,381,732 76,912
SPY (S&P Depositary Receipts) Open Interest and Dollar Volume (includes LEAPS and FLEX)
Month Call Put Total Call Put TotalJan 4,068,194 10,530,130 14,598,324 $27,783,419 $38,041,066 $65,824,485Feb 4,802,689 11,578,340 16,381,029 $23,062,415 $39,157,515 $62,219,930Mar 5,455,014 12,156,840 17,611,854 $51,370,493 $83,959,974 $135,330,467Apr 5,423,943 12,121,460 17,545,403 $34,586,901 $57,187,649 $91,774,550May 5,169,027 13,048,160 18,217,187 $53,613,202 $71,906,084 $125,519,286Jun 6,019,858 14,953,720 20,973,578 $93,769,494 $148,082,260 $241,851,754Jul 5,644,782 15,350,070 20,994,852 $113,018,510 $173,508,669 $286,527,179Aug 8,026,954 17,815,280 25,842,234 $256,232,797 $361,450,896 $617,683,693Sep 8,088,170 17,481,620 25,569,790 $209,913,121 $228,314,202 $438,227,323Oct 6,430,300 14,690,230 21,120,530 $205,813,991 $208,461,463 $414,275,454Nov 6,771,483 14,317,810 21,089,293 $104,875,135 $158,372,231 $263,247,366Dec 6,015,961 11,565,540 17,581,501 $52,604,629 $73,062,289 $125,666,918Total -- -- -- $1,226,644,107 $1,641,504,298 $2,868,148,405
Open Interest in Contracts
Contract Volume
Dollar Volume
CBOE HOLDINGS, INC. Page 135 2011 MARKET STATISTICS
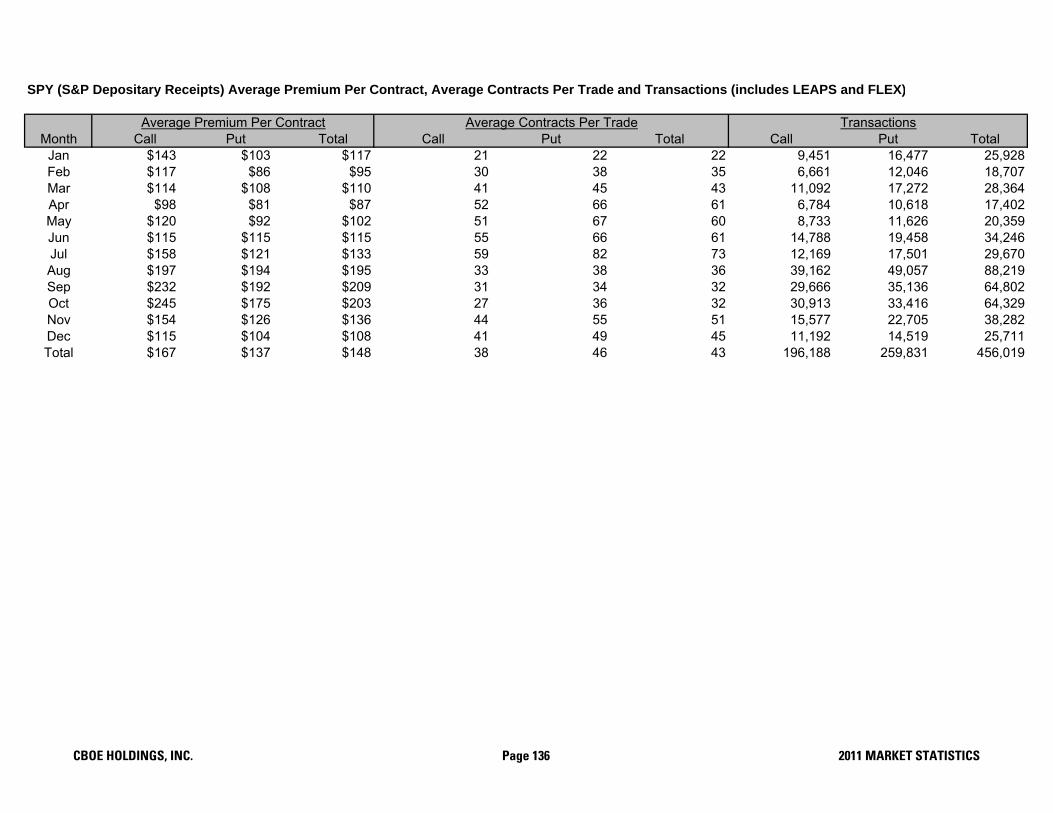
SPY (S&P Depositary Receipts) Average Premium Per Contract, Average Contracts Per Trade and Transactions (includes LEAPS and FLEX)
Month Call Put Total Call Put Total Call Put TotalJan $143 $103 $117 21 22 22 9,451 16,477 25,928Feb $117 $86 $95 30 38 35 6,661 12,046 18,707Mar $114 $108 $110 41 45 43 11,092 17,272 28,364Apr $98 $81 $87 52 66 61 6,784 10,618 17,402May $120 $92 $102 51 67 60 8,733 11,626 20,359Jun $115 $115 $115 55 66 61 14,788 19,458 34,246Jul $158 $121 $133 59 82 73 12,169 17,501 29,670Aug $197 $194 $195 33 38 36 39,162 49,057 88,219Sep $232 $192 $209 31 34 32 29,666 35,136 64,802Oct $245 $175 $203 27 36 32 30,913 33,416 64,329Nov $154 $126 $136 44 55 51 15,577 22,705 38,282Dec $115 $104 $108 41 49 45 11,192 14,519 25,711Total $167 $137 $148 38 46 43 196,188 259,831 456,019
TransactionsAverage Premium Per Contract Average Contracts Per Trade
CBOE HOLDINGS, INC. Page 136 2011 MARKET STATISTICS

IWM (iShares Russell 2000 Index Fund) Contract Volume (includes LEAPS)
Trading Average DailyMonth Days Call Put Total Volume
Jan 20 49,802 118,199 168,001 8,400Feb 19 44,928 109,535 154,463 8,130Mar 23 73,888 146,273 220,161 9,572Apr 20 56,237 130,548 186,785 9,339May 21 72,516 144,676 217,192 10,342Jun 22 91,218 181,532 272,750 12,398Jul 20 71,039 146,643 217,682 10,884Aug 23 138,656 204,086 342,742 14,902Sep 21 76,450 142,900 219,350 10,445Oct 21 75,817 138,268 214,085 10,195Nov 21 70,659 203,636 274,295 13,062Dec 21 41,838 93,112 134,950 6,426Total 252 863,048 1,759,408 2,622,456 10,407
IWM (iShares Russell 2000 Index Fund) Open Interest and Dollar Volume (includes LEAPS)
Month Call Put Total Call Put TotalJan 1,419,417 3,439,328 4,858,745 $5,816,352 $12,700,451 $18,516,803Feb 1,625,597 4,293,418 5,919,015 $5,706,650 $10,195,559 $15,902,209Mar 1,527,053 4,498,226 6,025,279 $7,206,928 $15,291,226 $22,498,154Apr 1,432,241 4,361,235 5,793,476 $5,517,674 $13,510,674 $19,028,348May 1,565,019 4,372,520 5,937,539 $9,466,821 $17,812,234 $27,279,055Jun 1,892,072 4,805,361 6,697,433 $8,852,133 $20,913,729 $29,765,862Jul 1,864,837 5,219,331 7,084,168 $7,399,745 $14,448,886 $21,848,631Aug 2,264,952 5,557,130 7,822,082 $20,292,132 $39,589,886 $59,882,018Sep 1,853,784 4,903,182 6,756,966 $12,100,819 $23,395,946 $35,496,765Oct 1,795,715 3,733,705 5,529,420 $15,911,708 $25,225,498 $41,137,206Nov 1,368,777 3,247,509 4,616,286 $11,316,574 $28,000,977 $39,317,551Dec 1,145,866 2,623,604 3,769,470 $6,960,418 $11,835,386 $18,795,804Total -- -- -- $116,547,954 $232,920,452 $349,468,406
Open Interest in Contracts Dollar Volume
Contract Volume
CBOE HOLDINGS, INC. Page 137 2011 MARKET STATISTICS
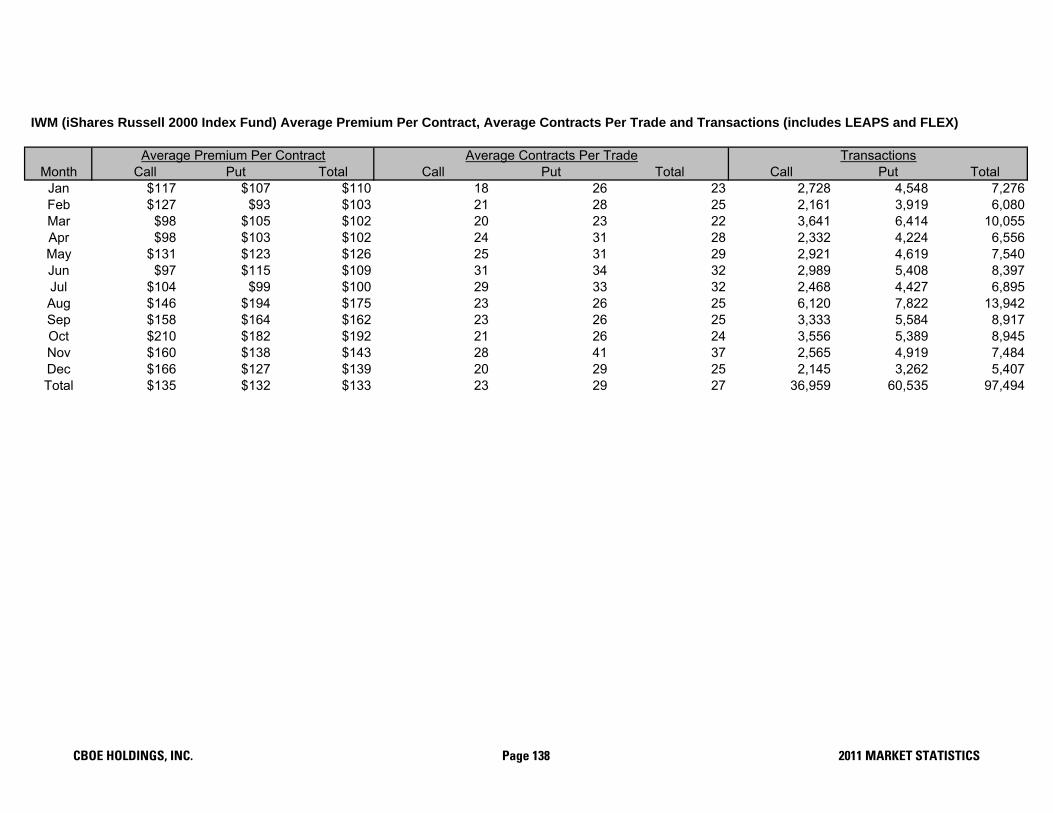
IWM (iShares Russell 2000 Index Fund) Average Premium Per Contract, Average Contracts Per Trade and Transactions (includes LEAPS and FLEX)
Month Call Put Total Call Put Total Call Put TotalJan $117 $107 $110 18 26 23 2,728 4,548 7,276Feb $127 $93 $103 21 28 25 2,161 3,919 6,080Mar $98 $105 $102 20 23 22 3,641 6,414 10,055Apr $98 $103 $102 24 31 28 2,332 4,224 6,556May $131 $123 $126 25 31 29 2,921 4,619 7,540Jun $97 $115 $109 31 34 32 2,989 5,408 8,397Jul $104 $99 $100 29 33 32 2,468 4,427 6,895Aug $146 $194 $175 23 26 25 6,120 7,822 13,942Sep $158 $164 $162 23 26 25 3,333 5,584 8,917Oct $210 $182 $192 21 26 24 3,556 5,389 8,945Nov $160 $138 $143 28 41 37 2,565 4,919 7,484Dec $166 $127 $139 20 29 25 2,145 3,262 5,407Total $135 $132 $133 23 29 27 36,959 60,535 97,494
Average Premium Per Contract Average Contracts Per Trade Transactions
CBOE HOLDINGS, INC. Page 138 2011 MARKET STATISTICS

Other C2 Exchange Traded Funds Contract Volume
Trading Average DailyMonth Days Call Put Total Volume
Jan 20 235,816 213,686 449,502 22,475Feb 19 237,287 193,708 430,995 22,684Mar 23 342,866 270,154 613,020 26,653Apr 20 306,166 258,910 565,076 28,254May 21 482,709 480,104 962,813 45,848Jun 22 381,622 383,018 764,640 34,756Jul 20 307,780 277,945 585,725 29,286Aug 23 564,629 553,647 1,118,276 48,621Sep 21 414,536 392,444 806,980 38,428Oct 21 500,300 440,135 940,435 44,783Nov 21 330,943 289,368 620,311 29,539Dec 21 279,593 261,184 540,777 25,751Total 252 4,384,247 4,014,303 8,398,550 33,328
Other C2 Exchange Traded Funds Open Interest and Dollar Volume
Month Call Put Total Call Put TotalJan 13,869,355 17,795,283 31,664,638 $21,101,897 $18,459,151 $39,561,048Feb 17,284,193 19,987,214 37,271,407 $23,770,411 $16,122,504 $39,892,915Mar 18,680,034 20,796,445 39,476,479 $35,700,366 $21,570,916 $57,271,282Apr 19,315,208 23,194,910 42,510,118 $36,777,502 $23,372,458 $60,149,960May 20,967,572 24,732,183 45,699,755 $50,153,651 $69,498,257 $119,651,908Jun 20,500,042 22,920,016 43,420,058 $37,140,342 $39,768,709 $76,909,051Jul 21,194,352 23,243,351 44,437,703 $31,196,053 $22,204,419 $53,400,472Aug 25,472,068 28,536,306 54,008,374 $95,506,881 $79,988,274 $175,495,155Sep 24,657,170 26,287,524 50,944,694 $57,412,348 $56,271,127 $113,683,475Oct 25,065,500 26,130,828 51,196,328 $60,899,543 $57,288,116 $118,187,659Nov 24,997,412 28,480,235 53,477,647 $48,380,765 $39,472,154 $87,852,919Dec 21,437,215 22,730,843 44,168,058 $37,278,355 $34,961,510 $72,239,865Total -- -- -- $535,318,114 $478,977,595 $1,014,295,709
Contract Volume
Open Interest in Contracts Dollar Volume
CBOE HOLDINGS, INC. Page 139 2011 MARKET STATISTICS

Other C2 Exchange Traded Funds Average Premium Per Contract, Average Contracts Per Trade and Transactions
Month Call Put Total Call Put Total Call Put TotalJan $89 $86 $88 10 11 10 24,640 20,178 44,818Feb $100 $83 $93 10 10 10 23,877 18,739 42,616Mar $104 $80 $93 10 10 10 34,606 26,008 60,614Apr $120 $90 $106 11 11 11 28,160 22,907 51,067May $104 $145 $124 12 13 13 39,039 35,692 74,731Jun $97 $104 $101 12 13 12 32,127 29,347 61,474Jul $101 $80 $91 12 13 13 25,366 20,615 45,981Aug $169 $144 $157 12 13 12 47,340 42,542 89,882Sep $138 $143 $141 11 12 12 36,048 31,497 67,545Oct $122 $130 $126 13 14 13 37,787 32,361 70,148Nov $146 $136 $142 12 14 13 26,783 21,383 48,166Dec $133 $134 $134 12 12 12 23,640 22,040 45,680Total $122 $119 $121 12 12 12 379,413 323,309 702,722
Average Premium Per Contract Average Contracts Per Trade Transactions
Includes EEM, EFA, EWJ, EWT, EWW, EWY, EWZ, FAS, FAZ, FXE, FXI, FXP, GDX, GLD, IYR, KRE, OIH, QID, QLD, SDS, SKF, SLV, SMH, SRS, SSO, TBT, TLT, TZA, UNG, URE, USO, UUP, UYG, VXX, XHB, XLB, XLE, XLF, XLI, XLK, XLP, XLU, XLV, XLY, XME, XOP, XRT
CBOE HOLDINGS, INC. Page 140 2011 MARKET STATISTICS

C2 Other Exchange Traded Funds Contract Volume Detail
Month GDX IYR KRE OIH SMH XHB XLB XLE XLFJan 36,146 2,689 175 7,197 2,884 1,800 5,599 12,324 10,024Feb 25,513 1,714 153 8,630 2,302 1,171 2,350 10,108 6,854Mar 35,544 2,576 92 6,696 4,120 1,435 2,254 13,763 16,501Apr 30,854 1,614 273 6,955 4,425 1,341 2,195 13,143 17,587May 43,600 2,118 87 9,904 3,967 878 6,241 23,942 23,790Jun 37,233 5,010 215 7,595 3,048 1,410 5,711 17,325 37,669Jul 34,995 2,837 192 6,189 2,208 482 2,221 12,863 73,807Aug 39,911 7,201 2,431 9,915 3,586 1,772 5,168 23,505 263,025Sep 58,969 2,641 943 4,873 439 2,664 14,305 226,044Oct 44,608 3,689 741 4,086 1,352 10,677 28,839 286,846Nov 23,172 1,199 52 1,581 565 2,911 14,732 172,020Dec 26,438 2,297 134 1,095 833 3,457 15,300 87,539Total 436,983 35,585 5,488 74,716 26,540 13,478 51,448 200,149 1,221,706
Month XLI XLK XLP XLU XLV XLY XME XOP XRTJan 2,497 2,515 139 636 335 1,196 2,840 296 3,478Feb 1,430 1,050 105 332 350 1,070 1,249 456 2,553Mar 4,217 1,335 176 520 386 1,436 2,911 455 4,982Apr 3,332 1,276 143 620 749 552 1,660 311 4,004May 8,163 492 230 1,642 1,654 415 4,631 695 3,393Jun 4,682 438 387 563 9,992 1,540 3,252 1,314 4,211Jul 5,211 1,360 4,501 278 1,077 1,329 1,860 1,282 2,117Aug 9,276 1,989 1,835 2,391 2,327 2,758 3,642 4,509 7,439Sep 3,438 1,061 371 1,269 1,093 2,174 3,610 2,264 5,933Oct 4,722 3,352 1,400 2,007 962 3,294 3,857 6,401 6,780Nov 2,034 2,150 59 2,438 530 2,069 2,423 2,977 5,844Dec 5,036 2,057 217 3,281 1,482 1,249 2,719 3,043 5,936Total 54,038 19,075 9,563 15,977 20,937 19,082 34,654 24,003 56,670
Month VXXJan 21,711Feb 27,814Mar 37,929Apr 16,610May 22,511Jun 62,035Jul 35,193Aug 69,037Sep 39,157Oct 24,130Nov 38,393Dec 22,832Total 417,352
DOMESTIC SECTOR
DOMESTIC BROAD-BASED
CBOE HOLDINGS, INC. Page 141 2011 MARKET STATISTICS

Month EEM EFA EWJ EWT EWW EWY EWZ FXIJan 39,442 4,305 490 67 1,030 780 10,883 10,443Feb 46,059 1,639 374 198 726 952 12,610 9,011Mar 46,320 12,200 14,940 326 589 953 20,110 8,478Apr 35,726 7,600 8,739 80 144 664 20,725 9,836May 49,644 9,491 2,773 122 978 946 24,510 10,540Jun 49,622 9,627 3,053 92 598 767 25,750 10,059Jul 41,960 7,920 3,381 127 295 557 20,032 10,322Aug 47,126 13,863 3,618 257 706 1,339 30,358 18,541Sep 39,826 14,137 1,498 475 564 936 20,721 12,669Oct 67,992 17,566 1,220 352 870 3,090 21,712 26,426Nov 36,076 15,944 1,226 2,907 448 245 12,986 18,427Dec 28,686 10,852 2,622 1,052 191 326 13,924 9,896Total 528,479 125,144 43,934 6,055 7,139 11,555 234,321 154,648
Month GLD SLV UNG USOJan 87,487 46,488 13,273 21,848Feb 66,893 56,891 9,249 39,270Mar 96,731 100,507 14,214 49,484Apr 95,284 177,640 10,454 23,128May 164,039 416,376 7,294 45,940Jun 145,931 152,287 6,413 65,950Jul 121,698 86,551 4,429 19,019Aug 228,272 97,965 3,574 40,632Sep 103,388 107,899 3,260 17,429Oct 71,996 70,535 4,214 44,579Nov 65,045 52,787 2,274 23,515Dec 91,692 53,085 2,817 41,876Total 1,338,456 1,419,011 81,465 432,670
FOREIGN
COMMODITY POOLS
CBOE HOLDINGS, INC. Page 142 2011 MARKET STATISTICS

Month FAS FAZ FXP QID QLD SDS SKF SRS SSO TBT TZA URE UYGJan 33,369 19,331 505 1,521 629 6,038 1,033 167 11,490 9,105 3,609 145 920Feb 40,324 14,631 239 1,586 550 4,647 240 145 11,071 9,254 2,828 177 1,059Mar 54,076 12,884 510 2,830 1,295 6,310 348 239 10,915 7,323 5,231 126 953Apr 35,431 11,214 155 610 398 2,099 36 95 2,246 5,718 822 71 421May 29,612 11,954 132 431 198 3,166 58 133 4,163 5,489 2,749 84 379Jun 34,713 13,859 771 1,477 782 1,490 492 278 7,813 7,541 5,540 99 1,076Jul 30,333 11,905 305 1,617 378 2,747 343 86 9,072 7,558 4,268 151 565Aug 60,821 17,736 1,189 2,590 643 23,975 1,461 690 15,113 15,922 9,324 145 2,036Sep 49,845 3,845 602 1,174 236 14,672 1,210 536 5,786 6,566 5,314 44 864Oct 61,747 7,163 1,310 1,709 528 29,288 1,402 1,095 12,904 11,347 13,429 84 1,788Nov 17,452 25,891 311 4,501 421 16,305 2,017 313 5,249 3,937 27,507 57 316Dec 8,220 25,428 240 1,825 612 9,113 1,225 381 3,630 7,353 26,010 202 285Total 455,943 175,841 6,269 21,871 6,670 119,850 9,865 4,158 99,452 97,113 106,631 1,385 10,662
Month FXE UUP Month TLTJan 3,297 3,696 Jan 3,630Feb 1,201 2,383 Feb 1,584Mar 1,822 3,434 Mar 2,544Apr 1,441 4,997 Apr 1,658May 3,158 8,788 May 1,313Jun 4,643 3,793 Jun 6,494Jul 2,067 2,241 Jul 5,796Aug 2,405 2,936 Aug 13,322Sep 3,017 5,567 Sep 13,652Oct 4,517 6,492 Oct 17,337Nov 3,050 1,942 Nov 4,013Dec 3,523 2,770 Dec 7,996Total 34,141 49,039 Total 79,339
CURRENCY FIXED INCOME
LEVERAGED & INVERSE
CBOE HOLDINGS, INC. Page 143 2011 MARKET STATISTICS

CBOE HOLDINGS, INC. TRADING ACTIVITYAND MARKET SHARE - 2011
Total Options Contract Volume By Exchange
CBOE C2 Month CBOE C2 AMEX BATS BOX ISE NYSE ARCA PHLX NSDQ TOTAL Market Share Market Share
Jan 102,667,811 3,120,167 45,208,568 5,817,724 12,003,924 66,147,678 42,007,165 83,276,753 18,230,716 378,480,506 27% 0.8%Feb 92,251,088 2,826,654 47,556,064 7,024,638 9,679,351 60,962,016 38,658,491 77,679,313 17,576,621 354,214,236 26% 0.8%Mar 107,417,338 4,126,710 57,290,287 12,054,230 9,990,088 70,541,771 43,532,706 92,250,181 19,985,264 417,188,575 26% 1.0%Apr 86,187,788 3,491,730 47,564,711 11,438,604 8,878,902 58,270,407 33,394,935 70,918,076 15280794 335,425,947 26% 1.0%May 84,157,329 3,915,423 48,067,119 13,487,699 9,002,176 60,599,517 36,594,759 87,437,274 16,049,524 359,310,820 23% 1.1%Jun 94,714,649 4,639,709 50,301,385 15,222,670 8,849,317 60,859,291 40,272,783 84,003,142 14065947 372,928,893 25% 1.2%Jul 86,976,442 4,402,308 46,427,810 14,455,657 11,747,729 57,326,281 36,594,292 77,640,819 12,646,833 348,218,171 25% 1.3%Aug 144,033,629 7,148,635 71,842,697 20,885,535 20,021,674 94,831,634 60,879,998 109,198,697 21,206,908 550,049,407 26% 1.3%Sep 99,446,662 4,800,505 54,566,019 15,196,796 13,068,311 68,820,625 42,171,993 78,118,438 15,057,590 391,246,939 25% 1.2%Oct 99,532,722 5,628,132 56,409,432 14,414,898 13,908,534 72,101,567 42,317,147 69,986,615 16,683,389 390,982,436 25% 1.4%Nov 84,075,142 4,836,046 49,948,704 10,841,782 12,103,038 59,808,169 39,555,900 68,339,517 14,869,012 344,377,310 24% 1.4%Dec 70,602,797 3,882,597 43,550,270 7,498,227 10,426,237 47,817,469 39,363,658 84,636,379 12,547,320 320,324,954 22% 1.2%Total 1,152,063,397 52,818,616 618,733,066 148,338,460 139,679,281 778,086,425 495,343,827 983,485,204 194,199,918 4,562,748,194 25% 1.2%
CBOE pioneered the concepts of listed options in 1973 and remains the largest options exchange. Options volume for stocks listed on the CBOE represented 20% and on C2 represented 0.8% of all equity options trading in 2011. At year-end there were 2,795 listed equity options on CBOE and 307 on C2.
CBOE C2Month CBOE C2 AMEX BATS BOX ISE NYSE ARCA PHLX NSDQ TOTAL Market Share Market Share
Jan 57,979,927 1,729,207 30,433,585 3,736,396 9,276,625 42,978,337 27,709,490 60,336,897 12,951,522 247,131,986 23% 0.7%Feb 49,216,720 1,431,521 30,664,207 4,428,447 7,432,441 37,635,708 22,654,668 53,956,690 11,918,311 219,338,713 22% 0.7%Mar 49,369,929 1,725,969 34,253,742 7,718,295 7,136,286 40,881,315 23,818,203 51,256,505 11,884,662 228,044,906 22% 0.8%Apr 42,103,823 1,502,697 30,168,004 7,606,194 6,338,488 35,525,539 20,800,644 47,213,288 9172346 200,431,023 21% 0.7%May 38,441,170 1,342,470 27,264,467 7,826,099 5,972,381 35,187,825 19,879,958 58,909,719 8,267,316 203,091,405 19% 0.7%Jun 37,338,073 1,233,765 27,309,772 8,882,464 5,795,765 32,929,903 20,873,680 46,533,959 6,837,444 187,734,825 20% 0.7%Jul 36,673,066 1,211,472 27,558,120 9,138,041 7,535,430 32,226,992 21,147,273 47,339,053 6,704,326 189,533,773 19% 0.6%Aug 49,393,932 2,212,628 36,435,227 10,982,869 11,969,642 45,846,099 28,200,597 54,702,274 9,577,494 249,320,762 20% 0.9%Sep 35,019,922 1,421,086 28,648,366 8,597,811 7,583,836 33,759,766 20,599,605 36,270,999 7,294,370 179,195,761 20% 0.8%Oct 38,681,392 2,110,354 31,918,903 8,708,385 8,704,863 37,408,136 22,954,293 37,743,354 8,730,373 196,960,053 20% 1.1%Nov 33,482,807 1,604,586 26,674,157 6,171,306 7,610,457 31,571,138 23,045,936 41,941,790 7,211,577 179,313,754 19% 0.9%Dec 29,205,022 1,706,134 25,310,302 4,711,207 6,599,916 24,696,870 25,822,740 54,270,474 6,341,778 178,664,443 16% 1.0%Total 496,905,783 19,231,889 356,638,852 88,507,514 91,956,130 430,647,628 277,507,087 590,475,002 106,891,519 2,458,761,404 20% 0.8%
Cleared Total Options Volume
Total Equity Options Contract Volume By Exchange
Cleared Equity Options Volume
CBOE HOLDINGS, INC. Page 144 2011 MARKET STATISTICS

Total Exchange Traded Funds Contract Volume By Exchange
CBOE C2Month CBOE C2 AMEX BATS BOX ISE NYSE Arca PHLX NSDQ Total Market Share Market Share
Jan 22,203,780 1,390,960 14,648,301 2,081,328 2,718,427 22,479,600 14,206,565 22,664,335 5,270,232 107,663,528 21% 1%Feb 22,030,406 1,395,133 16,695,120 2,596,191 2,237,683 22,623,724 15,948,366 23,448,123 5,648,950 112,623,696 20% 1%Mar 28,850,075 2,400,741 22,781,620 4,335,935 2,843,820 28,734,569 19,618,027 40,508,320 8,084,713 158,157,820 18% 2%Apr 24,104,088 1,989,033 17,228,029 3,832,410 2,533,748 22,010,665 12,490,076 23,386,263 6,097,532 113,671,844 21% 2%May 24,120,756 2,572,953 20,596,337 5,661,600 3,023,383 24,636,542 16,578,042 28,127,190 7,768,602 133,085,405 18% 2%Jun 28,744,598 3,405,944 22,801,956 6,340,206 3,047,393 27,033,375 19,315,425 36,893,530 7,213,336 154,795,763 19% 2%Jul 24,364,933 3,190,836 18,739,790 5,317,616 4,205,000 24,318,156 15,368,833 29,826,751 5,921,953 131,253,868 19% 2%Aug 48,791,526 4,936,007 35,153,313 9,902,666 8,034,037 47,962,385 32,476,335 53,757,270 11,613,431 252,626,970 19% 2%Sep 34,441,268 3,379,419 25,677,820 6,598,985 5,470,924 34,501,382 21,425,025 41,376,520 7,751,375 180,622,718 19% 2%Oct 31,552,557 3,417,496 24,100,295 5,706,513 5,195,210 34,243,521 19,268,277 31,699,515 7,937,684 163,121,068 19% 2%Nov 24,953,058 3,120,915 22,994,047 4,670,476 4,483,991 27,949,122 16,412,832 25,953,125 7,645,818 138,183,384 18% 2%Dec 20,923,333 2,071,004 18,085,037 2,787,020 3,821,844 22,869,781 13,437,550 29,845,567 6,195,925 120,037,061 17% 2%Total 335,080,378 33,270,441 259,501,665 59,830,946 47,615,460 339,362,822 216,545,353 387,486,509 87,149,551 1,765,843,125 19% 2%
Total Cash Index Options Contract Volume By Exchange
CBOE C2Month CBOE C2 AMEX BOX ISE NYSE ARCA PHLX NSDAQ Total Market Share Market Share
Jan 22,484,103 126,682 8,872 689,741 91,110 275,521 8,962 23,684,991 95%Feb 21,003,954 196,737 9,227 702,584 55,457 274,500 9,360 22,251,819 94%Mar 29,197,334 254,925 9,982 925,887 96,476 485,356 15,889 30,985,849 94%Apr 19,979,877 168,678 6,666 734,203 104,215 318,525 10,916 21,323,080 94%May 21,595,396 206,315 6,412 775,150 136,759 400,365 13,606 23,134,003 93%Jun 28,631,968 189,657 6,159 896,013 83,678 575,653 15,167 30,398,295 94%Jul 25,938,390 129,900 7,299 781,133 78,186 475,015 20,554 27,430,477 95%Aug 45,848,161 254,157 17,995 1,023,150 203,066 739,153 15,983 48,101,665 95%Sep 29,985,432 239,833 13,551 559,477 147,363 470,919 11,845 31,428,420 95%Oct 29,298,773 100,282 390,234 8,461 449,910 94,577 543,746 15,332 30,901,315 95% 0.3%Nov 25,639,275 110,545 280,500 8,590 287,909 97,132 444,602 11,617 26,880,170 95% 0.4%Dec 20,474,442 105,459 154,931 4,477 250,818 103,368 520,338 9,617 21,623,450 95% 0.5%Total 320,077,105 316,286 2,592,549 107,691 8,075,975 1,291,387 5,523,693 158,848 338,143,534 95% 0.1%
Total Other CBOE Options Contract Volume (CEBOs and Interest Rate)
MonthJan 1Feb 8Mar 0Apr 0May 7Jun 10Jul 53Aug 10Sep 40Oct 0Nov 2Dec 0Total 131
Cleared Exchange Traded Funds Option Volume
Cleared Other Options VolumeCBOE
Cleared Cash Index Options Volume
CBOE HOLDINGS, INC. Page 145 2011 MARKET STATISTICS

CBOE HOLDINGS HISTORICAL TRADING ACTIVITY -- ALL OPTIONS
Total CBOE Options Contract VolumeOn April 26, 1973, CBOE began trading call options. Put option trading was introduced on June 3, 1977.
Average DailyYear Total Call Put Volume2011 1,152,063,397 577,092,395 574,971,002 4,571,6802010 1,115,491,922 592,491,518 523,000,404 4,426,5552009 1,134,764,209 611,725,019 523,039,190 4,503,0332008 1,193,355,070 587,004,744 606,350,326 4,716,8182007 944,471,924 469,655,277 474,816,647 3,762,8362006 674,735,348 354,565,882 320,169,466 2,688,1892005 468,249,301 247,513,759 220,735,542 1,858,1322004 361,086,774 198,190,521 162,896,253 1,432,8842003 283,946,495 160,336,098 123,610,397 1,126,7722002 267,616,496 148,507,315 119,109,181 1,061,9702001 306,667,851 117,139,776 189,528,075 1,236,5642000 326,359,531 208,792,580 117,566,951 1,295,0781999 254,331,851 162,166,675 92,165,176 1,009,2531998 206,865,991 122,657,327 84,208,664 820,8971997 187,243,741 112,221,858 75,021,883 740,0941996 173,944,877 100,208,882 73,735,995 684,8221995 178,533,465 100,046,756 78,486,709 708,4661994 183,934,483 98,922,516 85,011,967 729,8991993 140,348,955 79,695,186 60,653,769 554,7391992 121,467,604 68,755,241 52,712,363 478,2191991 121,689,918 70,231,032 51,458,886 480,9881990 129,500,018 73,898,486 55,601,532 511,8581989 126,765,253 79,781,447 46,983,806 503,0371988 111,760,234 70,784,062 40,976,172 441,8341987 182,112,636 115,238,100 66,874,536 719,8131986 180,357,774 114,787,911 65,569,863 712,8771985 148,889,196 100,156,360 48,732,836 590,8301984 123,273,736 78,932,796 44,340,940 487,2481983 82,468,750 57,858,252 24,610,498 325,9631982 75,735,739 50,224,805 25,510,934 299,3511981 57,584,175 40,801,201 16,782,974 277,6051980 52,916,921 42,941,970 9,974,951 209,1581979 35,379,600 30,123,005 5,256,595 139,8401978 34,277,350 30,298,133 3,979,217 136,0211977 24,838,632 23,581,254 1,257,378 98,5661976 21,498,027 21,498,027 84,9721975 14,431,023 14,431,023 57,0401974 5,682,907 5,682,907 22,4621973 1,119,177 1,119,177 6,469
Contract Volume
CBOE HOLDINGS, INC. Page 146 2011 MARKET STATISTICS

Total CBOE Options Year-end Open Interest and Dollar Volume
Year Total Call Put Total Call Put2011 287,097,587 153,763,441 133,334,146 $698,406,153 $331,057,741 $367,348,4122010 294,435,762 155,064,130 139,371,632 $599,332,339 $298,782,674 $300,549,6652009 268,233,481 141,397,911 126,835,570 $638,871,408 $324,804,266 $314,067,1412008 246,726,010 141,588,920 105,137,090 $969,149,693 $359,915,472 $609,234,2212007 277,987,145 146,952,723 131,034,422 $609,419,047 $311,548,311 $297,870,7362006 226,402,102 121,058,989 105,343,113 $311,676,396 $176,160,342 $135,516,0542005 180,546,883 96,452,688 84,094,195 $202,670,123 $112,617,864 $90,052,2592004 154,632,839 81,910,271 72,722,568 $165,796,951 $90,967,813 $74,829,1382003 126,320,572 68,527,351 57,793,221 $148,353,167 $83,446,496 $64,906,6702002 93,472,074 56,719,928 36,752,146 $151,870,740 $63,760,762 $88,109,9782001 81,906,961 51,447,344 30,459,617 $195,013,480 $83,694,213 $111,319,2672000 53,264,239 33,792,832 19,471,407 $324,433,366 $174,504,703 $149,928,6631999 47,549,070 28,187,566 19,361,504 $243,893,100 $162,688,061 $81,205,0391998 19,790,701 11,816,164 7,974,537 $175,124,363 $104,655,792 $70,468,5711997 15,701,630 9,414,828 6,286,802 $145,939,880 $94,343,229 $51,596,6511996 11,596,228 6,869,206 4,727,022 $103,556,272 $68,617,768 $34,938,5041995 10,065,868 5,872,728 4,193,140 $82,499,796 $58,040,292 $24,459,5041994 8,894,266 5,374,500 3,519,766 $67,165,498 $35,881,208 $31,284,2901993 7,831,078 4,795,017 3,036,061 $45,924,523 $28,424,080 $17,500,4231992 5,671,591 3,517,562 2,154,029 $44,499,077 $26,972,202 $17,526,8751991 4,562,642 2,679,410 1,883,232 $50,715,972 $33,414,169 $17,301,8031990 3,753,880 2,304,291 1,449,589 $55,362,874 $29,736,100 $25,626,7741989 3,956,914 2,689,478 1,267,436 $47,312,286 $33,014,811 $14,297,4751988 3,596,163 2,453,502 1,142,661 $39,708,577 $25,515,571 $14,193,0061987 3,773,540 2,863,162 910,378 $76,910,854 $50,403,786 $26,507,0681986 4,845,869 3,426,893 1,418,976 $55,902,000 $39,952,000 $15,950,0001985 5,444,817 3,788,635 1,656,182 $38,430,000 $29,645,000 $8,785,0001984 4,198,005 3,103,722 1,094,283 $34,367,000 $24,586,000 $9,781,0001983 7,184,514 5,325,649 1,858,865 $39,444,000 $33,397,000 $6,047,0001982 5,610,671 3,884,527 1,726,144 $32,265,764 $25,164,139 $7,101,6251981 4,772,604 3,449,959 1,322,645 $22,433,636 $17,013,970 $5,419,6661980 3,257,364 2,633,312 624,052 $27,893,035 $25,245,995 $2,647,0401979 2,258,529 2,048,463 210,066 $13,858,402 $12,131,512 $1,726,8901978 2,165,894 1,976,022 189,872 $14,403,416 $12,695,972 $17,075,0001977 1,190,636 1,831,806 128,830 $7,996,670 $7,507,300 $489,3701976 1,519,852 1,519,852 $9,039,670 $9,039,5661975 1,190,085 1,190,085 $6,443,327 $6,443,3271974 543,703 543,703 $1,657,652 $1,657,6521973 242,825 242,825 $449,615 $449,615
Open Interest Dollar Volume (thousands)
CBOE HOLDINGS, INC. Page 147 2011 MARKET STATISTICS

Total CBOE Options Average Premium Per Contract and Average Contracts Per Trade
Year Total Call Put Total Call Put2011 $606 $574 $639 20.9 17.9 25.02010 $537 $504 $575 20.4 17.8 24.42009 $563 $531 $600 19.2 17.0 22.72008 $812 $613 $1,005 19.9 16.9 24.12007 $645 $663 $627 20.0 16.0 26.72006 $462 $497 $423 18.1 15.0 23.42005 $433 $455 $408 19.3 16.0 25.12004 $459 $459 $459 19.5 16.6 25.12003 $522 $520 $525 18.3 16.0 22.42002 $567 $429 $740 17.1 15.7 19.22001 $636 $714 $588 16.2 9.4 29.02000 $994 $836 $1,275 12.3 11.0 15.51999 $959 $1,003 $881 11.5 10.3 14.31998 $847 $853 $837 12.9 11.3 16.21997 $779 $841 $688 13.0 11.4 16.51996 $595 $685 $474 14.3 12.6 17.51995 $462 $580 $312 16.5 14.5 19.81994 $365 $363 $368 18.6 16.8 21.31993 $327 $357 $289 15.0 13.7 17.31992 $366 $392 $333 13.8 12.7 15.51991 $417 $476 $336 13.4 12.5 14.91990 $428 $402 $461 13.6 13.1 14.31989 $373 $414 $304 12.9 12.1 14.51988 $355 $360 $346 11.7 11.2 12.71987 $422 $437 $396 12.2 11.4 13.71986 $310 $348 $243 12.9 12.2 14.61985 $205 $305 $177 8.7 8.7 8.81984 $318 $346 $240 8.4 8.3 8.61983 $499 $597 $231 7.7 7.8 7.51982 $426 $501 $278 7.4 7.5 7.11981 $390 $417 $323 7.2 7.3 7.01980 $527 $588 $265 6.1 6.0 6.51979 $392 $403 $329 6.0 5.8 7.21978 $420 $419 $429 5.3 5.3 5.71977 $322 $318 $389 5.1 5.1 5.31976 $420 4.11975 $446 3.51974 $294 3.41973 $402 2.6
Average Premium Per Contract Average Contracts Per Trade
CBOE HOLDINGS, INC. Page 148 2011 MARKET STATISTICS

Total CBOE Options Contract Volume -- All Options
YearTotal
VolumeEquity
VolumeCash Index
Volume
Exchange Traded Funds
VolumeT-Bond & T-Note
VolumeInterest Rate
Volume
Foreign CurrencyVolume
CEBOsVolume
2011 1,152,063,397 496,905,783 320,077,105 335,080,378 9 1222010 1,115,491,922 571,281,150 270,006,239 274,202,116 2,4172009 1,134,764,209 634,710,477 222,781,717 277,266,218 5,7972008 1,193,355,070 604,024,956 259,496,193 329,830,388 3,523 102007 944,471,924 500,964,713 230,517,843 212,979,241 10,079 482006 674,735,348 390,657,577 157,575,349 126,481,092 21,3302005 468,249,301 275,646,980 115,657,828 76,878,867 65,6262004 361,086,774 224,316,863 85,420,267 51,259,036 90,6082003 283,946,495 173,033,965 69,675,859 41,146,233 90,4382002 267,616,496 173,207,520 64,003,053 30,362,691 43,2322001 306,667,851 232,851,089 52,009,919 21,767,252 39,5912000 326,359,531 278,585,728 47,397,039 334,664 42,1001999 254,331,851 196,460,578 56,202,470 1,626,247 42,5561998 206,865,991 137,951,223 68,282,088 555,920 76,7601997 187,243,741 116,031,496 71,136,728 75,5171996 173,944,877 88,456,579 85,394,046 94,2521995 178,533,465 77,040,466 101,427,897 65,1021994 183,934,483 68,974,809 114,743,082 216,5921993 140,348,955 58,710,818 81,573,576 64,5611992 121,467,604 44,968,235 76,442,064 57,3051991 121,689,918 45,255,301 76,384,506 76 50,0351990 129,500,018 48,486,402 80,944,668 7,109 61,8391989 126,765,253 61,902,931 64,645,248 144,356 72,7181988 111,784,045 49,393,316 62,250,400 140,3291987 182,112,636 73,315,232 108,352,440 207,476 237,4881986 180,357,774 64,744,167 114,834,854 321,021 457,7321985 148,889,091 57,523,494 90,822,067 415,001 128,5291984 123,273,736 58,674,901 64,356,841 241,9941983 82,468,750 71,695,563 10,662,498 110,6891982 75,735,739 75,721,605 14,1341981 57,584,175 57,584,1751980 52,916,921 52,916,9211979 35,379,600 35,379,6001978 34,277,350 34,277,3501977 24,838,632 24,838,6321976 21,498,027 21,498,0271975 14,431,023 14,431,0231974 5,682,907 5,682,9071973 1,119,177 1,119,177
CBOE HOLDINGS, INC. Page 149 2011 MARKET STATISTICS

Total C2 Options Contract VolumeC2 Options Exchange began trading on October 29, 2010.
Average DailyYear Total Call Put Volume2011 52,818,616 25,140,382 27,678,234 209,5982010 3,610,470 1,848,447 1,762,023 3,610,470
Total C2 Options Year-end Open Interest and Dollar Volume*NOTE-- Open Interest reflects OI for the entire class.
Year Total Call Put Total Call Put2011 222,127,368 118,413,756 103,713,612 $7,959,731 $4,053,704 $3,906,0272010 225,574,085 118,599,733 106,974,352 $497,954 $295,602 $202,353
Total C2 Options Average Premium Per Contract and Average Contracts Per Trade
Year Total Call Put Total Call Put2011 $151 $161 $141 16.9 14.8 19.32010 $138 $160 $115 13.8 12.6 15.3
Total C2 Options Contract Volume -- All Options
YearTotal
VolumeEquity
VolumeCash Index
Volume
Exchange Traded Funds
Volume2011 52,818,616 19,231,889 316,286 33,270,4412010 3,610,470 1,582,764 2,027,706
Contract Volume
Open Interest* Dollar Volume (thousands)
Average Premium Per Contract Average Contracts Per Trade
CBOE HOLDINGS, INC. Page 150 2011 MARKET STATISTICS

Total Options Contract Volume by Exchange
Year CBOE C2 AMEX PHLX NYSE ARCA ISE BOX NSDQ BATS NYSE MSE NASD Total2011 1,152,063,397 52,818,616 618,733,066 983,485,204 495,343,827 778,086,425 139,679,281 194,199,918 148,338,460 4,562,748,1942010 1,115,491,922 3,610,470 440,021,234 846,895,365 488,093,760 745,175,111 91,754,121 142,922,225 25,103,245 3,899,067,4532009 1,134,764,209 248,119,861 606,458,952 421,349,395 960,247,551 137,784,626 103,912,524 3,612,637,1182008 1,193,355,070 207,285,283 547,456,114 416,938,764 1,007,661,590 178,650,541 31,225,219 3,582,572,5812007 944,471,924 240,383,466 407,975,849 335,838,547 804,359,093 129,797,339 2,862,826,2182006 674,735,348 197,045,745 273,128,017 196,586,356 591,961,518 94,390,602 2,027,847,5862005 468,249,301 201,764,835 162,619,052 144,780,498 448,695,669 78,202,185 1,504,311,5402004 361,086,774 202,692,231 133,404,843 103,262,458 360,852,519 20,741,271 1,182,040,0962003 283,946,495 180,074,903 112,705,597 86,152,637 244,979,023 907,858,6552002 267,616,496 186,060,672 88,955,247 85,426,649 152,399,279 780,458,3432001 306,667,851 205,043,075 101,841,724 102,637,138 65,353,969 781,543,7572000 326,359,531 207,726,689 76,549,892 108,541,840 7,565,684 726,743,6361999 254,331,851 129,662,189 48,125,415 75,801,209 507,920,6641998 206,865,991 97,661,673 42,844,295 58,971,239 406,343,1981997 187,243,741 88,107,842 30,364,035 46,686,240 1,421,260 353,823,1181996 173,944,877 61,591,891 21,938,865 33,881,762 3,438,990 294,796,3851995 178,533,465 52,391,899 22,000,030 30,905,131 2,885,698 286,716,2231994 183,934,483 48,505,380 25,704,131 20,929,869 2,300,700 281,374,5631993 140,348,955 47,883,957 25,699,888 16,364,744 2,052,965 232,350,5091992 121,467,604 42,314,942 22,947,867 13,066,618 2,177,041 201,974,0721991 121,689,918 38,805,589 22,365,110 13,852,604 2,059,969 198,773,1901990 129,500,018 40,914,962 22,808,688 13,881,269 2,817,811 209,922,7481989 126,765,253 49,873,264 27,970,765 18,091,434 4,315,944 227,016,6601988 111,784,045 45,022,497 23,165,112 13,349,148 2,627,789 195,948,5911987 182,112,636 70,988,990 29,155,308 19,410,875 3,499,095 305,166,9041986 180,357,774 65,440,500 24,467,468 14,075,872 4,823,782 45,239 289,210,6351985 148,889,091 48,559,122 18,134,575 12,793,451 4,426,855 107,453 232,910,5471984 123,273,736 40,104,605 16,109,050 11,366,056 4,093,816 194,947,2631983 82,468,750 38,967,725 16,808,125 11,155,906 656,480 150,056,9861982 75,735,739 38,790,852 13,466,652 9,309,563 137,302,8061981 57,584,175 34,859,475 10,009,565 6,952,567 109,405,7821980 52,916,921 29,048,323 7,758,101 5,486,590 1,518,611 96,728,5461979 35,379,600 17,467,018 4,952,737 3,856,344 2,609,164 64,264,8631978 34,277,350 14,380,959 3,270,378 3,289,968 2,012,363 57,231,0181977 24,838,632 10,077,578 2,195,307 1,925,031 600,780 39,637,3281976 21,498,027 9,035,767 1,274,702 550,194 15,237 32,373,9271975 14,431,023 3,530,564 140,982 18,102,5691974 5,682,907 5,682,9071973 1,119,177 1,119,177
CBOE HOLDINGS, INC. Page 151 2011 MARKET STATISTICS

HISTORICAL TRADING ACTIVITY-- EQUITY OPTIONS
CBOE Equity Options Contract Volume
Trading Average DailyYear Days Total Call Put Volume2011 252 496,905,783 302,589,878 194,315,905 1,971,8482010 252 571,281,150 361,903,853 209,377,297 2,266,9892009 252 634,710,477 385,177,721 249,532,756 2,518,6922008 253 604,024,956 340,379,270 263,645,686 2,387,4502007 251 500,964,713 303,103,478 197,861,235 1,995,8752006 251 390,657,577 242,452,904 148,204,673 1,556,4052005 252 275,646,980 171,904,795 103,742,185 1,093,8372004 252 224,316,863 144,135,153 80,181,710 890,1462003 252 173,033,965 113,319,401 59,714,564 686,6432002 252 173,207,520 105,620,741 67,586,779 687,3312001 248 232,851,089 83,199,296 149,651,793 938,9162000 252 278,585,728 187,771,263 90,814,465 1,105,4991999 252 196,460,578 137,621,936 58,838,642 779,6051998 252 137,951,223 93,220,846 44,730,377 547,4251997 253 116,031,496 80,677,086 35,354,410 458,6231996 254 88,456,579 62,902,214 25,554,365 348,2541995 252 77,040,466 54,736,660 22,303,806 305,7161994 252 68,974,809 48,113,043 20,861,766 273,7101993 253 58,710,818 41,515,962 17,194,856 232,0591992 254 44,968,235 32,039,653 12,928,582 177,0401991 253 45,255,301 32,055,783 13,199,518 178,8751990 253 48,486,402 34,417,287 14,069,115 191,6461989 252 61,902,931 47,641,419 14,261,512 245,6471988 253 49,393,316 37,904,233 11,489,083 195,2311987 253 73,315,232 56,423,959 16,891,273 289,7841986 253 64,744,167 50,022,504 14,721,663 255,9061985 252 57,523,599 44,008,742 13,514,857 228,2681984 253 58,674,907 42,938,367 15,736,540 231,9171983 253 71,695,563 52,594,594 19,100,969 283,3821982 253 75,721,605 50,214,419 25,507,186 299,2951981 253 57,584,175 40,801,201 16,782,974 277,6051980 253 52,916,921 42,941,970 9,974,951 209,1581979 253 35,379,600 30,123,005 5,256,595 139,8401978 252 34,277,350 30,298,133 3,979,217 136,0211977 252 24,838,632 23,581,254 1,257,378 98,5661976 253 21,498,027 21,498,027 84,9721975 253 14,431,023 14,431,023 57,0401974 253 5,682,907 5,682,907 22,4621973 173 1,119,177 1,119,177 6,469
Contract Volume
CBOE HOLDINGS, INC. Page 152 2011 MARKET STATISTICS

CBOE Equity Options Open Interest and Dollar Volume
TradingYear Days Total Call Put Total Call Put2011 252 198,126,396 114,997,656 83,128,740 $102,652,276 $62,128,925 $40,523,3512010 252 209,185,157 120,446,391 88,738,766 $102,892,319 $63,378,204 $39,514,1152009 252 188,281,057 107,207,719 81,073,338 $111,455,038 $62,936,609 $48,518,4282008 253 187,131,615 112,103,811 75,027,804 $172,277,231 $77,708,400 $94,568,8312007 251 219,737,693 124,228,333 95,509,360 $150,642,889 $104,906,569 $45,736,3202006 251 187,953,281 105,349,889 82,603,392 $99,059,458 $66,499,081 $32,560,3772005 252 151,157,355 83,872,112 67,285,243 $61,225,819 $42,672,371 $18,553,4482004 252 131,498,380 72,327,968 59,170,412 $44,009,316 $30,291,322 $13,717,9942003 252 108,666,567 60,739,426 47,927,141 $34,107,920 $23,358,678 $10,749,2412002 252 81,343,419 50,202,050 31,141,369 $38,561,160 $19,883,468 $18,677,6922001 248 73,887,799 47,364,846 26,522,953 $82,289,683 $36,395,995 $45,893,6882000 252 49,944,375 32,216,400 17,727,975 $193,045,390 $113,149,682 $79,895,7081999 252 43,773,835 26,688,057 17,085,778 $123,162,126 $97,096,772 $26,065,3541998 252 16,238,394 10,310,315 5,928,079 $57,183,718 $41,780,348 $15,403,3701997 253 12,419,614 8,113,173 4,306,441 $41,741,218 $31,378,668 $10,362,5501996 254 9,121,888 6,024,657 3,097,231 $30,022,394 $23,635,014 $6,387,3801995 252 7,350,437 4,865,786 2,484,651 $22,173,991 $17,162,494 $5,011,4971994 252 6,028,581 4,089,047 1,939,534 $17,033,086 $12,044,017 $4,989,0691993 253 5,642,471 3,904,005 1,738,466 $15,135,317 $11,370,936 $3,764,3811992 254 3,781,653 2,705,913 1,075,740 $11,296,632 $8,156,397 $3,140,2361991 253 2,783,155 1,955,738 827,417 $11,463,090 $8,689,214 $2,773,8761990 253 2,459,695 1,731,851 727,844 $12,464,706 $8,886,631 $3,578,0751989 252 2,944,944 2,238,981 705,963 $19,514,223 $15,190,793 $4,323,4301988 253 2,706,148 2,023,117 683,031 $12,012,403 $9,682,054 $2,330,3491987 253 3,027,620 2,463,979 563,641 $25,833,348 $20,551,949 $5,281,3991986 253 3,773,319 2,890,993 882,326 $19,544,336 $16,459,993 $3,094,3431985 252 4,101,981 3,089,567 1,012,414 $15,801,517 $13,415,012 $2,386,5041984 253 3,532,286 2,694,296 837,790 $18,644,743 $14,865,730 $3,779,0131983 253 6,840,625 5,124,492 1,716,133 $35,796,506 $31,388,075 $4,408,4311982 253 5,610,671 3,884,527 1,726,144 $32,265,764 $25,164,139 $7,101,6251981 253 4,772,604 3,449,959 1,322,645 $22,433,636 $17,013,970 $5,419,6661980 253 3,257,364 2,633,312 624,052 $27,893,035 $25,245,995 $2,647,0401979 253 2,258,529 2,048,463 210,066 $13,858,402 $12,131,512 $1,726,8901978 252 2,165,894 1,976,022 189,872 $14,403,416 $12,695,972 $1,707,4441977 252 1,960,636 1,831,806 128,830 $7,996,670 $7,507,300 $489,3701976 253 1,519,852 1,519,852 $9,039,5661975 253 1,190,085 1,190,085 $6,443,3271974 253 543,703 543,703 $1,657,6521973 173 242,825 242,825 $449,615
Open Interest Dollar Volume (thousands)
CBOE HOLDINGS, INC. Page 153 2011 MARKET STATISTICS

CBOE Equity Options Average Premium Per Contract and Average Contracts Per Trade
Year Total Call Put Total Call Put2011 $207 $205 $209 12.9 12.8 13.22010 $180 $175 $189 13.9 13.7 14.12009 $176 $163 $194 13.8 13.2 14.82008 $285 $228 $359 17.0 13.9 23.72007 $301 $346 $231 16.7 13.8 25.02006 $254 $274 $220 15.1 12.6 22.22005 $222 $248 $179 16.4 13.8 23.62004 $196 $210 $171 17.3 14.9 24.32003 $197 $206 $180 16.4 14.7 21.22002 $223 $188 $276 15.8 14.6 18.12001 $353 $513 $327 15.8 7.2 28.22000 $693 $603 $880 11.4 10.4 14.21999 $627 $706 $443 10.2 9.5 12.11998 $415 $448 $344 10.7 9.8 13.01997 $360 $389 $293 10.4 9.7 12.41996 $339 $376 $250 10.4 9.9 11.61995 $288 $314 $225 11.1 10.6 12.51994 $247 $250 $239 12.2 11.9 12.91993 $258 $274 $219 10.4 10.2 11.01992 $251 $255 $243 9.1 9.1 9.31991 $253 $271 $210 9.2 9.0 9.71990 $257 $258 $254 9.5 9.7 9.31989 $315 $319 $303 10.2 10.0 10.81988 $243 $255 $203 8.8 8.8 9.11987 $352 $364 $313 8.6 8.6 8.61986 $302 $329 $210 8.5 8.5 8.41985 $275 $305 $177 8.7 8.7 8.81984 $318 $346 $240 8.4 8.3 8.61983 $499 $597 $231 7.7 7.8 7.51982 $426 $501 $278 7.4 7.5 7.21981 $390 $417 $323 7.2 7.3 7.01980 $527 $588 $265 6.1 6.0 6.51979 $392 $403 $329 6.0 5.8 7.21978 $420 $419 $429 5.3 5.3 5.71977 $322 $318 $389 5.1 5.1 5.31976 $420 $420 4.1 4.11975 $446 $446 3.5 3.51974 $294 $294 3.4 3.41973 $402 $402 2.6 2.6
Average Premium Per Contract Average Contracts Per Trade
CBOE HOLDINGS, INC. Page 154 2011 MARKET STATISTICS

C2 Equity Options Contract Volume
Trading Average DailyYear Days Total Call Put Volume2011 252 19,231,889 11,263,334 7,968,555 76,3172010 44 1,582,764 1,008,164 574,600 35,972
C2 Equity Options Open Interest and Dollar Volume
TradingYear Days Total Call Put Total Call Put2011 252 152,058,318 87,871,687 64,186,631 $3,100,623 $1,864,037 $1,236,5862010 44 161,147,858 93,318,095 67,829,763 $280,621 $192,939 $87,682
C2 Equity Options Average Premium Per Contract and Average Contracts Per Trade
Year Total Call Put Total Call Put2011 $161 $165 $155 11.0 11.0 11.12010 $177 $191 $153 9.9 10.1 9.4
Average Premium Per Contract
Contract Volume
Average Contracts Per Trade
Open Interest Dollar Volume (thousands)
CBOE HOLDINGS, INC. Page 155 2011 MARKET STATISTICS

Equity Options Contract Volume by ExchangeCBOE C2
Cleared Equity Options Volume % Share of % Share ofYear CBOE C2 AMEX PHLX NYSE ARCA ISE BOX NSDQ BATS MSE* NYSE** Total Total Volume Total Volume2011 496,905,783 19,231,889 356,638,852 590,475,002 277,507,087 430,647,628 91,956,130 106,891,519 88,507,514 2,458,761,404 20.2 0.82010 571,281,150 1,582,764 286,077,480 548,861,274 304,747,309 469,905,753 68,164,391 90,250,112 15,155,045 2,356,025,278 24.2 0.12009 634,710,477 166,605,560 427,432,643 271,897,478 672,142,392 74,924,326 52,672,323 2,300,385,199 27.62008 604,024,956 117,745,266 409,003,309 266,142,594 687,799,217 99,654,631 13,135,332 2,197,505,305 27.52007 500,964,713 158,940,325 331,458,236 259,399,433 603,361,649 95,509,373 1,949,633,729 25.72006 390,657,577 141,858,034 231,789,665 168,521,298 484,184,624 77,480,159 1,494,491,357 26.12005 275,646,980 155,020,082 138,878,659 127,621,679 384,016,841 61,318,465 1,142,502,706 24.02004 224,316,863 160,354,728 107,404,566 88,909,404 322,767,111 16,457,048 920,209,720 24.02003 173,033,965 142,184,749 89,060,733 71,112,677 225,829,026 701,221,150 24.72002 173,207,520 145,258,377 78,435,997 71,433,006 140,343,022 608,677,922 28.52001 232,851,089 167,713,954 92,955,040 95,646,008 59,201,203 648,367,294 35.92000 278,585,728 192,032,222 72,135,321 108,533,862 7,565,684 658,852,817 42.31999 196,460,578 126,821,276 44,086,183 75,770,940 443,138,977 44.31998 137,951,223 94,332,281 37,871,930 58,930,521 329,085,955 41.91997 116,031,496 83,926,288 25,021,282 46,606,429 1,413,206 272,998,701 42.51996 88,456,579 57,082,441 16,325,194 33,839,202 3,414,471 199,117,887 44.41995 77,040,466 48,886,858 14,739,706 30,852,968 2,860,273 174,380,271 44.21994 68,974,809 44,810,966 13,016,116 20,861,609 2,269,165 149,932,665 46.01993 58,710,818 43,390,722 11,411,065 16,203,312 2,010,184 131,726,101 44.61992 44,918,235 36,067,822 10,408,628 12,996,923 2,042,844 106,484,452 42.21991 45,255,301 32,829,447 11,803,703 13,781,027 1,901,208 104,850,686 43.21990 48,486,402 34,197,819 12,443,833 13,750,956 2,546,734 111,425,744 43.51989 61,902,931 41,579,453 16,768,793 17,865,387 3,723,184 141,839,748 43.61988 49,393,231 37,470,045 13,092,707 13,068,755 1,902,900 114,927,638 43.01987 73,315,232 52,770,659 18,088,192 18,951,794 1,305,974 164,431,851 44.61986 64,744,167 47,140,205 15,054,738 13,941,683 1,050,152 141,930,945 45.61985 57,523,599 36,099,739 12,068,358 12,700,805 163,593 118,556,094 48.51984 58,674,901 33,076,866 15,982,001 11,191,471 118,925,239 49.31983 71,695,563 36,199,701 16,607,806 11,155,906 135,658,976 52.81982 75,721,605 38,766,996 13,466,652 9,309,563 137,264,816 55.21981 57,584,175 34,859,475 10,009,565 6,952,567 109,405,782 52.61980 52,916,921 29,048,323 7,758,101 5,486,590 1,518,611 96,728,546 54.71979 35,379,600 17,467,018 4,952,737 3,856,344 2,609,164 64,264,863 55.11978 34,277,350 14,380,959 3,270,378 3,289,968 2,012,363 57,231,018 59.91977 24,838,632 10,077,578 2,195,307 1,925,031 600,780 39,637,328 62.71976 21,498,027 9,035,767 1,274,702 550,194 15,237 32,373,927 66.41975 14,431,023 3,530,564 140,982 18,102,569 79.71974 5,682,907 5,682,907 100.01973 1,119,177 1,119,177 100.0
*The Midwest Stock Exchange (presently the Chicago Stock Exchange) options program began in 1976 and was consolidated with the CBOE on June 2, 1980.**The New York Stock Exchange began trading options in June 1985. On April 28, 1997, CBOE assumed all NYSE options business.
CBOE HOLDINGS, INC. Page 156 2011 MARKET STATISTICS

CBOE Equity LEAPS Contract Volume
Trading Average DailyYear Days Total Call Put Volume Total Call Put2009 252 50,333,181 30,547,604 19,785,577 199,735 38,082,002 22,133,107 15,948,8952008 253 44,892,521 26,583,106 18,309,415 177,441 36,740,700 21,935,772 14,804,9282007 251 44,472,769 26,378,831 18,093,938 177,182 53,729,657 29,861,284 23,868,3732006 251 44,657,572 26,971,479 17,686,093 177,919 51,039,824 28,754,537 22,285,2872005 252 37,153,710 20,386,596 16,767,114 147,435 45,169,499 24,466,273 20,703,2262004 252 28,285,579 16,526,854 11,758,725 112,244 41,145,160 21,129,138 20,016,0222003 252 23,177,623 13,389,335 9,788,288 91,975 35,790,932 18,535,560 17,255,3722002 252 21,149,572 12,530,244 8,619,328 83,927 30,405,272 17,362,660 13,042,6122001 248 21,068,576 7,228,812 13,839,764 84,954 17,881,440 11,694,927 6,186,5132000 252 18,320,847 12,913,284 5,407,563 72,702 9,220,251 5,859,826 3,360,4251999 252 12,495,220 8,828,450 3,666,770 49,584 6,331,538 3,738,715 2,592,8231998 252 7,193,811 5,109,298 2,084,513 28,547 2,623,740 1,730,927 892,8131997 253 5,146,780 3,677,210 1,469,570 20,343 1,749,909 1,114,337 635,5721996 254 3,573,877 2,538,756 1,035,121 14,070 2,467,906 841,547 1,626,3591995 252 3,532,779 2,463,099 1,069,680 14,019 1,042,392 665,976 376,4161994 252 2,919,657 2,169,929 749,728 11,586 957,380 618,975 338,4051993 253 2,571,321 1,866,891 704,430 10,163 846,057 543,649 302,4081992 254 1,547,717 1,182,606 365,111 6,093 508,781 365,887 142,8941991 253 625,642 497,984 127,658 2,473 199,109 150,230 48,879
Contract Volume Open Interest
CBOE HOLDINGS, INC. Page 157 2011 MARKET STATISTICS
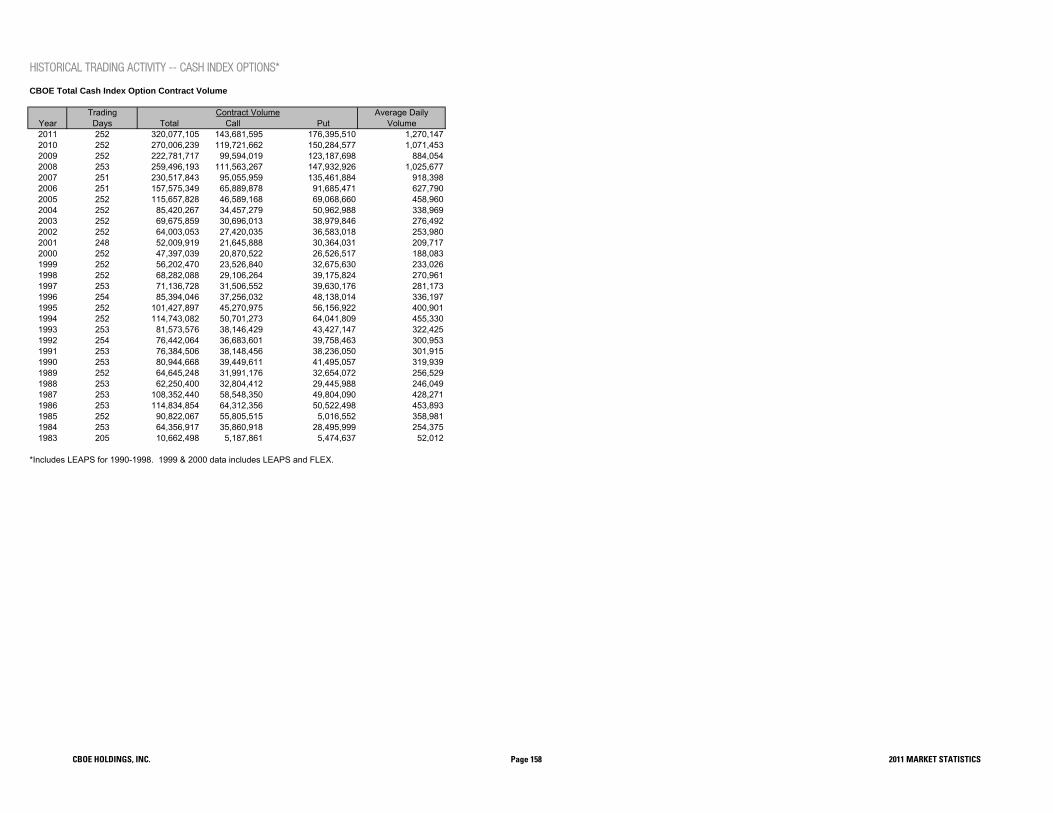
HISTORICAL TRADING ACTIVITY -- CASH INDEX OPTIONS*
CBOE Total Cash Index Option Contract Volume
Trading Average DailyYear Days Total Call Put Volume2011 252 320,077,105 143,681,595 176,395,510 1,270,1472010 252 270,006,239 119,721,662 150,284,577 1,071,4532009 252 222,781,717 99,594,019 123,187,698 884,0542008 253 259,496,193 111,563,267 147,932,926 1,025,6772007 251 230,517,843 95,055,959 135,461,884 918,3982006 251 157,575,349 65,889,878 91,685,471 627,7902005 252 115,657,828 46,589,168 69,068,660 458,9602004 252 85,420,267 34,457,279 50,962,988 338,9692003 252 69,675,859 30,696,013 38,979,846 276,4922002 252 64,003,053 27,420,035 36,583,018 253,9802001 248 52,009,919 21,645,888 30,364,031 209,7172000 252 47,397,039 20,870,522 26,526,517 188,0831999 252 56,202,470 23,526,840 32,675,630 233,0261998 252 68,282,088 29,106,264 39,175,824 270,9611997 253 71,136,728 31,506,552 39,630,176 281,1731996 254 85,394,046 37,256,032 48,138,014 336,1971995 252 101,427,897 45,270,975 56,156,922 400,9011994 252 114,743,082 50,701,273 64,041,809 455,3301993 253 81,573,576 38,146,429 43,427,147 322,4251992 254 76,442,064 36,683,601 39,758,463 300,9531991 253 76,384,506 38,148,456 38,236,050 301,9151990 253 80,944,668 39,449,611 41,495,057 319,9391989 252 64,645,248 31,991,176 32,654,072 256,5291988 253 62,250,400 32,804,412 29,445,988 246,0491987 253 108,352,440 58,548,350 49,804,090 428,2711986 253 114,834,854 64,312,356 50,522,498 453,8931985 252 90,822,067 55,805,515 5,016,552 358,9811984 253 64,356,917 35,860,918 28,495,999 254,3751983 205 10,662,498 5,187,861 5,474,637 52,012
*Includes LEAPS for 1990-1998. 1999 & 2000 data includes LEAPS and FLEX.
Contract Volume
CBOE HOLDINGS, INC. Page 158 2011 MARKET STATISTICS

CBOE Total Cash Index Option Open Interest and Dollar Volume
Year Total Call Put Total Call Put2011 15,261,775 6,148,200 9,113,575 $536,337,242,696 $245,133,130,659 $291,204,112,0372010 17,094,958 7,442,072 9,652,886 $451,444,699,759 $216,117,491,616 $235,327,208,1432009 16,896,384 7,822,582 9,073,802 $474,272,665,556 $235,806,525,790 $238,466,139,7662008 15,001,141 6,437,670 8,563,471 $701,965,854,990 $243,474,615,645 $458,491,239,3452007 13,510,217 5,448,068 8,062,149 $393,277,382,801 $184,204,220,553 $209,073,162,2482006 13,590,215 5,712,398 7,877,817 $180,949,552,849 $97,982,423,326 $82,967,129,5232005 10,710,125 4,419,799 6,290,326 $124,362,155,959 $63,417,089,377 $60,945,066,5822004 7,873,906 2,813,149 5,060,757 $111,789,605,607 $56,858,870,118 $54,930,735,4892003 6,219,688 2,540,180 3,679,508 $106,423,859,606 $56,846,355,697 $49,577,503,9092002 5,116,156 2,524,734 2,591,422 $106,269,617,884 $40,964,533,127 $65,305,084,7572001 4,075,603 1,862,987 2,212,616 $103,304,236,589 $40,990,346,222 $62,313,890,3672000 3,317,081 1,575,805 1,741,276 $131,117,652,021 $61,270,306,288 $69,847,345,7331999 3,706,451 1,459,002 2,247,449 $119,740,401,583 $64,882,929,610 $54,857,471,9731998 3,232,699 1,308,280 1,924,419 $117,705,321,296 $62,741,413,439 $54,963,907,8571997 3,273,034 1,296,473 1,976,561 $104,182,695,225 $62,957,704,514 $41,224,990,7111996 2,467,906 841,547 1,626,359 $73,513,538,077 $44,971,815,222 $28,541,722,8541995 2,708,600 1,003,661 1,704,939 $60,314,791,589 $40,872,092,367 $19,442,699,2111994 2,844,191 1,273,899 1,570,292 $50,092,654,182 $23,813,355,297 $26,279,298,8851993 2,185,174 889,577 1,295,597 $30,777,982,925 $17,047,779,862 $13,730,203,0631992 1,887,202 809,961 1,077,241 $33,195,348,189 $18,812,242,598 $14,383,105,5911991 1,774,620 719,990 1,054,630 $39,245,357,743 $24,321,846,057 $14,523,511,6861990 1,289,914 569,727 720,187 $42,880,469,686 $20,840,458,316 $22,040,011,3701989 1,005,657 445,741 559,916 $27,505,936,771 $17,563,299,309 $9,942,637,4621988 880,985 422,233 458,752 $27,478,205,683 $15,658,723,033 $11,819,482,6501987 741,736 396,658 345,078 $50,536,478,841 $29,612,693,832 $20,923,785,0091986 1,010,739 501,142 509,597 $35,358,087,000 $22,843,990,000 $12,514,097,0001985 1,286,108 668,340 617,768 $21,623,424,000 $15,471,594,000 $6,151,830,0001984 647,821 398,057 249,764 $15,356,000,000 $9,534,000,000 $5,822,000,0001983 334,510 195,682 138,828 $3,396,000,000 $1,882,000,000 $1,514,000,000
Open Interest in Contracts Dollar Volume
CBOE HOLDINGS, INC. Page 159 2011 MARKET STATISTICS

CBOE Total Cash Index Option Average Premium Per Contract and Average Contracts Per Trade
Year Total Call Put Total Call Put2011 $1,676 $1,706 $1,651 51.8 47.0 56.62010 $1,672 $1,805 $1,566 52.5 48.4 56.22009 $2,129 $2,368 $1,936 52.6 49.6 55.32008 $2,705 $2,182 $3,099 51.1 46.0 55.92007 $1,706 $1,938 $1,543 55.4 49.8 60.22006 $1,148 $1,487 $905 49.2 45.5 52.42005 $1,075 $1,361 $882 42.2 36.8 46.92004 $1,309 $1,650 $1,078 32.9 28.5 36.72003 $1,527 $1,852 $1,272 25.6 25.9 25.42002 $1,660 $1,494 $1,785 23.0 23.7 22.42001 $1,986 $1,894 $2,052 24.7 24.1 25.22000 $2,766 $2,936 $2,633 22.7 22.1 23.11999 $2,131 $2,758 $1,679 21.1 21.3 21.01998 $1,724 $2,156 $1,403 22.1 21.5 22.61997 $1,465 $1,998 $1,040 22.0 20.6 23.41996 $861 $1,207 $593 23.5 22.8 24.11995 $595 $903 $346 26.1 26.3 25.91994 $437 $470 $410 27.3 27.7 27.01993 $377 $447 $316 22.1 21.7 22.41992 $434 $513 $362 19.7 19.6 19.81991 $514 $648 $380 18.3 18.4 18.21990 $530 $528 $531 18.3 19.0 17.61989 $425 $549 $304 17.2 17.4 17.01988 $441 $477 $401 15.7 16.5 14.91987 $466 $506 $420 16.9 16.8 17.01986 $308 $355 $248 18.2 18.2 18.21985 $238 $277 $207 18.6 18.4 18.81984 $239 $266 $204 17.7 17.1 18.01983 $318 $363 $277 12.6 10.2 10.9
Average Premium Per Contract Average Contracts Per Trade
CBOE HOLDINGS, INC. Page 160 2011 MARKET STATISTICS
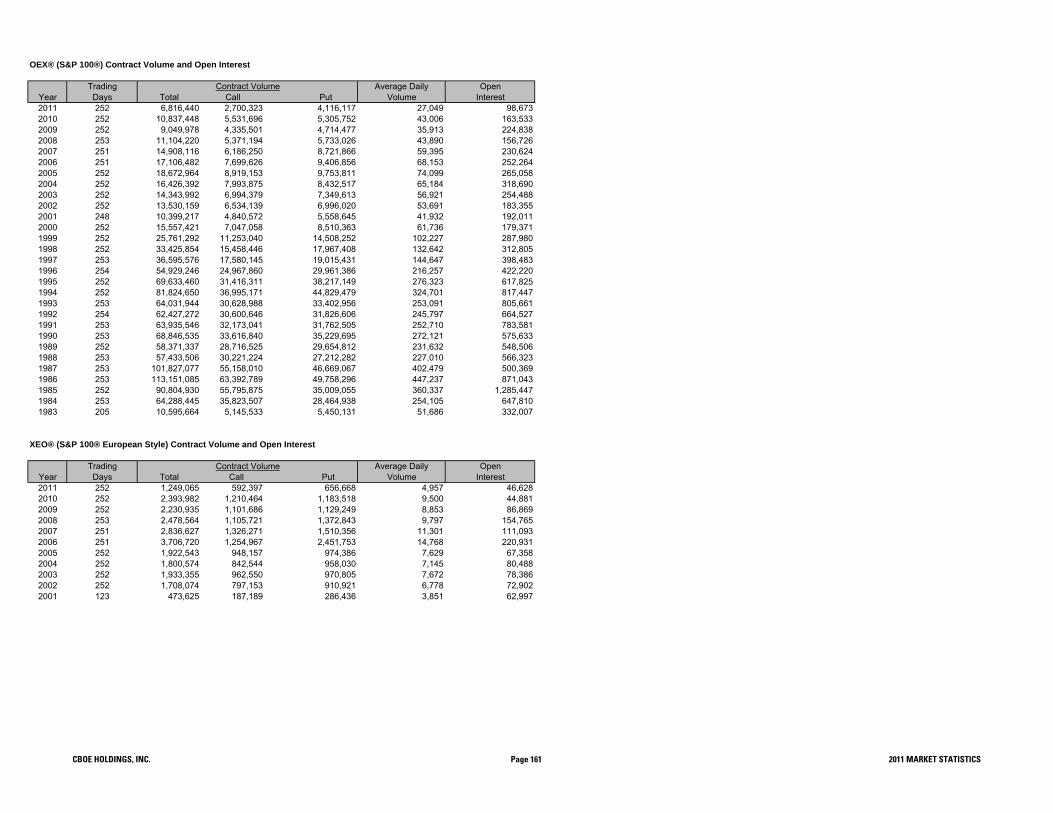
OEX® (S&P 100®) Contract Volume and Open Interest
Trading Average Daily OpenYear Days Total Call Put Volume Interest2011 252 6,816,440 2,700,323 4,116,117 27,049 98,6732010 252 10,837,448 5,531,696 5,305,752 43,006 163,5332009 252 9,049,978 4,335,501 4,714,477 35,913 224,8382008 253 11,104,220 5,371,194 5,733,026 43,890 156,7262007 251 14,908,116 6,186,250 8,721,866 59,395 230,6242006 251 17,106,482 7,699,626 9,406,856 68,153 252,2642005 252 18,672,964 8,919,153 9,753,811 74,099 265,0582004 252 16,426,392 7,993,875 8,432,517 65,184 318,6902003 252 14,343,992 6,994,379 7,349,613 56,921 254,4882002 252 13,530,159 6,534,139 6,996,020 53,691 183,3552001 248 10,399,217 4,840,572 5,558,645 41,932 192,0112000 252 15,557,421 7,047,058 8,510,363 61,736 179,3711999 252 25,761,292 11,253,040 14,508,252 102,227 287,9801998 252 33,425,854 15,458,446 17,967,408 132,642 312,8051997 253 36,595,576 17,580,145 19,015,431 144,647 398,4831996 254 54,929,246 24,967,860 29,961,386 216,257 422,2201995 252 69,633,460 31,416,311 38,217,149 276,323 617,8251994 252 81,824,650 36,995,171 44,829,479 324,701 817,4471993 253 64,031,944 30,628,988 33,402,956 253,091 805,6611992 254 62,427,272 30,600,646 31,826,606 245,797 664,5271991 253 63,935,546 32,173,041 31,762,505 252,710 783,5811990 253 68,846,535 33,616,840 35,229,695 272,121 575,6331989 252 58,371,337 28,716,525 29,654,812 231,632 548,5061988 253 57,433,506 30,221,224 27,212,282 227,010 566,3231987 253 101,827,077 55,158,010 46,669,067 402,479 500,3691986 253 113,151,085 63,392,789 49,758,296 447,237 871,0431985 252 90,804,930 55,795,875 35,009,055 360,337 1,285,4471984 253 64,288,445 35,823,507 28,464,938 254,105 647,8101983 205 10,595,664 5,145,533 5,450,131 51,686 332,007
XEO® (S&P 100® European Style) Contract Volume and Open Interest
Trading Average Daily OpenYear Days Total Call Put Volume Interest2011 252 1,249,065 592,397 656,668 4,957 46,6282010 252 2,393,982 1,210,464 1,183,518 9,500 44,8812009 252 2,230,935 1,101,686 1,129,249 8,853 86,8692008 253 2,478,564 1,105,721 1,372,843 9,797 154,7652007 251 2,836,627 1,326,271 1,510,356 11,301 111,0932006 251 3,706,720 1,254,967 2,451,753 14,768 220,9312005 252 1,922,543 948,157 974,386 7,629 67,3582004 252 1,800,574 842,544 958,030 7,145 80,4882003 252 1,933,355 962,550 970,805 7,672 78,3862002 252 1,708,074 797,153 910,921 6,778 72,9022001 123 473,625 187,189 286,436 3,851 62,997
Contract Volume
Contract Volume
CBOE HOLDINGS, INC. Page 161 2011 MARKET STATISTICS

SPX® (S&P 500®) Contract Volume and Open Interest
Trading Average Daily OpenYear Days Total Call Put Volume Interest2011 252 197,509,449 70,328,866 127,180,583 783,768 10,802,8442010 252 175,291,508 66,811,419 108,480,089 695,601 11,328,7292009 252 154,869,646 61,997,990 92,871,656 614,562 10,735,9152008 253 179,045,021 67,489,789 111,555,232 707,688 10,372,6502007 251 158,084,691 55,560,969 102,523,722 629,819 8,187,4102006 251 104,312,673 40,128,731 64,183,942 415,588 7,848,7852005 252 71,802,558 26,511,165 45,291,393 284,931 6,080,3232004 252 49,472,117 17,781,545 31,690,572 196,318 4,965,8072003 252 36,754,720 15,458,872 21,295,848 145,852 3,839,5852002 252 29,939,598 12,680,856 17,258,742 118,808 3,169,4152001 248 24,271,222 10,165,544 14,105,678 97,868 2,674,6082000 252 23,290,194 10,202,047 13,088,147 92,421 2,496,3491999 252 24,699,878 10,160,737 14,539,141 98,015 2,850,5231998 252 25,708,136 10,383,764 15,324,372 102,016 1,730,7941997 253 26,494,543 10,276,751 16,217,792 104,722 1,606,3181996 254 24,844,808 10,032,433 14,812,375 97,814 1,339,6511995 252 26,726,023 11,638,290 15,087,733 106,056 1,352,8371994 252 28,016,776 11,667,855 16,348,921 111,178 1,282,4851993 253 16,454,282 7,183,029 9,271,253 65,037 1,098,6601992 254 13,420,174 5,990,574 7,429,600 52,835 993,9221991 253 11,924,719 5,850,383 6,074,336 47,133 726,0851990 253 12,089,035 5,829,971 6,259,064 47,783 708,5771989 252 6,273,911 3,274,651 2,999,260 24,952 457,1511988 253 4,816,894 2,583,188 2,233,706 19,039 314,6621987 253 6,204,793 3,199,564 3,005,229 24,525 241,3671986 253 1,682,808 919,026 763,782 6,786 139,6961985 252 7,762 4,949 2,813 31 6611984 253 11,970 5,065 6,905 47 111983 127 14,093 6,210 7,883 111 2,503
XSP (Mini S&P 500®) Contract Volume and Open Interest
Trading Average Daily OpenYear Days Total Call Put Volume Interest2011 252 92,504 31,268 61,236 367 25,7332010 252 268,399 135,603 132,796 1,065 44,3832009 252 819,013 389,451 429,562 3,250 77,7632008 253 2,853,825 1,212,293 1,641,532 11,280 239,8702007 251 1,535,570 641,738 893,832 6,118 319,5282006 251 1,771,820 799,620 972,200 7,059 937,3302005 47 709,820 382,038 327,782 15,103 981,280
Contract Volume
Contract Volume
CBOE HOLDINGS, INC. Page 162 2011 MARKET STATISTICS

DJX (Dow Jones Industrial Average®) Contract Volume and Open Interest
Trading Average Daily OpenYear Days Total Call Put Volume Interest2011 252 1,673,765 795,953 877,812 6,642 226,9482010 252 2,827,082 1,181,844 1,645,238 11,219 332,3482009 252 4,327,086 1,949,256 2,377,830 17,171 402,6222008 253 7,350,475 3,340,939 4,009,536 29,053 518,2022007 251 7,770,015 4,243,436 3,526,579 30,956 584,6852006 251 7,699,769 4,133,477 3,566,292 30,676 616,1552005 252 6,887,691 3,540,252 3,347,439 27,332 622,2652004 252 7,347,145 3,512,773 3,834,372 29,155 584,4022003 252 10,193,708 4,595,606 5,598,102 40,451 603,9062002 252 12,114,841 4,141,448 7,973,393 48,075 822,0352001 248 8,958,075 2,666,528 6,291,547 36,121 562,428 2000 252 3,763,077 1,635,695 2,127,382 14,933 223,569 1999 252 3,319,804 1,015,438 2,304,366 13,174 437,6541998 252 4,281,731 1,399,234 2,882,497 16,991 343,5561997 61 2,029,938 902,050 1,127,888 33,278 464,792
NDX (Nasdaq-100 Index®) Contract Volume and Open Interest
Trading Average Daily OpenYear Days Total Call Put Volume Interest2011 252 5,311,148 2,050,080 3,261,068 21,076 262,8892010 252 5,546,210 2,415,442 3,130,768 22,009 287,7892009 252 4,336,877 2,083,638 2,253,239 17,210 629,2872008 253 6,086,941 2,796,459 3,290,482 24,059 340,4492007 251 7,357,166 3,388,010 3,969,156 29,311 379,2142006 251 7,750,477 3,411,823 4,338,654 30,878 475,0882005 252 6,341,052 2,732,001 3,609,051 25,163 653,8832004 252 3,528,556 1,327,392 2,201,164 14,002 276,4912003 252 1,622,687 579,208 1,043,479 6,439 180,2182002 252 1,196,900 523,282 673,618 4,750 70,9312001 248 1,603,884 684,259 919,625 6,467 35,6652000 252 2,313,580 940,780 1,372,800 9,181 68,2201999 252 1,371,349 568,392 802,957 5,442 86,4421998 252 1,563,242 774,814 788,428 6,203 20,3751997 253 2,061,376 1,090,248 971,128 8,148 31,1581996 254 3,216,041 1,495,178 1,720,863 12,662 36,8591995 252 2,082,335 881,058 1,200,377 8,263 83,3641994 227 1,358,930 558,245 800,685 5,986 39,369
Contract Volume
Contract Volume
CBOE HOLDINGS, INC. Page 163 2011 MARKET STATISTICS

MNX (Mini Nasdaq-100 Index®) Contract Volume and Open Interest
Trading Average Daily OpenYear Days Total Call Put Volume Interest2011 252 271,901 170,112 101,789 1,079 157,3542010 252 654,793 276,314 378,479 2,598 341,5872009 252 1,723,896 782,310 941,586 6,841 753,0402008 253 4,792,951 2,174,127 2,618,824 18,944 1,311,7882007 251 4,577,696 1,765,655 2,812,041 18,238 1,377,7952006 251 5,198,989 2,414,079 2,784,910 20,713 1,710,0282005 252 6,157,513 2,760,217 3,397,296 24,435 1,627,8372004 252 5,503,345 2,498,691 3,004,654 21,839 1,528,1212003 252 4,034,201 1,798,884 2,235,317 16,009 1,125,4542002 252 4,993,791 2,506,047 2,487,744 19,817 694,6792001 248 6,325,335 3,084,290 3,241,045 25,505 589,3862000 93 1,468,469 756,636 711,740 15,790 268,086
RUT (Russell 2000 Index®) Contract Volume and Open Interest
Trading Average Daily OpenYear Days Total Call Put Volume Interest2011 252 9,163,017 3,772,930 5,390,087 36,361 539,8732010 252 9,713,843 4,048,116 5,665,727 38,547 725,9622009 252 12,045,122 6,007,708 6,037,414 47,798 808,6032008 253 18,248,587 9,013,878 9,234,709 72,129 1,300,7932007 251 8,122,116 3,662,827 4,459,289 32,359 1,648,6012006 251 2,156,819 937,467 1,219,352 8,593 639,9262005 252 1,086,807 402,341 684,466 4,313 217,8792004 252 889,448 336,085 553,363 3,530 94,2142003 252 612,790 237,850 374,940 2,432 117,5992002 252 386,262 156,940 229,322 1,533 95,4672001 248 325,157 142,733 182,424 1,311 91,3732000 252 835,614 197,567 638,047 3,316 64,6631999 252 821,565 414,385 407,180 3,260 33,3221998 252 876,158 383,124 493,034 3,477 57,2151997 253 616,882 349,415 267,467 2,438 34,0351996 254 388,399 179,145 209,254 1,529 55,9011995 252 317,099 103,557 213,542 1,258 24,7541994 252 651,009 192,777 458,232 2,583 46,8171993 253 494,980 233,801 261,179 1,956 76,8961992 35 40,086 19,869 20,217 1,145 21,499
RVX (Russell 2000 Volatility Index Options) Contract Volume and Open Interest
Trading Average Daily OpenYear Days Total Call Put Volume Interest2009 252 961 378 583 4 02008 253 31,706 8,341 23,365 125 1532007 66 32,502 14,497 18,005 492 2,489
Contract Volume
Contract Volume
Contract Volume
CBOE HOLDINGS, INC. Page 164 2011 MARKET STATISTICS

VIX (CBOE S&P 500 Volatility Index®) Contract Volume and Open Interest
Trading Average Daily OpenYear Days Total Call Put Volume Interest2011 252 97,988,951 63,239,376 34,749,575 388,845 3,100,8142010 252 62,452,232 38,107,437 24,344,795 247,826 3,820,2512009 252 33,328,163 20,925,987 12,402,176 132,255 3,167,8742008 253 25,947,655 18,544,852 7,402,803 102,560 555,8322007 251 23,388,366 17,663,899 5,724,467 93,181 566,5202006 251 5,050,638 4,062,588 988,050 23,491 697,011
VXN (NASDAQ Volatility Index Options) Contract Volume and Open Interest
Trading Average Daily OpenYear Days Total Call Put Volume Interest2009 252 37 20 17 0 02008 253 2,780 1,778 1,002 11 212007 64 4,639 2,654 1,985 72 386
Contract Volume
Contract Volume
CBOE HOLDINGS, INC. Page 165 2011 MARKET STATISTICS

C2 Total Cash Index Option Contract Volume
Trading Average DailyYear Days Total Call Put Volume2011 62 316,286 122,504 193,782 5,101
C2 Total Cash Index Option Open Interest and Dollar Volume
Year Total Call Put Total Call Put2011 41,573 11,922 29,651 $362,019,377 $194,198,365 $167,821,012
C2 Total Cash Index Option Average Premium Per Contract and Average Contracts Per Trade
Year Total Call Put Total Call Put2011 $1,145 $1,585 $866 8.8 8.0 9.3
SPXpm (S&P 500®) Contract Volume and Open Interest
Trading Average Daily OpenYear Days Total Call Put Volume Interest2011 62 316,286 122,504 193,782 5,101 41,573
Contract Volume
Dollar Volume
Average Premium Per Contract Average Contracts Per Trade
Contract Volume
Open Interest in Contracts
CBOE HOLDINGS, INC. Page 166 2011 MARKET STATISTICS

Total Cash Index Options Contract Volume by ExchangeCBOE C2
% Share of % Share ofYear CBOE C2 AMEX PHLX NYSE ARCA ISE BOX NSDQ NYSE MSE NASD Total Total Volume Total Volume2011 320,077,105 316,286 2,592,549 5,523,693 1,291,387 8,075,975 107,691 158,848 338,143,534 94.7% 0.09%2010 270,006,239 1,940,116 3,264,495 1,012,594 11,415,450 185,312 78,564 287,902,770 93.8%2009 222,781,717 3,483,300 3,768,015 403,388 13,259,920 449,064 244,145,404 91.2%2008 259,496,193 7,428,496 5,547,813 745,206 17,850,871 1,097,558 292,166,137 88.8%2007 230,517,843 13,804,541 6,719,120 295,980 15,719,177 847,448 267,904,109 86.0%2006 157,575,349 10,050,680 7,589,744 8,212,419 48,859 183,477,051 85.9%2005 115,657,828 8,678,564 6,211,858 4,464,570 135,012,820 85.7%2004 85,420,267 7,290,157 5,275,701 83,358 98,069,483 87.1%2003 69,675,859 4,272,865 3,221,784 10,833 77,181,341 90.3%2002 64,003,053 2,606,890 3,602,611 70,212,554 91.2%2001 52,306,915 1,161,485 4,517,137 57,985,537 90.2%2000 46,711,119 15,694,467 3,862,126 7,978 67,296,274 70.9%1999 57,828,717 2,840,913 3,189,587 30,269 63,889,486 90.5%1998 68,838,008 3,329,392 3,139,347 40,718 75,347,465 91.4%1997 71,136,728 4,181,554 2,776,578 79,811 8,054 78,182,725 91.0%1996 85,394,046 4,509,450 2,459,867 42,560 24,519 92,430,442 92.4%1995 101,427,897 3,505,041 2,799,964 52,163 25,425 107,810,490 94.1%1994 114,743,082 3,694,414 2,549,514 68,260 31,535 121,086,805 94.8%1993 81,573,576 4,493,235 1,153,714 161,432 42,781 87,424,738 93.3%1992 76,442,064 6,247,120 354,005 69,695 134,197 83,247,081 91.8%1991 76,384,506 5,976,142 433,686 71,577 158,761 83,024,672 92.0%1990 80,944,668 6,617,870 218,659 130,313 271,077 88,182,587 91.8%1989 64,645,248 8,282,314 151,117 226,047 592,760 73,897,486 87.5%1988 62,250,400 7,548,749 156,597 280,393 724,889 70,961,028 87.7%1987 108,352,440 18,192,811 498,756 459,081 2,193,121 129,696,209 83.5%1986 114,834,854 18,274,774 1,398,800 134,189 3,773,630 45,239 138,461,486 82.9%1985 90,822,067 12,437,897 2,321,006 92,646 4,263,262 107,453 110,044,331 82.5%1984 64,356,841 7,006,035 127,049 174,585 4,093,816 75,758,326 85.0%1983 10,662,498 2,693,153 6,278 656,480 14,018,409 76.1%
CBOE HOLDINGS, INC. Page 167 2011 MARKET STATISTICS
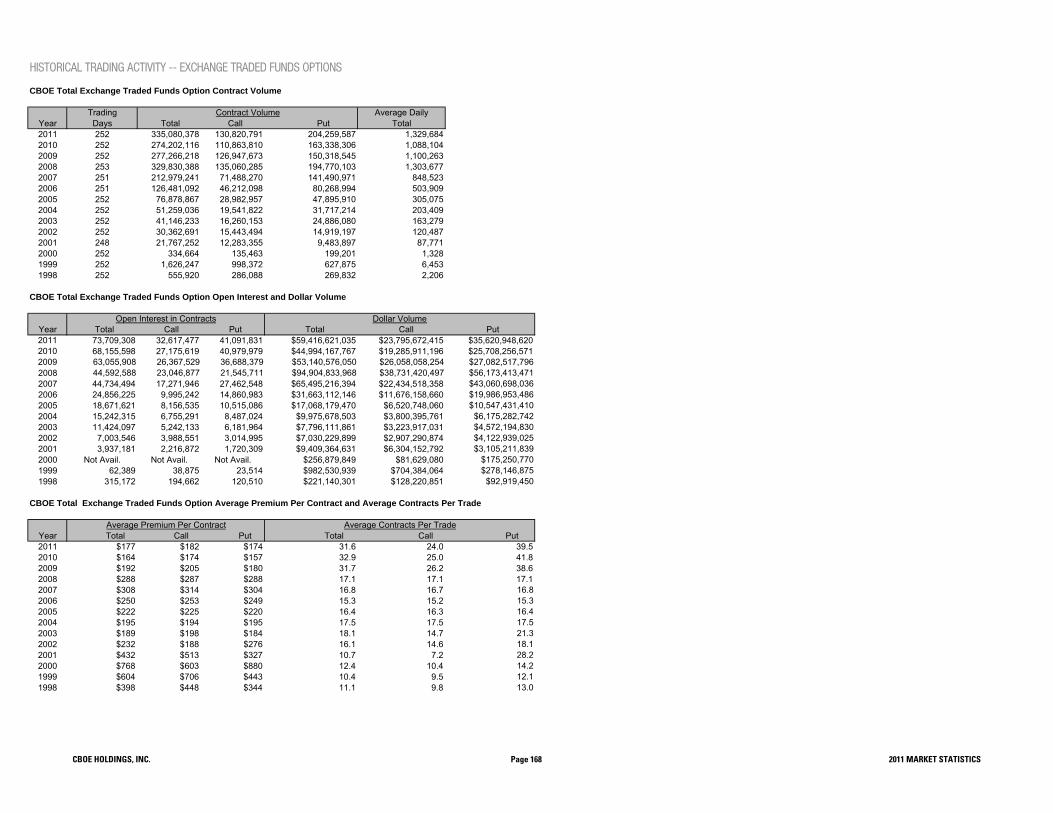
HISTORICAL TRADING ACTIVITY -- EXCHANGE TRADED FUNDS OPTIONS
CBOE Total Exchange Traded Funds Option Contract Volume
Trading Average DailyYear Days Total Call Put Total2011 252 335,080,378 130,820,791 204,259,587 1,329,6842010 252 274,202,116 110,863,810 163,338,306 1,088,1042009 252 277,266,218 126,947,673 150,318,545 1,100,2632008 253 329,830,388 135,060,285 194,770,103 1,303,6772007 251 212,979,241 71,488,270 141,490,971 848,5232006 251 126,481,092 46,212,098 80,268,994 503,9092005 252 76,878,867 28,982,957 47,895,910 305,0752004 252 51,259,036 19,541,822 31,717,214 203,4092003 252 41,146,233 16,260,153 24,886,080 163,2792002 252 30,362,691 15,443,494 14,919,197 120,4872001 248 21,767,252 12,283,355 9,483,897 87,7712000 252 334,664 135,463 199,201 1,3281999 252 1,626,247 998,372 627,875 6,4531998 252 555,920 286,088 269,832 2,206
CBOE Total Exchange Traded Funds Option Open Interest and Dollar Volume
Year Total Call Put Total Call Put2011 73,709,308 32,617,477 41,091,831 $59,416,621,035 $23,795,672,415 $35,620,948,6202010 68,155,598 27,175,619 40,979,979 $44,994,167,767 $19,285,911,196 $25,708,256,5712009 63,055,908 26,367,529 36,688,379 $53,140,576,050 $26,058,058,254 $27,082,517,7962008 44,592,588 23,046,877 21,545,711 $94,904,833,968 $38,731,420,497 $56,173,413,4712007 44,734,494 17,271,946 27,462,548 $65,495,216,394 $22,434,518,358 $43,060,698,0362006 24,856,225 9,995,242 14,860,983 $31,663,112,146 $11,676,158,660 $19,986,953,4862005 18,671,621 8,156,535 10,515,086 $17,068,179,470 $6,520,748,060 $10,547,431,4102004 15,242,315 6,755,291 8,487,024 $9,975,678,503 $3,800,395,761 $6,175,282,7422003 11,424,097 5,242,133 6,181,964 $7,796,111,861 $3,223,917,031 $4,572,194,8302002 7,003,546 3,988,551 3,014,995 $7,030,229,899 $2,907,290,874 $4,122,939,0252001 3,937,181 2,216,872 1,720,309 $9,409,364,631 $6,304,152,792 $3,105,211,8392000 Not Avail. Not Avail. Not Avail. $256,879,849 $81,629,080 $175,250,7701999 62,389 38,875 23,514 $982,530,939 $704,384,064 $278,146,8751998 315,172 194,662 120,510 $221,140,301 $128,220,851 $92,919,450
CBOE Total Exchange Traded Funds Option Average Premium Per Contract and Average Contracts Per Trade
Year Total Call Put Total Call Put2011 $177 $182 $174 31.6 24.0 39.52010 $164 $174 $157 32.9 25.0 41.82009 $192 $205 $180 31.7 26.2 38.62008 $288 $287 $288 17.1 17.1 17.12007 $308 $314 $304 16.8 16.7 16.82006 $250 $253 $249 15.3 15.2 15.32005 $222 $225 $220 16.4 16.3 16.42004 $195 $194 $195 17.5 17.5 17.52003 $189 $198 $184 18.1 14.7 21.32002 $232 $188 $276 16.1 14.6 18.12001 $432 $513 $327 10.7 7.2 28.22000 $768 $603 $880 12.4 10.4 14.21999 $604 $706 $443 10.4 9.5 12.11998 $398 $448 $344 11.1 9.8 13.0
Open Interest in Contracts Dollar Volume
Average Premium Per Contract Average Contracts Per Trade
Contract Volume
CBOE HOLDINGS, INC. Page 168 2011 MARKET STATISTICS
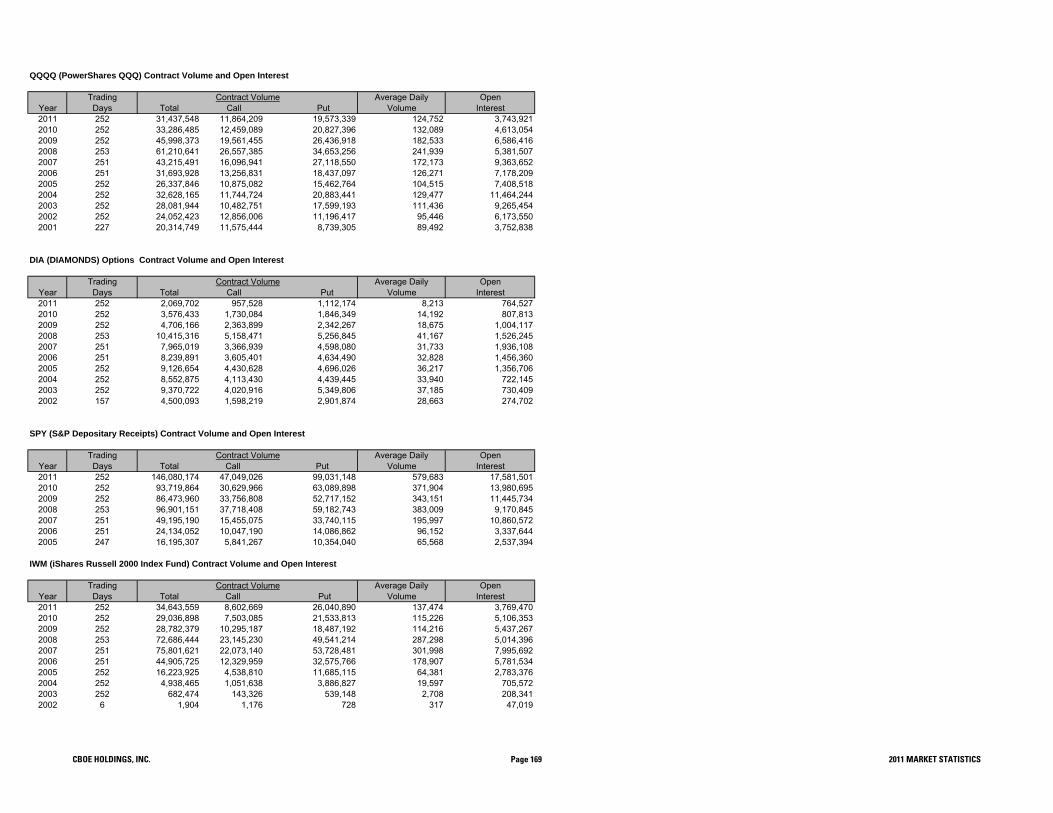
QQQQ (PowerShares QQQ) Contract Volume and Open Interest
Trading Average Daily OpenYear Days Total Call Put Volume Interest2011 252 31,437,548 11,864,209 19,573,339 124,752 3,743,9212010 252 33,286,485 12,459,089 20,827,396 132,089 4,613,0542009 252 45,998,373 19,561,455 26,436,918 182,533 6,586,4162008 253 61,210,641 26,557,385 34,653,256 241,939 5,381,5072007 251 43,215,491 16,096,941 27,118,550 172,173 9,363,6522006 251 31,693,928 13,256,831 18,437,097 126,271 7,178,2092005 252 26,337,846 10,875,082 15,462,764 104,515 7,408,5182004 252 32,628,165 11,744,724 20,883,441 129,477 11,464,2442003 252 28,081,944 10,482,751 17,599,193 111,436 9,265,4542002 252 24,052,423 12,856,006 11,196,417 95,446 6,173,5502001 227 20,314,749 11,575,444 8,739,305 89,492 3,752,838
DIA (DIAMONDS) Options Contract Volume and Open Interest
Trading Average Daily OpenYear Days Total Call Put Volume Interest2011 252 2,069,702 957,528 1,112,174 8,213 764,5272010 252 3,576,433 1,730,084 1,846,349 14,192 807,8132009 252 4,706,166 2,363,899 2,342,267 18,675 1,004,1172008 253 10,415,316 5,158,471 5,256,845 41,167 1,526,2452007 251 7,965,019 3,366,939 4,598,080 31,733 1,936,1082006 251 8,239,891 3,605,401 4,634,490 32,828 1,456,3602005 252 9,126,654 4,430,628 4,696,026 36,217 1,356,7062004 252 8,552,875 4,113,430 4,439,445 33,940 722,1452003 252 9,370,722 4,020,916 5,349,806 37,185 730,4092002 157 4,500,093 1,598,219 2,901,874 28,663 274,702
SPY (S&P Depositary Receipts) Contract Volume and Open Interest
Trading Average Daily OpenYear Days Total Call Put Volume Interest2011 252 146,080,174 47,049,026 99,031,148 579,683 17,581,5012010 252 93,719,864 30,629,966 63,089,898 371,904 13,980,6952009 252 86,473,960 33,756,808 52,717,152 343,151 11,445,7342008 253 96,901,151 37,718,408 59,182,743 383,009 9,170,8452007 251 49,195,190 15,455,075 33,740,115 195,997 10,860,5722006 251 24,134,052 10,047,190 14,086,862 96,152 3,337,6442005 247 16,195,307 5,841,267 10,354,040 65,568 2,537,394
IWM (iShares Russell 2000 Index Fund) Contract Volume and Open Interest
Trading Average Daily OpenYear Days Total Call Put Volume Interest2011 252 34,643,559 8,602,669 26,040,890 137,474 3,769,4702010 252 29,036,898 7,503,085 21,533,813 115,226 5,106,3532009 252 28,782,379 10,295,187 18,487,192 114,216 5,437,2672008 253 72,686,444 23,145,230 49,541,214 287,298 5,014,3962007 251 75,801,621 22,073,140 53,728,481 301,998 7,995,6922006 251 44,905,725 12,329,959 32,575,766 178,907 5,781,5342005 252 16,223,925 4,538,810 11,685,115 64,381 2,783,3762004 252 4,938,465 1,051,638 3,886,827 19,597 705,5722003 252 682,474 143,326 539,148 2,708 208,3412002 6 1,904 1,176 728 317 47,019
Contract Volume
Contract Volume
Contract Volume
Contract Volume
CBOE HOLDINGS, INC. Page 169 2011 MARKET STATISTICS

C2 Total Exchange Traded Funds Option Contract Volume
Trading Average DailyYear Days Total Call Put Total2011 252 33,270,441 13,754,544 19,515,897 132,0262010 44 2,027,706 840,283 1,187,423 46,084
C2 Total Exchange Traded Funds Option Open Interest and Dollar Volume
Year Total Call Put Total Call Put2011 70,027,477 30,530,147 39,497,330 $4,497,088,651 $1,995,468,229 $2,501,620,4222010 64,426,227 25,281,638 39,144,589 $217,333,062 $102,662,794 $114,670,268
C2 Total Exchange Traded Funds Option Average Premium Per Contract and Average Contracts Per Trade
Year Total Call Put Total Call Put2011 $135 $145 $128 24.6 21.0 28.02010 $107 $122 $97 20.0 17.7 22.0
QQQQ (PowerShares QQQ) Contract Volume and Open Interest
Trading Average Daily OpenYear Days Total Call Put Volume Interest2011 252 2,641,062 1,040,761 1,600,301 10,480 3,743,9212010 44 332,298 141,001 191,297 7,552 4,613,054
DIA (DIAMONDS) Options Contract Volume and Open Interest
Trading Average Daily OpenYear Days Total Call Put Volume Interest2011 252 226,641 106,728 119,913 899 764,5272010 44 15,046 5,606 9,440 342 807,813
SPY (S&P Depositary Receipts) Contract Volume and Open Interest
Trading Average Daily OpenYear Days Total Call Put Volume Interest2011 252 19,381,732 7,359,760 12,021,972 76,912 17,581,5012010 44 928,599 361,759 566,840 21,105 13,980,695
IWM (iShares Russell 2000 Index Fund) Contract Volume and Open Interest
Trading Average Daily OpenYear Days Total Call Put Volume Interest2011 252 2,622,456 863,048 1,759,408 10,407 3,769,4702010 44 290,206 82,568 207,638 6,596 5,106,353
Contract Volume
Contract Volume
Average Premium Per Contract Average Contracts Per Trade
Contract Volume
Contract Volume
Contract Volume
Open Interest in Contracts Dollar Volume
CBOE HOLDINGS, INC. Page 170 2011 MARKET STATISTICS

Total Exchange Traded Funds Options Contract Volume by ExchangeCBOE C2
% Share of % Share ofYear CBOE C2 AMEX PHLX NYSE ARCA ISE BOX NSDQ BATS Total Total Volume Total Volume2011 335,080,378 33,270,441 259,501,665 387,486,509 216,545,353 339,362,822 47,615,460 87,149,551 59,830,946 1,765,843,125 19.0% 1.9%2010 274,202,116 2,027,706 152,003,638 294,769,596 182,333,857 263,853,908 23,404,418 52,593,549 9,948,200 1,255,136,988 21.8% 0.2%2009 277,266,218 78,016,892 175,230,523 149,048,529 274,844,231 62,411,236 51,240,201 1,068,057,830 26.0%2008 329,830,388 82,111,402 129,630,580 150,050,779 300,545,759 77,898,352 18,089,887 1,088,157,147 30.3%2007 212,979,241 67,710,562 69,827,027 76,202,359 185,482,087 33,475,202 645,676,478 33.0%2006 126,481,092 45,142,347 33,614,672 28,073,577 99,564,422 16,861,584 349,737,694 36.2%2005 76,878,867 38,150,097 17,363,186 17,213,077 60,308,533 16,883,720 226,797,480 33.9%2004 51,259,036 35,089,619 20,529,525 14,374,597 38,063,902 4,284,223 163,600,902 31.3%2003 41,146,233 33,639,852 20,162,085 15,052,594 19,165,896 129,166,660 31.9%2002 30,362,691 38,250,334 6,977,732 14,063,428 12,067,494 101,721,679 29.8%2001 21,767,252 36,566,669 3,919,462 7,339,485 6,188,158 75,781,026 28.7%2000 1,020,584 11,816,747 167,803 275,567 13,280,701 7.7%
CBOE HOLDINGS, INC. Page 171 2011 MARKET STATISTICS

HISTORICAL TRADING ACTIVITY-INTEREST RATE OPTIONS
Total Interest Rate Options Contract VolumeTrading Average Daily
Year Days Total Call Put Volume2011 252 9 9 0 02010 252 2,417 2,193 224 102009 252 5,797 5,606 191 232008 253 3,523 1,912 1,611 142007 251 10,079 7,591 2,488 402006 251 21,330 11,002 10,328 852005 252 65,626 36,839 28,787 2602004 252 90,608 56,267 34,341 3602003 252 90,438 60,531 29,907 3572002 252 43,232 23,045 20,187 1722001 248 39,591 16,828 22,763 1602000 252 42,100 15,781 26,768 1671999 251 42,556 19,527 23,029 1701998 251 76,760 44,129 32,631 3061997 250 75,517 38,220 37,297 3021996 252 94,252 50,636 43,616 3741995 250 65,102 39,121 25,981 2601994 250 216,592 108,200 108,392 8661993 251 64,561 32,795 31,766 2571992 251 57,305 31,987 25,318 2281991 251 50,035 26,769 23,266 1991990 251 61,839 27,025 34,814 2461989 131 72,718 38,455 34,263 555
Total Interest Rate Options Open Interest and Dollar Volume
Month Total Call Put Total Call Put2011 0 0 0 $990 $990 $02010 49 48 1 $1,152,595 $1,067,315 $85,2802009 132 81 51 $3,128,115 $3,072,740 $55,3752008 666 562 104 $1,312,650 $575,335 $737,3152007 4,741 4,376 365 $1,900,451 $1,345,151 $555,3002006 2,381 1,460 921 $4,272,965 $2,679,090 $1,593,8752005 7,782 4,242 3,540 $13,968,215 $7,655,850 $6,312,3652004 18,238 13,863 4,375 $22,351,070 $17,224,745 $5,126,3252003 10,220 5,612 4,608 $25,275,575 $17,545,615 $7,729,9602002 8,953 4,593 4,360 $9,732,610 $5,470,335 $4,262,2752001 6,378 2,639 3,739 $10,195,678 $3,719,173 $6,476,5052000 2,783 627 2,156 $13,444,561 $3,085,375 $10,359,1861999 6,395 1,632 4,763 $8,041,082 $3,975,530 $4,065,5521998 4,436 2,907 1,529 $14,183,792 $5,809,911 $8,373,8811997 8,982 5,182 3,800 $15,966,935 $6,856,851 $9,110,0841996 6,434 3,002 3,432 $20,239,126 $10,938,500 $9,400,6261995 6,831 3,281 3,550 $11,013,182 $5,705,651 $5,307,5311994 21,494 11,554 9,940 $39,757,169 $23,835,743 $15,921,4261993 3,443 1,435 1,998 $11,223,338 $5,365,199 $5,858,1391992 2,736 1,688 1,048 $7,097,001 $3,562,920 $3,534,0811991 4,867 3,682 1,185 $7,347,106 $3,075,106 $4,271,2331990 4,205 2,652 1,553 $10,778,046 $4,956,810 $5,821,2361989 4,706 3,150 1,556 $12,125,585 $5,500,884 $6,624,701
Contract Volume
Open Interest in Contracts Dollar Volume
CBOE HOLDINGS, INC. Page 172 2011 MARKET STATISTICS

Total Interest Rate Options Average Premium Per Contract, Average Contracts Per Trade and Transactions
Year Total Call Put Total Call Put2011 $110 $110 $0 2.3 2.3 0.02010 $477 $487 $381 25.2 28.9 11.22009 $540 $548 $290 6.1 6.1 8.72008 $373 $301 $458 15.5 15.2 15.82007 $189 $177 $223 26.2 32.6 16.52006 $200 $244 $154 13.3 11.0 17.02005 $213 $208 $219 11.4 8.4 20.82004 $247 $306 $149 9.4 7.8 14.42003 $279 $290 $258 9.7 9.1 11.12002 $225 $237 $211 13.1 11.4 15.92001 $258 $221 $285 12.4 12.2 12.62000 $314 $196 $387 21.9 12.9 36.21999 $189 $204 $177 16.6 16.0 17.01998 $185 $132 $257 25.3 26.6 23.81997 $211 $179 $244 24.9 21.1 30.31996 $216 $216 $216 18.9 18.1 19.91995 $169 $146 $204 17.2 15.5 20.61994 $183 $220 $147 26.5 24.2 29.31993 $174 $164 $184 24.0 20.6 28.91992 $124 $111 $140 23.5 26.0 20.91991 $147 $115 $184 14.1 17.1 11.71990 $174 $183 $167 17.1 17.9 16.51989 $167 $143 $193 14.3 15.9 12.8
Average Premium Per Contract Average Contracts Per Trade
CBOE HOLDINGS, INC. Page 173 2011 MARKET STATISTICS

HISTORICAL TRADING ACTIVITY - CREDIT DEFAULT BASKET OPTIONS
Total Single-Name CEBOs Contract Volume, Dollar Volume and Transactions
Trading Average Daily OpenYear Days Total Call Put Volume Interest2011 252 122 122 0 0 1082010 252 0 0 0 0 02009 252 0 0 0 0 02008 253 10 10 0 0 02007 136 46 46 0 0 0
Total Basket CEBOs Contract Volume, Dollar Volume and Transactions
Trading Average Daily OpenYear Days Total Call Put Volume Interest2011 252 0 0 0 0 02010 252 0 0 0 0 02009 252 0 0 0 0 02008 253 0 0 0 0 02007 87 2 2 0 0 0
Contract Volume
Contract Volume
CBOE HOLDINGS, INC. Page 174 2011 MARKET STATISTICS

CFE TRADING ACTIVITY - 2011(Includes Futures and Options on Futures)
Total CFE Trading Summary
TotalNo. of Contracts 12,044,691Average Daily Volume 47,796Open Interest 125,961Transactions 5,328,790
MonthTrading
DaysContract Volume
TotalAverage Daily
TotalOpen Interest
TotalJan 20 779,557 38,978 165,722Feb 19 790,121 41,585 161,226Mar 23 1,066,368 46,364 184,555Apr 20 836,892 41,845 211,913May 21 994,608 47,362 242,508Jun 22 1,223,534 55,615 220,078Jul 20 1,170,656 58,533 217,740Aug 23 1,828,152 79,485 166,301Sep 21 984,558 46,884 148,252Oct 21 898,808 42,800 140,666Nov 21 822,891 39,185 143,825Dec 21 648,546 30,883 125,961Total 252 12,044,691 47,796 --
Total CFE Futures and Option Futures Average Contracts Per Trade and Transactions
MonthTrading
Days
Average Contracts Per Trade
TotalTransactions
TotalJan 20 2.9 273,360Feb 19 2.7 295,087Mar 23 2.4 440,265Apr 20 2.8 300,197May 21 2.7 367,696Jun 22 2.5 489,238Jul 20 2.5 460,847Aug 23 2.1 891,100Sep 21 1.9 521,025Oct 21 1.8 490,129Nov 21 1.8 453,435Dec 21 1.9 346,411Total 252 2.3 5,328,790
CBOE HOLDINGS, INC. Page 175 2011 MARKET STATISTICS

Total CFE Futures and Option Futures Contract Volume
MonthTrading
Days Total Futures VolumeFutures Volume
Option Futures Volume
Jan 20 779,557 779,493 64Feb 19 790,121 790,006 115Mar 23 1,066,368 1,066,327 41Apr 20 836,892 836,749 143May 21 994,608 994,559 49Jun 22 1,223,534 1,223,240 294Jul 20 1,170,656 1,169,650 1,006Aug 23 1,828,152 1,826,876 1,276Sep 21 984,558 983,349 1,209Oct 21 898,808 898,409 399Nov 21 822,891 822,876 15Dec 21 648,546 648,540 6Total 252 12,044,691 12,040,074 4,617
CBOE HOLDINGS, INC. Page 176 2011 MARKET STATISTICS

CFE FUTURES TRADING ACTIVITY - 2011
MonthTrading
DaysContract Volume
TotalAverage Daily
TotalOpen Interest
TotalJan 20 779,493 38,975 165,696Feb 19 790,006 41,579 161,192Mar 23 1,066,327 46,362 184,533Apr 20 836,749 41,837 211,784May 21 994,559 47,360 242,499Jun 22 1,223,240 55,602 219,784Jul 20 1,169,650 58,483 217,018Aug 23 1,826,876 79,429 166,136Sep 21 983,349 46,826 148,227Oct 21 898,409 42,781 140,662Nov 21 822,876 39,185 143,824Dec 21 648,540 30,883 125,959Total 252 12,040,074 47,778 --
Total CFE Futures Average Contracts Per Trade and Transactions
MonthTrading
DaysAverage Contracts Per Trade
TotalTransactions
TotalJan 20 2.9 273,326Feb 19 2.7 295,032Mar 23 2.4 440,236Apr 20 2.8 300,170May 21 2.7 367,672Jun 22 2.5 489,224Jul 20 2.5 460,777Aug 23 2.1 891,051Sep 21 1.9 520,997Oct 21 1.8 490,098Nov 21 1.8 453,422Dec 21 1.9 346,406Total 252 2.3 5,328,411
CBOE HOLDINGS, INC. Page 177 2011 MARKET STATISTICS

VIX (CBOE Volatility Index Futures) Contract Volume
MonthTrading
DaysContract Volume
TotalAverage Daily
TotalOpen Interest
TotalJan 20 778,766 38,938 165,470Feb 19 789,295 41,542 161,052Mar 23 1,065,374 46,321 184,342Apr 20 836,110 41,806 211,584May 21 993,990 47,333 242,356Jun 22 1,222,577 55,572 219,660Jul 20 1,169,064 58,453 216,864Aug 23 1,825,867 79,386 166,009Sep 21 982,628 46,792 148,002Oct 21 897,666 42,746 140,563Nov 21 822,121 39,149 143,724Dec 21 648,070 30,860 125,881Total 252 12,031,528 47,744 --
VIX (CBOE Volatility Index Futures) Average Contracts Per Trade and Transactions
MonthTrading
DaysAverage Contracts Per Trade
TotalTransactions
TotalJan 20 2.9 272,951Feb 19 2.7 294,666Mar 23 2.4 439,695Apr 20 2.8 299,773May 21 2.7 367,350Jun 22 2.5 488,898Jul 20 2.5 460,426Aug 23 2.1 890,456Sep 21 1.9 520,527Oct 21 1.8 489,694Nov 21 1.8 453,032Dec 21 1.9 346,143Total 252 2.3 5,323,611
CBOE HOLDINGS, INC. Page 178 2011 MARKET STATISTICS

VM (CBOE Mini-VIX Futures) Contract Volume
MonthTrading
DaysContract Volume
TotalAverage Daily
TotalOpen Interest
TotalJan 20 727 36 226Feb 19 709 37 140Mar 23 951 41 189Apr 20 551 28 159May 21 532 25 115Jun 22 651 30 113Jul 20 574 29 138Aug 23 1,006 44 114Sep 21 721 34 215Oct 21 743 35 89Nov 21 755 36 90Dec 21 468 22 68Total 252 8,388 33 --
VM (CBOE Mini-VIX Futures) Average Contracts Per Trade and Transactions
MonthTrading
DaysAverage Contracts Per Trade
TotalTransactions
TotalJan 20 1.9 375Feb 19 1.9 364Mar 23 1.8 539Apr 20 1.6 345May 21 1.7 313Jun 22 2.1 314Jul 20 1.6 348Aug 23 1.7 594Sep 21 1.5 470Oct 21 1.8 404Nov 21 1.9 390Dec 21 1.8 261Total 252 1.8 4,717
CBOE HOLDINGS, INC. Page 179 2011 MARKET STATISTICS

VTI (CBOE S&P 500 Three-Month Variance Futures) Contract Volume
MonthTrading
DaysContract Volume
TotalAverage Daily
TotalOpen Interest
TotalJan 20 0 0 0Feb 19 2 0 0Mar 23 2 0 2Apr 20 0 0 2May 21 0 0 2Jun 22 8 0 6Jul 20 12 1 16Aug 23 3 0 13Sep 21 0 0 10Oct 21 0 0 10Nov 21 0 0 10Dec 21 2 0 10Total 252 29 0 --
VTI (CBOE S&P 500 Three-Month Variance Futures) Average Contracts Per Trade and Transactions
MonthTrading
DaysAverage Contracts Per Trade
TotalTransactions
TotalJan 20 0.0 0Feb 19 1.0 2Mar 23 1.0 2Apr 20 0.0 0May 21 0.0 0Jun 22 1.0 8Jul 20 4.0 3Aug 23 3.0 1Sep 21 0.0 0Oct 21 0.0 0Nov 21 0.0 0Dec 21 1.0 2Total 252 1.6 18
CBOE HOLDINGS, INC. Page 180 2011 MARKET STATISTICS

GVZ (CBOE Gold ETF Volatility Index Futures) Contract Volume
MonthTrading
DaysContract Volume
TotalAverage Daily
TotalOpen Interest
TotalJan 20Feb 19Mar 23 0 0 0Apr 20 88 4 39May 21 37 2 26Jun 22 4 0 5Jul 20 0 0 0Aug 23 0 0 0Sep 21 0 0 0Oct 21 0 0 0Nov 21 0 0 0Dec 21 0 0 0Total 252 129 1 --
GVZ (CBOE Gold ETF Volatility Index Futures) Average Contracts Per Trade and Transactions
MonthTrading
DaysAverage Contracts Per Trade
TotalTransactions
TotalJan 20Feb 19Mar 23 0.0 0Apr 20 1.7 52May 21 4.1 9Jun 22 1.0 4Jul 20 0.0 0Aug 23 0.0 0Sep 21 0.0 0Oct 21 0.0 0Nov 21 0.0 0Dec 21 0.0 0Total 252 2.0 65
CBOE HOLDINGS, INC. Page 181 2011 MARKET STATISTICS

CFE OPTIONS ON FUTURES TRADING ACTIVITY - 2011
VOW (CBOE Volatility Index Options on Futures) Contract Volume
MonthTrading
DaysContract Volume
TotalAverage Daily
TotalOpen Interest
TotalJan 20 64 3 26Feb 19 115 6 34Mar 23 41 2 22Apr 20 143 7 129May 21 49 2 9Jun 22 294 13 294Jul 20 1,006 50 722Aug 23 1,276 55 165Sep 21 1,209 58 25Oct 21 399 19 4Nov 21 15 1 1Dec 21 6 0 2Total 252 4,617 18 --
VOW (CBOE Volatility Index Options on Futures) Average Contracts Per Trade and Transactions
MonthTrading
DaysAverage Contracts Per Trade
TotalTransactions
TotalJan 20 1.9 34Feb 19 2.1 55Mar 23 1.4 29Apr 20 5.3 27May 21 2.0 24Jun 22 21.0 14Jul 20 14.4 70Aug 23 26.0 49Sep 21 43.2 28Oct 21 12.9 31Nov 21 1.2 13Dec 21 1.2 5Total 252 12.2 379
CBOE HOLDINGS, INC. Page 182 2011 MARKET STATISTICS

The information and data in this document was obtained from sources believed to be reliable, but accuracy is not guaranteed. Standard & Poor’s®, S&P®, S&P 500®, Standard & Poor’s Depositary Receipts®, SPDR®, Standard & Poor’s 500 and 500 are trademarks of Standard & Poor’s Financial Services, LLC and have been licensed for use by Chicago Board Options Exchange, Incorporated (CBOE). S&P makes no recommendations concerning the advisability of investing in SPDRs. Neither S&P nor its index compilation agent makes any recommendation concerning the advisability of investing in options on SPDRs. Russell 1000®, Russell 2000®, Russell 3000® and Russell MidCap are registered trademarks of the Frank Russell Company, used under license. Dow Jones, DJIA, Dow Jones Industrial Average, Dow Jones Transportation Average, Dow Jones Utility Average, and DIAMONDS are trademarks of Dow Jones & Company, Inc. and have been licensed for use for certain purposes by CBOE. CBOE’s options based on the Dow Jones indexes are not sponsored, endorsed, sold or promoted by Dow Jones, and Dow Jones makes no representations regarding the advisability of investing in such products. The Nasdaq-100 Index®, Nasdaq-100®, The Nasdaq National Market®, Nasdaq®, Nasdaq-100 Shares and Nasdaq-100 Trust are trademark or service marks of The Nasdaq Stock Market, Inc. (with which its affiliates are the “Corporations”). These marks are licensed for use by CBOE in connection with the trading of products based on the Nasdaq-100 Index. The products have not been passed on by the Corporations as to their legality or suitability. The products are not issued, endorsed, sold or promoted by the Corporations. THE CORPORATIONS MAKE NO WARRANTIES AND BEAR NO LIABILITY WITH RESPECT TO THE PRODUCT(S). CBOE®, Chicago Board Options Exchange®, CBOE Volatility Index®, FLEX®, FLexible EXchange®, LEAPS®, OEX®, VIX®, and XEO® are registered trademarks of CBOE. BXM, C2, C2 Options Exchange, DVS, Long-term Equity AnticiPation Securities, SPX, Weeklys and XSP are service marks of CBOE. MSCI, EAFE, iShares, BGI and the MSCI index names are service marks of Morgan Stanley Capital International Inc. (“MSCI”), its licensors or their affiliates (the “MSCI Parties”) and have been licensed for use by CBOE. Option contracts on any exchange-traded fund based on an MSCI index are not sponsored, guaranteed or endorsed by MSCI, the issuer of such fund or their affiliates. None of the MSCI Parties makes any representations regarding the advisability of investing in such option contracts. None of the MSCI Parties makes any warranty, express or implied, or bears any liability as to the results to be obtained by any person or any entity from any option contract. No purchaser, seller or holder of this security, or any other person or entity, should use or refer to any trade name, trademark or service mark relating thereto to sponsor, endorse, market or promote any other security without first contacting MSCI to determine whether MSCI’s permission is required. Other names, logos, designs, titles, words or phrases in this publication may constitute trademarks, service marks, or trade names of Chicago Board Options Exchange, Incorporated or other entities and which may be registered in certain jurisdictions. Copyright © 1995 - 2012 Chicago Board Options Exchange, Incorporated. All rights reserved. Printed in USA.

400 South LaSalleChicago, IL 60605www.cboe.com