multi-agency radiological laboratory analytical protocols ......
TRANSCRIPT
Multi-Agency RadiologicalLaboratory Analytical Protocols Manual
Volume I: Chapters 1 � 9 and Appendices A � E
IMPLEMENTATION
PLANNING
ASSESSMENT
MARLAP
NUREG-1576EPA 402-B-04-001A
NTIS PB2004-105421
July 2004

AVAILABILITY OF REFERENCE MATERIALSIN NRC PUBLICATIONS
NRC Reference Material
As of November 1999, you may electronically accessNUREG-series publications and other NRC records atNRC’s Public Electronic Reading Room athttp://www.nrc.gov/reading-rm.html.Publicly released records include, to name a few,NUREG-series publications; Federal Register notices;applicant, licensee, and vendor documents andcorrespondence; NRC correspondence and internalmemoranda; bulletins and information notices;inspection and investigative reports; licensee eventreports; and Commission papers and theirattachments.
NRC publications in the NUREG series, NRCregulations, and Title 10, Energy, in the Code ofFederal Regulations may also be purchased from oneof these two sources.1. The Superintendent of Documents U.S. Government Printing Office Mail Stop SSOP Washington, DC 20402–0001 Internet: bookstore.gpo.gov Telephone: 202-512-1800 Fax: 202-512-22502. The National Technical Information Service Springfield, VA 22161–0002 www.ntis.gov 1–800–553–6847 or, locally, 703–605–6000
A single copy of each NRC draft report for comment isavailable free, to the extent of supply, upon writtenrequest as follows:Address: Office of the Chief Information Officer, Reproduction and Distribution Services Section U.S. Nuclear Regulatory Commission Washington, DC 20555-0001E-mail: [email protected] Facsimile: 301–415–2289
Some publications in the NUREG series that are posted at NRC’s Web site addresshttp://www.nrc.gov/reading-rm/doc-collections/nuregsare updated periodically and may differ from the lastprinted version. Although references to material foundon a Web site bear the date the material wasaccessed, the material available on the date cited maysubsequently be removed from the site.
Non-NRC Reference Material
Documents available from public and special technicallibraries include all open literature items, such asbooks, journal articles, and transactions, FederalRegister notices, Federal and State legislation, andcongressional reports. Such documents as theses,dissertations, foreign reports and translations, andnon-NRC conference proceedings may be purchasedfrom their sponsoring organization.
Copies of industry codes and standards used in asubstantive manner in the NRC regulatory process aremaintained at—
The NRC Technical Library Two White Flint North11545 Rockville PikeRockville, MD 20852–2738
These standards are available in the library forreference use by the public. Codes and standards areusually copyrighted and may be purchased from theoriginating organization or, if they are AmericanNational Standards, from—
American National Standards Institute11 West 42nd StreetNew York, NY 10036–8002www.ansi.org 212–642–4900
Legally binding regulatory requirements are statedonly in laws; NRC regulations; licenses, includingtechnical specifications; or orders, not in NUREG-series publications. The views expressedin contractor-prepared publications in this seriesare not necessarily those of the NRC.
The NUREG series comprises (1) technical andadministrative reports and books prepared by thestaff (NUREG–XXXX) or agency contractors(NUREG/CR–XXXX), (2) proceedings ofconferences (NUREG/CP–XXXX), (3) reportsresulting from international agreements(NUREG/IA–XXXX), (4) brochures(NUREG/BR–XXXX), and (5) compilations of legaldecisions and orders of the Commission andAtomic and Safety Licensing Boards and ofDirectors’ decisions under Section 2.206 of NRC’sregulations (NUREG–0750).
NUREG-1576EPA 402-B-04-001A
NTIS PB2004-105421
Multi-Agency RadiologicalLaboratory Analytical Protocols Manual
(MARLAP)
Part I: Chapters 1 � 9Appendices A � E
(Volume I)
United States Environmental Protection AgencyUnited States Department of DefenseUnited States Department of Energy
United States Department of Homeland SecurityUnited States Nuclear Regulatory CommissionUnited States Food and Drug Administration
United States Geological SurveyNational Institute of Standards and Technology
July 2004

IIIJULY 2004 MARLAP
ABSTRACT
The Multi-Agency Radiological Laboratory Analytical Protocols (MARLAP) manual providesguidance for the planning, implementation, and assessment of projects that require the laboratoryanalysis of radionuclides. MARLAP�s basic goal is to provide guidance for project planners,managers, and laboratory personnel to ensure that radioanalytical laboratory data will meet aproject�s or program�s data requirements. To attain this goal, the manual offers a framework fornational consistency in the form of a performance-based approach for meeting data requirementsthat is scientifically rigorous and flexible enough to be applied to a diversity of projects andprograms. The guidance in MARLAP is designed to help ensure the generation of radioanalyticaldata of known quality, appropriate for its intended use. Examples of data collection activities thatMARLAP supports include site characterization, site cleanup and compliance demonstration,decommissioning of nuclear facilities, emergency response, remedial and removal actions,effluent monitoring of licensed facilities, environmental site monitoring, background studies, andwaste management activities.
MARLAP is organized into two parts. Part I, intended primarily for project planners andmanagers, provides the basic framework of the directed planning process as it applies to projectsrequiring radioanalytical data for decision making. The nine chapters in Part I offerrecommendations and guidance on project planning, key issues to be considered during thedevelopment of analytical protocol specifications, developing measurement quality objectives,project planning documents and their significance, obtaining laboratory services, selecting andapplying analytical methods, evaluating methods and laboratories, verifying and validatingradiochemical data, and assessing data quality. Part II is intended primarily for laboratorypersonnel. Its eleven chapters provide detailed guidance on field sampling issues that affectlaboratory measurements, sample receipt and tracking, sample preparation in the laboratory,sample dissolution, chemical separation techniques, instrumentation for measuring radionuclides,data acquisition, reduction, and reporting, waste management, laboratory quality control,measurement uncertainty, and detection and quantification capability. Seven appendices providecomplementary information and additional details on specific topics.
MARLAP was developed by a workgroup that included representatives from the U.S. Environ-mental Protection Agency (EPA), Department of Energy (DOE), Department of Defense (DOD),Department of Homeland Security (DHS), Nuclear Regulatory Commission (NRC), NationalInstitute of Standards and Technology (NIST), U.S. Geological Survey (USGS), and Food andDrug Administration (FDA), and from the Commonwealth of Kentucky and the State ofCalifornia.


VJULY 2004 MARLAP
FOREWORD
MARLAP is organized into two parts. Part I, consisting of Chapters 1 through 9, is intendedprimarily for project planners and managers. Part I introduces the directed planning processcentral to MARLAP and provides guidance on project planning with emphasis on radioanalyticalplanning issues and radioanalytical data requirements. Part II, consisting of Chapters 10 through20, is intended primarily for laboratory personnel and provides guidance in the relevant areas ofradioanalytical laboratory work. In addition, MARLAP contains seven appendices�labeled Athrough G�that provide complementary information, detail background information, or conceptspertinent to more than one chapter. Six chapters and one appendix are immediately followed byone or more attachments that the authors believe will provide additional or more detailedexplanations of concepts discussed within the chapter. Attachments to chapters have letterdesignators (e.g, Attachment �6A� or �3B�), while attachments to appendices are numbered (e.g.,�B1�). Thus, �Section B.1.1� refers to section 1.1 of appendix B, while �Section B1.1� refers tosection 1 of attachment 1 to appendix B. Cross-references within the text are explicit in order toavoid confusion.
Because of its length, the printed version of MARLAP is bound in three volumes. Volume I(Chapters 1 through 9 and Appendices A through E) contains Part I. Because of its length, Part IIis split between Volumes II and III. Volume II (Chapters 10 through 17 and Appendix F) coversmost of the activities performed at radioanalytical laboratories, from field and sampling issuesthat affect laboratory measurements through waste management. Volume III (Chapters 18through 20 and Appendix G) covers laboratory quality control, measurement uncertainty anddetection and quantification capability. Each volume includes a table of contents, list ofacronyms and abbreviations, and a complete glossary of terms.
MARLAP and its periodic revisions are available online at www.epa.gov/radiation/marlap andwww.nrc.gov/reading-rm/doc-collections/nuregs/staff/sr1576/. The online version is updatedperiodically and may differ from the last printed version. Although references to material foundon a web site bear the date the material was accessed, the material available on the date cited maysubsequently be removed from the site. Printed and CD-ROM versions of MARLAP areavailable through the National Technical Information Service (NTIS). NTIS may be accessedonline at www.ntis.gov. The NTIS Sales Desk can be reached between 8:30 a.m. and 6:00 p.m.Eastern Time, Monday through Friday at 1-800-553-6847; TDD (hearing impaired only) at 703-487-4639 between 8:30 a.m. and 5:00 p.m Eastern Time, Monday through Friday; or fax at 703-605-6900.
MARLAP is a living document, and future editions are already under consideration. Users areurged to provide feedback on how MARLAP can be improved. While suggestions may notalways be acknowledged or adopted, commentors may be assured that they will be consideredcarefully. Comments may be submitted electronically through a link on EPA�s MARLAP website (www.epa.gov/radiation/marlap).

VIIJULY 2004 MARLAP
ACKNOWLEDGMENTS
The origin of the Multi-Agency Radiological Laboratory Analytical Protocols (MARLAP)manual can be traced to the recognition by a number of agencies for the need to have a nationallyconsistent approach to producing radioanalytical data that meet a program�s or project�s needs. Aworkgroup was formed with representatives from the U.S. Environmental Protection Agency(EPA), Department of Energy (DOE), Department of Homeland Security (DHS), NuclearRegulatory Commission (NRC), Department of Defense (DOD), U.S. Geological Survey(USGS), National Institute of Standards and Technology (NIST), and Food and Drug Adminis-tration (FDA) to develop guidance for the planning, implementation, and assessment of projectsthat require the laboratory analysis of radionuclides. Representatives from the Commonwealth ofKentucky and the State of California also contributed to the development of the manual.Contractors and consultants of EPA, DOE, and NRC�and members of the public�have beenpresent during open meetings of the MARLAP workgroup.
MARLAP would not have been possible without the workgroup members who contributed theirtime, talent, and efforts to develop this guidance document:
John Griggs*, EPA, Chair
EPA: H. Benjamin HullMarianne Lynch*Keith McCroan*Eric ReynoldsJon Richards
FDA: Edmond Baratta
DOD: Andrew Scott (Army) Ronald Swatski* (Army)
Jan Dunker (Army Corps of Engineers)William J. Adams (Navy)Troy Blanton (Navy)David Farrand (Navy)Dale Thomas (Air Force)
DOE: Emile Boulos*Stan Morton*Stephanie Woolf*
DHS�: Carl Gogolak*Pamela Greenlaw*Catherine Klusek*Colin Sanderson*
NRC: Rateb (Boby) Abu EidTin MoGeorge Powers
NIST: Kenneth G.W. Inn*
USGS: Ann Mullin*
* These workgroup members also served as chapter chairs.� All with the Environmental Measurements Laboratory, which was part of DOE prior to the establishment of DHS
on March 1, 2003.
Acknowledgments
VIIIMARLAP JULY 2004
Special recognition is given to John Volpe, Commonwealth of Kentucky, and Penny Leinwander,State of California, for their contributions to the development of the MARLAP manual. Thefollowing federal agency contractors provided assistance in developing the MARLAP manual:
EPA: N. Jay Bassin (Environmental Management Support, Inc.)U. Hans Behling ( S. Cohen & Associates, Inc.)Richard Blanchard (S. Cohen & Associates, Inc.)Leca Buchan (Environmental Management Support, Inc.)Jessica Burns (Environmental Management Support, Inc.)Harry ChmelynskiDiane Dopkin (Environmental Management Support, Inc.)Scott Hay (S. Cohen & Associates, Inc.)Patrick Kelly (S. Cohen & Associates, Inc.)Robert LitmanDavid McCurdyCharles (Chick) Phillips (S. Cohen & Associates, Inc.)William Richardson III (S. Cohen & Associates, Inc.)Steven Schaffer (S. Cohen & Associates, Inc.)Michael SchultzRobert Shannon (Time Solutions Corp.)
DOE: Stan Blacker (MACTEC, Inc.)Pat Harrington (MACTEC, Inc.)David McCurdyJohn Maney (Environmental Measurements Assessments)Mike Miller (MACTEC, Inc.)Lisa Smith (Argonne National Laboratory)
NRC: Eric W. Abelquist (ORISE)Dale Condra (ORISE)
The MARLAP workgroup was greatly aided in the development of the manual by thecontributions and support provided by the individuals listed below.
John Arnold (USGS)David Bottrell (DOE)Lloyd Currie (NIST)Mike Carter (EPA)Mary Clark (EPA)Ron Colle (NIST)Mark Doehnert (EPA)Steve Domotor (DOE)Joan Fisk (EPA)
David Friedman (EPA)Lino Fragoso (Navy)Richard Graham (EPA)Patricia Gowland (EPA)Larry Jensen (EPA)K. Jack Kooyoomjian (EPA)Jim Kottan (NRC)Ed Messer (EPA)Kevin Miller (DOE)
Jim Mitchell (EPA)Colleen Petullo (EPA)Steve Pia (EPA)Phil Reed (NRC) Cheryl Trottier (NRC)Mary C. Verwolf (DOE)John Warren (EPA)Mary L. Winston (EPA)Tony Wolbarst (EPA)

Acknowledgments
IXJULY 2004 MARLAP
EPA�s Science Advisory Board (SAB) Radiation Advisory Committee�s Review Subcommitteethat conducted an extensive peer review of the MARLAP includes:
ChairDr. Janet A. Johnson, Shepherd Miller, Inc.
SAB Members Dr. Lynn R. Anspaugh, University of UtahDr. Bruce B. Boecker, (Scientist Emeritus), Lovelace Respiratory Research InstituteDr. Gilles Y. Bussod, Science Network InternationalDr. Thomas F. Gesell, Idaho State UniversityDr. Helen Ann Grogan, Cascade Scientific, Inc.Dr. Richard W. Hornung, University of CincinnatiDr. Jill Lipoti, New Jersey Department of Environmental ProtectionDr. Genevieve S. Roessler, Radiation Consultant
SAB Consultants Dr. Vicki M. Bier, University of WisconsinDr. Stephen L. Brown, R2C2 (Risks of Radiation and Chemical Compounds)Dr. Michael E. Ginevan, M.E. Ginevan & AssociatesDr. Shawki Ibrahim, Colorado State UniversityDr. Bernd Kahn, Georgia Institute of TechnologyDr. June Fabryka-Martin, Los Alamos National LaboratoryDr. Bobby R. Scott, Lovelace Respiratory Research Institute
Science Advisory Board Staff Dr. K. Jack Kooyoomjian, Designated Federal Officer, EPAMs. Mary L. Winston, Management Assistant, EPA
Dozens of individuals and organizations offered hundreds of valuable comments in response tothe Call for Public Comments on the draft MARLAP between August 2001 and January 2002,and their suggestions contributed greatly to the quality and consistency of the final document. While they are too numerous to mention individually, Jay A. MacLellan, Pacific NorthwestNational Laboratory; Daniel J. Strom, Pacific Northwest National Laboratory; and James H.Stapleton, Department of Statistics and Probability of Michigan State University are especiallyacknowledged for their comments and suggestions.


XIJULY 2004 MARLAP
CONTENTSPage
Abstract . . . . . . . . . . . . . . . . . . . . . . . . . . . . . . . . . . . . . . . . . . . . . . . . . . . . . . . . . . . . . . . . . . . . III
Foreword . . . . . . . . . . . . . . . . . . . . . . . . . . . . . . . . . . . . . . . . . . . . . . . . . . . . . . . . . . . . . . . . . . . V
Acknowledgments . . . . . . . . . . . . . . . . . . . . . . . . . . . . . . . . . . . . . . . . . . . . . . . . . . . . . . . . . . . VII
Contents of Appendices . . . . . . . . . . . . . . . . . . . . . . . . . . . . . . . . . . . . . . . . . . . . . . . . . . . . XXXVI
List of Figures . . . . . . . . . . . . . . . . . . . . . . . . . . . . . . . . . . . . . . . . . . . . . . . . . . . . . . . . . . . . . . XLI
List of Tables . . . . . . . . . . . . . . . . . . . . . . . . . . . . . . . . . . . . . . . . . . . . . . . . . . . . . . . . . . . . . . XLV
Acronyms and Abbreviations . . . . . . . . . . . . . . . . . . . . . . . . . . . . . . . . . . . . . . . . . . . . . . . . . . XLIX
Unit Conversion Factors . . . . . . . . . . . . . . . . . . . . . . . . . . . . . . . . . . . . . . . . . . . . . . . . . . . . . LVII
1 Introduction to MARLAP . . . . . . . . . . . . . . . . . . . . . . . . . . . . . . . . . . . . . . . . . . . . . . . . . . . 1-11.1 Overview . . . . . . . . . . . . . . . . . . . . . . . . . . . . . . . . . . . . . . . . . . . . . . . . . . . . . . . . . . . . 1-11.2 Purpose of the Manual . . . . . . . . . . . . . . . . . . . . . . . . . . . . . . . . . . . . . . . . . . . . . . . . . . 1-21.3 Use and Scope of the Manual . . . . . . . . . . . . . . . . . . . . . . . . . . . . . . . . . . . . . . . . . . . . 1-31.4 Key MARLAP Concepts and Terminology . . . . . . . . . . . . . . . . . . . . . . . . . . . . . . . . . . 1-4
1.4.1 Data Life Cycle . . . . . . . . . . . . . . . . . . . . . . . . . . . . . . . . . . . . . . . . . . . . . . . . . 1-41.4.2 Directed Planning Process . . . . . . . . . . . . . . . . . . . . . . . . . . . . . . . . . . . . . . . . . 1-51.4.3 Performance-Based Approach . . . . . . . . . . . . . . . . . . . . . . . . . . . . . . . . . . . . . . 1-51.4.4 Analytical Process . . . . . . . . . . . . . . . . . . . . . . . . . . . . . . . . . . . . . . . . . . . . . . . 1-61.4.5 Analytical Protocol . . . . . . . . . . . . . . . . . . . . . . . . . . . . . . . . . . . . . . . . . . . . . . 1-71.4.6 Analytical Method . . . . . . . . . . . . . . . . . . . . . . . . . . . . . . . . . . . . . . . . . . . . . . . 1-71.4.7 Uncertainty and Error . . . . . . . . . . . . . . . . . . . . . . . . . . . . . . . . . . . . . . . . . . . . . 1-71.4.8 Precision, Bias, and Accuracy . . . . . . . . . . . . . . . . . . . . . . . . . . . . . . . . . . . . . . 1-91.4.9 Performance Objectives: Data Quality Objectives and Measurement Quality
Objectives . . . . . . . . . . . . . . . . . . . . . . . . . . . . . . . . . . . . . . . . . . . . . . . . . . . . 1-101.4.10 Analytical Protocol Specifications . . . . . . . . . . . . . . . . . . . . . . . . . . . . . . . . . . 1-111.4.11 The Assessment Phase . . . . . . . . . . . . . . . . . . . . . . . . . . . . . . . . . . . . . . . . . . . 1-11
1.5 The MARLAP Process . . . . . . . . . . . . . . . . . . . . . . . . . . . . . . . . . . . . . . . . . . . . . . . . . 1-121.6 Structure of the Manual . . . . . . . . . . . . . . . . . . . . . . . . . . . . . . . . . . . . . . . . . . . . . . . . 1-13
1.6.1 Overview of Part I . . . . . . . . . . . . . . . . . . . . . . . . . . . . . . . . . . . . . . . . . . . . . . 1-161.6.2 Overview of Part II . . . . . . . . . . . . . . . . . . . . . . . . . . . . . . . . . . . . . . . . . . . . . . 1-171.6.3 Overview of the Appendices . . . . . . . . . . . . . . . . . . . . . . . . . . . . . . . . . . . . . . 1-18
1.7 References . . . . . . . . . . . . . . . . . . . . . . . . . . . . . . . . . . . . . . . . . . . . . . . . . . . . . . . . . . 1-19

Contents
Page
XIIMARLAP JULY 2004
2 Project Planning Process . . . . . . . . . . . . . . . . . . . . . . . . . . . . . . . . . . . . . . . . . . . . . . . . . . . . 2-12.1 Introduction . . . . . . . . . . . . . . . . . . . . . . . . . . . . . . . . . . . . . . . . . . . . . . . . . . . . . . . . . . 2-12.2 The Importance of Directed Project Planning . . . . . . . . . . . . . . . . . . . . . . . . . . . . . . . . 2-22.3 Directed Project Planning Processes . . . . . . . . . . . . . . . . . . . . . . . . . . . . . . . . . . . . . . . 2-3
2.3.1 A Graded Approach to Project Planning . . . . . . . . . . . . . . . . . . . . . . . . . . . . . . 2-42.3.2 Guidance on Directed Planning Processes . . . . . . . . . . . . . . . . . . . . . . . . . . . . . 2-42.3.3 Elements of Directed Planning Processes . . . . . . . . . . . . . . . . . . . . . . . . . . . . . 2-5
2.4 The Project Planning Team . . . . . . . . . . . . . . . . . . . . . . . . . . . . . . . . . . . . . . . . . . . . . . 2-62.4.1 Team Representation . . . . . . . . . . . . . . . . . . . . . . . . . . . . . . . . . . . . . . . . . . . . . 2-72.4.2 The Radioanalytical Specialists . . . . . . . . . . . . . . . . . . . . . . . . . . . . . . . . . . . . . 2-7
2.5 Directed Planning Process and Role of the Radioanalytical Specialists . . . . . . . . . . . . 2-82.5.1 State the Problem . . . . . . . . . . . . . . . . . . . . . . . . . . . . . . . . . . . . . . . . . . . . . . . 2-112.5.2 Identify the Decision . . . . . . . . . . . . . . . . . . . . . . . . . . . . . . . . . . . . . . . . . . . . 2-12
2.5.2.1 Define the Action Level . . . . . . . . . . . . . . . . . . . . . . . . . . . . . . . . . . . . . . . 2-122.5.2.2 Identify Inputs to the Decision . . . . . . . . . . . . . . . . . . . . . . . . . . . . . . . . . . 2-132.5.2.3 Define the Decision Boundaries . . . . . . . . . . . . . . . . . . . . . . . . . . . . . . . . 2-132.5.2.4 Define the Scale of the Decision . . . . . . . . . . . . . . . . . . . . . . . . . . . . . . . . 2-14
2.5.3 Specify the Decision Rule and the Tolerable Decision Error Rates . . . . . . . . 2-142.5.4 Optimize the Strategy for Obtaining Data . . . . . . . . . . . . . . . . . . . . . . . . . . . . 2-15
2.5.4.1 Analytical Protocol Specifications . . . . . . . . . . . . . . . . . . . . . . . . . . . . . . . 2-162.5.4.2 Measurement Quality Objectives . . . . . . . . . . . . . . . . . . . . . . . . . . . . . . . . 2-16
2.6 Results of the Directed Planning Process . . . . . . . . . . . . . . . . . . . . . . . . . . . . . . . . . . 2-172.6.1 Output Required by the Radioanalytical Laboratory: The Analytical Protocol
Specifications . . . . . . . . . . . . . . . . . . . . . . . . . . . . . . . . . . . . . . . . . . . . . . . . . . 2-182.6.2 Chain of Custody . . . . . . . . . . . . . . . . . . . . . . . . . . . . . . . . . . . . . . . . . . . . . . . 2-19
2.7 Project Planning and Project Implementation and Assessment . . . . . . . . . . . . . . . . . 2-192.7.1 Documenting the Planning Process . . . . . . . . . . . . . . . . . . . . . . . . . . . . . . . . . 2-192.7.2 Obtaining Analytical Services . . . . . . . . . . . . . . . . . . . . . . . . . . . . . . . . . . . . . 2-202.7.3 Selecting Analytical Protocols . . . . . . . . . . . . . . . . . . . . . . . . . . . . . . . . . . . . . 2-202.7.4 Assessment Plans . . . . . . . . . . . . . . . . . . . . . . . . . . . . . . . . . . . . . . . . . . . . . . . 2-21
2.7.4.1 Data Verification . . . . . . . . . . . . . . . . . . . . . . . . . . . . . . . . . . . . . . . . . . . . 2-212.7.4.2 Data Validation . . . . . . . . . . . . . . . . . . . . . . . . . . . . . . . . . . . . . . . . . . . . . 2-222.7.4.3 Data Quality Assessment . . . . . . . . . . . . . . . . . . . . . . . . . . . . . . . . . . . . . . 2-22
2.8 Summary of Recommendations . . . . . . . . . . . . . . . . . . . . . . . . . . . . . . . . . . . . . . . . . . 2-222.9 References . . . . . . . . . . . . . . . . . . . . . . . . . . . . . . . . . . . . . . . . . . . . . . . . . . . . . . . . . . 2-23
3 Key Analytical Planning Issues and Developing Analytical Protocol Specifications . . . . . . 3-13.1 Introduction . . . . . . . . . . . . . . . . . . . . . . . . . . . . . . . . . . . . . . . . . . . . . . . . . . . . . . . . . . 3-13.2 Overview of the Analytical Process . . . . . . . . . . . . . . . . . . . . . . . . . . . . . . . . . . . . . . . . 3-23.3 General Analytical Planning Issues . . . . . . . . . . . . . . . . . . . . . . . . . . . . . . . . . . . . . . . . 3-2

Contents
Page
XIIIJULY 2004 MARLAP
3.3.1 Develop Analyte List . . . . . . . . . . . . . . . . . . . . . . . . . . . . . . . . . . . . . . . . . . . . . 3-33.3.2 Identify Concentration Ranges . . . . . . . . . . . . . . . . . . . . . . . . . . . . . . . . . . . . . . 3-53.3.3 Identify and Characterize Matrices of Concern . . . . . . . . . . . . . . . . . . . . . . . . . 3-53.3.4 Determine Relationships Among the Radionuclides of Concern . . . . . . . . . . . 3-63.3.5 Determine Available Project Resources and Deadlines . . . . . . . . . . . . . . . . . . . 3-73.3.6 Refine Analyte List and Matrix List . . . . . . . . . . . . . . . . . . . . . . . . . . . . . . . . . 3-73.3.7 Method Performance Characteristics and Measurement Quality Objectives . . . 3-7
3.3.7.1 Develop MQOs for Select Method Performance Characteristics . . . . . . . . 3-93.3.7.2 The Role of MQOs in the Protocol Selection and Evaluation Process . . . 3-143.3.7.3 The Role of MQOs in the Project�s Data Evaluation Process . . . . . . . . . . 3-14
3.3.8 Determine Any Limitations on Analytical Options . . . . . . . . . . . . . . . . . . . . . 3-153.3.8.1 Gamma Spectrometry . . . . . . . . . . . . . . . . . . . . . . . . . . . . . . . . . . . . . . . . 3-163.3.8.2 Gross Alpha and Beta Analyses . . . . . . . . . . . . . . . . . . . . . . . . . . . . . . . . . 3-163.3.8.3 Radiochemical Nuclide-Specific Analysis . . . . . . . . . . . . . . . . . . . . . . . . . 3-17
3.3.9 Determine Method Availability . . . . . . . . . . . . . . . . . . . . . . . . . . . . . . . . . . . 3-173.3.10 Determine the Type and Frequency of, and Evaluation Criteria for, Quality
Control Samples . . . . . . . . . . . . . . . . . . . . . . . . . . . . . . . . . . . . . . . . . . . . . . . 3-173.3.11 Determine Sample Tracking and Custody Requirements . . . . . . . . . . . . . . . . 3-183.3.12 Determine Data Reporting Requirements . . . . . . . . . . . . . . . . . . . . . . . . . . . . 3-19
3.4 Matrix-Specific Analytical Planning Issues . . . . . . . . . . . . . . . . . . . . . . . . . . . . . . . . . 3-203.4.1 Solids . . . . . . . . . . . . . . . . . . . . . . . . . . . . . . . . . . . . . . . . . . . . . . . . . . . . . . . . 3-21
3.4.1.1 Removal of Unwanted Materials . . . . . . . . . . . . . . . . . . . . . . . . . . . . . . . . 3-213.4.1.2 Homogenization and Subsampling . . . . . . . . . . . . . . . . . . . . . . . . . . . . . . 3-213.4.1.3 Sample Dissolution . . . . . . . . . . . . . . . . . . . . . . . . . . . . . . . . . . . . . . . . . . 3-22
3.4.2 Liquids . . . . . . . . . . . . . . . . . . . . . . . . . . . . . . . . . . . . . . . . . . . . . . . . . . . . . . . 3-223.4.3 Filters and Wipes . . . . . . . . . . . . . . . . . . . . . . . . . . . . . . . . . . . . . . . . . . . . . . . 3-23
3.5 Assembling the Analytical Protocol Specifications . . . . . . . . . . . . . . . . . . . . . . . . . . . 3-233.6 Level of Protocol Performance Demonstration . . . . . . . . . . . . . . . . . . . . . . . . . . . . . . 3-243.7 Project Plan Documents . . . . . . . . . . . . . . . . . . . . . . . . . . . . . . . . . . . . . . . . . . . . . . . . 3-243.8 Summary of Recommendations . . . . . . . . . . . . . . . . . . . . . . . . . . . . . . . . . . . . . . . . . . 3-273.9 References . . . . . . . . . . . . . . . . . . . . . . . . . . . . . . . . . . . . . . . . . . . . . . . . . . . . . . . . . . 3-27Attachment 3A: Measurement Uncertainty . . . . . . . . . . . . . . . . . . . . . . . . . . . . . . . . . . . . 3-29
3A.1 Introduction . . . . . . . . . . . . . . . . . . . . . . . . . . . . . . . . . . . . . . . . . . . . . . . . . . . 3-293A.2 Analogy: Political Polling . . . . . . . . . . . . . . . . . . . . . . . . . . . . . . . . . . . . . . . . 3-293A.3 Measurement Uncertainty . . . . . . . . . . . . . . . . . . . . . . . . . . . . . . . . . . . . . . . . 3-303A.4 Sources of Measurement Uncertainty . . . . . . . . . . . . . . . . . . . . . . . . . . . . . . . 3-313A.5 Uncertainty Propagation . . . . . . . . . . . . . . . . . . . . . . . . . . . . . . . . . . . . . . . . . . 3-323A.6 References . . . . . . . . . . . . . . . . . . . . . . . . . . . . . . . . . . . . . . . . . . . . . . . . . . . . 3-32
Attachment 3B: Analyte Detection . . . . . . . . . . . . . . . . . . . . . . . . . . . . . . . . . . . . . . . . . . 3-333B.1 Introduction . . . . . . . . . . . . . . . . . . . . . . . . . . . . . . . . . . . . . . . . . . . . . . . . . . . . . 3-33

Contents
Page
XIVMARLAP JULY 2004
3B.2 The Critical Value . . . . . . . . . . . . . . . . . . . . . . . . . . . . . . . . . . . . . . . . . . . . . . 3-343B.3 The Minimum Detectable Value . . . . . . . . . . . . . . . . . . . . . . . . . . . . . . . . . . . 3-353B.4 Sources of Confusion . . . . . . . . . . . . . . . . . . . . . . . . . . . . . . . . . . . . . . . . . . . . 3-363B.5 Implementation Difficulties . . . . . . . . . . . . . . . . . . . . . . . . . . . . . . . . . . . . . . . 3-37
4 Project Plan Documents . . . . . . . . . . . . . . . . . . . . . . . . . . . . . . . . . . . . . . . . . . . . . . . . . . . . 4-14.1 Introduction . . . . . . . . . . . . . . . . . . . . . . . . . . . . . . . . . . . . . . . . . . . . . . . . . . . . . . . . . . 4-14.2 The Importance of Project Plan Documents . . . . . . . . . . . . . . . . . . . . . . . . . . . . . . . . . 4-24.3 A Graded Approach to Project Plan Documents . . . . . . . . . . . . . . . . . . . . . . . . . . . . . 4-34.4 Structure of Project Plan Documents . . . . . . . . . . . . . . . . . . . . . . . . . . . . . . . . . . . . . . 4-3
4.4.1 Guidance on Project Plan Documents . . . . . . . . . . . . . . . . . . . . . . . . . . . . . . . . 4-44.4.2 Approaches to Project Plan Documents . . . . . . . . . . . . . . . . . . . . . . . . . . . . . . 4-5
4.5 Elements of Project Plan Documents . . . . . . . . . . . . . . . . . . . . . . . . . . . . . . . . . . . . . . . 4-64.5.1 Content of Project Plan Documents . . . . . . . . . . . . . . . . . . . . . . . . . . . . . . . . . . 4-64.5.2 Plan Documents Integration . . . . . . . . . . . . . . . . . . . . . . . . . . . . . . . . . . . . . . . . 4-94.5.3 Plan Content for Small Projects . . . . . . . . . . . . . . . . . . . . . . . . . . . . . . . . . . . . 4-9
4.6 Linking the Project Plan Documents and the Project Planning Process . . . . . . . . . . . 4-104.6.1 Planning Process Report . . . . . . . . . . . . . . . . . . . . . . . . . . . . . . . . . . . . . . . . . 4-144.6.2 Data Assessment . . . . . . . . . . . . . . . . . . . . . . . . . . . . . . . . . . . . . . . . . . . . . . . 4-15
4.6.2.1 Data Verification . . . . . . . . . . . . . . . . . . . . . . . . . . . . . . . . . . . . . . . . . . . . 4-154.6.2.2 Data Validation . . . . . . . . . . . . . . . . . . . . . . . . . . . . . . . . . . . . . . . . . . . . . 4-154.6.2.3 Data Quality Assessment . . . . . . . . . . . . . . . . . . . . . . . . . . . . . . . . . . . . . . 4-16
4.7 Summary of Recommendations . . . . . . . . . . . . . . . . . . . . . . . . . . . . . . . . . . . . . . . . . . 4-174.8 References . . . . . . . . . . . . . . . . . . . . . . . . . . . . . . . . . . . . . . . . . . . . . . . . . . . . . . . . . . 4-17
5 Obtaining Laboratory Services . . . . . . . . . . . . . . . . . . . . . . . . . . . . . . . . . . . . . . . . . . . . . . . . 5-15.1 Introduction . . . . . . . . . . . . . . . . . . . . . . . . . . . . . . . . . . . . . . . . . . . . . . . . . . . . . . . . . . 5-15.2 Importance of Writing a Technical and Contractual Specification Document . . . . . . . 5-25.3 Statement of Work�Technical Requirements . . . . . . . . . . . . . . . . . . . . . . . . . . . . . . . 5-2
5.3.1 Analytes . . . . . . . . . . . . . . . . . . . . . . . . . . . . . . . . . . . . . . . . . . . . . . . . . . . . . . . 5-35.3.2 Matrix . . . . . . . . . . . . . . . . . . . . . . . . . . . . . . . . . . . . . . . . . . . . . . . . . . . . . . . . . 5-35.3.3 Measurement Quality Objectives . . . . . . . . . . . . . . . . . . . . . . . . . . . . . . . . . . . . 5-35.3.4 Unique Analytical Process Requirements . . . . . . . . . . . . . . . . . . . . . . . . . . . . . 5-45.3.5 Quality Control Samples and Participation in External Performance Evaluation
Programs . . . . . . . . . . . . . . . . . . . . . . . . . . . . . . . . . . . . . . . . . . . . . . . . . . . . . . 5-45.3.6 Laboratory Radiological Holding and Turnaround Times . . . . . . . . . . . . . . . . . 5-55.3.7 Number of Samples and Schedule . . . . . . . . . . . . . . . . . . . . . . . . . . . . . . . . . . 5-55.3.8 Quality System . . . . . . . . . . . . . . . . . . . . . . . . . . . . . . . . . . . . . . . . . . . . . . . . . . 5-65.3.9 Laboratory�s Proposed Methods . . . . . . . . . . . . . . . . . . . . . . . . . . . . . . . . . . . . 5-6
5.4 Request for Proposal�Generic Contractual Requirements . . . . . . . . . . . . . . . . . . . 5-7
Contents
Page
XVJULY 2004 MARLAP
5.4.1 Sample Management . . . . . . . . . . . . . . . . . . . . . . . . . . . . . . . . . . . . . . . . . . . . . . . 5-75.4.2 Licenses, Permits and Environmental Regulations . . . . . . . . . . . . . . . . . . . . . . 5-8
5.4.2.1 Licenses . . . . . . . . . . . . . . . . . . . . . . . . . . . . . . . . . . . . . . . . . . . . . . . . . . . . 5-85.4.2.2 Environmental and Transportation Regulations . . . . . . . . . . . . . . . . . . . . . 5-8
5.4.3 Data Reporting and Communications . . . . . . . . . . . . . . . . . . . . . . . . . . . . . . . . 5-95.4.3.1 Data Deliverables . . . . . . . . . . . . . . . . . . . . . . . . . . . . . . . . . . . . . . . . . . . . . 5-95.4.3.2 Software Verification and Control . . . . . . . . . . . . . . . . . . . . . . . . . . . . . . . 5-105.4.3.3 Problem Notification and Communication . . . . . . . . . . . . . . . . . . . . . . . . 5-105.4.3.4 Status Reports . . . . . . . . . . . . . . . . . . . . . . . . . . . . . . . . . . . . . . . . . . . . . . 5-11
5.4.4 Sample Re-Analysis Requirements . . . . . . . . . . . . . . . . . . . . . . . . . . . . . . . . . 5-115.4.5 Subcontracted Analyses . . . . . . . . . . . . . . . . . . . . . . . . . . . . . . . . . . . . . . . . . . 5-11
5.5 Laboratory Selection and Qualification Criteria . . . . . . . . . . . . . . . . . . . . . . . . . . . . . 5-115.5.1 Technical Proposal Evaluation . . . . . . . . . . . . . . . . . . . . . . . . . . . . . . . . . . . . 5-12
5.5.1.1 Scoring and Evaluation Scheme . . . . . . . . . . . . . . . . . . . . . . . . . . . . . . . . 5-125.5.1.2 Scoring Elements . . . . . . . . . . . . . . . . . . . . . . . . . . . . . . . . . . . . . . . . . . . . 5-13
5.5.2 Pre-Award Proficiency Evaluation . . . . . . . . . . . . . . . . . . . . . . . . . . . . . . . . . 5-145.5.3 Pre-Award Assessments and Audits . . . . . . . . . . . . . . . . . . . . . . . . . . . . . . . . . . 5-15
5.6 Summary of Recommendations . . . . . . . . . . . . . . . . . . . . . . . . . . . . . . . . . . . . . . . . . . 5-155.7 References . . . . . . . . . . . . . . . . . . . . . . . . . . . . . . . . . . . . . . . . . . . . . . . . . . . . . . . 5-16
5.7.1 Cited References . . . . . . . . . . . . . . . . . . . . . . . . . . . . . . . . . . . . . . . . . . . . . . . 5-165.7.2 Other Sources . . . . . . . . . . . . . . . . . . . . . . . . . . . . . . . . . . . . . . . . . . . . . . . . . . 5-16
6 Selection and Application of an Analytical Method . . . . . . . . . . . . . . . . . . . . . . . . . . . . . . . 6-16.1 Introduction . . . . . . . . . . . . . . . . . . . . . . . . . . . . . . . . . . . . . . . . . . . . . . . . . . . . . . . . . . 6-16.2 Method Definition . . . . . . . . . . . . . . . . . . . . . . . . . . . . . . . . . . . . . . . . . . . . . . . . . . . . . 6-36.3 Life Cycle of Method Application . . . . . . . . . . . . . . . . . . . . . . . . . . . . . . . . . . . . . . . . . 6-56.4 Generic Considerations for Method Development and Selection . . . . . . . . . . . . . . . . . 6-96.5 Project-Specific Considerations for Method Selection . . . . . . . . . . . . . . . . . . . . . . . . 6-11
6.5.1 Matrix and Analyte Identification . . . . . . . . . . . . . . . . . . . . . . . . . . . . . . . . . . 6-116.5.1.1 Matrices . . . . . . . . . . . . . . . . . . . . . . . . . . . . . . . . . . . . . . . . . . . . . . . . . . . 6-116.5.1.2. Analytes and Potential Interferences . . . . . . . . . . . . . . . . . . . . . . . . . . . . 6-14
6.5.2 Process Knowledge . . . . . . . . . . . . . . . . . . . . . . . . . . . . . . . . . . . . . . . . . . . . . . . 6-146.5.3 Radiological Holding and Turnaround Times . . . . . . . . . . . . . . . . . . . . . . . . . 6-156.5.4 Unique Process Specifications . . . . . . . . . . . . . . . . . . . . . . . . . . . . . . . . . . . . . 6-166.5.5 Measurement Quality Objectives . . . . . . . . . . . . . . . . . . . . . . . . . . . . . . . . . . . 6-17
6.5.5.1 Method Uncertainty . . . . . . . . . . . . . . . . . . . . . . . . . . . . . . . . . . . . . . . . . 6-176.5.5.2 Quantification Capability . . . . . . . . . . . . . . . . . . . . . . . . . . . . . . . . . . . . . . 6-186.5.5.3 Detection Capability . . . . . . . . . . . . . . . . . . . . . . . . . . . . . . . . . . . . . . . . . 6-196.5.5.4 Applicable Analyte Concentration Range . . . . . . . . . . . . . . . . . . . . . . . . . 6-206.5.5.5 Method Specificity . . . . . . . . . . . . . . . . . . . . . . . . . . . . . . . . . . . . . . . . . . . 6-20

Contents
Page
XVIMARLAP JULY 2004
6.5.5.6 Method Ruggedness . . . . . . . . . . . . . . . . . . . . . . . . . . . . . . . . . . . . . . . . . 6-216.5.5.7 Bias Considerations . . . . . . . . . . . . . . . . . . . . . . . . . . . . . . . . . . . . . . . . . . 6-21
6.6 Method Validation . . . . . . . . . . . . . . . . . . . . . . . . . . . . . . . . . . . . . . . . . . . . . . . . . . . . 6-226.6.1 General Method Validation . . . . . . . . . . . . . . . . . . . . . . . . . . . . . . . . . . . . . . . 6-246.6.2 Project Method Validation Protocol . . . . . . . . . . . . . . . . . . . . . . . . . . . . . . . . 6-256.6.3 Tiered Approach to Project Method Validation . . . . . . . . . . . . . . . . . . . . . . . . 6-26
6.6.3.1 Existing Methods Requiring No Additional Validation . . . . . . . . . . . . . . 6-286.6.3.2 Routine Methods Having No Project Method Validation . . . . . . . . . . . . . 6-286.6.3.3 Use of a Validated Method for Similar Matrices . . . . . . . . . . . . . . . . . . . . 6-286.6.3.4 New Application of a Validated Method . . . . . . . . . . . . . . . . . . . . . . . . . . 6-296.6.3.5 Newly Developed or Adapted Methods . . . . . . . . . . . . . . . . . . . . . . . . . . . 6-30
6.6.4 Testing for Bias . . . . . . . . . . . . . . . . . . . . . . . . . . . . . . . . . . . . . . . . . . . . . . . . 6-316.6.4.1 Absolute Bias . . . . . . . . . . . . . . . . . . . . . . . . . . . . . . . . . . . . . . . . . . . . . . . 6-316.6.4.2 Relative Bias . . . . . . . . . . . . . . . . . . . . . . . . . . . . . . . . . . . . . . . . . . . . . . . 6-32
6.6.5 Project Method Validation Documentation . . . . . . . . . . . . . . . . . . . . . . . . . . . 6-326.7 Analyst Qualifications and Demonstrated Proficiency . . . . . . . . . . . . . . . . . . . . . . . 6-326.8 Method Control . . . . . . . . . . . . . . . . . . . . . . . . . . . . . . . . . . . . . . . . . . . . . . . . . . . . . . 6-336.9 Continued Performance Assessment . . . . . . . . . . . . . . . . . . . . . . . . . . . . . . . . . . . 6-346.10 Documentation To Be Sent to the Project Manager . . . . . . . . . . . . . . . . . . . . . . . 6-356.11 Summary of Recommendations . . . . . . . . . . . . . . . . . . . . . . . . . . . . . . . . . . . . . . . 6-366.12 References . . . . . . . . . . . . . . . . . . . . . . . . . . . . . . . . . . . . . . . . . . . . . . . . . . . . . . . 6-36Attachment 6A: Bias-Testing Procedure . . . . . . . . . . . . . . . . . . . . . . . . . . . . . . . . . . . . . . 6-39
6A.1 Introduction . . . . . . . . . . . . . . . . . . . . . . . . . . . . . . . . . . . . . . . . . . . . . . . . . . . . 6-396A.2 The Test . . . . . . . . . . . . . . . . . . . . . . . . . . . . . . . . . . . . . . . . . . . . . . . . . . . . . . . 6-396A.3 Bias Tests at Multiple Concentrations . . . . . . . . . . . . . . . . . . . . . . . . . . . . . . . . 6-42
7 Evaluating Methods and Laboratories . . . . . . . . . . . . . . . . . . . . . . . . . . . . . . . . . . . . . . . . . . 7-17.1 Introduction . . . . . . . . . . . . . . . . . . . . . . . . . . . . . . . . . . . . . . . . . . . . . . . . . . . . . . . . . . 7-17.2 Evaluation of Proposed Analytical Methods . . . . . . . . . . . . . . . . . . . . . . . . . . . . . . . . . 7-2
7.2.1 Documentation of Required Method Performance . . . . . . . . . . . . . . . . . . . . . . 7-27.2.1.1 Method Validation Documentation . . . . . . . . . . . . . . . . . . . . . . . . . . . . . . . 7-37.2.1.2 Internal Quality Control or External PE Program Reports . . . . . . . . . . . . . 7-47.2.1.3 Method Experience, Previous Projects, and Clients . . . . . . . . . . . . . . . . . . 7-57.2.1.4 Internal and External Quality Assurance Assessments . . . . . . . . . . . . . . . . 7-5
7.2.2 Performance Requirements of the SOW�Analytical Protocol Specifications . 7-57.2.2.1 Matrix and Analyte Identification . . . . . . . . . . . . . . . . . . . . . . . . . . . . . . . . 7-67.2.2.2 Radiological Holding and Turnaround Times . . . . . . . . . . . . . . . . . . . . . . . 7-77.2.2.3 Unique Processing Specifications . . . . . . . . . . . . . . . . . . . . . . . . . . . . . . . . 7-87.2.2.4 Measurement Quality Objectives . . . . . . . . . . . . . . . . . . . . . . . . . . . . . . . . . 7-87.2.2.5 Bias Considerations . . . . . . . . . . . . . . . . . . . . . . . . . . . . . . . . . . . . . . . . . . 7-13
Contents
Page
XVIIJULY 2004 MARLAP
7.3 Initial Evaluation of a Laboratory . . . . . . . . . . . . . . . . . . . . . . . . . . . . . . . . . . . . . . . . 7-157.3.1 Review of Quality System Documents . . . . . . . . . . . . . . . . . . . . . . . . . . . . . . 7-157.3.2 Adequacy of Facilities, Instrumentation, and Staff Levels . . . . . . . . . . . . . . . 7-177.3.3 Review of Applicable Prior Work . . . . . . . . . . . . . . . . . . . . . . . . . . . . . . . . . . 7-177.3.4 Review of General Laboratory Performance . . . . . . . . . . . . . . . . . . . . . . . . . . 7-18
7.3.4.1 Review of Internal QC Results . . . . . . . . . . . . . . . . . . . . . . . . . . . . . . . . . 7-187.3.4.2 External PE Program Results . . . . . . . . . . . . . . . . . . . . . . . . . . . . . . . . . . . 7-197.3.4.3 Internal and External Quality Assessment Reports . . . . . . . . . . . . . . . . . . 7-20
7.3.5 Initial Audit . . . . . . . . . . . . . . . . . . . . . . . . . . . . . . . . . . . . . . . . . . . . . . . . . . . 7-207.4 Ongoing Evaluation of the Laboratory�s Performance . . . . . . . . . . . . . . . . . . . . . . . . 7-20
7.4.1 Quantitative Measures of Quality . . . . . . . . . . . . . . . . . . . . . . . . . . . . . . . . . . 7-217.4.1.1 MQO Compliance . . . . . . . . . . . . . . . . . . . . . . . . . . . . . . . . . . . . . . . . . . . 7-227.4.1.2 Other Parameters . . . . . . . . . . . . . . . . . . . . . . . . . . . . . . . . . . . . . . . . . . . . 7-27
7.4.2 Operational Aspects . . . . . . . . . . . . . . . . . . . . . . . . . . . . . . . . . . . . . . . . . . . . . 7-287.4.2.1 Desk Audits . . . . . . . . . . . . . . . . . . . . . . . . . . . . . . . . . . . . . . . . . . . . . . . . 7-287.4.2.2 Onsite Audits . . . . . . . . . . . . . . . . . . . . . . . . . . . . . . . . . . . . . . . . . . . . . . . 7-30
7.5 Summary of Recommendations . . . . . . . . . . . . . . . . . . . . . . . . . . . . . . . . . . . . . . . . . . 7-327.6 References . . . . . . . . . . . . . . . . . . . . . . . . . . . . . . . . . . . . . . . . . . . . . . . . . . . . . . . . . . 7-33
8 Radiochemical Data Verification and Validation . . . . . . . . . . . . . . . . . . . . . . . . . . . . . . . . . 8-18.1 Introduction . . . . . . . . . . . . . . . . . . . . . . . . . . . . . . . . . . . . . . . . . . . . . . . . . . . . . . . . . . 8-18.2 Data Assessment Process . . . . . . . . . . . . . . . . . . . . . . . . . . . . . . . . . . . . . . . . . . . . . . . . 8-2
8.2.1 Planning Phase of the Data Life Cycle . . . . . . . . . . . . . . . . . . . . . . . . . . . . . . . . 8-28.2.2 Implementation Phase of the Data Life Cycle . . . . . . . . . . . . . . . . . . . . . . . . . . 8-3
8.2.2.1 Project Objectives . . . . . . . . . . . . . . . . . . . . . . . . . . . . . . . . . . . . . . . . . . . . 8-38.2.2.2 Documenting Project Activities . . . . . . . . . . . . . . . . . . . . . . . . . . . . . . . . . 8-48.2.2.3 Quality Assurance/Quality Control . . . . . . . . . . . . . . . . . . . . . . . . . . . . . . 8-4
8.2.3 Assessment Phase of the Data Life Cycle . . . . . . . . . . . . . . . . . . . . . . . . . . . . . 8-58.3 Validation Plan . . . . . . . . . . . . . . . . . . . . . . . . . . . . . . . . . . . . . . . . . . . . . . . . . . . . . . . . 8-7
8.3.1 Technical and Quality Objectives of the Project . . . . . . . . . . . . . . . . . . . . . . . . 8-88.3.2 Validation Tests . . . . . . . . . . . . . . . . . . . . . . . . . . . . . . . . . . . . . . . . . . . . . . . . . 8-98.3.3 Data Qualifiers . . . . . . . . . . . . . . . . . . . . . . . . . . . . . . . . . . . . . . . . . . . . . . . . . . 8-98.3.4 Reporting and Documentation . . . . . . . . . . . . . . . . . . . . . . . . . . . . . . . . . . . . . 8-10
8.4 Other Essential Elements for Data Validation . . . . . . . . . . . . . . . . . . . . . . . . . . . . . . . 8-118.4.1 Statement of Work . . . . . . . . . . . . . . . . . . . . . . . . . . . . . . . . . . . . . . . . . . . . . . 8-118.4.2 Verified Data Deliverables . . . . . . . . . . . . . . . . . . . . . . . . . . . . . . . . . . . . . . . . 8-12
8.5 Data Verification and Validation Process . . . . . . . . . . . . . . . . . . . . . . . . . . . . . . . . . . 8-128.5.1 The Sample Handling and Analysis System . . . . . . . . . . . . . . . . . . . . . . . . . . 8-13
8.5.1.1 Sample Descriptors . . . . . . . . . . . . . . . . . . . . . . . . . . . . . . . . . . . . . . . . . . 8-148.5.1.2 Aliquant Size . . . . . . . . . . . . . . . . . . . . . . . . . . . . . . . . . . . . . . . . . . . . . . . 8-15
Contents
Page
XVIIIMARLAP JULY 2004
8.5.1.3 Dates of Sample Collection, Preparation, and Analysis . . . . . . . . . . . . . . 8-168.5.1.4 Preservation . . . . . . . . . . . . . . . . . . . . . . . . . . . . . . . . . . . . . . . . . . . . . . . . 8-168.5.1.5 Tracking . . . . . . . . . . . . . . . . . . . . . . . . . . . . . . . . . . . . . . . . . . . . . . . . . . . 8-178.5.1.6 Traceability . . . . . . . . . . . . . . . . . . . . . . . . . . . . . . . . . . . . . . . . . . . . . . . . 8-178.5.1.7 QC Types and Linkages . . . . . . . . . . . . . . . . . . . . . . . . . . . . . . . . . . . . . . . 8-188.5.1.8 Chemical Separation (Yield) . . . . . . . . . . . . . . . . . . . . . . . . . . . . . . . . . . . 8-188.5.1.9 Self-Absorption . . . . . . . . . . . . . . . . . . . . . . . . . . . . . . . . . . . . . . . . . . . . . 8-198.5.1.10 Efficiency, Calibration Curves, and Instrument Background . . . . . . . . . 8-198.5.1.11 Spectrometry Resolution . . . . . . . . . . . . . . . . . . . . . . . . . . . . . . . . . . . . . 8-208.5.1.12 Dilution and Correction Factors . . . . . . . . . . . . . . . . . . . . . . . . . . . . . . . . 8-208.5.1.13 Counts and Count Time (Duration) . . . . . . . . . . . . . . . . . . . . . . . . . . . . . 8-218.5.1.14 Result of Measurement, Uncertainty, Minimum Detectable Concentration,
and Units . . . . . . . . . . . . . . . . . . . . . . . . . . . . . . . . . . . . . . . . . . . . . . . . . . . . . 8-218.5.2 Quality Control Samples . . . . . . . . . . . . . . . . . . . . . . . . . . . . . . . . . . . . . . . . . 8-22
8.5.2.1 Method Blank . . . . . . . . . . . . . . . . . . . . . . . . . . . . . . . . . . . . . . . . . . . . . . . 8-238.5.2.2 Laboratory Control Samples . . . . . . . . . . . . . . . . . . . . . . . . . . . . . . . . . . . 8-238.5.2.3 Laboratory Replicates . . . . . . . . . . . . . . . . . . . . . . . . . . . . . . . . . . . . . . . . 8-248.5.2.4 Matrix Spikes and Matrix Spike Duplicates . . . . . . . . . . . . . . . . . . . . . . . 8-24
8.5.3 Tests of Detection and Unusual Uncertainty . . . . . . . . . . . . . . . . . . . . . . . . . . 8-258.5.3.1 Detection . . . . . . . . . . . . . . . . . . . . . . . . . . . . . . . . . . . . . . . . . . . . . . . . . . 8-258.5.3.2 Detection Capability . . . . . . . . . . . . . . . . . . . . . . . . . . . . . . . . . . . . . . . . . 8-268.5.3.3 Large or Unusual Uncertainty . . . . . . . . . . . . . . . . . . . . . . . . . . . . . . . . . . 8-27
8.5.4 Final Qualification and Reporting . . . . . . . . . . . . . . . . . . . . . . . . . . . . . . . . . . 8-278.6 Validation Report . . . . . . . . . . . . . . . . . . . . . . . . . . . . . . . . . . . . . . . . . . . . . . . . . . . . . 8-298.7 Summary of Recommendations . . . . . . . . . . . . . . . . . . . . . . . . . . . . . . . . . . . . . . . . . . 8-318.8 Bibliography . . . . . . . . . . . . . . . . . . . . . . . . . . . . . . . . . . . . . . . . . . . . . . . . . . . . . . . . . 8-31
9 Data Quality Assessment . . . . . . . . . . . . . . . . . . . . . . . . . . . . . . . . . . . . . . . . . . . . . . . . . . . . 9-19.1 Introduction . . . . . . . . . . . . . . . . . . . . . . . . . . . . . . . . . . . . . . . . . . . . . . . . . . . . . . . . . . 9-19.2 Assessment Phase . . . . . . . . . . . . . . . . . . . . . . . . . . . . . . . . . . . . . . . . . . . . . . . . . . . . . 9-29.3 Graded Approach to Assessment . . . . . . . . . . . . . . . . . . . . . . . . . . . . . . . . . . . . . . . . . . 9-39.4 The Data Quality Assessment Team . . . . . . . . . . . . . . . . . . . . . . . . . . . . . . . . . . . . . . . 9-39.5 Data Quality Assessment Plan . . . . . . . . . . . . . . . . . . . . . . . . . . . . . . . . . . . . . . . . . . . . 9-49.6 Data Quality Assessment Process . . . . . . . . . . . . . . . . . . . . . . . . . . . . . . . . . . . . . . . . . 9-5
9.6.1 Review of Project Documents . . . . . . . . . . . . . . . . . . . . . . . . . . . . . . . . . . . . . . 9-79.6.1.1 The Project DQOs and MQOs . . . . . . . . . . . . . . . . . . . . . . . . . . . . . . . . . . . 9-79.6.1.2 The DQA Plan . . . . . . . . . . . . . . . . . . . . . . . . . . . . . . . . . . . . . . . . . . . . . . . 9-89.6.1.3 Summary of the DQA Review . . . . . . . . . . . . . . . . . . . . . . . . . . . . . . . . . . . 9-8
9.6.2 Sample Representativeness . . . . . . . . . . . . . . . . . . . . . . . . . . . . . . . . . . . . . . . . 9-99.6.2.1 Review of the Sampling Plan . . . . . . . . . . . . . . . . . . . . . . . . . . . . . . . . . . . . 9-9

Contents
Page
XIXJULY 2004 MARLAP
9.6.2.2 Sampling Plan Implementation . . . . . . . . . . . . . . . . . . . . . . . . . . . . . . . . . 9-129.6.2.3 Data Considerations . . . . . . . . . . . . . . . . . . . . . . . . . . . . . . . . . . . . . . . . . . 9-13
9.6.3 Data Accuracy . . . . . . . . . . . . . . . . . . . . . . . . . . . . . . . . . . . . . . . . . . . . . . . . . 9-149.6.3.1 Review of the Analytical Plan . . . . . . . . . . . . . . . . . . . . . . . . . . . . . . . . . . 9-189.6.3.2 Analytical Plan Implementation . . . . . . . . . . . . . . . . . . . . . . . . . . . . . . . . 9-19
9.6.4 Decisions and Tolerable Error Rates . . . . . . . . . . . . . . . . . . . . . . . . . . . . . . . . 9-219.6.4.1 Statistical Evaluation of Data . . . . . . . . . . . . . . . . . . . . . . . . . . . . . . . . . . 9-219.6.4.2 Evaluation of Decision Error Rates . . . . . . . . . . . . . . . . . . . . . . . . . . . . . 9-24
9.7 Data Quality Assessment Report . . . . . . . . . . . . . . . . . . . . . . . . . . . . . . . . . . . . . . . . . 9-259.8 Summary of Recommendations . . . . . . . . . . . . . . . . . . . . . . . . . . . . . . . . . . . . . . . . . . 9-269.9 References . . . . . . . . . . . . . . . . . . . . . . . . . . . . . . . . . . . . . . . . . . . . . . . . . . . . . . . . . . 9-27
9.9.1 Cited Sources . . . . . . . . . . . . . . . . . . . . . . . . . . . . . . . . . . . . . . . . . . . . . . . . . . 9-279.9.2 Other Sources . . . . . . . . . . . . . . . . . . . . . . . . . . . . . . . . . . . . . . . . . . . . . . . . . . 9-27
Volume II
10 Field and Sampling Issues That Affect Laboratory Measurements . . . . . . . . . . . . . . . . . 10-1Part A: Generic Issues . . . . . . . . . . . . . . . . . . . . . . . . . . . . . . . . . . . . . . . . . . . . . . . . . . . . 10-110.1 Introduction . . . . . . . . . . . . . . . . . . . . . . . . . . . . . . . . . . . . . . . . . . . . . . . . . . . . . . 10-110.2 Field Sampling Plan: Non-Matrix-Specific Issues . . . . . . . . . . . . . . . . . . . . . . . . . 10-3
10.2.1 Determination of Analytical Sample Size . . . . . . . . . . . . . . . . . . . . . . . . . . . . 10-310.2.2 Field Equipment and Supply Needs . . . . . . . . . . . . . . . . . . . . . . . . . . . . . . . . . 10-310.2.3 Selection of Sample Containers . . . . . . . . . . . . . . . . . . . . . . . . . . . . . . . . . . . . 10-4
10.2.3.1 Container Material . . . . . . . . . . . . . . . . . . . . . . . . . . . . . . . . . . . . . . . . 10-410.2.3.2 Container Opening and Closure . . . . . . . . . . . . . . . . . . . . . . . . . . . . . . 10-510.2.3.3 Sealing Containers . . . . . . . . . . . . . . . . . . . . . . . . . . . . . . . . . . . . . . . . 10-510.2.3.4 Precleaned and Extra Containers . . . . . . . . . . . . . . . . . . . . . . . . . . . . . 10-5
10.2.4 Container Label and Sample Identification Code . . . . . . . . . . . . . . . . . . . . . . 10-610.2.5 Field Data Documentation . . . . . . . . . . . . . . . . . . . . . . . . . . . . . . . . . . . . . . . . 10-710.2.6 Field Tracking, Custody, and Shipment Forms . . . . . . . . . . . . . . . . . . . . . . . . 10-810.2.7 Chain of Custody . . . . . . . . . . . . . . . . . . . . . . . . . . . . . . . . . . . . . . . . . . . . . . . 10-910.2.8 Field Quality Control . . . . . . . . . . . . . . . . . . . . . . . . . . . . . . . . . . . . . . . . . . . 10-1010.2.9 Decontamination of Field Equipment . . . . . . . . . . . . . . . . . . . . . . . . . . . . . . 10-1010.2.10 Packing and Shipping . . . . . . . . . . . . . . . . . . . . . . . . . . . . . . . . . . . . . . . . . 10-1110.2.11 Worker Health and Safety Plan . . . . . . . . . . . . . . . . . . . . . . . . . . . . . . . . . . 10-12
10.2.11.1 Physical Hazards . . . . . . . . . . . . . . . . . . . . . . . . . . . . . . . . . . . . . . . . 10-1310.2.11.2 Biohazards . . . . . . . . . . . . . . . . . . . . . . . . . . . . . . . . . . . . . . . . . . . . . 10-15
Part B: Matrix-Specific Issues That Impact Field Sample Collection, Processing, andPreservation . . . . . . . . . . . . . . . . . . . . . . . . . . . . . . . . . . . . . . . . . . . . . . . . . . . . . . . . 10-16
10.3 Liquid Samples . . . . . . . . . . . . . . . . . . . . . . . . . . . . . . . . . . . . . . . . . . . . . . . . . . 10-17
Contents
Page
XXMARLAP JULY 2004
10.3.1 Liquid Sampling Methods . . . . . . . . . . . . . . . . . . . . . . . . . . . . . . . . . . . . . . . 10-1810.3.2 Liquid Sample Preparation: Filtration . . . . . . . . . . . . . . . . . . . . . . . . . . . . . . 10-18
10.3.2.1 Example of Guidance for Ground-Water Sample Filtration . . . . . . . 10-1910.3.2.2 Filters . . . . . . . . . . . . . . . . . . . . . . . . . . . . . . . . . . . . . . . . . . . . . . . . . 10-21
10.3.3 Field Preservation of Liquid Samples . . . . . . . . . . . . . . . . . . . . . . . . . . . . . . 10-2210.3.3.1 Sample Acidification . . . . . . . . . . . . . . . . . . . . . . . . . . . . . . . . . . . . . 10-2210.3.3.2 Non-Acid Preservation Techniques . . . . . . . . . . . . . . . . . . . . . . . . . . 10-23
10.3.4 Liquid Samples: Special Cases . . . . . . . . . . . . . . . . . . . . . . . . . . . . . . . . . . . 10-2510.3.4.1 Radon-222 in Water . . . . . . . . . . . . . . . . . . . . . . . . . . . . . . . . . . . . . . 10-2510.3.4.1 Milk . . . . . . . . . . . . . . . . . . . . . . . . . . . . . . . . . . . . . . . . . . . . . . . . . . 10-26
10.3.5 Nonaqueous Liquids and Mixtures . . . . . . . . . . . . . . . . . . . . . . . . . . . . . . . . 10-2610.4 Solids . . . . . . . . . . . . . . . . . . . . . . . . . . . . . . . . . . . . . . . . . . . . . . . . . . . . . . . . . 10-28
10.4.1 Soils . . . . . . . . . . . . . . . . . . . . . . . . . . . . . . . . . . . . . . . . . . . . . . . . . . . . . . . . 10-2910.4.1.1 Soil Sample Preparation . . . . . . . . . . . . . . . . . . . . . . . . . . . . . . . . . . 10-2910.4.1.2 Sample Ashing . . . . . . . . . . . . . . . . . . . . . . . . . . . . . . . . . . . . . . . . . 10-30
10.4.2 Sediments . . . . . . . . . . . . . . . . . . . . . . . . . . . . . . . . . . . . . . . . . . . . . . . . . . . 10-3010.4.3 Other Solids . . . . . . . . . . . . . . . . . . . . . . . . . . . . . . . . . . . . . . . . . . . . . . . . . 10-31
10.4.3.1 Structural Materials . . . . . . . . . . . . . . . . . . . . . . . . . . . . . . . . . . . . . . 10-3110.4.3.2 Biota: Samples of Plant and Animal Products . . . . . . . . . . . . . . . . . . 10-31
10.5 Air Sampling . . . . . . . . . . . . . . . . . . . . . . . . . . . . . . . . . . . . . . . . . . . . . . . . . . . . 10-3410.5.1 Sampler Components and Operation . . . . . . . . . . . . . . . . . . . . . . . . . . . . . . 10-3410.5.2 Filter Selection Based on Destructive Versus Nondestructive Analysis . . . . 10-3510.5.3 Sample Preservation and Storage . . . . . . . . . . . . . . . . . . . . . . . . . . . . . . . . . 10-3610.5.4 Special Cases: Collection of Gaseous and Volatile Air Contaminants . . . . . 10-36
10.5.4.1 Radioiodines . . . . . . . . . . . . . . . . . . . . . . . . . . . . . . . . . . . . . . . . . . . 10-3610.5.4.2 Gases . . . . . . . . . . . . . . . . . . . . . . . . . . . . . . . . . . . . . . . . . . . . . . . . . 10-3710.5.4.3 Tritium Air Sampling . . . . . . . . . . . . . . . . . . . . . . . . . . . . . . . . . . . . . 10-3810.5.4.4 Radon Sampling in Air . . . . . . . . . . . . . . . . . . . . . . . . . . . . . . . . . . . 10-39
10.6 Wipe Sampling for Assessing Surface Contamination . . . . . . . . . . . . . . . . . . . . 10-4110.6.1 Sample Collection Methods . . . . . . . . . . . . . . . . . . . . . . . . . . . . . . . . . . . . . 10-42
10.6.1.1 Dry Wipes . . . . . . . . . . . . . . . . . . . . . . . . . . . . . . . . . . . . . . . . . . . . . 10-4210.6.1.2 Wet Wipes . . . . . . . . . . . . . . . . . . . . . . . . . . . . . . . . . . . . . . . . . . . . . 10-43
10.6.2 Sample Handling . . . . . . . . . . . . . . . . . . . . . . . . . . . . . . . . . . . . . . . . . . . . . . 10-4410.6.3 Analytical Considerations for Wipe Material Selection . . . . . . . . . . . . . . . . 10-44
10.7 References . . . . . . . . . . . . . . . . . . . . . . . . . . . . . . . . . . . . . . . . . . . . . . . . . . . . . . 10-45
11 Sample Receipt, Inspection, and Tracking . . . . . . . . . . . . . . . . . . . . . . . . . . . . . . . . . . . . . 11-111.1 Introduction . . . . . . . . . . . . . . . . . . . . . . . . . . . . . . . . . . . . . . . . . . . . . . . . . . . . . . 11-111.2 General Considerations . . . . . . . . . . . . . . . . . . . . . . . . . . . . . . . . . . . . . . . . . . . . . 11-1
11.2.1 Communication Before Sample Receipt . . . . . . . . . . . . . . . . . . . . . . . . . . . . . 11-1

Contents
Page
XXIJULY 2004 MARLAP
11.2.2 Standard Operating Procedures . . . . . . . . . . . . . . . . . . . . . . . . . . . . . . . . . . . . 11-311.2.3 Laboratory License . . . . . . . . . . . . . . . . . . . . . . . . . . . . . . . . . . . . . . . . . . . . . . 11-411.2.4 Sample Chain-of-Custody . . . . . . . . . . . . . . . . . . . . . . . . . . . . . . . . . . . . . . . . 11-4
11.3 Sample Receipt . . . . . . . . . . . . . . . . . . . . . . . . . . . . . . . . . . . . . . . . . . . . . . . . . . . 11-511.3.1 Package Receipt . . . . . . . . . . . . . . . . . . . . . . . . . . . . . . . . . . . . . . . . . . . . . . . . 11-511.3.2 Radiological Surveying . . . . . . . . . . . . . . . . . . . . . . . . . . . . . . . . . . . . . . . . . . 11-611.3.3 Corrective Action . . . . . . . . . . . . . . . . . . . . . . . . . . . . . . . . . . . . . . . . . . . . . . . 11-8
11.4 Sample Inspection . . . . . . . . . . . . . . . . . . . . . . . . . . . . . . . . . . . . . . . . . . . . . . . . . 11-811.4.1 Physical Integrity of Package and Sample Containers . . . . . . . . . . . . . . . . . . . 11-811.4.2 Sample Identity Confirmation . . . . . . . . . . . . . . . . . . . . . . . . . . . . . . . . . . . . . 11-911.4.3 Confirmation of Field Preservation . . . . . . . . . . . . . . . . . . . . . . . . . . . . . . . . . 11-911.4.4 Presence of Hazardous Materials . . . . . . . . . . . . . . . . . . . . . . . . . . . . . . . . . . . 11-911.4.5 Corrective Action . . . . . . . . . . . . . . . . . . . . . . . . . . . . . . . . . . . . . . . . . . . . . . 11-10
11.5 Laboratory Sample Tracking . . . . . . . . . . . . . . . . . . . . . . . . . . . . . . . . . . . . . . . . 11-1111.5.1 Sample Log-In . . . . . . . . . . . . . . . . . . . . . . . . . . . . . . . . . . . . . . . . . . . . . . . . 11-1111.5.2 Sample Tracking During Analyses . . . . . . . . . . . . . . . . . . . . . . . . . . . . . . . . . 11-1111.5.3 Storage of Samples . . . . . . . . . . . . . . . . . . . . . . . . . . . . . . . . . . . . . . . . . . . . . 11-12
11.6 References . . . . . . . . . . . . . . . . . . . . . . . . . . . . . . . . . . . . . . . . . . . . . . . . . . . . . . 11-13
12 Laboratory Sample Preparation . . . . . . . . . . . . . . . . . . . . . . . . . . . . . . . . . . . . . . . . . . . . . 12-112.1 Introduction . . . . . . . . . . . . . . . . . . . . . . . . . . . . . . . . . . . . . . . . . . . . . . . . . . . . . . 12-112.2 General Guidance for Sample Preparation . . . . . . . . . . . . . . . . . . . . . . . . . . . . . . . 12-2
12.2.1 Potential Sample Losses During Preparation . . . . . . . . . . . . . . . . . . . . . . . . . 12-212.2.1.1 Losses as Dust or Particulates . . . . . . . . . . . . . . . . . . . . . . . . . . . . . . . 12-212.2.1.2 Losses Through Volatilization . . . . . . . . . . . . . . . . . . . . . . . . . . . . . . . 12-312.2.1.3 Losses Due to Reactions Between Sample and Container . . . . . . . . . . 12-5
12.2.2 Contamination from Sources in the Laboratory . . . . . . . . . . . . . . . . . . . . . . . . 12-612.2.2.1 Airborne Contamination . . . . . . . . . . . . . . . . . . . . . . . . . . . . . . . . . . . 12-712.2.2.2 Contamination of Reagents . . . . . . . . . . . . . . . . . . . . . . . . . . . . . . . . . 12-712.2.2.3 Contamination of Glassware and Equipment . . . . . . . . . . . . . . . . . . . 12-812.2.2.4 Contamination of Facilities . . . . . . . . . . . . . . . . . . . . . . . . . . . . . . . . . 12-8
12.2.3 Cleaning of Labware, Glassware, and Equipment . . . . . . . . . . . . . . . . . . . . . . 12-812.2.3.1 Labware and Glassware . . . . . . . . . . . . . . . . . . . . . . . . . . . . . . . . . . . . 12-812.2.3.2 Equipment . . . . . . . . . . . . . . . . . . . . . . . . . . . . . . . . . . . . . . . . . . . . . 12-10
12.3 Solid Samples . . . . . . . . . . . . . . . . . . . . . . . . . . . . . . . . . . . . . . . . . . . . . . . . . . . 12-1212.3.1 General Procedures . . . . . . . . . . . . . . . . . . . . . . . . . . . . . . . . . . . . . . . . . . . . 12-12
12.3.1.1 Exclusion of Material . . . . . . . . . . . . . . . . . . . . . . . . . . . . . . . . . . . . . 12-1412.3.1.2 Principles of Heating Techniques for Sample Pretreatment . . . . . . . 12-1412.3.1.3 Obtaining a Constant Weight . . . . . . . . . . . . . . . . . . . . . . . . . . . . . . . 12-2312.3.1.4 Subsampling . . . . . . . . . . . . . . . . . . . . . . . . . . . . . . . . . . . . . . . . . . . . 12-24

Contents
Page
XXIIMARLAP JULY 2004
12.3.2 Soil/Sediment Samples . . . . . . . . . . . . . . . . . . . . . . . . . . . . . . . . . . . . . . . . . 12-2712.3.2.1 Soils . . . . . . . . . . . . . . . . . . . . . . . . . . . . . . . . . . . . . . . . . . . . . . . . . . 12-2812.3.2.2 Sediments . . . . . . . . . . . . . . . . . . . . . . . . . . . . . . . . . . . . . . . . . . . . . . 12-28
12.3.3 Biota Samples . . . . . . . . . . . . . . . . . . . . . . . . . . . . . . . . . . . . . . . . . . . . . . . . 12-2812.3.3.1 Food . . . . . . . . . . . . . . . . . . . . . . . . . . . . . . . . . . . . . . . . . . . . . . . . . . 12-2912.3.3.2 Vegetation . . . . . . . . . . . . . . . . . . . . . . . . . . . . . . . . . . . . . . . . . . . . . 12-2912.3.3.3 Bone and Tissue . . . . . . . . . . . . . . . . . . . . . . . . . . . . . . . . . . . . . . . . . 12-30
12.3.4 Other Samples . . . . . . . . . . . . . . . . . . . . . . . . . . . . . . . . . . . . . . . . . . . . . . . . 12-3012.4 Filters . . . . . . . . . . . . . . . . . . . . . . . . . . . . . . . . . . . . . . . . . . . . . . . . . . . . . . . . . . 12-3012.5 Wipe Samples . . . . . . . . . . . . . . . . . . . . . . . . . . . . . . . . . . . . . . . . . . . . . . . . . . . 12-3112.6 Liquid Samples . . . . . . . . . . . . . . . . . . . . . . . . . . . . . . . . . . . . . . . . . . . . . . . . . . 12-32
12.6.1 Conductivity . . . . . . . . . . . . . . . . . . . . . . . . . . . . . . . . . . . . . . . . . . . . . . . . . 12-3212.6.2 Turbidity . . . . . . . . . . . . . . . . . . . . . . . . . . . . . . . . . . . . . . . . . . . . . . . . . . . . . 12-3212.6.3 Filtration . . . . . . . . . . . . . . . . . . . . . . . . . . . . . . . . . . . . . . . . . . . . . . . . . . . . 12-3312.6.4 Aqueous Liquids . . . . . . . . . . . . . . . . . . . . . . . . . . . . . . . . . . . . . . . . . . . . . . 12-3312.6.5 Nonaqueous Liquids . . . . . . . . . . . . . . . . . . . . . . . . . . . . . . . . . . . . . . . . . . . 12-3412.6.6 Mixtures . . . . . . . . . . . . . . . . . . . . . . . . . . . . . . . . . . . . . . . . . . . . . . . . . . . . . 12-35
12.6.6.1 Liquid-Liquid Mixtures . . . . . . . . . . . . . . . . . . . . . . . . . . . . . . . . . . . 12-3512.6.6.2 Liquid-Solid Mixtures . . . . . . . . . . . . . . . . . . . . . . . . . . . . . . . . . . . . 12-35
12.7 Gases . . . . . . . . . . . . . . . . . . . . . . . . . . . . . . . . . . . . . . . . . . . . . . . . . . . . . . . . . . 12-3612.8 Bioassay . . . . . . . . . . . . . . . . . . . . . . . . . . . . . . . . . . . . . . . . . . . . . . . . . . . . . . . . 12-3612.9 References . . . . . . . . . . . . . . . . . . . . . . . . . . . . . . . . . . . . . . . . . . . . . . . . . . . . . . 12-37
12.9.1 Cited Sources . . . . . . . . . . . . . . . . . . . . . . . . . . . . . . . . . . . . . . . . . . . . . . . . . 12-3712.9.2 Other Sources . . . . . . . . . . . . . . . . . . . . . . . . . . . . . . . . . . . . . . . . . . . . . . . . . 12-43
13 Sample Dissolution . . . . . . . . . . . . . . . . . . . . . . . . . . . . . . . . . . . . . . . . . . . . . . . . . . . . . . 13-113.1 Introduction . . . . . . . . . . . . . . . . . . . . . . . . . . . . . . . . . . . . . . . . . . . . . . . . . . . . . . 13-113.2 The Chemistry of Dissolution . . . . . . . . . . . . . . . . . . . . . . . . . . . . . . . . . . . . . . . . 13-2
13.2.1 Solubility and the Solubility Product Constant, Ksp . . . . . . . . . . . . . . . . . . . . 13-213.2.2 Chemical Exchange, Decomposition, and Simple Rearrangement Reactions . 13-313.2.3 Oxidation-Reduction Processes . . . . . . . . . . . . . . . . . . . . . . . . . . . . . . . . . . . . 13-413.2.4 Complexation . . . . . . . . . . . . . . . . . . . . . . . . . . . . . . . . . . . . . . . . . . . . . . . . . . 13-513.2.5 Equilibrium: Carriers and Tracers . . . . . . . . . . . . . . . . . . . . . . . . . . . . . . . . . . 13-6
13.3 Fusion Techniques . . . . . . . . . . . . . . . . . . . . . . . . . . . . . . . . . . . . . . . . . . . . . . . . . 13-613.3.1 Alkali-Metal Hydroxide Fusions . . . . . . . . . . . . . . . . . . . . . . . . . . . . . . . . . . . 13-913.3.2 Boron Fusions . . . . . . . . . . . . . . . . . . . . . . . . . . . . . . . . . . . . . . . . . . . . . . . . 13-1113.3.3 Fluoride Fusions . . . . . . . . . . . . . . . . . . . . . . . . . . . . . . . . . . . . . . . . . . . . . . . 13-1213.3.4 Sodium Hydroxide Fusion . . . . . . . . . . . . . . . . . . . . . . . . . . . . . . . . . . . . . . . 13-12
13.4 Wet Ashing and Acid Dissolution Techniques . . . . . . . . . . . . . . . . . . . . . . . . . . 13-1213.4.1 Acids and Oxidants . . . . . . . . . . . . . . . . . . . . . . . . . . . . . . . . . . . . . . . . . . . . 13-13

Contents
Page
XXIIIJULY 2004 MARLAP
13.4.2 Acid Digestion Bombs . . . . . . . . . . . . . . . . . . . . . . . . . . . . . . . . . . . . . . . . . . 13-2013.5 Microwave Digestion . . . . . . . . . . . . . . . . . . . . . . . . . . . . . . . . . . . . . . . . . . . . . . 13-21
13.5.1 Focused Open-Vessel Systems . . . . . . . . . . . . . . . . . . . . . . . . . . . . . . . . . . . 13-2113.5.2 Low-Pressure, Closed-Vessel Systems . . . . . . . . . . . . . . . . . . . . . . . . . . . . . 13-2213.5.3 High-Pressure, Closed-Vessel Systems . . . . . . . . . . . . . . . . . . . . . . . . . . . . . 13-22
13.6 Verification of Total Dissolution . . . . . . . . . . . . . . . . . . . . . . . . . . . . . . . . . . . . . 13-2313.7 Special Matrix Considerations . . . . . . . . . . . . . . . . . . . . . . . . . . . . . . . . . . . . . . . 13-23
13.7.1 Liquid Samples . . . . . . . . . . . . . . . . . . . . . . . . . . . . . . . . . . . . . . . . . . . . . . . 13-2313.7.2 Solid Samples . . . . . . . . . . . . . . . . . . . . . . . . . . . . . . . . . . . . . . . . . . . . . . . . 13-2413.7.3 Filters . . . . . . . . . . . . . . . . . . . . . . . . . . . . . . . . . . . . . . . . . . . . . . . . . . . . . . . 13-2413.7.4 Wipe Samples . . . . . . . . . . . . . . . . . . . . . . . . . . . . . . . . . . . . . . . . . . . . . . . . 13-24
13.8 Comparison of Total Dissolution and Acid Leaching . . . . . . . . . . . . . . . . . . . . . 13-2513.9 References . . . . . . . . . . . . . . . . . . . . . . . . . . . . . . . . . . . . . . . . . . . . . . . . . . . . . . 13-27
13.9.1 Cited References . . . . . . . . . . . . . . . . . . . . . . . . . . . . . . . . . . . . . . . . . . . . . . 13-2713.9.2 Other Sources . . . . . . . . . . . . . . . . . . . . . . . . . . . . . . . . . . . . . . . . . . . . . . . . . 13-29
14 Separation Techniques . . . . . . . . . . . . . . . . . . . . . . . . . . . . . . . . . . . . . . . . . . . . . . . . . . . . 14-114.1 Introduction . . . . . . . . . . . . . . . . . . . . . . . . . . . . . . . . . . . . . . . . . . . . . . . . . . . . . . 14-114.2 Oxidation-Reduction Processes . . . . . . . . . . . . . . . . . . . . . . . . . . . . . . . . . . . . . . . 14-2
14.2.1 Introduction . . . . . . . . . . . . . . . . . . . . . . . . . . . . . . . . . . . . . . . . . . . . . . . . . . . 14-214.2.2 Oxidation-Reduction Reactions . . . . . . . . . . . . . . . . . . . . . . . . . . . . . . . . . . . . 14-314.2.3 Common Oxidation States . . . . . . . . . . . . . . . . . . . . . . . . . . . . . . . . . . . . . . . . 14-614.2.4 Oxidation State in Solution . . . . . . . . . . . . . . . . . . . . . . . . . . . . . . . . . . . . . . 14-1014.2.5 Common Oxidizing and Reducing Agents . . . . . . . . . . . . . . . . . . . . . . . . . . 14-1114.2.6 Oxidation State and Radiochemical Analysis . . . . . . . . . . . . . . . . . . . . . . . . 14-13
14.3 Complexation . . . . . . . . . . . . . . . . . . . . . . . . . . . . . . . . . . . . . . . . . . . . . . . . . . . . 14-1814.3.1 Introduction . . . . . . . . . . . . . . . . . . . . . . . . . . . . . . . . . . . . . . . . . . . . . . . . . . 14-1814.3.2 Chelates . . . . . . . . . . . . . . . . . . . . . . . . . . . . . . . . . . . . . . . . . . . . . . . . . . . . . 14-2014.3.3 The Formation (Stability) Constant . . . . . . . . . . . . . . . . . . . . . . . . . . . . . . . . 14-2214.3.4 Complexation and Radiochemical Analysis . . . . . . . . . . . . . . . . . . . . . . . . . 14-23
14.3.4.1 Extraction of Laboratory Samples and Ores . . . . . . . . . . . . . . . . . . . . 14-2314.3.4.2 Separation by Solvent Extraction and Ion-Exchange Chromatography 14-2314.3.4.3 Formation and Dissolution of Precipitates . . . . . . . . . . . . . . . . . . . . . 14-2414.3.4.4 Stabilization of Ions in Solution . . . . . . . . . . . . . . . . . . . . . . . . . . . . . 14-2414.3.4.5 Detection and Determination . . . . . . . . . . . . . . . . . . . . . . . . . . . . . . . . 14-25
14.4 Solvent Extraction . . . . . . . . . . . . . . . . . . . . . . . . . . . . . . . . . . . . . . . . . . . . . . . . 14-2514.4.1 Extraction Principles . . . . . . . . . . . . . . . . . . . . . . . . . . . . . . . . . . . . . . . . . . . 14-2514.4.2 Distribution Coefficient . . . . . . . . . . . . . . . . . . . . . . . . . . . . . . . . . . . . . . . . . 14-2614.4.3 Extraction Technique . . . . . . . . . . . . . . . . . . . . . . . . . . . . . . . . . . . . . . . . . . . 14-2714.4.4 Solvent Extraction and Radiochemical Analysis . . . . . . . . . . . . . . . . . . . . . . 14-30

Contents
Page
XXIVMARLAP JULY 2004
14.4.5 Solid-Phase Extraction . . . . . . . . . . . . . . . . . . . . . . . . . . . . . . . . . . . . . . . . . . 14-3214.4.5.1 Extraction Chromatography Columns . . . . . . . . . . . . . . . . . . . . . . . . 14-3314.4.5.2 Extraction Membranes . . . . . . . . . . . . . . . . . . . . . . . . . . . . . . . . . . . . 14-34
14.4.6 Advantages and Disadvantages of Solvent Extraction . . . . . . . . . . . . . . . . . 14-3514.4.6.1 Advantages of Liquid-Liquid Solvent Extraction . . . . . . . . . . . . . . . 14-3514.4.6.2 Disadvantages of Liquid-Liquid Solvent Extraction . . . . . . . . . . . . . 14-3514.4.6.3 Advantages of Solid-Phase Extraction Media . . . . . . . . . . . . . . . . . . 14-3514.4.6.4 Disadvantages of Solid-Phase Extraction Media . . . . . . . . . . . . . . . . 14-36
14.5 Volatilization and Distillation . . . . . . . . . . . . . . . . . . . . . . . . . . . . . . . . . . . . . . . 14-3614.5.1 Introduction . . . . . . . . . . . . . . . . . . . . . . . . . . . . . . . . . . . . . . . . . . . . . . . . . . 14-3614.5.2 Volatilization Principles . . . . . . . . . . . . . . . . . . . . . . . . . . . . . . . . . . . . . . . . 14-3614.5.3 Distillation Principles . . . . . . . . . . . . . . . . . . . . . . . . . . . . . . . . . . . . . . . . . . 14-3814.5.4 Separations in Radiochemical Analysis . . . . . . . . . . . . . . . . . . . . . . . . . . . . . 14-3914.5.5 Advantages and Disadvantages of Volatilization . . . . . . . . . . . . . . . . . . . . . 14-40
14.5.5.1 Advantages . . . . . . . . . . . . . . . . . . . . . . . . . . . . . . . . . . . . . . . . . . . . . 14-4014.5.5.2 Disadvantages . . . . . . . . . . . . . . . . . . . . . . . . . . . . . . . . . . . . . . . . . . 14-40
14.6 Electrodeposition . . . . . . . . . . . . . . . . . . . . . . . . . . . . . . . . . . . . . . . . . . . . . . . . . 14-4114.6.1 Electrodeposition Principles . . . . . . . . . . . . . . . . . . . . . . . . . . . . . . . . . . . . . 14-4114.6.2 Separation of Radionuclides . . . . . . . . . . . . . . . . . . . . . . . . . . . . . . . . . . . . . 14-4214.6.3 Preparation of Counting Sources . . . . . . . . . . . . . . . . . . . . . . . . . . . . . . . . . . 14-4314.6.4 Advantages and Disadvantages of Electrodeposition . . . . . . . . . . . . . . . . . . 14-43
14.6.4.1 Advantages . . . . . . . . . . . . . . . . . . . . . . . . . . . . . . . . . . . . . . . . . . . . . 14-4314.6.4.2 Disadvantages . . . . . . . . . . . . . . . . . . . . . . . . . . . . . . . . . . . . . . . . . . . . 14-43
14.7 Chromatography . . . . . . . . . . . . . . . . . . . . . . . . . . . . . . . . . . . . . . . . . . . . . . . . . . 14-4414.7.1 Chromatographic Principles . . . . . . . . . . . . . . . . . . . . . . . . . . . . . . . . . . . . . . 14-4414.7.2 Gas-Liquid and Liquid-Liquid Phase Chromatography . . . . . . . . . . . . . . . . . 14-4514.7.3 Adsorption Chromatography . . . . . . . . . . . . . . . . . . . . . . . . . . . . . . . . . . . . . 14-4514.7.4 Ion-Exchange Chromatography . . . . . . . . . . . . . . . . . . . . . . . . . . . . . . . . . . . 14-46
14.7.4.1 Principles of Ion Exchange . . . . . . . . . . . . . . . . . . . . . . . . . . . . . . . . 14-4614.7.4.2 Resins . . . . . . . . . . . . . . . . . . . . . . . . . . . . . . . . . . . . . . . . . . . . . . . . . 14-48
14.7.5 Affinity Chromatography . . . . . . . . . . . . . . . . . . . . . . . . . . . . . . . . . . . . . . . . 14-5414.7.6 Gel-Filtration Chromatography . . . . . . . . . . . . . . . . . . . . . . . . . . . . . . . . . . . 14-5414.7.7 Chromatographic Laboratory Methods . . . . . . . . . . . . . . . . . . . . . . . . . . . . . 14-5514.7.8 Advantages and Disadvantages of Chromatographic Systems . . . . . . . . . . . 14-56
14.7.8.1 Advantages . . . . . . . . . . . . . . . . . . . . . . . . . . . . . . . . . . . . . . . . . . . . . 14-5614.7.8.2 Disadvantages . . . . . . . . . . . . . . . . . . . . . . . . . . . . . . . . . . . . . . . . . . 14-56
14.8 Precipitation and Coprecipitation . . . . . . . . . . . . . . . . . . . . . . . . . . . . . . . . . . . . 14-5614.8.1 Introduction . . . . . . . . . . . . . . . . . . . . . . . . . . . . . . . . . . . . . . . . . . . . . . . . . . 14-5614.8.2 Solutions . . . . . . . . . . . . . . . . . . . . . . . . . . . . . . . . . . . . . . . . . . . . . . . . . . . . 14-5714.8.3 Precipitation . . . . . . . . . . . . . . . . . . . . . . . . . . . . . . . . . . . . . . . . . . . . . . . . . . 14-59

Contents
Page
XXVJULY 2004 MARLAP
14.8.3.1 Solubility and the Solubility Product Constant, Ksp . . . . . . . . . . . . . . 14-5914.8.3.2 Factors Affecting Precipitation . . . . . . . . . . . . . . . . . . . . . . . . . . . . . 14-6414.8.3.3 Optimum Precipitation Conditions . . . . . . . . . . . . . . . . . . . . . . . . . . 14-69
14.8.4 Coprecipitation . . . . . . . . . . . . . . . . . . . . . . . . . . . . . . . . . . . . . . . . . . . . . . . . 14-6914.8.4.1 Coprecipitation Processes . . . . . . . . . . . . . . . . . . . . . . . . . . . . . . . . . 14-7014.8.4.2 Water as an Impurity . . . . . . . . . . . . . . . . . . . . . . . . . . . . . . . . . . . . . 14-7414.8.4.3 Postprecipitation . . . . . . . . . . . . . . . . . . . . . . . . . . . . . . . . . . . . . . . . 14-7414.8.4.4 Coprecipitation Methods . . . . . . . . . . . . . . . . . . . . . . . . . . . . . . . . . . 14-75
14.8.5 Colloidal Precipitates . . . . . . . . . . . . . . . . . . . . . . . . . . . . . . . . . . . . . . . . . . . 14-7814.8.6 Separation of Precipitates . . . . . . . . . . . . . . . . . . . . . . . . . . . . . . . . . . . . . . . 14-8114.8.7 Advantages and Disadvantages of Precipitation and Coprecipitation . . . . . . 14-82
14.8.7.1 Advantages . . . . . . . . . . . . . . . . . . . . . . . . . . . . . . . . . . . . . . . . . . . . . 14-8214.8.7.2 Disadvantages . . . . . . . . . . . . . . . . . . . . . . . . . . . . . . . . . . . . . . . . . . 14-82
14.9 Carriers and Tracers . . . . . . . . . . . . . . . . . . . . . . . . . . . . . . . . . . . . . . . . . . . . . . . 14-8214.9.1 Introduction . . . . . . . . . . . . . . . . . . . . . . . . . . . . . . . . . . . . . . . . . . . . . . . . . . 14-8214.9.2 Carriers . . . . . . . . . . . . . . . . . . . . . . . . . . . . . . . . . . . . . . . . . . . . . . . . . . . . . . 14-83
14.9.2.1 Isotopic Carriers . . . . . . . . . . . . . . . . . . . . . . . . . . . . . . . . . . . . . . . . . 14-8314.9.2.2 Nonisotopic Carriers . . . . . . . . . . . . . . . . . . . . . . . . . . . . . . . . . . . . . 14-8414.9.2.3 Common Carriers . . . . . . . . . . . . . . . . . . . . . . . . . . . . . . . . . . . . . . . . 14-8514.9.2.4 Holdback Carriers . . . . . . . . . . . . . . . . . . . . . . . . . . . . . . . . . . . . . . . 14-8914.9.2.5 Yield of Isotopic Carriers . . . . . . . . . . . . . . . . . . . . . . . . . . . . . . . . . . 14-89
14.9.3 Tracers . . . . . . . . . . . . . . . . . . . . . . . . . . . . . . . . . . . . . . . . . . . . . . . . . . . . . . 14-9014.9.3.1 Characteristics of Tracers . . . . . . . . . . . . . . . . . . . . . . . . . . . . . . . . . . 14-9214.9.3.2 Coprecipitation . . . . . . . . . . . . . . . . . . . . . . . . . . . . . . . . . . . . . . . . . . 14-9314.9.3.3 Deposition on Nonmetallic Solids . . . . . . . . . . . . . . . . . . . . . . . . . . . 14-9314.9.3.4 Radiocolloid Formation . . . . . . . . . . . . . . . . . . . . . . . . . . . . . . . . . . 14-9414.9.3.5 Distribution (Partition) Behavior . . . . . . . . . . . . . . . . . . . . . . . . . . . . 14-9514.9.3.6 Vaporization . . . . . . . . . . . . . . . . . . . . . . . . . . . . . . . . . . . . . . . . . . . . 14-9514.9.3.7 Oxidation and Reduction . . . . . . . . . . . . . . . . . . . . . . . . . . . . . . . . . . 14-96
14.10 Analysis of Specific Radionuclides . . . . . . . . . . . . . . . . . . . . . . . . . . . . . . . . . . . 14-9714.10.1 Basic Principles of Chemical Equilibrium . . . . . . . . . . . . . . . . . . . . . . . . 14-9714.10.2 Oxidation State . . . . . . . . . . . . . . . . . . . . . . . . . . . . . . . . . . . . . . . . . . . . 14-10014.10.3 Hydrolysis . . . . . . . . . . . . . . . . . . . . . . . . . . . . . . . . . . . . . . . . . . . . . . . . 14-10014.10.4 Polymerization . . . . . . . . . . . . . . . . . . . . . . . . . . . . . . . . . . . . . . . . . . . . . 14-10214.10.5 Complexation . . . . . . . . . . . . . . . . . . . . . . . . . . . . . . . . . . . . . . . . . . . . . 14-10314.10.6 Radiocolloid Interference . . . . . . . . . . . . . . . . . . . . . . . . . . . . . . . . . . . . 14-10314.10.7 Isotope Dilution Analysis . . . . . . . . . . . . . . . . . . . . . . . . . . . . . . . . . . . . 14-10414.10.8 Masking and Demasking . . . . . . . . . . . . . . . . . . . . . . . . . . . . . . . . . . . . . 14-10514.10.9 Review of Specific Radionuclides . . . . . . . . . . . . . . . . . . . . . . . . . . . . . . 14-109
14.10.9.1 Americium . . . . . . . . . . . . . . . . . . . . . . . . . . . . . . . . . . . . . . . . . . . . 14-109
Contents
Page
XXVIMARLAP JULY 2004
14.10.9.2 Carbon . . . . . . . . . . . . . . . . . . . . . . . . . . . . . . . . . . . . . . . . . . . . . . . 14-11414.10.9.3 Cesium . . . . . . . . . . . . . . . . . . . . . . . . . . . . . . . . . . . . . . . . . . . . . . . 14-11614.10.9.4 Cobalt . . . . . . . . . . . . . . . . . . . . . . . . . . . . . . . . . . . . . . . . . . . . . . . . 14-11914.10.9.5 Iodine . . . . . . . . . . . . . . . . . . . . . . . . . . . . . . . . . . . . . . . . . . . . . . . . 14-12514.10.9.6 Neptunium . . . . . . . . . . . . . . . . . . . . . . . . . . . . . . . . . . . . . . . . . . . . 14-13214.10.9.7 Nickel . . . . . . . . . . . . . . . . . . . . . . . . . . . . . . . . . . . . . . . . . . . . . . . . 14-13614.10.9.8 Plutonium . . . . . . . . . . . . . . . . . . . . . . . . . . . . . . . . . . . . . . . . . . . . . 14-13914.10.9.9 Radium . . . . . . . . . . . . . . . . . . . . . . . . . . . . . . . . . . . . . . . . . . . . . . . 14-14814.10.9.10 Strontium . . . . . . . . . . . . . . . . . . . . . . . . . . . . . . . . . . . . . . . . . . . . . 14-15514.10.9.11 Sulfur and Phosphorus . . . . . . . . . . . . . . . . . . . . . . . . . . . . . . . . . . . 14-16014.10.9.12 Technetium . . . . . . . . . . . . . . . . . . . . . . . . . . . . . . . . . . . . . . . . . . . 14-16314.10.9.13 Thorium . . . . . . . . . . . . . . . . . . . . . . . . . . . . . . . . . . . . . . . . . . . . . . 14-16914.10.9.14 Tritium . . . . . . . . . . . . . . . . . . . . . . . . . . . . . . . . . . . . . . . . . . . . . . . 14-17514.10.9.15 Uranium . . . . . . . . . . . . . . . . . . . . . . . . . . . . . . . . . . . . . . . . . . . . . . 14-18014.10.9.16 Zirconium . . . . . . . . . . . . . . . . . . . . . . . . . . . . . . . . . . . . . . . . . . . . . 14-19114.10.9.17 Progeny of Uranium and Thorium . . . . . . . . . . . . . . . . . . . . . . . . . . 14-198
14.11 References . . . . . . . . . . . . . . . . . . . . . . . . . . . . . . . . . . . . . . . . . . . . . . . . . . . . . 14-20114.12 Selected Bibliography . . . . . . . . . . . . . . . . . . . . . . . . . . . . . . . . . . . . . . . . . . . . 14-218
14.12.1 Inorganic and Analytical Chemistry . . . . . . . . . . . . . . . . . . . . . . . . . . . . 14-21814.12.2 General Radiochemistry . . . . . . . . . . . . . . . . . . . . . . . . . . . . . . . . . . . . . 14-21914.12.3 Radiochemical Methods of Separation . . . . . . . . . . . . . . . . . . . . . . . . . . 14-21914.12.4 Radionuclides . . . . . . . . . . . . . . . . . . . . . . . . . . . . . . . . . . . . . . . . . . . . . 14-22014.12.5 Separation Methods . . . . . . . . . . . . . . . . . . . . . . . . . . . . . . . . . . . . . . . . . 14-222
Attachment 14A Radioactive Decay and Equilibrium . . . . . . . . . . . . . . . . . . . . . . . . . . 14-22314A.1 Radioactive Equilibrium . . . . . . . . . . . . . . . . . . . . . . . . . . . . . . . . . . . . . . . 14-223
14A.1.1 Secular Equilibrium . . . . . . . . . . . . . . . . . . . . . . . . . . . . . . . . . . . . . 14-22314A.1.2 Transient Equilibrium . . . . . . . . . . . . . . . . . . . . . . . . . . . . . . . . . . . 14-22514A.1.3 No Equilibrium . . . . . . . . . . . . . . . . . . . . . . . . . . . . . . . . . . . . . . . . 14-22614A.1.4 Summary of Radioactive Equilibria . . . . . . . . . . . . . . . . . . . . . . . . . 14-227
14A.1.5 Supported and Unsupported Radioactive Equilibria . . . . . . . . . . . . . . . . 14-22814A.2 Effects of Radioactive Equilibria on Measurement Uncertainty . . . . . . . . . 14-229
14A.2.1 Issue . . . . . . . . . . . . . . . . . . . . . . . . . . . . . . . . . . . . . . . . . . . . . . . . . 14-22914A.2.2 Discussion . . . . . . . . . . . . . . . . . . . . . . . . . . . . . . . . . . . . . . . . . . . . 14-22914A.2.3 Examples of Isotopic Distribution: Natural, Enriched, and Depleted
Uranium . . . . . . . . . . . . . . . . . . . . . . . . . . . . . . . . . . . . . . . . . . . . . . 14-23114A.3 References . . . . . . . . . . . . . . . . . . . . . . . . . . . . . . . . . . . . . . . . . . . . . . . . . . 14-232
15 Quantification of Radionuclides . . . . . . . . . . . . . . . . . . . . . . . . . . . . . . . . . . . . . . . . . . . . 15-115.1 Introduction . . . . . . . . . . . . . . . . . . . . . . . . . . . . . . . . . . . . . . . . . . . . . . . . . . . . . . 15-115.2 Instrument Calibrations . . . . . . . . . . . . . . . . . . . . . . . . . . . . . . . . . . . . . . . . . . . . . 15-2

Contents
Page
XXVIIJULY 2004 MARLAP
15.2.1 Calibration Standards . . . . . . . . . . . . . . . . . . . . . . . . . . . . . . . . . . . . . . . . . . . 15-315.2.2 Congruence of Calibration and Test-Source Geometry . . . . . . . . . . . . . . . . . . 15-315.2.3 Calibration and Test-Source Homogeneity . . . . . . . . . . . . . . . . . . . . . . . . . . . 15-515.2.4 Self-Absorption, Attenuation, and Scattering Considerations for Source
Preparations . . . . . . . . . . . . . . . . . . . . . . . . . . . . . . . . . . . . . . . . . . . . . . . . . . . . . . 15-515.2.5 Calibration Uncertainty . . . . . . . . . . . . . . . . . . . . . . . . . . . . . . . . . . . . . . . . . . 15-7
15.3 Methods of Source Preparation . . . . . . . . . . . . . . . . . . . . . . . . . . . . . . . . . . . . . . . 15-815.3.1 Electrodeposition . . . . . . . . . . . . . . . . . . . . . . . . . . . . . . . . . . . . . . . . . . . . . . . 15-815.3.2 Precipitation/Coprecipitation . . . . . . . . . . . . . . . . . . . . . . . . . . . . . . . . . . . . . 15-1115.3.3 Evaporation . . . . . . . . . . . . . . . . . . . . . . . . . . . . . . . . . . . . . . . . . . . . . . . . . . 15-1215.3.4 Thermal Volatilization/Sublimation . . . . . . . . . . . . . . . . . . . . . . . . . . . . . . . . 15-1515.3.5 Special Source Matrices . . . . . . . . . . . . . . . . . . . . . . . . . . . . . . . . . . . . . . . . . 15-16
15.3.5.1 Radioactive Gases . . . . . . . . . . . . . . . . . . . . . . . . . . . . . . . . . . . . . . . 15-1615.3.5.2 Air Filters . . . . . . . . . . . . . . . . . . . . . . . . . . . . . . . . . . . . . . . . . . . . . . 15-1715.3.5.3 Swipes . . . . . . . . . . . . . . . . . . . . . . . . . . . . . . . . . . . . . . . . . . . . . . . . 15-18
15.4 Alpha Detection Methods . . . . . . . . . . . . . . . . . . . . . . . . . . . . . . . . . . . . . . . . . . 15-1815.4.1 Introduction . . . . . . . . . . . . . . . . . . . . . . . . . . . . . . . . . . . . . . . . . . . . . . . . . . 15-1815.4.2 Gas Proportional Counting . . . . . . . . . . . . . . . . . . . . . . . . . . . . . . . . . . . . . . 15-20
15.4.2.1 Detector Requirements and Characteristics . . . . . . . . . . . . . . . . . . . . . 15-2015.4.2.2 Calibration and Test Source Preparation . . . . . . . . . . . . . . . . . . . . . . 15-2515.4.2.3 Detector Calibration . . . . . . . . . . . . . . . . . . . . . . . . . . . . . . . . . . . . . 15-2515.4.2.4 Troubleshooting . . . . . . . . . . . . . . . . . . . . . . . . . . . . . . . . . . . . . . . . . 15-27
15.4.3 Solid-State Detectors . . . . . . . . . . . . . . . . . . . . . . . . . . . . . . . . . . . . . . . . . . . 15-2915.4.3.1 Detector Requirements and Characteristics . . . . . . . . . . . . . . . . . . . . 15-3015.4.3.2 Calibration- and Test-Source Preparation . . . . . . . . . . . . . . . . . . . . . 15-3315.4.3.3 Detector Calibration . . . . . . . . . . . . . . . . . . . . . . . . . . . . . . . . . . . . . . 15-3315.4.3.4 Troubleshooting . . . . . . . . . . . . . . . . . . . . . . . . . . . . . . . . . . . . . . . . . 15-3415.4.3.5 Detector or Detector Chamber Contamination . . . . . . . . . . . . . . . . . 15-3515.4.3.6 Degraded Spectrum . . . . . . . . . . . . . . . . . . . . . . . . . . . . . . . . . . . . . . 15-37
15.4.4 Fluorescent Detectors . . . . . . . . . . . . . . . . . . . . . . . . . . . . . . . . . . . . . . . . . . . 15-3815.4.4.1 Zinc Sulfide . . . . . . . . . . . . . . . . . . . . . . . . . . . . . . . . . . . . . . . . . . . . 15-3815.4.4.2 Calibration- and Test-Source Preparation . . . . . . . . . . . . . . . . . . . . . 15-4015.4.4.3 Detector Calibration . . . . . . . . . . . . . . . . . . . . . . . . . . . . . . . . . . . . . . 15-4115.4.4.4 Troubleshooting . . . . . . . . . . . . . . . . . . . . . . . . . . . . . . . . . . . . . . . . . 15-41
15.4.5 Photon Electron Rejecting Alpha Liquid Scintillation (PERALS®) . . . . . . . 15-4215.4.5.1 Detector Requirements and Characteristics . . . . . . . . . . . . . . . . . . . . 15-4215.4.5.2 Calibration- and Test-Source Preparation . . . . . . . . . . . . . . . . . . . . . 15-4415.4.5.3 Detector Calibration . . . . . . . . . . . . . . . . . . . . . . . . . . . . . . . . . . . . . . 15-4515.4.5.4 Quench . . . . . . . . . . . . . . . . . . . . . . . . . . . . . . . . . . . . . . . . . . . . . . . . 15-4515.4.5.5 Available Cocktails . . . . . . . . . . . . . . . . . . . . . . . . . . . . . . . . . . . . . . 15-46
Contents
Page
XXVIIIMARLAP JULY 2004
15.4.5.6 Troubleshooting . . . . . . . . . . . . . . . . . . . . . . . . . . . . . . . . . . . . . . . . . 15-4615.5 Beta Detection Methods . . . . . . . . . . . . . . . . . . . . . . . . . . . . . . . . . . . . . . . . . . . . 15-46
15.5.1 Introduction . . . . . . . . . . . . . . . . . . . . . . . . . . . . . . . . . . . . . . . . . . . . . . . . . . . 15-4615.5.2 Gas Proportional Counting/Geiger-Mueller Tube Counting . . . . . . . . . . . . . 15-49
15.5.2.1 Detector Requirements and Characteristics . . . . . . . . . . . . . . . . . . . . 15-4915.5.2.2 Calibration- and Test-Source Preparation . . . . . . . . . . . . . . . . . . . . . 15-5315.5.2.3 Detector Calibration . . . . . . . . . . . . . . . . . . . . . . . . . . . . . . . . . . . . . . 15-5415.5.2.4. Troubleshooting . . . . . . . . . . . . . . . . . . . . . . . . . . . . . . . . . . . . . . . . . 15-57
15.5.3 Liquid Scintillation . . . . . . . . . . . . . . . . . . . . . . . . . . . . . . . . . . . . . . . . . . . . 15-5715.5.3.1 Detector Requirements and Characteristics . . . . . . . . . . . . . . . . . . . . 15-5815.5.3.2 Calibration- and Test-Source Preparation . . . . . . . . . . . . . . . . . . . . . 15-6115.5.3.3 Detector Calibration . . . . . . . . . . . . . . . . . . . . . . . . . . . . . . . . . . . . . . 15-6215.5.3.4 Troubleshooting . . . . . . . . . . . . . . . . . . . . . . . . . . . . . . . . . . . . . . . . . 15-68
15.6 Gamma Detection Methods . . . . . . . . . . . . . . . . . . . . . . . . . . . . . . . . . . . . . . . . . 15-6815.6.1 Sample Preparation Techniques . . . . . . . . . . . . . . . . . . . . . . . . . . . . . . . . . . . 15-70
15.6.1.1 Containers . . . . . . . . . . . . . . . . . . . . . . . . . . . . . . . . . . . . . . . . . . . . . 15-7115.6.1.2 Gases . . . . . . . . . . . . . . . . . . . . . . . . . . . . . . . . . . . . . . . . . . . . . . . . . 15-7115.6.1.3 Liquids . . . . . . . . . . . . . . . . . . . . . . . . . . . . . . . . . . . . . . . . . . . . . . . . 15-7215.6.1.4 Solids . . . . . . . . . . . . . . . . . . . . . . . . . . . . . . . . . . . . . . . . . . . . . . . . . 15-72
15.6.2 Sodium Iodide Detector . . . . . . . . . . . . . . . . . . . . . . . . . . . . . . . . . . . . . . . . . 15-7315.6.2.1 Detector Requirements and Characteristics . . . . . . . . . . . . . . . . . . . . 15-7315.6.2.2 Operating Voltage . . . . . . . . . . . . . . . . . . . . . . . . . . . . . . . . . . . . . . . 15-7615.6.2.3 Shielding . . . . . . . . . . . . . . . . . . . . . . . . . . . . . . . . . . . . . . . . . . . . . . 15-7615.6.2.4 Background . . . . . . . . . . . . . . . . . . . . . . . . . . . . . . . . . . . . . . . . . . . . 15-7615.6.2.5 Detector Calibration . . . . . . . . . . . . . . . . . . . . . . . . . . . . . . . . . . . . . . 15-7715.6.2.6 Troubleshooting . . . . . . . . . . . . . . . . . . . . . . . . . . . . . . . . . . . . . . . . . 15-77
15.6.3 High Purity Germanium . . . . . . . . . . . . . . . . . . . . . . . . . . . . . . . . . . . . . . . . . 15-7815.6.3.1 Detector Requirements and Characteristics . . . . . . . . . . . . . . . . . . . . 15-7815.6.3.2 Gamma Spectrometer Calibration . . . . . . . . . . . . . . . . . . . . . . . . . . . 15-8215.6.3.3 Troubleshooting . . . . . . . . . . . . . . . . . . . . . . . . . . . . . . . . . . . . . . . . . 15-84
15.6.4 Extended Range Germanium Detectors . . . . . . . . . . . . . . . . . . . . . . . . . . . . 15-8815.6.4.1 Detector Requirements and Characteristics . . . . . . . . . . . . . . . . . . . . 15-8915.6.4.2 Detector Calibration . . . . . . . . . . . . . . . . . . . . . . . . . . . . . . . . . . . . . . 15-8915.6.4.3 Troubleshooting . . . . . . . . . . . . . . . . . . . . . . . . . . . . . . . . . . . . . . . . . 15-90
15.6.5 Special Techniques for Radiation Detection . . . . . . . . . . . . . . . . . . . . . . . . . 15-9015.6.5.1 Other Gamma Detection Systems . . . . . . . . . . . . . . . . . . . . . . . . . . . 15-9015.6.5.2 Coincidence Counting . . . . . . . . . . . . . . . . . . . . . . . . . . . . . . . . . . . . 15-9115.6.5.3 Anti-Coincidence Counting . . . . . . . . . . . . . . . . . . . . . . . . . . . . . . . . 15-93
15.7 Specialized Analytical Techniques . . . . . . . . . . . . . . . . . . . . . . . . . . . . . . . . . . . 15-9415.7.1 Kinetic Phosphorescence Analysis by Laser (KPA) . . . . . . . . . . . . . . . . . . . 15-94

Contents
Page
XXIXJULY 2004 MARLAP
15.7.2 Mass Spectrometry . . . . . . . . . . . . . . . . . . . . . . . . . . . . . . . . . . . . . . . . . . . . . 15-9515.7.2.1 Inductively Coupled Plasma-Mass Spectrometry . . . . . . . . . . . . . . . 15-9615.7.2.2 Thermal Ionization Mass Spectrometry . . . . . . . . . . . . . . . . . . . . . . . 15-9915.7.2.3 Accelerator Mass Spectrometry . . . . . . . . . . . . . . . . . . . . . . . . . . . . 15-100
15.8 References . . . . . . . . . . . . . . . . . . . . . . . . . . . . . . . . . . . . . . . . . . . . . . . . . . . . . 15-10115.8.1 Cited References . . . . . . . . . . . . . . . . . . . . . . . . . . . . . . . . . . . . . . . . . . . . . 15-10115.8.2 Other Sources . . . . . . . . . . . . . . . . . . . . . . . . . . . . . . . . . . . . . . . . . . . . . . . . 15-115
16 Data Acquisition, Reduction, and Reporting for Nuclear Counting Instrumentation . . . . 16-116.1 Introduction . . . . . . . . . . . . . . . . . . . . . . . . . . . . . . . . . . . . . . . . . . . . . . . . . . . . . . 16-116.2 Data Acquisition . . . . . . . . . . . . . . . . . . . . . . . . . . . . . . . . . . . . . . . . . . . . . . . . . . 16-2
16.2.1 Generic Counting Parameter Selection . . . . . . . . . . . . . . . . . . . . . . . . . . . . . . 16-316.2.1.1 Counting Duration . . . . . . . . . . . . . . . . . . . . . . . . . . . . . . . . . . . . . . . . 16-416.2.1.2 Counting Geometry . . . . . . . . . . . . . . . . . . . . . . . . . . . . . . . . . . . . . . . 16-516.2.1.3 Software . . . . . . . . . . . . . . . . . . . . . . . . . . . . . . . . . . . . . . . . . . . . . . . . . . 16-5
16.2.2 Basic Data Reduction Calculations . . . . . . . . . . . . . . . . . . . . . . . . . . . . . . . . . 16-616.3 Data Reduction on Spectrometry Systems . . . . . . . . . . . . . . . . . . . . . . . . . . . . . . 16-8
16.3.1 Gamma-Ray Spectrometry . . . . . . . . . . . . . . . . . . . . . . . . . . . . . . . . . . . . . . . . 16-916.3.1.1 Peak Search or Identification . . . . . . . . . . . . . . . . . . . . . . . . . . . . . . . . . 16-1016.3.1.2 Singlet/Multiplet Peaks . . . . . . . . . . . . . . . . . . . . . . . . . . . . . . . . . . . 16-1316.3.1.3 Definition of Peak Centroid and Energy . . . . . . . . . . . . . . . . . . . . . . . . 16-1416.3.1.4 Peak Width Determination . . . . . . . . . . . . . . . . . . . . . . . . . . . . . . . . . . . 16-1516.3.1.5 Peak Area Determination . . . . . . . . . . . . . . . . . . . . . . . . . . . . . . . . . . 16-1716.3.1.6 Calibration Reference File . . . . . . . . . . . . . . . . . . . . . . . . . . . . . . . . . 16-1916.3.1.7 Activity and Concentration . . . . . . . . . . . . . . . . . . . . . . . . . . . . . . . . 16-2016.3.1.8 Summing Considerations . . . . . . . . . . . . . . . . . . . . . . . . . . . . . . . . . . 16-2116.3.1.9 Uncertainty Calculation . . . . . . . . . . . . . . . . . . . . . . . . . . . . . . . . . . . . . 16-22
16.3.2 Alpha Spectrometry . . . . . . . . . . . . . . . . . . . . . . . . . . . . . . . . . . . . . . . . . . . . 16-2316.3.2.1 Radiochemical Yield . . . . . . . . . . . . . . . . . . . . . . . . . . . . . . . . . . . . . 16-2716.3.2.2 Uncertainty Calculation . . . . . . . . . . . . . . . . . . . . . . . . . . . . . . . . . . . 16-28
16.3.3 Liquid Scintillation Spectrometry . . . . . . . . . . . . . . . . . . . . . . . . . . . . . . . . . 16-2916.3.3.1 Overview of Liquid Scintillation Counting . . . . . . . . . . . . . . . . . . . . . . 16-2916.3.3.2 Liquid Scintillation Spectra . . . . . . . . . . . . . . . . . . . . . . . . . . . . . . . . 16-2916.3.3.3 Pulse Characteristics . . . . . . . . . . . . . . . . . . . . . . . . . . . . . . . . . . . . . 16-2916.3.3.4 Coincidence Circuitry . . . . . . . . . . . . . . . . . . . . . . . . . . . . . . . . . . . . 16-3016.3.3.5 Quenching . . . . . . . . . . . . . . . . . . . . . . . . . . . . . . . . . . . . . . . . . . . . . 16-3016.3.3.6 Luminescence . . . . . . . . . . . . . . . . . . . . . . . . . . . . . . . . . . . . . . . . . . . 16-3116.3.3.7 Test-Source Vials . . . . . . . . . . . . . . . . . . . . . . . . . . . . . . . . . . . . . . . . 16-3116.3.3.8 Data Reduction for Liquid Scintillation Counting . . . . . . . . . . . . . . . 16-31
16.4 Data Reduction on Non-Spectrometry Systems . . . . . . . . . . . . . . . . . . . . . . . . . . 16-32

Contents
Page
XXXMARLAP JULY 2004
16.5 Internal Review of Data by Laboratory Personnel . . . . . . . . . . . . . . . . . . . . . . . . 16-3616.5.1 Primary Review . . . . . . . . . . . . . . . . . . . . . . . . . . . . . . . . . . . . . . . . . . . . . . . 16-3716.5.2 Secondary Review . . . . . . . . . . . . . . . . . . . . . . . . . . . . . . . . . . . . . . . . . . . . . 16-37
16.6 Reporting Results . . . . . . . . . . . . . . . . . . . . . . . . . . . . . . . . . . . . . . . . . . . . . . . . . 16-3816.6.1 Sample and Analysis Method Identification . . . . . . . . . . . . . . . . . . . . . . . . . 16-3816.6.2 Units and Radionuclide Identification . . . . . . . . . . . . . . . . . . . . . . . . . . . . . . 16-3816.6.3 Values, Uncertainty, and Significant Figures . . . . . . . . . . . . . . . . . . . . . . . . . 16-39
16.7 Data Reporting Packages . . . . . . . . . . . . . . . . . . . . . . . . . . . . . . . . . . . . . . . . . . . 16-3916.8 Electronic Data Deliverables . . . . . . . . . . . . . . . . . . . . . . . . . . . . . . . . . . . . . . . . 16-4116.9 References . . . . . . . . . . . . . . . . . . . . . . . . . . . . . . . . . . . . . . . . . . . . . . . . . . . . . . 16-41
16.9.1 Cited References . . . . . . . . . . . . . . . . . . . . . . . . . . . . . . . . . . . . . . . . . . . . . . 16-4116.9.2 Other Sources . . . . . . . . . . . . . . . . . . . . . . . . . . . . . . . . . . . . . . . . . . . . . . . . . 16-44
17 Waste Management in a Radioanalytical Laboratory . . . . . . . . . . . . . . . . . . . . . . . . . . . . 17-117.1 Introduction . . . . . . . . . . . . . . . . . . . . . . . . . . . . . . . . . . . . . . . . . . . . . . . . . . . . . . 17-117.2 Types of Laboratory Wastes . . . . . . . . . . . . . . . . . . . . . . . . . . . . . . . . . . . . . . . . . 17-117.3 Waste Management Program . . . . . . . . . . . . . . . . . . . . . . . . . . . . . . . . . . . . . . . . . 17-2
17.3.1 Program Integration . . . . . . . . . . . . . . . . . . . . . . . . . . . . . . . . . . . . . . . . . . . . . 17-317.3.2 Staff Involvement . . . . . . . . . . . . . . . . . . . . . . . . . . . . . . . . . . . . . . . . . . . . . . . 17-3
17.4 Waste Minimization . . . . . . . . . . . . . . . . . . . . . . . . . . . . . . . . . . . . . . . . . . . . . . . . 17-317.5 Waste Characterization . . . . . . . . . . . . . . . . . . . . . . . . . . . . . . . . . . . . . . . . . . . . . 17-617.6 Specific Waste Management Requirements . . . . . . . . . . . . . . . . . . . . . . . . . . . . . 17-6
17.6.1 Sample/Waste Exemptions . . . . . . . . . . . . . . . . . . . . . . . . . . . . . . . . . . . . . . . 17-917.6.2 Storage . . . . . . . . . . . . . . . . . . . . . . . . . . . . . . . . . . . . . . . . . . . . . . . . . . . . . . . 17-9
17.6.2.1 Container Requirements . . . . . . . . . . . . . . . . . . . . . . . . . . . . . . . . . . . . . 17-1017.6.2.2 Labeling Requirements . . . . . . . . . . . . . . . . . . . . . . . . . . . . . . . . . . . . . 17-1017.6.2.3 Time Constraints . . . . . . . . . . . . . . . . . . . . . . . . . . . . . . . . . . . . . . . . . . 17-1117.6.2.4 Monitoring Requirements . . . . . . . . . . . . . . . . . . . . . . . . . . . . . . . . . . . 17-11
17.6.3 Treatment . . . . . . . . . . . . . . . . . . . . . . . . . . . . . . . . . . . . . . . . . . . . . . . . . . . . 17-1217.6.4 Disposal . . . . . . . . . . . . . . . . . . . . . . . . . . . . . . . . . . . . . . . . . . . . . . . . . . . . . 17-12
17.7 Contents of a Laboratory Waste Management Plan/Certification Plan . . . . . . . . 17-1317.7.1 Laboratory Waste Management Plan . . . . . . . . . . . . . . . . . . . . . . . . . . . . . . . 17-1317.7.2 Waste Certification Plan/Program . . . . . . . . . . . . . . . . . . . . . . . . . . . . . . . . . 17-14
17.8 Useful Web Sites . . . . . . . . . . . . . . . . . . . . . . . . . . . . . . . . . . . . . . . . . . . . . . . . . 17-1517.9 References . . . . . . . . . . . . . . . . . . . . . . . . . . . . . . . . . . . . . . . . . . . . . . . . . . . . . . 17-17
17.9.1 Cited References . . . . . . . . . . . . . . . . . . . . . . . . . . . . . . . . . . . . . . . . . . . . . . 17-1717.9.2 Other Sources . . . . . . . . . . . . . . . . . . . . . . . . . . . . . . . . . . . . . . . . . . . . . . . . . 17-17

Contents
Page
XXXIJULY 2004 MARLAP
Volume III
18 Laboratory Quality Control . . . . . . . . . . . . . . . . . . . . . . . . . . . . . . . . . . . . . . . . . . . . . . . . 18-118.1 Introduction . . . . . . . . . . . . . . . . . . . . . . . . . . . . . . . . . . . . . . . . . . . . . . . . . . . . . . 18-1
18.1.1 Organization of Chapter . . . . . . . . . . . . . . . . . . . . . . . . . . . . . . . . . . . . . . . . . . 18-218.1.2 Format . . . . . . . . . . . . . . . . . . . . . . . . . . . . . . . . . . . . . . . . . . . . . . . . . . . . . . . 18-2
18.2 Quality Control . . . . . . . . . . . . . . . . . . . . . . . . . . . . . . . . . . . . . . . . . . . . . . . . . . . 18-318.3 Evaluation of Performance Indicators . . . . . . . . . . . . . . . . . . . . . . . . . . . . . . . . . . 18-3
18.3.1 Importance of Evaluating Performance Indicators . . . . . . . . . . . . . . . . . . . . . . 18-318.3.2 Statistical Means of Evaluating Performance Indicators � Control Charts . . 18-518.3.3 Tolerance Limits . . . . . . . . . . . . . . . . . . . . . . . . . . . . . . . . . . . . . . . . . . . . . . . 18-718.3.4 Measurement Uncertainty . . . . . . . . . . . . . . . . . . . . . . . . . . . . . . . . . . . . . . . . 18-8
18.4 Radiochemistry Performance Indicators . . . . . . . . . . . . . . . . . . . . . . . . . . . . . . . . 18-918.4.1 Method and Reagent Blank . . . . . . . . . . . . . . . . . . . . . . . . . . . . . . . . . . . . . . . 18-918.4.2 Laboratory Replicates . . . . . . . . . . . . . . . . . . . . . . . . . . . . . . . . . . . . . . . . . . 18-1318.4.3 Laboratory Control Samples, Matrix Spikes, and Matrix Spike Duplicates . 18-1618.4.4 Certified Reference Materials . . . . . . . . . . . . . . . . . . . . . . . . . . . . . . . . . . . . 18-1818.4.5 Chemical/Tracer Yield . . . . . . . . . . . . . . . . . . . . . . . . . . . . . . . . . . . . . . . . . . 18-21
18.5 Instrumentation Performance Indicators . . . . . . . . . . . . . . . . . . . . . . . . . . . . . . . 18-2418.5.1 Instrument Background Measurements . . . . . . . . . . . . . . . . . . . . . . . . . . . . . 18-2418.5.2 Efficiency Calibrations . . . . . . . . . . . . . . . . . . . . . . . . . . . . . . . . . . . . . . . . . 18-2618.5.3 Spectrometry Systems . . . . . . . . . . . . . . . . . . . . . . . . . . . . . . . . . . . . . . . . . . 18-29
18.5.3.1 Energy Calibrations . . . . . . . . . . . . . . . . . . . . . . . . . . . . . . . . . . . . . . 18-2918.5.3.2 Peak Resolution and Tailing . . . . . . . . . . . . . . . . . . . . . . . . . . . . . . . 18-32
18.5.4 Gas Proportional Systems . . . . . . . . . . . . . . . . . . . . . . . . . . . . . . . . . . . . . . . 18-3618.5.4.1 Voltage Plateaus . . . . . . . . . . . . . . . . . . . . . . . . . . . . . . . . . . . . . . . . . 18-3618.5.4.2 Self-Absorption, Backscatter, and Crosstalk . . . . . . . . . . . . . . . . . . 18-37
18.5.5 Liquid Scintillation . . . . . . . . . . . . . . . . . . . . . . . . . . . . . . . . . . . . . . . . . . . . 18-3818.5.6 Summary Guidance on Instrument Calibration, Background,
and Quality Control . . . . . . . . . . . . . . . . . . . . . . . . . . . . . . . . . . . . . . . . . . . . . . . 18-4018.5.6.1 Gas Proportional Counting Systems . . . . . . . . . . . . . . . . . . . . . . . . . 18-4218.5.6.2 Gamma-Ray Detectors and Spectrometry Systems . . . . . . . . . . . . . . 18-4518.5.6.3 Alpha Detector and Spectrometry Systems . . . . . . . . . . . . . . . . . . . . 18-4918.5.6.4 Liquid Scintillation Systems . . . . . . . . . . . . . . . . . . . . . . . . . . . . . . . 18-51
18.5.7 Non-Nuclear Instrumentation . . . . . . . . . . . . . . . . . . . . . . . . . . . . . . . . . . . . 18-5318.6 Related Concerns . . . . . . . . . . . . . . . . . . . . . . . . . . . . . . . . . . . . . . . . . . . . . . . . . 18-54
18.6.1 Detection Capability . . . . . . . . . . . . . . . . . . . . . . . . . . . . . . . . . . . . . . . . . . . 18-5418.6.2 Radioactive Equilibrium . . . . . . . . . . . . . . . . . . . . . . . . . . . . . . . . . . . . . . . . 18-5418.6.3 Half-Life . . . . . . . . . . . . . . . . . . . . . . . . . . . . . . . . . . . . . . . . . . . . . . . . . . . . . 18-5718.6.4 Interferences . . . . . . . . . . . . . . . . . . . . . . . . . . . . . . . . . . . . . . . . . . . . . . . . . . 18-58
Contents
Page
XXXIIMARLAP JULY 2004
18.6.5 Negative Results . . . . . . . . . . . . . . . . . . . . . . . . . . . . . . . . . . . . . . . . . . . . . . 18-6018.6.6 Blind Samples . . . . . . . . . . . . . . . . . . . . . . . . . . . . . . . . . . . . . . . . . . . . . . . . 18-6118.6.7 Calibration of Apparatus Used for Mass and Volume Measurements . . . . . . 18-63
18.7 References . . . . . . . . . . . . . . . . . . . . . . . . . . . . . . . . . . . . . . . . . . . . . . . . . . . . . . 18-6518.7.1 Cited Sources . . . . . . . . . . . . . . . . . . . . . . . . . . . . . . . . . . . . . . . . . . . . . . . . . 18-6518.7.2 Other Sources . . . . . . . . . . . . . . . . . . . . . . . . . . . . . . . . . . . . . . . . . . . . . . . . . 18-67
Attachment 18A: Control Charts . . . . . . . . . . . . . . . . . . . . . . . . . . . . . . . . . . . . . . . . . . . 18-6918A.1 Introduction . . . . . . . . . . . . . . . . . . . . . . . . . . . . . . . . . . . . . . . . . . . . . . . . . . 18-6918A.2 X Charts . . . . . . . . . . . . . . . . . . . . . . . . . . . . . . . . . . . . . . . . . . . . . . . . . . . . . 18-6918A.3 Charts . . . . . . . . . . . . . . . . . . . . . . . . . . . . . . . . . . . . . . . . . . . . . . . . . . . . . 18-72X18A.4 R Charts . . . . . . . . . . . . . . . . . . . . . . . . . . . . . . . . . . . . . . . . . . . . . . . . . . . . . 18-7418A.5 Control Charts for Instrument Response . . . . . . . . . . . . . . . . . . . . . . . . . . . . 18-7518A.6 References . . . . . . . . . . . . . . . . . . . . . . . . . . . . . . . . . . . . . . . . . . . . . . . . . . . 18-79
Attachment 18B: Statistical Tests for QC Results . . . . . . . . . . . . . . . . . . . . . . . . . . . . . . 18-8118B.1 Introduction . . . . . . . . . . . . . . . . . . . . . . . . . . . . . . . . . . . . . . . . . . . . . . . . . . 18-8118B.2 Tests for Excess Variance in the Instrument Response . . . . . . . . . . . . . . . . . 18-8118B.3 Instrument Background Measurements . . . . . . . . . . . . . . . . . . . . . . . . . . . . . 18-88
18B.3.1 Detection of Background Variability . . . . . . . . . . . . . . . . . . . . . . . . . 18-8818B.3.2 Comparing a Single Observation to Preset Limits . . . . . . . . . . . . . . . 18-9018B.3.3 Comparing the Results of Consecutive Measurements . . . . . . . . . . . 18-93
18B.4 Negative Activities . . . . . . . . . . . . . . . . . . . . . . . . . . . . . . . . . . . . . . . . . . . . . 18-9618B.5 References . . . . . . . . . . . . . . . . . . . . . . . . . . . . . . . . . . . . . . . . . . . . . . . . . . . 18-96
19 Measurement Uncertainty . . . . . . . . . . . . . . . . . . . . . . . . . . . . . . . . . . . . . . . . . . . . . . . . . 19-119.1 Overview . . . . . . . . . . . . . . . . . . . . . . . . . . . . . . . . . . . . . . . . . . . . . . . . . . . . . . . . 19-119.2 The Need for Uncertainty Evaluation . . . . . . . . . . . . . . . . . . . . . . . . . . . . . . . . . . 19-119.3 Evaluating and Expressing Measurement Uncertainty . . . . . . . . . . . . . . . . . . . . . 19-3
19.3.1 Measurement, Error, and Uncertainty . . . . . . . . . . . . . . . . . . . . . . . . . . . . . . . 19-319.3.2 The Measurement Process . . . . . . . . . . . . . . . . . . . . . . . . . . . . . . . . . . . . . . . . 19-419.3.3 Analysis of Measurement Uncertainty . . . . . . . . . . . . . . . . . . . . . . . . . . . . . . . 19-619.3.4 Corrections for Systematic Effects . . . . . . . . . . . . . . . . . . . . . . . . . . . . . . . . . . 19-719.3.5 Counting Uncertainty . . . . . . . . . . . . . . . . . . . . . . . . . . . . . . . . . . . . . . . . . . . . 19-719.3.6 Expanded Uncertainty . . . . . . . . . . . . . . . . . . . . . . . . . . . . . . . . . . . . . . . . . . . 19-719.3.7 Significant Figures . . . . . . . . . . . . . . . . . . . . . . . . . . . . . . . . . . . . . . . . . . . . . . 19-819.3.8 Reporting the Measurement Uncertainty . . . . . . . . . . . . . . . . . . . . . . . . . . . . . 19-919.3.9 Recommendations . . . . . . . . . . . . . . . . . . . . . . . . . . . . . . . . . . . . . . . . . . . . . 19-10
19.4 Procedures for Evaluating Uncertainty . . . . . . . . . . . . . . . . . . . . . . . . . . . . . . . . 19-1119.4.1 Identifying Sources of Uncertainty . . . . . . . . . . . . . . . . . . . . . . . . . . . . . . . . 19-1219.4.2 Evaluation of Standard Uncertainties . . . . . . . . . . . . . . . . . . . . . . . . . . . . . . 19-13

Contents
Page
XXXIIIJULY 2004 MARLAP
19.4.2.1 Type A Evaluations . . . . . . . . . . . . . . . . . . . . . . . . . . . . . . . . . . . . . . . . 19-1319.4.2.2 Type B Evaluations . . . . . . . . . . . . . . . . . . . . . . . . . . . . . . . . . . . . . . . . 19-16
19.4.3 Combined Standard Uncertainty . . . . . . . . . . . . . . . . . . . . . . . . . . . . . . . . . . 19-2019.4.3.1 Uncertainty Propagation Formula . . . . . . . . . . . . . . . . . . . . . . . . . . . . . 19-2019.4.3.2 Components of Uncertainty . . . . . . . . . . . . . . . . . . . . . . . . . . . . . . . . . 19-2419.4.3.3 Special Forms of the Uncertainty Propagation Formula . . . . . . . . . . . . 19-25
19.4.4 The Estimated Covariance of Two Output Estimates . . . . . . . . . . . . . . . . . . 19-2619.4.5 Special Considerations for Nonlinear Models . . . . . . . . . . . . . . . . . . . . . . . . 19-29
19.4.5.1 Uncertainty Propagation for Nonlinear Models . . . . . . . . . . . . . . . . . . 19-2919.4.5.2 Bias due to Nonlinearity . . . . . . . . . . . . . . . . . . . . . . . . . . . . . . . . . . . . 19-31
19.4.6 Monte Carlo Methods . . . . . . . . . . . . . . . . . . . . . . . . . . . . . . . . . . . . . . . . . . . 19-3419.5 Radiation Measurement Uncertainty . . . . . . . . . . . . . . . . . . . . . . . . . . . . . . . . . . 19-34
19.5.1 Radioactive Decay . . . . . . . . . . . . . . . . . . . . . . . . . . . . . . . . . . . . . . . . . . . . . 19-3419.5.2 Radiation Counting . . . . . . . . . . . . . . . . . . . . . . . . . . . . . . . . . . . . . . . . . . . . 19-35
19.5.2.1 Binomial Model . . . . . . . . . . . . . . . . . . . . . . . . . . . . . . . . . . . . . . . . . . 19-3519.5.2.2 Poisson Approximation . . . . . . . . . . . . . . . . . . . . . . . . . . . . . . . . . . . . . 19-36
19.5.3 Count Time and Count Rate . . . . . . . . . . . . . . . . . . . . . . . . . . . . . . . . . . . . . 19-3819.5.3.1 Dead Time . . . . . . . . . . . . . . . . . . . . . . . . . . . . . . . . . . . . . . . . . . . . . . . 19-3919.5.3.2 A Confidence Interval for the Count Rate . . . . . . . . . . . . . . . . . . . . . . 19-40
19.5.4 Instrument Background . . . . . . . . . . . . . . . . . . . . . . . . . . . . . . . . . . . . . . . . . 19-4119.5.5 Radiochemical Blanks . . . . . . . . . . . . . . . . . . . . . . . . . . . . . . . . . . . . . . . . . . 19-4219.5.6 Counting Efficiency . . . . . . . . . . . . . . . . . . . . . . . . . . . . . . . . . . . . . . . . . . . . 19-4319.5.7 Radionuclide Half-Life . . . . . . . . . . . . . . . . . . . . . . . . . . . . . . . . . . . . . . . . . 19-4719.5.8 Gamma-Ray Spectrometry . . . . . . . . . . . . . . . . . . . . . . . . . . . . . . . . . . . . . . . 19-4819.5.9 Balances . . . . . . . . . . . . . . . . . . . . . . . . . . . . . . . . . . . . . . . . . . . . . . . . . . . . . 19-4819.5.10 Pipets and Other Volumetric Apparatus . . . . . . . . . . . . . . . . . . . . . . . . . . . 19-5219.5.11 Digital Displays and Rounding . . . . . . . . . . . . . . . . . . . . . . . . . . . . . . . . . . 19-5419.5.12 Subsampling . . . . . . . . . . . . . . . . . . . . . . . . . . . . . . . . . . . . . . . . . . . . . . . . . 19-5519.5.13 The Standard Uncertainty for a Hypothetical Measurement . . . . . . . . . . . . 19-56
19.6 References . . . . . . . . . . . . . . . . . . . . . . . . . . . . . . . . . . . . . . . . . . . . . . . . . . . . . . 19-5819.6.1 Cited Sources . . . . . . . . . . . . . . . . . . . . . . . . . . . . . . . . . . . . . . . . . . . . . . . . . 19-5819.6.2 Other Sources . . . . . . . . . . . . . . . . . . . . . . . . . . . . . . . . . . . . . . . . . . . . . . . . . 19-61
Attachment 19A: Statistical Concepts and Terms . . . . . . . . . . . . . . . . . . . . . . . . . . . . . . 19-6319A.1 Basic Concepts . . . . . . . . . . . . . . . . . . . . . . . . . . . . . . . . . . . . . . . . . . . . . . . . 19-6319A.2 Probability Distributions . . . . . . . . . . . . . . . . . . . . . . . . . . . . . . . . . . . . . . . . 19-66
19A.2.1 Normal Distributions . . . . . . . . . . . . . . . . . . . . . . . . . . . . . . . . . . . . . . . 19-6719A.2.2 Log-normal Distributions . . . . . . . . . . . . . . . . . . . . . . . . . . . . . . . . . . . 19-6819A.2.3 Chi-squared Distributions . . . . . . . . . . . . . . . . . . . . . . . . . . . . . . . . . . . 19-6919A.2.4 T-Distributions . . . . . . . . . . . . . . . . . . . . . . . . . . . . . . . . . . . . . . . . . . . 19-7019A.2.5 Rectangular Distributions . . . . . . . . . . . . . . . . . . . . . . . . . . . . . . . . . . . 19-71
Contents
Page
XXXIVMARLAP JULY 2004
19A.2.6 Trapezoidal and Triangular Distributions . . . . . . . . . . . . . . . . . . . . . . . 19-7219A.2.7 Exponential Distributions . . . . . . . . . . . . . . . . . . . . . . . . . . . . . . . . . . . 19-7319A.2.8 Binomial Distributions . . . . . . . . . . . . . . . . . . . . . . . . . . . . . . . . . . . . . 19-7319A.2.9 Poisson Distributions . . . . . . . . . . . . . . . . . . . . . . . . . . . . . . . . . . . . . . 19-74
19A.3 References . . . . . . . . . . . . . . . . . . . . . . . . . . . . . . . . . . . . . . . . . . . . . . . . . . . 19-76Attachment 19B: Example Calculations . . . . . . . . . . . . . . . . . . . . . . . . . . . . . . . . . . . . . 19-77
19B.1 Overview . . . . . . . . . . . . . . . . . . . . . . . . . . . . . . . . . . . . . . . . . . . . . . . . . . . . 19-7719B.2 Sample Collection and Analysis . . . . . . . . . . . . . . . . . . . . . . . . . . . . . . . . . . . 19-7719B.3 The Measurement Model . . . . . . . . . . . . . . . . . . . . . . . . . . . . . . . . . . . . . . . . 19-7819B.4 The Combined Standard Uncertainty . . . . . . . . . . . . . . . . . . . . . . . . . . . . . . . 19-80
Attachment 19C: Multicomponent Measurement Models . . . . . . . . . . . . . . . . . . . . . . . . 19-8319C.1 Introduction . . . . . . . . . . . . . . . . . . . . . . . . . . . . . . . . . . . . . . . . . . . . . . . . . . 19-8319C.2 The Covariance Matrix . . . . . . . . . . . . . . . . . . . . . . . . . . . . . . . . . . . . . . . . . . 19-8319C.3 Least-Squares Regression . . . . . . . . . . . . . . . . . . . . . . . . . . . . . . . . . . . . . . . . 19-8319C.4 References . . . . . . . . . . . . . . . . . . . . . . . . . . . . . . . . . . . . . . . . . . . . . . . . . . . 19-84
Attachment 19D: Estimation of Coverage Factors . . . . . . . . . . . . . . . . . . . . . . . . . . . . . 19-8519D.1 Introduction . . . . . . . . . . . . . . . . . . . . . . . . . . . . . . . . . . . . . . . . . . . . . . . . . . 19-8519D.2 Procedure . . . . . . . . . . . . . . . . . . . . . . . . . . . . . . . . . . . . . . . . . . . . . . . . . . . . 19-85
19D.2.1 Basis of Procedure . . . . . . . . . . . . . . . . . . . . . . . . . . . . . . . . . . . . . . . . . 19-8519D.2.2 Assumptions . . . . . . . . . . . . . . . . . . . . . . . . . . . . . . . . . . . . . . . . . . . . . 19-8519D.2.3 Effective Degrees of Freedom . . . . . . . . . . . . . . . . . . . . . . . . . . . . . . . . 19-8619D.2.4 Coverage Factor . . . . . . . . . . . . . . . . . . . . . . . . . . . . . . . . . . . . . . . . . . 19-87
19D.3 Poisson Counting Uncertainty . . . . . . . . . . . . . . . . . . . . . . . . . . . . . . . . . . . . 19-8819D.4 References . . . . . . . . . . . . . . . . . . . . . . . . . . . . . . . . . . . . . . . . . . . . . . . . . . . 19-91
Attachment 19E: Uncertainties of Mass and Volume Measurements . . . . . . . . . . . . . . . 19-9319E.1 Purpose . . . . . . . . . . . . . . . . . . . . . . . . . . . . . . . . . . . . . . . . . . . . . . . . . . . . . . 19-9319E.2 Mass Measurements . . . . . . . . . . . . . . . . . . . . . . . . . . . . . . . . . . . . . . . . . . . . 19-93
19E.2.1 Considerations . . . . . . . . . . . . . . . . . . . . . . . . . . . . . . . . . . . . . . . . . . . . 19-9319E.2.2 Repeatability . . . . . . . . . . . . . . . . . . . . . . . . . . . . . . . . . . . . . . . . . . . . . 19-9419E.2.3 Environmental Factors . . . . . . . . . . . . . . . . . . . . . . . . . . . . . . . . . . . . . . 19-9519E.2.4 Calibration . . . . . . . . . . . . . . . . . . . . . . . . . . . . . . . . . . . . . . . . . . . . . . . 19-9719E.2.5 Linearity . . . . . . . . . . . . . . . . . . . . . . . . . . . . . . . . . . . . . . . . . . . . . . . . . 19-9819E.2.6 Gain or Loss of Mass . . . . . . . . . . . . . . . . . . . . . . . . . . . . . . . . . . . . . . . 19-9819E.2.7 Air-Buoyancy Corrections . . . . . . . . . . . . . . . . . . . . . . . . . . . . . . . . . . . 19-9919E.2.8 Combining the Components . . . . . . . . . . . . . . . . . . . . . . . . . . . . . . . . 19-103
19E.3 Volume Measurements . . . . . . . . . . . . . . . . . . . . . . . . . . . . . . . . . . . . . . . . . 19-10519E.3.1 First Approach . . . . . . . . . . . . . . . . . . . . . . . . . . . . . . . . . . . . . . . . . . . 19-10519E.3.2 Second Approach . . . . . . . . . . . . . . . . . . . . . . . . . . . . . . . . . . . . . . . . . 19-10819E.3.3 Third Approach . . . . . . . . . . . . . . . . . . . . . . . . . . . . . . . . . . . . . . . . . . 19-111
19E.4 References . . . . . . . . . . . . . . . . . . . . . . . . . . . . . . . . . . . . . . . . . . . . . . . . . . 19-111
Contents
Page
XXXVJULY 2004 MARLAP
20 Detection and Quantification Capabilities . . . . . . . . . . . . . . . . . . . . . . . . . . . . . . . . . . . . . 20-120.1 Overview . . . . . . . . . . . . . . . . . . . . . . . . . . . . . . . . . . . . . . . . . . . . . . . . . . . . . . . . . . . 20-1
20.2 Concepts and Definitions . . . . . . . . . . . . . . . . . . . . . . . . . . . . . . . . . . . . . . . . . . . . 20-120.2.1 Analyte Detection Decisions . . . . . . . . . . . . . . . . . . . . . . . . . . . . . . . . . . . . . . 20-120.2.2 The Critical Value . . . . . . . . . . . . . . . . . . . . . . . . . . . . . . . . . . . . . . . . . . . . . . 20-320.2.3 The Blank . . . . . . . . . . . . . . . . . . . . . . . . . . . . . . . . . . . . . . . . . . . . . . . . . . . . . 20-520.2.4 The Minimum Detectable Concentration . . . . . . . . . . . . . . . . . . . . . . . . . . . . . 20-520.2.6 Other Detection Terminologies . . . . . . . . . . . . . . . . . . . . . . . . . . . . . . . . . . . . 20-920.2.7 The Minimum Quantifiable Concentration . . . . . . . . . . . . . . . . . . . . . . . . . . 20-10
20.3 Recommendations . . . . . . . . . . . . . . . . . . . . . . . . . . . . . . . . . . . . . . . . . . . . . . . . 20-1120.4 Calculation of Detection and Quantification Limits . . . . . . . . . . . . . . . . . . . . . . 20-12
20.4.1 Calculation of the Critical Value . . . . . . . . . . . . . . . . . . . . . . . . . . . . . . . . . . 20-1220.4.1.1 Normally Distributed Signals . . . . . . . . . . . . . . . . . . . . . . . . . . . . . . . . 20-1320.4.1.2 Poisson Counting . . . . . . . . . . . . . . . . . . . . . . . . . . . . . . . . . . . . . . . . . 20-1320.4.1.3 Batch Blanks . . . . . . . . . . . . . . . . . . . . . . . . . . . . . . . . . . . . . . . . . . . . . 20-17
20.4.2 Calculation of the Minimum Detectable Concentration . . . . . . . . . . . . . . . . 20-1820.4.2.1 The Minimum Detectable Net Instrument Signal . . . . . . . . . . . . . . . . . 20-1920.4.2.2 Normally Distributed Signals . . . . . . . . . . . . . . . . . . . . . . . . . . . . . . . . 20-2020.4.2.3 Poisson Counting . . . . . . . . . . . . . . . . . . . . . . . . . . . . . . . . . . . . . . . . . 20-2420.4.2.4 More Conservative Approaches . . . . . . . . . . . . . . . . . . . . . . . . . . . . . . 20-2820.4.2.5 Experimental Verification of the MDC . . . . . . . . . . . . . . . . . . . . . . . . 20-28
20.4.3 Calculation of the Minimum Quantifiable Concentration . . . . . . . . . . . . . . . 20-2920.5 References . . . . . . . . . . . . . . . . . . . . . . . . . . . . . . . . . . . . . . . . . . . . . . . . . . . . . . 20-33
20.5.1 Cited Sources . . . . . . . . . . . . . . . . . . . . . . . . . . . . . . . . . . . . . . . . . . . . . . . . . 20-3320.5.2 Other Sources . . . . . . . . . . . . . . . . . . . . . . . . . . . . . . . . . . . . . . . . . . . . . . . . . 20-35
Attachment 20A: Low-Background Detection Issues . . . . . . . . . . . . . . . . . . . . . . . . . . . 20-3720A.1 Overview . . . . . . . . . . . . . . . . . . . . . . . . . . . . . . . . . . . . . . . . . . . . . . . . . . . . 20-3720A.2 Calculation of the Critical Value . . . . . . . . . . . . . . . . . . . . . . . . . . . . . . . . . . 20-37
20A.2.1 Normally Distributed Signals . . . . . . . . . . . . . . . . . . . . . . . . . . . . . . . 20-3720A.2.2 Poisson Counting . . . . . . . . . . . . . . . . . . . . . . . . . . . . . . . . . . . . . . . . 20-39
20A.3 Calculation of the Minimum Detectable Concentration . . . . . . . . . . . . . . . . 20-5320A.3.1 Normally Distributed Signals . . . . . . . . . . . . . . . . . . . . . . . . . . . . . . . 20-5420A.3.2 Poisson Counting . . . . . . . . . . . . . . . . . . . . . . . . . . . . . . . . . . . . . . . . 20-58
20A.4 References . . . . . . . . . . . . . . . . . . . . . . . . . . . . . . . . . . . . . . . . . . . . . . . . . . . 20-62
Glossary . . . . . . . . . . . . . . . . . . . . . . . . . . . . . . . . . . . . . . . . . . . . . . . . . . . . . . End of each volume
Contents
Page
XXXVIMARLAP JULY 2004
Appendices � Volume I
A Directed Planning Approaches . . . . . . . . . . . . . . . . . . . . . . . . . . . . . . . . . . . . . . . . . . . . . . A-1A.1 Introduction . . . . . . . . . . . . . . . . . . . . . . . . . . . . . . . . . . . . . . . . . . . . . . . . . . . . . . A-1A.2 Elements Common to Directed Planning Approaches . . . . . . . . . . . . . . . . . . . . . . A-2A.3 Data Quality Objectives Process . . . . . . . . . . . . . . . . . . . . . . . . . . . . . . . . . . . . . . A-2A.4 Observational Approach . . . . . . . . . . . . . . . . . . . . . . . . . . . . . . . . . . . . . . . . . . . . A-3A.5 Streamlined Approach for Environmental Restoration . . . . . . . . . . . . . . . . . . . . . A-4A.6 Technical Project Planning . . . . . . . . . . . . . . . . . . . . . . . . . . . . . . . . . . . . . . . . . . A-4A.7 Expedited Site Characterization . . . . . . . . . . . . . . . . . . . . . . . . . . . . . . . . . . . . . . . A-4A.8 Value Engineering . . . . . . . . . . . . . . . . . . . . . . . . . . . . . . . . . . . . . . . . . . . . . . . . . A-5A.9 Systems Engineering . . . . . . . . . . . . . . . . . . . . . . . . . . . . . . . . . . . . . . . . . . . . . . . A-6A.10 Total Quality Management . . . . . . . . . . . . . . . . . . . . . . . . . . . . . . . . . . . . . . . . . . A-6A.11 Partnering . . . . . . . . . . . . . . . . . . . . . . . . . . . . . . . . . . . . . . . . . . . . . . . . . . . . . . . . A-7A.12 References . . . . . . . . . . . . . . . . . . . . . . . . . . . . . . . . . . . . . . . . . . . . . . . . . . . . . . . A-7
A.12.1 Data Quality Objectives . . . . . . . . . . . . . . . . . . . . . . . . . . . . . . . . . . . . . . . . . . A-7A.12.2 Observational Approach . . . . . . . . . . . . . . . . . . . . . . . . . . . . . . . . . . . . . . . . . A-9A.12.3 Streamlined Approach for Environmental Restoration (Safer) . . . . . . . . . . . A-10A.12.4 Technical Project Planning . . . . . . . . . . . . . . . . . . . . . . . . . . . . . . . . . . . . . . A-11A.12.5 Expedited Site Characterization . . . . . . . . . . . . . . . . . . . . . . . . . . . . . . . . . . . A-11A.12.6 Value Engineering . . . . . . . . . . . . . . . . . . . . . . . . . . . . . . . . . . . . . . . . . . . . . A-12A.12.7 Systems Engineering . . . . . . . . . . . . . . . . . . . . . . . . . . . . . . . . . . . . . . . . . . . A-13A.12.8 Total Quality Management . . . . . . . . . . . . . . . . . . . . . . . . . . . . . . . . . . . . . . A-15A.12.9 Partnering . . . . . . . . . . . . . . . . . . . . . . . . . . . . . . . . . . . . . . . . . . . . . . . . . . . . A-16
Appendix B The Data Quality Objectives Process . . . . . . . . . . . . . . . . . . . . . . . . . . . . . . . . . . B-1B.1Introduction . . . . . . . . . . . . . . . . . . . . . . . . . . . . . . . . . . . . . . . . . . . . . . . . . . . . . . . . . . B-1B.2Overview of the DQO Process . . . . . . . . . . . . . . . . . . . . . . . . . . . . . . . . . . . . . . . . . . . . B-2B.3The Seven Steps of the DQO Process . . . . . . . . . . . . . . . . . . . . . . . . . . . . . . . . . . . . . . B-3
B.3.1 DQO Process Step 1: State the Problem . . . . . . . . . . . . . . . . . . . . . . . . . . . . . . B-3B.3.2 DQO Process Step 2: Identify the Decision . . . . . . . . . . . . . . . . . . . . . . . . . . . . B-4B.3.3 DQO Process Step 3: Identify Inputs to the Decision . . . . . . . . . . . . . . . . . . . . B-5B.3.4 DQO Process Step 4: Define the Study Boundaries . . . . . . . . . . . . . . . . . . . . . B-6B.3.5 Outputs of DQO Process Steps 1 through 4 Lead Into Steps 5 through 7 . . . . . B-7B.3.6 DQO Process Step 5: Develop a Decision Rule . . . . . . . . . . . . . . . . . . . . . . . . B-7B.3.7 DQO Process Step 6: Specify the Limits on Decision Errors . . . . . . . . . . . . . . B-9B.3.8 DQO Process Step 7: Optimize the Design for Obtaining Data . . . . . . . . . . . B-22
B.4References . . . . . . . . . . . . . . . . . . . . . . . . . . . . . . . . . . . . . . . . . . . . . . . . . . . . . . . . . . B-24Attachment B1: Decision Error Rates and the Gray Region for Decisions About
Mean Concentrations . . . . . . . . . . . . . . . . . . . . . . . . . . . . . . . . . . . . . . . . . . . . . . . . . . B-26

Contents
Page
XXXVIIJULY 2004 MARLAP
B1.1 Introduction . . . . . . . . . . . . . . . . . . . . . . . . . . . . . . . . . . . . . . . . . . . . . . . . . . . B-26B1.2 The Region of Interest . . . . . . . . . . . . . . . . . . . . . . . . . . . . . . . . . . . . . . . . . . . B-26B1.3 Measurement Uncertainty at the Action Level . . . . . . . . . . . . . . . . . . . . . . . . B-26B1.4 The Null Hypothesis . . . . . . . . . . . . . . . . . . . . . . . . . . . . . . . . . . . . . . . . . . . . B-29
Case 1: Assume the True Concentration is Over 1.0 . . . . . . . . . . . . . . . . . . . . . . . B-30Case 2: Assume the True Concentration is 0.9 . . . . . . . . . . . . . . . . . . . . . . . . . . . B-32
B1.5 The Gray Region . . . . . . . . . . . . . . . . . . . . . . . . . . . . . . . . . . . . . . . . . . . . . . . B-32B1.6 Summary . . . . . . . . . . . . . . . . . . . . . . . . . . . . . . . . . . . . . . . . . . . . . . . . . . . . . B-34
Attachment B2: Decision Error Rates and the Gray Region for Detection Decisions . . . . B-36B2.1 Introduction . . . . . . . . . . . . . . . . . . . . . . . . . . . . . . . . . . . . . . . . . . . . . . . . . . . B-36B2.2 The DQO Process Applied to the Detection Limit Problem . . . . . . . . . . . . . . B-36B2.3 Establish the Concentration Range of Interest . . . . . . . . . . . . . . . . . . . . . . . . . B-37B2.4 Estimate the Measurement Variability when Measuring a Blank . . . . . . . . . . B-41
Appendix C Measurement Quality Objectives for Method Uncertainty and Detection andQuantification Capability . . . . . . . . . . . . . . . . . . . . . . . . . . . . . . . . . . . . . . . . . . . . . . . . . . . C-1C.1Introduction . . . . . . . . . . . . . . . . . . . . . . . . . . . . . . . . . . . . . . . . . . . . . . . . . . . . . . . . . . C-1C.2Hypothesis Testing . . . . . . . . . . . . . . . . . . . . . . . . . . . . . . . . . . . . . . . . . . . . . . . . . . . . . C-1C.3Development of MQOs for Analytical Protocol Selection . . . . . . . . . . . . . . . . . . . . . . C-3C.4The Role of the MQO for Method Uncertainty in Data Evaluation . . . . . . . . . . . . . . . C-9
C.4.1 Uncertainty Requirements at Various Concentrations . . . . . . . . . . . . . . . . . . . . C-9C.4.2 Acceptance Criteria for Quality Control Samples . . . . . . . . . . . . . . . . . . . . . . . C-11
C.5References . . . . . . . . . . . . . . . . . . . . . . . . . . . . . . . . . . . . . . . . . . . . . . . . . . . . . . . . . . C-17
Appendix D Content of Project Plan Documents . . . . . . . . . . . . . . . . . . . . . . . . . . . . . . . . . . D-1D.1Introduction . . . . . . . . . . . . . . . . . . . . . . . . . . . . . . . . . . . . . . . . . . . . . . . . . . . . . . . . . D-1D.2Group A: Project Management . . . . . . . . . . . . . . . . . . . . . . . . . . . . . . . . . . . . . . . . . . D-5
D.2.1 Project Management (A1): Title and Approval Sheet . . . . . . . . . . . . . . . . . . . D-5D.2.2 Project Management (A2): Table of Contents . . . . . . . . . . . . . . . . . . . . . . . . . D-7D.2.3 Project Management (A3): Distribution List . . . . . . . . . . . . . . . . . . . . . . . . . D-7D.2.4 Project Management (A4): Project/Task Organization . . . . . . . . . . . . . . . . . . D-7D.2.5 Project Management (A5): Problem Definition/Background . . . . . . . . . . . . . D-8D.2.6 Project Management (A6): Project/Task Description . . . . . . . . . . . . . . . . . . . D-9D.2.7 Project Management (A7): Quality Objectives and Criteria for Measurement
Data . . . . . . . . . . . . . . . . . . . . . . . . . . . . . . . . . . . . . . . . . . . . . . . . . . . . . . . . . . . D-11D.2.7.1 Project�s Quality Objectives . . . . . . . . . . . . . . . . . . . . . . . . . . . . . . . D-11D.2.7.2 Specifying Measurement Quality Objectives . . . . . . . . . . . . . . . . . . . D-12D.2.7.3 Relation between the Project DQOs, MQOs, and QC Requirements D-13
D.2.8 Project Management (A8): Special Training Requirements/Certification . . . D-13D.2.9 Project Management (A9): Documentation and Record . . . . . . . . . . . . . . . . D-13

Contents
Page
XXXVIIIMARLAP JULY 2004
D.3Group B: Measurement/Data Acquisition . . . . . . . . . . . . . . . . . . . . . . . . . . . . . . . . . D-14D.3.1 Measurement/Data Acquisition (B1): Sampling Process Design . . . . . . . . . D-15D.3.2 Measurement/Data Acquisition (B2): Sampling Methods Requirements . . . D-16D.3.3 Measurement/Data Acquisition (B3): Sample Handling and Custody
Requirements . . . . . . . . . . . . . . . . . . . . . . . . . . . . . . . . . . . . . . . . . . . . . . . . . . . . D-18D.3.4 Measurement/Data Acquisition (B4): Analytical Methods Requirements . . D-19D.3.5 Measurement/Data Acquisition (B5): Quality Control Requirements . . . . . D-21D.3.6 Measurement/Data Acquisition (B6): Instrument/Equipment Testing, Inspection,
and Maintenance Requirements . . . . . . . . . . . . . . . . . . . . . . . . . . . . . . . . . . D-22D.3.7 Measurement/Data Acquisition (B7): Instrument Calibration and Frequency D-23D.3.8 Measurement/Data Acquisition (B8): Inspection/Acceptance Requirements for
Supplies and Consumables . . . . . . . . . . . . . . . . . . . . . . . . . . . . . . . . . . . . . . D-23D.3.9 Measurement/Data Acquisition (B9): Data Acquisition Requirements for Non-
Direct Measurement Data . . . . . . . . . . . . . . . . . . . . . . . . . . . . . . . . . . . . . . . D-24D.3.10 Measurement/Data Acquisition (B10): Data Management . . . . . . . . . . . . . . D-25
D.4Group C: Assessment/Oversight . . . . . . . . . . . . . . . . . . . . . . . . . . . . . . . . . . . . . . . . D-26D.4.1 Assessment/Oversight (C1): Assessment and Response Actions . . . . . . . . . D-26D.4.2 Assessment/Oversight (C2): Reports to Management . . . . . . . . . . . . . . . . . D-27
D.5Group D: Data Validation and Usability . . . . . . . . . . . . . . . . . . . . . . . . . . . . . . . . . . D-28D.5.1 Data Validation and Usability (D1): Verification and Validation
Requirements . . . . . . . . . . . . . . . . . . . . . . . . . . . . . . . . . . . . . . . . . . . . . . . . . . . . D-28D.5.2 Data Validation and Usability (D2): Verification and Validation Methods . D-29
D.5.2.1 Data Verification . . . . . . . . . . . . . . . . . . . . . . . . . . . . . . . . . . . . . . . . D-29D.5.2.2 Data Validation . . . . . . . . . . . . . . . . . . . . . . . . . . . . . . . . . . . . . . . . . D-30
D.5.3 Data Validation and Usability (D3): Reconciliation with Data Quality Objectives . . . . . . . . . . . . . . . . . . . . . . . . . . . . . . . . . . . . . . . . . . . . . . . . . . . . . . D-30
D.6References . . . . . . . . . . . . . . . . . . . . . . . . . . . . . . . . . . . . . . . . . . . . . . . . . . . . . . . . . D-31
Appendix E Contracting Laboratory Services . . . . . . . . . . . . . . . . . . . . . . . . . . . . . . . . . . . . . E-1E.1 Introduction . . . . . . . . . . . . . . . . . . . . . . . . . . . . . . . . . . . . . . . . . . . . . . . . . . . . . . . . . . E-1E.2 Procurement of Services . . . . . . . . . . . . . . . . . . . . . . . . . . . . . . . . . . . . . . . . . . . . . . . . E-4
E.2.1 Request for Approval of Proposed Procurement Action . . . . . . . . . . . . . . . . . . E-5E.2.2 Types of Procurement Mechanisms . . . . . . . . . . . . . . . . . . . . . . . . . . . . . . . . . . E-6
E.3 Request for Proposals�The Solicitation . . . . . . . . . . . . . . . . . . . . . . . . . . . . . . . . . . . E-7E.3.1 Market Research . . . . . . . . . . . . . . . . . . . . . . . . . . . . . . . . . . . . . . . . . . . . . . . . E-8E.3.2 Period of Contract . . . . . . . . . . . . . . . . . . . . . . . . . . . . . . . . . . . . . . . . . . . . . . . E-9E.3.3 Subcontracts . . . . . . . . . . . . . . . . . . . . . . . . . . . . . . . . . . . . . . . . . . . . . . . . . . . . E-9
E.4 Proposal Requirements . . . . . . . . . . . . . . . . . . . . . . . . . . . . . . . . . . . . . . . . . . . . . . . . E-10E.4.1 RFP and Contract Information . . . . . . . . . . . . . . . . . . . . . . . . . . . . . . . . . . . . . E-11E.4.2 Personnel . . . . . . . . . . . . . . . . . . . . . . . . . . . . . . . . . . . . . . . . . . . . . . . . . . . . . E-13
Contents
Page
XXXIXJULY 2004 MARLAP
E.4.3 Instrumentation . . . . . . . . . . . . . . . . . . . . . . . . . . . . . . . . . . . . . . . . . . . . . . . . E-15E.4.3.1 Type, Number, and Age of Laboratory Instruments . . . . . . . . . . . . . . E-16E.4.3.2 Service Contract . . . . . . . . . . . . . . . . . . . . . . . . . . . . . . . . . . . . . . . . . . E-16
E.4.4 Narrative to Approach . . . . . . . . . . . . . . . . . . . . . . . . . . . . . . . . . . . . . . . . . . . E-16E.4.4.1 Analytical Methods or Protocols . . . . . . . . . . . . . . . . . . . . . . . . . . . . . E-16E.4.4.2 Meeting Contract Measurement Quality Objectives . . . . . . . . . . . . . . E-17E.4.4.3 Data Package . . . . . . . . . . . . . . . . . . . . . . . . . . . . . . . . . . . . . . . . . . . . E-17E.4.4.4 Schedule . . . . . . . . . . . . . . . . . . . . . . . . . . . . . . . . . . . . . . . . . . . . . . . . E-17E.4.4.5 Sample Storage and Disposal . . . . . . . . . . . . . . . . . . . . . . . . . . . . . . . . E-18
E.4.5 Quality Manual . . . . . . . . . . . . . . . . . . . . . . . . . . . . . . . . . . . . . . . . . . . . . . . . E-18E.4.6 Licenses and Accreditations . . . . . . . . . . . . . . . . . . . . . . . . . . . . . . . . . . . . . . . E-19E.4.7 Experience . . . . . . . . . . . . . . . . . . . . . . . . . . . . . . . . . . . . . . . . . . . . . . . . . . . . E-20
E.4.7.1 Previous or Current Contracts . . . . . . . . . . . . . . . . . . . . . . . . . . . . . . . E-20E.4.7.2 Quality of Performance . . . . . . . . . . . . . . . . . . . . . . . . . . . . . . . . . . . . E-20
E.5 Proposal Evaluation and Scoring Procedures . . . . . . . . . . . . . . . . . . . . . . . . . . . . . . . E-21E.5.1 Evaluation Committee . . . . . . . . . . . . . . . . . . . . . . . . . . . . . . . . . . . . . . . . . . . E-21E.5.2 Ground Rules � Questions . . . . . . . . . . . . . . . . . . . . . . . . . . . . . . . . . . . . . . . E-22E.5.3 Scoring/Evaluating Scheme . . . . . . . . . . . . . . . . . . . . . . . . . . . . . . . . . . . . . . . E-22
E.5.3.1 Review of Technical Proposal and Quality Manual . . . . . . . . . . . . . . E-23E.5.3.2 Review of Laboratory Accreditation . . . . . . . . . . . . . . . . . . . . . . . . . . E-25E.5.3.3 Review of Experience . . . . . . . . . . . . . . . . . . . . . . . . . . . . . . . . . . . . . E-25
E.5.4 Pre-Award Proficiency Samples . . . . . . . . . . . . . . . . . . . . . . . . . . . . . . . . . . . E-25E.5.5 Pre-Award Audit . . . . . . . . . . . . . . . . . . . . . . . . . . . . . . . . . . . . . . . . . . . . . . . E-26E.5.6 Comparison of Prices . . . . . . . . . . . . . . . . . . . . . . . . . . . . . . . . . . . . . . . . . . . . E-30E.5.7 Debriefing of Unsuccessful Vendors . . . . . . . . . . . . . . . . . . . . . . . . . . . . . . . . E-30
E.6 The Award . . . . . . . . . . . . . . . . . . . . . . . . . . . . . . . . . . . . . . . . . . . . . . . . . . . . . . . . . . E-31E.7 For the Duration of the Contract . . . . . . . . . . . . . . . . . . . . . . . . . . . . . . . . . . . . . . . . . E-31
E.7.1 Managing a Contract . . . . . . . . . . . . . . . . . . . . . . . . . . . . . . . . . . . . . . . . . . . . E-32E.7.2 Responsibility of the Contractor . . . . . . . . . . . . . . . . . . . . . . . . . . . . . . . . . . . E-32E.7.3 Responsibility of the Agency . . . . . . . . . . . . . . . . . . . . . . . . . . . . . . . . . . . . . . E-32E.7.4 Anomalies and Nonconformance . . . . . . . . . . . . . . . . . . . . . . . . . . . . . . . . . . . E-33E.7.5 Laboratory Assessment . . . . . . . . . . . . . . . . . . . . . . . . . . . . . . . . . . . . . . . . . . E-33
E.7.5.1 Performance Testing and Quality Control Samples . . . . . . . . . . . . . . . E-33E.7.5.2 Laboratory Performance Evaluation Programs . . . . . . . . . . . . . . . . . . E-34E.7.5.3 Laboratory Evaluations Performed During the Contract Period . . . . . E-35
E.8 Contract Completion . . . . . . . . . . . . . . . . . . . . . . . . . . . . . . . . . . . . . . . . . . . . . . . . . . E-36E.9 References . . . . . . . . . . . . . . . . . . . . . . . . . . . . . . . . . . . . . . . . . . . . . . . . . . . . . . . . . . E-36

Contents
Page
XLMARLAP JULY 2004
Appendices � Volume II
Appendix F Laboratory Subsampling . . . . . . . . . . . . . . . . . . . . . . . . . . . . . . . . . . . . . . . . . . . . F-1F.1 Introduction . . . . . . . . . . . . . . . . . . . . . . . . . . . . . . . . . . . . . . . . . . . . . . . . . . . . . . . . . . F-1F.2 Basic Concepts . . . . . . . . . . . . . . . . . . . . . . . . . . . . . . . . . . . . . . . . . . . . . . . . . . . . . . . . F-2F.3 Sources of Measurement Error . . . . . . . . . . . . . . . . . . . . . . . . . . . . . . . . . . . . . . . . . . . F-3
F.3.1 Sampling Bias . . . . . . . . . . . . . . . . . . . . . . . . . . . . . . . . . . . . . . . . . . . . . . . . . . F-4F.3.2 Fundamental Error . . . . . . . . . . . . . . . . . . . . . . . . . . . . . . . . . . . . . . . . . . . . . . . F-5F.3.3 Grouping and Segregation Error . . . . . . . . . . . . . . . . . . . . . . . . . . . . . . . . . . . . F-6
F.4 Implementation of the Particulate Sampling Theory . . . . . . . . . . . . . . . . . . . . . . . . . . . F-9F.4.1 The Fundamental Variance . . . . . . . . . . . . . . . . . . . . . . . . . . . . . . . . . . . . . . . F-10F.4.2 Scenario 1 � Natural Radioactive Minerals . . . . . . . . . . . . . . . . . . . . . . . . . . . F-10F.4.3 Scenario 2 � Hot Particles . . . . . . . . . . . . . . . . . . . . . . . . . . . . . . . . . . . . . . . . F-11F.4.4 Scenario 3 � Particle Surface Contamination . . . . . . . . . . . . . . . . . . . . . . . . . F-13
F.5 Summary . . . . . . . . . . . . . . . . . . . . . . . . . . . . . . . . . . . . . . . . . . . . . . . . . . . . . . . . . . . F-15F.6 References . . . . . . . . . . . . . . . . . . . . . . . . . . . . . . . . . . . . . . . . . . . . . . . . . . . . . . . . . . F-16
Appendices � Volume III
G Statistical Tables . . . . . . . . . . . . . . . . . . . . . . . . . . . . . . . . . . . . . . . . . . . . . . . . . . . . . . . . G-1
Contents
Page
XLIJULY 2004 MARLAP
List of FiguresFigure 1.1 The data life cycle . . . . . . . . . . . . . . . . . . . . . . . . . . . . . . . . . . . . . . . . . . . . . . . . . . 1-4Figure 1.2 Typical components of an analytical process . . . . . . . . . . . . . . . . . . . . . . . . . . . . . 1-6Figure 1.3 The MARLAP process . . . . . . . . . . . . . . . . . . . . . . . . . . . . . . . . . . . . . . . . . . . . . 1-14Figure 1.4 Key MARLAP terms and processes . . . . . . . . . . . . . . . . . . . . . . . . . . . . . . . . . . . 1-15
Figure 3.1 Typical components of an analytical process . . . . . . . . . . . . . . . . . . . . . . . . . . . . . 3-2Figure 3.2 Analytical protocol specifications . . . . . . . . . . . . . . . . . . . . . . . . . . . . . . . . . . . . . 3-25Figure 3.3 Example analytical protocol specifications . . . . . . . . . . . . . . . . . . . . . . . . . . . . . . 3-26Figure 3B.1 The critical value of the net signal . . . . . . . . . . . . . . . . . . . . . . . . . . . . . . . . . . . 3-35
Figure 6.1 Analytical process . . . . . . . . . . . . . . . . . . . . . . . . . . . . . . . . . . . . . . . . . . . . . . . . . . 6-2Figure 6.2 Method application life cycle . . . . . . . . . . . . . . . . . . . . . . . . . . . . . . . . . . . . . . . . . 6-6Figure 6.3 Expanded Figure 6.2 addressing the laboratory�s method evaluation process . . . . 6-7Figure 6.4 Relationship between level of laboratory effort, method validation level, and degree
of assurance of method performance under the tiered approach to method validation . . . 6-27
Figure 7.1 Considerations for the initial evaluation of a laboratory . . . . . . . . . . . . . . . . . . . . 7-16
Figure 8.1 The assessment process . . . . . . . . . . . . . . . . . . . . . . . . . . . . . . . . . . . . . . . . . . . . . . 8-5
Figure 9.1 Using physical samples to measure a characteristic of the population representatively. . . . . . . . . . . . . . . . . . . . . . . . . . . . . . . . . . . . . . . . . . . . . . . . . . . . . . . . . . 9-10
Figure 9.2 Types of sampling and analytical errors. . . . . . . . . . . . . . . . . . . . . . . . . . . . . . . . . 9-17
Volume II
Figure 10.1 Example of chain-of-custody record . . . . . . . . . . . . . . . . . . . . . . . . . . . . . . . . . . 10-9
Figure 11.1 Overview of sample receipt, inspection, and tracking . . . . . . . . . . . . . . . . . . . . . 11-2
Figure 12.1 Degree of error in laboratory sample preparation relative to other activities . . . 12-1Figure 12.2 Laboratory sample preparation flowchart (for solid samples) . . . . . . . . . . . . . . 12-13
Figure 14.1 Ethylene diamine tetraacetic acid (EDTA) . . . . . . . . . . . . . . . . . . . . . . . . . . . . 14-20Figure 14.2 Crown ethers . . . . . . . . . . . . . . . . . . . . . . . . . . . . . . . . . . . . . . . . . . . . . . . . . . . 14-21Figure 14.3 The behavior of elements in concentrated hydrochloric acid on cation-exchange
resins . . . . . . . . . . . . . . . . . . . . . . . . . . . . . . . . . . . . . . . . . . . . . . . . . . . . . . . . . . . . . . . . 14-52

Contents
Page
XLIIMARLAP JULY 2004
Figure 14.4 The behavior of elements in concentrated hydrochloric acid on anion-exchange resins . . . . . . . . . . . . . . . . . . . . . . . . . . . . . . . . . . . . . . . . . . . . . . . . . . . . . . . . . . . . . . . . 14-53
Figure 14.5 The electrical double layer. . . . . . . . . . . . . . . . . . . . . . . . . . . . . . . . . . . . . . . . . 14-79Figure 14A.1 Decay chain for 238U . . . . . . . . . . . . . . . . . . . . . . . . . . . . . . . . . . . . . . . . . . 14-224Figure 14A.2 Secular equilibrium of 210Pb/210Bi . . . . . . . . . . . . . . . . . . . . . . . . . . . . . . . . . 14-225Figure 14A.3 Transient equilibrium of 95Zr/95Nb . . . . . . . . . . . . . . . . . . . . . . . . . . . . . . . . 14-226Figure 14A.4 No equilibrium of 239U/239Np . . . . . . . . . . . . . . . . . . . . . . . . . . . . . . . . . . . . 14-227
Figure 15.1 Alpha plateau generated by a 210Po source on a GP counter using P-10 gas . . . 15-23Figure 15.2 Gas proportional counter self-absorption curve for 230Th . . . . . . . . . . . . . . . . . 15-28Figure 15.3 Beta plateau generated by a 90Sr/Y source on a GP counter using P-10 gas . . . 15-52Figure 15.4 Gas proportional counter self-absorption curve for 90Sr/Y . . . . . . . . . . . . . . . . 15-56Figure 15.5 Representation of a beta emitter energy spectrum . . . . . . . . . . . . . . . . . . . . . . . 15-65Figure 15.6 Gamma-ray interactions with high-purity germanium . . . . . . . . . . . . . . . . . . . 15-70Figure 15.7 NaI(Tl) spectrum of 137Cs . . . . . . . . . . . . . . . . . . . . . . . . . . . . . . . . . . . . . . . . . 15-75Figure 15.8 Energy spectrum of 22Na . . . . . . . . . . . . . . . . . . . . . . . . . . . . . . . . . . . . . . . . . . 15-80Figure 15.9 Different geometries for the same germanium detector and the same sample in
different shapes or position . . . . . . . . . . . . . . . . . . . . . . . . . . . . . . . . . . . . . . . . . . . . . . . 15-83Figure 15.10 Extended range coaxial germanium detector . . . . . . . . . . . . . . . . . . . . . . . . . . 15-88Figure 15.11 Typical detection efficiencies comparing extended range with a normal coaxial
germanium detector . . . . . . . . . . . . . . . . . . . . . . . . . . . . . . . . . . . . . . . . . . . . . . . . . . . . . 15-90Figure 15.12 Beta-gamma coincidence efficiency curve for 131I . . . . . . . . . . . . . . . . . . . . . . 15-93
Figure 16.1 Gamma-ray spectrum . . . . . . . . . . . . . . . . . . . . . . . . . . . . . . . . . . . . . . . . . . . . . . 16-9Figure 16.2 Gamma-ray analysis flow chart and input parameters . . . . . . . . . . . . . . . . . . . . 16-11Figure 16.3 Low-energy tailing . . . . . . . . . . . . . . . . . . . . . . . . . . . . . . . . . . . . . . . . . . . . . . . 16-16Figure 16.4 Photopeak baseline continuum . . . . . . . . . . . . . . . . . . . . . . . . . . . . . . . . . . . . . 16-17Figure 16.5 Photopeak baseline continuum-step function . . . . . . . . . . . . . . . . . . . . . . . . . . 16-18Figure 16.6 Alpha spectrum (238U, 235U, 234U, 239/240Pu, 241Am) . . . . . . . . . . . . . . . . . . . . . . . 16-23
Volume III
Figure 18.1 Problems leading to loss of analytical control . . . . . . . . . . . . . . . . . . . . . . . . . . . 18-4Figure 18.2 Control chart for daily counting of a standard reference source, with limits corrected
for decay . . . . . . . . . . . . . . . . . . . . . . . . . . . . . . . . . . . . . . . . . . . . . . . . . . . . . . . . . . . . . . . 18-7Figure 18.3 Three general categories of blank changes . . . . . . . . . . . . . . . . . . . . . . . . . . . . 18-12Figure 18.4 Failed performance indicator: replicates . . . . . . . . . . . . . . . . . . . . . . . . . . . . . . 18-15Figure 18.5 Failed performance indicator: chemical yield . . . . . . . . . . . . . . . . . . . . . . . . . . 18-23
Figure 19.1 Addition of uncertainty components . . . . . . . . . . . . . . . . . . . . . . . . . . . . . . . . . 19-25

Contents
Page
XLIIIJULY 2004 MARLAP
Figure 19.2 Expected fraction of atoms remaining at time t . . . . . . . . . . . . . . . . . . . . . . . . . 19-35Figure 19.3 A symmetric distribution . . . . . . . . . . . . . . . . . . . . . . . . . . . . . . . . . . . . . . . . . . 19-64Figure 19.4 An asymmetric distribution . . . . . . . . . . . . . . . . . . . . . . . . . . . . . . . . . . . . . . . . 19-65Figure 19.5 A normal distribution . . . . . . . . . . . . . . . . . . . . . . . . . . . . . . . . . . . . . . . . . . . . 19-67Figure 19.6 A log-normal distribution . . . . . . . . . . . . . . . . . . . . . . . . . . . . . . . . . . . . . . . . . 19-68Figure 19.7 Chi-squared distributions . . . . . . . . . . . . . . . . . . . . . . . . . . . . . . . . . . . . . . . . . . 19-69Figure 19.8 The t-distribution with 3 degrees of freedom . . . . . . . . . . . . . . . . . . . . . . . . . . 19-70Figure 19.9 A rectangular distribution . . . . . . . . . . . . . . . . . . . . . . . . . . . . . . . . . . . . . . . . . 19-72Figure 19.10 A trapezoidal distribution . . . . . . . . . . . . . . . . . . . . . . . . . . . . . . . . . . . . . . . . 19-72Figure 19.11 An exponential distribution . . . . . . . . . . . . . . . . . . . . . . . . . . . . . . . . . . . . . . . 19-73Figure 19.12a Poisson distribution vs. normal distribution, µ = 3 . . . . . . . . . . . . . . . . . . . . 19-75Figure 19.12b Poisson distribution vs. normal distribution, µ = 100 . . . . . . . . . . . . . . . . . . 19-76Figure 19.13 Nonlinear balance response curve . . . . . . . . . . . . . . . . . . . . . . . . . . . . . . . . . 19-98
Figure 20.1 The critical net signal, SC, and minimum detectable net signal, SD . . . . . . . . . . . 20-6Figure 20.2 Type I error rates for Table 20.1 . . . . . . . . . . . . . . . . . . . . . . . . . . . . . . . . . . . . 20-41Figure 20.3 Type I error rate for the Poisson-normal approximation (tB = tS) . . . . . . . . . . . 20-42Figure 20.4 Type I error rates for Formula A . . . . . . . . . . . . . . . . . . . . . . . . . . . . . . . . . . . . 20-44Figure 20.5 Type I error rates for Formula B . . . . . . . . . . . . . . . . . . . . . . . . . . . . . . . . . . . . 20-45Figure 20.6 Type I error rates for Formula C . . . . . . . . . . . . . . . . . . . . . . . . . . . . . . . . . . . . 20-46Figure 20.7 Type I error rates for the Stapleton approximation . . . . . . . . . . . . . . . . . . . . . . 20-48Figure 20.8 Type I error rates for the nonrandomized exact test . . . . . . . . . . . . . . . . . . . . . 20-49
Figure B.1 Seven steps of the DQO process. . . . . . . . . . . . . . . . . . . . . . . . . . . . . . . . . . . . . . . B-2Figure B.2(a) Decision performance goal diagram null hypothesis: the parameter exceeds the
action level. . . . . . . . . . . . . . . . . . . . . . . . . . . . . . . . . . . . . . . . . . . . . . . . . . . . . . . . . . . . . B-11Figure B.2(b) Decision performance goal diagram null hypothesis: the parameter is less than the
action level. . . . . . . . . . . . . . . . . . . . . . . . . . . . . . . . . . . . . . . . . . . . . . . . . . . . . . . . . . . . . B-11Figure B.3 Plot is made showing the range of the parameter of interest on the x-axis . . . . . . B-15Figure B.4 A line showing the action level, the type of decision error possible at a given value of
the true concentration, and a y-axis showing the acceptable limits on making a decision errorhave been added to Figure B.3. . . . . . . . . . . . . . . . . . . . . . . . . . . . . . . . . . . . . . . . . . . . . . B-16
Figure B.5 The gray region is a specified range of values of the true concentration where theconsequences of a decision error are considered to be relatively minor . . . . . . . . . . . . . . B-17
Figure B.6 Three possible ways of setting the gray region. . . . . . . . . . . . . . . . . . . . . . . . . . . B-17Figure B.7 Example decision performance goal diagram . . . . . . . . . . . . . . . . . . . . . . . . . . . B-19Figure B.8 A power curve constructed from the decision performance goal diagram in Figure
B.7. . . . . . . . . . . . . . . . . . . . . . . . . . . . . . . . . . . . . . . . . . . . . . . . . . . . . . . . . . . . . . . . . . . B-20Figure B.9 Example power curve showing the key parameters used to determine the appropriate
number of samples to take in the survey unit. . . . . . . . . . . . . . . . . . . . . . . . . . . . . . . . . . . B-21
Contents
Page
XLIVMARLAP JULY 2004
Figure B.10 How proximity to the action level determines what is an acceptable level ofuncertainty . . . . . . . . . . . . . . . . . . . . . . . . . . . . . . . . . . . . . . . . . . . . . . . . . . . . . . . . . . . . . B-24
Figure B1.1 The action level is 1.0 . . . . . . . . . . . . . . . . . . . . . . . . . . . . . . . . . . . . . . . . . . . . . B-26Figure B1.2 The true mean concentration is 1.0. . . . . . . . . . . . . . . . . . . . . . . . . . . . . . . . . . . B-27Figure B1.3 The true mean concentration is 0.9. . . . . . . . . . . . . . . . . . . . . . . . . . . . . . . . . . . B-28Figure B1.4 If 0.95 is measured, is the true mean concentration 1.0 (right) or 0.9 (left)? . . . B-28Figure B1.5 When the true mean concentration is 1.0, and the standard uncertainty of the
distribution of measured concentrations is 0.1, a measured concentration of 0.84 or less willbe observed only about 5 percent of the time . . . . . . . . . . . . . . . . . . . . . . . . . . . . . . . . . . B-30
Figure B1.6 When the true mean concentration is 0.84, and the standard uncertainty of thedistribution of measured concentrations is 0.1, a measured concentration of 0.84 or less willbe observed only about half the time . . . . . . . . . . . . . . . . . . . . . . . . . . . . . . . . . . . . . . . . . B-31
Figure B1.7 When the true mean concentration is 0.68 and the standard uncertainty of thedistribution of measured concentrations is 0.1, a measured concentration over 0.84 will beobserved only about 5 percent of the time . . . . . . . . . . . . . . . . . . . . . . . . . . . . . . . . . . . . . B-31
Figure B1.8 The true mean concentration is 0.9 (left) and 1.22 (right). . . . . . . . . . . . . . . . . . B-32Figure B1.9 The true mean concentration is 0.84 (left) and 1.0 (right) . . . . . . . . . . . . . . . . . B-34Figure B2.1 Region of interest for the concentration around the action level of 1.0 . . . . . . . B-38Figure B2.2 (a) The distribution of blank (background) readings. (b) The true concentration is
0.0. The standard deviation of the distribution of measured concentrations is 0.2. . . . . . B-38Figure B2.3 The true concentration is 0.0, and the standard deviation of the distribution of
measured concentrations is 0.2 . . . . . . . . . . . . . . . . . . . . . . . . . . . . . . . . . . . . . . . . . . . . . B-39Figure B2.4 The true concentration is 0.2 and the standard deviation of the distribution of
measured concentrations is 0.2 . . . . . . . . . . . . . . . . . . . . . . . . . . . . . . . . . . . . . . . . . . . . . B-39Figure B2.5 The true value of the concentration is 0.66 and the standard deviation of the
distribution of measured concentrations is 0.2 . . . . . . . . . . . . . . . . . . . . . . . . . . . . . . . . . B-41Figure B2.6 The true value of the measured concentration is 0.0 and the standard deviation of
the measured concentrations is 0.2. . . . . . . . . . . . . . . . . . . . . . . . . . . . . . . . . . . . . . . . . . . B-41Figure B2.7 The standard deviation of the normally distributed measured concentrations
is 0.2. . . . . . . . . . . . . . . . . . . . . . . . . . . . . . . . . . . . . . . . . . . . . . . . . . . . . . . . . . . . . . . . . . B-42
Figure C.1 Required analytical standard deviation (uReq) . . . . . . . . . . . . . . . . . . . . . . . . . . . . C-10
Figure E.1 General sequence initiating and later conducting work with a contract laboratory E-4

Contents
Page
XLVJULY 2004 MARLAP
List of TablesTable 2.1 � Summary of the directed planning process and radioanalytical specialists
participation . . . . . . . . . . . . . . . . . . . . . . . . . . . . . . . . . . . . . . . . . . . . . . . . . . . . . . . . . . . . . 2-9
Table 3.1 Common matrix-specific analytical planning issues . . . . . . . . . . . . . . . . . . . . . . . 3-20
Table 4.1 Elements of project plan documents . . . . . . . . . . . . . . . . . . . . . . . . . . . . . . . . . . . . . 4-7Table 4.2 Crosswalk between project plan document elements and directed planning
process . . . . . . . . . . . . . . . . . . . . . . . . . . . . . . . . . . . . . . . . . . . . . . . . . . . . . . . . . . . . . . . . 4-10
Table 6.1 Tiered project method validation approach . . . . . . . . . . . . . . . . . . . . . . . . . . . . . . 6-26
Table 7.1 Cross reference of information available for method evaluation . . . . . . . . . . . . . . . 7-3
Table 9.1 Summary of the DQA process . . . . . . . . . . . . . . . . . . . . . . . . . . . . . . . . . . . . . . . . . 9-6
Volume II
Table 10.1 Summary of sample preservation techniques . . . . . . . . . . . . . . . . . . . . . . . . . . . 10-25
Table 11.1 Typical topics addressed in standard operating procedures related to sample receipt,inspection, and tracking . . . . . . . . . . . . . . . . . . . . . . . . . . . . . . . . . . . . . . . . . . . . . . . . . . . 11-3
Table 12.1 Examples of volatile radionuclides . . . . . . . . . . . . . . . . . . . . . . . . . . . . . . . . . . . . 12-4Table 12.2 Properties of sample container materials . . . . . . . . . . . . . . . . . . . . . . . . . . . . . . . 12-5Table 12.3 Examples of dry-ashing temperatures (platinum container) . . . . . . . . . . . . . . . . 12-23Table 12.4 Preliminary ashing temperature for food samples . . . . . . . . . . . . . . . . . . . . . . . 12-29
Table 13.1 Common fusion fluxes . . . . . . . . . . . . . . . . . . . . . . . . . . . . . . . . . . . . . . . . . . . . . 13-7Table 13.2 Examples of acids used for wet ashing . . . . . . . . . . . . . . . . . . . . . . . . . . . . . . . . 13-13Table 13.3 Standard reduction potentials of selected half-reactions at 25 EC . . . . . . . . . . . 13-14
Table 14.1 Oxidation states of elements . . . . . . . . . . . . . . . . . . . . . . . . . . . . . . . . . . . . . . . . . 14-8Table 14.2 Oxidation states of selected elements . . . . . . . . . . . . . . . . . . . . . . . . . . . . . . . . . 14-10Table 14.3 Redox reagents for radionuclides . . . . . . . . . . . . . . . . . . . . . . . . . . . . . . . . . . . . 14-13Table 14.4 Common ligands . . . . . . . . . . . . . . . . . . . . . . . . . . . . . . . . . . . . . . . . . . . . . . . . . 14-19Table 14.5 Radioanalytical methods employing solvent extraction . . . . . . . . . . . . . . . . . . . 14-32
Contents
Page
XLVIMARLAP JULY 2004
Table 14.6 Radioanalytical methods employing extraction chromatography . . . . . . . . . . . . 14-33Table 14.7 Elements separable by volatilization as certain species . . . . . . . . . . . . . . . . . . . 14-37Table 14.8 Typical functional groups of ion-exchange resins . . . . . . . . . . . . . . . . . . . . . . . 14-49Table 14.9 Common ion-exchange resins . . . . . . . . . . . . . . . . . . . . . . . . . . . . . . . . . . . . . . . 14-50Table 14.10 General solubility behavior of some cations of interest . . . . . . . . . . . . . . . . . . 14-58Table 14.11 Summary of methods for utilizing precipitation from homogeneous solution . 14-68Table 14.12 Influence of precipitation conditions on the purity of precipitates . . . . . . . . . . 14-69Table 14.13 Common coprecipitating agents for radionuclides . . . . . . . . . . . . . . . . . . . . . . 14-76Table 14.14 Coprecipitation behavior of plutonium and neptunium . . . . . . . . . . . . . . . . . . 14-78Table 14.15 Atoms and mass of select radionuclides equivalent to 500 dpm . . . . . . . . . . . 14-83Table 14.16 Masking agents for ions of various metals . . . . . . . . . . . . . . . . . . . . . . . . . . . 14-106Table 14.17 Masking agents for anions and neutral molecules . . . . . . . . . . . . . . . . . . . . . 14-108Table 14.18 Common radiochemical oxidizing and reducing agents for iodine . . . . . . . . 14-129Table 14.19 Redox agents in plutonium chemistry . . . . . . . . . . . . . . . . . . . . . . . . . . . . . . . 14-142Table 14A.1 Relationships of radioactive equilibria . . . . . . . . . . . . . . . . . . . . . . . . . . . . . 14-228
Table 15.1 Radionuclides prepared by coprecipitation or precipitation . . . . . . . . . . . . . . . . 15-12Table 15.2 Nuclides for alpha calibration . . . . . . . . . . . . . . . . . . . . . . . . . . . . . . . . . . . . . . . 15-20Table 15.3 Typical gas operational parameters for gas proportional alpha counting . . . . . . 15-22Table 15.4 Nuclides for beta calibration . . . . . . . . . . . . . . . . . . . . . . . . . . . . . . . . . . . . . . . . 15-48Table 15.5 Typical operational parameters for gas proportional beta counting . . . . . . . . . . 15-50Table 15.6 Typical FWHM values as a function of energy . . . . . . . . . . . . . . . . . . . . . . . . . 15-79Table 15.7 Typical percent gamma-ray efficiencies for a 55 percent HPGe detector with various
counting geometries . . . . . . . . . . . . . . . . . . . . . . . . . . . . . . . . . . . . . . . . . . . . . . . . . . . . . 15-83Table 15.8 AMS detection limits for selected radionuclides . . . . . . . . . . . . . . . . . . . . . . . 15-100
Table 16.1 Units for data reporting . . . . . . . . . . . . . . . . . . . . . . . . . . . . . . . . . . . . . . . . . . . . 16-39Table 16.2 Example elements of a radiochemistry data package . . . . . . . . . . . . . . . . . . . . . 16-40
Table 17.1 Examples of laboratory-generated wastes . . . . . . . . . . . . . . . . . . . . . . . . . . . . . . . 17-2
Volume III
Table 18.1a Certified Massic activities for natural radionuclides with a normal distribution ofmeasurement results . . . . . . . . . . . . . . . . . . . . . . . . . . . . . . . . . . . . . . . . . . . . . . . . . . . . . 18-20
Table 18.1b Certified Massic activities for anthropogenic radionuclides with a Weibulldistribution of measurement results . . . . . . . . . . . . . . . . . . . . . . . . . . . . . . . . . . . . . . . . . 18-20
Table 18.1c Uncertified Massic activities . . . . . . . . . . . . . . . . . . . . . . . . . . . . . . . . . . . . . . . 18-20Table 18.2 Instrument background evaluation . . . . . . . . . . . . . . . . . . . . . . . . . . . . . . . . . . . 18-26Table 18.3 Root-cause analysis of performance check results for spectrometry systems . . . 18-35

Contents
Page
XLVIIJULY 2004 MARLAP
Table 18.4 Some causes of excursions in liquid scintillation analysis . . . . . . . . . . . . . . . . . 18-40Table 18.5 Example gas proportional instrument calibration, background frequency, and
performance criteria . . . . . . . . . . . . . . . . . . . . . . . . . . . . . . . . . . . . . . . . . . . . . . . . . . . . . 18-44Table 18.6 Example gamma spectrometry instrument calibration, background frequency, and
performance criteria . . . . . . . . . . . . . . . . . . . . . . . . . . . . . . . . . . . . . . . . . . . . . . . . . . . . . 18-48Table 18.7 Example alpha spectrometry instrument calibration, background frequency, and
performance criteria . . . . . . . . . . . . . . . . . . . . . . . . . . . . . . . . . . . . . . . . . . . . . . . . . . . . . 18-50Table 18.8 Example liquid scintillation counting systems calibration, background frequency, and
performance criteria . . . . . . . . . . . . . . . . . . . . . . . . . . . . . . . . . . . . . . . . . . . . . . . . . . . . . 18-53Table 18A.1 Bias-correction factor for the experimental standard deviation . . . . . . . . . . . . 18-70
Table 19.1 Differentiation rules . . . . . . . . . . . . . . . . . . . . . . . . . . . . . . . . . . . . . . . . . . . . . . 19-21Table 19.2 Applications of the first-order uncertainty propagation formula . . . . . . . . . . . . 19-21Table 19.3 95 % confidence interval for a Poisson mean . . . . . . . . . . . . . . . . . . . . . . . . . . . 19-75Table 19.4 Input estimates and standard uncertainties . . . . . . . . . . . . . . . . . . . . . . . . . . . . . 19-81Table 19.5 Coefficients of cubical expansion . . . . . . . . . . . . . . . . . . . . . . . . . . . . . . . . . . . 19-107Table 19.6 Density of air-free water . . . . . . . . . . . . . . . . . . . . . . . . . . . . . . . . . . . . . . . . . . 19-109
Table 20.1 Critical gross count (well-known blank) . . . . . . . . . . . . . . . . . . . . . . . . . . . . . . . 20-40Table 20.2 Bias factor for the experimental standard deviation . . . . . . . . . . . . . . . . . . . . . . 20-55Table 20.3 Estimated and true values of SD (tB = tS) . . . . . . . . . . . . . . . . . . . . . . . . . . . . . . 20-62
Table B.1 Possible decision errors . . . . . . . . . . . . . . . . . . . . . . . . . . . . . . . . . . . . . . . . . . . . . B-12Table B.2 Example of possible decision errors with null hypothesis that the average
concentration in a survey unit is above the action level . . . . . . . . . . . . . . . . . . . . . . . . . . . B-15Table B.3 Example decision error limits table . . . . . . . . . . . . . . . . . . . . . . . . . . . . . . . . . . . . B-19
Table D.1 QAPP groups and elements . . . . . . . . . . . . . . . . . . . . . . . . . . . . . . . . . . . . . . . . . . D-2Table D.2 Comparison of project plan contents . . . . . . . . . . . . . . . . . . . . . . . . . . . . . . . . . . . D-3Table D.3 Content of the three elements that constitute the project description . . . . . . . . . . D-8
Table E.1 Examples of procurement options to obtain materials or services . . . . . . . . . . . . . . E-6Table E.2 SOW checklists for the agency and proposer . . . . . . . . . . . . . . . . . . . . . . . . . . . . . E-12Table E.3 Laboratory technical supervisory personnel listed by position title and examples for
suggested minimum qualifications . . . . . . . . . . . . . . . . . . . . . . . . . . . . . . . . . . . . . . . . . . E-14Table E.4 Laboratory technical personnel listed by position title and examples for suggested
minimum qualifications and examples of optional staff members . . . . . . . . . . . . . . . . . . E-14Table E.5 Laboratory technical personnel listed by position title and examples for suggested
minimum qualifications . . . . . . . . . . . . . . . . . . . . . . . . . . . . . . . . . . . . . . . . . . . . . . . . . . . E-15Table E.6 Example of a proposal evaluation plan . . . . . . . . . . . . . . . . . . . . . . . . . . . . . . . . . E-23

Contents
Page
XLVIIIMARLAP JULY 2004
Table G.1 Quantiles of the standard normal distribution . . . . . . . . . . . . . . . . . . . . . . . . . . . . G-1Table G.2 Quantiles of Student�s t distribution . . . . . . . . . . . . . . . . . . . . . . . . . . . . . . . . . . . G-3Table G.3 Quantiles of chi-square . . . . . . . . . . . . . . . . . . . . . . . . . . . . . . . . . . . . . . . . . . . . . G-5Table G.4 Critical values for the nonrandomized exact test . . . . . . . . . . . . . . . . . . . . . . . . . . G-7Table G.5 Summary of probability distributions . . . . . . . . . . . . . . . . . . . . . . . . . . . . . . . . . G-11
XLIXJULY 2004 MARLAP
ACRONYMS AND ABBREVIATIONS
AC . . . . . . . . . alternating currentADC . . . . . . . . analog to digital convertor AEA . . . . . . . . Atomic Energy Act AL . . . . . . . . . action levelAMS . . . . . . . . accelerator mass spectrometryANSI . . . . . . . American National Standards InstituteAOAC . . . . . . Association of Official Analytical ChemistsAPHA . . . . . . . American Public Health AssociationAPS . . . . . . . . analytical protocol specificationARAR . . . . . . applicable or relevant and appropriate requirement (CERCLA/Superfund)ASL . . . . . . . . analytical support laboratoryASQC . . . . . . . American Society for Quality ControlASTM . . . . . . American Society for Testing and MaterialsATD . . . . . . . . alpha track detector
BGO . . . . . . . . bismuth germanate [detector]BNL . . . . . . . . Brookhaven National Laboratory (DOE)BOA . . . . . . . . basic ordering agreement
CAA . . . . . . . . Clean Air ActCC . . . . . . . . . charcoal canistersCEDE . . . . . . . committed effective dose equivalentCERCLA . . . . Comprehensive Environmental Response, Compensation, and Liability Act of
1980 (�Superfund�)c.f. . . . . . . . . . carrier free [tracer]cfm . . . . . . . . . cubic feet per minuteCFR . . . . . . . . Code of Federal RegulationsCL . . . . . . . . . central line (of a control chart)CMPO . . . . . . [octyl(phenyl)]-N,N-diisobutylcarbonylmethylphosphine oxideCMST . . . . . . . Characterization, Monitoring, and Sensor Technology Program (DOE)CO . . . . . . . . . contracting officerCOC . . . . . . . . chain of custodyCOR . . . . . . . . contracting officer�s representativecpm . . . . . . . . . counts per minutecps . . . . . . . . . counts per secondCRM . . . . . . . . (1) continuous radon monitor; (2) certified reference materialCSU . . . . . . . . combined standard uncertaintyCV . . . . . . . . . coefficient of variationCWA . . . . . . . Clean Water ActCWLM . . . . . . continuous working level monitor

Acronyms and Abbreviations
LMARLAP JULY 2004
d . . . . . . . . . . . day[s]D . . . . . . . . . . . homogeneous distribution coefficientDAAP . . . . . . . diamylamylphosphonateDC . . . . . . . . . direct currentDCGL . . . . . . . derived concentration guideline levelDHS . . . . . . . . U.S. Department of Homeland SecurityDIN . . . . . . . . . di-isopropylnaphthaleneDL . . . . . . . . . discrimination limitDoD . . . . . . . . U.S. Department of Defense DOE . . . . . . . . U.S. Department of Energy DOELAP . . . . DOE Laboratory Accreditation Program DOT . . . . . . . . U.S. Department of TransportationDOP . . . . . . . . dispersed oil particulatedpm . . . . . . . . disintegrations per minuteDPPP . . . . . . . dipentylpentylphosphonateDQA . . . . . . . . data quality assessmentDQI . . . . . . . . . data quality indicatorDQO . . . . . . . . data quality objectiveDTPA . . . . . . . diethylene triamine pentaacetic acid DVB . . . . . . . . divinylbenzene
Ee . . . . . . . . . . emission probability per decay eventEβmax . . . . . . . . maximum beta-particle energyEDD . . . . . . . . electronic data deliverableEDTA . . . . . . . ethylene diamine tetraacetic acidEGTA . . . . . . . ethyleneglycol bis(2-aminoethylether)-tetraacetate EMEDD . . . . . environmental management electronic data deliverable (DOE)EPA . . . . . . . . U.S. Environmental Protection Agency ERPRIMS . . . Environmental Resources Program Management System (U.S. Air Force)ESC . . . . . . . . expedited site characterization; expedited site conversioneV . . . . . . . . . . electron volts
FAR . . . . . . . . Federal Acquisition Regulations, CFR Title 48FBO . . . . . . . . Federal Business Opportunities [formerly Commerce Business Daily]FDA . . . . . . . . U.S. Food and Drug AdministrationFEP . . . . . . . . . full energy peakfg . . . . . . . . . . femtogramFOM . . . . . . . . figure of merit FWHM . . . . . . full width of a peak at half maximumFWTM . . . . . . full width of a peak at tenth maximum
Acronyms and Abbreviations
LIJULY 2004 MARLAP
GC . . . . . . . . . gas chromatographyGLPC . . . . . . . gas-liquid phase chromatographyGM . . . . . . . . . Geiger-Mueller [detector]GP . . . . . . . . . gas proportional [counter]GUM . . . . . . . Guide to the Expression of Uncertainty in Measurement (ISO)Gy . . . . . . . . . . gray[s]
h . . . . . . . . . . . hour[s]H0 . . . . . . . . . . null hypothesisHA, H1 . . . . . . . alternative hypothesisHDBP . . . . . . . dibutylphosphoric acidHDEHP . . . . . bis(2-ethylhexyl) phosphoric acidHDPE . . . . . . . high-density polyethyleneHLW . . . . . . . high-level [radioactive] wasteHPGe . . . . . . . high-purity germaniumHPLC . . . . . . . high-pressure liquid chromatography; high-performance liquid chromatographyHTRW . . . . . . hazardous, toxic, and radioactive waste
IAEA . . . . . . . International Atomic Energy AgencyICRU . . . . . . . International Commission on Radiation Units and MeasurementsICP-MS . . . . . inductively coupled plasma-mass spectroscopyIPPD . . . . . . . . integrated product and process developmentISO . . . . . . . . . International Organization for StandardizationIUPAC . . . . . . International Union of Pure and Applied Chemistry
k . . . . . . . . . . . coverage factorkeV . . . . . . . . . kilo electron voltsKPA . . . . . . . . kinetic phosphorimeter analysis
LAN . . . . . . . . local area networkLANL . . . . . . . Los Alamos National Laboratory (DOE)LBGR . . . . . . . lower bound of the gray regionLCL . . . . . . . . lower control limitLCS . . . . . . . . laboratory control samplesLDPE . . . . . . . low-density polyethylene LEGe . . . . . . . low-energy germaniumLIMS . . . . . . . laboratory information management systemLLD . . . . . . . . lower limit of detectionLLNL . . . . . . . Lawrence Livermore National Laboratory (DOE)LLRW . . . . . . low-level radioactive wasteLLRWPA . . . . Low Level Radioactive Waste Policy Act

Acronyms and Abbreviations
LIIMARLAP JULY 2004
LOMI . . . . . . . low oxidation-state transition-metal ion LPC . . . . . . . . liquid-partition chromatography; liquid-phase chromatography LS . . . . . . . . . . liquid scintillation LSC . . . . . . . . liquid scintillation counterLWL . . . . . . . . lower warning limit
MAPEP . . . . . Mixed Analyte Performance Evaluation Program (DOE)MARSSIM . . . Multi-Agency Radiation Survey and Site Investigation ManualMCA . . . . . . . multichannel analyzerMCL . . . . . . . . maximum contaminant limitMDA . . . . . . . minimum detectable amount; minimum detectable activityMDC . . . . . . . minimum detectable concentrationMDL . . . . . . . . method detection limitMeV . . . . . . . . mega electron voltsMIBK . . . . . . . methyl isobutyl ketonemin . . . . . . . . . minute[s]MPa . . . . . . . . megapascalsMQC . . . . . . . minimum quantifiable concentrationMQO . . . . . . . measurement quality objectiveMS . . . . . . . . . matrix spike; mass spectrometerMSD . . . . . . . . matrix spike duplicateMVRM . . . . . . method validation reference material
NAA . . . . . . . . neutron activation analysisNaI(Tl) . . . . . . thallium-activated sodium iodide [detector]NCP . . . . . . . . National Oil and Hazardous Substances Pollution Contingency PlanNCRP . . . . . . . National Council on Radiation Protection and MeasurementNELAC . . . . . National Environmental Laboratory Accreditation ConferenceNESHAP . . . . National Emission Standards for Hazardous Air Pollutants (EPA)NIM . . . . . . . . nuclear instrumentation module NIST . . . . . . . . National Institute of Standards and TechnologyNPL . . . . . . . . National Physics Laboratory (United Kingdom); National Priorities List (United
States)NRC . . . . . . . . U.S. Nuclear Regulatory CommissionNRIP . . . . . . . NIST Radiochemistry Intercomparison Program NTA (NTTA) . nitrilotriacetateNTU . . . . . . . . nephelometric turbidity unitsNVLAP . . . . . National Voluntary Laboratory Accreditation Program (NIST)
OA . . . . . . . . . observational approachOFHC . . . . . . . oxygen-free high-conductivity
Acronyms and Abbreviations
LIIIJULY 2004 MARLAP
OFPP . . . . . . . Office of Federal Procurement Policy
φMR . . . . . . . . . required relative method uncertainty Pa . . . . . . . . . . pascalsPARCC . . . . . precision, accuracy, representativeness, completeness, and comparabilityPBBO . . . . . . . 2-(4'-biphenylyl) 6-phenylbenzoxazolePCB . . . . . . . . polychlorinated biphenylpCi . . . . . . . . . picocuriepdf . . . . . . . . . probability density functionPE . . . . . . . . . . performance evaluationPERALS . . . . . Photon Electron Rejecting Alpha Liquid Scintillation®
PFA . . . . . . . . perfluoroalcoholoxil�
PIC . . . . . . . . . pressurized ionization chamberPIPS . . . . . . . . planar implanted passivated silicon [detector]PM . . . . . . . . . project managerPMT . . . . . . . . photomultiplier tubePT . . . . . . . . . . performance testingPTB . . . . . . . . Physikalisch-Technische bundesanstalt (Germany)PTFE . . . . . . . polytetrafluoroethylene PUREX . . . . . plutonium uranium reduction extractionPVC . . . . . . . . polyvinyl chloride
QA . . . . . . . . . quality assuranceQAP . . . . . . . . Quality Assessment Program (DOE)QAPP . . . . . . . quality assurance project planQC . . . . . . . . . quality control
rad . . . . . . . . . radiation absorbed doseRCRA . . . . . . . Resource Conservation and Recovery ActREE . . . . . . . . rare earth elementsREGe . . . . . . . reverse-electrode germaniumrem . . . . . . . . . roentgen equivalent: manRFP . . . . . . . . request for proposalsRFQ . . . . . . . . request for quotationsRI/FS . . . . . . . remedial investigation/feasibility studyRMDC . . . . . . required minimum detectable concentrationROI . . . . . . . . . region of interestRPD . . . . . . . . relative percent differenceRPM . . . . . . . . remedial project managerRSD . . . . . . . . relative standard deviationRSO . . . . . . . . radiation safety officer

Acronyms and Abbreviations
LIVMARLAP JULY 2004
s . . . . . . . . . . . second[s]SA . . . . . . . . . spike activitySC . . . . . . . . . . critical valueSAFER . . . . . . Streamlined Approach for Environmental Restoration Program (DOE)SAM . . . . . . . . site assessment managerSAP . . . . . . . . sampling and analysis planSEDD . . . . . . . staged electronic data deliverableSI . . . . . . . . . . international system of unitsSMO . . . . . . . . sample management office[r]SOP . . . . . . . . standard operating procedureSOW . . . . . . . . statement of workSQC . . . . . . . . statistical quality controlSPE . . . . . . . . . solid-phase extractionSR . . . . . . . . . . unspiked sample resultSRM . . . . . . . . standard reference materialSSB . . . . . . . . silicon surface barrier [alpha detector]SSR . . . . . . . . spiked sample resultSv . . . . . . . . . . sievert[s]
t½ . . . . . . . . . . half-lifeTAT . . . . . . . . turnaround timeTBP . . . . . . . . tributylphosphateTC . . . . . . . . . to containTCLP . . . . . . . toxicity characteristic leaching procedureTD . . . . . . . . . to deliverTEC . . . . . . . . technical evaluation committeeTEDE . . . . . . . total effective dose equivalent TEC . . . . . . . . technical evaluation committee (USGS)TES . . . . . . . . technical evaluation sheet (USGS)TFM . . . . . . . . tetrafluorometoxil�
TIMS . . . . . . . thermal ionization mass spectrometryTIOA . . . . . . . triisooctylamineTLD . . . . . . . . thermoluminescent dosimeterTnOA . . . . . . . tri-n-octylamineTOPO . . . . . . . trioctylphosphinic oxideTPO . . . . . . . . technical project officerTPP . . . . . . . . . technical project planningTPU . . . . . . . . total propagated uncertaintyTQM . . . . . . . . Total Quality ManagementTRUEX . . . . . trans-uranium extractionTSCA . . . . . . . Toxic Substances Control Act
Acronyms and Abbreviations
LVJULY 2004 MARLAP
TSDF . . . . . . . treatment, storage, or disposal facilitytSIE . . . . . . . . transfomed spectral index of the external standardTTA . . . . . . . . thenoyltrifluoroacetone
U . . . . . . . . . . . expanded uncertaintyuMR . . . . . . . . . required absolute method uncertaintyuc(y) . . . . . . . . combined standard uncertaintyUBGR . . . . . . upper bound of the gray regionUCL . . . . . . . . upper control limitUSACE . . . . . United States Army Corps of EngineersUSGS . . . . . . . United States Geological Survey UV . . . . . . . . . ultravioletUWL . . . . . . . upper warning limit
V . . . . . . . . . . . volt[s]
WCP . . . . . . . . waste certification plan
XML . . . . . . . . extensible mark-up languageXtGe® . . . . . . . extended-range germanium
y . . . . . . . . . . . year[s]Y . . . . . . . . . . . response variable
ZnS(Ag) . . . . . silver-activated zinc sulfide [detector]


LVIIJULY 2004 MARLAP
UNIT CONVERSION FACTORS
To Convert To Multiply by To Convert To Multiply byYears (y) Seconds (s)
Minutes (min)Hours (h)
3.16 × 10⁷
5.26 × 10⁵
8.77 × 10³
sminh
y 3.17 × 10!8
1.90 × 10!6
1.14 × 10!4
Disintegrationsper second (dps)
Becquerels (Bq) 1.0 Bq dps 1.0
BqBq/kgBq/m3
Bq/m3
Picocuries (pCi)pCi/gpCi/LBq/L
27.032.7 × 10!2
2.7 × 10!2
103
pCipCi/gpCi/LBq/L
BqBq/kgBq/m3
Bq/m3
3.7 × 10!2
373710!3
Microcuries permilliliter(µCi/mL)
pCi/L 109 pCi/L µCi/mL 10!9
Disintegrationsper minute (dpm)
µCipCi
4.5 × 10!7
4.5 × 10!1pCi dpm 2.22
Gallons (gal) Liters (L) 3.78 Liters Gallons 0.265Gray (Gy) rad 100 rad Gy 10!2
RoentgenEquivalent Man(rem)
Sievert (Sv) 10!2 Sv rem 102

1-1JULY 2004 MARLAP
1 INTRODUCTION TO MARLAP
1.1 Overview
Each year, hundreds of millions of dollars are spent on projects and programs that rely, to varyingdegrees, on radioanalytical data for decisionmaking. These decisions often have a significantimpact on human health and the environment. Of critical importance to informed decisionmakingare data of known quality, appropriate for their intended use. Making incorrect decisions due todata inadequacies, such as failing to remediate a radioactively contaminated site properly,necessitates the expenditure of additional resources, causes delays in project completions and,depending on the nature of the project, can result in the loss of public trust and confidence. TheMulti-Agency Radiological Laboratory Analytical Protocols (MARLAP) Manual addresses theneed for a nationally consistent approach to producing radioanalytical laboratory data that meet aproject�s or program�s data requirements. MARLAP provides guidance for the planning,implementation, and assessment phases of those projects that require the laboratory analysis ofradionuclides. The guidance provided by MARLAP is both scientifically rigorous and flexibleenough to be applied to a diversity of projects and programs. This guidance is intended forproject planners, managers, and laboratory personnel.
MARLAP is divided into two main parts. Part I is primarily for project planners and managersand provides guidance on project planning with emphasis on analytical planning issues andanalytical data requirements. Part I also provides guidance on preparing project plan documentsand radioanalytical statements of work (SOWs), obtaining and evaluating radioanalyticallaboratory services, data validation, and data quality assessment. Part I of MARLAP covers theentire life of a project that requires the laboratory analysis of radionuclides from the initialproject planning phase to the assessment phase.
Part II of MARLAP is primarily for laboratory personnel and provides guidance in the relevantareas of radioanalytical laboratory work. Part II offers information on the laboratory analysis ofradionuclides. The chapters in Part II cover the range of activities performed at radioanalyticallaboratories, including sample preservation, shipping and handling, sample preparation, sampledissolution, separation techniques, instrument measurements, data reduction, quality control,statistics, and waste management. Part II is not a compilation of analytical procedures but ratheris intended to provide information on many ofthe radioanalytical options available to labora-tories and discuss the advantages anddisadvantages of each.
MARLAP was developed collaboratively by thefollowing federal agencies: the EnvironmentalProtection Agency (EPA), the Department ofEnergy (DOE), the Department of Homeland
Contents
1.1 Overview . . . . . . . . . . . . . . . . . . . . . . . . . . . . . 1-11.2 Purpose of the Manual . . . . . . . . . . . . . . . . . . 1-21.3 Use and Scope of the Manual . . . . . . . . . . . . . 1-31.4 Key MARLAP Concepts and Terminology . . 1-41.5 The MARLAP Process . . . . . . . . . . . . . . . . . 1-121.6 Structure of the Manual . . . . . . . . . . . . . . . . . 1-131.7 References . . . . . . . . . . . . . . . . . . . . . . . . . . . 1-19

Introduction to MARLAP
1-2MARLAP JULY 2004
Security (DHS), the Nuclear Regulatory Commission (NRC), the Department of Defense (DOD),the National Institute of Standards and Technology (NIST), the United States Geological Survey(USGS), and the Food and Drug Administration (FDA). State participation in the development ofMARLAP involved contributions from representatives from the Commonwealth of Kentuckyand the State of California.
1.2 Purpose of the Manual
MARLAP�s basic goal is to provide guidance for project planners, managers, and laboratorypersonnel to ensure that radioanalytical laboratory data will meet a project�s or program�s datarequirements and needs. To attain this goal, MARLAP provides the necessary framework fornational consistency in radioanalytical work in the form of a performance-based approach formeeting a project�s data requirements. In general terms, a performance-based approach tolaboratory analytical work involves clearly defining the analytical data needs and requirements ofa project in terms of measurable goals during the planning phase of a project. These project-specific analytical data needs and requirements then serve as measurement performance criteriafor decisions as to exactly how the laboratory analysis will be conducted during the implemen-tation phase of a project. They are used subsequently as criteria for evaluating analytical dataduring the assessment phase. The manual focuses on activities performed at radioanalyticallaboratories as well as on activities and issues that direct, affect, or can be used to evaluateactivities performed at radioanalytical laboratories.
Specific objectives of MARLAP include:
� Promoting a directed planning process for projects involving individuals from relevantdisciplines including radiochemistry;
� Highlighting common radioanalytical planning issues;
� Providing a framework and information resource for using a performance-based approach forplanning and conducting radioanalytical work;
� Providing guidance on linking project planning, implementation, and assessment;
� Providing guidance on obtaining and evaluating radioanalytical laboratory services;
� Providing guidance for evaluating radioanalytical laboratory data, i.e., data verification, datavalidation, and data quality assessment;
� Promoting high quality radioanalytical laboratory work; and

Introduction to MARLAP
1-3JULY 2004 MARLAP
� Making collective knowledge and experience in radioanalytical work widely available.
1.3 Use and Scope of the Manual
The guidance contained in MARLAP is for both governmental and private sectors. Users ofMARLAP include project planners, project managers, laboratory personnel, regulators, auditors,inspectors, data evaluators, decisionmakers, and other end users of radioanalytical laboratorydata.
Because MARLAP uses a performance-based approach to laboratory measurements, theguidance contained in the manual is applicable to a wide range of projects and activities thatrequire radioanalytical laboratory measurements. Examples of data collection activities thatMARLAP supports include:
� Site characterization activities; � Site cleanup and compliance demonstration activities; � License termination activities; � Decommissioning of nuclear facilities; � Remedial and removal actions; � Effluent monitoring of licensed facilities; � Emergency response activities; � Environmental site monitoring; � Background studies; � Routine ambient monitoring; and � Waste management activities.
MARLAP and the Multi-Agency Radiation Survey and Site Investigation Manual (MARSSIM,2000) are complementary guidance documents in support of cleanup and decommissioningactivities. MARSSIM provides guidance on how to plan and carry out a study to demonstrate thata site meets appropriate release criteria. It describes a methodology for planning, conducting,evaluating, and documenting environmental radiation surveys conducted to demonstratecompliance with cleanup criteria. MARLAP provides guidance and a framework for both projectplanners and laboratory personnel to ensure that radioanalytical data will meet the needs andrequirements of cleanup and decommissioning activities.
While MARLAP supports a wide range of projects, some topics are not specifically discussed inthe manual. These include high-level waste, mixed waste, and medical applications involvingradionuclides. While they are not specifically addressed, much of MARLAP�s guidance may beapplicable in these areas. Although the focus of the manual is to provide guidance for thoseprojects that require the laboratory analysis of radionuclides, much of the guidance on theplanning and assessment phases can be applied wherever the measurement process is conducted,
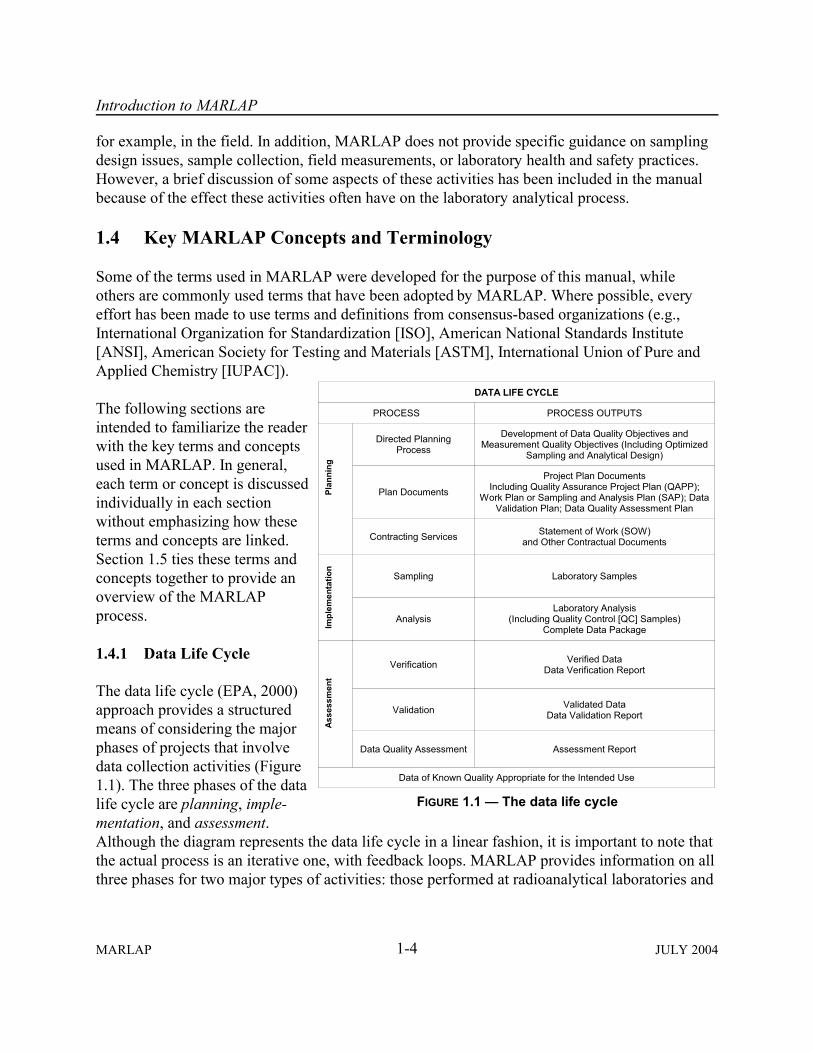
Introduction to MARLAP
1-4MARLAP JULY 2004
������������
������� �������������
�� �����
�� �� �������������� ��
� ���� ��������������������� ���� ����� ���� � �������������� ���� ��!"���������������# �
�������������$���������� ����%
��������� ���
���� ������������ ���"�����������������$������� ����� ��������!�$��%&
'��(����������������������$�������������!�$�%&����)��������������&�������������$�� ��� �������
������������� ���� ����� � ������'��(�!��'%
������* ������������������ ���
��������� ����
�������� +��������������� �
$�������+����������$�������
!"�������������������������,��-������ �%����� � ��������(��
����������
) ����������) ���� �����
����) ������������ ����
)���������)������ �����
����)����������� ����
������������$�� ��� �� $�� ��� ���� ����
�������.��/����������$��������� ������* �"�� �� ����
FIGURE 1.1 � The data life cycle
for example, in the field. In addition, MARLAP does not provide specific guidance on samplingdesign issues, sample collection, field measurements, or laboratory health and safety practices.However, a brief discussion of some aspects of these activities has been included in the manualbecause of the effect these activities often have on the laboratory analytical process.
1.4 Key MARLAP Concepts and Terminology
Some of the terms used in MARLAP were developed for the purpose of this manual, whileothers are commonly used terms that have been adopted by MARLAP. Where possible, everyeffort has been made to use terms and definitions from consensus-based organizations (e.g.,International Organization for Standardization [ISO], American National Standards Institute[ANSI], American Society for Testing and Materials [ASTM], International Union of Pure andApplied Chemistry [IUPAC]).
The following sections areintended to familiarize the readerwith the key terms and conceptsused in MARLAP. In general,each term or concept is discussedindividually in each sectionwithout emphasizing how theseterms and concepts are linked.Section 1.5 ties these terms andconcepts together to provide anoverview of the MARLAPprocess.
1.4.1 Data Life Cycle
The data life cycle (EPA, 2000)approach provides a structuredmeans of considering the majorphases of projects that involvedata collection activities (Figure1.1). The three phases of the datalife cycle are planning, imple-mentation, and assessment.Although the diagram represents the data life cycle in a linear fashion, it is important to note thatthe actual process is an iterative one, with feedback loops. MARLAP provides information on allthree phases for two major types of activities: those performed at radioanalytical laboratories and

Introduction to MARLAP
1-5JULY 2004 MARLAP
those that direct, affect, or evaluate activities performed at radioanalytical laboratories (such asproject planning, development of plan documents, data verification and data validation).
One of MARLAP�s specific objectives is to emphasize the importance of establishing the properlinkages among the three phases of the data life cycle. This results in an integrated and iterativeprocess that translates the expectations and requirements of data users into measurementperformance criteria for data suppliers. The integration of the three phases of the data life cycle iscritical to ensuring that the analytical data requirements (defined during the planning phase) canserve as measurement performance criteria during the implementation phase and subsequently asdata evaluation criteria during the assessment phase.
Without the proper linkages and integration of the three phases, there is a significant likelihoodthat the analytical data will not meet a project�s data requirements. The data may be evaluatedusing criteria that have little relation to their intended use. Therefore, failure to integrate andadequately link the three phases of the data life cycle increases the likelihood of project costescalation or project failure.
1.4.2 Directed Planning Process
MARLAP recommends the use of a directed or systematic planning process. A directed planningprocess is an approach for setting well-defined, achievable objectives and developing a cost-effective, technically sound sampling and analysis design that balances the data user�s tolerancefor uncertainty in the decision process with the resources available for obtaining data to support adecision. While MARLAP recommends and promotes the use of a directed planning process, itdoes not recommend or endorse any particular directed planning process. However, MARLAPemploys many of the terms and concepts associated with the data quality objective (DQO)process (ASTM D5792; EPA, 2000). This was done to ensure consistent terminology throughoutthe manual, and also because many of the terms and concepts of this process are familiar to thoseengaged in environmental data collection activities.
1.4.3 Performance-Based Approach
MARLAP provides the necessary guidance for using a performance-based approach to meet aproject�s analytical data requirements. In a performance-based approach, the project-specificanalytical data requirements that are determined during directed planning serve as measurementperformance criteria for analytical selections and decisions. The project-specific analytical datarequirements also are used for the initial, ongoing, and final evaluation of the laboratory�sperformance and the laboratory�s data. MARLAP provides guidance for using a performance-based approach for all three phases of the data life cycle for those projects that requireradioanalytical laboratory data. This involves not only using a performance-based approach forselecting an analytical protocol, but also using a performance-based approach for other project

Introduction to MARLAP
1-6MARLAP JULY 2004
������������ ����������������
���������� ���� ����������������������������������������
��������� ������������ ����
����������������������������
����������������
� ��� ���������������!������� ������!���� ���
�������������!��������!������������"���������
����������"���������
��������� �����������������
FIGURE 1.2 � Typical components of an analytical process
activities, such as developing acceptance criteria for laboratory quality control samples,laboratory evaluations, data verification, data validation, and data quality assessment.
There are three major steps associated with a performance-based approach. The first is clearlyand accurately defining the analytical data requirements for the project. This process is discussedin more detail in Section 1.4.9 of this chapter. The second step uses an organized, interactiveprocess to select or develop analytical protocols to meet the specified analytical data require-ments and to demonstrate the protocols� abilities to meet the analytical data requirements(Section 1.4.10). The third major step uses the analytical data requirements as measurementperformance criteria for the ongoing and final evaluation of the laboratory data, including dataverification, data validation, and data quality assessment (Section 1.4.11). Within the constraintsof other factors, such as cost, a performance-based approach allows for the use of any analyticalprotocol that meets the project�s analytical data requirements. For all relevant project activities,the common theme of a performance-based approach is the use of project-specific analytical datarequirements that are developed during project planning and serve as measurement performancecriteria for selections, evaluations, and decisionmaking.
1.4.4 Analytical Process
Most environmental datacollection efforts center aroundtwo major processes: the samplingprocess and the analytical process.MARLAP does not provideguidance on the sampling process,except for brief discussions ofcertain activities that often affectthe analytical process (fieldprocessing, preservation, etc.).The analytical (or measurement)process is a general term used byMARLAP to refer to acompilation of activities startingfrom the time a sample iscollected and ending with thereporting of data. Figure 1.2illustrates the major componentsof an analytical process. Aparticular analytical process for aproject may not include all of theactivities listed. For example, if aproject involves the analysis of

Introduction to MARLAP
1-7JULY 2004 MARLAP
tritium in drinking water, then the analytical process for the project will not include sampledissolution and the chemical separation of the radionuclide of concern. It is important to identifythe relevant activities of the analytical process for a particular project early in the planning phase.Once the activities have been identified, the analytical requirements of the activities can beestablished, which will ultimately lead to defining how the activities will be accomplishedthrough the selection or development of written procedures.
1.4.5 Analytical Protocol
MARLAP uses the term �analytical protocol� to refer to a compilation of specific procedures andmethods that are performed in succession for a particular analytical process. For example, aprotocol for the analysis of drinking water samples for tritium would be comprised of the set ofprocedures that describe the relevant activities, such as sample tracking, quality control, fieldsample preparation and preservation, sample receipt and inspection, laboratory sample prepara-tion (if necessary), preparing the samples for counting, counting the samples, and data reductionand reporting. A written procedure may cover one or more of the activities, but it is unlikely thata single procedure will cover all of the activities of a given analytical process. With a perfor-mance-based approach, there may be a number of alternative protocols that might be appropriatefor a particular analytical process. Selecting or developing an analytical protocol requiresknowledge of the particular analytical process, as well as an understanding of the analytical datarequirements developed during the project planning phase.
1.4.6 Analytical Method
A major component of an analytical protocol is the analytical method, which normally includeswritten instructions for sample digestion, chemical separation (if required), and counting. It isrecognized that in many instances the analytical method may cover many of the activities of aparticular analytical process. Therefore attention is naturally focused on the selection ordevelopment of an analytical method. However, many analytical methods do not addressactivities such as field preparation and preservation, certain aspects of laboratory preparation,laboratory subsampling, etc., which are often important activities within an analytical process.The analytical protocol is generally more inclusive of the activities that make up the analyticalprocess than the analytical method.
1.4.7 Uncertainty and Error
An important aspect of sampling and measurement is uncertainty. The term �uncertainty� hasdifferent shades of meaning in different contexts, but generally the word refers to a lack ofcomplete knowledge about something of interest. In the context of metrology (the science ofmeasurement), the more specific term �measurement uncertainty� often will be used. �Uncertain-ty (of measurement)� is defined in the Guide to the Expression of Uncertainty in Measurement(ISO 1995��GUM�) as a �parameter, associated with the result of a measurement, that charac-
Introduction to MARLAP
1-8MARLAP JULY 2004
terizes the dispersion of values that could reasonably be attributed to the measurand.� The�measurand� is the quantity being measured. MARLAP recommends the terminology andmethods of GUM for describing, evaluating, and reporting measurement uncertainty. Theuncertainty of a measured value is typically expressed as an estimated standard deviation, calleda �standard uncertainty� (or �one-sigma uncertainty�). The standard uncertainty of a calculatedresult usually is obtained by propagating the standard uncertainties of a number of othermeasured values, and in this case, the standard uncertainty is called a �combined standarduncertainty.� The combined standard uncertainty may be multiplied by a specified factor called a�coverage factor� (e.g., 2 or 3) to obtain an �expanded uncertainty� (a �two-sigma� or �three-sigma� uncertainty), which describes an interval about the result that can be expected to containthe true value with a specified high probability. MARLAP recommends that either the combinedstandard uncertainty or an expanded uncertainty be reported with every result. Chapter 19discusses the terminology, notation, and methods of GUM in more detail and provides guidancefor applying the concepts to radioanalytical measurements.
While measurement uncertainty is a parameter associated with an individual result and iscalculated after a measurement is performed, MARLAP uses the term �method uncertainty� torefer to the predicted uncertainty of a measured value that likely would result from the analysis ofa sample at a specified analyte concentration. Method uncertainty is a method performancecharacteristic much like the detection capability of a method. Reasonable values for bothcharacteristics can be predicted for a particular method based on typical values for certainparameters and on information and assumptions about the samples to be analyzed. Thesepredicted values can be used in the method selection process to identify the most appropriatemethod based on a project�s data requirements. Chapter 3 provides MARLAP�s recommenda-tions for deriving analytical protocol selection criteria based on the required method uncertaintyand other analytical requirements.
When a decisionmaker bases a decision on the results of measurements, the measurementuncertainties affect the probability of making a wrong decision. When sampling is involved,sampling statistics also contribute to the probability of a wrong decision. Because decision errorsare possible, there is uncertainty in the decisionmaking process. MARLAP uses the terms�decision uncertainty� or �uncertainty of the decision� to refer to this type of uncertainty.Decision uncertainty is usually expressed as the estimated probability of a decision error underspecified assumptions. Appendix B discusses decision uncertainty further in the context of theDQO process.
A concept that should not be confused with uncertainty is error. In general, error refers tosomething that deviates from what is correct, right or true. In terms of measurements such aslaboratory analyses, the difference between the measured result and the actual value of themeasurand is the error of the measurement. Because the actual value of the measurand isgenerally not known, the measurement error cannot be determined. Therefore, the error of ameasurement is primarily a theoretical concept with little practical use. However, the
Introduction to MARLAP
1-9JULY 2004 MARLAP
measurement uncertainty, which provides an estimated bound for the likely size of themeasurement error, is very useful and plays a key role in MARLAP�s performance-basedapproach.
1.4.8 Precision, Bias, and Accuracy
Analytical data requirements often have been described in terms of precision and bias. Precisionis usually expressed as a standard deviation, which measures the dispersion of measured valuesabout their mean. It is sometimes more natural to speak of �imprecision,� because larger valuesof the standard deviation indicate less precision. MARLAP considers bias to be a persistentdifference between the measured result and the true value of the quantity being measured, whichdoes not vary if the measurement is repeated. If the measurement process is in statistical control,then precision may be improved by averaging the results of many independent measurements ofthe same quantity. Bias is unaffected by averaging (see Section 6.5.5.7).
A bias in a data set may be caused by measurement errors that occur in steps of the measurementprocess that are not repeated, such as the determination of a half-life. Imprecision may be causedby measurement errors in steps that are repeated many times, such as weighing, pipetting, andradiation counting. However, distinguishing between bias and precision is complicated by thefact that some steps in the process, such as instrument calibration or tracer preparation, arerepeated at frequencies less than those of other steps, and the measurement errors in seldomrepeated steps may affect large blocks of data. Consequently, measurement errors that produceapparent biases in small data sets might adversely affect precision in larger data sets.
Because the same type of measurement error may produce either bias or precision, depending onone�s point of view, the concept of measurement uncertainty, described in Section 1.4.7, treats alltypes of measurement error alike and combines estimates of their magnitudes into a singlenumerical parameter (i.e., combined standard uncertainty). The concepts of precision and bias areuseful in context when a measurement process or a data set consisting of many measurementresults is considered. When one considers only a single measurement result, the concept ofmeasurement uncertainty tends to be more useful than the concepts of precision and bias.Therefore, it is probably best to consider precision and bias to be characteristics of themeasurement process or of the data set, and to consider measurement uncertainty to be an aspectof each individual result.
Quality control samples are analyzed for the purpose of assessing precision and bias. Spikedsamples and method blanks are typically used to assess bias, and duplicates are used to assessprecision. Because a single measurement of a spike or blank cannot in principle distinguishbetween precision and bias, a reliable estimate of bias requires a data set that includes many suchmeasurements.
Introduction to MARLAP
1-10MARLAP JULY 2004
Different authors have given the word accuracy different technical definitions, expressed interms of bias and precision. MARLAP avoids all of these technical definitions and uses the term�accuracy� in its common, ordinary sense, which is consistent with its definition in theInternational Vocabulary of Basic and General Terms in Metrology (ISO, 1993). In MARLAP�sterminology, the result of a measurement is �accurate� if it is close to the true value of thequantity being measured. Inaccurate results may be caused either by bias or precision in themeasurement process.
While it is recognized that the terms bias, precision, and accuracy are commonly used in datacollection activities, these terms are used somewhat sparingly in this manual. MARLAPemphasizes and provides guidance in the use of measurement uncertainty as a means ofestablishing analytical data requirements and in the evaluation of single measurement results.
1.4.9 Performance Objectives: Data Quality Objectives and Measurement QualityObjectives
One of the outputs of a directed planning process is DQOs for a project or program. DQOs arequalitative and quantitative statements that clarify the study objectives, define the mostappropriate type of data to collect, determine the most appropriate conditions from which tocollect the data, and specify tolerable limits on decision error rates (ASTM D5792; EPA, 2000).DQOs apply to all data collection activities associated with a project or program, includingsampling and analysis. In particular, DQOs should encompass the �total uncertainty� resultingfrom all data collection activities, including analytical and sampling activities.
From an analytical perspective, a process of developing the analytical data requirements from theDQOs of a project is essential. These analytical data requirements serve as measurement perfor-mance criteria or objectives of the analytical process. MARLAP refers to these performanceobjectives as �measurement quality objectives� (MQOs). The MARLAP Manual providesguidance on developing the MQOs from the overall project DQOs (Chapter 3). MQOs can beviewed as the analytical portion of the DQOs and are therefore project-specific. MARLAPprovides guidance on developing MQOs during project planning for select method performancecharacteristics, such as method uncertainty at a specified concentration; detection capability;quantification capability; specificity, or the capability of the method to measure the analyte ofconcern in the presence of interferences; range; ruggedness, etc. An MQO is a statement of aperformance objective or requirement for a particular method performance characteristic. LikeDQOs, MQOs can be quantitative and qualitative statements. An example of a quantitative MQOwould be a statement of a required method uncertainty at a specified radionuclide concentration,such as the action level�i.e., �a method uncertainty of 3.7 Bq/kg (0.10 pCi/g) or less is requiredat the action level of 37 Bq/kg (1.0 pCi/g).� An example of a qualitative MQO would be astatement of the required specificity of the analytical protocol�the ability to analyze for theradionuclide of concern given the presence of interferences�i.e., �the protocol must be able toquantify the amount of 226Ra present given high levels of 235U in the samples.�

Introduction to MARLAP
1-11JULY 2004 MARLAP
The MQOs serve as measurement performance criteria for the selection or development ofanalytical protocols and for the initial evaluation of the analytical protocols. Once the analyticalprotocols have been selected and evaluated, the MQOs serve as criteria for the ongoing and finalevaluation of the laboratory data, including data verification, data validation, and data qualityassessment. In a performance-based approach, analytical protocols are either selected or rejectedfor a particular project, to a large measure, based on their ability or inability to achieve the statedMQOs. Once selected, the performance of the analytical protocols is evaluated using the project-specific MQOs.
1.4.10 Analytical Protocol Specifications
MARLAP uses the term �analytical protocol specifications� (APSs) to refer to the output of adirected planning process that contains the project�s analytical data requirements in an organized,concise form. In general, there will be an APS developed for each analysis type. Thesespecifications serve as the basis for the evaluation and selection of the analytical protocols thatwill be used for a particular project. In accordance with a performance-based approach, the APSscontain only the minimum level of specificity required to meet the project�s analytical datarequirements without dictating exactly how the requirements are to be met. At a minimum, theAPSs should indicate the analyte of interest, the matrix of concern, the type and frequency ofquality control (QC) samples, and provide the required MQOs and any specific analytical processrequirements, such as chain-of-custody for sample tracking. In most instances, a particular APSdocument would be a one-page form (see Chapter 3, Figure 3.2). Depending on the particularproject, a number of specific analytical process requirements may be included. For example, ifproject or process knowledge indicates that the radionuclide of interest exists in a refractoryform, then the APSs may require a fusion step for sample digestion.
Within the constraints of other factors, such as cost, MARLAP�s performance-based approachallows the use of any analytical protocol that meets the requirements in the APSs. The APSs�inparticular the MQOs�are used to select and evaluate the analytical protocols. Once theanalytical protocols have been selected and evaluated, the APSs then serve as criteria for theongoing and final evaluation of the laboratory data, including data verification, data validation,and data quality assessment.
1.4.11 The Assessment Phase
The MARLAP Manual provides guidance for the assessment phases for those projects thatrequire the laboratory analysis of radionuclides. The guidance on the assessment phase ofprojects focuses on three major activities: data verification, data validation, and data qualityassessment.
Data verification assures that laboratory conditions and operations were compliant with thestatement of work and any appropriate project plan documents (e.g., Quality Assurance Project

Introduction to MARLAP
1-12MARLAP JULY 2004
Plan), which may reference laboratory documents such as laboratory standard operatingprocedures. Verification compares the material delivered by the laboratory to these requirements(compliance) and checks for consistency and comparability of the data throughout the datapackage, correctness of calculations, and completeness of the results to ensure that all necessarydocumentation is available. The verification process usually produces a report identifying whichrequirements are not met. The verification report may be used to determine payment forlaboratory services and to identify problems that should be investigated during data validation.Verification works iteratively and interactively with the generator (i.e., laboratory) to assurereceipt of all available, necessary data. Although the verification process identifies specificproblems, the primary function should be to apply appropriate feedback resulting in correctiveaction improving the analytical services before the work is completed.
Validation addresses the reliability of the data. The validation process begins with a review of theverification report and laboratory data package to screen the areas of strength and weakness ofthe data set. The validator evaluates the data to determine the presence or absence of an analyteand the uncertainty of the measurement process for contaminants of concern. During validation,the technical reliability and the degree of confidence in reported analytical data are considered.Validation �flags� (i.e., qualifiers) are applied to data that do not meet the acceptance criteriaestablished to assure data meet the needs of the project. The product of the validation process is avalidation report noting all data sufficiently inconsistent with the validation acceptance criteria inthe expert opinion of the validator. The appropriate data validation tests should be establishedduring the project planning phase.
Data quality assessment (DQA), the third and final step of the assessment phase, is defined as the�scientific and statistical evaluation of data to determine if data are of the right type, quality, andquantity to support their intended use.� DQA is more global in its purview than the previousverification and validation steps. DQA, in addition to reviewing the issues raised during verifica-tion and validation, may be the first opportunity to review other issues, such as field activitiesand their impact on data quality and usability. DQA should consider the combined impact of allproject activities in making a data usability determination, which is documented in a DQA report.
1.5 The MARLAP Process
An overarching objective of the MARLAP Manual is to provide a framework and informationfor the selection, development, and evaluation of analytical protocols and the resulting laboratorydata. The MARLAP process is a performance-based approach that develops APSs and uses theserequirements as criteria for the analytical protocol selection, development and evaluationprocesses, and for the evaluation of the resulting laboratory data. This process, which spans thethree phases of the data life cycle for a project�planning, implementation and assessment�isthe basis for achieving MARLAP�s basic goal of ensuring that radioanalytical data will meet a
Introduction to MARLAP
1-13JULY 2004 MARLAP
project�s data requirements. A brief overview of this process, which is referred to as theMARLAP process and is the focus of Part I of the manual, is provided below.
The MARLAP process starts with a directed planning process. Within a directed planningprocess, key analytical issues based on the project�s particular analytical processes are discussedand resolved. The resolution of these key analytical issues produces the APSs, which include theMQOs. The APSs are documented in project plan documents (e.g., Quality Assurance ProjectPlans, Sampling and Analysis Plans). A SOW is then developed that contains the APSs. Thelaboratories receiving the SOW respond with proposed analytical protocols based on the require-ments of the APSs and provide evidence that the proposed protocols meet the performancecriteria in the APSs. The proposed analytical protocols are initially evaluated by the projectmanager or designee to determine if they will meet the requirements in the APSs. If the proposedanalytical protocols are accepted, the project plan documents are updated by the inclusion orreferencing of the actual analytical protocols to be used. During analyses, resulting sample andQC data will be evaluated primarily using MQOs from the respective APSs. Once the analysesare completed, an evaluation of the data will be conducted, including data verification, datavalidation, and data quality assessment with the respective MQOs serving as criteria forevaluation. The role of the APSs (particularly the MQOs, which make up an essential part of theAPSs) in the selection, development, and evaluation of the analytical protocols and the laboratorydata is to provide a critical link between the three phases of the data life cycle of a project. Thislinkage helps to ensure that radioanalytical laboratory data will meet a project�s data require-ments, and that the data are of known quality appropriate for their intended use. The MARLAPprocess is illustrated in Figure 1.3. Although the diagram represents the MARLAP process in alinear fashion, it is important to note that the process is an iterative one, and there can be manyvariations on this stylized diagram. Also, the phases shown at the right of Figure 1.3 onlyillustrate the relationship of the MARLAP process to the data life cycle.
1.6 Structure of the Manual
MARLAP is divided into two main parts. Part I provides guidance on implementing theMARLAP process as described in Section 1.5. This part of the manual focuses on the sequenceof steps involved when using a performance-based approach for projects requiring radioanalyticallaboratory work starting with a directed planning process and ending with DQA. Part I providesthe overall guidance for using a performance-based approach for all three phases of a project. Amore detailed overview of Part I is provided in Section 1.6.1. While the primary users for most ofthe Part I chapters are project managers and planners, other groups can benefit from the guidancein Part I. Part II of the manual provides information on the laboratory analysis of radionuclides to supporta performance-based approach. Part II provides guidance and information on the variousactivities performed at radioanalytical laboratories, such as sample preparation, sample

Introduction to MARLAP
1-14MARLAP JULY 2004
Directed Planning Process (Chapter 2)• Key Analytical Issues (Chapter 3)• Development of Analytical Protocol Specifications• Includes MQOs (Chapter 3)
Develop Plan Documents That IncorporateAnalytical Protocol Specifications (Chapter 4)
(e.g., QAPP, SAP, Data Validation Plan)
Laboratory Responds with Analytical Protocols(Chapter 6)
• Selected to Meet Requirements of Analytical Protocol Specifications• Performance Data Provided
Initial Evaluation of Analytical Protocols and Laboratory(Chapter 7)
• Review of Performance Data• Performance Evaluation (PE) Samples/Certified Reference
Materials (CRMs) Analyzed• Quality Systems Audit
ProtocolsRejected
Development of SOW (Chapter 5)• Includes Analytical Protocol Specifications (MQOs)
CorrectiveActions
Update Plan Documents(Chapter 4)
• Include or Reference Accepted Analytical Protocols
Start Analysis of Samples
Protocols Accepted
Ongoing Evaluation of Laboratory Performance(Chapter 7)
• Evaluation of QC and PE Sample Results• Laboratory Audits• Evaluation of Sample-Specific Parameters (i.e., yield)
Analyses Completed
Data Evaluation and Assessment• Data Verification (Chapter 8)• Data Validation (Chapter 8)• Data Quality Assessment (Chapter 9)
Data of Known Quality for Decision Making
Project Manager
Project Planning Team
AssessmentPhase
ImplementationPhase
PlanningPhase
FIGURE 1.3 � The MARLAP process
dissolution, chemical separations, preparing sources for counting, nuclear counting, etc. Theprimary users for Part II are laboratory personnel. Using the overall framework provided in Part I,the material in Part II can be used to assist project planners, managers, and laboratory personnelin the selection, development, evaluation, and implementation of analytical protocols for aparticular project or program. Figure 1.4 illustrates the interaction of the project manager and thelaboratory using key MARLAP terms and processes. A more detailed overview of Part II isprovided in Section 1.6.2. In addition to Part I and Part II, MARLAP has several appendices thatsupport both Part I and Part II of the manual. An overview of the appendices is provided inSection 1.6.3 of this chapter.

Introduction to MARLAP
1-15JULY 2004 MARLAP
FIGURE 1.4 � Key MARLAP terms and processes
Because of the structure and size of the manual, most individuals will naturally focus on thosechapters that provide guidance in areas directly related to their work. Therefore, to help ensurethat key concepts are conveyed to the readers, there is some material is repeated, often in verysimilar or even the same language, throughout the manual.

Introduction to MARLAP
1-16MARLAP JULY 2004
1.6.1 Overview of Part I
Figure 1.3, the MARLAP Process on page 1-14, illustrates the sequence of steps that make up aperformance-based approach for the planning, implementation, and assessment phases ofradioanalytical projects. The remainder of Part I closely tracks this sequence:
� Chapter 2, Project Planning Process, provides an overview of the directed planning processand its outputs.
� Chapter 3, Key Analytical Planning Issues and Developing Analytical Protocol Specifica-tions, describes key analytical planning issues that need to be addressed during a directedplanning process and provides guidance on developing APSs, which are outputs of theplanning process.
� Chapter 4, Project Plan Documents, provides guidance on the linkage between projectplanning and project plan documents, with an overview of different types of project plandocuments (e.g., work plans, quality assurance project plans, sampling and analysis plans).
� Chapter 5, Obtaining Laboratory Services, provides guidance on developing a statement ofwork that incorporates the APSs.
� Chapter 6, Selection and Application of an Analytical Method, provides guidance on selectingor developing analytical protocols that will meet the MQOs and other requirements asoutlined in the APSs. Unlike the rest of Part I, this chapter is intended primarily for labora-tory personnel, because under a performance-based approach, a laboratory may use anyprotocol that meets the requirements of the APSs. (Other factors, such as cost, also willinfluence the selection of analytical protocols.)
� Chapter 7, Evaluating Methods and Laboratories, provides guidance on the initial andongoing evaluation of analytical protocols and also provides guidance on the overallevaluation of radioanalytical laboratories.
� Chapter 8, Radiochemical Data Verification and Validation, provides an overview of the dataevaluation process, provides general guidelines for data verification and validation, andprovides �tools� for data validation.
� The last chapter of Part I, Chapter 9, Data Quality Assessment, discusses data qualityassessment and provides guidance on linking data quality assessment to the planning process.
Introduction to MARLAP
1-17JULY 2004 MARLAP
1.6.2 Overview of Part II
The chapters in Part II are intended to provide information on the laboratory analysis ofradionuclides. The chapters provide information on many of the options available for analyticalprotocols, and discuss common advantages and disadvantages of each. The chapters highlightcommon analytical problems and ways to identify and correct them. The chapters also serve toeducate the reader by providing a detailed explanation of the typical activities performed at aradioanalytical laboratory. Consistent with a performance-based approach, the chapters in Part IIdo not contain detailed step-by-step instructions on how to perform certain laboratory tasks, suchas the digestion of a soil sample. The chapters do contain information and guidance intended toassist primarily laboratory personnel in deciding on the best approach for a particular laboratorytask. For example, while the chapter on sample dissolution does not contain step-by-stepinstructions on how to dissolve a soil sample, it does provide information on acid digestion,fusion techniques, and microwave digestion, which is intended to help the reader select the mostappropriate technique or approach for a particular project.
The primary audience for Part II is laboratory personnel and the chapters generally contain asignificant amount of technical information. While the primary target audience is laboratorypersonnel, other groups, such as project planners and managers, can benefit from the guidance inPart II. Listed below are the chapters that make up Part II of the manual. It should be noted thatPart II of the manual does not provide specific guidance for some laboratory activities that arecommon to all laboratories, such as laboratory quality assurance, and laboratory health and safetypractices. This is primarily due to the fact that these activities are not unique to radioanalyticallaboratories and considerable guidance in these areas already exists.
Chapter 10 Field and Sampling Issues That Affect Laboratory MeasurementsChapter 11 Sample Receipt, Inspection, and TrackingChapter 12 Laboratory Sample PreparationChapter 13 Sample DissolutionChapter 14 Separation TechniquesChapter 15 Quantification of RadionuclidesChapter 16 Data Acquisition, Reduction, and Reporting for Nuclear Counting
InstrumentationChapter 17 Waste Management in a Radioanalytical LaboratoryChapter 18 Laboratory Quality ControlChapter 19 Measurement UncertaintyChapter 20 Detection and Quantification Capabilities
Chapters 10 through 16 provide information on the typical components of an analytical processin the order in which activities that make up an analytical process are normally performed. Whilenot providing step-by-step procedures for activities such as sample preservation, sampledigestion, nuclear counting, etc., the chapters do provide an overview of options available for the

Introduction to MARLAP
1-18MARLAP JULY 2004
various activities and importantly, provide information on the appropriateness of the assortedoptions under a variety of conditions.
Chapter 17, Waste Management in a Radioanalytical Laboratory, provides an overview of manyof the regulations for waste disposal and provides guidance for managing wastes in a radioana-lytical laboratory. Chapter 18, Laboratory Quality Control, provides guidance on monitoring keylaboratory performance indicators as a means of determining if a laboratory�s measurementprocesses are in control. The chapter also provides information on likely causes of excursions forselected laboratory performance indicators, such as chemical yield, instrument background,quality control samples, etc.
Chapters 19, Measurement Uncertainty, and 20, Detection and Quantification Capabilities,provide information on statistical principles and methods applicable to radioanalytical measure-ments, calibrations, data interpretation, and quality control. Topics covered in the chapter includedetection and quantification, measurement uncertainty, and procedures for estimatinguncertainty.
1.6.3 Overview of the Appendices
Seven appendices provide additional details on specific topics discussed in Part I and Part IIchapters. Appendices A through E primarily support Part I chapters (project planning issues) andAppendices F and G primarily support the chapters in Part II (laboratory implementation issues).
� Appendix A, Directed Planning Approaches, provides an overview of a number of directedplanning processes and discusses some common elements of the different approaches.
� Appendix B, The Data Quality Objective Process, provides an expanded discussion of theData Quality Objectives Process including detailed guidance on setting up a �gray region�and establishing tolerable decision error rates.
� Appendix C, Measurement Quality Objectives for Method Uncertainty and Detection andQuantification Capability, provides the rationale and guidance for developing MQOs forselect method performance characteristics.
� Appendix D, Content of Project Plan Documents, provides guidance on the appropriatecontent of plan documents.
� Appendix E, Contracting Laboratory Services, contains detailed guidance on contractinglaboratory services.
� Appendix F, Laboratory Subsampling, provides information on improving and evaluatinglaboratory subsampling techniques.

Introduction to MARLAP
1-19JULY 2004 MARLAP
� Appendix G, Statistical Tables, provides a compilation of statistical tables.
1.7 References
American Society for Testing and Materials (ASTM) D5792. Standard Practice for Generationof Environmental Data Related to Waste Management Activities: Development of DataQuality Objectives, 1995.
International Organization for Standardization (ISO). 1993. International Vocabulary of Basicand General Terms in Metrology. ISO, Geneva, Switzerland.
International Organization for Standardization (ISO). 1995. Guide to the Expression ofUncertainty in Measurement. ISO, Geneva, Switzerland.
MARSSIM. 2000. Multi-Agency Radiation Survey and Site Investigation Manual, Revision 1.NUREG-1575 Rev 1, EPA 402-R-97-016 Rev1, DOE/EH-0624 Rev1. August. Available atwww.epa.gov/radiation/marssim/.
U.S. Environmental Protection Agency (EPA). 2000. Guidance for the Data Quality ObjectiveProcess (EPA QA/G-4). EPA/600/R-96/055, Washington, DC. Available at www.epa.gov/quality1/qa_docs.html.


2-1JULY 2004 MARLAP
2 PROJECT PLANNING PROCESS
2.1 Introduction
Efficient environmental data collection activities depend on successfully identifying the type,quantity, and quality of data needed, as well as how the data will be used to support the decision-making process. MARLAP recommends the use of a directed or systematic planning process.These planning processes provide a logical framework for establishing well-defined, achievableobjectives within a cost-effective, technically sound, and defensible sampling and analysisdesign. They also balance the data user�s tolerance for uncertainty in the decision process withthe available resources for obtaining data to support a decision. MARLAP uses the term �directedplanning� to emphasize that the planning process, in addition to having a framework orstructure (i.e., it is systematic), is focused on defining the data needed to support an informeddecision for a specific project.
This chapter provides an overview of the directed planning process. It promotes:
1. Directed planning as a tool for project management to identify and document the data qualityobjectives (DQOs)�qualitative and quantitative statements that define the project objectivesand the tolerable rate of making decision errors, which in turn will be used to establish thequality and quantity of data needed to support the decision�and the measurement qualityobjectives (MQOs) that define the analytical data requirements appropriate for decision-making;
2. The involvement of technical experts�radioanalytical specialists, in particular�in theplanning process; and
3. Integration of the outputs from the directed planning process into the implementation andassessment phases of the project through documentation in project plan documents, theanalytical statement of work (SOW), and the data assessment plans (e.g., for data verification,data validation, and data qualityassessment).
MARLAP uses the terms �DQOs� and�MQOs,� as defined above and in Section1.4.9, because of their widespread use inenvironmental data collection activities. Theseconcepts may be expressed by other terms,such as �decision performance criteria� or�project quality objectives� for DQOs and�measurement performance criteria� or �dataquality requirements� for MQOs.
Contents
2.1 Introduction . . . . . . . . . . . . . . . . . . . . . . . . . . 2-12.2 The Importance of Directed Project Planning 2-22.3 Directed Project Planning Processes . . . . . . . 2-32.4 The Project Planning Team . . . . . . . . . . . . . . 2-62.5 Directed Planning Process and Role of the
Radioanalytical Specialists . . . . . . . . . . . . . . 2-82.6 Results of the Directed Planning Process . . 2-172.7 Project Planning and Project Implementation and
Assessment . . . . . . . . . . . . . . . . . . . . . . . . . 2-192.8 Summary of Recommendations . . . . . . . . . . 2-222.9 References . . . . . . . . . . . . . . . . . . . . . . . . . . 2-23
Project Planning Process
2-2MARLAP JULY 2004
Section 2.2 discusses the importance of directed project planning. The approach, guidance, andcommon elements of directed planning are discussed in Section 2.3. The project planning team isaddressed in Section 2.4, Section 2.5 describes the elements of project planning from theperspective of the radioanalytical specialists. The results of the planning process are discussed inSection 2.6. Section 2.7 presents the next steps of the planning phase of the project, whichdocument the results of the planning process and link the results of the planning process to theimplementation and assessment phases of data collection activities. Additional discussion on theplanning process in Chapter 3, Key Analytical Planning Issues and Developing AnalyticalProtocol Specifications, focuses on project planning from the perspective of the analyticalprocess and the development of Analytical Protocol Specifications (APSs).
The environmental data collection process consists of a series of elements: planning, developing,and updating project plan documents; contracting for services; sampling; analysis; dataverification; data validation; and data quality assessment (see Section 1.4.1, �Data Life Cycle�).These elements are interrelated because sampling and analysis cannot be performed efficiently orresources allocated effectively without first identifying data needs during planning. Linkage andintegration of the data collection process elements are essential to the success of theenvironmental data collection activity.
2.2 The Importance of Directed Project Planning
A directed planning process has several notable strengths. It brings together the stakeholders (seebox), decisionmakers, and technical experts at the beginning of the project to obtain commitmentfor the project and a consensus on the nature of the problem and the desired decision. MARLAPrecognizes the need for a directed planning process that involves radioanalytical and othertechnical experts as principals to ensure the decisionmakers� data requirements and the resultsfrom the field and radioanalytical laboratory are linked effectively. Directed planning enableseach participant to play a constructive role in clearly defining:
� The problem that requires resolution; � What type, quantity, and quality of data the decisionmaker needs to resolve that problem; � Why the decisionmaker needs that type and quality of data; � What are the tolerable decision error rates; and � How the decisionmaker will use the data to make a defensible decision.
A directed planning process encourages efficient planning by framing and organizing complexissues. The process promotes timely, open, and effective communication among the stakeholders,resulting in well-conceived and documented plans. Because of the emphasis on documentation,directed planning also provides project management with a more efficient and consistent transferof knowledge to new project members.

Project Planning Process
2-3JULY 2004 MARLAP
Example of Stakeholders for a Cleanup Project
A stakeholder is anyone with an interest in the outcome of an activity. For a cleanup project,some of the stakeholders could be:
� Federal, regional, state, and tribal environmental agencies with regulatory interests (e.g.,NRC and EPA).
� States with direct interest in transportation, storage and disposition of wastes, and otherrelated issues.
� City and county governments concerned with the operations and safety at sites as well aseconomic development and site transition.
� Site Advisory Boards, citizens groups, licensees, special interest groups, responsibleparties, and other members of the public with interest in cleanup activities at the site.
A directed planning process focuses on collection of only those data needed to address theappropriate questions and support defensible decisions. Directed planning helps to eliminate pooror inadequate sampling and analysis designs that require analysis of (1) too few or too manysamples, (2) samples that will not meet the needs of the project, or (3) inappropriate qualitycontrol (QC) samples. During directed planning, which is an iterative process, the sufficiency ofexisting data is evaluated, and the need for additional data to fill the gaps, as well as the desiredquality of the additional data, are determined. By defining the MQOs, directed planning providesinput for obtaining appropriate radioanalytical services, which balance constraints and therequired data quality.
The time invested in preliminary planning can greatly reduce resource expenditure in the moreresource-intensive execution phase of the project. Less overall time (and money) is expendedwhen early efforts are focused on defining (and documenting) the project�s objectives (DQOs),technically based, project-specific analytical data needs (MQOs and any specific analyticalprocess requirements), and measures of performance for the assessment phase of the datacollection activity.
2.3 Directed Project Planning Processes
The recognition of the importance of project planning has resulted in the development of avariety of directed planning approaches. MARLAP does not endorse any one planning approach.Users of this manual are encouraged to consider the available approaches and choose a directedplanning process that is appropriate to their project and agency. Appendix A, Directed PlanningApproaches, provides brief descriptions of several directed planning processes.
Project Planning Process
2-4MARLAP JULY 2004
Section 2.3.1 discusses a graded approach to project planning, and existing standards andguidance are briefly summarized in Section 2.3.2. An overview of common elements of projectplanning is discussed in Section 2.3.3. The elements of project planning are discussed in detail inSection 2.5.
2.3.1 A Graded Approach to Project Planning
The sophistication, the level of QC and oversight, and the resources invested should be approp-riate to the project (i.e., a �graded approach�). Directed planning for small or less complexprojects follows the logic of the process but will proceed faster and involve fewer people. Thegoal still is to (1) plan properly to collect only the data needed to meet the objectives of theproject and (2) establish the measures of performance for the implementation and assessmentphases of the data life cycle of the project.
2.3.2 Guidance on Directed Planning Processes
The following national standards related to directed project planning for environmental datacollection are available:
� Standard Practice for Generation of Environmental Data Related to Waste ManagementActivities: Development of Data Quality Objectives (ASTM D5792), which addresses theprocess of development of data quality objectives for the acquisition of environmental data.This standard describes the DQO process in detail.
� Standard Provisional Guide for Expedited Site Characterization of Hazardous WasteContaminated Sites (ASTM PS85), which describes the Expedited Site Characterization(ESC) process used to identify all relevant contaminant migration pathways and determinethe distribution, concentration and fate of the contaminants for the purpose of evaluating risk,determining regulatory compliance, and designing remediation systems.
� Standard Guide for Site Characterization for Environmental Purposes with Emphasis onSoil, Rock, the Vadose Zone and Ground Water (ASTM D5730), which covers a generalapproach to planning field investigations using the process of defining one or moreconceptual site models that is useful for any type of environmental reconnaissance orinvestigation plan with a primary focus on the surface and subsurface environment.
� Standard Guide for Quality Planning and Field Implementation of a Water QualityMeasurements Program (ASTM D5612), which defines criteria and identifies activities thatmay be required based on the DQOs.
� Standard Guide for Planning and Implementing a Water Monitoring Program (ASTMD5851), which provides a procedural flowchart for planning the monitoring of point and non-

Project Planning Process
2-5JULY 2004 MARLAP
point sources of pollution of water resources (surface or ground water, rivers, lakes orestuaries).
Several directed planning approaches have been implemented by the federal sector forenvironmental data collection activities. MARLAP does not endorse a single planning approachand project planners should be cognizant of their agency�s requirements for planning. Thefollowing guidance is available:
� EPA developed the DQO process (EPA, 2000a) and has tailored DQO process guidance forspecific programmatic needs of project planning under the Comprehensive EnvironmentalResponse, Compensation, and Liability Act of 1980 (CERCLA/Superfund) (EPA, 1993) andfor site-specific remedial investigation feasibility study activities (EPA, 2000b).
� The U. S. Army Corps of Engineers Technical Project Planning (TPP) Process (USACE,1998) was developed for technical projects planning for hazardous, toxic and radioactivewaste sites.
� DOE has developed the Streamlined Approach for Environmental Restoration (SAFER)(DOE, 1993) for its environmental restoration activities.
� Planning guidance, including decision frameworks, for projects demonstrating compliancewith a dose- or risk-based regulation is available for final status radiological surveys(MARSSIM, 2000) and radiological criteria for license termination (NRC, 1998a; NRC,1998b).
Additional information on the DQO process (ASTM D5792; EPA, 2000a) is presented inAppendix B, The Data Quality Objectives Process.
2.3.3 Elements of Directed Planning Processes
Environmental data collection activities require planning for the use of data in decisionmaking.The various directed planning approaches, when applied to environmental data collectionactivities, address common planning considerations. Some common elements of the planningprocesses are:
1. State the problem: Describe clearly the problem(s) facing the stakeholder or customer.
2. Identify the Decision: Define the decision(s) or the alternative actions that will address theproblem(s) or concern and satisfy the stakeholder/customer, and define the inputs andboundaries to the decision.

Project Planning Process
2-6MARLAP JULY 2004
3. Specify the Decision Rule and the Tolerable Decision Error Rates: Develop a decision rule toget from the problem or concern to the desired decision and define the limits on the decisionerror rates that are acceptable to the stakeholder/customer. The decision rule can take theform of �if ...then...� statements for choosing among decisions or alternative actions.
4. Optimize the Strategy for Obtaining Data: Determine the optimum, cost-effective way toreach the decision while satisfying the desired quality of the decision. Define the quality ofthe data that are required for the decision by establishing specific, quantitative and qualitativeanalytical performance measures (e.g, MQOs). Define the process and criteria to evaluate thesuitability of the data to support their intended use (data quality assessment).
The objective of the directed project planning process for environmental data collection activitiesis to reach consensus among the stakeholders on defining the problem, the full range of possiblesolutions, the desired decision, the optimal data collection strategy, and performance measuresfor implementation and assessment phases of the project. If only a cursory job is done definingthe problem or the desired results, the consequence will be the development of a design that maybe technically sound but answers the wrong question, may answer the question only after thecollection of significant quantities of unnecessary data, or may collect insufficient data to answerthe question.
The key outputs of the directed planning process are DQOs: qualitative and quantitativestatements that define the project objectives and the tolerable decision error rates that will beused as the basis for establishing the quality and quantity of data needed to support the decision.The MQOs and the decisions on key analytical planning issues will provide the framework forAnalytical Protocol Specifications. The MQOs and the tolerable decision error rates will providethe basis for the data assessment phase (data validation and data quality assessment). Importantanalytical planning issues and APSs are discussed in Chapter 3, Key Analytical Planning Issuesand Developing Analytical Protocol Specifications.
2.4 The Project Planning Team
The number of participants in the project planning process, and their respective disciplines, willvary depending on the nature and scope of the project, but in most cases a multidisciplinary teamwill be required. The project planning team should consist of all the parties who have a vestedinterest or can influence the outcome (stakeholders). A key to successful directed planning ofenvironmental projects is getting the data users and data suppliers to work together early in theprocess to understand each other�s needs and requirements, to agree on the desired end product,and to establish lines of communication. Equally important is having integrated teams ofoperational and technical experts. These experts will determine whether the problem has beensufficiently defined and if the desired outcomes are achievable. With the input of technical

Project Planning Process
2-7JULY 2004 MARLAP
experts early in the planning process, efforts are focused on feasible solutions, and resources arenot wasted pursuing unworkable solutions.
2.4.1 Team Representation
Members of the project planning team may include program and project managers, regulators,public representatives, project engineers, health and safety advisors, and specialists in statistics,health physics, chemical analysis, radiochemical analysis, field sampling, quality assurance/quality control (QA/QC), data assessment, contract and data management, field operation, andother technical specialists. The program or project manager(s) may be a remedial project manager(RPM), a site assessment manager (SAM), or a technical project officer (TPO). Some systematicplanning processes, such as Expedited Site Characterization, utilize a core technical teamsupported as needed by members of larger technical and operational teams. Throughout thisdocument, the combined group of decisionmakers and technical experts is referred to as the�project planning team.�
The duration of service for the project planning team members can vary, as can the level ofparticipation required of each member during the various planning phases. While the projectplanning team may not meet as frequently once the project objectives and the sampling andanalysis design have been established, a key point to recognize is that the project planning teamshould not disband. Rather, the team or a �core group� of the team (including the projectmanager and other key members) should continue to meet at agreed upon intervals to review theproject�s progress and to deal with actual project conditions that require changes to the originalplan. The availability of a core team also provides the mechanism for the radioanalyticallaboratory to receive needed information to clarify questions as they arise.
A key concept built into directed planning approaches is the ability to revisit previous decisionsafter the initial planning is completed (i.e., during the implementation phases of the environmen-tal data collection process). Even when objectives are clearly established by the project planningteam and contingency planning was included in the plan development, the next phases of theproject may uncover new information or situations, which require alterations to the datacollection strategy. For example, finding significantly different levels of analytes or differentanalytes than were anticipated based on existing information may require changes in the process.To respond to unexpected events, the project planning team (or the core group) should remainaccessible during other phases of the data collection process to respond to questions raised,revisit and revise project requirements as necessary, and communicate the basis for previousassumptions.
2.4.2 The Radioanalytical Specialists
Depending on the size and complexity of the project, MARLAP recognizes that a number of keytechnical experts should participate on the project planning team and be involved throughout the

Project Planning Process
2-8MARLAP JULY 2004
project as needed. When the problem or concern involves radioactive analytes, it is importantthat the radioanalytical specialist(s) are part of the project planning team, in addition to radiationhealth and safety specialists. MARLAP recommends that the radioanalytical specialists be a partof the integrated effort of the project planning team. Throughout this manual, the term �radio-analytical specialists� is used to refer to the radioanalytical expertise needed.
Radioanalytical specialists may provide expertise in (1) radiochemistry and radiation/nuclidemeasurement systems and (2) the knowledge of the chemical characteristics of the analyte ofconcern. In particular, the radioanalytical specialist plays a key role in the development ofMQOs. The radioanalytical specialists may also provide knowledge about sample transportationissues, preparation, preservation, sample size, subsampling, available analytical protocols andachievable analytical data quality. If more than one person is needed, the specialists membersneed not be from the same organization. The radioanalytical specialists need not be from thecontractual radioanalytical laboratory. The participation of the radioanalytical specialists iscritical to the success of the planning process and the effective use of resources available to theproject.
2.5 Directed Planning Process and Role of the Radioanalytical Specialists
The importance of technical input in a directed planning process becomes apparent when oneexamines the common difficulties facing the radioanalytical laboratory. Without sufficient input,there is often a disconnect in translating the project planning team�s analytical data requirementsinto laboratory requirements and products. Radioanalytical advice and input during planning,however, help to assure that the analytical protocols selected will satisfy the data requirements,including consideration of time, cost and relevance to the data requirements and budget. The roleof the radioanalytical specialists during the early stage of the directed planning process is to focuson whether the desired radionuclides can be measured and the practicality of obtaining thedesired analytical data. During the latter part of the process, the radioanalytical specialists canprovide specific direction and fine tuning for defining the analytical performance requirements(MQOs) and other items of the APSs.
Planning with input from radioanalytical specialists can help ensure that the data received by thedata users will meet the project�s DQOs. Common areas that are improved with radioanalyticalspecialists� participation in project planning include:
� The correct radionuclide is measured;
� MQOs are adequately established and achievable;
� Consideration is given to the impact of half-life and parent/progeny factors;
� The data analysis is not compromised by interferences;

Project Planning Process
2-9JULY 2004 MARLAP
� Unnecessary or overly sophisticated analytical techniques are avoided in favor of analyticaltechniques appropriate to the required level of measurement uncertainty;
� Optimum radioanalytical variables, such as count time and sample volume, are considered;
� Environmental background levels are considered;
� Chemical speciation is addressed; and
� Consideration is given to laboratory operations (e.g., turnaround time, resources).
These improvements result in an appropriate data collection design, with specified MQOs andany specific analytical process requirements to be documented in the project plan documents andSOWs.
The following sections, using the common planning elements outlined in Section 2.3.3, willdiscuss the process and results of directed planning in more detail and emphasize the input ofradioanalytical specialists. Table 2.1 provides a summary of (1) the information needed by theproject planning team, (2) how the radioanalytical specialists participate, and (3) the output orproduct for each element of the directed planning process. It must be emphasized that a directedplanning process is an iterative, rather than linear, process. Although the process is presented indiscrete sections, the project planning may not progress in such an orderly fashion. The planningteam will more precisely define decisions and data needs as the planning progresses and use newinformation to modify or change earlier decisions until the planning team has determined themost resource-effective approach to the problem. The common planning elements are used forease of presentation and to delineate what should be covered in planning, not the order ofdiscussion.
TABLE 2.1 � Summary of the directed planning process and radioanalytical specialists participation
Element Information Needed by TheProject Planning Team
Radioanalytical SpecialistsParticipation/Input Output/Product
1. State theproblem
� Key stakeholders and theirconcerns.
� Facts relevant to currentsituation (e.g., site history,ongoing studies).
� Analytes of concern oranalytes driving risk.
� Matrix of concern.� Regulatory requirements
and related issues.� Existing data and its
reliability. � Known sampling
constraints.� Resources and relevant
deadlines.
� Evaluate existing radiologicaldata for use in defining theissues (e.g., analytes of concern).
� Assure that the perceivedproblem is really a concern byreviewing the underlying datathat are the basis for the problemdefinition.
� Consider how resource limita-tions and deadlines will impactmeasurement choices.
� Use existing data to begin todefine the analyte of concern andthe potential range ofconcentrations.
� Problem defined withspecificity.
� Identification of theprimary decisionmaker,the available resources,and constraints.

Project Planning Process
Element Information Needed by TheProject Planning Team
Radioanalytical SpecialistsParticipation/Input Output/Product
2-10MARLAP JULY 2004
2a. Identify thedecision(s)
� Analytical aspects relatedto the decision.
� Possible alternativeactions.
� Sequence and priority foraddressing the problem.
� Provide focus on what analytesneed to be measured,considering analyte relationshipsand background.
� Begin to address the feasibilityof different analytical protocols.
� Begin to identify the items of theAPSs.
� Begin to determine how samplecollection and handling willaffect MQOs.
� Statements that link thedefined problem to theassociated decision(s)and alternative actions.
2b. Identifyinputs tothedecisions
� All useful existing data.� The general basis for
establishing an action level.� Acquisition strategy
options (if new data isneeded).
� Review the quality andsufficiency of the existingradiological data.
� Identify alternate analytes.
� Defined list of needednew data.
� Define the characteristicor parameter of interest(analyte/matrix).
� Define the action level.� Identify estimated
concentration range foranalyte(s) of interest.
2c. Define thedecisionboundaries
� Sampling or measurementtimeframe.
� Sampling areas andboundaries.
� Subpopulations.� Practical constraints on
data collection (season,equipment, turnaroundtime, etc.).
� Available protocols.
� Identify temporal trends andspatial heterogeneity usingexisting data.
� With the sampling specialists,identify practical constraints thatimpact sampling and analysis.
� Determine feasibility ofobtaining new data with currentmethodology.
� Identify limitations of availableprotocols.
� Temporal and spatialboundaries.
� The scale of decision.
3a. Develop adecisionrule
� Statistical parameter todescribe the parameter ofinterest and to be comparedto the action level.
� The action level(quantitative).
� The scale of decision-making.
� Identify potentially usefulmethods.
� Estimate measurementuncertainty and detection limitsof available analytical protocols.
� A logical, sequentialseries of steps(�if...then�) to resolvethe problem.
3b. Specifylimits ondecisionerror rates
� Potential consequences ofmaking wrong decisions.
� Possible range of theparameter of interest.
� Allowable differencesbetween the action leveland the actual value.
� Acceptable level ofdecision errors orconfidence.
� Assess variability in existingdata for decisions on hypothesistesting or statistical decisiontheory.
� Evaluate whether the tolerabledecision error rates can be metwith available laboratoryprotocols, or if the errortolerance needs to be relaxed ornew methods developed.
� Defined baseline con-dition (null hypothesis)and quantitative esti-mates of acceptabledecision error rates.
� Defined range ofpossible parametervalues where theconsequence of a TypeII decision error isrelatively minor (grayregion).

Project Planning Process
Element Information Needed by TheProject Planning Team
Radioanalytical SpecialistsParticipation/Input Output/Product
2-11JULY 2004 MARLAP
4. Optimize thestrategy forobtainingdata
� All outputs from allprevious elementsincluding parameters(analytes and matrix) ofconcern, action levels,anticipated range ofconcentration, tolerabledecision error rates,boundaries, resources andpractical constraints.
� Available protocols forsampling and analysis.
With sampling specialists, considerthe potential combinations ofsampling and analytical methods,in relation to: � Sample preparation,
compositing, subsampling. � Available protocols. � Methods required by regulations
(if any). � Detection and quantitation
capability. � MQOs achievable by method,
matrix and analyte. � QC sample types, frequencies,
and evaluation criteria. � Sample volume, field processing,
preservatives, and containerrequirements.
� Assure that the MQOs forsample analysis are realistic.
� Assure that the parameters forthe APSs are complete.
� Resources and time frame todevelop and validate newmethod(s), if required.
� The most resource-effective sampling andanalysis design thatmeets the establishedconstraints (i.e., numberof samples needed tosatisfy the DQOs andthe tolerable decisionerror rates).
� A method for testing thehypothesis.
� The MQOs and thestatement(s) of theAPSs.
� The process and criteriafor data assessment.
2.5.1 State the Problem
The first and most important step of the project planning process is a clear statement of thefundamental issue to be addressed by the project. Correctly implemented, directed planningensures that a clear definition of the problem is developed before any additional resources arecommitted. The project planning team should understand clearly the conditions or circumstancesthat are causing the problem and the reason for making a decision (e.g., threat to human health orenvironment).
Many projects present a complex interaction of technical, economic and political factors. Theproblem definition should include a summary of the study objectives, regulatory context, fundingand other resources available, relevant deadlines, previous study results, and any obvious datacollection design constraints. By participating in the initial stages of the project planning, theradioanalytical specialists will understand the context of the facts and logic used to state theproblem and begin to formulate information on applicable protocols based on the project�sresources (time and budget).
Existing data (e.g., monitoring data, radioactive materials license, emergency actions, site permitfiles, operating records) may provide specific details about the identity, concentrations, andgeographic, spatial, or temporal distribution of analytes. However, these data should be examined
Project Planning Process
2-12MARLAP JULY 2004
carefully. Conditions may have changed since the data were collected. For example, additionalwaste disposal may have occurred, the contaminant may have been released or migrated, ordecontamination may have been performed. In some cases, a careful review of the historical databy the project planning team will show that a concern is not a problem or the problem can beadequately addressed using the available data.
2.5.2 Identify the Decision
The project planning team will define the decision(s) to be made (or the question the project willattempt to resolve) and the inputs and boundaries to the decision. There may also be multipledecision criteria that have to be met, and each should be clearly defined. For example, thedecision may be for an individual survey area rather than the site as a whole, or a phase of the siteclosure project (scoping, characterization, cleanup operation, or final status survey) rather thanthe project as a whole because of the different objectives and data requirements.
The decision should be clear and unambiguous. It may be useful to state specifically whatconclusions may and may not be drawn from the data. If the study is to be designed, for example,to investigate whether or not a site may be released for use by the general public, then the projectplanning team may want to specifically exclude other possible uses for the data.
The project planning team also should determine possible alternative actions that may be taken.Consideration should be given to the option of taking no action, as this option is frequentlyoverlooked but still may be the optimal course of action (e.g., no technology available, too costly,relocation will create problems). After examining the alternative actions, the project planningteam should develop a decision statement that expresses a choice among alternative actions.
During these discussions of the directed planning process, the role of the radioanalyticalspecialists is to ensure that the analytical aspects of the project have been clearly defined andincorporated into the decision(s). The radioanalytical specialists focus on defining: (1) theparameter (analyte/matrix) of interest; (2) what analytical information could resolve the problem;and (3) the practicality of obtaining the desired field and laboratory data. Sections 3.3.1 through3.3.7 in Chapter 3 discuss in more detail the analytical aspects of the decision (or question) anddetermining the characteristic or parameter of concern. This information is incorporated into theAPS.
2.5.2.1 Define the Action Level
The term �action level� is used in this document to mean the numerical value that will cause thedecisionmaker to choose one of the alternative actions. The action level may be a derivedconcentration guideline level (see below), background level, release criterion, regulatory decisionlimit, etc. The action level is often associated with the type of medium, analyte and concentrationlimit.

Project Planning Process
2-13JULY 2004 MARLAP
Some action levels, such as the release criteria for license termination, are expressed in terms ofdose or risk. The release criterion is typically based on the total effective dose equivalent(TEDE), the committed effective dose equivalent (CEDE), risk of cancer incidence (morbidity)or risk of cancer death (mortality) and generally cannot be measured directly. For example, in sitecleanup, a radionuclide-specific predicted concentration or surface area concentration of specificnuclides that can result in a dose (TEDE or CEDE) or specific risk equal to the release criterionis called the �derived concentration guideline level� (DCGL). A direct comparison can be madebetween the project�s analytical measurements and the DCGL (MARSSIM, 2000). For drinkingwater analysis, an example of an action level would be a radionuclide-specific concentrationbased on the Maximum Contaminant Level (MCL) under the Safe Drinking Water Act (42U.S.C. §300f-300j-26).
2.5.2.2 Identify Inputs to the Decision
The project planning team should determine the specific information required for decisionmakingand this should include a list of the specific data requirements (e.g., number, type, quality). Thestatistical parameter (e.g., mean concentration) that will be used in the comparison to the actionlevel should be established. An estimate of the expected variability of the data will be needed inorder to specify controls on decision-error rates. Existing data, experience and scientific judg-ment can be used to establish the estimate. Information on environmental background levels andvariability may be needed.
The project planning team establishes whether the existing data are sufficient or whether newdata are needed to resolve the problem. The radioanalytical specialist can play a key role in thiseffort by evaluating the quality of the existing radiological data.
2.5.2.3 Define the Decision Boundaries
The project planning team should clearly define the spatial boundaries for the project as well asthe time frame for collecting data and making the decision. The spatial boundaries define thephysical area to be studied and generally where samples will be collected. Temporal boundariesdescribe the time frame the study data will represent and when samples should be taken. Anypractical constraints that could interfere with sampling should also be identified since theseconstraints may limit the spatial and/or temporal boundaries of the study.
During these discussions, the radioanalytical specialist can:
� Review existing data for spatial and temporal trends; � Identify practical constraints that can impact sampling and analysis; and � Determine feasibility of obtaining new data with current analytical methodologies.
Project Planning Process
2-14MARLAP JULY 2004
2.5.2.4 Define the Scale of the Decision
The project planning team should clearly define the scale of the decision. The scale of thedecision should be the smallest, most appropriate subset of the population for which decisionswill be made, based on spatial or temporal boundaries. For example, at a remediation site, asurvey unit is generally formed by grouping contiguous site areas with a similar use history andthe same classification of potential concentration of the analyte of interest. The survey unit willbe defined with a specified size and shape for which a separate decision will be made as towhether the unit attains the site-specific reference-based cleanup standard for the designatedanalyte of interest (MARSSIM, 2000; NRC, 1998c).
The survey unit is established to delineate areas or volumes of similar composition and historyfor which a single decision can be made based on the statistical analysis of the data. The varia-bility in the measurement data for a survey unit is a combination of the imprecision of themeasurement process and the real spatial and temporal variability of the analyte concentration. Ifthe measurement data include a background contribution, the spatial variability of thebackground adds to the overall measurement variability.
2.5.3 Specify the Decision Rule and the Tolerable Decision Error Rates
A decision statement or rule is developed by combining the decisions and the alternative actions(see Appendix B, The Data Quality Objectives Process). The decision rule presents the strategyor logical basis for choosing among the alternative decisions, generally by use of a series of�if...then� statements. For a complex problem, it may be helpful to develop a logic flow diagram(also called a �decision tree� or�decision framework�), arraying eachelement of the issue in its propersequence along with the possibleactions. The decision rule identifies (1)the action level that will be a basis fordecision, (2) the statistical parameterthat is to be compared to the actionlevel, and (3) the decision that wouldbe made and the action that would betaken.
The radioanalytical specialists play a key role in the development of technical alternatives thatare realistic and satisfy the programmatic and regulatory needs. (See Chapter 3, Key AnalyticalPlanning Issues and Developing Analytical Protocol Specifications, for additional discussion onbackground.)
For each proposed alternative technical action, the radioanalytical specialists can:
Example of a Decision Rule
General form: �If the value of parameter A over the areaB, is greater than C, then take action D, otherwise takeaction D*.�
Example: �If the mean concentration of x in the upper ycm of surface soil of the site is greater than z Bq/g, thenaction will be taken to remove the soil from the site;otherwise, the soil will be left in place.�

Project Planning Process
2-15JULY 2004 MARLAP
� Focus the project planning team on what radionuclides will need to be measured and whattypes of analytical techniques are available;
� Address whether it is feasible to obtain the necessary analytical results;
� Present the technical limitations (i.e., the minimum detectable concentrations�MDCs) ofavailable measurement systems; and
� Address how sample collection and handling will affect what measurement techniques can beused.
The project planning team also assesses the potential consequences of making a wrong decision.While the possibility of a decision error can never be totally eliminated, it can be controlled. Thepotential consequences of a decision error are used to establish tolerable limits on the probabilitythat the data will mislead the decisionmaker into making an incorrect decision. (See Appendix B,The Data Quality Objectives Process, for a discussion of hypothesis testing, action levels, anddecision errors). The decision rule and decisionmaker�s limits on the decision error rates are usedto establish performance criteria for a data collection design.
In choosing the tolerable decision error rates, the team needs to look at alternative measurementapproaches, the sources of error in field and laboratory handling of samples and analysis, factorsthat would influence the likelihood of a decision error, estimates of the cost of analysis, andjudicious use of resources. Realistic decision error rates should be determined during theplanning process in order to develop and optimize the sampling and analysis design process.
2.5.4 Optimize the Strategy for Obtaining Data
During the process of developing and optimizing the sampling and analysis plans, the technicalteam members should determine the project-specific sampling and analytical requirements andassociated quality control that will meet all the requirements (desired outputs) established by theproject planning team. Optimizing the data collection design generally requires extensivecoordination between the radioanalytical and sampling specialists on the planning team. Thetechnical team may not know the most effective analytical protocols at this stage.
Typical considerations during the development of the analysis portion of the data collectiondesign include the number of samples required and the APSs, which include the MQOs (e.g., astatement of the required method uncertainty) required of the analytical procedures (see Sections2.5.4.1 and 2.5.4.2). In general, the more certainty required in the DQOs, the greater the numberof samples or the more precise and unbiased the measurements need to be. During planning, thecosts and time for field and analytical procedures must be balanced against the level of certaintythat is needed to arrive at an acceptable decision.
Project Planning Process
2-16MARLAP JULY 2004
The radioanalytical specialists are involved in evaluating the technical options and their effect onthe sources of decision error, their resource requirements and the ability to meet the project�sobjectives. The radioanalytical specialists can identify an array of potential analytical methods,which can be combined in analytical protocols to meet the defined data needs and MQOs.Working with the sampling specialists, potential sampling methods are identified based on thesample requirements of the potential analytical protocols and other sampling constraints. Theplanning team specialists need to consider sources of bias and imprecision that will impact therepresentativeness of the samples and the accuracy of the data collected. Appropriate combina-tions of sampling methods, analytical protocols and sampling constraints can then be assessedwith regard to resource effectiveness.
It may be useful at this point for the project planning team to perform a sensitivity analysis on theinput parameters that contribute to the final analytical result. The final analytical result directlyimpacts the decision, so this sensitivity analysis will allow the project planning team to identifythe portions of the analytical protocols that potentially have the most impact on the decision.Once identified, these portions of the analytical protocols can be targeted to receive a propor-tionally larger share of the resources available for developing the protocols.
2.5.4.1 Analytical Protocol Specifications
Requirements of the desired analytical protocols should be based on the intended use of the data.That is, project-specific critical parameters should be considered, including the type ofradioactivity and the nuclides of concern, the anticipated range of concentrations, the matrix typeand complexity, regulatory required methods, the measurement uncertainty required at someactivity concentration, detection limits required, necessary chemical separation, qualification orquantification requirements, QC requirements, and turnaround time needed. MQOs are a keycomponent of the APSs and are discussed on the next page. Chapter 3, Key Analytical PlanningIssues and Developing Analytical Protocol Specifications, contains more detailed discussion onsome of the key decisions and needed input to successfully optimize the sampling and analysisdesign and develop APSs. Chapter 6, Selection and Application of an Analytical Method,discusses the selection of an analytical protocol from the laboratory�s perspective.
The project planning team should ensure that there are analytical methods available to provideacceptable measurements. If analytical methods do not exist, the project planning team will needto consider the resources needed to develop a new method, reconsider the approach for providinginput data, or perhaps reformulate the decision statement.
2.5.4.2 Measurement Quality Objectives
When additional data are to be obtained, the project planning process should establish measuresof performance for the analysis (MQOs) and evaluation of the data. Without these measures ofperformance, data assessment is difficult and arbitrary.
Project Planning Process
2-17JULY 2004 MARLAP
A MQO is a statement of a performance objective or requirement for a particular methodperformance characteristic, such as the required method uncertainty at some concentration.MQOs can be both quantitative and qualitative performance objectives. Quantitative andqualitative MQOs are used for real-time compliance monitoring by field and laboratory staff andduring subsequent assessments and data usability determinations. Quantitative MQOs providenumerical criteria for field and laboratory QC samples or procedure performance (e.g.,specifications for measurement uncertainty, detection limit, yield, spikes, blanks and duplicates).Precision, bias, completeness, and sensitivity are common data quality indicators for whichquantitative MQOs could be developed during the planning process (ANSI/ASQC E-4). Thus,quantitative MQOs are statements that contain specific units of measure, such as: x percentrecovery, x percent relative standard uncertainty, a standard deviation of x Bq/L, or a MDC of xBq/g. The specificity of the MQOs allows specific comparisons of the data to an MQO. Chapter3, Key Analytical Planning Issues and Developing Analytical Protocol Specifications, providesdetailed guidance on developing MQOs for several method performance characteristics.
The MQOs for the analytical data should be documented in the project plan documents (e.g., theQA Project Plan). MQOs are also the basis for the data verification and validation criteria (seeAppendix D, Section D2.7, for a discussion of MQOs and QA project plans).
2.6 Results of the Directed Planning Process
By the end of the directed planning process, the project planning team has established its priorityof concerns, the definition of the problem, the decision(s) or outcome to address the posedproblem, the inputs and boundaries to the decision(s), and the tolerable decision error rates. It hasalso agreed on decision rules that incorporate all this information into a logic statement aboutwhat must be done to obtain the desired answer. The key output of the planning process is theDQOs: qualitative and quantitative statements that clarify study objectives, define the appropriatetype of data, and specify the tolerable rate of making decision errors that will be used as the basisfor establishing the quantity and quality of data needed to support the decisions and the criteriafor data assessment.
If new data are required, then the project planning team has defined the desired analytical qualityof the data (MQOs). That is, the project planning team has determined the type, quantity, andquality of data needed to support a decision. The directed planning process has clearly linkedsampling and analysis efforts to a decision and an action level. This linkage allows the projectplanning team to determine when enough data have been collected.
If new data are to be obtained, the project planning team has developed the most resource-effective sampling and analysis design that will provide adequate data for decisionmaking. Basedon the DQOs, the project planning team specifies the sampling collection design and APSs,including:

Project Planning Process
2-18MARLAP JULY 2004
� The type and quantity of samples to be collected; � Where, when, and under what conditions they should be collected; � What radionuclides are to be measured; and � The MQOs to ensure that the analytical errors are controlled sufficiently to meet the tolerable
decision error rates specified in the DQOs.
2.6.1 Output Required by the Radioanalytical Laboratory: The Analytical ProtocolSpecifications
As a result of directed planning, the description of the DQOs for the project and the APSs (whichcontain the MQOs and any specific analytical process requirements for additional data) willprovide the radioanalytical laboratory with a clear and definitive description of the desired data,as well as the purpose and use of the data. This information will be provided to the projectimplementation team through the SOW and the project plan documents. Precise statements ofanalytical needs may prevent the radioanalytical laboratory from:
� Having to make a �best guess� as to what data are really required; � Using the least costly or most routine protocol, which may not meet the needed data quality; � Independently developing solutions for unresolved issues without direction from the project
planning team; and � Having �moving targets� and �scope creep� that stem from ambiguous statements of work.
The output of the planning process, from the perspective of the radioanalytical laboratory, is theAPSs. The APSs should contain the minimum level of specificity required to meet the projectdata requirements. In accordance with a performance based measurement approach the laboratorywill use this information to select or develop (specific) analytical protocols that will meet theMQOs. The APSs should present the resolution of the project planning team on both generalissues and matrix-specific issues. Chapter 3, Key Analytical Planning Issues and DevelopingAnalytical Protocol Specifications, addresses some of the common radioanalytical planningissues.
The APSs should include, but not be limited to:
� The radionuclide(s) of concern; � The matrix of concern, with information on chemical, explosive and other hazardous
components; � The anticipated concentration range (estimate, maximum or detection capability); � The MQOs desired for the radionuclides of concern; � The sample preparation and preservation requirements (laboratory and field); � The type and frequency of QC samples required of each radionuclide of concern; � The sample transport, tracking, and custody requirements;

Project Planning Process
2-19JULY 2004 MARLAP
� The required analytical turnaround time for the project and the anticipated budget for theanalysis; and
� The data reporting requirements.
2.6.2 Chain of Custody
Requirements for formal chain of custody (COC) should be specified in the APSs if required.COC procedures provide the means to trace possession and handling of the sample fromcollection to data reporting. COC will impact how the field and laboratory personnel handle thesample. COC is discussed in Chapter 10 (Field and Sampling Issues that Affect LaboratoryMeasurements) and Chapter 11 (Sample Receipt, Inspection, and Tracking).
2.7 Project Planning and Project Implementation and Assessment
A directed planning process generally is considered complete with the approval of an optimaldata collection design approach or when historical data are deemed sufficient to support thedesired decision. However to complete the process, the project planning team clearly shoulddocument the results of the planning process and link DQOs and MQOs to the implementationand assessment processes. The directed planning process is the first activity in the project�splanning phase (see Figure 1.1, �The Data Life Cycle�). The planning process outputs are keyinputs to the implementation and assessment processes of the data collection activities. That is,the outputs of the directed planning process are the starting point for developing plan documents,obtaining analytical services, selecting specific analytical protocols and assessing the datacollected. This section will provide an overview of the next steps of the planning phase and thelinkage to the implementation and assessment phases and to other Part I chapters in MARLAP.
2.7.1 Documenting the Planning Process
A concept inherent in directed planning approaches is the establishment of a formal process todocument both the decisions and supporting logic established by the team during the projectplanning process. Establishing this documentation process is not only good management practice,but also tends to prevent situations where new team members recreate the past logic for activitiesbeing performed upon the departure of their predecessors. As actual field conditions or othersituations force changes to the original plans, the documentation can then be updated through achange control process to continue to maintain the technically defensible basis for the actionsbeing taken.
When properly documented, the directed planning process:
� Provides a background narrative of the project; � Defines the necessary input needed (nuclides, matrices, estimate of concentration range, etc.);
Project Planning Process
2-20MARLAP JULY 2004
� Defines the constraints and boundaries within which the project would have to operate; � Defines the decision rule, which states the action level that will be the basis for the decision
and the statistical parameter that is to be compared to the action level; � Identifies the tolerable decision error rates; � Identifies MQOs for new analytical data; and � Identifies processes and criteria for evaluating the usability of the data.
The results of the project planning process are also needed for the development of project plandocuments required for implementing the sampling and analysis activities. These project plandocuments may include a quality assurance project plan (QAPP), work plan, or sampling andanalysis plan (SAP). The format and title of plan documents are usually a function of theauthoring organization�s experience, the controlling federal or state regulations, or the controllingagency. Project plan documents are discussed in Chapter 4, Project Plan Documents, and inAppendix D, Content of Project Plan Documents. The project plan documents will rely on theplanning process outputs, including the MQOs, to describe in comprehensive detail the necessaryQA, QC, and other technical activities that must be implemented to ensure that the results of thework performed will satisfy the stated DQOs. The project plan documents should also documentthe processes and criteria developed for data assessment. MARLAP recommends that theplanning process rationale is documented and the documentation integrated with the project plandocuments. Documentation of the planning process can be incorporated directly in the projectplan documents or through citation to a separate report on the planning process.
2.7.2 Obtaining Analytical Services
If laboratory services are required, a SOW should be developed based on the planning processstatements of required data and data quality. The SOW is the contractual agreement thatdescribes the project scope and requirements (i.e., what work is to be accomplished). MARLAPrecommends that a SOW be developed even if a contract is not involved, for example when anagency employs one of its own laboratories. Contracting laboratory services is discussed inChapter 5, Obtaining Laboratory Services, and Chapter 7, Evaluating Methods andLaboratories. Developing a SOW is discussed in Chapter 5.
2.7.3 Selecting Analytical Protocols
From an analytical perspective, one of the most important functions of a directed planningprocess is the identification and resolution of key analytical planning issues for a project. A keyanalytical planning issue may be defined as one that has the potential to be a significant contribu-tor of uncertainty to the analytical process and ultimately the resulting data. Identifying keyanalytical issues for a particular process requires a clear understanding of the analytical process.It is the role of the radioanalytical specialist on the project planning team to ensure that keyanalytical planning issues have been clearly defined and articulated and incorporated into the

Project Planning Process
2-21JULY 2004 MARLAP
principal decision or principal study question. Chapter 3 discusses the key analytical planningissues.
The selection of radioanalytical protocols by the laboratory is made in response to the APSs (foreach analyte/matrix) developed by the project planning team as documented in the SOW. Unlessrequired by regulatory policy, rarely will a radioanalytical method be specifically stated. Anumber of radioanalytical methods are available but no one method provides a general solution;all have advantages and disadvantages. The selection of a method involves a broad range ofconsiderations, including analyte and matrix characteristics; technical complexity and practi-cality; quality requirements; availability of equipment, facility, and staff resources; regulatoryand economic considerations; and previous use of the method. Chapter 6 discusses the selectionof an analytical method as well as the modification of an existing analytical method to meetproject requirements.
2.7.4 Assessment Plans
Concurrent with the development of MQOs and other specifications of the optimized analyticaldesign, is the development of the data assessment plans. Data assessment is difficult andarbitrary when attempted at the end of the project without planning and well defined, projectspecific criteria. The development of these plans during the project planning process shouldensure that the appropriate documentation will be available for assessment and that thoseimplementing and assessing data will be aware of how the data will be assessed. Assessment ofenvironmental data consists of three separate and identifiable phases: data verification, datavalidation, and data quality assessment (DQA). Verification and validation pertain to evaluationof analytical data generated by the laboratory. DQA considers all sampling, analytical, and datahandling details, and other historical project data when determining the usability of data in thecontext of the decisions to be made. The focus of verification and validation is on the analyticalprocess and a data point by data point review, while DQA considers the data set as a whole,including the sampling and analytical protocols used to produce them. Verification, validation,and DQA assure the technical strengths and weaknesses of the overall project data are known,and therefore, establishes the technical defensibility of the data.
2.7.4.1 Data Verification
The data verification process should be defined during the project planning process anddocumented in a data verification plan or the project plan documents (e.g., the QAPP). Theverification plan should specify the types of documentation needed for verification. Analyticaldata verification assures that laboratory conditions and operations were compliant with the SOWand project plan (i.e., SAP or QAPP). The contract for analytical services and the project plandetermine the procedures the laboratory must use to produce data of acceptable quality (asprescribed by the MQOs) and the content of the analytical data package. Verification comparesthe material delivered by the laboratory to these requirements and checks for consistency of the
Project Planning Process
2-22MARLAP JULY 2004
data throughout the data package, correctness of calculations, and completeness of the results toensure all documentation is available. Compliance, exceptions, missing documentation and theresulting inability to verify compliance must be recorded in the data verification report. Dataverification is discussed in more detail in Chapter 8, Radiological Data Verification andValidation.
2.7.4.2 Data Validation
Performance objectives and criteria for data validation should be developed during the projectplanning process and documented in a separate plan or included in the project plan documents(e.g., QAPP). Guidance on Data Validation Plans is provided in Chapter 8. After the data arecollected, data validation activities will rely on the MQOs and other requirements of the APSs toconfirm whether the obtained data meet the requirements of the project.
2.7.4.3 Data Quality Assessment
The DQA process evaluates whether the quality and quantity of data will support their intendeduse. The DQA process determines whether the data meet the assumptions under which the DQOsand the data collection design were developed and whether the analytical uncertainty in the datawill allow the decisionmaker to use the data to support the decision within the tolerable decisionerror rates established during the directed planning process. Guidance on the DQA process andplan development is provided in Chapter 9, Data Quality Assessment. The process and criteria tobe used for the DQA process should be developed by the project planning team and documentedin the project plan documents or in a stand alone plan that is cited or appended to the project plandocuments.
2.8 Summary of Recommendations
� MARLAP recommends the use of a directed project planning process.
� MARLAP recommends that the radioanalytical specialists be a part of the integrated effort ofthe project planning team.
� MARLAP recommends that the planning process rationale be documented and thedocumentation integrated with the project plan documents.
� MARLAP recommends using a graded approach in which the sophistication, level of QC andoversight, and resources applied are appropriate to the project.
Project Planning Process
2-23JULY 2004 MARLAP
2.9 References
American Society for Quality Control (ANSI/ASQC) E-4. Specifications and Guidelines forQuality Systems for Environmental Data Collection and Environmental TechnologyPrograms. 1995. American Society for Quality Control, Milwaukee, Wisconsin.
American Society for Testing and Materials (ASTM) D5612. Standard Guide for QualityPlanning and Field Implementation of a Water Quality Measurements Program, 1994. WestConshohocken, PA.
American Society for Testing and Materials (ASTM) D5730. Standard Guide for SiteCharacterization for Environmental Purposes with Emphasis on Soil, Rock, the Vadose Zoneand Ground Water, 1996. West Conshohocken, PA.
American Society for Testing and Materials (ASTM) D5792. Standard Practice for Generationof Environmental Data Related to Waste Management Activities: Development of DataQuality Objectives, 1995. West Conshohocken, PA.
American Society for Testing and Materials (ASTM) D5851. Standard Guide for Planning andImplementing a Water Monitoring Program, 1995. West Conshohocken, PA.
American Society for Testing and Materials (ASTM) PS85. Standard Provisional Guidance forExpedited Site Characterization of Hazardous Waste Contaminated Sites, 1996. WestConshohocken, PA.
U.S. Army Corps of Engineers (USACE). 1998. Technical Project Planning (TPP) Process.Engineer Manual EM-200-1-2.
U.S. Department of Energy (DOE). December 1993. Remedial Investigation/Feasibility Study(RI/FS) Process, Elements and Techniques Guidance, Module 7 Streamlined Approach forEnvironmental Restoration, Office of Environmental Guidance, RCRA/CERCLA Divisionand Office of Program Support, Regulatory Compliance Division Report DOE/EH-94007658.
U.S. Environmental Protection Agency (EPA). September 1993. Data Quality Objective Processfor Superfund: Interim Final Guidance. EPA/540/G-93/071, Washington, DC.
U.S. Environmental Protection Agency (EPA). 2000a. Guidance for the Data Quality ObjectiveProcess (EPA QA/G-4). EPA/600/R-96/055, Washington, DC. Available at www.epa.gov/quality1/qa_docs.html.

Project Planning Process
2-24MARLAP JULY 2004
U.S. Environmental Protection Agency (EPA). 2000b. Data Quality Objectives Process forHazardous Waste Site Investigations (Quality Assurance/G-4HW), EPA 600/R-00/007,Washington, DC. Available at: http://www.epa.gov/quality1/qa_docs.html.
MARSSIM. 2000. Multi-Agency Radiation Survey and Site Investigation Manual, Revision 1.NUREG-1575 Rev 1, EPA 402-R-97-016 Rev1, DOE/EH-0624 Rev1. August. Available atwww.epa.gov/radiation/marssim/.
U.S. Nuclear Regulatory Commission (NRC). 1998a. Decision Methods for Dose Assessment toComply with Radiological Criteria for License Termination. NUREG-1549 (Draft).
U.S. Nuclear Regulatory Commission (NRC). 1998b. Demonstrating Compliance with theRadiological Criteria for License Termination. Regulatory Guide DG-4006.
U.S. Nuclear Regulatory Commission (NRC). 1998c. A Nonparametric Statistical Methodologyfor the Design and Analysis of Final Status Decommissioning Surveys. NUREG-1505, Rev.1.

3-1JULY 2004 MARLAP
3 KEY ANALYTICAL PLANNING ISSUES AND DEVELOPING ANALYTICAL PROTOCOL
SPECIFICATIONS
3.1 Introduction
This chapter provides an overview of key analytical planning issues that should be addressed andresolved during a directed planning process (see Chapter 2). A key analytical planning issue isone that has a significant effect on the selection and development of analytical protocols, or onethat has the potential to be a significant contributor of uncertainty to the analytical process and,ultimately, the resulting data. It should be noted that a key analytical planning issue for oneproject may not be a key issue for another project. One of the most important functions of adirected planning process is the identification and resolution of these key issues for a project. Theresolution of these issues results in the development of analytical protocol specifications (APSs).
In accordance with a performance-based approach, APSs should contain only the minimum levelof specificity required to meet the project or program data requirements and resolve the keyanalytical planning issues. While Chapter 2 provides an oversight of the project planning process,this chapter provides a focused examination of analytical planning issues and the development ofAPSs.
In order to assist the project planning team in identifying issues, this chapter provides a list ofpotential key analytical planning issues. Neither the list nor discussion of these potential issues isan exhaustive examination of all possible issues for a project. However, this chapter does providea framework and a broad base of information that can assist in the identification of key analyticalplanning issues for a particular project during a directed planning process.
Analytical planning issues can be divided intotwo broad categories�those that tend to bematrix-specific and those that are moregeneral in nature. While there is certainlysome overlap between these two broadcategories, MARLAP divides analyticalplanning issues along these lines because of thestructure and logic it provides in developingAPSs. This approach involves identifying keyanalytical planning issues from the general(non-matrix-specific) issues first and thenproceeding on to the matrix-specific issues.Examples of non-matrix-specific analyticalplanning issues include sample tracking and
Contents
3.1 Introduction . . . . . . . . . . . . . . . . . . . . . . . . . . 3-13.2 Overview of the Analytical Process . . . . . . . 3-23.3 General Analytical Planning Issues . . . . . . . . 3-23.4 Matrix-Specific Analytical Planning Issues 3-203.5 Assembling the Analytical Protocol
Specifications . . . . . . . . . . . . . . . . . . . . . . . 3-233.6 Level of Protocol Performance
Demonstration . . . . . . . . . . . . . . . . . . . . . . . 3-243.7 Project Plan Documents . . . . . . . . . . . . . . . 3-243.8 Summary of Recommendations . . . . . . . . . . 3-273.9 References . . . . . . . . . . . . . . . . . . . . . . . . . . 3-27Attachment 3A: Measurement Uncertainty . . . . . 3-29Attachment 3B: Analyte Detection . . . . . . . . . . . 3-33
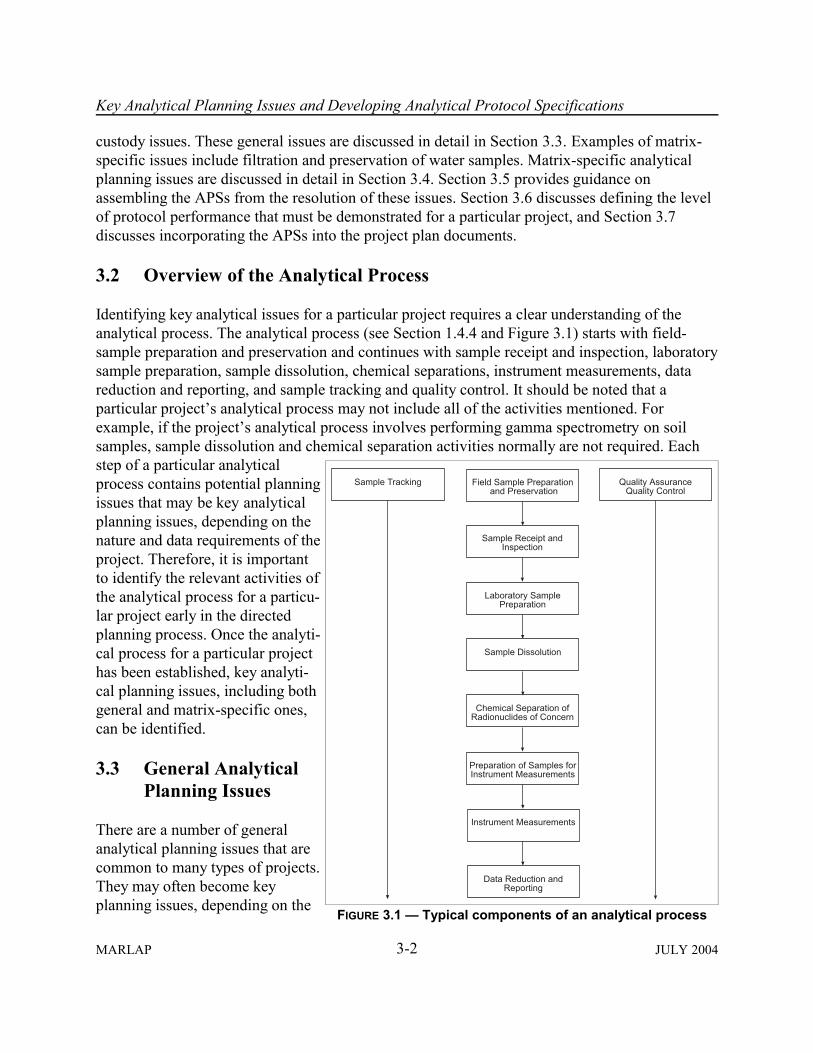
Key Analytical Planning Issues and Developing Analytical Protocol Specifications
3-2MARLAP JULY 2004
������������ ����������������
���������� ���� ����������������������������������������
��������� ������������ ����
����������������������������
����������������
� ��� ���������������!������� ������!���� ���
�������������!��������!������������"���������
����������"���������
��������� �����������������
FIGURE 3.1 � Typical components of an analytical process
custody issues. These general issues are discussed in detail in Section 3.3. Examples of matrix-specific issues include filtration and preservation of water samples. Matrix-specific analyticalplanning issues are discussed in detail in Section 3.4. Section 3.5 provides guidance onassembling the APSs from the resolution of these issues. Section 3.6 discusses defining the levelof protocol performance that must be demonstrated for a particular project, and Section 3.7discusses incorporating the APSs into the project plan documents.
3.2 Overview of the Analytical Process
Identifying key analytical issues for a particular project requires a clear understanding of theanalytical process. The analytical process (see Section 1.4.4 and Figure 3.1) starts with field-sample preparation and preservation and continues with sample receipt and inspection, laboratorysample preparation, sample dissolution, chemical separations, instrument measurements, datareduction and reporting, and sample tracking and quality control. It should be noted that aparticular project�s analytical process may not include all of the activities mentioned. Forexample, if the project�s analytical process involves performing gamma spectrometry on soilsamples, sample dissolution and chemical separation activities normally are not required. Eachstep of a particular analyticalprocess contains potential planningissues that may be key analyticalplanning issues, depending on thenature and data requirements of theproject. Therefore, it is importantto identify the relevant activities ofthe analytical process for a particu-lar project early in the directedplanning process. Once the analyti-cal process for a particular projecthas been established, key analyti-cal planning issues, including bothgeneral and matrix-specific ones,can be identified.
3.3 General AnalyticalPlanning Issues
There are a number of generalanalytical planning issues that arecommon to many types of projects.They may often become keyplanning issues, depending on the

Key Analytical Planning Issues and Developing Analytical Protocol Specifications
3-3JULY 2004 MARLAP
nature and data requirements of the project, and the resolution of some of these planning issuesmay affect the selection of methods (see Section 6.5, �Project-Specific Considerations forMethod Selection�). This section presents each planning issue as an activity to be accomplishedduring a directed planning process and also identifies the expected outcome of the activity ingeneral terms. The resolution of these general analytical planning issues, particularly those thatare key planning issues for a project, provides the basic framework of the APSs and, therefore,should be identified and resolved before proceeding to matrix-specific planning issues. Theresolution of these issues normally results (at a minimum) in an analyte list, identified matricesof concern, measurement quality objectives (MQOs), and established frequencies and acceptancecriteria for quality control (QC) samples. The resolution of matrix-specific issues, particularlythose that are key issues for a project, normally provides the necessary additions and modifi-cations to the basic framework of the APSs needed to complete and finalize the specifications.MARLAP recommends that any assumptions made during the resolution of key analyticalplanning issues are documented, and that these assumptions are incorporated into the appropriatenarrative sections of project plan documents. Documenting these assumptions may help answerquestions or help make decisions during the implementation and assessment phases of theproject.
3.3.1 Develop Analyte List
From an analytical perspective, one of the most important planning issues is the target analytelist�the radionuclides of concern for the project. Note that the target analyte list may alsoinclude nonradioactive hazardous constituents, which could influence the analytical protocols,including sample collection and waste disposal issues. Although this issue probably would bedealt with by the same planning team, its discussion is outside the scope of MARLAP. For manyprojects, data are available from previous activities for this purpose. Four possible sources ofinformation are (1) historical data, (2) process knowledge, (3) previous studies, and (4)information obtained from conducting a preliminary survey or characterization study. Althoughdiscussed separately in Section 3.3.3, the identification and characterization of matrices ofconcern often is done concurrently with the development of an analyte list.
Historical data are one source of existing information. Many activities associated with radio-active materials have been well documented. For example, activities licensed by the NuclearRegulatory Commission (NRC) or NRC Agreement States normally generate much documen-tation. Chapter 3 of MARSSIM (2000) provides guidance on obtaining and evaluating historicalsite data.
Another source of existing information is process knowledge. Some sites are associated with aspecific activity or process that involved radioactive material, where the process was well definedand the fate of the radioactive material in the process was known or controlled. Examples includeuranium and rare earth ore processing, operations at Department of Energy (DOE) weapons facil-

Key Analytical Planning Issues and Developing Analytical Protocol Specifications
3-4MARLAP JULY 2004
ities, and operations at commercial nuclear power plants (see Section 6.5.2 for additionaldiscussion on process knowledge).
A third source of existing information is previous studies. Similar projects or studies of relatedtopics can provide valuable information during a directed planning process. Previous studies mayprovide useful information on background radiation. Many radionuclides are present in measur-able quantities in the environment. Natural background radiation is due both to primordial andcosmogenic radionuclides. Anthropogenic background includes radionuclides that are ubiquitousin the environment as a result of such human activities as the atmospheric testing of nuclearweapons. Natural and anthropogenic backgrounds can be highly variable even within a given site.It may be important to consider the background and its variability when choosing an action leveland when establishing the MQOs. Every effort should be made to obtain as much existing infor-mation as possible prior to initiating a directed planning process.
A fourth source of information is generated by conducting a preliminary survey or characteriza-tion study. This preliminary analysis may be necessary if there are little or no historical data thatcan help identify concentrations of radionuclides of potential concern, or if the existing data areof inadequate quality. The design of preliminary surveys or characterization studies should bepart of the project planning process. The need for fast turnaround and lower costs at this stage ofthe project may lead to different data quality objectives (DQOs) and MQOs that are lessrestrictive than those used for the primary phase of the project. However, it is important thatanalytical requirements for the survey or study be established during the project planning process.Gross alpha, gross beta, and gamma spectrometry analyses often are used for preliminary surveyor characterization studies. The benefits of performing these types of measurements include:
� Rapid analysis and short turnaround time; � Relatively low analytical costs; and � Ability to detect the presence of a wide range of radionuclides in a variety of matrices.
There are also limitations on the use of these analyses. These limitations include:
� No specific identification for pure alpha- or pure beta-emitting radionuclides; � Low-energy gamma- and beta-emitting radionuclides are generally not detected; and � Failing to detect the presence of several radionuclides (e.g., 3H and other volatile
radionuclides; 55Fe and other radionuclides that decay by electron capture).
Output: An initial list of radionuclides of potential concern including a brief narrative explain-ing why each radionuclide is on the list as well as an explanation of why certain radio-nuclides were considered but not listed. This list may be modified as more project-specific information becomes available. It is better to include radionuclides on theinitial list even if the probability that they significantly contribute to the addressedconcerns is small. The consequence of discovering an additional radionuclide of

Key Analytical Planning Issues and Developing Analytical Protocol Specifications
3-5JULY 2004 MARLAP
concern late in a project generally outweighs the effort of evaluating its potentialduring planning.
3.3.2 Identify Concentration Ranges
Once the radionuclides of concern have been identified, the expected concentration range foreach radionuclide should be determined. Historical data, process knowledge, previous studies,and preliminary survey or characterization results if available, can be used to determine theexpected concentration range for each analyte. While most analytical protocols are applicableover a fairly large concentration range for the radionuclide of concern, performance over arequired concentration range can serve as an MQO for the protocol-selection process, therebyeliminating any analytical protocols that cannot accommodate this need. In addition, knowledgeof the expected concentration ranges for all of the radionuclides of concern can be used toidentify possible chemical or spectral interferences that might lead to the elimination of some ofthe alternative analytical protocols.
Output: The expected concentration range for each radionuclide of concern and anyconstituent with the potential for causing chemical or radiological interference.
3.3.3 Identify and Characterize Matrices of Concern
During a directed project planning process, the matrices of concern should be identified clearly.Typical matrices may include surface soil, subsurface soil, sediment, surface water, groundwater,drinking water, air particulates, biota, structural materials, metals, etc. Historical data, processknowledge, previous studies, conceptual site models, transport models, and other such sourcesgenerally are used to identify matrices of concern. It is critical to be as specific as possible whenidentifying a matrix.
Information on the chemical and physical characteristics of a matrix is extremely useful.Therefore, in addition to identifying the matrices of concern, every effort should be made toobtain any information available on the chemical and physical characteristics of the matrices.This information is particularly important when determining the required specificity of theanalytical protocol (i.e., the ability to accommodate possible interferences). It is also important toidentify any possible hazards associated with the matrix, such as the presence of explosive orother highly reactive chemicals. Issues related to specific matrices, such as filtration of watersamples and removal of foreign material, are discussed in more detail in Section 3.4 (�Matrix-Specific Analytical Planning Issues�) and Section 6.5.1.1 (�Matrices�).
Output: A list of the matrices of concern along with any information on their chemical andphysical characteristics and on possible hazards associated with them. The list ofmatrices of concern and the analyte list often are developed concurrently. In some
Key Analytical Planning Issues and Developing Analytical Protocol Specifications
3-6MARLAP JULY 2004
cases, one analyst list is applicable to all the matrices of concern, and in other casesthere are variations in the analyte list for each matrix.
3.3.4 Determine Relationships Among the Radionuclides of Concern
Known or expected relationships among radionuclides can be used to establish �alternate�radionuclides that may be easier and less costly to measure. In most cases, an �easy-to-measure�radionuclide is analyzed, and the result of this analysis is used to estimate the concentration ofone or more radionuclides that may be difficult to measure or costly to analyze.
One of the best known and easiest relationships to establish is between a parent radionuclide andits associated progeny. Once equilibrium conditions have been established, the concentration ofany member of the decay series can be used to estimate the concentration of any other member ofthe series (see Attachment 14A, �Radioactive Decay And Equilibrium�). For example, thethorium decay series contains 12 radionuclides. If each radionuclide in this series is analyzedseparately, the analytical costs can be very high. However, if equilibrium conditions for the decayseries have been established, a single analysis using gamma spectrometry may be adequate forquantifying all of the radionuclides in the series simultaneously.
Similarly, process knowledge can be used to predict relationships between radionuclides. Forexample, in a nuclear power reactor, steel may become irradiated, producing radioactive isotopesof the elements present in the steel. These isotopes often include 60Co, 63Ni, and 55Fe. Cobalt-60decays by emission of a beta particle and two high-energy gamma rays, which are easilymeasured using gamma spectrometry. Nickel-63 also decays by emission of a beta particle buthas no associated gamma rays. Iron-55 decays by electron capture and has several associated X-rays with very low energies. Laboratory analysis of 63Ni and 55Fe typically is time-consuming andexpensive. However, because all three radionuclides are produced by the same mechanism fromthe same source material, there is an expected relationship at a given time in their productioncycle. Once the relationship between these radionuclides has been established, the 60Coconcentration can be used as an alternate radionuclide to estimate the concentration of 63Ni and55Fe.
The uncertainty in the concentration ratio between radionuclide concentrations used in the alter-nate analyte approach should be included as part of the combined standard uncertainty of theanalytical protocol in the measurement process. Propagation of uncertainties is discussed inChapter 19, Measurement Uncertainty.
Output: A list of known or potential radionuclide relationships, based upon parent-progenyrelationships, previous studies, or process knowledge. A preliminary study todetermine the project-specific radionuclide relationships may be necessary, andadditional measurements may be required to confirm the relationship used during theproject. This information may be used to develop a revised analyte list.
Key Analytical Planning Issues and Developing Analytical Protocol Specifications
3-7JULY 2004 MARLAP
3.3.5 Determine Available Project Resources and Deadlines
The available project resources can have a significant impact on the selection or development ofanalytical protocols, as well as the number and type of samples to be analyzed. In addition,project deadlines and, in particular, required analytical turnaround times (see Section 6.5.3,�Radiological Holding and Turnaround Times�) can be important factors in the selection anddevelopment of analytical protocols for a particular project. During a directed planning process,radioanalytical specialists can provide valuable information on typical costs and turnaround timesfor various types of laboratory analyses.
Output: A statement of the required analytical turnaround times for the radionuclides ofconcern and the anticipated budget for the laboratory analysis of the samples.
3.3.6 Refine Analyte List and Matrix List
As additional information about a project is collected, radionuclides may be added to or removedfrom the analyte list. There may be one analyte list for all matrices or separate lists for eachmatrix. Developing an analyte list is an iterative process, however. The list should become morespecific during the project planning process.
Radionuclides might be added to the analyte list when subsequent investigations indicate thatadditional radionuclides were involved in a specific project. In some cases, radionuclides may beremoved from the analyte list. When there is significant uncertainty about the presence orabsence of specific radionuclides, the most conservative approach is to leave them on the listeven when there is only a small probability that they may be present. Subsequent investigationsmay determine if specific radionuclides are actually present and need to be considered as part ofthe project. For example, a research laboratory was licensed for a specific level of activity fromall radionuclides with atomic numbers between 2 and 87. Even limiting the analyte list toradionuclides with a half-life greater than six months results in a list containing several dozenradionuclides. A study may be designed to identify the actual radionuclides of concern throughthe use of historical records and limited analyses to justify removing radionuclides from theanalyte list.
Output: A revised analyte list. Radionuclides can always be added to or removed from theanalyte list, but justification for adding or removing radionuclides should be includedin the project documentation.
3.3.7 Method Performance Characteristics and Measurement Quality Objectives
The output of a directed planning process includes DQOs for a project (Section 2.6, �Results ofthe Directed Planning Process�). DQOs apply to all data collection activities associated with aproject, including sampling and analysis. In particular, DQOs for data collection activities
Key Analytical Planning Issues and Developing Analytical Protocol Specifications
3-8MARLAP JULY 2004
describe the overall level of uncertainty that a decisionmaker is willing to accept for projectresults. This overall level of uncertainty is made up of uncertainties from sampling and analysisactivities.
Because DQOs apply to both sampling and analysis activities, what are needed from an analyticalperspective are performance objectives specifically for the analytical process of a particularproject. MARLAP refers to these performance objectives as MQOs. The MQOs can be viewed asthe analytical portion of the overall project DQOs. In a performance-based approach, the MQOsare used initially for the selection and evaluation of analytical protocols and are subsequentlyused for the ongoing and final evaluation of the analytical data.
In MARLAP, the development of MQOs for a project depends on the selection of an action leveland gray region for each analyte during the directed planning process. The term �action level� isused to denote the numerical value that will cause the decisionmaker to choose one of thealternative actions. The �gray region� is a set of concentrations close to the action level where theproject planning team is willing to tolerate a relatively high decision error rate (see Chapter 2 andAppendices B and C for a more detailed discussion of action levels and gray region). MARLAPrecommends that an action level and gray region be established for each analyte during thedirected planning process.
MARLAP provides guidance on developing MQOs for select method performance characteristicssuch as:
� The method uncertainty at a specified concentration (expressed as an estimated standarddeviation);
� The method�s detection capability (expressed as the minimum detectable concentration, orMDC);
� The method�s quantification capability (expressed as the minimum quantifiableconcentration, or MQC);
� The method�s range, which defines the method�s ability to measure the analyte of concernover some specified range of concentration;
� The method�s specificity, which refers to the ability of the method to measure the analyte ofconcern in the presence of interferences; and
� The method�s ruggedness, which refers to the relative stability of method performance forsmall variations in method parameter values.

Key Analytical Planning Issues and Developing Analytical Protocol Specifications
3-9JULY 2004 MARLAP
An MQO is a quantitative or qualitative statement of a performance objective or requirement fora particular method performance characteristic. An example MQO for the method uncertainty ata specified concentration, such as the action level, would be: �A method uncertainty of 0.01 Bq/gor less is required at the action level of 0.1 Bq/g.� A qualitative example of an MQO for methodspecificity would be �The method must be able to quantify the amount of 226Ra present, givenelevated levels of 235U in the samples.�
The list provided in this section is not intended to be an exhaustive list of method performancecharacteristics, and for a particular project, other method performance characteristics may beimportant and should be addressed during the project planning process. In addition, one or moreof the method performance characteristics listed may not be important for a particular project.From an analytical perspective, a key activity during project planning is the identification ofimportant method performance characteristics and the development of MQOs for them.
In addition to developing MQOs for method performance characteristics, MQOs may be estab-lished for other parameters, such as data quality indicators (DQIs). DQIs are qualitative andquantitative descriptors used in interpreting the degree of acceptability or utility of data. Theprincipal DQIs are precision, bias, representativeness, comparability, and completeness. Thesefive DQIs are also referred to by the acronym PARCC; the �A� stands for �accuracy� instead ofbias, although both indicators are included in discussions of the PARCC parameters (EPA,2002). Because the distinction between imprecision and bias depends on context, and because areliable estimate of bias requires a data set that includes many measurements, MARLAP focuseson developing an MQO for method uncertainty. Method uncertainty effectively combinesimprecision and bias into a single parameter whose interpretation does not depend on context.This approach assumes that all potential sources of bias present in the analytical process havebeen considered in the estimation of the measurement uncertainty and, if not, that any appre-ciable bias would only be detected after a number of measurements of QC and performance-testing samples have been performed. MARLAP provides guidance on the detection of bias, forexample, during analytical method validation and evaluation (Chapters 6, Selection andApplication of an Analytical Method, and 7, Evaluating Methods and Laboratories).
While MARLAP does not provide specific guidance on developing MQOs for the DQIs, estab-lishing MQOs for the DQIs may be important for some projects. EPA (2002) contains moreinformation on DQIs. MARLAP provides guidance on developing MQOs for methodperformance characteristics in the next section.
3.3.7.1 Develop MQOs for Select Method Performance Characteristics
Once the important method performance characteristics for an analytical process have been iden-tified, the next step is to develop MQOs for them. This section provides guidance on developingMQOs for the method performance characteristics listed in the previous section. As noted, othermethod performance characteristics may be important for a particular analytical process, and

Key Analytical Planning Issues and Developing Analytical Protocol Specifications
3-10MARLAP JULY 2004
MQOs should be developed for them during project planning. Many of these issues are discussedin Section 6.5 from the laboratory�s perspective.
METHOD UNCERTAINTY
While measurement uncertainty is a parameter associated with an individual result and is calcu-lated after a measurement is performed, MARLAP uses the term �method uncertainty� to refer tothe predicted uncertainty of a measured value that would likely result from the analysis of asample at a specified analyte concentration (see Attachment 3A for a general overview of theconcept of measurement uncertainty). Method uncertainty is a method performance characteristicmuch like the detection capability of a method. Reasonable values for both characteristics can bepredicted for a particular method based on typical values for certain parameters and on informa-tion and assumptions about the samples to be analyzed. These predicted values can be used in themethod selection process to identify the most appropriate method based on a project�s datarequirements. Because of its importance in the selection and evaluation of analytical protocolsand its importance in the evaluation of analytical data, MARLAP recommends that the methoduncertainty at a specified concentration (typically the action level) always be identified as animportant method performance characteristic, and that an MQO be established for it for eachanalyte/matrix combination.
The MQO for the method uncertainty at a specified concentration plays a key role in MARLAP�sperformance-based approach. It effectively links the three phases of the data life cycle: planning,implementation, and assessment. This MQO, developed during the planning phase, is usedinitially in the selection and validation of an analytical method for a project (Chapter 6). ThisMQO provides criteria for the evaluation of QC samples during the implementation phase(Appendix C, MQOs for Method Uncertainty and Detection and Quantification Capability, andChapter 7, Evaluating Methods and Laboratories). It also provides criteria for verification andvalidation during the assessment phase (Chapter 8, Radiochemical Data Verification andValidation). The use of the project-specific MQOs for the method uncertainty of each analyte inthe three phases of the life of a project, as opposed to arbitrary non-project-specific criteria, helpsto ensure the generation of radioanalytical data of known quality appropriate for its intended use.
The MQO for method uncertainty for an analyte at a specified concentration, normally the actionlevel, is related to the width of the gray region. The gray region has an upper bound and a lowerbound. The upper bound typically is the action level. The width of the gray region is representedby the symbol ∆ (delta). Given the importance of the gray region in establishing MQOs, thereader is strongly encouraged to review Section B3.7 in Appendix B and Attachment B-1 ofAppendix B, which provide detailed guidance on setting up a gray region.
Appendix C provides the rationale and detailed guidance on the development of MQOs formethod uncertainty. Outlined below is MARLAP�s recommended guideline for developingMQOs for method uncertainty when a decision is to be made about the mean of a population
Key Analytical Planning Issues and Developing Analytical Protocol Specifications
3-11JULY 2004 MARLAP
represented by multiple samples. Appendix C provides additional guidelines for developingMQOs for method uncertainty when decisions are to be made about individual items or samples.
If decisions are to be made about the mean of a sampled population, MARLAP recommends thatthe method uncertainty (uMR) be less than or equal to the width of the gray region divided by 10for sample concentrations at the upper bound of the gray region (typically the action level). If thismethod uncertainty cannot be achieved, the project planners should require at least that themethod uncertainty be less than or equal to the width of the gray region divided by 3 (AppendixC).
EXAMPLE
Suppose the action level is 0.1 Bq/g and the lower bound of the gray region is 0.02 Bq/g. Ifdecisions are to be made about survey units based on samples, then the required method uncer-tainty (uMR) at 0.1 Bq/g is
∆10
'0.1 & 0.02
10' 0.008 Bq/g
If this uncertainty cannot be achieved, then a method uncertainty (uMR) as large as ∆ / 3 =0.027 Bq/g may be allowed if more samples are taken.
In the example above, the required method uncertainty (uMR) is 0.008 Bq/g. In terms of methodselection, this particular MQO calls for a method that can ordinarily produce measured resultswith expected combined standard uncertainties (1σ) of 0.008 Bq/g or less at sample concentra-tions at the action level (0.1 Bq/g in this example). Although individual measurement uncertain-ties will vary from one measured result to another, the required method uncertainty is effectivelya target value for the individual measurement uncertainties.
Output: MQOs expressed as the required method uncertainty at a specified concentration foreach analyte.
DETECTION AND QUANTIFICATION CAPABILITY
For a particular project, the detection capability or the quantification capability may be identifiedas an important method performance characteristic during project planning (see Attachment 3Bof this chapter and Attachment B-2 of Appendix B for a general overview of the concept ofdetection of an analyte). If the issue is whether an analyte is present in an individual sample andit is therefore important that the method be able to reliably distinguish small amounts of theanalyte from zero, then an MQO for the detection capability should be established during projectplanning. If the emphasis is on being able to make precise measurements of the analyte

Key Analytical Planning Issues and Developing Analytical Protocol Specifications
3-12MARLAP JULY 2004
concentration for comparing the mean of a sampled population to the action level, then an MQOfor the quantification capability should be established during project planning.
Detection Capability
When decisions are to be made about individual items or samples (e.g., drinking water samples),and the lower bound of the gray region is zero for the analyte of concern, the detection capabilityof the method is an important method performance characteristic, and an MQO should bedeveloped for it. MARLAP recommends that the MQO for the detection capability be expressedas a required MDC (Chapter 20, Detection and Quantification Capabilities).
Outlined below is MARLAP�s recommended guideline for developing MQOs for detectioncapability. Appendix C provides the rationale along with detailed guidance on the developmentof MQOs for detection capability.
If the lower bound of the gray region is zero, and decisions are to be made about individualitems or specimens, choose an analytical method whose MDC is no greater than the action level.
Quantification Capability
When decisions are to be made about a sampled population and the lower bound of the grayregion is zero for the analyte of concern, the quantification capability of the method is animportant method performance characteristic and an MQO should be developed for it. MARLAPrecommends that the MQO for the quantification capability be expressed as a required MQC(Chapter 20).
Outlined below is MARLAP�s recommended guideline for developing MQOs for quantificationcapability. The MQC, as used in the guideline, is defined as the analyte concentration at whichthe relative standard uncertainty is 10 percent (see Chapter 19). Appendix C provides the ration-ale along with detailed guidance on the development of MQOs for quantification capability.
If the lower bound of the gray region is zero, and decisions are to be made about a sampledpopulation, choose an analytical method whose MQC is no greater than the action level.
If an MQO for method uncertainty has been established, then establishing an MQO for thequantification capability in terms of a required MQC is somewhat redundant because an MQC isdefined in terms of a specified relative standard uncertainty. However, this method performancecharacteristic is included in MARLAP for several reasons. First, it has been included to empha-size the importance of the quantification capability of a method for those instances where theissue is not whether an analyte is present or not�for example measuring 238U in soil where thepresence of the analyte is given�but rather how precisely the analyte can be measured. Second,this method performance characteristic has been included so as to promote the MQC as an

Key Analytical Planning Issues and Developing Analytical Protocol Specifications
3-13JULY 2004 MARLAP
important method parameter. And last, it has been included as an alternative to the overemphasison establishing required detection limits in those instances where detection (reliably distinguish-ing an analyte concentration from zero) is not the key analytical question.
Output: MQOs for each analyte should be expressed as (a) MQCs if the lower bound of thegray region is zero and decisions are to be made about a sample population or (b)MDCs if the lower bound of the gray region is zero, and decisions are to be madeabout individual items or samples.
RANGE
Depending on the expected concentration range for an analyte (Section 3.3.2), the method�srange may be an important method performance characteristic. Most radioanalytical methods arecapable of performing over a fairly large range of analyte concentrations. However, if theexpected concentration range is large for an analyte, the method�s range should be identified asan important method performance characteristic and an MQO should be developed for it. Theradioanalytical specialist on the project planning team will determine when the expected concen-tration range of an analyte warrants the development of an MQO for the method�s range. Becausethe expected concentration range for an analyte is based on past data, which may or may not beaccurate, the MQO for the method�s range should require that the method perform over a largerconcentration range than the expected range. This precaution will help minimize the potential forselecting methods that cannot accommodate the actual concentration range of the analyte.
Output: MQOs for the method�s concentration range for each analyte.
SPECIFICITY
Depending on the chemical and physical characteristics of the matrices, as well as the concen-trations of analytes and other chemical constituents, the method�s specificity may be an importantmethod performance characteristic for an analytical process. Method specificity refers to theability of the method to measure the analyte of concern in the presence of interferences. Theimportance of this characteristic is evaluated by the radioanalytical specialist based uponinformation about the expected concentration range of the analytes of concern, other chemicaland radioactive constituents that may be present, and the chemical and physical characteristics ofthe matrices (Sections 3.3.2 and 3.3.3). If it is determined that method specificity is an importantmethod performance characteristic, then an MQO should be developed for it. The MQO can bequalitative or quantitative in nature.
Output: MQOs for the method specificity for those analytes likely affected by interferences.
Key Analytical Planning Issues and Developing Analytical Protocol Specifications
3-14MARLAP JULY 2004
RUGGEDNESS
For a project that involves analyzing samples that are complex in terms of their chemical andphysical characteristics, the method�s ruggedness may be an important method performancecharacteristic. Method ruggedness refers to the relative stability of the method�s performancewhen small variations in method parameter values are made, such as a change in pH, a change inamount of reagents used, etc. The importance of this characteristic is evaluated by the radio-analytical specialist based upon detailed information about the chemical and physical characteris-tics of the sample. If important, then an MOO should be developed for it, which may requireperformance data demonstrating the method�s ruggedness for specified changes in select methodparameters. Youden and Steiner (1975) and ASTM E1169 provide guidance on ruggednesstesting.
Output: MQOs for method ruggedness for specified changes in select method parameters.
3.3.7.2 The Role of MQOs in the Protocol Selection and Evaluation Process
Once developed, the MQOs become an important part of the project�s APSs and are subsequentlyincorporated into project plan documents (Chapter 4) and into the analytical Statement of Work(Chapter 5). In MARLAP, MQOs are used initially in the selection, validation, and evaluation ofanalytical protocols (Chapters 6 and 7). In a performance-based approach, analytical protocolsare either accepted or rejected largely on their ability or inability to meet the project MQOs.
3.3.7.3 The Role of MQOs in the Project�s Data Evaluation Process
Once the analytical protocols have been selected and implemented, the MQOs and�inparticular�the MQOs for method uncertainty, are used in the evaluation of the resultinglaboratory data relative to the project�s analytical requirements. The most important MQO fordata evaluation is the one for method uncertainty at a specified concentration. It is expressed asthe required method uncertainty (uMR) at some concentration, normally the action level (for thisdiscussion, it is assumed that the action level is the upper bound of the gray region). When theanalyte concentration of a laboratory sample is less than the action level, the combined standarduncertainty of the measured result should not exceed the required method uncertainty.
For example, if the required method uncertainty is 0.01 Bq/g or less at an action level of 0.1Bq/g, then for any measured result less than 0.1 Bq/g, the laboratory�s reported combinedstandard uncertainty should be less than or equal to 0.01 Bq/g. When the concentration is greaterthan the action level, the combined standard uncertainty of the measured result should not exceedthe relative value of the required method uncertainty. If the required method standard uncertaintyis 0.01 Bq/g or less at an action level of 0.1 Bq/g (10 percent of the action level), then for anymeasured result greater than 0.1 Bq/g, the laboratory�s reported combined standard uncertaintyshould be no greater than 10 percent of the measured result. If an expanded uncertainty is
Key Analytical Planning Issues and Developing Analytical Protocol Specifications
3-15JULY 2004 MARLAP
reported with each measured value, and the coverage factor also is specified (see Section 19.3.6,�Expanded Uncertainty�), the combined standard uncertainty may be calculated and checkedagainst the required value. The check described relies on the laboratory�s estimate of itsmeasurement uncertainty. Additional checks are needed to ensure that the uncertainties are notseriously underestimated.
Appendix C provides guidance on developing criteria for QC samples based on the MQO formethod uncertainty. Specifically, Appendix C contains equations for determining warning andcontrol limits for QC sample results based on the project�s MQO for method uncertainty.
The following example illustrates the use of the MQO for method uncertainty in evaluating QCsample results. Chapter 8, Data Verification and Validation, provides guidance on developingvalidation criteria based on the MQO for the required method uncertainty.
EXAMPLE
Suppose the upper bound of the gray region (the action level) is 0.1 Bq/g, and the requiredmethod uncertainty (uMR) at this concentration is 0.01 Bq/g, or 10 percent. A routine laboratorycontrol sample (LCS) is prepared with an analyte concentration of 0.150 Bq/g. (For thepurpose of this example the uncertainty in the spike concentration is assumed to be negligible.)The lab analyzes the LCS with a batch of samples and obtains the measured result 0.140 ±0.008 Bq/g, where 0.008 Bq/g is the combined standard uncertainty (1σ).
Question: Is this LCS result acceptable?
Answer: The LCS result may be acceptable if it differs from the accepted true value by nomore than three times the required method uncertainty at that concentration. In this examplethe required method uncertainty is 10 percent at 0.150 Bq/g. So, the LCS result is required tobe within 30 percent of 0.150 Bq/g, or in the range 0.105�0.195 Bq/g. Because 0.140 Bq/g isclearly in the acceptance range, the data user considers the result acceptable. Note also that thelaboratory�s reported combined standard uncertainty is less than the required methoduncertainty, as expected.
3.3.8 Determine Any Limitations on Analytical Options
With the outputs of the resolution of a number of key analytical planning issues, such as a refinedanalyte list, MQOs for the analyte list, known relationship between radionuclides of concern, alist of possible alternate analytes, required analytical turnaround times, the analytical budget, etc.,the project planning team may choose to limit the analytical options normally available to thelaboratory. This decision may be based on information obtained during project planning, such asthe absence of equilibrium between the analyte and other radionuclides in its decay chain, the

Key Analytical Planning Issues and Developing Analytical Protocol Specifications
3-16MARLAP JULY 2004
presence of other radionuclides known to cause spectral interferences, the presence of the analytein a refractory form, etc. However, in the absence of such considerations, the project planningshould allow the laboratory the flexibility of selecting any analytical approach that meets theanalytical requirements in the APSs.
The role of the radioanalytical specialist is critical in determining if any limitations on analyticaloptions are necessary because of the many laboratory-related issues and factors involved (seeSection 2.5, �Directed Planning Process and Role of the Radioanalytical Specialists�). Forexample, if several of the radionuclides of concern on the target analyte list are gamma-emitters,the radioanalytical specialist can determine if gamma spectrometry is an appropriate techniquegiven the required MQOs, matrices of concern, possible spectral interferences, etc. The radio-analytical specialist may determine that not only is gamma spectrometry an appropriate techniquefor the gamma-emitting radionuclides of concern, but because there is evidence that equilibriumconditions are present, the results for gamma spectrometry can be used for other radionuclides ofconcern in the same decay chain as the gamma-emitting radionuclides. In other instances, such asthe use of gamma spectrometry to quantify 226Ra in the presence of elevated levels of 235U, theradioanalytical specialist may determine that gamma spectrometry is not an appropriate analysisdue to possible spectral interferences. The following sections provide a brief overview of somemeasurement options.
3.3.8.1 Gamma Spectrometry
In general, gamma spectrometry has many advantages over other choices. It is capable ofidentifying and quantifying a large number of radionuclides. In comparison with other analyses, itoffers a fairly quick turnaround time, and because it is generally a nondestructive technique andlimited sample manipulation is involved, it is relatively inexpensive, particularly compared toanalyses that require sample dissolution and chemical separations. It also allows for the use ofrelatively large sample sizes, thereby reducing the measurement uncertainty associated with sub-sampling at the laboratory. However, given its many advantages, gamma spectrometry cannot beused to analyze for all radionuclides. For example, gamma spectrometry may not be able toachieve the project�s MQOs, because some or all of the radionuclides of concern may not begamma-emitters, interfering radionuclides may present problems, etc. The radioanalyticalspecialist on the planning team can evaluate the appropriateness of the use of gamma spectrom-etry for some or all of the radionuclides on the analyte list or for alternate analytes.
3.3.8.2 Gross Alpha and Beta Analyses
Gross alpha and gross beta analysis provides information on the overall level of alpha- and beta-emitting radionuclides present in a sample. The analysis has the advantage of a relatively quickturnaround time and generally is inexpensive compared to other analyses. The analysis also hassignificant limitations. It does not identify specific alpha- and beta-emitting radionuclides, so thesource of the overall alpha and beta radiation is not determined by the analysis. It does not detect

Key Analytical Planning Issues and Developing Analytical Protocol Specifications
3-17JULY 2004 MARLAP
contribution from low-energy beta-emitting radionuclides such as 3H. Volatile radionuclides maybe lost during analysis. The measurement uncertainty of the analysis, particularly for matricesother than water, tends to be larger than the measurement uncertainty of other analyses. However,even with these limitations, gross alpha and beta analysis can be an important and appropriateanalysis for a project.
3.3.8.3 Radiochemical Nuclide-Specific Analysis
In many instances, due to the project�s MQOs, the lack of an appropriate alternate analyte, thelack of equilibrium conditions, etc., radiochemical nuclide-specific analyses are required. This isoften true when radionuclides such as 3H, 14C, 90Sr, isotopes of Pu, 99Tc, etc., are on the analytelist. These analyses generally involve more manipulation of the samples than do gamma spec-trometry and gross alpha and beta analysis. These analyses often require sample dissolution andchemical separation of the radionuclides of concern. For liquid scintillation counting, distillationis usually required for water samples, and some oxidative/combustion procedure is usuallyrequired for solid samples. Because of this, these analyses generally have longer turnaroundtimes and are more expensive than other analyses.
Given the many analytical factors and considerations involved, the role of the radioanalyticalspecialist is critical to determining if any limitations on analysis options are necessary.
Output: Any limitations on analysis options, if appropriate.
3.3.9 Determine Method Availability
After the required analyses have been specified along with their associated sample matrices, therequired MQOs, the analytical turnaround times, etc., the radioanalytical specialist should be ableto determine if there are analytical methods currently available to meet the project�s require-ments.
If there are no known analytical methods that would meet the project�s analytical requirements,the project planning team must evaluate options. They may decide to reevaluate the analyticaldata requirements, such as the MQOs, to see if they can be changed to allow the use of existingmethods or increase the analytical budget and project timeline to allow for method development.
Output: A statement of method availability.
3.3.10 Determine the Type and Frequency of, and Evaluation Criteria for, Quality ControlSamples
There are three main categories of laboratory QC samples�blanks, replicates, and spikes. Inaddition, there are different types of blanks, replicates, and spikes. For example, spikes can be

Key Analytical Planning Issues and Developing Analytical Protocol Specifications
3-18MARLAP JULY 2004
matrix spikes, laboratory control samples, external performance evaluation samples, etc. Chapter18 (Laboratory Quality Control) contains a detailed discussion of the different types of QCsamples and the information they provide. Because the results of the three main types of QCsamples often are used to evaluate different aspects of the analytical process, most projectsshould employ all three types as part of the QC process.
The frequency of laboratory QC sampling for a project essentially represents a compromisebetween the need to evaluate and control the analytical process and the resources available. Inaddition, the nature of the project and the intended use of the data will play a role in determiningthe frequency of QC samples required. For example, the frequency of QC samples for a projectinvolving newly developed methods for analytes in a complex matrix normally should be greaterthan the frequency of QC samples for a project using more established methods on a simplermatrix, assuming the intended use of the data is the same for both projects. The radioanalyticalspecialists on the project planning team play a key role in determining the type and frequency ofQC samples for a project.
In order to adequately evaluate laboratory data, it is important that the QC samples be clearlylinked to a group of project samples. Typically, this is done by analyzing QC samples along witha batch of samples and reporting the results together (see Chapter 18).
In addition to determining the type and frequency of QC samples, evaluation criteria for the QCsample results should be developed during the directed planning process and incorporated intothe project�s APSs. Appendix C provides guidance on developing criteria for QC samples andcontains equations that calculate warning and control limits for QC sample results based on theproject�s MQO for method uncertainty.
Output: List of type and frequency of QC samples required and the criteria for evaluating QCsample results.
3.3.11 Determine Sample Tracking and Custody Requirements
A procedural method for sample tracking should be in place for all projects so that the properlocation and identification of samples is maintained throughout the life of the project. Sampletracking should cover the entire process from sample collection to sample disposal. For someprojects, a chain-of-custody (COC) process is needed. COC procedures are particularly importantin demonstrating sample control when litigation is involved. In many cases, federal, state, orlocal agencies may require that COC be maintained for specific samples. Chapter 11, SampleReceipt, Inspection, and Tracking, provides guidance on sample tracking and COC. It isimportant that the requirements for sample tracking be clearly established during projectplanning.
Output: Project sample tracking requirements.

Key Analytical Planning Issues and Developing Analytical Protocol Specifications
3-19JULY 2004 MARLAP
3.3.12 Determine Data Reporting Requirements
The data reporting requirements should be established during project planning. This involvesdetermining not only what is to be reported but also how it is to be reported. Consideration alsoshould be given to which information should be archived to allow a complete evaluation of thedata in the future. Items that are routinely reported are listed below. It should be noted that this isnot a comprehensive list, and some projects may require the reporting of more items while otherprojects may require the reporting of fewer items:
� Field sample identification number � Laboratory sample identification number � Sample receipt date � Analysis date � Radionuclide � Radionuclide concentration units � Sample size (volume, mass) � Aliquant size (volume, mass) � Radionuclide concentration at specified date � Combined standard uncertainty or expanded uncertainty (coverage factor should be indicated) � Sample-specific minimum detectable concentration � Analysis batch identification � Quality control sample results � Laboratory instrument identification � Specific analytical parameters (e.g., chemical yields, counting times, etc.) � Analytical method/procedure reference
It is important that the required units for reporting specific items be determined during projectplanning. MARLAP recommends that units of the International System of Units (SI) be usedwhenever possible. However, because regulatory compliance levels are usually quoted intraditional radiation units, it may be appropriate to report in both SI and traditional units, withone being placed in parentheses. MARLAP also recommends that all measurement results bereported directly as obtained, including negative values, along with the measurement uncer-tainty�for example 2σ, 3σ, etc. This recommendation addresses the laboratory�s reporting ofdata to the project planning team or project manager; additional consideration should be given tohow data will be reported to the general public. Additional guidance on data reporting, includinga discussion of electronic data deliverables, is provided in Chapter 16, Data Acquisition,Reduction, and Reporting for Nuclear Counting Instrumentation, and in Chapter 5, ObtainingLaboratory Services.
Output: Data reporting requirements for a project.

Key Analytical Planning Issues and Developing Analytical Protocol Specifications
3-20MARLAP JULY 2004
3.4 Matrix-Specific Analytical Planning Issues
This section discusses a number of matrix-specific analytical planning issues common to manytypes of projects. For each matrix there is a discussion of several potential key analytical plan-ning issues specific to that matrix. It should be noted that what may be a key analytical planningissue for one project, may not be a key issue for another project. The list of potential matrix-specific key analytical planning issues discussed in this section is summarized in Table 3.1.Table 3.1 is not a comprehensive list, but rather is an overview of some common matrix-specificplanning issues. Parenthetical references associated with �potential key issues� in the tableidentify Part II chapters where these issues are discussed in detail.
This section is divided into solids, liquids, filters and wipes. While filters and wipes are solids,they are discussed separately because of the unique concerns associated with them.
TABLE 3.1 � Common matrix-specific analytical planning issuesMATRIX RECOMMENDED KEY
ISSUESPOTENTIAL KEY ISSUES
(Reference Chapters)Solids (soil, sediment,structural material,biota, metal, etc.)
HomogenizationSubsamplingRemoval of unwanted material
Container type (Chapter 10)Container material (10)Sample preservation (10)Surveying samples for health and safety (11)Volatile compounds (10)Sample identification (10, 11, 12)Cross-contamination (10)Sample size (10, 11, 12)Compliance with radioactive materials license (11)Compliance with shipping regulations (11)Chemical and physical form of the substrate (13, 14)
Liquids (drinkingwater, groundwater,precipitation, solvents,oils, etc.)
Is filtering required?Sample preservationShould sample be filtered orpreserved first?
Sample identification (Chapters 10, 11, 12)Volume of sample (10)Immiscible layers (12)Precipitation (12)Total dissolved solids (12)Reagent background (12)Compliance with radioactive materials license (11)Compliance with shipping regulations (11)
Filters and Wipes Filter materialPore sizeSample volume or area wiped
Sample identification (Chapters 10, 11, 12)Compliance with radioactive materials license (11)Compliance with shipping regulations (11)Subsampling (12)Background from filter material (12)

Key Analytical Planning Issues and Developing Analytical Protocol Specifications
3-21JULY 2004 MARLAP
3.4.1 Solids
Solid samples consist of a wide variety of materials that include soil and sediment, plant andanimal tissue, concrete, asphalt; trash, etc. In general, most solid samples do not require preserva-tion (Chapter 10) but do require specific processing both in the field and in the laboratory. Incertain instances, some biota samples may require preservation, primarily in the form of loweredtemperatures, to prevent sample degradation and loss of water. Some common analyticalplanning issues for solid samples include the removal of unwanted materials (Section 3.4.1.1),homogenization and subsampling (Section 3.4.1.2), and sample dissolution (Section 3.4.1.3) Forcertain types of biological samples, removal and analysis of edible portions may be a keyanalytical planning issue.
3.4.1.1 Removal of Unwanted Materials
When a solid sample is collected in the field, extraneous material may be collected along with the�intended� sample. For example, when collecting a soil sample, rocks, plant matter, debris, etc.,may also be collected. Unless instructed otherwise, samples received by the laboratory typicallyare analyzed exactly as they are received. Therefore, it is important to develop requirementsregarding the treatment of extraneous materials. Ultimately, these guidelines should be based onthe project�s DQOs. The requirements should clearly state what, if anything, is to be removedfrom the sample and should indicate what is to be done with the removed materials. Theguidelines should indicate where the removal process should occur (in the field, in the laboratoryor at both locations) and the material to be removed should be clearly identified.
For soil samples, this may involve identifying rock fragments of a certain sieve size, plant matter,debris, etc., as extraneous material to be removed, weighed, and stored at the laboratory. Ifmaterial is removed from a soil sample, consideration should be given to documenting the natureand weight of the material removed. For sediment samples, requirements for occluded watershould be developed. In the case of biological samples, if the entire sample is not to be analyzed,the analytical portion should be identified clearly.
3.4.1.2 Homogenization and Subsampling
For many types of analyses, a portion of the sample sent to the laboratory must be removed foranalysis. As with sampling in the field, this portion of the sample should be representative of theentire sample. Adequate homogenization and proper subsampling techniques are critical toobtaining a representative portion of the sample for analysis. Developing requirements for�andmeasuring the adequacy of�homogenization processes and subsampling techniques can becomplicated for various types of solid matrices. General guidance on homogenization and sub-sampling is provided in Chapter 12 and Appendix F. The input of the radioanalytical specialist asa member of the project planning team is critical to developing requirements for homogenizationprocesses and subsampling techniques.

Key Analytical Planning Issues and Developing Analytical Protocol Specifications
3-22MARLAP JULY 2004
3.4.1.3 Sample Dissolution
For many analyses, a portion of the solid sample must undergo dissolution before the analyte ofinterest can be measured. The decision as to which technique to employ for sample dissolution isbest left to the laboratory performing the analysis. The radioanalytical specialist can review anyinformation on the chemical and physical characteristics of the matrices of concern andincorporate any relevant information into the APSs.
3.4.2 Liquids
Liquids include aqueous liquids (e.g., surface water, groundwater, drinking water, aqueousprocess wastes, and effluents), nonaqueous liquids (e.g., oil, solvents, organic liquid processwastes), and mixtures of aqueous and nonaqueous liquids.
A key analytical planning issue for most liquids is whether or not filtering is required or neces-sary (Section 10.3.2). The question of whether or not to filter a liquid is generally defined by thefundamental analytical question. If the question is related to total exposure from ingestion, theliquids are generally not filtered or the filters are analyzed separately and the results summed. Ifthe question is concerned with mobility of the analyte the concentration in the liquid fractionbecomes more important than the concentration in the suspended solids (although somesuspended solids may still be important to questions concerning mobility of contamination). Inmany projects, all of the liquids are filtered and the question becomes which filters need to beanalyzed. Issues related to this decision include where and when to filter (Chapter 10);homogenization and subsampling (Chapter 10); volatile compounds (Chapter 10); screening forhealth and safety (Chapter 11); and cross-contamination (Chapter 10).
Another key analytical planning issue involves preservation of liquid samples, which is also dis-cussed in Chapter 10. Sample preservation involves decisions about the method of preservation(temperature or chemical, Chapter 10), container type and material (Chapter 10), and chemicalcomposition of the sample (Chapters 13 and 14). Preservation of radionuclides in liquids isgenerally accomplished in the same manner as preservation of metals for chemical analysis.There are of course exceptions such as for 3H and 129I.
A third key analytical issue results from the first two issues and involves the decision of whichissue should be resolved first. Should the sample be filtered and then preserved, or preserved firstand filtered later? This issue is also discussed in Chapter 10. In general, acid is used to preserveliquid samples. Because acid brings many radionuclides into solution from suspended or undis-solved material, filtering is generally performed in the field prior to preserving the sample withacid.

Key Analytical Planning Issues and Developing Analytical Protocol Specifications
3-23JULY 2004 MARLAP
3.4.3 Filters and Wipes
Filters include a wide variety of samples, including liquid filters, air filters for suspendedparticulates, and air filters for specific compounds. Once the decision to filter has been made,there are at least three key analytical planning issues: filter material, effective pore size, andvolume of material to be filtered.
The selection of filter or wipe material can be very important. The wrong filter or wipe candissolve, break, clog, or tear during sample collection or processing, thus invalidating the sample.Chapter 10 includes a discussion of the various types of filter and wipe materials. Issuesinfluencing this decision include the volume of material to be filtered, the loading expected onthe filter, and the chemical composition of the material to be filtered.
The volume of material to be filtered, or area to be wiped, is generally determined by the detec-tion requirements for the project. Lower detection limits require larger samples. Larger samplesmay, in turn, result in problems with shipping samples or analytical problems where multiplefilters were required to meet the requested detection limits.
3.5 Assembling the Analytical Protocol Specifications
After key general and matrix-specific analytical planning issues have been identified andresolved, the next task of the project planning team is to organize and consolidate the results ofthis process into APSs for the project. In general, there will be an APS for each type of analysis(analyte-matrix combination). At a minimum, the APS should include the analyte list, the samplematrix, possible interferences, the MQOs, any limitations on analysis options, the type andfrequency of QC samples along with acceptance criteria, and any analytical process requirements(e.g., sample tracking requirements). The analytical process requirements should be limited toonly those requirements that are considered essential to meeting the project�s analytical datarequirements. For example, if the analyte of concern is known to exist in a refractory form in thesamples, then fusion for sample digestion may be included as an analytical process requirement.However, in a performance-based approach, it is important that the level of specificity in theAPSs should be limited to those requirements that are considered essential to meeting theproject�s analytical data requirements. The APS should be a one- or two-page form thatsummarizes the resolution of key analytical planning issues.
Figure 3.2 provides an example form for APSs with references to sections in this chapter asmajor headers on the form. Figure 3.3 provides for the purpose of an example, an APS for 226Rain soil for an information gathering project.
Key Analytical Planning Issues and Developing Analytical Protocol Specifications
3-24MARLAP JULY 2004
3.6 Level of Protocol Performance Demonstration
As discussed in Section 3.3.7.3, during project planning, the project planning team should deter-mine what level of analytical performance demonstration or method validation is appropriate forthe project. The question to be answered is how the analytical protocols will be evaluated. Thereare three parts of this overall evaluation process: (1) the initial evaluation, (2) the ongoing evalu-ation, and (3) the final evaluation. This section briefly discusses the initial evaluation of protocolperformance. Chapters 7 and 8 provide guidance on the ongoing and final evaluation of protocolperformance, respectively.
The project planning team should determine what level of initial performance demonstration isrequired from the laboratory to demonstrate that the analytical protocols the laboratory proposesto use will meet the MQOs and other requirements in the APSs. The project planning teamshould decide the type and amount of performance data required. For example, for the analysis of3H in drinking water, the project planning team may decide that past performance data from thelaboratory, such as the results of internal QC samples for the analysis of 3H in drinking water, aresufficient for the initial demonstration of performance for the laboratory�s analytical protocols ifthey demonstrate the protocol�s ability to meet the MQOs. If the analysis is for 238Pu in a sludge,the project planning team may decide that past performance data (if it exists) would not besufficient for the initial demonstration of performance. The planning team may decide thatsatisfactory results on performance evaluation samples would be required for the initialdemonstration of analytical protocol performance. Section 6.6 (�Method Validation�) providesdetailed guidance on protocol performance demonstration/method validation, including a tieredapproach based on the project analytical needs and available resources.
3.7 Project Plan Documents
Once the APSs have been completed, they should be incorporated into the appropriate projectplan documents and, ultimately, into the analytical Statement of Work. Chapters 4 and 5 provideguidance on the development of project plan documents and analytical Statements of Work,respectively. While the APSs are concise compilations of the analytical data requirements, theappropriate plan documents should detail the rationale behind the decisions made in the develop-ment of the APSs.

Key Analytical Planning Issues and Developing Analytical Protocol Specifications
3-25JULY 2004 MARLAP
Analytical Protocol Specifications
Analyte List: (Section 3.3.1, 3.3.7) Analysis Limitations: (Sections 3.3.9)
Matrix: (Section 3.3.3) Possible Interferences: (Sections 3.3.2, 3.3.7)
Concentration Range: (Section 3.3.2) Action Level: (Section 3.3.7)
MQOs: (Section 3.3.7) (Section 3.3.7)
(Section 3.3.7) (Section 3.3.7)
QC SamplesType Frequency Evaluation Criteria
(Section 3.3.10) (Section 3.3.10) (Section 3.3.10)(Section 3.3.10) (Section 3.3.10) (Section 3.3.10)(Section 3.3.10) (Section 3.3.10) (Section 3.3.10)(Section 3.3.10) (Section 3.3.10) (Section 3.3.10)
Analytical Process Requirements*Activity Special Requirements
Field Sample Preparation and Preservation (Section 3.4)Sample Receipt and Inspection (Section 3.3.12)Laboratory Sample Preparation (Section 3.4)Sample Dissolution (Section 3.4)Chemical Separations (Section 3.4)Preparing Sources for Counting (Section 3.4)Nuclear Counting (Section 3.4)Data Reduction and Reporting (Section 3.3.12)Sample Tracking Requirements (Section 3.3.11)Other
*Consistent with a performance-based approach, analytical process requirements should be kept to a minimum,therefore none or N/A may be appropriate for many of the activities.
FIGURE 3.2 � Analytical protocol specifications

Key Analytical Planning Issues and Developing Analytical Protocol Specifications
3-26MARLAP JULY 2004
Analytical Protocol Specifications (Example)
Analyte List: 226Ra Analysis Limitations: Must perform direct measurementof analyte or analysis of progeny allowed if equilibriumestablished at laboratory
Matrix: Soil Possible Interferences: Elevated levels of 235U
Concentration Range: 0.01 to 1.50 Bq/g Action Level: 0.5 Bq/g
MQOs:
A method uncertainty (uMR) of 0.05 Bq/g or less at 0.5 Bq/g
QC SamplesType Frequency Evaluation Criteria
Method blank 1 per batch See attachment B*Duplicate 1 per batch See attachment B*
Matrix Spike 1 per batch See attachment B*
Analytical Process RequirementsActivity Special Requirements
Field Sample Preparation and Preservation NoneSample Receipt and Inspection NoneLaboratory Sample Preparation NoneSample Dissolution NoneChemical Separations NonePreparing Sources for Counting NoneNuclear Counting NoneData Reduction and Reporting See Attachment A*Sample Tracking Requirements Chain-of-CustodyOther
* Attachments A and B are not provided in this example
FIGURE 3.3 � Example analytical protocol specifications

Key Analytical Planning Issues and Developing Analytical Protocol Specifications
3-27JULY 2004 MARLAP
3.8 Summary of Recommendations
� MARLAP recommends that any assumptions made during the resolution of key analyticalplanning issues are documented, and that these assumptions are incorporated into theappropriate narrative sections of project plan documents.
� MARLAP recommends that an action level and gray region be established for each analyteduring the directed planning process.
� MARLAP recommends that the method uncertainty at a specified concentration (typically theaction level) always be identified as an important method performance characteristic, and thatan MQO be established for it for each analyte.
� MARLAP recommends that the MQO for the detection capability be expressed as a requiredminimum detectable concentration.
� MARLAP recommends that the MQO for the quantification capability be expressed as arequired minimum quantifiable concentration.
� MARLAP recommends that if the lower bound of the gray region is zero, and decisions are tobe made about individual items or specimens, an analytical method should be chosen whoseMDC is no greater than the action level.
� MARLAP recommends that if the lower bound of the gray region is zero, and decisions are tobe made about a sampled population, choose an analytical method whose MQC is no greaterthan the action level.
� MARLAP recommends that units of the International System of Units (SI) be used wheneverpossible.
� MARLAP recommends that all measurement results be reported directly as obtained,including negative values, along with the measurement uncertainty.
3.9 References
American Society for Testing and Materials (ASTM) E1169. Standard Guide for ConductingRuggedness Test. 1989. West Conshohocken, PA.
U. S. Environmental Protection Agency (EPA). 2002. Guidance on Developing QualityAssurance Project Plans (EPA QA/G-5). EPA/240/R-02/009. Office of EnvironmentalInformation, Washington, DC. Available at www.epa.gov/quality/qa_docs.html.

Key Analytical Planning Issues and Developing Analytical Protocol Specifications
3-28MARLAP JULY 2004
MARSSIM. 2000. Multi-Agency Radiation Survey and Site Investigation Manual, Revision 1.NUREG-1575 Rev 1, EPA 402-R-97-016 Rev1, DOE/EH-0624 Rev1. August. Available at:www.epa.gov/radiation/marssim/filesfin.htm.
Youden, W.J. and E.H. Steiner. 1975. Statistical Manual of the Association of Official AnalyticalChemists. Association of Official Analytical Chemists International, Gaithersburg, MD.
3-29JULY 2004 MARLAP
ATTACHMENT 3AMeasurement Uncertainty
3A.1 Introduction
No measurement is perfect. If one measures the same quantity more than once, the result gener-ally varies with each repetition of the measurement. Not all the results can be exactly correct. Infact it is generally the case that no result is exactly correct. Each result has an �error,� which isthe difference between the result and the true value of the measurand (the quantity being meas-ured). Ideally, the error of a measurement should be small, but it is always present and its value isalways unknown. (Given the result of a measurement, it is impossible to know the error of theresult without knowing the true value of the measurand.)
Since there is an unknown error in the result of any measurement, the measurement alwaysleaves one with some uncertainty about the value of the measurand. What is needed then is anestimate of the range of values that could reasonably be attributed to the measurand on the basisof the measurement. Determining such a range of reasonable values is the purpose of evaluatingthe numerical �uncertainty� of the measurement (ISO, 1993).
This attachment gives only a brief overview of the subject of measurement uncertainty. Chapter19 (Measurement Uncertainty) of this manual describes the evaluation and expression ofmeasurement uncertainty in more detail.
3A.2 Analogy: Political Polling
The uncertainty of a laboratory measurement is similar to the �margin of error� reported with theresults of polls and other surveys. Note that a political poll is a form of measurement, the measur-and in this case being the fraction of likely voters who support a specified candidate. (The frac-tion is usually reported as a percentage.) The margin of error for the poll result is a kind ofmeasurement uncertainty.
Suppose a poll of 1200 people indicates that 43 percent of the population supports a particularcandidate in an election, and the margin of error is reported to be 3 percent. Then if the pollingprocedure is unbiased, one can be reasonably confident (but not certain) that the actual percent-age of people who support that candidate is really between 40 percent and 46 percent.
Political polling results can be wildly inaccurate, and the predicted winner sometimes loses. Onereason for this problem is the difficulty of obtaining an unbiased sample of likely voters for thepoll. A famous example of this difficulty occurred in the presidential election of 1936, when apolling organization chose its sample from a list of people who owned telephones and automo-biles and predicted on the basis of the poll that Alf Landon would defeat Franklin Roosevelt. A

Key Analytical Planning Issues and Developing APSs: Measurement Uncertainty
3-30MARLAP JULY 2004
significant source of inaccuracy in the result was the fact that many voters during the GreatDepression were not affluent enough to own telephones and automobiles, and those voters tendedto support FDR, who won the election in a landslide. Another famous example of inaccuratepolling occurred in the 1948 presidential election, when polls erroneously predicted that ThomasDewey would defeat Harry Truman. It seems that the polls in this case were simply taken tooearly in the campaign. They estimated the fraction of people who supported Dewey at the timethe polls were taken, but the fraction who supported him on election day was lower. So, themargin of error in each of these cases was not a good estimate of the total uncertainty of thepolling result, because it did not take into account significant sources of inaccuracy. A morecomplete estimate of the uncertainty would have combined the margin of error with otheruncertainty components associated with possible sampling bias or shifts in public opinion.Similar issues may arise when laboratories evaluate measurement uncertainties.
3A.3 Measurement Uncertainty
To obtain a single numerical parameter that describes the uncertainty of a measured result in thelaboratory requires one to consider all the significant sources of inaccuracy. An internationallyaccepted approach to the expression of measurement uncertainty involves evaluating theuncertainty first in the form of an estimated standard deviation, called a standard uncertainty(ISO, 1995). A standard uncertainty is sometimes informally called a �one-sigma� uncertainty.
In the political polling example above, the measurand is the fraction, p, of likely voters whosupport candidate X. The poll is conducted by asking 1,200 likely voters whether they supportcandidate X, and counting the number of those who say they do. If m is the number who supportX, then the pollster estimates p by the quotient m / 1200. Pollsters commonly evaluate the stan-dard uncertainty of p as u(p) = .1 / 2 1200
After the standard uncertainty of a result is calculated, finding a range of likely values for themeasurand consists of constructing an interval about the result by adding and subtracting a mul-tiple of the standard uncertainty from the measured result. Such a multiple of the uncertainty iscalled an expanded uncertainty. The factor, k, by which the standard uncertainty is multiplied iscalled a coverage factor. Typically the value of k is a small number, such as 2 or 3. If k = 2 or 3,the expanded uncertainty is sometimes informally called a �two-sigma� or �three-sigma� uncer-tainty. An expanded uncertainty based on a coverage factor of 2 provides an interval about themeasured result that has a reasonably high probability of containing the true value of the measur-and (often assumed to be about 95 percent), and an expanded uncertainty based on a coveragefactor of 3 typically provides an interval with a very high probability of containing the true value(often assumed to be more than 99 percent).
Key Analytical Planning Issues and Developing APSs: Measurement Uncertainty
3-31JULY 2004 MARLAP
In the polling example, the definition of the margin of error is equivalent to that of an expandeduncertainty based on a coverage factor of k = 2. Thus, the margin of error equals 2 times u(p), or
, which is approximately 3 percent.1 / 1200
3A.4 Sources of Measurement Uncertainty
In radiochemistry the most familiar source of measurement uncertainty is counting statistics.Mathematically, the uncertainty of a radiation measurement due to counting statistics is closelyrelated to the uncertainty represented by the margin of error for a political poll. If one prepares asource from a measured amount of radioactive material, places the source in a radiation counter,and makes several 10-minute measurements, the number of counts observed will not always bethe same. A typical set of five results might be as follows:
101, 115, 88, 111, 103
Similarly, if the political poll described above were repeated five times with different groups oflikely voters, the number of respondents in each poll who indicate they support the specified can-didate might be as follows:
523, 506, 520, 516, 508
In either case, whether the numbers come from radiation counting or political polling, there issome inherent variability in the results due to random sampling and counting. In radiation count-ing, the variability exists partly because of the inherently random nature of radioactive decay andpartly because the radiation counter is not perfectly efficient at detecting the radiation emittedfrom the source. In political polling, the variability exists because only a fraction of voters sup-port the candidate and only a limited number of voters are surveyed.
As noted above, there are other potential sources of uncertainty in a political poll. The difficultyin polling is in obtaining a representative sample of likely voters to be surveyed. A similar diffi-culty is generally present in radiochemical analysis, since many analytical methods require thatonly a small fraction of the entire laboratory sample be analyzed. The result obtained for thatsmall fraction is used to estimate the concentration of analyte in the entire sample, which may bedifferent if the fraction analyzed is not representative of the rest of the material.
There are many other potential sources of uncertainty in a radiochemical measurement, such asinstrument calibration standards, variable background radiation (e.g., cosmic radiation),contaminants in chemical reagents, and even imperfect mathematical models. Some of theseerrors will vary randomly each time the measurement is performed, and are considered to be�random errors.� Others will be fixed or may vary in a nonrandom manner, and are considered tobe �systematic errors.� However, the distinction between a random error and a systematic error isrelatively unimportant when one wants to know the quality of the result of a single measurement.
Key Analytical Planning Issues and Developing APSs: Measurement Uncertainty
3-32MARLAP JULY 2004
Generally, the data user wants to know how close the result is to the true value and seldom careswhether the (unknown) error of the result would vary or remain fixed if the measurement wererepeated. So, the accepted methods for evaluating and expressing the uncertainty of a measure-ment make no distinction between random and systematic errors. Components of the total uncer-tainty due to random effects and systematic effects are mathematically combined in a singleuncertainty parameter.
3A.5 Uncertainty Propagation
In a radiochemical measurement one typically calculates the final result, y, called the �outputestimate,� from the observed values of a number of other variables, x1,x2,...,xN, called �input esti-mates,� using a mathematical model of the measurement. The input estimates might includequantities such as the gross sample count, blank count, count times, calibration factor, decay fac-tors, aliquant size, chemical yield, and other variables. The standard uncertainty of y is calculatedby combining the standard uncertainties of all these input estimates using a mathematicaltechnique called �uncertainty propagation.� The standard uncertainty of y calculated in this man-ner is called a �combined standard uncertainty� and is denoted by uc(y).
Radiochemists, like pollsters, have traditionally provided only partial estimates of their measure-ment uncertainties, because it is easy to evaluate and propagate radiation counting uncertainty �just as it is easy to calculate the margin of error for a political poll. In many cases the countinguncertainty is the largest contributor to the overall uncertainty of the final result, but in somecases other uncertainty components may dominate the counting uncertainty � just as the pollinguncertainty due to nonrepresentative sampling may dominate the uncertainty calculated from thesimple margin-of-error formula. MARLAP recommends (in Chapter 19) that all of the potentiallysignificant components of uncertainty be evaluated and propagated to obtain the combinedstandard uncertainty of the final result.
3A.6 References
International Organization for Standardization (ISO). 1993. International Vocabulary of Basicand General Terms in Metrology. ISO, Geneva, Switzerland.
International Organization for Standardization (ISO). 1995. Guide to the Expression of Uncer-tainty in Measurement. ISO, Geneva, Switzerland.
1 In other cases, the analyte�s presence in a sample may be known or assumed before the analysis. For example,project planners may want to know whether the concentration of a naturally occurring radionuclide, such as 238U, insoil is above or below an action level, although there is little doubt that the analyte is present. In these cases it isusually not necessary to make a detection decision.
3-33JULY 2004 MARLAP
ATTACHMENT 3BAnalyte Detection
3B.1 Introduction
In many cases one of the purposes of analyzing a laboratory sample is to determine whether theanalyte is present in the sample.1 If the data provide evidence that the analyte is present, the ana-lyte is detected; otherwise, it is not detected. The purpose of this attachment is to explain theissues involved in analyte detection decisions, which are often misunderstood. More details arepresented in Chapter 20 (Detection and Quantification Capabilities).
The result of a laboratory analysis is seldom if ever exactly equal to the true value of the meas-urand (the quantity being measured), because the result is affected by measurement error (seeAttachment 3A). It is also rare for two or more analyses to produce exactly the same result,because some components of the measurement error vary randomly when a measurement isrepeated. Typically some sources of error are well understood (e.g., radiation counting statistics)while others (e.g., reagent contamination and interferences) may or may not be. For thesereasons, deciding whether an analyte is present in a sample is not always easy.
Acceptable methods for making detection decisions are based on statistical hypothesis testing. Inany statistical hypothesis test there are two hypotheses, which are called the null hypothesis andthe alternative hypothesis. Each hypothesis is a statement whose truth is unknown. Only one ofthe two hypotheses in a hypothesis test can be true in any given situation. The purpose of the testis to choose between the two statements. The null hypothesis is the statement that is presumed tobe true unless there is adequate statistical evidence (e.g., analytical data) to the contrary. Whenthe evidence for the alternative hypothesis is strong, the null hypothesis is rejected and the alter-native hypothesis is accepted. When the evidence is weak, the null hypothesis is retained andthus must still be assumed to be true, or at least possibly true. In the context of analyte detection,the null hypothesis states that there is no analyte in the sample, while the alternative hypothesisstates that there is some analyte in the sample.
The concept of a null hypothesis is similar to that of a presumption of innocence in a criminaltrial, where the defendant is presumed to be innocent (the null hypothesis) unless there is stronglegal evidence to the contrary. If the evidence is strong enough to meet the burden of proof, thedefendant is found guilty (the alternative hypothesis). The important point here is that an acquit-

Key Analytical Planning Issues and Developing APSs: Analyte Detection
3-34MARLAP JULY 2004
tal does not require proof of innocence�only a lack of proof of the defendant�s guilt. Analogousrules apply in statistical hypothesis testing.
In the context of analyte detection, the null hypothesis states that there is no analyte in thesample; so, one must presume that no analyte is present unless there is sufficient analyticalevidence to the contrary. Therefore, failing to detect an analyte is not the same thing as provingthat no analyte is present. Generally, proving that there is no analyte in a sample is impossiblebecause of measurement error. No matter how small the result of the measurement is, even if theresult is zero or negative, one cannot be certain that there is not at least one atom or molecule ofthe analyte in the sample.
3B.2 The Critical Value
When a laboratory analyzes a sample, the measuring instrument produces a response, or grosssignal, that is related to the quantity of analyte present in the sample, but random measurementerrors cause this signal to vary somewhat if the measurement is repeated. A nonzero signal maybe (and usually is) produced even when no analyte is present. For this reason the laboratoryanalyzes a blank (or an instrument background) to determine the signal observed when no analyteis present in the sample, and subtracts this blank signal from the gross signal to obtain the netsignal. In fact, since the signal varies if the blank measurement is repeated, there is a blank signaldistribution, whose parameters must be estimated. To determine how large the instrument signalfor a sample must be to provide strong evidence for the presence of the analyte, one calculates athreshold value for the net signal, called the critical value, which is sometimes denoted by SC. Ifthe observed net signal for a sample exceeds the critical value, the analyte is considered�detected�; otherwise, it is �not detected.�
Since the measurement process is statistical in nature, even when one analyzes an analyte-freesample, it is possible for the net signal to exceed the critical value, leading one to conclude incor-rectly that the sample contains a positive amount of the analyte. Such an error is sometimescalled a �false positive,� although the term �Type I error� is favored by MARLAP. The proba-bility of a Type I error is often denoted by α. Before calculating the critical value one mustchoose a value for α. The most commonly used value is 0.05, or 5 percent. If α = 0.05, then oneexpects the net instrument signal to exceed the critical value in only about 5 percent of cases(one in twenty) when analyte-free samples are analyzed.
Figure 3B.1 depicts the theoretical distribution of the net instrument signal obtained whenanalyzing an analyte-free sample and shows how this distribution and the chosen Type I errorprobability, α, together determine the critical value of the net signal, SC. The probability α isdepicted as the area under the curve to the right of the dashed line. Note that decreasing the valueof α, requires increasing the critical value (shifting the dashed line to the right), and increasingthe value of α requires decreasing the critical value (shifting the dashed line to the left).

Key Analytical Planning Issues and Developing APSs: Analyte Detection
2 Although the minimum detectable value is defined theoretically as a �true� value of the analyte, this value, likealmost any true value in the laboratory, is not known exactly and can only be estimated. The important point to bemade here is that the minimum detectable value should not be used as a detection threshold for the measured valueof the analyte.
3-35JULY 2004 MARLAP
0 SC
α
FIGURE 3B.1 � The critical value of the net signal
3B.3 The Minimum Detectable Value
As explained above, the critical value is chosen to limit the probability of a Type I decision error,which means incorrectly concluding that the analyte has been detected when it actually is notpresent. When the analyte actually is present in the sample being analyzed, another kind ofdecision error is possible: incorrectly failing to detect the analyte. The latter type of error is calleda Type II error.
The detection capability of an analytical measurement process, or its ability to distinguish smallpositive amounts of analyte from zero, is defined in terms of the probability of a Type II error.The common measure of detection capability is the minimum detectable value, which equals thesmallest true value (amount, activity, or concentration) of the analyte at which the probability ofa Type II error does not exceed a specified value, β. 2 The definition of the minimum detectablevalue presumes that an appropriate detection criterion (i.e., the critical value) has already beenchosen. So, the minimum detectable value is the smallest true value of the analyte that has aspecified probability, 1 ! β, of generating an instrument signal greater than the critical value. Thevalue of β, like that of α, is often chosen to be 0.05, or 5 percent. (See Figure 20.1 in Chapter 20for a graphical illustration of the relationship between the critical value and the minimum detect-able value.)
In radiochemistry, the minimum detectable value may be called the minimum detectable concen-tration (MDC), minimum detectable amount (MDA), or minimum detectable activity (alsoabbreviated as MDA). MARLAP generally uses the term �minimum detectable concentration,�or MDC.
Key Analytical Planning Issues and Developing APSs: Analyte Detection
3-36MARLAP JULY 2004
It is common in radiochemistry to report the MDC (or MDA) for the measurement process.Unfortunately, it is also common to use the MDC incorrectly as a critical value, which it is not. Itis difficult to imagine a scenario in which any useful purpose is served by comparing a measuredresult to the MDC. Nevertheless such comparisons are used frequently by many laboratories anddata validators to make analyte detection decisions, often at the specific request of projectplanners.
This common but incorrect practice of comparing the measured result to the MDC to make adetection decision produces the undesirable effect of making detection much harder than itshould be, because the MDC is typically at least twice as large as the concentration that corres-ponds to the critical value of the instrument signal. In principle, a sample that contains an analyteconcentration equal to the MDC should have a high probability (usually 95 percent) ofproducing a detectable result. However, when the MDC is used for the detection decision, theprobability of detection is only about 50 percent, because the measured concentration is as likelyto be below the MDC as above it. When an analyte-free sample is analyzed, the probability of aType I error is expected to be low (usually 5 percent), but when the MDC is used for thedetection decision, the probability of a Type I error is actually much smaller�perhaps 0.1 percent or less.
Sometimes it may be desirable to have a Type I error rate much less than 5 percent; however,this goal does not justify using the MDC for the detection decision. In this case, the correctapproach is to specify the critical value based on a smaller value of α, such as 0.01 insteadof 0.05.
MARLAP recommends that when a detection decision is required, the decision should bemade by comparing the measured value (e.g., of the net instrument signal) to its criticalvalue�not to the minimum detectable value.
3B.4 Sources of Confusion
There are several potential sources of confusion whenever one deals with the subject of analytedetection in radiochemistry. One source is the lack of standardization of terminology. For exam-ple, the term �detection limit� is used with different meanings by different people. In radiochem-istry, the detection limit for a measurement process generally means the minimum detectablevalue. However, in other fields the term may correspond more closely to the critical value. Inparticular, in the context of hazardous chemical analysis, the term �method detection limit,�which is abbreviated as MDL, is defined and correctly used as a critical value (i.e., detectionthreshold); so, the MDL is not a �detection limit� at all in the sense in which the latter term iscommonly used in radiochemistry. Another potential source of confusion is the similarity be-tween the abbreviations MDL and MDC, which represent very different concepts. Anyone who isfamiliar with only one of these terms is likely to be confused upon first encountering the other.

Key Analytical Planning Issues and Developing APSs: Analyte Detection
3-37JULY 2004 MARLAP
Another cause of confusion may be the practice of reporting undetectable results as �< MDC.� Ifthe measured result is less than the critical value, the practice of reporting �< MDC� may not beideal, but at least it can be defended on the basis that when the measured value is less than thecritical value, the true value is almost certainly less than the MDC. However, if this shorthandreporting format is not explained clearly, a reader may interpret �< MDC� to mean that the meas-ured value was less than the MDC and for that reason was considered undetectable. The latterinterpretation would be incorrect and might cause the reader to misunderstand the MDC concept.(MARLAP recommends in Chapter 19 that the laboratory always report the measured value andits uncertainty even if the result is considered undetectable.)
3B.5 Implementation Difficulties
Conceptually, the theory of detection decisions and detection limits is straightforward, but theimplementation of the theory often presents difficulties. Such difficulties may include:
� Difficulty in preparing and measuring appropriate blanks, � Variable instrument background, � Sample-specific interferences, and � Statistics of low-background radiation counting.
The concept of the �appropriate blank� is that of an artificial sample that is as much like a realsample as practical in all important respects, but which contains none of the analyte being meas-ured. The most appropriate type of blank depends on the analyte and the measurement procedure.
Too often the critical value is based on the distribution of the instrument background, even whenit is known that the presence of analyte in reagents and interferences from various sources causethe observed signal for an analyte-free sample to be somewhat elevated and more variable thanthe instrument background. This practice may produce a high percentage of Type I errors whenthe critical value is used as a detection threshold. In other cases, the instrument backgroundmeasurement may overestimate the signal produced by an analyte-free sample and lead to higherType II error rates. Note that the problem in either of these cases is not the use of the criticalvalue but its incorrect calculation. There is still no justification for using the MDC as a detectionthreshold. Instead, the critical value should be based on a better evaluation of the distribution ofthe signal that is observed when analyte-free samples are analyzed.
Even when there are no interferences or reagent contamination, if the instrument background isvariable, some of the commonly used expressions for the critical value (which are based oncounting statistics only) may be inadequate. Again, the consequence of ignoring such variabilitywhen calculating the critical value may be a high percentage of Type I errors. In this case too, themistake is not in how the critical value is used (as a detection threshold), but in how it is calcu-lated.
Key Analytical Planning Issues and Developing APSs: Analyte Detection
3-38MARLAP JULY 2004
A final issue to be discussed is how to calculate an appropriate critical value when the observedblank count is extremely low (e.g., less than 20 counts). Chapter 20 presents expressions for thecritical value that should give good results (Type I error rates close to those expected) in thesesituations when the only variability is that due to counting statistics. However, when the blankcount is low and there is additional variability, the usefulness of these expressions cannot beguaranteed, even when they are modified to account for the extra variability.

4-1JULY 2004 MARLAP
4 PROJECT PLAN DOCUMENTS
4.1 Introduction
The project plan documents are a blueprint for how a particular project will achieve data of thetype and quality needed and expected by the project planning team. In the planning documents,the data user�s expectations and requirements, which are developed during the planningprocess�including the analytical protocol specifications (APSs) and measurement qualityobjectives (MQOs)�are documented along with the standard operating procedures (SOPs),health and safety protocols, and quality assurance/quality control (QA/QC) procedures for thefield and laboratory analytical teams. The objectives of this chapter are to discuss:
� The importance of project plan documents; � The elements of project plan documents; and � The link between project planning and project plan documents, in particular the incorporation
of the analytical protocols.
The importance of project plan documents is discussed in Section 4.2. Section 4.3 discusses agraded approach to project plan documents. The different types of planning documents and theelements of the project plan documents are discussed in Sections 4.4 and 4.5, respectively. Thelink between project planning and project plan documents is discussed in Section 4.6.
The project plan documents should be dynamic documents, used and updated over the life of theproject. Under a performance-based approach, the analytical protocols requirements in the projectplan documents initially may reflect the APSs established by the project planning team andissued in the statement of work (SOW). When the analytical laboratory has been selected, theproject plan documents should be updated to reflect the actual protocols to be used. Theprotocols should be cited, or the SOPs for the protocols should be included as appendices. (APSsand the relation to project measurement quality objectives (MQOs) are discussed in Chapter 3and represented in Figure 3.2 and 3.3).
While this chapter will address the documenta-tion of QA/QC used in project activities,MARLAP recognizes and fully endorses theneed for a quality system as documented in amanagement plan or quality manual. Thedevelopment of the project plan documentsshould be addressed in the quality systemrequirements documentation. The project plandocuments should reflect, and be consistentwith, the organization�s QA policies andprocedures. Guidance on elements of a quality
Contents
4.1 Introduction . . . . . . . . . . . . . . . . . . . . . . . . . . . 4-14.2 The Importance of Project Plan Documents . . 4-24.3 A Graded Approach to Project Plan
Documents . . . . . . . . . . . . . . . . . . . . . . . . . . . . 4-34.4 Structure of Project Plan Documents . . . . . . . 4-34.5 Elements of Project Plan Documents . . . . . . . 4-64.6 Linking the Project Plan Documents and the
Project Planning Process . . . . . . . . . . . . . . . . 4-104.7 Summary of Recommendations . . . . . . . . . . . 4-174.8 References . . . . . . . . . . . . . . . . . . . . . . . . . . . 4-17

Project Plan Documents
4-2MARLAP JULY 2004
system for environmental data collection activities is available from several sources includingANSI/ASQC E-4 and ISO 9001. QA requirements have been developed by several federalagencies, and they include the following:
� 10 CFR 830.120 � 10 CFR 50, Appendix B � ANSI N42.23 � ASME NQA-1 � DOE Order 414.1A on QA � EPA Order 5360.1.A2 on quality systems (2000) � DOD QA requirement MIL-Q-9858A (1963)
4.2 The Importance of Project Plan Documents
Project plan documents are important in environmental data collection activities to ensure thatthe type and quantity of data are sufficient for the decision to be made. These documents providea record of the decisions made during the planning process and integrate the technical operationswith the management and quality system practices. Project plans also:
� Support data defensibility for environmental compliance; � Can be used to defend project objectives and budget; and � Are a tool for communication with stakeholders.
The development of project plan documents and the implementation of the project plan providethe following benefits:
� Full documentation for legal, regulatory, and historical use of the information;
� Specification of data collection and quality control;
� Documentation of analytical requirements through the incorporation of an APS;
� Implementation of planned data collection activities (through internal and externalassessment and oversight activities); and
� Meeting project-specific criteria (i.e., MQOs, DQOs) through data validation and usabilityassessment.
Project Plan Documents
4-3JULY 2004 MARLAP
4.3 A Graded Approach to Project Plan Documents
A graded approach bases the level of management controls applied to an item or work on theintended use of the results and the degree of confidence needed in the quality of the results(ANSI/ASQC E-4). MARLAP recommends a graded approach to project plan developmentbecause of the diversity of environmental data collection activities. This diversity in the type ofproject and the data to be collected impacts the content and extent of the detail to be presented inthe plan document. The plan document development team should be flexible in its application ofguidance according to the nature of the work being performed and the intended use of the data.
Under a graded approach, a mix of project-specific and site-based quality system documentationmay be relied upon to ensure quality. For example, the project specific plan may:
� Address design, work processes, and inspection; and
� Incorporate by citation site-wide plans that address records management, qualityimprovement, procurement, and assessment.
A comprehensive and detailed project plan is required for some data collection activities becauseof the need for legal and scientific defensibility of the data. A comprehensive and detailed planalso may be necessary to obtain approval from the Office of Management and Budget for a publicsurvey under the Paperwork Reduction Act to carry out the project (e.g., NRC/EPA survey ofPublicly Owned Treatment Works).
Other environmental data collection activities, such as basic studies or small projects, may onlyrequire a discussion of the experimental process and its objectives, which is often called a�project narrative statement,� �QA narrative statement,� or �proposal QA plan� (EPA, 2002).Basic studies and small projects generally are of short duration or limited scope and couldinclude proof of concept studies, exploratory projects, small data collection tasks, feasibilitystudies, qualitative screens, or initial work to explore assumptions or correlations. Although basicstudies and small projects may be used to acquire a better understanding of a phenomenon, theywill not by themselves be used to make significant decisions or establish policy. Furtherdiscussion on the content of plan documents for basic studies and small projects is provided inSection 4.5.3.
4.4 Structure of Project Plan Documents
The ANSI/ASQC E-4 definition for a QAPP, which is also applicable to other integrated projectplan documents, is �a formal document describing in comprehensive detail the necessary QA,QC and other technical activities that must be implemented to ensure that the results of the workperformed will satisfy the stated performance criteria.� The project plan documents should

Project Plan Documents
4-4MARLAP JULY 2004
contain this information in a clear and integrated manner so that all implementation teams canunderstand their role and the project objectives.
Project plan documents vary in size and format and are referred to by a variety of names. Thesize of the project plan documents tends to reflect the issuing agency�s requirements, complexity,and scope of the project activities. Some projects with multiple phases may have more than oneplan document. For example, separate plan documents may be developed for scoping surveys,characterization, and the final status survey for the same site because of the different objectivesand data requirements. Available guidance on project plans follows in Section 4.4.1, and ageneral discussion of various approaches is in Section 4.4.2.
4.4.1 Guidance on Project Plan Documents
National standards guidance on project plan documents is available in:
� ASTM D5283, Standard Practice for Generation of Environmental Data Related to WasteManagement Activities: Quality Assurance and Quality Control Planning andImplementation;
� ASTM D5612, Standard Guide for Quality Planning and Field Implementation of a WaterQuality Measurements Program; and
� ASTM PS85, Standard Provisional Guidance for Expedited Site Characterization ofHazardous Waste Contaminated Sites.
Guidance on project plans for federal environmental data collection activities is also available(EPA, 2002; 40 CFR 300.430; NRC, 1989; and USACE, 1997 and 2001). Other federal agenciesmay follow or adapt EPA guidance for quality assurance project plans (QAPPs) (EPA, 2002).
The Intergovernmental Data Quality Task Force (IDQTF) has developed a Uniform FederalPolicy for Quality Assurance Project Plans (UFP-QAPP) and a Uniform Federal Policy forImplementing Environmental Quality Systems (UFP-QS). Agencies participating in IDQTF arethe Environmental Protection Agency, Department of Defense, and Department of Energy. TheUFP-QAPP Manual is a consensus document prepared by the IDQTF work group, and itprovides instructions for preparing QAPPs for any environmental data collection operation.Information on IDQTF, including these policies, may be found at www.epa.gov/swerffrr/documents/data_quality/ufp_sep00_intro.htm#quality.

Project Plan Documents
4-5JULY 2004 MARLAP
4.4.2 Approaches to Project Plan Documents
The approach and naming of project plan documents is usually a function of the authoringorganization�s experience, any controlling federal or state regulations, or the controlling Agency.Project plan, work plan, QAPP, field sampling plan, sampling and analysis plan, and dynamicwork plan are some of the names commonly used for project plan documents. The names canhowever often represent different documents to different agencies, states, companies and even todifferent people within the same organization.
A work plan is often the primary and integrating plan document when the data collection activityis a smaller supportive component of a more comprehensive project (for example, data collectionactivity in support of an aspect of an environmental impact statement for a large multi-yearproject). The QAPP is often the primary document when the data collection activity is a majorportion of the project (for example, data collection activity in support of an initial site investiga-tion). A National Contingency Plan (NCP) format (40 CFR 300.430) is appropriate when datacollection activities are in support of National Priorities List (NPL) Superfund site projects. TheNCP format has a sampling and analysis plan as the primary plan document. The projectdocumentation consists of two integrated documents: a field sampling plan and a QAPP. Stand-alone health and safety plans are also developed.
Traditional site investigations are generally based on a phased engineering approach, whichcollects samples based on a pre-specified grid pattern and does not provide the framework formaking changes in the plan in the field. The work plan (the project plan document) for the siteinvestigation typically will specify the number of samples to be collected, the location of eachsample and the analyses to be performed. A newer concept is to develop a dynamic work plan(the project plan document), which, rather than specifying the number of samples to be collectedand the location of each sample, would specify the decisionmaking logic that will be used in thefield to determine where the samples will be collected, when the sampling will stop, and whatanalyses will be performed. Guidance on dynamic work plans is available in ASTM PS85 andEPA (2003).
MARLAP does not recommend a particular project plan document approach, title or arrange-ment. Federal and state agencies have different requirements for the various environmental datacollection activities. In certain cases there are regulatory requirements. If an organization hassuccessful experience addressing the essential content of plan documents (Section 4.5) in a well-integrated, documented format, it is usually unnecessary and wasteful of time and monies tochange a proven approach. The project plan document should reflect, and be consistent with, theorganization�s QA policies and procedures.
MARLAP recommends a primary project plan document that includes other documents bycitation or as appendices. The primary project plan document serves to integrate the multi-
Project Plan Documents
4-6MARLAP JULY 2004
disciplinary sections, other management plans, and stand alone documents into a coherent plan.Appropriate management plans may include the Health and Safety Plan, Waste ManagementPlan, Risk Analysis Plan, Community Relations Plan, or Records Management Plan. If a detaileddiscussion of the project already exists in another document, which is available to projectparticipants, then a brief description of site history and incorporation of the document into theproject plan document by reference may be appropriate. Incorporation by citation may also beappropriate when the complexity of the project requires an extensive discussion of backgroundissues. Other documents that should be integrated, if available, are the report on the planningprocess, the data validation plan (Chapter 8), and the DQA plan (Chapter 9). If stand alonedocuments are not immediately available to project participants, they should be appended to the(primary) project plan document.
4.5 Elements of Project Plan Documents
A project plan document must address a range of issues. The extent of the detail is dependent onthe type of project and the intended use of the results as previously discussed in applying agraded approach to plan documents (Section 4.3). For all projects, the project plan documentmust provide the project information and decisions developed during the project planningprocess. Project plan documents should address:
� The project�s DQOs and MQOs;
� The sampling and analytical protocols that will be used to achieve the project objectives; and
� The assessment procedures and documentation that are sufficient to confirm that the data areof the type and quality needed.
Content of plan documents is discussed in Section 4.5.1. The integration of project plandocuments is discussed in Section 4.5.2. Special consideration of project documentation forsmall projects is discussed in Section 4.5.3.
4.5.1 Content of Project Plan Documents
The plan document development team should remain flexible with regard to format and shouldfocus instead on the appropriate content of plan documents needed to address the elements listedabove. The content of plan documents, regardless of the title or format, will include similarinformation, including:
� The project description and objectives;
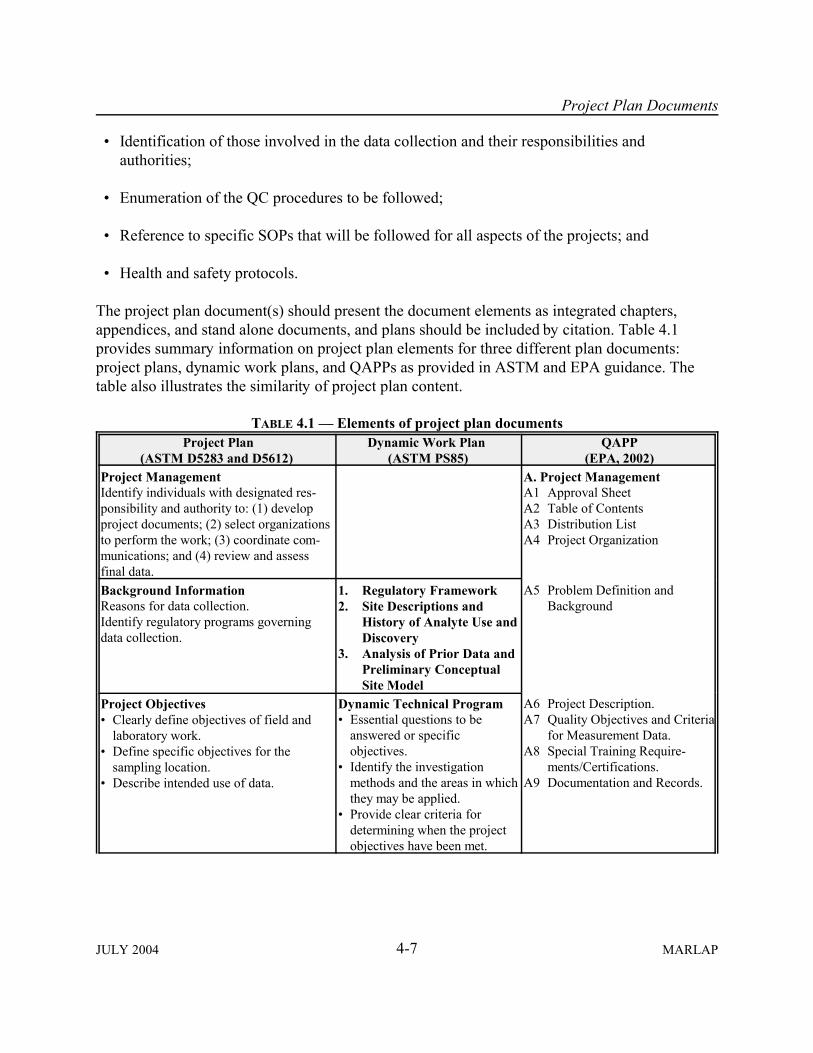
Project Plan Documents
4-7JULY 2004 MARLAP
� Identification of those involved in the data collection and their responsibilities andauthorities;
� Enumeration of the QC procedures to be followed;
� Reference to specific SOPs that will be followed for all aspects of the projects; and
� Health and safety protocols.
The project plan document(s) should present the document elements as integrated chapters,appendices, and stand alone documents, and plans should be included by citation. Table 4.1provides summary information on project plan elements for three different plan documents:project plans, dynamic work plans, and QAPPs as provided in ASTM and EPA guidance. Thetable also illustrates the similarity of project plan content.
TABLE 4.1 � Elements of project plan documents Project Plan
(ASTM D5283 and D5612)Dynamic Work Plan
(ASTM PS85)QAPP
(EPA, 2002)Project ManagementIdentify individuals with designated res-ponsibility and authority to: (1) developproject documents; (2) select organizationsto perform the work; (3) coordinate com-munications; and (4) review and assessfinal data.
A. Project ManagementA1 Approval SheetA2 Table of ContentsA3 Distribution ListA4 Project Organization
Background InformationReasons for data collection.Identify regulatory programs governingdata collection.
1. Regulatory Framework2. Site Descriptions and
History of Analyte Use andDiscovery
3. Analysis of Prior Data andPreliminary ConceptualSite Model
A5 Problem Definition andBackground
Project Objectives � Clearly define objectives of field and
laboratory work.� Define specific objectives for the
sampling location.� Describe intended use of data.
Dynamic Technical Program� Essential questions to be
answered or specificobjectives.
� Identify the investigationmethods and the areas in whichthey may be applied.
� Provide clear criteria fordetermining when the projectobjectives have been met.
A6 Project Description.A7 Quality Objectives and Criteria
for Measurement Data.A8 Special Training Require-
ments/Certifications.A9 Documentation and Records.
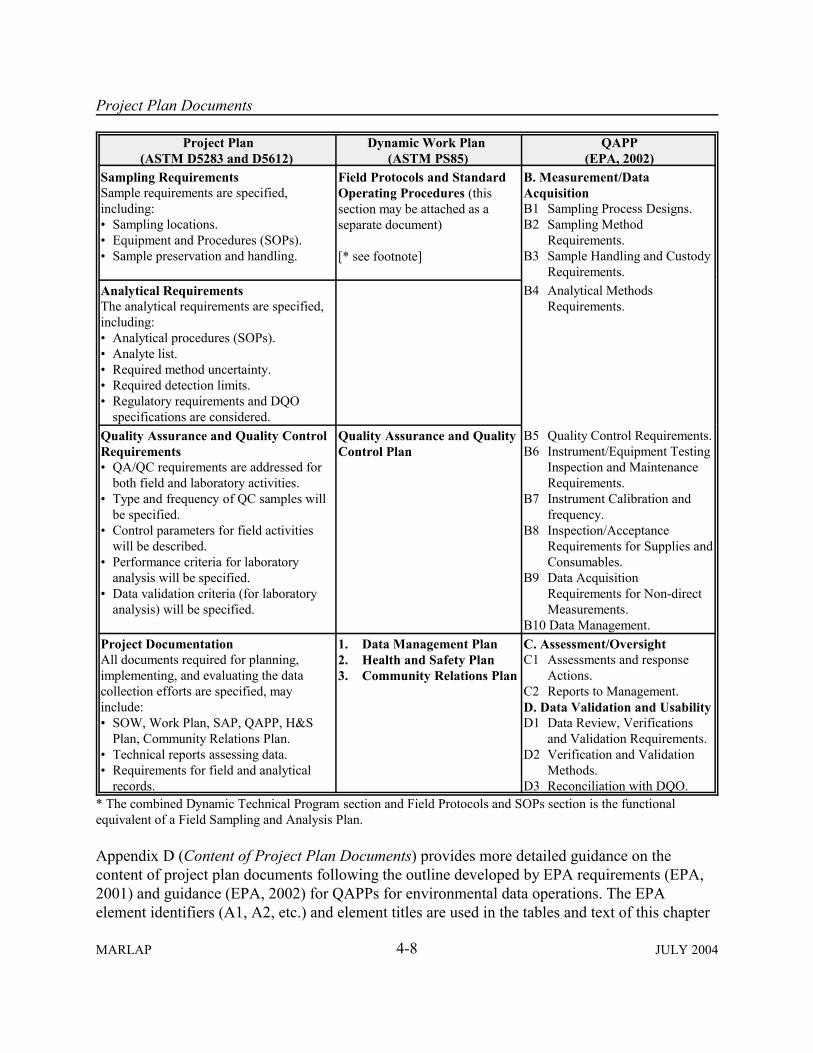
Project Plan Documents
Project Plan(ASTM D5283 and D5612)
Dynamic Work Plan (ASTM PS85)
QAPP(EPA, 2002)
4-8MARLAP JULY 2004
Sampling RequirementsSample requirements are specified,including: � Sampling locations.� Equipment and Procedures (SOPs).� Sample preservation and handling.
Field Protocols and StandardOperating Procedures (thissection may be attached as aseparate document)
[* see footnote]
B. Measurement/DataAcquisitionB1 Sampling Process Designs.B2 Sampling Method
Requirements.B3 Sample Handling and Custody
Requirements.Analytical RequirementsThe analytical requirements are specified,including:� Analytical procedures (SOPs).� Analyte list.� Required method uncertainty.� Required detection limits.� Regulatory requirements and DQO
specifications are considered.
B4 Analytical MethodsRequirements.
Quality Assurance and Quality ControlRequirements� QA/QC requirements are addressed for
both field and laboratory activities. � Type and frequency of QC samples will
be specified.� Control parameters for field activities
will be described.� Performance criteria for laboratory
analysis will be specified.� Data validation criteria (for laboratory
analysis) will be specified.
Quality Assurance and QualityControl Plan
B5 Quality Control Requirements.B6 Instrument/Equipment Testing
Inspection and MaintenanceRequirements.
B7 Instrument Calibration andfrequency.
B8 Inspection/AcceptanceRequirements for Supplies andConsumables.
B9 Data AcquisitionRequirements for Non-directMeasurements.
B10 Data Management.Project DocumentationAll documents required for planning,implementing, and evaluating the datacollection efforts are specified, mayinclude:� SOW, Work Plan, SAP, QAPP, H&S
Plan, Community Relations Plan.� Technical reports assessing data.� Requirements for field and analytical
records.
1. Data Management Plan2. Health and Safety Plan3. Community Relations Plan
C. Assessment/OversightC1 Assessments and response
Actions.C2 Reports to Management.D. Data Validation and UsabilityD1 Data Review, Verifications
and Validation Requirements.D2 Verification and Validation
Methods.D3 Reconciliation with DQO.
* The combined Dynamic Technical Program section and Field Protocols and SOPs section is the functionalequivalent of a Field Sampling and Analysis Plan.
Appendix D (Content of Project Plan Documents) provides more detailed guidance on thecontent of project plan documents following the outline developed by EPA requirements (EPA,2001) and guidance (EPA, 2002) for QAPPs for environmental data operations. The EPAelement identifiers (A1, A2, etc.) and element titles are used in the tables and text of this chapter

Project Plan Documents
4-9JULY 2004 MARLAP
for ease of cross reference to the appropriate section in Appendix D. The EPA elements for aQAPP are used to facilitate the presentation and do not represent a recommendation byMARLAP on the use of a QAPP as the project plan document format.
4.5.2 Plan Documents Integration
MARLAP strongly discourages the use of a number of stand-alone plan components ofequivalent status without integrating information and without a document being identified as aprimary document. For large project plan compilations, it is appropriate to issue stand-aloneportions of the plan that focus on certain activities such as sampling, analysis or data validation,since it can be cumbersome for sampling and laboratory personnel to keep the entire volume(s)of the project plan document readily available. However, each stand-alone component shouldcontain consistent project information, in addition to the component specific plan information,such as the following:
� A brief description of the project including pertinent history; � A brief discussion of the problem to be solved or the question to be answered (DQO); � An organizational chart or list of key contact persons and means of contact; � The analyte(s) of interest; and � The appropriate health and safety protocols and documentation requirements.
In addition, a cross-referenced table is helpful in the primary document, which identifies whereproject plan elements are located in the integrated plan document.
4.5.3 Plan Content for Small Projects
The project plan documents for small projects and basic studies (Section 4.3) generally consist ofthree elements: the title and approval sheet, the distribution list, and a project narrative. Theproject narrative should discuss in a concise manner the majority of issues that are normallyaddressed in a project plan document, such as a QAPP. A typical project narrative may be aconcise and brief description of the following list (keyed to the QAPP column in Table 4.1,[EPA, 2001]):
� Problem and site history (A5) � Project/task organization (A4) � Project tasks, including a schedule and key deliverables (A6) � Anticipated use of the data (A5, A6) � MQOs (A7) � Sampling process design requirements and description (B1) � Sample type and sampling location requirements (B2) � Sample handling and custody requirements (B3) � Analytical protocols (B4)

Project Plan Documents
4-10MARLAP JULY 2004
� QC and calibration requirements for sampling and analysis (B5, B7) � Inspection and maintenance of analytical instrumentation (B6) � Plans for peer or readiness reviews prior to data collection (C1) � Assessments to be conducted during actual operation (C1) � Procedure for data review (D2) � Identification of any special reports on QA/QC activities, as appropriate (C2) � Reconciliation with DQOs or other objectives (D3)
4.6 Linking the Project Plan Documents and the Project Planning Process
Directed planning processes (Chapter 2 and Appendix B) yield many outputs, such as the APSs(Chapter 3), which must be captured in project plan documents to ensure that data collectionactivities are implemented properly. MARLAP recommends that the project plan documentsintegrate all technical and quality aspects for the life cycle of the project, including planning,implementation, and assessment.
The project plan should be a dynamic document, used and updated over the life of the project.For example, the analytical methods requirements in the project plan documents (B4) willinitially reflect the APSs established by the project planning team (Chapter 3) and issued in theSOW or BOA task order (Chapter 5). When the analytical laboratory has been selected (Chapter7), the project plan document should be updated to reflect the specific analytical protocols: theactual protocols to be used, which should be included by citation or inclusion of the SOPs asappendices. MARLAP also recommends using a formal process to control and document changesif updates of the original project plan document are needed.
Table 4.2 presents a crosswalk of the elements of the EPA QAPP guidance with outputs of adirected planning process to illustrate how to capture and integrate the outputs of the planningprocess into the plan document(s).
TABLE 4.2 � Crosswalk between project plan document elements and directed planning process
IDProject Plan Document
Elements (QAPP�EPA, 2001)*
Content Directed Planning Process Input
PROJECT MANAGEMENT
A1 Title and Approval Sheet Title and approval sheet.A2 Table of Contents Document control format.A3 Distribution List Distribution list for the plan
document revisions and finalguidance.
Include the members of the projectplanning team and stakeholders.
A4 Project/Task Organization 1) Identify individuals ororganizations participating in theproject and discuss their roles andresponsibilities.
The directed planning process:� Identifies the stakeholders, data
users, decisionmakers.

Project Plan Documents
IDProject Plan Document
Elements (QAPP�EPA, 2001)*
Content Directed Planning Process Input
4-11JULY 2004 MARLAP
2) Provide an organizational chartshowing relationships andcommunication lines.
� Identifies the core planning team andthe technical planning team membersresponsible for technical oversight.
� Identifies the specific people/organi-zations responsible for projectimplementation (sampling andanalysis).
A5 Problem Definition/Background
1) State the specific problem to besolved and decision to be made.2) Include enough background toprovide a historical perspective.
Project planning team:� Documents the problem, site history,
existing data, regulatory concerns,background levels and thresholds.
� Develops a decision statement.A6 Project/Task Description Identify measurements, special
requirements, sampling andanalytical methods, action levels,regulatory standards, required dataand reports, quality assessmenttechniques, and schedules.
Project planning team identifies:� Deadlines and other constraints that
can impact scheduling.� Existing and needed data inputs.Project planning team establishes:� Action levels and tolerable decision
error rates that will be the basis forthe decision rule.
� The optimized sampling andanalytical design as well as qualitycriteria.
A7 Quality Objectives andCriteria for MeasurementData
1) Identify DQOs, data use, type ofdata needed, domain, matrices,constraints, action levels, statisticalparameters, and acceptable decisionerrors.
2) Establish MQOs that linkanalysis to the user's qualityobjectives.
Project planning team:� Identifies the regulatory standards
and the action level(s).� Establishes the decision rule.� Describes the existing and needed
data inputs.� Describes practical constraints and
the domain.� Establishes the statistical parameter
that is compared to the action level.� Establishes tolerable decision error
rates used to choose quality criteria. � Establishes quality criteria linked to
the optimized design.� Establishes data verification,
validation and assessment criteriaand procedures.
� Establishes APSs and MQOs.A8 Special Training
Requirements/Certification
Identify and discuss specialtraining/certificates required toperform work.
Project planning team:� Identifies training, certification,
accreditation requirements for fieldand laboratory.

Project Plan Documents
IDProject Plan Document
Elements (QAPP�EPA, 2001)*
Content Directed Planning Process Input
4-12MARLAP JULY 2004
� Identifies federal and staterequirements for certification forlaboratories.
� Identifies federal and staterequirements for activities, such asdisposal of field-generated residuals.
A9 Documentation and Record Itemize the information and records,which must be included in a datareport package including reportformat and requirements for storageetc.
Project planning team:� Indicates whether documents will be
controlled and the distribution listincomplete.
� Identifies documents that must bearchived.
� Specifies period of time thatdocuments must be archived.
� Specifies procedures for errorcorrections (for hard copy andelectronic files).
MEASUREMENT/DATA ACQUISITION
B1 Sampling Process Designs(Experimental Designs)
(1) Outline the experimental design,including sampling design andrationale, sampling frequencies,matrices, and measurementparameter of interest. (2) Identify non-standard methodsand validation process.
Project planning team establishes therationale for and details of the samplingdesign.
B2 Sampling MethodsRequirements
Describe sampling procedures,needed materials and facilities,decontamination procedures, wastehandling and disposal procedures,and include a tabular description ofsample containers, sample volumes,preservation and holding timerequirements.
Project planning team specifies thepreliminary details of the optimizedsampling method.
B3 Sample Handling andCustody Requirements
Describe the provisions for samplelabeling, shipment, sample trackingforms, procedures for transferringand maintaining custody of samples.
Project planning team describes theregulatory situation and site history,which can be used to identify theappropriate sample tracking level.
B4 Analytical MethodsRequirements
Identify analytical methods andprocedures including neededmaterials, waste disposal andcorrective action procedures.
Project planning team:� Identifies inputs to the decision
(nuclide of interest, matrix, etc.).� Establishes the allowable measure-
ment uncertainty that will drivechoice of the analytical protocols.
� Specifies the optimized sampling andanalytical design.
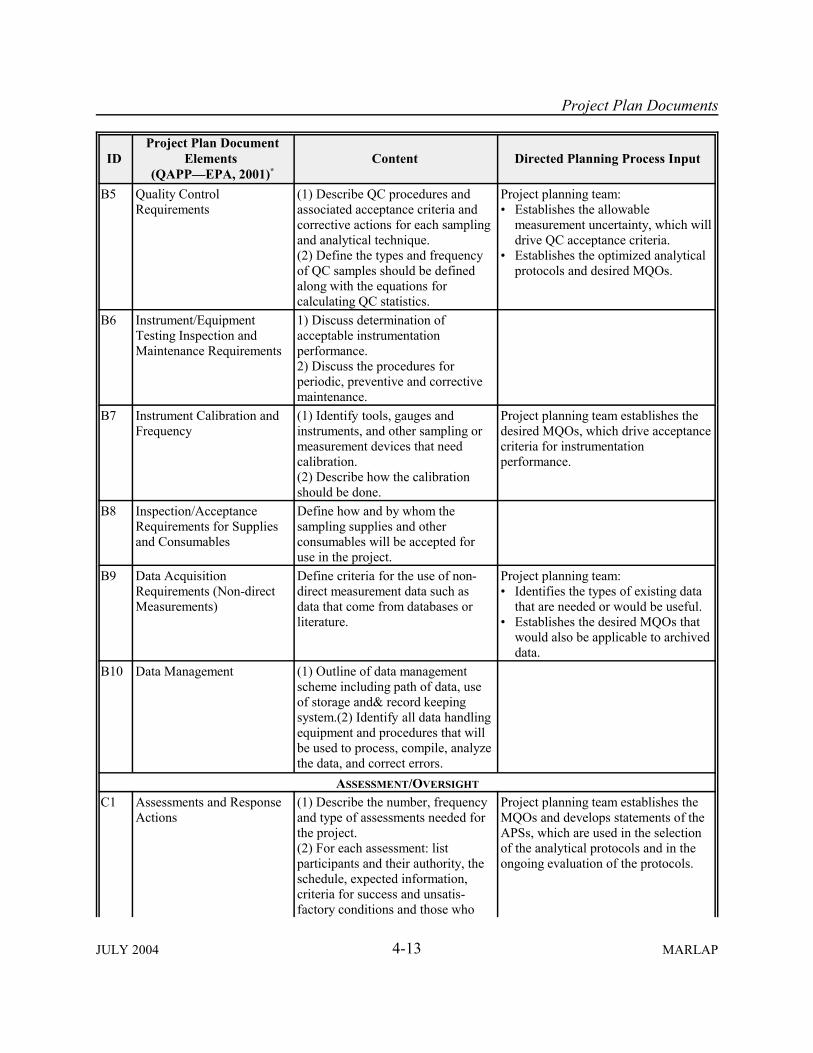
Project Plan Documents
IDProject Plan Document
Elements (QAPP�EPA, 2001)*
Content Directed Planning Process Input
4-13JULY 2004 MARLAP
B5 Quality ControlRequirements
(1) Describe QC procedures andassociated acceptance criteria andcorrective actions for each samplingand analytical technique. (2) Define the types and frequencyof QC samples should be definedalong with the equations forcalculating QC statistics.
Project planning team:� Establishes the allowable
measurement uncertainty, which willdrive QC acceptance criteria.
� Establishes the optimized analyticalprotocols and desired MQOs.
B6 Instrument/EquipmentTesting Inspection andMaintenance Requirements
1) Discuss determination ofacceptable instrumentationperformance. 2) Discuss the procedures forperiodic, preventive and correctivemaintenance.
B7 Instrument Calibration andFrequency
(1) Identify tools, gauges andinstruments, and other sampling ormeasurement devices that needcalibration. (2) Describe how the calibrationshould be done.
Project planning team establishes thedesired MQOs, which drive acceptancecriteria for instrumentationperformance.
B8 Inspection/AcceptanceRequirements for Suppliesand Consumables
Define how and by whom thesampling supplies and otherconsumables will be accepted foruse in the project.
B9 Data AcquisitionRequirements (Non-directMeasurements)
Define criteria for the use of non-direct measurement data such asdata that come from databases orliterature.
Project planning team:� Identifies the types of existing data
that are needed or would be useful.� Establishes the desired MQOs that
would also be applicable to archiveddata.
B10 Data Management (1) Outline of data managementscheme including path of data, useof storage and& record keepingsystem.(2) Identify all data handlingequipment and procedures that willbe used to process, compile, analyzethe data, and correct errors.
ASSESSMENT/OVERSIGHT
C1 Assessments and ResponseActions
(1) Describe the number, frequencyand type of assessments needed forthe project. (2) For each assessment: listparticipants and their authority, theschedule, expected information,criteria for success and unsatis-factory conditions and those who
Project planning team establishes theMQOs and develops statements of theAPSs, which are used in the selectionof the analytical protocols and in theongoing evaluation of the protocols.
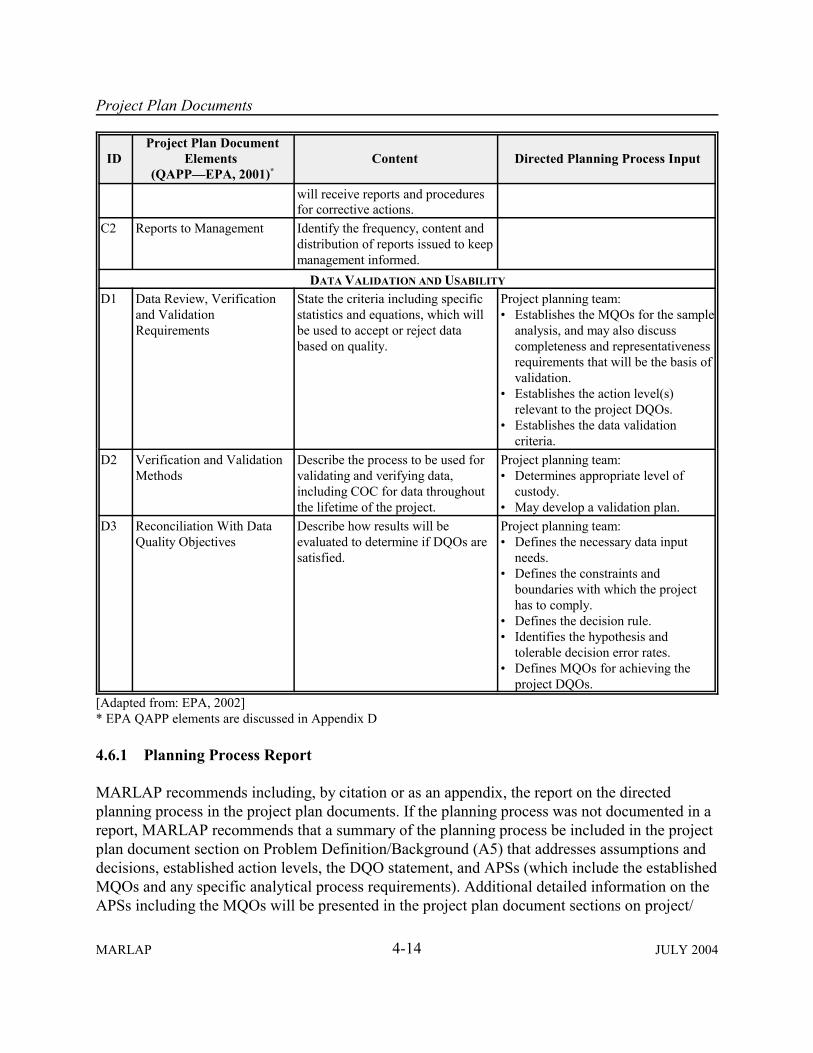
Project Plan Documents
IDProject Plan Document
Elements (QAPP�EPA, 2001)*
Content Directed Planning Process Input
4-14MARLAP JULY 2004
will receive reports and proceduresfor corrective actions.
C2 Reports to Management Identify the frequency, content anddistribution of reports issued to keepmanagement informed.
DATA VALIDATION AND USABILITY
D1 Data Review, Verificationand ValidationRequirements
State the criteria including specificstatistics and equations, which willbe used to accept or reject databased on quality.
Project planning team:� Establishes the MQOs for the sample
analysis, and may also discusscompleteness and representativenessrequirements that will be the basis ofvalidation.
� Establishes the action level(s)relevant to the project DQOs.
� Establishes the data validationcriteria.
D2 Verification and ValidationMethods
Describe the process to be used forvalidating and verifying data,including COC for data throughoutthe lifetime of the project.
Project planning team:� Determines appropriate level of
custody.� May develop a validation plan.
D3 Reconciliation With DataQuality Objectives
Describe how results will beevaluated to determine if DQOs aresatisfied.
Project planning team:� Defines the necessary data input
needs.� Defines the constraints and
boundaries with which the projecthas to comply.
� Defines the decision rule.� Identifies the hypothesis and
tolerable decision error rates.� Defines MQOs for achieving the
project DQOs. [Adapted from: EPA, 2002]* EPA QAPP elements are discussed in Appendix D
4.6.1 Planning Process Report
MARLAP recommends including, by citation or as an appendix, the report on the directedplanning process in the project plan documents. If the planning process was not documented in areport, MARLAP recommends that a summary of the planning process be included in the projectplan document section on Problem Definition/Background (A5) that addresses assumptions anddecisions, established action levels, the DQO statement, and APSs (which include the establishedMQOs and any specific analytical process requirements). Additional detailed information on theAPSs including the MQOs will be presented in the project plan document sections on project/

Project Plan Documents
4-15JULY 2004 MARLAP
task description (A6), quality objectives and criteria for measurement data (A7), and analyticalmethods requirements (B4). MARLAP views the project plan documents as the principal productof the planning process.
4.6.2 Data Assessment
Assessment (verification, validation, and DQA) is the last step in the project�s data life cycle andprecedes the use of data. Assessment, and in particular DQA, is designed to evaluate thesuitability of project data to answer the underlying project question or the suitability of projectdata to support the project decision. The project planners should define the assessment process inenough detail that achievement or failure to meet goals can be established upon projectcompletion. An important output of the directed planning process to be captured in the projectplan document is the data verification, validation and assessment criteria and procedures.
4.6.2.1 Data Verification
Analytical data verification assures that laboratory conditions and operations were compliantwith the contractual SOW and the project plan. Verification compares the data package to theserequirements (contract compliance) and checks for consistency and comparability of the datathroughout the data package and completeness of the results to ensure all necessary documen-tation is available. Performance criteria for verification should be documented in the contract andin the project plan document in the sections that address data review, verification, and validationrequirements (D1), and verification and validation methods (D2).
4.6.2.2 Data Validation
Validation addresses the reliability of the data. During validation, the technical reliability and thedegree of confidence in reported analytical data are considered. Data validation criteria andprocedures should be established during the planning process and captured in the project plandocument (and the SOW for the validation contractor). Performance criteria for data validationcan be documented directly in the project plan document in data review, verifications, andvalidation requirements (D1) and verifications and validation methods (D2) or in a separate plan,which is included by citation or as an appendix in the project plan document.
Guidance on data validation plans is provided in Section 8.3. The data validation plan shouldcontain the following information:
� A summary of the project, which provides sufficient detail about the project�s APSs,including the MQOs;
4-16MARLAP JULY 2004
� The set of data to be validated and whether all the raw data will be reviewed and in whatdetail;
� The necessary validation criteria and the MQOs deemed appropriate for achieving projectDQOs;
� Specifications on what qualifiers are to be used and how final qualifiers are to be assigned;and
� Information on the content of the validation report.
4.6.2.3 Data Quality Assessment
Data quality assessment consists of a scientific and statistical evaluation of project-wideknowledge to determine if the data set is of the right type, quality and quantity to support itsintended use. The data quality assessor integrates the data validation report, field information,assessment reports and historical project data and compares the findings to the original projectobjectives and criteria (DQOs).
Performance criteria for data usability for the project should be documented in the project plandocuments in a section on DQA or reconciliation of the data results with DQOs (D3) or in aseparate plan, which is included by citation or as an appendix in the project plan document.Guidance on DQA plans is provided in Section 9.5. The DQA plan should contain the followinginformation:
� A summary of the project, which provides sufficient detail about the project�s DQOs andtolerable decision error rates;
� Identification of what issues will be addressed by the DQA;
� Identification of any statistical tests that will be used to evaluate the data;
� Description of how the representativeness of the data will be evaluated (for example, reviewthe sampling strategy, the suitability of sampling devices, subsampling procedures,assessment findings);
� Description of how the accuracy of the data, including potential impact of non-measurablefactors (for example, subsampling bias) will be considered (for example, review the APSsand the analytical plan, the suitability of analytical protocols, subsampling procedures,assessment findings);
� Description of how the MQOs will be used to determine the usability of measurement data(that is, did the uncertainty in the data significantly affect confidence in the decision);

Project Plan Documents
4-17JULY 2004 MARLAP
� Identification of what will be included in the DQA report; and
� Identification of who will receive the report and the mechanism for its archival.
4.7 Summary of Recommendations
� MARLAP recommends using a graded approach to project plan writing because of thediversity of environmental data collection activities.
� MARLAP recommends developing a primary integrating project plan that includes otherdocuments by citation or as appendices.
� MARLAP recommends developing project plan documents that integrate all technical andquality aspects for the life-cycle of the project, including planning, implementation, andassessment.
� MARLAP recommends including, by citation or as an appendix, the report on the directedplanning process in the project plan documents.
� If the planning process was not documented in a report, MARLAP recommends that asummary of the planning process addressing assumptions and decisions, established actionlevels, the DQO statement, and APSs (which include the established MQOs and any specificanalytical process requirements) be included in the project plan documents.
� MARLAP recommends using a formal process to control and document changes if updates ofthe original project plan document are needed.
4.8 References
American Society for Quality Control (ANSI/ASQC) E-4. Specifications and Guidelines forQuality Systems for Environmental Data Collection and Environmental TechnologyPrograms. 1995. American Society for Quality Control, Milwaukee, Wisconsin.
American Society of Mechanical Engineers (ASME) NQA-1. Quality Assurance ProgramRequirements for Nuclear Facilities. New York, New York. 1989.
American Society of Testing and Materials (ASTM) D5283. Standard Practice for Generation ofEnvironmental Data Related to Waste Management Activities: Quality Assurance andQuality Control Planning and Implementation. 1992. West Conshohocken, PA.

4-18MARLAP JULY 2004
American Society of Testing and Materials (ASTM) D5612. Standard Guide for QualityPlanning and Field Implementation of a Water Quality Measurements Program, 1994. WestConshohocken, PA.
American Society of Testing and Materials (ASTM) PS85. Standard Provisional Guidance forExpedited Site Characterization of Hazardous Waste Contaminated Sites. 1996. WestConshohocken, PA.
Code of Federal Regulations (CFR). 1999. 10 CFR 50 Appendix B, �Quality Assurance Criteriafor Nuclear Power Plants and Fuel Reprocessing Plants.�
Code of Federal Regulations (CFR). 1994. 10 CFR 830.120, �Nuclear Safety Management -Quality Assurance Requirements.�
Code of Federal Regulations (CFR). 1997. 40 CFR 300.430, �National Oil and HazardousSubstance Pollution Contingency Plan � Remedial Investigation/Feasibility Study andSelection of Remedy.�
U.S. Department of Defense (DOD). 1963. Quality Program Requirements. MilitarySpecification MIL-Q-9858A. Washington, DC.
U.S. Department of Energy (DOE). 1991. Quality Assurance. DOE Order 414.1A (ReplacedDOE Order 5700.6C), Washington, DC.
U.S. Environmental Protection Agency (EPA). 2000. EPA Policy and Program Requirements forthe Mandatory Agency-Wide Quality System. EPA Order 5360.1A2, Revised. Washington,DC. Available at www.epa.gov/quality/qa_docs.html.
U.S. Environmental Protection Agency (EPA). 2001. EPA Requirements for Quality AssuranceProject Plans (EPA QA/R-5). EPA/240/B-01/003. Office of Environmental Information,Washington, DC. Available at www.epa.gov/quality/qa_docs.html.
U. S. Environmental Protection Agency (EPA). 2002. Guidance on Developing QualityAssurance Project Plans (EPA QA/G-5). EPA/240/R-02/009. Office of EnvironmentalInformation, Washington, DC. Available at www.epa.gov/quality/qa_docs.html.
U.S. Environmental Protection Agency (EPA). 2003. Using Dynamic Field Activities for On-SiteDecision Making: A Guide for Project Managers. EPA/540/R-03/002. Office of Solid Wasteand Emergency Response, Washington, DC. Available at www.epa.gov/superfund/programs/dfa/index.htm.
International Organization for Standardization (ISO) 9001. Quality Systems - Model for QualityAssurance in Design, Development, Installation and Servicing. 1994.

Project Plan Documents
4-19JULY 2004 MARLAP
U.S. Army Corps of Engineers (USACE). 1997. Chemical Quality Assurance for Hazardous,Toxic and Radioactive Waste Projects. Engineer Manual EM 200-1-6. Available atwww.environmental.usace.army.mil/info/technical/chem/chemguide/chemusac/chemusac.html.
U.S. Army Corps of Engineers (USACE). 2001. Requirements for the Preparation of Samplingand Analysis Plans. Engineer Manual EM 200-1-3. Available at www.environmental.usace.army.mil/info/technical/chem/chemguide/chemusac/chemusac.html.
U.S. Nuclear Regulatory Commission (NRC). 1989. Standard Format and Content ofDecommissioning Plans for Licensees Under 10 CFR Parts 30, 40, and 70. Regulatory Guide3.65.

5-1JULY 2004 MARLAP
5 OBTAINING LABORATORY SERVICES
5.1 Introduction
This chapter provides guidance on obtaining radioanalytical laboratory services. In particular,this chapter discusses the broad items that should be considered in the development of aprocurement for laboratory services. Throughout this chapter, MARLAP uses the request forproposal (RFP) as an example of a procurement mechanism. Agencies and other organizationsmay use a variety of procurement mechanisms, depending upon circumstances and policies. TheRFP typically includes a statement of work (SOW), generic contract requirements, and thedescription of the laboratory qualification and selection process. It should be noted that for someagencies or organizations, not all technical, quality, and administrative aspects of a contract arespecified in a SOW; many are in the procurement document (RFP) or resulting contract. Moredetailed guidance and discussion on the content of the SOW and other contracting issues can befound in Appendix E (Contracting Laboratory Services). Appendix E includes types of procure-ment mechanisms (with emphasis on the request for proposal), typical proposal requirements,proposal evaluation and scoring, pre-award proficiency samples and audits, and post-awardcontract management. This chapter is written for contracting outside laboratory services, but theprincipal items and information provided would apply equally to similar services not requiring aformal contract, such as a service agreement within an Agency or organization. It should be notedthat the information and specifications of a SOW may appear in many procurement documentsother than a contract resulting from a RFP. These include purchase and work orders, task ordersunder existing Basic ordering agreements, or Government-wide Acquisition Contracts andMultiple Acquisition Schedule contracts, such as those offered by the U.S. General ServicesAdministration. MARLAP recommends that technical specifications be prepared in writing in asingle document, designated a SOW, for all radioanalytical laboratory services, regardless ofwhether the services are to be contracted out or performed by an Agency�s laboratory.
Analytical protocol specifications (APSs) should be compiled in the SOW in order for thelaboratory to propose the analytical protocols that the laboratory wishes to use for the project(Chapter 6). The development of APSs, whichincludes the measurement quality objectives(MQOs), is described in detail in Chapter 3,and the incorporation of these protocols intothe relevant project plan documents is coveredin Chapter 4. These specifications shouldinclude such items as the MQOs, the type andfrequency of quality control (QC) samples, thelevel of performance demonstration needed,number and type of samples, turnaround times,and type of data package.
Contents
5.1 Introduction . . . . . . . . . . . . . . . . . . . . . . . . . . 5-15.2 Importance of Writing a Technical and
Contractual Specification Document . . . . . . 5-25.3 Statement of Work�Technical Requirements 5-25.4 Request for Proposal�Generic Contractual
Requirements . . . . . . . . . . . . . . . . . . . . . . . . . 5-75.5 Laboratory Selection and Qualification
Criteria . . . . . . . . . . . . . . . . . . . . . . . . . . . . 5-115.6 Summary of Recommendations . . . . . . . . . . 5-155.7 References . . . . . . . . . . . . . . . . . . . . . . . . . . 5-16
Obtaining Laboratory Services
5-2MARLAP JULY 2004
Section 5.3 discusses the technical requirements of a SOW, Section 5.4 provides guidance ongeneric contractual requirements, and Section 5.5 discusses various elements of the laboratoryselection and qualification criteria.
5.2 Importance of Writing a Technical and Contractual SpecificationDocument
One objective of the SOW and contract documents is to provide the analytical requirements in aconcise format that will facilitate the laboratory�s selection of the appropriate analyticalprotocols. The authors of the SOW may be able to extract most, if not all, of the necessarytechnical information from properly prepared project plan documents (Chapter 4). If specificinformation is not available, the author should contact the planning team. The preparation of aSOW can be viewed as a check to make sure that the project planning documents contain all theinformation required for the selection and implementation of the appropriate analytical protocols.One important aspect of writing the SOW is that it should clearly identify the project laboratory�sresponsibility for documentation to be provided for subsequent data verification, validation, andquality assessment. These project laboratory requirements should be addressed in the assessmentplans developed during directed planning (Chapter 2).
5.3 Statement of Work�Technical Requirements
A review of the project plan documents (Chapter 4) should result in a summary list of thetechnical requirements needed to develop a SOW. Much of this information, including theproject MQOs and any unique analytical process requirements, will be contained in the APSs.When possible, a project summary of sufficient detail (i.e., process knowledge) to be useful tothe laboratory should be included in the SOW. The project planning team is responsible foridentifying and resolving key analytical planning issues and for ensuring that the resolutions ofthese issues are captured in the APSs. Consistent with a performance-based approach, the levelof specificity in the APSs is limited to those requirements that are essential to meeting theproject�s analytical data requirements. In response to such project management decisions, thelaboratory may propose for consideration several alternative validated methods that meet theMQOs under the performance-based approach (such as measurement of a decay progeny as analternate radionuclide; see Section 6.6, �Method Validation�). Chapter 7 provides guidance onthe evaluation of a laboratory and analytical methods.
The SOW should specify what the laboratory needs to provide in order to demonstrate its abilityto meet the technical specifications in the RFP. This should include documentation relative to themethod validation process to demonstrate compliance with the MQOs and information onprevious contracts for similar analytical work as well as performance in performance evaluation(PE) programs using the proposed method. Any specific requirements on sample delivery
Obtaining Laboratory Services
5-3JULY 2004 MARLAP
(Section 5.3.7) should also be made clear to the laboratory. In addition, the requirements for thelaboratory�s quality system should be discussed.
5.3.1 Analytes
Each APS should state the analyte of concern. The SOW should specify all analytes of concernand, when possible, an analyte�s expected chemical form and anticipated concentration range(useful information for separating high activity samples from low activity samples) and potentialchemical or radiometric interferences (Sections 3.3.1, �Develop Analyte List,� and 3.3.2,�Identify Concentration Ranges�). In some instances, because of process knowledge andinformation on the absence of equilibrium between analytes and their parents and progeny, theSOW may require the direct measurement of an analyte rather than allowing for the measurementof other radionuclides in the analyte�s decay chain. In these cases, the SOW should indicate theanalyses to be performed. Examples of analyses include gross alpha and beta, gammaspectrometry, and radionuclide/matrix-specific combinations such as 3H in water and 238Pu insoil.
5.3.2 Matrix
Each APS should state the sample matrix to be analyzed. The sample matrix for each radionuc-lide or analysis type (e.g., gamma-ray spectrometry) should be listed and described in detailwhere necessary. The matrix categories may include surface soil, sub-surface soil, sediment,sludge, concrete, surface water, ground water, salt water, aquatic and terrestrial biota, air, airsample filters, building materials, etc. Additional information should be provided for certainmatrices (e.g., the chemical form of the matrix for solid matrices) in order for the laboratory toselect the appropriate sample preparation or dissolution method (Section 3.3.3, �Identify andCharacterize Matrices of Concern�).
5.3.3 Measurement Quality Objectives
The APSs should provide the MQOs for each analyte-matrix combination. The MQOs can beviewed as the analytical portion of the overall project data quality objectives (DQOs). An MQOis a statement of a performance objective or requirement for a particular method performancecharacteristic. Examples of method performance characteristics include the method�s uncertaintyat some concentration, detection capability, quantification capability, specificity, analyteconcentration range, and ruggedness. An example MQO for the method uncertainty at someanalyte concentration such as the action level would be, �A method uncertainty of 0.5 Bq/g orless is required at the action level of 5.0 Bq/g� (Chapters 1, 3, and 19). The MQOs are a key partof a project�s APSs. Chapter 3 provides guidance on developing MQOs for select methodperformance characteristics.

Obtaining Laboratory Services
5-4MARLAP JULY 2004
5.3.4 Unique Analytical Process Requirements
The APS should state any unique analytical processing requirement. The SOW should give anymatrix-specific details necessary for the laboratory to process the sample, such as type of soil,type of debris to be removed, whether or not filtering a sample at the laboratory is required,processing whole fish versus edible parts, drying of soils, information on any known or suspectedinterferences, hazards associated with the sample, etc. (see Section 3.4, �Matrix-SpecificAnalytical Planning Issues�). In some cases, unique analytical process requirements or instruc-tions should be specified that further delineate actions to be taken in case problems occur duringsample processing. For example, the SOW may require that the laboratory reprocess anotheraliquant of the sample by a more robust technique when a chemical yield drops below a statedvalue.
If necessary, special instructions should be provided as to how or when the analytical results areto be corrected for radioactive decay or ingrowth. In some cases, the sample collection date maynot be the appropriate date to use in the decay or ingrowth equations.
5.3.5 Quality Control Samples and Participation in External Performance EvaluationPrograms
The SOW should state the type and frequency of internal QC samples needed as well as whetherthey are to be included on a batch or some other basis (see Chapter 18, Laboratory QualityControl). The batch size may be defined in the SOW and may vary depending on the analysistype. The quality acceptance limits for all types of QC samples should be stated (see Appendix Cfor guidance on developing acceptance limits for QC samples based on the MQO for methoduncertainty). In addition, the SOW should state when and how the project manager or thecontracting officer�s representative should be notified about any nonconformity. In addition, theSOW should spell out the conditions under which the laboratory will have to reanalyze samplesdue to a nonconformance.
The evaluation of the laboratory's ability to perform the required radiochemical analyses shouldbe based on the acceptability of the method validation documentation submitted by thelaboratory. The evaluation should also include the laboratory�s performance in various externalPE programs administered by government agencies or commercial radioactive source suppliersthat are traceable to a national standards laboratory or organization, such as the National Instituteof Standards and Technology (NIST). The source supplier�s measurement capabilities andmanufacturing processes should be linked to NIST according to ANSI N42.22 (additionalinformation on evaluating a laboratory�s performance is provided in Chapter 7). As such, theRFP should request the laboratory�s participation in a PE program, traceable to a nationalstandards organization, appropriate for the analytes and matrices under consideration. In addition,the weighting factor (Appendix C) given to scoring the laboratory�s performance in such aprogram should be provided to the laboratory. Some examples of government programs include

Obtaining Laboratory Services
5-5JULY 2004 MARLAP
DOE�s Quality Assessment Program (QAP) and the Mixed Analyte Performance EvaluationProgram (MAPEP) and the NIST-administered National Voluntary Laboratory AccreditationProgram (NVLAP) Performance Testing (PT) providers.
5.3.6 Laboratory Radiological Holding and Turnaround Times
The SOW should include specifications on the required laboratory radiological holding time (i.e.,the time between the date of sample collection and the date of analysis) and the sampleprocessing turnaround time (i.e., the time between the receipt of the sample at the laboratory tothe reporting of the analytical results). Such radiological holding and turnaround times, which areusually determined by specific project requirements, are typically specified in terms of calendaror working days. The SOW should state whether the laboratory may be requested to handleexpedited or rush samples. In some cases, time constraints become an important aspect of sampleprocessing (e.g., in the case of radionuclides that have short half-lives). Some analyses will callfor specific steps that take a prescribed amount of time. Requesting an analytical protocol thatrequires several days to complete is obviously not compatible with a 24-hour turnaround time.This highlights the need for input from radioanalytical specialists during the planning process.
In some cases, the required sample-processing turnaround times are categorized according togeneric headings such as routine, expedited or rush, and emergency sample processing. Underthese circumstances, the SOW should specify the appropriate category for the samples andanalyses.
5.3.7 Number of Samples and Schedule
Estimating the volume of work for a laboratory is commonly considered part of the planningprocess that precedes the initiation of a project. Thus, the SOW should estimate the anticipatedamount of work and should spell out the conditions under which the laboratory will have toreanalyze samples due to some non-conformance. Similarly, the estimate should allow thelaboratory to judge if its facility has the capacity to compete for the work. The estimate for thenumber of samples is a starting point, and some revision to the volume of work may occur,unless the laboratory sets specific limits on the number of samples to be processed.
The SOW should indicate whether samples will be provided on a regular basis, seasonally, or onsome other known or unknown schedule. It should also be specified if some samples may be sentby overnight carrier for immediate analysis. Holidays may be listed when samples will not besent to the laboratory. The SOW should state if Saturday deliveries may be required.Furthermore, it should specify whether samples will be sent in batches or individually, and fromone location or different locations.
Obtaining Laboratory Services
5-6MARLAP JULY 2004
The carrier used to ship samples to the laboratory should be experienced in the delivery of fieldsamples, provide next day and Saturday deliveries, have a package tracking system and befamiliar with hazardous materials shipping regulations.
5.3.8 Quality System
The RFP should require that a copy of the laboratory�s Quality System documentation (such as aQuality Manual), related standard operating procedures (including appropriate methods) anddocumentation (such as a summary of the internal QC and external PE sample results) beincluded with the proposal, as necessary. Only those radioanalytical laboratories that adhere to awell-defined quality system can ensure the appropriate quality of scientifically valid anddefensible data. The laboratory�s Quality System (NELAC, 2002; ANSI N42.23; ISO/IEC17025) for a radioanalytical laboratory should address at a minimum the following items:
� Organization and management; � Quality system establishment, audits, essential quality controls and evaluation and data
verification; � Personnel (qualifications and resumes); � Physical facilities�accommodations and environment; � Equipment and reference materials; � Measurement traceability and calibration; � Test methods and standard operating procedures (methods); � Sample handling, sample acceptance policy and sample receipt; � Records; � Subcontracting analytical samples; � Outside support services and supplies; and � Complaints.
The Intergovernmental Data Quality Task Force (IDQTF) has developed a Uniform FederalPolicy for Implementing Environmental Quality Systems. Agencies participating in the IDQTFare the Environmental Protection Agency, Department of Defense, and Department of Energy.The Uniform Federal Policy is a consensus document prepared by the IDQTF work groupand it provides recommendations and guidelines for documentation and implementation ofacceptable quality systems for federal agencies. Information on IDQTF and this policy may befound at www.epa.gov/swerffrr/documents/data_quality/ufp_sep00_intro.htm#quality.
5.3.9 Laboratory�s Proposed Methods
Under the performance-based approach to method selection, the laboratory will select andidentify radioanalytical methods (Chapter 6) that will meet the MQOs and other performancespecifications of the SOW. MARLAP recommends that the laboratory submit the proposedmethods and required method validation documentation with the formal response. The SOW

Obtaining Laboratory Services
5-7JULY 2004 MARLAP
should state that the proposed methods and method validation documentation will be evaluated inaccordance with established procedures by a technical evaluation committee (TEC) based onexperience, expertise, and professional judgement. MARLAP uses the term TEC for the groupthat performs this function. Agencies and other organizations may use various terms andprocedures for this process.
The TEC should provide their findings and recommendations to the organization�s contractingofficer for further disposition. In some cases, the organization may inform a laboratory that theproposed methods were deemed inadequate, and, if appropriate, request that the laboratorysubmit alternative methods with method validation documentation within a certain time period.
When the methods proposed by the laboratories have been deemed adequate to meet the technicalspecifications of the SOW, the TEC may want to rank the proposed methods (and laboratories)according to various factors (e.g., robustness, performance in PE programs or qualifying samples,etc.) as part of the contract scoring process.
5.4 Request for Proposal�Generic Contractual Requirements
Not all quality and administration aspects of a contract are specified in a SOW. Many quality(e.g., requirement for a quality system), administrative, legal, and regulatory items need to bespecified in a RFP and eventually in the contract. Although not inclusive, the items or categoriesdiscussed in the following sections should be considered as part of the contractual requirementsand specifications of a RFP.
5.4.1 Sample Management
The RFP should require the laboratory to have an appropriate sample management program thatincludes those administrative and quality assurance aspects covering sample receipt, control,storage and disposition. The RFP should require the laboratory to have adequate facilities,procedures, and personnel in place for the following actions (see Chapter 11, Sample Receipt,Inspection, and Tracking; and Chapter 17, Waste Management in a Radioanalytical Laboratory):
� Receive, log-in, and store samples in a proper fashion to prevent deterioration, cross-contamination, and analyte losses;
� Verify the receipt of each sample shipment: compare shipping documentation with samplesactually received; notify the point of contact or designee by telephone within a prescribednumber of business days and subsequently provide details in all case narratives of anydiscrepancies in the documentation;

Obtaining Laboratory Services
5-8MARLAP JULY 2004
� Sign, upon receipt of the samples, the sample receipt form or, if required, chain of custody(COC) form(s) submitted with each sample release. Only authorized laboratory personnelshould sign the forms. The signature date on the COC form, if required, is normally theofficial sample receipt date. All sample containers should be sealed prior to their removalfrom the site; and
� Store unused portions of samples in such a manner that the analyses could be repeated or newanalyses requested, if required, for a certain specified time period following the submissionof an acceptable data package. Unused sample portions should be stored with the samesample handling requirements that apply to samples awaiting analysis. Documentation shouldbe maintained pertaining to storage conditions and sample archival or disposal.
� Treat, store, or dispose of sample processing wastes, test and calibration sources, and samples(see also Section E.4.4.5, �Sample Storage and Disposal,� and Chapter 17)
5.4.2 Licenses, Permits and Environmental Regulations
Various federal, state, and local permits, licences and certificates (accreditation) may benecessary for the operation of a radioanalytical laboratory. The RFP should require the laboratoryto have the necessary government permits, licenses, and certificates in place before thecommencement of any laboratory work for an awarded contract. The following sections provide apartial list of those provisions that may be necessary. Some projects may require specialgovernment permits in order to conduct the work and transport and analyze related samples. Forthese cases, the necessary regulations or permits should be cited in the RFP.
5.4.2.1 Licenses
When required, the laboratory will be responsible for maintaining a relevant Nuclear RegulatoryCommission (NRC) or Agreement State License to accept low-level radioactive samples foranalyses. In certain circumstances, the laboratory may have to meet host nation requirements ifoperating outside the United States (e.g., military fixed or deployed laboratories locatedoverseas).
When necessary, the laboratory should submit a current copy of the laboratory�s radioactivematerials license with their proposal. Some circumstances may require a copy of the originalradioactive materials license. For more complete information on license requirements, refer toeither the NRC or state government offices in which the laboratory resides, or to 10 CFR 30.
5.4.2.2 Environmental and Transportation Regulations
Performance under a contract or subcontract must be in compliance with all applicable local,state, federal, and international laws and regulations. Such consideration must not only include
Obtaining Laboratory Services
5-9JULY 2004 MARLAP
relevant laws and regulations currently in effect, but also revisions thereto or public notice thathas been given that may reasonably be anticipated to be effective during the term of the contract.
The laboratory may be required to receive (and in some cases ship) samples according tointernational, federal, state, and local regulations (see Section 10.2.10, �Packaging andShipping,� for details). In particular, the laboratory should be aware of U.S. Postal Service andDepartment of Transportation (DOT) hazardous materials regulations applicable to therequirements specified in the SOW and that appropriate personnel should be trained in theseregulations. International shipping also is subject to International Air Transport AssociationDangerous Goods Regulations.
5.4.3 Data Reporting and Communications
The type of information, schedules and data reports required to be delivered by the laboratory, aswell as the expected communications between the appropriate staff or organizations, should bedelineated in the RFP. The required schedule and content of the various reports, including samplereceipt acknowledgment, chain of custody, final data results, data packages, QA/QC projectsummaries, status reports, sample disposition, and invoices should be provided in the RFP. Inaddition, the expected frequency and lines of communications should be specified.
In some cases, the RFP may request relevant information relative to the point-of-contact forcertain key laboratory positions such as the Laboratory Director, Project Manager, QA Officer,Sample Manager, Record Keeping Supervisor, Radiation Safety or Safety Officer andContracting Officer. Contact persons should be identified along with appropriate telephonenumbers (office, FAX, pager), e-mail, and postal and courier addresses.
5.4.3.1 Data Deliverables
The SOW should specify what data are required for data verification, validation, and qualityassessment. A data package, the pages of which should be sequentially numbered, may include aproject narrative, the results in a specified format including units, a data review checklist, anynon-conformance memos resulting from the work, sample receipt acknowledgment or chain ofcustody form (if required), sample and quality control sample data, calibration verification data,and standard and tracer information. In addition, the date and time of analysis, instrumentidentification, and analyst performing the analysis should be included on the appropriatepaperwork. At the inception of the project, initial calibration data may be required for thedetectors used for the work. When a detector is recalibrated, or a new detector is placed inservice, updated calibration data should be required whenever those changes could affect theanalyses in question. In some cases, only the summary or final data report may be requested. Inthese cases, the name of the data reviewer, the sample identification information, reference andanalysis dates, and the analytical results along with the reported measurement uncertaintiesshould be reported.
Obtaining Laboratory Services
5-10MARLAP JULY 2004
The SOW should specify the acceptable formats for electronic and hard copy records. The SOWalso should state at what intervals the data will be delivered (batch, monthly, etc.).
5.4.3.2 Software Verification and Control
The policy for computer software verification, validation and documentation typically areincluded in the laboratory�s Quality Manual. If there are specific software verification andvalidation requirements germane to the project, the RFP should instruct or specify suchrequirements. ASTM E919, �Standard Specification for Software Documentation for aComputerized System,� describes computer program documentation that should be provided by asoftware supplier. Other sources for software QC are ANSI ANS 10.3 �Documentation ofComputer Software� and IEEE Standard 1063, �IEEE Standard for Software UserDocumentation.�
5.4.3.3 Problem Notification and Communication
Communication is key to the successful management and execution of the contract. Problems,schedule delays, potential overruns, etc., can be resolved quickly only if communication betweenthe laboratory and organization�s representative is conducted promptly. The RFP should stateexplicitly when, how, and in what time frame communication or notification is required by thelaboratory for special technical events, such as the inability to meet MQO specifications for asample or analyte, when a QC sample result is outside of an acceptance limit or some other non-conformance and when�if required by the project manager�the laboratory fails to meet itsinternal QC specifications.
The laboratory should document and report all deviations from the method and unexpectedobservations that may be of significance to the data reviewer or user. Such deviations should bedocumented in the narrative section of the data package produced by the contract laboratory.Each narrative should be monitored closely to assure that the laboratory is documentingdepartures from contract requirements or acceptable practice.
Communication from the organization�s representative to the laboratory is also important. A keyelement in managing a contract is the timely review of the data packages provided by thelaboratory. Early identification of problems allows for corrective actions to improve laboratoryperformance and, if necessary, the cessation of laboratory analyses until solutions can beinstituted to prevent the production of large amounts of data that are unusable. Note that somesample matrices and processing methods can be problematic for even the best laboratories. Thus,the organization�s technical representative must be able to discern between failures due tolegitimate reasons and poor laboratory performance.

Obtaining Laboratory Services
5-11JULY 2004 MARLAP
5.4.3.4 Status Reports
The SOW may require the laboratory to submit, on a specified frequency, sample processingstatus reports that include such information as the sample identification number, receipt date,analyses required, expected analytical completion date and report date. Depending on theproject�s needs, a status report may include the disposition of remaining portions of samplesfollowing sample processing or sample processing wastes.
5.4.4 Sample Re-Analysis Requirements
There may be circumstances when samples should be reanalyzed due to questionable analyticalresults or suspected poor quality as reflected by the laboratory�s batch QC or external PTsamples. Specific instructions and contractual language should be included in the RFP thataddress such circumstances and the resultant fiscal responsibilities (Appendix E).
5.4.5 Subcontracted Analyses
MARLAP recommends that the RFP state that subcontracting will be permitted only with thecontracting organization�s approval. In addition, contract language should be included giving thecontracting organization the authority to approve proposed subcontract laboratories. Forcontinuity or for quality assurance, the contract may require one laboratory to handle the entireanalytical work load. However, the need may arise to subcontract work to another laboratoryfacility if the project calls for a large number of samples requiring quick turnaround times orspecific methodologies that are not part of the primary laboratory�s support services. The use ofmultiple service providers adds complexity to the organization�s tasks of auditing, evaluating andtracking services.
Any intent to use a subcontracted laboratory should be specified in the response to the RFP orspecific task orders. The primary laboratory should specify which laboratory(ies) are to be used,require that these laboratories comply with all contract or task order requirements, and verify thattheir operations can and will provide data quality meeting or exceeding the SOW requirements.Subcontract laboratories should be required to allow the contracting organization full access toinspect their operations, although it should be understood that the primary laboratory shouldmaintain full responsibility for the performance of subcontract laboratories.
5.5 Laboratory Selection and Qualification Criteria
A description of the laboratory qualification and selection process should be stated in the RFP.The initial stages of the evaluation process focus on the technical considerations only. Cost willenter the selection process later. The organization�s TEC considers all proposals and then makesan initial selection (see Figures E.6a and E.6b in Appendix E), at which time some laboratories
Obtaining Laboratory Services
5-12MARLAP JULY 2004
may be eliminated based on the screening process. The laboratory selection process is based onpredetermined criteria that are related to the RFP and how a laboratory is technically able tosupport the contract. A laboratory that is obviously not equipped to perform work according tothe RFP is certain to be dropped early in the selection process. In some cases, the stated ability tomeet the analysis request may be verified by the organization, through pre-award audits andproficiency testing as described below. Letters notifying unsuccessful bidders may be sent at thistime.
5.5.1 Technical Proposal Evaluation
The RFP requires each bidding contractor laboratory to submit a technical proposal and a copy ofits Quality Manual. This Quality Manual is intended to address all of the technical and generallaboratory requirements. As noted previously, the proposal and Quality Manual are reviewed bymembers of the TEC who are both familiar with the proposed project and are clearlyknowledgeable in the field of radiochemistry and laboratory management.
5.5.1.1 Scoring and Evaluation Scheme
The RFP should include information concerning scoring of proposals or weighting factors forareas of evaluation. This helps a laboratory to understand the relative importance of specificsections in a proposal and how a proposal will be evaluated or scored. This allows the laboratoryto focus on those areas of greater importance. If the laboratory submits a proposal that lackssufficient information to demonstrate support in a specific area, the organization can thenindicate how the proposal does not fulfill the need as stated in the request. Because evaluationformats differ from organization to organization, laboratories may wish to contact the organiza-tion for additional organization-specific details concerning this process. A technical evaluationsheet (TES) may be used in conjunction with the proposal evaluation plan as outlined in the nextsection (see Figures E.6a and E.6b in Appendix E) to list the total weight for each factor and toprovide a space for the evaluator�s assigned rating. In the event of a protest, the TES can be usedto substantiate the selection process. The TES also provides areas to record the RFP number,identity of the proposer, and spaces for total score, remarks, and evaluator�s signature. Thescoring and evaluation scheme is based on additional, more detailed, considerations which arediscussed briefly in the Sections E.4 and E.5 of Appendix E.
Once all proposals are accepted by the organization, the TEC scores the technical portion of theproposal. MARLAP recommends that all members of the TEC have a technical understanding ofthe subject matter related to the proposed work. These individuals are also responsible forresponding to any challenge to the organization�s selection for the award of the contract. Theiranswers to such challenges are based on technical merit in relation to the proposed work.

Obtaining Laboratory Services
5-13JULY 2004 MARLAP
5.5.1.2 Scoring Elements
Although each organization may have a different scoring process to evaluate a laboratory�sresponse to a RFP, there are various broad categories or common elements that are typicallyevaluated. For example, these may include the following:
� Technical merit; � Adequacy and suitability of laboratory resources and equipment; � Staff qualifications; � Related experience and record of past performance; and � Other RFP requirements.
Although each organization may score or weight these items differently, performance-basedcontracting requires the weighting of past performance of the contractor as a significant technicalelement. Each of these elements is considered in the following paragraphs. Outlined below arethe key elements that are discussed in more detail in Appendix E.
TECHNICAL MERIT
The response to the RFP should include details of the laboratory�s quality system and all theanalytical methods to be employed by the laboratory as well as the method validationdocumentation (Section 6.6). The information provided should outline or demonstrate that themethods proposed are likely to be suitable and meet the APSs. The methods should be evaluatedagainst the APSs and MQOs provided in the SOW. Chapter 7 provides guidance on theevaluation of methods and laboratories. The laboratory�s Quality Manual should be reviewed foradequacy and completeness to ensure the required data quality.
ADEQUACY AND SUITABILITY OF LABORATORY RESOURCES AND EQUIPMENT
When requested, the laboratory will provide a listing of the available instrumentation orequipment by analytical method category. In addition, the RFP may request information on theavailable sample processing capacity and the workload for other clients during the proposedcontract period. The information provided should be evaluated by the TEC to determine if thelaboratory has the sample processing capacity to perform the work. The instrumentation andequipment must be purchased, set-up, calibrated, and on-line before award of contract. Inaddition, the laboratory should provide information relative to the adequacy and suitability of thelaboratory space available for the analysis of samples.
STAFF QUALIFICATIONS
The RFP should require the identification of the technical staff and their duties, along with theireducational background and experience in radiochemistry, radiometrology or laboratory

Obtaining Laboratory Services
5-14MARLAP JULY 2004
operations. The laboratory staff that will perform the radiochemical analyses should be employedand trained prior to the award of the contract. Appendix E provides guidance on staffqualifications.
RELATED EXPERIENCE AND RECORD OF PAST PERFORMANCE
The RFP should require the laboratory to furnish references in relation to its past or present work.To the extent possible, this should be done with regard to contracts or projects similar incomposition, duration and number of samples to the proposed project. In some cases, thelaboratory�s previous performance for the same Agency may be given special consideration.
OTHER RFP REQUIREMENTS
Within the response to the RFP, the laboratory should outline the various programs andcommitments (QA, safety, waste management, etc.) as well as submit various certifications,licences, and permits to ensure the requirements of the RFP will be met. The reasonableness ofthe proposed work schedule, program, and commitments should be evaluated by the TEC. Inaddition, if accreditation is required in the RFP, the TEC should confirm the laboratory�saccreditation for radioanalytical services by contacting the organization that provided thecertification. The National Environmental Laboratory Accreditation Conference (NELAC) is anorganization formed to establish and promote performance standards for the inspection andoperation of environmental laboratories in support of the National Environmental LaboratoryProgram (NELAP). States and federal agencies serve as the accrediting authorities withinNELAP. If state-accredited, a laboratory typically is accredited by the state in which it resides,and if the state is a NELAP-recognized accrediting authority, the accreditation is recognized byother states and federal agencies approved under NELAP. If the state is not a NELAP-recognizedaccrediting authority, and an organization expects a laboratory to process samples from otherstates or the federal government, then additional accreditations may be required. The TEC shouldreview and confirm the applicability and status of the licenses and permits with respect to thetechnical scope and duration of the project.
5.5.2 Pre-Award Proficiency Evaluation
Some organizations may elect to send proficiency or PT samples (sometimes referred to as�performance evaluation� or �PE� samples) to the laboratories that meet a certain scoring criteriain order to demonstrate the laboratory�s analytical capability. The composition and number ofsamples should be determined by the nature of the proposed project. The PT sample matrixshould be composed of well-characterized materials. It is recommended that site specific PTmatrix samples or method validation reference material (MVRM; see Section 6.5.1, �Matrix andAnalyte Identification�) be used when available.
Obtaining Laboratory Services
5-15JULY 2004 MARLAP
Each competing lab should receive an identical set of PT samples. The RFP should specify whowill bear the cost of analyzing these samples as well as the scoring scheme (e.g., �pass/fail� or asliding scale). Any laboratory failing to submit results should be disqualified. The results shouldbe evaluated and each laboratory given a score. This allows the organization to make a secondcut�after which only two or three candidate laboratories are considered.
5.5.3 Pre-Award Assessments and Audits
The RFP should indicate that the laboratories with the highest combined scores for technicalproposals and proficiency samples may be given an on-site audit. A pre-award assessment oraudit may be performed to provide assurance that a selected laboratory is capable of fulfilling thecontract in accordance with the RFP. In other words, is the laboratory�s representation of itselfaccurate? To answer this question, auditors should be looking to see that a candidate laboratoryappears to have all the required elements to meet the proposed contract�s needs. Refer toAppendix E for details on the pre-award assessments and audits.
5.6 Summary of Recommendations
� MARLAP recommends that technical specifications be prepared in writing in a singledocument, designated a SOW, for all radioanalytical laboratory services, regardless ofwhether the services are to be contracted out or performed by an Agency�s laboratory.
� MARLAP recommends that the MQOs and analytical process requirements contained in theSOW be provided to the laboratory.
� MARLAP recommends that the SOW include the specifications for the action level and therequired method uncertainty for the analyte concentration at the action level for each analyte/matrix.
C MARLAP recommends that the laboratory submit the proposed methods and requiredmethod validation documentation with the formal response.
C MARLAP recommends that the RFP state that subcontracting will be permitted only with thecontracting organization�s approval.
C MARLAP recommends that all members of the TEC have a technical understanding of thesubject matter related to the proposed work.

Obtaining Laboratory Services
5-16MARLAP JULY 2004
5.7 References
5.7.1 Cited References
American National Standard Institute (ANSI) N42.23. Measurement and AssociatedInstrumentation Quality Assurance for Radioassay Laboratories. 2003.
American National Standard Institute (ANSI) ANS 10.3. Documentation of Computer Software.
American Society for Testing and Materials (ASTM) E919. Standard Test Methods for SoftwareDocumentation for a Computerized System. West Conshohocken, PA.
International Electrical and Electronics Engineers (IEEE). Standard 1063. Software UserDocumentation.
International Standards Organization/International Electrotechnical Commission (ISO/IEC)17025. General Requirements for the Competence of Testing and Calibration Laboratories,International Organization for Standardization, Geneva, Switzerland. December 1999, 26 pp.
National Environmental Laboratory Accreditation Conference (NELAC). 2002. NELACStandards. NELAC, Washington, DC. Available at: www.epa.gov/ttn/nelac/2002standards.html.
5.7.2 Other Sources
U.S. Department of Energy (DOE). 2001. Management Assessment and Independent AssessmentGuide. DOE G 414.1-1A. May. Available at: www.directives.doe.gov/pdfs/doe/doetext/neword/414/g4141-1a.html.
U.S. Department of Energy (DOE). 1997. Model Statement of Work for Analytical Laboratories.Albuquerque Operations Office. Prepared by AGRA Earth and Environmental, Inc.,Albuquerque, NM. March.
U.S. Department of Energy (DOE). 1999. Quality Assurance Management System Guide for usewith 10 CFR 830.120 and DOE O 414.1. DOE G 414.1-2. June. Available at: www.directives.doe.gov/cgi-bin/explhcgi?qry1666663647;doe-120#HL002.
U.S. Department of Energy (DOE). 2001. Management Assessment And Independent AssessmentGuide For Use With 10 CFR, Part 830, Subpart A, and DOE O 414.1A, Quality Assurance;DOE P 450.4, Safety Management System Policy; and DOE P 450.5, Line ES&H Oversight

Obtaining Laboratory Services
5-17JULY 2004 MARLAP
Policy. DOE G 414.1-1A. May. Available at: www.directives.doe.gov/pdfs/doe/doetext/neword/414/g4141-1a.html.
U. S. Environmental Protection Agency (EPA). 2002. Guidance for Quality Assurance ProjectPlans. EPA QA/G-5. EPA/240/R-02/009. Office of Environmental Information, Washington,DC. Available at www.epa.gov/quality/qa_docs.html.
U.S. Nuclear Regulatory Commission (NRC). 1994. NRC Procedures for Placement andMonitoring of Work With the U.S. Department of Energy (DOE). Directive 11.7, May 3.
U.S. Nuclear Regulatory Commission (NRC). 1996. NRC Acquisition of Supplies and Services.Directive 11.1, July 23.
Office of Federal Procurement Policy (OFPP) 1997. Performance-Based Service Contracting(PBSC) Solicitation/Contract/Task Order Review Checklist. August 8. Available at:www.arnet.gov/Library/OFPP/PolicyDocs/pbscckls.html.

6-1JULY 2004 MARLAP
6 SELECTION AND APPLICATION OF ANANALYTICAL METHOD
6.1 Introduction
This chapter provides guidance to both the project manager and the laboratory on the selectionand application of analytical method. It offers guidance to the project manager on the develop-ment of the analytical protocol specifications (APSs) from the laboratory�s perspective onmethod appropriateness and availability. It offers guidance to the laboratory on the key elementsto consider when selecting an analytical method (Section 1.4.5, �Analytical Protocol�) to meetthe objectives of the APSs contained in the statement of work (SOW). Assuming that thelaboratory has received a SOW, certain subsections within Section 6.5 provide guidance on howto review and properly evaluate the APSs therein. However, Section 6.5 also provides guidancefor the project planning team on the important laboratory considerations needed to develop themeasurement quality objectives (MQOs). Section 6.6 deals with method validation requirementsand has been written for both the project planners and the laboratory.
Because the method constitutes the major part of the analytical protocol (Chapter 1), this chapterfocuses on the selection of a method. However, other parts of the protocol should be evaluatedfor consistency with the method (Figure 6.1). MARLAP recommends the performance-basedapproach for method selection. Thus, the laboratory should be able to propose whichever methodmeets the project�s analytical data requirements (MQOs), within constraints of other factors suchas regulatory requirements, cost, and project deadlines. The selection of a method by thelaboratory is in response to the APSs (Chapter 3) that were formulated during the directedplanning process (Chapter 2) and documented in the SOW (Chapter 5, Obtaining LaboratoryServices). In most project plan documents, theproject manager or the project planning teamhas the authority and responsibility forapproving the methods proposed by thelaboratory. The APSs will, at a minimum,document the analytes, sample matrices, andthe MQOs. A MQO is a statement of aperformance objective or requirement for aparticular method performance characteristic.The MQOs can be viewed as the analyticalportion of the data quality objectives (DQOs;see Chapter 3).
Background material in Section 6.2.1 providesthe reader with the subtleties of the perfor-mance-based approach to method selection,contrasted with the use of prescribed methods
Contents
6.1 Introduction . . . . . . . . . . . . . . . . . . . . . . . . . . 6-16.2 Method Definition . . . . . . . . . . . . . . . . . . . . . 6-36.3 Life Cycle of Method Application . . . . . . . . 6-56.4 Generic Considerations for Method Development
and Selection . . . . . . . . . . . . . . . . . . . . . . . . 6-96.5 Project-Specific Considerations for Method
Selection . . . . . . . . . . . . . . . . . . . . . . . . . . . 6-116.6 Method Validation . . . . . . . . . . . . . . . . . . . 6-226.7 Analyst Qualifications and Demonstrated
Proficiency . . . . . . . . . . . . . . . . . . . . . . . . . 6-326.8 Method Control . . . . . . . . . . . . . . . . . . . . . . 6-336.9 Continued Performance Assessment . . . . . 6-346.10 Documentation To Be Sent to the Project
Manager . . . . . . . . . . . . . . . . . . . . . . . . . . . 6-356.11 Summary of Recommendations . . . . . . . . . . 6-366.12 References . . . . . . . . . . . . . . . . . . . . . . . . . . 6-36Attachment 6A: Bias-Testing Procedure . . . . . . . 6-39

Selection and Application of an Analytical Method
6-2MARLAP JULY 2004
����������������� ���������������� ���
���������� ��������� ���
������ �������������� ���
������������ ���
������������� ������������������������������
������ ������������������� ���� ���������� �
��� ���� ���������� �
�� ������� ����������� ���
������� ��� ���������������������� ����� ������ ���!
��������������
FIGURE 6.1 � Analytical process
and the importance of the directed planning process and MQOs in the selection of the method.This chapter does not provide a listing of existing methods with various attributes indexed tocertain applications. Analytical methods may be obtained from national standards bodies,government laboratories and publications, and the open literature.

Selection and Application of an Analytical Method
6-3JULY 2004 MARLAP
In this chapter, project method validation is defined as the demonstration of method applicabilityfor a particular project. MARLAP recommends that only methods validated for a project�sapplication be used. This recommendation should not be confused with the general methodvalidation that all methods should undergo during method development. The laboratory shouldvalidate the method to the APS requirements of a SOW for the analyte/matrix combination andprovide the project method validation documentation to the project manager prior to theimplementation of routine sample processing (Section 6.6.2). If applicable, consideration shouldbe given to the uncertainty of the laboratory�s protocol for subsampling (heterogeneity) of thereceived field sample when selecting a method. Appendix F provides guidance on theminimization of subsampling uncertainty.
Section 6.3 provides an overview of the generic application of a method for a project and how alaboratory meets the recommendations of the guidance provided in this and other chapters.Generic considerations for the method selection process that a laboratory should evaluate areprovided in Section 6.4. Project-specific considerations for method selection relevant to APSs arediscussed in Section 6.5. Recommendations on the degree of project method validation specifiedby the project planning team are outlined in Section 6.6. Sections 6.7, 6.8, and 6.9 provideguidance on analyst qualifications, method control, and continued laboratory performanceassessment, respectively. Section 6.10 outlines recommendations for the method proposal andmethod validation documentation that a laboratory should send to the project manager.
6.2 Method Definition
For this chapter, a laboratory �method� includes all physical, chemical, and radiometric processesconducted at a laboratory in order to provide an analytical result. These processes, depicted inFigure 6.1, may include sample preparation, dissolution, chemical separation, mounting forcounting, nuclear instrumentation counting, and analytical calculations. This chapter willemphasize the laboratory�s selection of the radioanalytical method that will be proposed inresponse to a SOW. Each method is assumed to address a particular analyte in a specified matrixor, in some cases, a group of analytes having the same decay emission category that can beidentified through spectrometric means (e.g., gamma-ray spectrometry). However, it should beemphasized that the project planning team should have evaluated every component of the APSsfor compatibility with respect to all analytes in a sample and the foreseen use of multipleanalytical methods by the laboratory. For example, samples containing multiple analytes must beof sufficient size (volume or mass) to ensure proper analysis and to meet detection and quantifi-cation requirements. Multiple analytes in a sample will require multiple analyses for which alaboratory may use a sequential method that addresses multiple analytes or stand-alone individualmethods for each analyte. The analytical protocol must ensure that the samples are properlypreserved for each analyte and sufficient sample is collected in the field to accommodate theanalytical requirements.

Selection and Application of an Analytical Method
6-4MARLAP JULY 2004
Certain aspects of a method are defined in this chapter in order to facilitate the method selectionprocess. The following subsections describe the underlying basis of a performance-basedapproach to method selection and provide a functional definition related to MARLAP.
Performance-Based Approach and Prescriptive Method Application
MARLAP uses a performance-based approach to selecting a method, which is based on ademonstrated capability to meet defined project performance criteria (e.g., MQOs). With aproperly implemented quality system, a validated method should produce appropriate andtechnically defensible results under the applicable conditions. The selection of any new methodusually requires additional planning and, in some cases, may result in additional methoddevelopment or validation. The selection of a method under the performance-based approachinvolves numerous technical, operational, quality, and economic considerations. However, themost important consideration in the selection of a method under the performance-based approachis compliance with the required MQOs for the analytical data. These requirements should bedefined in the SOW or appropriate project plan document.
When developing the MQOs, the project planning team should have evaluated all processes thathave a potential to affect the analytical data. Those involved in the directed planning processshould understand and communicate the needs of the project. They should also understand howthe sampling (field, process, system, etc.) and analytical activities will interact and the ramifica-tions that the data may have on the decisionmaking process. These interactive analysis andcommunication techniques should be applied in all areas where analytical data are produced. Asnew projects are implemented, it should not be assumed that the current methods are necessarilythe most appropriate and accurate; they should be reevaluated based on project objectives. Theapplication of a performance-based approach to method selection requires the quantitativeevaluation of all aspects of the analytical process. Once the MQOs for a project have beendetermined and incorporated into the APSs, under the performance-based approach, thelaboratory will evaluate its existing methods and propose one or more methods that meet eachAPS. This chapter contains guidance on how to use the APSs in the laboratory�s methodevaluation process.
The objective of a performance-based approach to method selection is to facilitate the selection,modification, or development of a method that will reliably produce quality analytical data asdefined by the MQOs. Under the performance-based approach, a laboratory, responding to aSOW, will propose a method that best satisfies the requirements of the MQO and the laboratory�soperations.
In certain instances, the requirement to use prescribed methods may be included in the SOW. Theterm �prescribed methods� has been associated with those methods that have been selected byindustry for internal use or selected by a regulatory agency, such as the U.S. EnvironmentalProtection Agency (EPA), for specific programs. The methods for analyzing radionuclides in
Selection and Application of an Analytical Method
6-5JULY 2004 MARLAP
drinking water prescribed by EPA (1980) provides an example of applying a limited number ofmethods to a well-defined matrix. In many companies or organizations, prescribed methods arewidely used. Methods that have been validated for a specific application by national standardsetting organizations such as the American Society for Testing and Materials (ASTM), AmericanNational Standards Institute (ANSI), American Public Health Association (APHA), etc., mayalso be used as prescribed methods by industry and government agencies.
Typically, the prescribed methods were selected by an organization to meet specific objectivesfor a regulation under consideration or for a program need. In most cases, the prescribed methodshad undergone some degree of method validation, and the responsible organization had requireda quality system to demonstrate continued applicability and quality, as well as laboratoryproficiency. The use of any analytical method, whether prescribed or from the performance-basedapproach, has a life cycle that can be organized into the major categories of selection, validation,and continued demonstrated capability and applicability. This chapter will cover in detail onlythe first two of these categories. A discussion on ongoing laboratory evaluations is presented inChapter 7 (Evaluating Methods and Laboratories) and Appendix C (MQOs for MethodUncertainty and Detection and Quantification Capability).
A final note should be made relative to prescribed methods and the performance-based approachto method selection. The performance-based approach for method selection allows more latitudein dealing with the potential diversity of matrices (such as waste-, sea-, ground- or surface water;biota; air filters; waste streams; swipes; soil; sediment; and sludge) from a variety of projects, orin dealing with different levels of data quality requirements or a laboratory�s analyticalproficiency. Even though the prescribed method approach may initially appear suitable and costeffective, it does not allow a laboratory to select a method from the many possible methods thatwill meet the MQOs.
Many individuals have the wrong impression that prescribed methods do not need to be validatedby a laboratory. However, as discussed in this chapter, all methods should be validated to somelevel of performance for a particular project by the laboratory prior to their use. In addition, thelaboratory should demonstrate continued proficiency in using the method through internal QCand external performance evaluation (PE) programs that use performance testing (PT) samples(Chapter 18, Laboratory Quality Control).
6.3 Life Cycle of Method Application
In responding to a SOW for a given analyte/matrix combination, a laboratory may have one ormore methods that may be appropriate for meeting the MQOs. The final method selected from aset of methods may be influenced by many other technical, operational, or quality considerations.Figure 6.2 provides an overview of the life cycle of the method application. Figure 6.3 expandsthe life cycle into a series of flow diagrams.

Selection and Application of an Analytical Method
6-6MARLAP JULY 2004
FIGURE 6.2 � Method application life cycle

Selection and Application of an Analytical Method
6-7JULY 2004 MARLAP
"���� ���#���������������$� ������������� ��#�%��� ���������������������������#������������ ���������� ���� ����������&������#������ �������������������������'��$���������� �������� ��� ����� ������� ���� ������� ���������� ��#������������������������ �&��������'��$����������(����� �#�"���� ��� ����� ������������������$�����������)������� ������*������ �+
�� ��(� �#������� ���������������'��$��������������������� �������� ��#������������������� ������ ���������������������� ������ ������ ��(�#�"���� ����� ����� ����������� ����� ��(&��������'��$������#�"���� �������������� ���� ���$� ����� ��(���#����������� ������������� ����
�
�� �������#������������������������������#��������������$� ������������������������� � ���#������� ������,�������� ��������� �������-����� ���� ��������������#������� ������,��������������.����������)����� �+����� �����������*����#������� ������,��������������������������������� �
�/0 �#���������� ������������������������ �1� ��(�#����������������/��#����������*������� ��������� ��� ��� � ����� ����������#���������/0������� ����� �������������������� ���� ���������������� �2�� ������������ �.�����������.���������� �������� �� ������������
�� ����3����� ������� ������� �����#������ ��� ����3����� ���������
��#���� �� �������������� �������� �� ���������������������-������������ ��)����'�+&���������/����*������ ��#���������'��$���������������������������� ������������ ���������� ��������
�#������ ���4�� ������������������ ���� ���� ��� ��(����������#�5� ����������� ������������1����� �������������������#�� � ���� �� �� ������� ����
����������� ���1������������ ���1������������� ���1��� �������16���������� ���#���������� �*���� ����4�� ����#�"���� �1������������������ ���� #�����������1���#��������1��������������#��������� ������������������1������ ���#��������1��������������� ����������#��� ��(���������� �����)������������������� ����+#��� ������������ ��)����� ���� ������� �+��� �� ���#��� ��������(� �#���*������ ����������������������������������� ���#�3����� ����� � ��������������� ����#�"��������� �����*���������� ���#�%�-�������$�� ������� ���#������� �1���������������*���� ����������� �#�"������ ������ �
������������ ���������������
���������� ��������������������
�������������������������������������� !"
������#������������������� �"
FIGURE 6.3 � Expanded Figure 6.2 addressing the laboratory�s method evaluation process

Selection and Application of an Analytical Method
6-8MARLAP JULY 2004
�������������
�������������������$%���������������������� &"
������'�������������� ("
�����$����������� ���������� ������*������ �������� �����2#�7�������(�� ���������� ���� ���#���������(�� ����� �������������� �#����������$�� �������������� �
�������� ���������� ���������� � ���
������ ������������ ������������ �2#��0�#��� ���������� ���������� � ���#������������� �������� �������
���4�� ��������������� ����������� ���#����������������$������������ ���#������$����� ���������� ���������� � ���#�"�������������
#��"����� ������ ���������� �� �$� ������������ ������������ �#�5���� ���#�5(��������8��������� ������ ��������� �
#�������� ��� ������������������� �.������ �������� �.����������������.�������$�� ���������
#�������� ��� ���������������� ���� ���#���� ���������$#�����������������#��� ����������
#��"����� ����� ������������ �� �#��"���� ���������� ���� �*���� ��������������*������ �������/0�
#����� ��������� ����������#���� �� ���������������#������� �����������
#����� ���� �������� ����8������ ������2� ���������� �������#����� ���� � ����*���� ����� ���
#��9�������.��� ��.������ ���������$���#�������1����# �#��������������������� ������ ���� � ����/������'�
#������� �����1������ ����������$� ������������������#���� �������� ���/�������#���0������� ���������� ���� �� ������� ���!��� �� ����
������#������������������� �"
'�����%��� ���������������������������� )"
#���� �������� ���/���������� �*���� ��������������� ����#��5( ������������������������������/�1���������������� ��� ����������-� ��������� ���������� ������������ ���#��5( ���������������������������������� �������5������2� ��������� ���� �����
� ������������#���� ���������� �������������� ���#���� �������������� �1���� �1�������������#��5( �������������� �1���� �1�������������
���%������������������� *+"
#���� ���������� �����������#��"����� � �������������#���� ������������� �����������������#����� $������������ �������������� �����������#����� ���� �������� ����8�/���������#���� ������� ������ ���/������������ �#���� ������8��( �������������� �#��5( ������������1�������/������������ �#�������� ������ �������� �#��"���� ���������� ��)������������ ���������+
FIGURE 6.3 (cont�d) � Expanded Fig. 6.2 addressing the laboratory�s method evaluation process
Selection and Application of an Analytical Method
6-9JULY 2004 MARLAP
6.4 Generic Considerations for Method Development and Selection
This section provides guidance on the technical, quality, and operational considerations for thedevelopment of a new method or the selection of an existing radioanalytical method. Unlessrequired by a regulatory or internal policy, rarely should a method be specified in an APS or aSOW. MARLAP recommends that a SOW containing the MQOs and analytical processrequirements be provided to the laboratory.
If the nature of the samples and analytes are known in advance, and variations in a sample matrixand analyte concentration are within a relatively small range, the development or selection ofanalytical methods is easier. In most situations, however, the number of samples, samplematrices, analyte interferences, chemical form of analytes, and variations among and withinsamples may influence the selection of a method for a given analyte. A number of radioanalyticalmethods are available, but no single method provides a general solution (all have advantages anddisadvantages). The method selection process should consider not only the classical radiochemi-cal methods involving decay emission detection (alpha, beta or gamma) but also non-nuclearmethods, such as mass spectrometric and kinetic phosphorescence analysis.
In the performance-based approach to method selection, the laboratory may select and propose agross measurement (alpha, beta, or gamma) method that can be applied to analyte concentrationswell below the action level for the analyte, as well as an analyte specific method for analytelevels exceeding a proposed �screening level� that is a fraction of the action level. For example,it may be acceptable to propose a gross measurement method when its method uncertainty meetsthe method uncertainty (absolute or uMR) requirement at concentration levels much below theaction level. A gross measurement method may be employed initially for some projects. Such anapproach would have to be agreed to by the laboratory and project manager. The project methodvalidation, discussed in Section 6.6.2, should demonstrate that the gross measurement methodcan measure the analyte of interest (directly or indirectly) at a proposed analyte screening levelconcentration and meet the method uncertainty requirement (uMR) in the presence of otherradionuclides. Appendix C provides guidance on how to determine an acceptable methoduncertainty at an analyte concentration relative to the action level.
In general, the development or selection of a method follows several broad considerations. Theseinclude analyte and matrix characteristics, technical complexity and practicality of methods,quality requirements, availability of equipment, facility and staff resources, regulatory concerns,and economic considerations. Each of the broad considerations can be detailed. The followinglist, although not inclusive, provides insight into the selection of an appropriate method. Many ofthese categories are discussed in subsequent MARLAP Part II chapters.
� Analyte/radionuclide/isotope of interest N Decay emission (particle or photon), atom detection, or chemical (photon detection) N Half-life of analyte
Selection and Application of an Analytical Method
6-10MARLAP JULY 2004
N Decay products (progeny); principal detection method or interference N Chemical/physical forms (e.g., gas, volatile) N Use of nondestructive or destructive sample analysis
� Level of other radionuclides or chemical interference N Level of decontamination or selectivity required, e.g., a decontamination factor of 103 for
an interfering nuclide (60Co) present with the analyte of interest (241Pu) N Resolution of measurement technique N Ruggedness of technique for handling large fluctuations in interference levels and
variations in a matrix N Radionuclides inherent in background
� Matrix N Destructive testing
� Stable elemental interferences� Difficulty in dissolution of a matrix � Difficulty in ensuring homogeneity of aliquant� Inconsistency in chemical forms and oxidation states of the analyte versus the tracer
N Non-destructive testing� Heterogeneity of final sample for analysis� Self absorption of particle/photon emissions within a matrix
� Degree of method complexity N Level of technical ability required of analysts N Reproducibility of quality results between analysts N Method applicability to sample batch processing N Extensive front-end chemical-processing technique (sample dissolution, analyte
concentration and purification/isolation, preparation for final form for radiometrics) N Nuclear instrumentation oriented technique (minimal chemical processing)
� Required sample turnaround time N Half-life of analyte N Sample preparation or chemical method processing time N Nuclear instrumentation measurement/analysis time N Chemical or sample matrix preservation time N Batch processing N Degree of automation available/possible
� Status of possible methods and applications N Validated for the intended application N Staff qualified and trained to use method(s) N Existing method QC

Selection and Application of an Analytical Method
6-11JULY 2004 MARLAP
N Specialized equipment, tracers, reagents, or materials available
� Hazardous or mixed-waste production N Older classical techniques versus new advanced chemical technologies N Availability and expense of waste disposal
� Associated costs N Labor, instrumentation usage, facilities, radiological waste costs N Method applicability to portable or mobile laboratory facilities N Availability of service hookups N Need for facility environmental controls N Need for regulatory permitting of mobile laboratory facility
6.5 Project-Specific Considerations for Method Selection
Certain parameters of the APSs (see Chapter 3 and the example in Figure 3.2) within the SOWare important to the method selection process. These include the analytes, matrix type, matrixcharacterization, analyte and matrix interferences, analyte speciation information gathered fromprocess knowledge, sample process specifications (such as radiological holding times and sampleprocessing turnaround times), and the MQOs. While these issues should be resolved duringproject planning, they are presented here as guidance to the laboratory for their review andevaluation of the technical adequacy of the SOW and to provide context for the methodevaluation and selection process. Many of the issues from the project planning point of view arediscussed in Section 3.3.
6.5.1 Matrix and Analyte Identification
The first step in selecting a method is knowing what analytes and sample matrices are involved.The following sections discuss what important information should accompany analyte and matrixidentification.
6.5.1.1 Matrices
A detailed identification and description of the sample matrix are important aspects in theselection of an analytical method to meet the MQOs. The SOW should provide the necessarydetailed sample matrix description, including those important matrix characteristics gatheredfrom process knowledge. The laboratory should evaluate whether the existing sample preparationand dissolution steps of a method (Chapters 10 and 12 through 15) will be sufficient to meet theMQOs or the general or project method validation requirements. The matrix will also determine,to a certain extent, waste handling and disposal at the laboratory. If the matrix description is toovague or generic, the laboratory should contact the technical representative named in the SOWand request additional information.
Selection and Application of an Analytical Method
6-12MARLAP JULY 2004
The laboratory should ensure that the sample matrix description in the SOW reflects what isconsidered to be the �sample� by the project manager and the description is of sufficient detail toselect the method preparation or analyte isolation steps that will meet the MQOs for the matrix.The laboratory should not accept generic sample matrix descriptions such as liquids or solids. Forexample, the differences between potable water and motor oil are obvious, but both may bedescribed as a �liquid sample.� However, there may be only subtle differences between potablesurface water and groundwater but major differences between potable and process effluentwaters. The laboratory should consider how much method ruggedness is needed in order toaddress the varied amounts of possible stable elements or compounds within a non-specifiedwater matrix. Furthermore, when water from a standing pool is received in the laboratory, it maycontain some insoluble matter. Now the questions arise whether the sample is the entire contentsof the container, what remains in the container, the insoluble material, or just the water? A claywill act as an ion exchange substrate, while a sand may have entirely different retentionproperties. Both can be described as a soil or sediment, but the properties with which they retaina radionuclide are substantially different; thus, the method to properly isolate a particularradionuclide will vary. The laboratory should ensure that the selected method is consistent withthe intended sample matrix, and the analytical results convey analyte concentration related to theproper matrix (i.e., Bq/L dissolved, Bq/L suspended, or Bq/L total). For such cases, thelaboratory should request the project manager to clarify the �matrix� or �sample� definition.
Matrices generically identified as �solid� require additional clarification or information in orderto select and validate a method properly. For example, sludges from a sewage treatment facilitymay be classified as a solid, but the suspended and aqueous portions (and possibly the driedresidual material) of the sample may have to be analyzed. Normally, the radionuclide concentra-tion in soils and sediments is reported in terms of becquerels per dry weight. However, certainprojects may require additional sample process specifications (Section 6.5.4) related to the soil orsediment matrix identification that will affect the method selection process and the reporting ofthe data. This may involve sectioning of core samples, specified drying temperature of thesample, determining wet-to-dry weight ratio, removing organic material or detritus, homogeni-zing and pulverizing, sieving and sizing samples, etc. In order to determine the average analyteconcentration of a sample of a given size containing radioactive particles, proper samplepreparation and subsampling coupled with the applicable analytical methods are required(Chapter 12, Laboratory Sample Preparation, and Appendix F, Laboratory Subsampling). Foralpha-emitting radionuclides, the method selected may only be suitable to analyze a few grams ofsoil or sediment, depending on the organic content. The laboratory should identify to the projectmanager the typical subsample or aliquant size that is used for the proposed method. Informationshould be provided to the laboratory on process knowledge. This information should indicatewhen sample inhomogeneities may exist due to:
� Radioactive particles; � Selected analyte adsorption onto soil or sediment particles; � Special chemical forms of the analyte; or
Selection and Application of an Analytical Method
6-13JULY 2004 MARLAP
� Any other special analyte circumstances.
Based on this information, the laboratory should propose sample preparation and analyticalmethods that will address these matrix characteristics. Information on the solubility of the analytecan be used to select the dissolution method employed (see Chapter 13, Sample Dissolution). Thelaboratory should submit the proposed methods annotated with the suspected matrixcharacterization issues.
When selecting the methods for the analysis of flora (terrestrial vegetation, vegetables, aquaticplants, algae, etc.) or fauna (terrestrial or aquatic animals) samples, the detailed information onthe matrix or the unique process specifications should be used by the laboratory to select orvalidate the method, or both. The laboratory should ensure that the specific units for theanalytical results are consistent with the matrix identification and unique process specificationsstated in the SOW. Most flora and fauna results are typically reported in concentrations of wetweight. However, for dosimetric pathway analyses, some projects may want only the edibleportion of the sample processed and the results to reflect this portion, e.g., fillet of sport fish,meat and fluid of clams, etc. For the alpha- and beta-emitting radionuclides, aquatic vegetationnormally is analyzed in the dry form, but the analyte concentration is reported as wet weight. Thelaboratory should ensure that the sample preparation method (Chapter 12) includes thedetermination of the necessary wet and dry weights.
These considerations bear not only on the method selected but also on how the sample should becollected and preserved during shipment. When possible, the laboratory should evaluate theproposed sample collection and preservation methods, as well as timeliness of shipping, forconsistency with the available analytical methods. Discrepancies noted in the SOW for suchcollateral areas should be brought to the attention of the project manager. For example, sedimentsamples that have been cored to evaluate the radionuclide depth profile should have beencollected and treated in a fashion to retain the depth profile. A common method is to freeze thecore samples in the original plastic coring sleeves and ship the samples on ice. The SOW shoulddefine the specifics on how to treat the core samples and the method of sectioning the samples(e.g., cutting the cores into the desired lengths or flash heating the sleeves with subsequentsectioning).
The SOW should have properly delineated the proper matrix specifications required for projectmethod validation. The purpose of the method validation reference material (MVRM) is toprovide a matrix, which closely approximates that of the project samples to be analyzed (Section6.6). The sample matrix must be characterized to the extent that the pertinent parameters are usedto prepare the MVRM for the project method validation (Section 6.6.2). The laboratory shouldensure that sufficient information and clarity have been provided on the matrix to conduct aproper method validation.

Selection and Application of an Analytical Method
6-14MARLAP JULY 2004
6.5.1.2. Analytes and Potential Interferences
The SOW should describe the analytes of interest and the presence of any other chemical andradionuclide contaminants (potential method interferences and their anticipated concentration)that may be in the samples. This information should be provided in the SOW to allow thelaboratory�s radiochemist to determine the specificity and ruggedness of a method that willaddress the multiple analytes and their interferences. The delineation of other possible interferingradionuclides is extremely important in the selection of a method to ensure that the necessarydecontamination factors and purification steps are considered.
The size of the sample needed by the laboratory will depend on the number of analytes andwhether the laboratory will select individual methods for each analyte or a possible �sequential�analytical method, where several analytes can be isolated from the same sample and analyzed. Ifa sample size is listed in the SOW, the laboratory should determine if there will be sufficientsample available to analyze all analytes, the associated QC samples, and any backup sample forre-analyses. Other aspects, such as the presence of short-lived analytes or analytes requiring verylow detection limits, may complicate the determination of a proper sample size.
The laboratory should ensure that the project method validation requirements in the SOW areconsistent with the analytes and matrix. The project method validation protocols defined inSection 6.6.2 are applicable to methods for single analyte analyses or to a �sequential method�where several analytes are isolated and analyzed. The laboratory should develop a well-plannedprotocol for project method validation that considers the method(s), analyte(s), matrix andvalidation criteria.
6.5.2 Process Knowledge
Process knowledge typically is related to facility effluent and environmental surveillanceprograms, facility decommissioning, and site remediation activities. Important processknowledge may be found in operational history or regulatory reports associated with thesefunctions or activities. It is imperative that the laboratory review the information provided in theSOW to determine whether the anticipated analyte concentration and matrix are consistent withthe scope of the laboratory operations. Process knowledge contained in the SOW should providesufficient detail for the laboratory to determine, quickly and decisively, whether or not to pursuethe work. If sufficient detail is not provided in the SOW, the laboratory should request the projectplanning documents. Laboratories having specialized sample preparation facilities that screen thesamples upon arrival can make the necessary aliquanting or dilutions to permit the processing ofall low-level samples in the laboratories. Laboratories that have targeted certain sectors of thenuclear industry or a particular nuclear facility may be very knowledgeable in the typicalchemical and physical forms of the analytes of a given sample matrix and may not requiredetailed process knowledge information. However, under these circumstances, the laboratory�s
Selection and Application of an Analytical Method
6-15JULY 2004 MARLAP
method should be robust and rugged enough to handle the expected range of analyte concen-trations, ratios of radionuclide and chemical interferences, and variations in the sample matrix.
Process knowledge may provide valuable information on the possible major matrix constituents,including major analytes, chemical/physical composition, hazardous components, radiationlevels, and biological growth (e.g., bacteria, algae, plankton, etc.) activities. When provided, thelaboratory should use this information to determine if the sample collection and preservationmethodologies are consistent with the proposed radioanalytical method chosen. In addition, theinformation also should be reviewed to ensure that the proposed sample transportation orshipping protocols comply with regulations governing the laboratory operation.
Process knowledge information in the SOW may be used by the laboratory to refine methodselection from possible radiometric/chemical interferences, chemical properties of the analytes ormatrix, and hazardous components, among others. Chapter 14 describes the various genericchemical processes that may be used to ensure proper decontamination or isolation of the analytefrom other interferences in the sample. These include ion exchange, co-precipitation, oxidation/reduction, and solvent extraction among others. The process knowledge information provided inthe SOW should be reviewed to determine whether substantial amounts of a radionuclide thatnormally would be used as a radiotracer will be present in the sample. Similarly, information onthe levels of any stable isotope of the analyte being evaluated is equally important. Substantialambient or background amounts of either a stable isotope of the radionuclide or the radiotracer inthe sample may produce elevated and false chemical yield factors. In addition, substantialamounts of a stable isotope of the analyte being evaluated may render certain purificationtechniques inadequate (e.g., ion exchange or solid extractants).
6.5.3 Radiological Holding and Turnaround Times
The SOW should contain the requirements for the analyte�s radiological holding and sampleturnaround times. MARLAP defines radiological holding time as the time differential betweenthe date of sample collection and the date of analysis. It is important that the laboratory reviewthe specifications for radionuclides that have short half-lives (less than 30 days), because themethod proposed by the laboratory may depend on the required radiological holding time. Forvery short-lived radionuclides, such as 131I or 224Ra, it is very important to analyze the sampleswithin the first two half-lives in order to meet the MQOs conveniently. A laboratory may haveseveral methods for the analysis of an analyte, each having a different analyte detection andquantification capability. Of the possible methods available, the method(s) selected and proposedby the laboratory should address the time-related constraints of the radioanalytical process, suchas the radiological holding time requirement, half-life of the analyte, and the time available aftersample receipt at the laboratory. When a laboratory has several methods to address variations inthese constraints, it is recommended that the laboratory propose more than one method with aclarification that addresses the radiological holding time and MQOs. In some cases, circum-stances arise which require the classification of sample processing into several time-related
Selection and Application of an Analytical Method
6-16MARLAP JULY 2004
categories (Chapter 5). For example, the determination of 131I in water can be achieved readilywithin a reasonable counting time through direct gamma-ray spectrometry (no chemistry) using aMarinelli beaker counting geometry, when the detection requirement is 0.4 Bq/L and the radio-logical holding time is short. However, when the anticipated radiological holding time is in theorder of weeks, then a radiochemistry method using beta detection or beta-gamma coincidencecounting would be more appropriate to meet the detection requirement. The more sensitivemethod also may be used when there is insufficient sample size or when the analyte has decayedto the point where the less sensitive method cannot meet the required MQOs. Another examplewould be the analysis of 226Ra in soil, where the laboratory could determine the 226Ra soilconcentration through the quantification of a 226Ra decay product by gamma-ray spectrometryafter a certain ingrowth period, instead of direct counting of the alpha particle originating fromthe final radiochemical product (micro-precipitate) using alpha spectrometry.
Sample (processing) turnaround time normally means the time differential from the receipt of thesample at the laboratory to the reporting of the analytical results. As such, the laboratory shouldevaluate the SOW to ensure that the sample turnaround time, radiological holding time, datareduction and reporting times, and project needs for rapid data evaluation are consistent andreasonable. Method selection should take into consideration the time-related SOW requirementsand operational aspects. When discrepancies are found in the SOW, the laboratory shouldcommunicate with the project manager and resolve any issue. Additionally, the response to theSOW should include any clarifications needed for sample turnaround time and/or radiologicalholding time issues.
6.5.4 Unique Process Specifications
Some projects may incorporate detailed sample processing parameters, specifications, or bothwithin the SOW. Specifications for parameters related to sample preparation may include thedegree of radionuclide heterogeneity in the final sample matrix prepared at the laboratory, thelength of the sections of a soil or sediment core for processing, analysis of dry versus wet weightmaterial, partitioning of meat and fluid of bivalves for analyses, and reporting of results forcertain media as a dry or wet weight. Specifications related to method analysis could includeradionuclide chemical speciation in the sample matrix. The laboratory must evaluate thesespecifications carefully, since various parameters may affect the method proposed by thelaboratory. When necessary, the laboratory should request clarification of the specifications inorder to determine a compatible method. In addition, the laboratory should ensure that the projectmethod validation process is consistent with the unique process requirements. In some cases, notall special process specifications must be validated and, in other cases, site-specific materials(also referred to as MVRM) will be required for method validation. When necessary, thelaboratory also should request site-specific reference materials having the matrix characteristicsneeded for proper method validation consistent with the special process requirements. It isincumbent upon the laboratory to understand clearly the intent of the special processspecifications and how they will be addressed.

Selection and Application of an Analytical Method
6-17JULY 2004 MARLAP
6.5.5 Measurement Quality Objectives
The specific method performance characteristics having a measurement quality objective mayinclude:
� Method uncertainty at a specified analyte concentration level; � Quantification capability (minimum quantifiable concentration); � Detection capability (minimum detectable concentration); � Applicable analyte concentration range; � Method specificity; and � Method ruggedness.
How each of these characteristics affect the method selection process will be discussed in detailin the subsequent paragraphs.
6.5.5.1 Method Uncertainty
From the directed planning process, the required method uncertainty at a stated analyteconcentration should have been determined for each analyte/matrix combination. The methoduncertainty requirement may be linked to the width of the gray region (Appendices B and C).MARLAP recommends that the SOW include the specifications for the action level and therequired method uncertainty for the analyte concentration at the action level for each combinationof analyte and matrix. For research and baseline monitoring programs, the action level and grayregion concepts may not be applicable. However, for these applications, the project managershould establish a concentration level of interest and a required method uncertainty at that level.The laboratory should ensure that this method uncertainty requirement is clearly stated in theSOW.
The laboratory should select a method that will satisfy the method uncertainty requirement at theaction level or other required analyte level. MARLAP uses the term �method uncertainty� torefer to the predicted uncertainty of a result that would be measured if a method were applied to ahypothetical laboratory sample with a specified analyte concentration. The uncertainty of eachinput quantity (method parameter) that may contribute significantly to the total uncertaintyshould be evaluated. For some methods, the uncertainty of an input quantity may vary by analystor spectral unfolding software. Chapter 19 provides guidance on how to calculate the combinedstandard uncertainty of the analyte concentration, and Section 19.6.12 shows how to predict theuncertainty for a hypothetical measurement. For most basic methods, uncertainty values for thefollowing input quantities (parameters) may be necessary when assessing the total uncertainty:
� Counting statistics (net count rate); � Detector efficiency, if applicable; � Chemical yield (when applicable) or tracer yield;

Selection and Application of an Analytical Method
6-18MARLAP JULY 2004
� Sample volume/weight; � Decay/ingrowth factor; and � Radiometric interference correction factor.
Typically, for low-level environmental remediation or surveillance activities, only those inputquantities having an uncertainty greater than one percent significantly contribute to the combinedstandard uncertainty. Other than the radiometric interference correction factor and countinguncertainties, most input quantity uncertainties normally do not vary as a function of analyteconcentration. At analyte levels near or below the detection limit, the counting uncertainty maydominate the method�s uncertainty. However, at the action level or above, the countinguncertainty may not dominate.
When appropriate, the laboratory should determine the method uncertainty over the MQO analyteconcentration range (Section 6.5.5.4), including the action level or other specified analyte con-centration. The laboratory�s project method validation (Section 6.6.2) should demonstrate orshow through extrapolation or inference (e.g., from a lower or higher range of concentrations)that this method uncertainty requirement can be met at the action level or specified analyteconcentration value. Method validation documentation should be provided in the response to theSOW.
6.5.5.2 Quantification Capability
For certain projects or programs, the project planning team may develop an MQO for thequantification capability of a method. The quantification capability, expressed as the minimumquantifiable concentration (MQC), is the smallest concentration of the analyte that ensures aresult whose relative standard deviation is not greater than a specified value, usually 10 percent.Chapter 19 provides additional information on the minimum quantifiable concentration.
For example, if the MQC requirement for 89Sr is 1.0 Bq/g (with a 10 percent relative standarddeviation), the laboratory should select a method that has sufficient chemical yield, beta detectionefficiency, low background, and sample (processing) turnaround time for a given sample mass toachieve a nominal measurement uncertainty of 0.1 Bq/g. The same forethought that a laboratorygives to estimating a method�s minimum detectable concentration (MDC) for an analyte shouldbe given to the MQC requirement. The laboratory should consider the uncertainties of all inputquantities (detector efficiency, chemical yields, interferences, etc.), including the countinguncertainty when selecting a method. This is an important consideration, because for somemethods, the counting uncertainty at the MQC level may contribute only 50 percent of thecombined standard uncertainty. Therefore, the laboratory may have to select a method that willmeet the MQC requirement for a variety of circumstances, including variations in matrixconstituents and chemical yields, radionuclide and chemical interferences, and radioactive decay.In addition, sufficient sample size for processing may be critical to achieving the MQCspecification.

Selection and Application of an Analytical Method
6-19JULY 2004 MARLAP
During the project method validation process, the ability of the method to meet the requiredMQC specification should be tested. The method validation acceptance criteria presented inSection 6.6 have been formulated to evaluate the MQC requirement at the proper analyteconcentration level, i.e., action level or other specified analyte concentration.
Since the laboratory is to report the analyte concentration value and its measurement uncertaintyfor each sample, the project manager or data validator easily can evaluate the reported data todetermine compliance with the MQC requirement. Some projects may send PT material spiked atthe MQC level as a more in-depth verification of the compliance with this requirement.
6.5.5.3 Detection Capability
For certain projects or programs, the method selected and proposed by the laboratory should becapable of meeting a required MDC for the analyte/matrix combination for each sampleanalyzed. For certain monitoring or research projects, the required analyte MDC may be the mostimportant MQO to be specified in the SOW. For such projects, the MDC specification may bebased on the analyte concentration of interest or the state-of-the-art capability of the employedtechnology or method. No matter what premise is used to set the value by the project planningteam, the definition of, or the equation used to calculate, the analyte MDC should be provided inthe SOW (Chapter 20). Furthermore, the SOW should specify how to treat appropriate blanks orthe detector background when calculating the MDC. The laboratory should be aware that not allagencies or organizations define or calculate the MDC in the same manner. It is important for thelaboratory to check that the SOW clearly defines the analyte detection requirements. In mostcases, it would be prudent for the laboratory to use a method that has a lower analyte MDC thanthe SOW required MDC.
In some situations, a radiochemical method may not be robust or specific enough to addressinterferences from other radionuclides in the sample. The interferences may come from theincomplete isolation of the analyte of interest resulting in the detection of the decay emissionsfrom these interfering nuclides. These interferences would increase the background of themeasurement for the analyte of interest and, thus, increase the uncertainty of the measurementbackground. Consequently, an a priori MDC that is calculated without prior sample knowledgeor inclusion of the interference uncertainties would underestimate the actual detection limit forthe sample under analysis. Another example of such interferences or increase in an analyte�sbackground uncertainty can be cited when using gamma-ray spectrometry to determine 144Ce inthe presence of 137Cs. The gamma energy usually associated with the identification and quanti-fication of 144Ce is 133.5 keV. The gamma energy for 137Cs is 661.6 keV. If a high concentrationof 137Cs is present in the sample, the Compton scattering from the 661.6 keV into the 133.5 keVregion may decrease the ability to detect 144Ce by one to two orders of magnitude over an a prioricalculation that uses a nominal non-sample specific background uncertainty. Another examplecan be cited for alpha-spectrometry and the determination of isotopic uranium. If some inter-fering metal is present in unexpected quantities and carries onto the final filter mount or electro-

Selection and Application of an Analytical Method
6-20MARLAP JULY 2004
deposited plate, a substantial decrease in the peak resolution may occur (resulting in an increasedwidth of the alpha peak). Depending on the severity of the problem, there may be overlappingalpha peaks resulting in additional interference terms that should be incorporated into the MDCequation. In order to avoid subsequent analyte detection issues, it is important for the laboratoryto inquire whether or not the project manager has considered all the constituents (analytes andinterferences) present in the sample when specifying a detection limit for an analyte.
The laboratory should include documentation in the response to the SOW that the methodproposed can meet the analyte�s MDC requirements for the method parameters (e.g., sample sizeprocessed, chemical yield, detector efficiency, counting times, decay/ingrowth correction factors,etc.). When practicable, care should be given to ensure the blank or detector background uncer-tainty includes contributions from possible anthropogenic and natural radionuclide interferences.In addition, any proposed screening method should meet the detection limit requirement in thepresence of other radionuclide interferences or natural background radioactivity. Whenappropriate or required, the laboratory should test the method�s capability of meeting the requiredMDC using MVRMs that have analytes and interferences in the expected analyte concentrationrange. Upon request, the project manager should arrange to provide MVRMs to the laboratory.
6.5.5.4 Applicable Analyte Concentration Range
The SOW should state the action level for the analyte and the expected analyte concentrationrange. The proposed method should provide acceptable analytical results over the expectedanalyte concentration range for the project. Acceptable analytical results used in this contextmeans consistent method precision (at a given analyte concentration) and without significantbias. The applicable analyte concentration range may be three or four orders of magnitude.However, most radioanalytical methods, with proper analyte isolation and interference-decon-tamination steps, will have a linear relationship between the analytical result and the analyteconcentration. For certain environmental monitoring or research projects, the laboratory shouldensure that there are no instrument or analytical blank background problems. If the background isnot well-defined, there may be an inordinate number of false positive and false negative results.
In its response to the SOW, the laboratory should include method validation documentation thatdemonstrates the method�s capability over the expected range. The laboratory�s project methodvalidation (Section 6.6) should demonstrate or show through extrapolation or inference (e.g.,from a different range of concentrations) that the method is capable of meeting the analyteconcentration range requirement.
6.5.5.5 Method Specificity
The proposed method should have the necessary specificity for the analyte/matrix combination.Method specificity refers to the method�s capability, through the necessary decontamination orseparation steps, to remove interferences or to isolate the analyte of interest from the sample over

Selection and Application of an Analytical Method
6-21JULY 2004 MARLAP
the expected analyte concentration range. Method specificity is applicable to both stable andradioactive constituents inherent in the sample. Certain matrices, such as soil and sediments,typically require selective isolation of femtogram amounts of the analyte from milligrams togram quantities of matrix material. In these circumstances, the method requires both specificityand ruggedness to handle variations in the sample constituents.
If other radionuclide interferences are known or expected to be present, the SOW should providea list of the radionuclides and their expected concentration ranges. This information enables thelaboratory to select and propose a method that has the necessary specificity to meet the MQOs.As an alternative, the project manager may specify in the SOW the degree of decontamination amethod needs for the interferences present in the samples. If the laboratory is not provided thisinformation, method specificity cannot be addressed properly. The laboratory should ensure thatrelated information on the matrix characteristics, radiometric or chemical interferences, andchemical speciation is provided to properly select a method.
6.5.5.6 Method Ruggedness
Ruggedness is the ability of the method to provide accurate analytical results over a range ofpossible sample constituents, interferences, and analyte concentrations, as well as to toleratesubtle variations in the application of the method by various chemists (EPA, 2002; APHA,1998). Ruggedness is somewhat qualitative (Chapter 7). Therefore, the desirable parameters of arugged method are difficult to specify quantitatively. A ruggedness test usually is conducted bysystematically altering the critical variables (or quantities) associated with the method andobserving the magnitude of the associated changes in the analytical results. ASTM E1169provides generic guidance on how to conduct method ruggedness tests under short-term, high-precision conditions. In many cases, a rugged method may be developed over time (typicallywhen difficulty is experienced applying an existing method to variations in the sample matrix orwhen two analysts have difficulty achieving the same level of analytical quality).
A laboratory may have several methods for an analyte/matrix combination. Samples fromdifferent geographical locations or different processes may have completely differentcharacteristics. Therefore, the laboratory should select a method that is rugged enough to meetthe APSs in the SOW. As indicated in Section 6.6.2, the prospective client may send site-specificMVRM samples for the method validation process or for PT samples (Chapter7).
6.5.5.7 Bias Considerations
As discussed earlier, the proposed method should provide acceptable analytical results over theexpected analyte concentration range for the project. Acceptable results used in this contextmeans consistent method precision (at a given analyte concentration) and without significantbias. According to ASTM (E177, E1488, D2777, D4855), �bias of a measurement process is ageneric concept related to a constant or systematic difference between a set of test results from

Selection and Application of an Analytical Method
6-22MARLAP JULY 2004
the process and an accepted reference value of the property being measured,� or �the differencebetween a population mean of the measurements or test results and the accepted reference or truevalue.� ASTM (D2777) defines precision as �the degree of agreement of repeated measurementsof the same property, expressed in terms of dispersion of test results (measurements) about thearithmetical mean result obtained by repetitive testing of a homogeneous sample under specifiedconditions.� MARLAP considers bias to be a persistent difference of the measured result fromthe true value of the quantity being measured, which does not vary if the measurement isrepeated. Normally, bias cannot be determined from a single result or a few results (unless thebias is large) because of the analytical uncertainty component in the measurement. Bias may beexpressed as the percent deviation from a �known� analyte concentration. Note that the estimatedbias, like any estimated value, has an uncertainty�it is not known exactly.
If bias is detected in the method validation process (see Section 6.6.4, �Testing for Bias�) or fromother QA processes, the laboratory should make every effort to eliminate it when practical.Implicitly, bias should be corrected before using the method for routine sample processing.However, in some cases, the bias may be very small and not affect the overall data quality. Theproject manager should review the method validation documentation and results from internalQC and external PE programs obtained during the laboratory review process (Chapter 7) anddetermine if there is a bias and its possible impact on data usability.
6.6 Method Validation
Without reliable analytical methods, all the efforts of the project may be jeopardized. Financialresources, timeliness, and public perception and confidence are at risk, should the data later becalled into question. Proof that the method used is applicable to the analyte and sample matrix ofconcern is paramount for defensibility. The project manager should ensure the methods used inthe analyses of the material are technically sound and legally defensible.
The method selected and proposed by the laboratory must be based on sound scientific principlesand must be demonstrated to produce repeatable results under a variety of sample variations.Each step of the method should have been evaluated and tested by a qualified expert (radio-analytical specialist) in order to understand the limits of each step and the overall method interms of the MQOs. These steps may involve well-known and characterized sample digestion,analyte purification and decontamination steps that use ion exchange, solvent extraction,precipitation and/or oxidation /reduction applications. Method validation will independently testthe scientific basis of the method selected for a given analyte and sample matrix.
EURACHEM (1998) interprets method validation as �being the process of defining an analyticalrequirement, and confirming that the method under consideration has performance capabilitiesconsistent with what the application requires. Implicit in this is that it will be necessary toevaluate the method�s performance capabilities.� As such, the laboratory is responsible for

Selection and Application of an Analytical Method
6-23JULY 2004 MARLAP
ensuring that a method is validated adequately. MARLAP distinguishes between general methodvalidation and project method validation. During the development of an analytical method orprior to the first use of a recognized industry or government method, laboratories typicallyperform a general method validation. General method validation is normally conducted todetermine the capability of the method for a single analyte/matrix combination to meet internallaboratory quality requirements.
For the purposes of MARLAP, project method validation is the demonstration that theradioanalytical method selected by the laboratory for the analysis of a particular radionuclide in agiven matrix is capable of providing analytical results that meet a project�s MQOs and any otherrequirements in the APS. A proposed method for a specific combination of analyte and matrixshould be validated in response to the requirements within a SOW. Demonstration of methodperformance to meet project-specific MQOs prior to analyzing project samples is a critical part ofthe MARLAP process.
Methods obtained from recognized industry standards (ASTM, ANSI, APHA) or governmentmethod manuals may have been validated for certain general applications by the developing orissuing laboratory. However, prior to their use, other laboratories planning to use these methodsneed to perform general and project method validations to ensure that the method meets labora-tory performance criteria (for generic applications) and project method validation criteria,respectively. In some cases, the laboratory�s quality requirements and method attributes forgeneral method validation may be less stringent compared to a project method validation. Forexample, a method�s precision or chemical yield range requirement may be less stringent forgeneral method validation than for project method validation requirements. MARLAPrecommends that a method undergo some basic general validation prior to project methodvalidation.
In the discussion on general and project method validation, certain terms related to test samplesare used. These include method validation reference materials (MVRMs) and internal andexternal PT materials. MVRM refers to site-specific materials that have the same or similarchemical, physical, and nuclear properties as the proposed project samples. Normally, MVRMscan be prepared by at least two mechanisms:
� Spiking background or blank material from a site with the radionuclides of interest; or � Characterizing the site material containing the radionuclides of interest to a high degree of
accuracy.
Although MVRM is the most appropriate material for testing a laboratory�s project-specificperformance or for validating a method for a particular project, its availability may be limiteddepending on the project manager�s ability to supply such material. Internal PT materials(samples) are materials prepared by the laboratory, typically as part of a laboratory�s QC programand method validation process. A matrix spike (internal batch QC sample) may be considered an
Selection and Application of an Analytical Method
6-24MARLAP JULY 2004
internal PT material. External PT materials are materials prepared for use in an externalgovernment or commercial PE program. When available and applicable, external PT samplesmay be used for validating methods. PT and MVRM samples should be traceable to a nationalstandards body, such as the National Institute of Standards and Technology in the United States.
An analytical laboratory�s quality system should address the requirements and attributes forgeneral method development, including some level of validation. However, general validationwill not address the specific requirements of project method validation. MARLAP recommendsthat when a method is applied to a specific project, the method should then undergo validationfor that specific application.
6.6.1 General Method Validation
A general method validation process should be a basic element in a laboratory�s quality system.General method validation is applied to an analyte(s)/matrix combination, such as 90Sr in water,but can be applied to a �sequential� method to determine multiple analytes. In most cases, amatrix of typical constituents will be used when evaluating the method. A general methodvalidation protocol should address the important aspects of the methods that influence the results(e.g., inclusion of radiotracers, standard addition, alternate analyte analyses, etc.) and the basicquality requirements of a laboratory�s quality system. General guidance on single laboratorymethod validation can be found in IUPAC (2002 ) and EURACHEM (1998). For mostapplications, the method should be evaluated for precision and relative bias for several analyteconcentration levels. In addition, the absolute bias, critical level and the a priori minimumdetectable concentration of the method, as determined from appropriate blanks, should beestimated. (See Section 6.6.4 for a discussion on testing for absolute and relative bias.) Thereshould be a sufficient number of test level concentrations and replicate PT samples to makerealistic estimates of the quality parameters. During validation, the method should also beevaluated in terms of factors most likely to influence a result (e.g., ruggedness) so that themethod can handle minor deviations to the method and precautions may be written into themethod (Youden and Steiner, 1975). In addition, IUPAC (2002) recommends that methodvalidation evaluate the following parameters: applicability, selectivity, calibration and linearity,range of applicable analyte concentrations, detection and determination (quantificationcapability) limit, sensitivity, fitness of purpose, matrix variation and measurement uncertainty.
Laboratories that have participated in an interlaboratory collaborative study whose data wereincluded in a published method (having an appropriate number of test levels and replicatesamples, e.g., ASTM D2777 and Youden and Steiner, 1975) would be considered to have anacceptable general validated method for the analyte/matrix combination under study. Thesecollaborative studies have at a minimum three or four different analyte concentration levels(excluding blanks) with three replicates or Youden pairs per analyte concentration level. A well-planned collaborative study will include expected interferences and matrix variations.

Selection and Application of an Analytical Method
6-25JULY 2004 MARLAP
6.6.2 Project Method Validation Protocol
A laboratory�s project method validation protocol should include the evaluation of the methodfor project-specific MQOs for an analyte and internal quality performance criteria as well asother generic parameters. With a properly designed method validation protocol, importantinformation may be ascertained from the analytical results generated by the method validationprocess.
The parameters that should be specified, evaluated, or may be ascertained from the analyticalresults generated by the project method validation process are listed below:
� Defined Method Validation Level (Table 6.1) � APSs including MQOs for each analyte/matrix
N Chemical or physical characteristics of analyte when appropriate N Action level (if applicable) N Method uncertainty at a specific concentration N MDC or MQC N Bias (if applicable) N Applicable analyte concentration range N Method blanks N Other qualitative parameters to measure the degree of method ruggedness or specificity
� Defined matrix for testing, including chemical and physical characteristics that approximateproject samples
� Selected project-specific or appropriate alternative matrix PT samples, including knownchemical or radionuclide interferences at appropriate levels
� Defined sample preservation � Stated additional data testing criteria (such as acceptable chemical/radiotracer yield values)
In order to demonstrate properly that a method will meet project MQOs, the method should beevaluated over a range of analyte concentrations that cover the expected analyte concentrationrange for the project (Section 6.5.5.4). The middle of the concentration range should be set nearthe action level. The preparation and analysis of the test samples should result in a measurementuncertainty that is equal to or less than the required method uncertainty. In addition, anticipatedor known chemical and radionuclide interferences should be added in the appropriate �inter-ference to analyte� activity or concentration ratio. As a requirement of the project methodvalidation process, appropriate method blanks (containing similar interferences when practical)should be analyzed concurrently with the matrix spikes to determine analyte interferences and toestimate the absolute bias near the detection limit (Section 6.6.4, �Testing for Bias�).
The number of validation samples requires is a function of the validation level sought. As shownin Table 6.1, the number of samples may vary from 9 to 21.
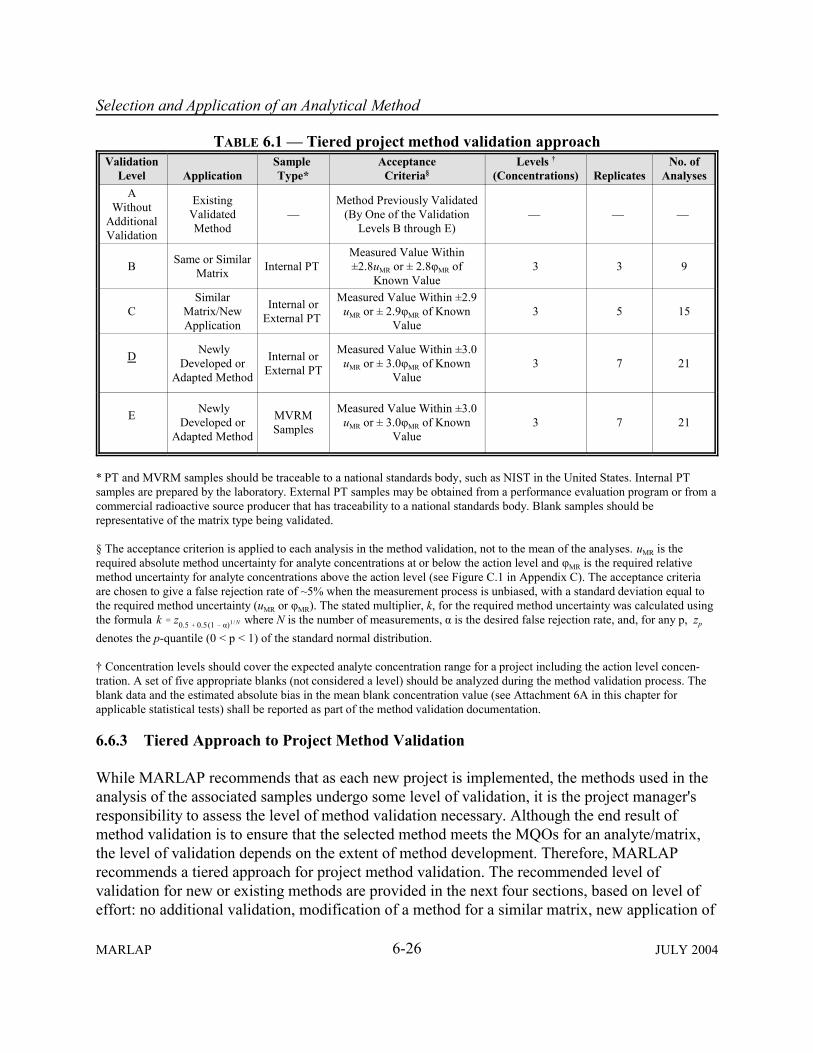
Selection and Application of an Analytical Method
6-26MARLAP JULY 2004
TABLE 6.1 � Tiered project method validation approachValidation
Level ApplicationSample Type*
AcceptanceCriteria§
Levels �
(Concentrations) ReplicatesNo. of
AnalysesA
WithoutAdditionalValidation
ExistingValidatedMethod
�Method Previously Validated
(By One of the ValidationLevels B through E)
� � �
B Same or SimilarMatrix Internal PT
Measured Value Within±2.8uMR or ± 2.8φMR of
Known Value3 3 9
CSimilar
Matrix/NewApplication
Internal orExternal PT
Measured Value Within ±2.9uMR or ± 2.9φMR of Known
Value3 5 15
D NewlyDeveloped or
Adapted Method
Internal orExternal PT
Measured Value Within ±3.0uMR or ± 3.0φMR of Known
Value3 7 21
E NewlyDeveloped or
Adapted Method
MVRMSamples
Measured Value Within ±3.0uMR or ± 3.0φMR of Known
Value3 7 21
* PT and MVRM samples should be traceable to a national standards body, such as NIST in the United States. Internal PTsamples are prepared by the laboratory. External PT samples may be obtained from a performance evaluation program or from acommercial radioactive source producer that has traceability to a national standards body. Blank samples should berepresentative of the matrix type being validated.
§ The acceptance criterion is applied to each analysis in the method validation, not to the mean of the analyses. uMR is therequired absolute method uncertainty for analyte concentrations at or below the action level and φMR is the required relativemethod uncertainty for analyte concentrations above the action level (see Figure C.1 in Appendix C). The acceptance criteriaare chosen to give a false rejection rate of ~5% when the measurement process is unbiased, with a standard deviation equal tothe required method uncertainty (uMR or φMR). The stated multiplier, k, for the required method uncertainty was calculated usingthe formula where N is the number of measurements, α is the desired false rejection rate, and, for any p, zpk ' z0.5 % 0.5(1 & α)1/N
denotes the p-quantile (0 < p < 1) of the standard normal distribution.
� Concentration levels should cover the expected analyte concentration range for a project including the action level concen-tration. A set of five appropriate blanks (not considered a level) should be analyzed during the method validation process. Theblank data and the estimated absolute bias in the mean blank concentration value (see Attachment 6A in this chapter forapplicable statistical tests) shall be reported as part of the method validation documentation.
6.6.3 Tiered Approach to Project Method Validation
While MARLAP recommends that as each new project is implemented, the methods used in theanalysis of the associated samples undergo some level of validation, it is the project manager'sresponsibility to assess the level of method validation necessary. Although the end result ofmethod validation is to ensure that the selected method meets the MQOs for an analyte/matrix,the level of validation depends on the extent of method development. Therefore, MARLAPrecommends a tiered approach for project method validation. The recommended level ofvalidation for new or existing methods are provided in the next four sections, based on level ofeffort: no additional validation, modification of a method for a similar matrix, new application of

Selection and Application of an Analytical Method
6-27JULY 2004 MARLAP
���
����
����
����
� ��
��5
����
����������"��������
3����� ���������
9�#�: �� ������/���������#�;< �� ���������5( ����������������#�=; �� ���������5( ��������������5�#�=; �3��������
,
'�-�� '�.��
��-�� ��.��
.
FIGURE 6.4 � Relationship between level of laboratory effort,method validation level, and degree of assurance of methodperformance under the tiered approach to method validation
a method, and newly developed or adapted methods. The suggested levels of validation areindicative of the modification required of the method. It should be noted that the methodvalidation requirements of Table 6.1 permit the laboratory to use internal and external PT orsite-specific MVRM samples and also permit the project manager to provide PT or site-specificMVRM samples for the laboratory to use or analyze. As part of the qualifying process, a projectmanager may provide PT samples. In this case, the project manager should ensure consistencywith the method validation requirements of Table 6.1. Most laboratories normally havedocumentation on the general or overall performance of a method. This documentation maysupplement, or occasionally may be sufficient to meet the project method validation criteria.
The tiered approach to project method validation outlined in Table 6.1 was developed to give theproject manager flexibility in the method validation process according to the project MQOs Thedegree of method validation increases from the lowest (Level A) to the highest (Level E). Figure6.4 illustrates that�for a given validation level�the relative assurance in a method meeting theMQOs and the relative effort for method validation required by the laboratory are directlyrelated. For certain projects, achieving the highest degree of assurance in method suitability (e.g.,for a difficult sample matrix with interferences) would require validation using site-specific PTsamples (Level E). This validation level also requires 21 samples: more laboratory effortcompared to the other levels.
Each of the validation levels evaluates the proposed method over the expected concentrationrange of the analytes and interferences. Requiring that each analytical result be within the intervalof the known value ± ~3 times the required method uncertainty (uMR or φMR) at the action levelensures a high degree of confidence that a method will meet the MQO. (See Appendix C for the
Selection and Application of an Analytical Method
6-28MARLAP JULY 2004
definition of the required method uncertainty at the action level or other stated concentration,uMR.) In addition to evaluating the method uncertainty, the method should be evaluated for bias(Section 6.6.4).
During the method validation process, the laboratory should ensure that the standard deviationfor the samples analyzed is consistent with the estimated individual sample measurement uncer-tainty. An evaluation should be conducted for replicate sample analyses that have the sameapproximate relative measurement uncertainties. If the estimated measurement uncertainty of agiven sample is much different than the observed method precision for the replicate analyzes,then the laboratory may not have properly estimated the uncertainty of one of the inputparameters used to calculate the combined standard uncertainty.
6.6.3.1 Existing Methods Requiring No Additional Validation
For completeness, it is necessary to consider the possibility that a previously validated methodrequires no additional validation (Level A of Table 6.1) for a specific project. As noted in thetable, the method should have previously undergone some level (Level B through E) ofvalidation. It may be that the samples (matrix and analyte specific) associated with a new projectare sufficiently similar to past samples analyzed by the same laboratory that the project managerfeels additional validation is unwarranted. The decision to use Level A method validation shouldbe made with caution. While the sampling scheme may be a continuation, the analyticalprocessing capabilities at the laboratory may have changed sufficiently to merit limited methodvalidation. Without some level of method validation, the project manager has no assurance thatthe analytical laboratory will perform to the same standards as an extension of the earlier work.
6.6.3.2 Routine Methods Having No Project Method Validation
When a laboratory has a routine method for a specific radionuclide/matrix combination that hashad no previous project method validation, a project manager may select method validation LevelB to validate the method for project sample analyses. Since the routine method has been used ona regular basis for client and PE program samples, there should be sufficient information on theperformance of the method. As such, the minimum method validation protocol of Level B shouldbe adequate to verify the method�s performance.
6.6.3.3 Use of a Validated Method for Similar Matrices
When a previously validated method is to be used in the analysis of samples that are similar tothe matrix and analyte for which the method was developed, MARLAP recommends thatvalidation of the method be implemented according to Level B or C of Table 6.1. These levelswill provide a reasonable assurance to both the laboratory and the project manager that themethod will meet the required MQOs. Level B requires the least amount of effort for thelaboratory but may not satisfy the level of method validation required by the project. When the

Selection and Application of an Analytical Method
6-29JULY 2004 MARLAP
laboratory does not have the capability to produce internal QC samples, the Level C validationprotocol should be used.
Since a method inherently includes initial sample preparation, projects that have severe differen-ces in analyte heterogeneity may require a moderate change in a radiochemical method�s initialsample treatment. A change in the method to address the increased heterogeneity of the analytedistribution within the sample may require another method validation depending on theruggedness of the method and the degree of analyte heterogeneity. In this case, Level Cvalidation would be appropriate.
6.6.3.4 New Application of a Validated Method
Methods that have been validated for one application normally require another validation for adifferent application, such as a different sample matrix. In addition, the MQOs may change fromone project to another or from one sample matrix to another. The validation process for anexisting validated method should be reviewed to ensure applicability of the new (which can bemore or less restrictive) MQOs. Applying an existing method to another matrix is not recommen-ded without further method validation. MARLAP recommends, based on the extent of themodification and the difficulty of the matrix, that Level C of Table 6.1 be used to validate theperformance of the modified method.
Both internal and external PT samples may be used for Level C validation. However, the projectmanager should specify the PT matrix. It should be recognized that national or commercial PEprograms may not provide the necessary matrices or the required analyte concentrations neededfor the Level C validation protocol. However, some radioactive source suppliers have thecapability to produce high quality PT materials for method validation.
Validation of an existing method for a different application depends on the extent of thedeparture from the original method application, in terms of:
� Dissimilarity of matrices; � Chemical speciation of the analyte or possible other chemical interference; � Analyte, chemical or radiometric interferences; � Complete solubilization of the analyte and sample matrix; and � Degree of analyte or sample matrix heterogeneity.
When the chemical separation of the analyte varies from that for which the method was originallyvalidated, the method should be so modified and subsequent validation performed. For example,if the original method was developed and validated to extract iodide using ion exchangechromatography, and a new application requires that iodine and iodate be quantified as well asiodide, then the method should be validated for the new analytes. Another example would be theinitial development of a method for soluble plutonium in soil using acid dissolution and then
Selection and Application of an Analytical Method
6-30MARLAP JULY 2004
applying the same method to high-fired plutonium oxide in soil. For these two examples, if theoriginal methods were to undergo the validation process for the new application, definitedeficiencies and poor results would be evident. Portions of the original method would have to bemodified to address the chemical speciation problems. The modified method requires validationto ensure that the MQOs for the new application can be met.
When additional analyte, chemical, or sample matrix interferences are known to exist for a newapplication, the previously validated method should undergo further validation. For example,applying a method developed for the analysis of an analyte in an environmental matrixcontaining few interfering radionuclides would be inappropriate for the analysis of process wastewaters containing many interfering radionuclides at high concentrations. In essence, the degree ofdecontamination (degree of interference removal) or analyte purification (isolation of the analytefrom other radionuclides) necessary for one application may be completely inadequate orinappropriate for another application (an indication of method specificity).
Another example would be the use of a method for soil analysis employing 234Th as a radiotracerfor chemical yield for the isotopic analysis of thorium when the soil also has a high concentrationof uranium. Thorium-234 is a decay product of 238U and will exist in the sample as a naturalanalyte, thus creating an erroneous chemical yield. A third example is the application of a 90Srmethod developed for freshwater to seawater samples for which the amount of chemicalinterferences and ambient strontium levels are extensive.
Some matrices and analytes may be solubilized easily through acid dissolution or digestion. Forsome applications, the analyte of interest may be solubilized from the sample matrix through anacid extraction process. The applicability of such methods should be carefully chosen and, mostimportant, the method must be validated for each application. Definite problems and misapplica-tion can be the result of using an acid extraction process when a more robust complete sampledissolution is necessary. These examples illustrate the deficiencies of the initial methodvalidation when applied to the modified sample parameters.
6.6.3.5 Newly Developed or Adapted Methods
MARLAP recommends that methods developed by the laboratory or adapted from the literaturethat have not been previously validated for a project be validated according to Levels D or E ofTable 6.1. These levels provide the most comprehensive testing of method performance. LevelsD and E have an increased number of replicates and the data obtained should provide the bestestimate of a method�s precision and bias. When the matrix under consideration is unique, themethod should be validated using the same matrix (e.g., MVRM) as determined in Level E. Thisis extremely important for process/effluent waters versus laboratory deionized water and forvarious heavy metal radionuclides in soils or sediments when compared to spiked sand orcommercial topsoil. For site-specific materials containing severe chemical and radionuclides

Selection and Application of an Analytical Method
1 Technically, the laboratory tests the measurement process for bias. The measurement process represents thelaboratory�s implementation of the method using particular instruments, analysts, quality control, etc.
6-31JULY 2004 MARLAP
interferences, many methods have been unable to properly address the magnitude ofinterferences.
6.6.4 Testing for Bias
The laboratory should test the method for bias.1 In fact, the laboratory should check for at leasttwo types of bias: absolute and relative. Attachment 6A describes a statistical hypothesis test thatmay be used to check for each type.
It is assumed here that the mean response of the method is an essentially linear function ofanalyte concentration over the range of the method. This function can be characterized by its y-intercept, which equals the mean response at zero concentration, and its slope, which equals theratio of the change in the mean response to a change in sample analyte concentration. Theabsolute bias of the method is equated here with the y-intercept, and the relative bias is equatedwith the difference between the slope and 1.
Detecting and quantifying an absolute or relative bias in a measurement process may be difficultif the bias is small in relation to the uncertainty of a measurement. Typically, an absolute bias ismost easily observed by analyzing blank samples, and a relative bias is most easily observed byanalyzing high-activity certified reference materials (CRMs); however, if the bias is very small,the number of sample measurements required to detect it may make the effort impractical. 6.6.4.1 Absolute Bias
Testing for absolute bias is most important when one of the purposes of analysis is to determinewhether the analyte is present either in individual laboratory samples or in a sampled population.An absolute bias in the measurement process can lead to incorrect detection decisions. Likelycauses of such a bias include inadequate corrections made by the laboratory for instrumentbackground, laboratory reagent contamination, and other interferences.
It is presumed here that the laboratory attempts to eliminate any absolute bias in the measurementprocess by blank- or background-correcting all measured results. For example, such a correctionmay be based on measurements of instrument background or analyses of reagent blank samples.To test whether the corrections are adequate, the laboratory should analyze a series of methodblank samples, applying all appropriate corrections exactly as for ordinary samples, and performa t-test on the results. To avoid the appearance of a false bias, the determinations of thecorrection terms (e.g., background or reagent blank) should be repeated for each method blanksample analyzed.

Selection and Application of an Analytical Method
6-32MARLAP JULY 2004
6.6.4.2 Relative Bias
Testing the method for relative bias is most important when one of the purposes of analysis is toquantify the amount of analyte present either in a sample or in a sampled population, and perhapsto determine whether the analyte concentration is above or below some positive action level.
To test for relative bias, the laboratory may analyze an appropriate CRM (or spiked sample) anumber of times. To avoid the appearance of a false bias, the laboratory should replicate as manysteps in the measurement process as possible for each analysis.
6.6.5 Project Method Validation Documentation
Project method validation, depending on the required level of validation, can be accomplished bythe project manager sending PT samples to the laboratory or by the laboratory using internal orexternal PT samples. When PT samples are sent to a laboratory to evaluate or validate thelaboratory�s method and capabilities, the appropriate technical representative should retain allrecords dealing with applicable method validation protocols (Section 6.6.2 ), PT samplepreparation certification, level of validation (from Table 6.1), results, and evaluations. Evalua-tions include comparison of individual results to the validation acceptance criterion, absolute biasin blanks and, if available, statistical analyses of the data for method precision and bias. Thelaboratory should provide the necessary documentation to the project manager for these PTsamples as required by the SOW. The laboratory should request feedback from the projectmanager as to the method performance. This information, along with the sample analyticalresults documentation, should be retained by the laboratory for future method validationdocumentation.
When the laboratory conducts its own project method validation, all records, laboratoryworkbooks, and matrix spike data used to validate an analytical method should be retained on fileand retrievable for a specified length of time after the method has been discontinued. Dataevaluations such as comparison of individual results to the validation acceptance criterion andabsolute bias in blanks and, when available, method precision and bias, should be part of the datavalidation package sent to the project manager. All method validation documentation should beretained as part of the documentation related to the laboratory�s quality system.
6.7 Analyst Qualifications and Demonstrated Proficiency
The required level of qualification of an analyst is commensurate with the degree of difficultyand sophistication of the method in use. The selection of the analyst for the method application istypically determined initially on experience, education and proven proficiency in similarmethods. Basic guidance for the minimum education and experience for radioassay laboratorytechnicians and analysts has been provided in Appendix E (Contracting Laboratory Services)and ANSI N42.23.

Selection and Application of an Analytical Method
6-33JULY 2004 MARLAP
For radiochemical methods, there may be several analysts involved. At most major laboratories,different individuals may be involved in the sample preparation, radiochemistry, and radiationdetection aspects of the method. In these cases, the entire staff involved in the method shouldundergo method proficiency tests to demonstrate their ability to meet quality requirements andperformance goals. The staff involved in the initial validation of an acceptable method would beconsidered proficient in their particular role in the method application and the results of theirperformance should be documented in their training records.
Successful proficiency is established when the performance of the analyst or staff meetpredefined quality requirements defined in the laboratory�s quality system or a SOW, as well asprocessing goals. Parameters involved in operational processing goals are typically turnaroundtime, chemical yields, frequency of re-analyses (percent failure rate), and frequency of errors.
The continued demonstrated analyst proficiency in the method is usually measured through theacceptable performance in internal QC and external PE programs associated with routine sampleprocessing.
6.8 Method Control
Method control is an inherent element of a laboratory�s quality system. Simply stated, methodcontrol is the ongoing process used to ensure that a validated method continues to meet theexpected requirements as the method is routinely used. Method control is synonymous withprocess control in most quality systems. For a laboratory operation, method control can beachieved by the application of the following:
� Controlled method manual (latest revision and signature sign-off);
� Calibration standards and radiotracers that are traceable to a national standards body such asthe National Institute of Science and Technology (NIST) in the United States;
� An instrument QC program that properly evaluates the important method parameters on anappropriate frequency;
� Radiotracers should be evaluated routinely for consistent concentration;
� Chemical yields should be evaluated for trends or deficiencies;
� Internal QC and external PT samples to determine deviations from expected qualityperformance ranges;
� Standard operating procedures for troubleshooting �out of control� situations; and
Selection and Application of an Analytical Method
6-34MARLAP JULY 2004
� Problem reporting, corrective action, and quality improvement process.
The method control elements described above typically are addressed in the quality manual of thelaboratory or the project plan document for the project under consideration. Refer to Chapter 18for additional information.
6.9 Continued Performance Assessment
The assessment of a laboratory�s continued performance is covered in detail in Chapter 7.However, it is important to discuss briefly certain aspects of evaluating a method�s continuedperformance from the perspective of a laboratory. A performance indicator system should be in place that assesses and provides feedback on thequality of the routine processing. The most useful and cost-effective means of assessing amethod�s performance is through the implementation of internal QC or external performanceevaluation programs or both. Of course, it can be argued that method assessment through a QC orPE program evaluates the combined performance of the method and the analyst. However,statistical and inferential interpretation of the QC/PE data can provide insight into whether themethod is failing or whether an analyst is underperforming. Chapters 7 and 18 and Appendix Cprovides guidance on quality control programs and the use of the internal laboratory QC orexternal PE data to assess the laboratory�s performance in meeting performance criteria.
The laboratory management should use the internal QC program to detect and addressradioanalytical issues before the client does. Many SOWs require the use of internal QC samplesfor every batch of project samples (Chapter 18). In effect, the client is essentially setting the levelof internal quality control and the frequency of method performance evaluation. It should berecognized that an internal QC program evaluates method performance related to the initialcalibrations or internal �known values.� An external NIST-traceable PE program will detectmethod biases relative to the national standard or to the agency�s PE program.
Some users of laboratory services have developed �monitoring� laboratory programs (ANSIN42.23). For these programs, the user engages a recognized independent monitoring laboratoryto intersperse double- and single-blind external PT materials into batches of normal samplessubmitted to a laboratory. The complexity and frequency of the monitoring laboratory PTsamples vary among programs, projects, and Federal and state agencies. An external double-blindPE program conducted by a monitoring laboratory using site-specific matrices probably providesthe most realistic estimate of the method�s or laboratory�s true performance. When themonitoring laboratory is traceable to a national standards body (such as NIST in the UnitedStates), either directly or through an authorized reference laboratory (ANSI N42.23), themonitoring laboratory program will provide an estimate of any method bias as related to thenational standard.

Selection and Application of an Analytical Method
6-35JULY 2004 MARLAP
Method performance can also be determined, although on a less frequent basis, through thelaboratory�s participation in the various PE programs. For a laboratory providing services togovernment agencies, the participation in such programs is typically a requirement. The PEprograms commonly send out non site-specific PT materials on a quarterly or semiannual basis.
The laboratory�s performance in certain PE programs is public knowledge. Such information isuseful to project managers in selecting a laboratory during the laboratory selection and qualifyingprocesses. Similar to the monitoring laboratory, when the laboratory conducting the PE programis traceable to NIST, either directly or through a NIST reference laboratory (ANSI N42.23), thePE program may provide an estimate of the bias as related to the national standard as well as theprecision of the method, depending on the distribution of replicate samples.
Some projects require that all analytical results received from a laboratory undergo a dataverification and validation process. Chapter 8 provides more detail on these processes. Whenproperly conducted, certain aspects and parameters of the method can be assessed during the dataverification and validation process.
Internal and external audits/assessments are also key elements in a laboratory�s quality system toassess the continuing performance of a method (Chapter 7). The level and frequency of the auditsand assessments typically vary according to the magnitude and importance of the project and onthe performance of the laboratory. Another quality system element that is very effective is a self-assessment program. A functioning and effective self-assessment program may identifyweaknesses or performance issues more readily and timely than formal internal and externalaudits.
6.10 Documentation To Be Sent to the Project Manager
The documentation related to the life cycle of a method application is essentially the informationgathered during the use of the method. A formal method documentation program is unnecessarysince the information should be part of the quality system documentation. Documentedinformation available from the quality system, related to a method�s development, validation, andcontrol, include the following:
� Method validation protocol and results; � Analyst training and proficiency tests; � Method manual control program; � Instrument calibration and QC results; � Internal QC and external PT sample results; � Internal and external assessments; and � Corrective actions.

Selection and Application of an Analytical Method
6-36MARLAP JULY 2004
Data verification and validation information should be kept available and retained for thoseprojects requiring such processes. In addition to QA documentation, the analytical results, eitherin hard copy or electronic form, should be available from the laboratory for a specified length oftime after the completion of a project.
6.11 Summary of Recommendations
� MARLAP recommends the performance-based approach for method selection.
� MARLAP recommends that only methods validated for a project�s application be used.
� MARLAP recommends that a SOW containing the MQOs and analytical processrequirements be provided to the laboratory.
� MARLAP recommends that the SOW include the specifications for the action level and therequired method uncertainty for the analyte concentration at the action level for eachcombination of analyte and matrix.
� MARLAP recommends that a method undergo some basic general validation prior to projectmethod validation.
� MARLAP recommends that when a method is applied to a specific project, the methodshould then undergo validation for that specific application.
� MARLAP recommends that as each new project is implemented, the methods used in theanalysis of the associated samples undergo some level of validation. However, it is theproject manager's responsibility to assess the level of method validation necessary.
� MARLAP recommends a tiered approach for project method validation.
6.12 References
American National Standards Institute (ANSI) N42.23. Measurement and AssociatedInstrumentation Quality Assurance for Radioassay Laboratories. 2003.
American Public Health Association (APHA). 1998. Standard Methods for the Examination ofWater and Waste Water, 20th Edition. Washington, DC. Available at: www.standardmethods.org.

Selection and Application of an Analytical Method
6-37JULY 2004 MARLAP
American Society for Testing and Materials (ASTM) D2777. Standard Practice forDetermination of Precision and Bias of Applicable Test Methods of Committee D-19 onWater. West Conshohocken, PA.
American Society for Testing and Materials (ASTM) D4855. Standard Practice for ComparingMethods. West Conshohocken, PA.
American Society for Testing and Materials (ASTM) E177. Standard Practice for Use of theTerms Precision and Bias in ASTM Test Methods. West Conshohocken, PA.
American Society for Testing and Materials (ASTM) E1169. Standard Guide for ConductingRuggedness Tests. West Conshohocken, PA.
American Society for Testing and Materials (ASTM) E1488. Standard Guide for StatisticalProcedures to Use in Developing and Applying ASTM Test Methods. West Conshohocken,PA.
U.S. Environmental Protection Agency (EPA). 1980. Prescribed Procedures for Measurement ofRadioactivity in Drinking Water. Environmental Monitoring and Support Laboratory,Cincinnati, OH. EPA 600-4-80-032, August.
U. S. Environmental Protection Agency (EPA). 2002. Guidance for Quality Assurance ProjectPlans. EPA QA/G-5. EPA/240/R-02/009. Office of Environmental Information, Washington,DC. Available at: www.epa.gov/quality/qa_docs.html.
EURACHEM. 1998. The Fitness for Purpose of Analytical Methods, A Laboratory Guide toMethod Validation and Related Topics. ISBN 0-948926-12-0. Available at: www.eurachem.ul.pt/index.htm.
International Union of Pure and Applied Chemistry (IUPAC). 2002. �Harmonized Guidelines forSingle-Laboratory Validation of Methods of Analysis.� Pure Appl. Chem., 74:5, pp. 835-855.
Youden, W.J. and E.H. Steiner. 1975. Statistical Manual of the AOAC. Association of OfficialAnalytical Chemists International, Gaithersburg, MD. Available at: www.aoac.org/pubs/pubcat81.htm.

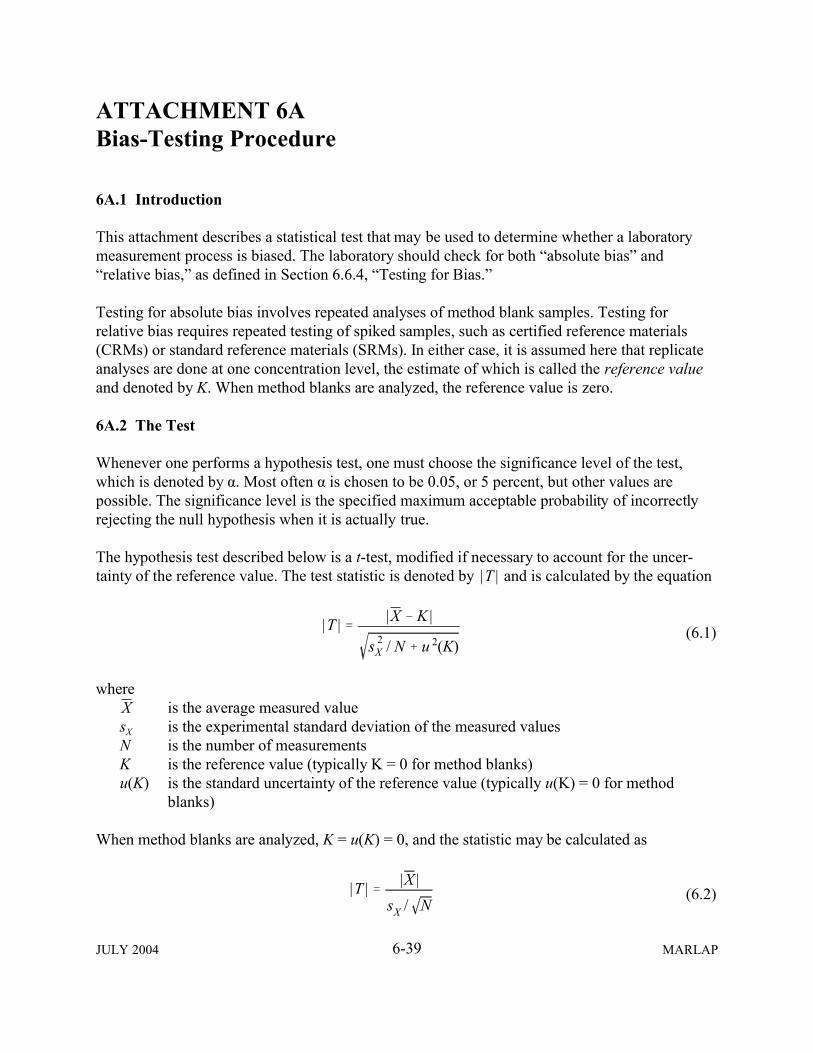
6-39JULY 2004 MARLAP
|T | ' |X & K |
s 2X / N % u 2(K)
(6.1)
|T | ' |X |sX / N
(6.2)
ATTACHMENT 6ABias-Testing Procedure
6A.1 Introduction
This attachment describes a statistical test that may be used to determine whether a laboratorymeasurement process is biased. The laboratory should check for both �absolute bias� and�relative bias,� as defined in Section 6.6.4, �Testing for Bias.�
Testing for absolute bias involves repeated analyses of method blank samples. Testing forrelative bias requires repeated testing of spiked samples, such as certified reference materials(CRMs) or standard reference materials (SRMs). In either case, it is assumed here that replicateanalyses are done at one concentration level, the estimate of which is called the reference valueand denoted by K. When method blanks are analyzed, the reference value is zero.
6A.2 The Test
Whenever one performs a hypothesis test, one must choose the significance level of the test,which is denoted by α. Most often α is chosen to be 0.05, or 5 percent, but other values arepossible. The significance level is the specified maximum acceptable probability of incorrectlyrejecting the null hypothesis when it is actually true.
The hypothesis test described below is a t-test, modified if necessary to account for the uncer-tainty of the reference value. The test statistic is denoted by and is calculated by the equation|T |
whereis the average measured valueX
sX is the experimental standard deviation of the measured valuesN is the number of measurementsK is the reference value (typically K = 0 for method blanks)u(K) is the standard uncertainty of the reference value (typically u(K) = 0 for method
blanks)
When method blanks are analyzed, K = u(K) = 0, and the statistic may be calculated as

Selection and Application of an Analytical Method: Bias-Testing Procedure
2 When the value of νeff is > 20, one may assume a νeff value of infinity.
6-40MARLAP JULY 2004
|T | > t1&α /2(νeff) (6.4)
νeff ' (N & 1) 1 %u 2(K)
s 2X / N
2
(6.3)
The number of effective degrees of freedom for the T statistic is calculated as follows:
When K = u(K) = 0, the number of effective degrees of freedom is N ! 1, which is an integer. However, if u(K) > 0, then νeff generally is not an integer2; so νeff should be truncated (roundeddown) to an integer. Then, given the chosen significance level, α, the critical value for is|T |defined to be t1!α/2(νeff), the (1 - α/2)-quantile of the t-distribution with νeff degrees of freedom(e.g., see Table G.2 in Appendix G). So, a bias in the measurement process is indicated if
A measure of the power of this t-test for bias is the minimum detectable bias (MDB), which maybe defined as the smallest bias (±) that can be detected with a specified probability, 1 ! β. TheMDB is a function of α, β, N, and the standard deviation of the measured results, σX, at the givenconcentration level. Achieving a small value for the MDB may require the analysis of manyreplicate samples. If α = β = 0.05, then at least 16 analyses are needed to ensure the MDB is lessthan the measurement standard deviation. Fifty-four measurements would be necessary to ensureMDB # σX / 2.
EXAMPLE 6.1
Suppose a laboratory analyzes a series of 9 method blanks and obtains the following results(Bq):
0.714 2.453 !1.159 0.845 0.495 0.993 0.472 !0.994 0.673
Determine whether the data indicate an absolute bias. Use a significance level of α = 0.05. Calculate the average of the measured results.
X '1N j
N
i'1Xi '
4.4929
' 0.49911
Note that is the best available estimate of the bias, but it has not yet been determined to beXstatistically significant.
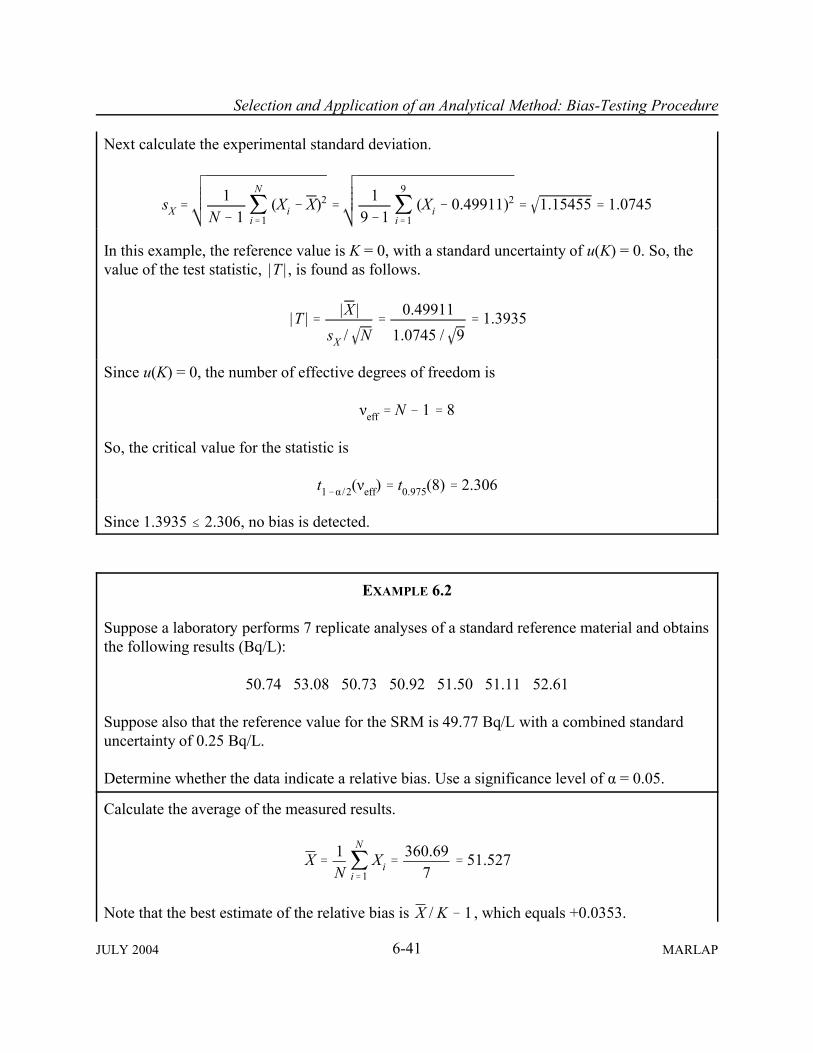
Selection and Application of an Analytical Method: Bias-Testing Procedure
6-41JULY 2004 MARLAP
Next calculate the experimental standard deviation.
sX '1
N & 1 jN
i'1(Xi & X)2 '
19&1 j
9
i'1(Xi & 0.49911)2 ' 1.15455 ' 1.0745
In this example, the reference value is K = 0, with a standard uncertainty of u(K) = 0. So, thevalue of the test statistic, , is found as follows.|T |
|T | ' |X |sX / N
'0.49911
1.0745 / 9' 1.3935
Since u(K) = 0, the number of effective degrees of freedom is
νeff ' N & 1 ' 8
So, the critical value for the statistic is
t1&α /2(νeff) ' t0.975(8) ' 2.306
Since 1.3935 # 2.306, no bias is detected.
EXAMPLE 6.2
Suppose a laboratory performs 7 replicate analyses of a standard reference material and obtainsthe following results (Bq/L):
50.74 53.08 50.73 50.92 51.50 51.11 52.61
Suppose also that the reference value for the SRM is 49.77 Bq/L with a combined standarduncertainty of 0.25 Bq/L.
Determine whether the data indicate a relative bias. Use a significance level of α = 0.05.
Calculate the average of the measured results.
X '1N j
N
i'1Xi '
360.697
' 51.527
Note that the best estimate of the relative bias is , which equals +0.0353.X / K & 1
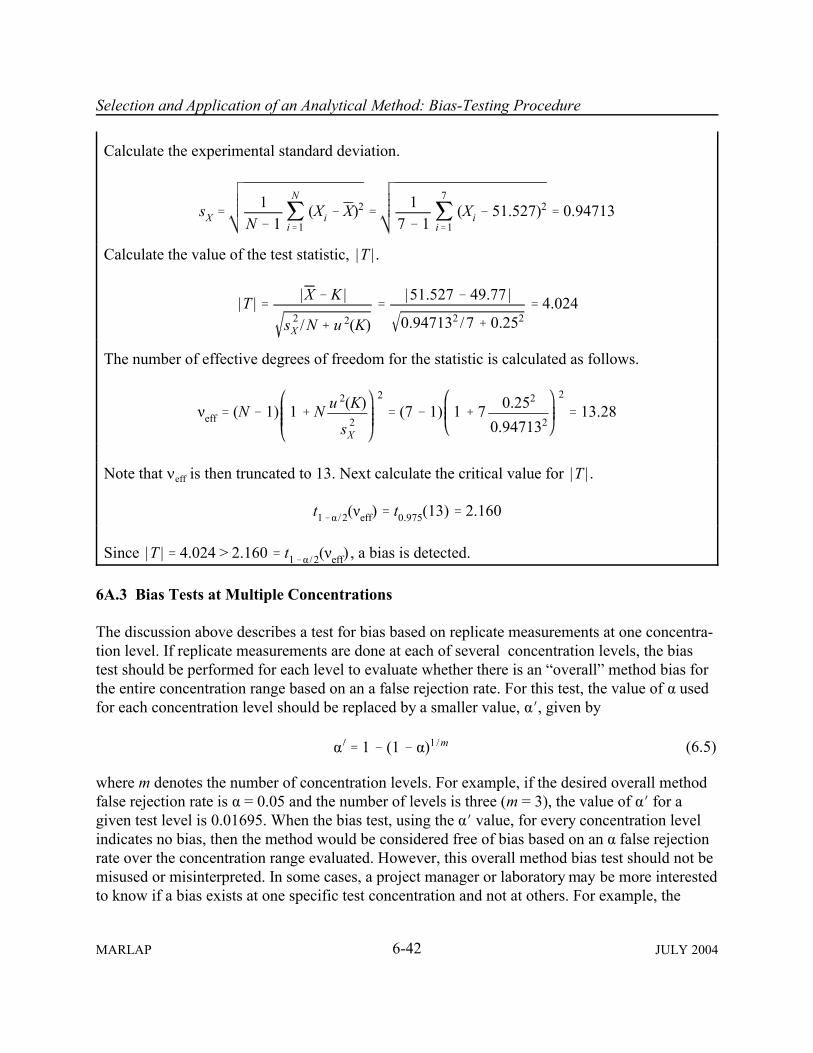
Selection and Application of an Analytical Method: Bias-Testing Procedure
6-42MARLAP JULY 2004
α) ' 1 & (1 & α)1/m (6.5)
Calculate the experimental standard deviation.
sX '1
N & 1 jN
i'1(Xi & X)2 '
17 & 1 j
7
i'1(Xi & 51.527)2 ' 0.94713
Calculate the value of the test statistic, .|T |
|T | ' |X & K |
s 2X /N % u 2(K)
'|51.527 & 49.77 |
0.947132 /7 % 0.252' 4.024
The number of effective degrees of freedom for the statistic is calculated as follows.
νeff ' (N & 1) 1 % N u 2(K)
s 2X
2
' (7 & 1) 1 % 7 0.252
0.947132
2
' 13.28
Note that νeff is then truncated to 13. Next calculate the critical value for .|T |
t1&α /2(νeff) ' t0.975(13) ' 2.160
Since , a bias is detected.|T | ' 4.024 > 2.160 ' t1&α /2(νeff)
6A.3 Bias Tests at Multiple Concentrations
The discussion above describes a test for bias based on replicate measurements at one concentra-tion level. If replicate measurements are done at each of several concentration levels, the biastest should be performed for each level to evaluate whether there is an �overall� method bias forthe entire concentration range based on an a false rejection rate. For this test, the value of α usedfor each concentration level should be replaced by a smaller value, αN, given by
where m denotes the number of concentration levels. For example, if the desired overall methodfalse rejection rate is α = 0.05 and the number of levels is three (m = 3), the value of αN for agiven test level is 0.01695. When the bias test, using the αN value, for every concentration levelindicates no bias, then the method would be considered free of bias based on an α false rejectionrate over the concentration range evaluated. However, this overall method bias test should not bemisused or misinterpreted. In some cases, a project manager or laboratory may be more interestedto know if a bias exists at one specific test concentration and not at others. For example, the

Selection and Application of an Analytical Method: Bias-Testing Procedure
6-43JULY 2004 MARLAP
evaluation of the rate of false- or non-detection for blanks (zero radionuclide concentration) maybe more important for a particular project than evaluating the overall method bias for all testlevels.
A possible alternative when testing is done at several concentration levels is to use weightedlinear regression to fit a straight line to the data and perform hypothesis tests to determinewhether the intercept is 0 and the slope is 1. However, determining the most appropriatenumerical weights may not be straightforward.


7-1JULY 2004 MARLAP
7 EVALUATING METHODS AND LABORATORIES
7.1 Introduction
This chapter provides guidance for the initial and ongoing evaluation of radioanalytical labora-tories and methods proposed by laboratories. Appendix E, Contracting Laboratory Services,provides additional guidance on the initial laboratory evaluation. More details about evaluatingand overseeing a laboratory�s performance can be found in ASTM E1691 and ASTM E548.
The performance-based approach to method selection allows a laboratory the freedom to proposeone or several methods for a specific analyte/matrix combination that will meet the needs of theanalytical protocol specifications (APSs) and measurement quality objectives (MQOs) delineatedin the statement of work (SOW). However, the laboratory should demonstrate, through a methodvalidation process, that the method is capable of producing analytical results of quality that meetthe needs of the SOW (Chapter 5, Obtaining Laboratory Services). Guidance and recommenda-tions on the selection of an analytical method based on the performance-based approach ispresented in Chapter 6 (Selection and Application of an Analytical Method). Section 7.2 providesguidance on how to evaluate the methods proposed by a laboratory. Section 7.3 providesguidance on the initial evaluation of a laboratory, and Section 7.4 discusses the continualevaluation of the quantitative measures of quality and operational aspects of the laboratory oncesample processing has commenced.
Method applicability and performance compliance should be demonstrated prior to the initiationof the sample analyses, as well as during the project period. A defined logical process for demon-strating and documenting that the analytical method selected meets the project�s data needs andrequirements may involve, for example, a review of the method validation documentation, anevaluation of past performance data from other projects (if available), the analysis of externalperformance evaluation (PE) program results, the analysis of matrix-specific standard referencematerials (or method validation reference materials) sent during the initial work period andthroughout the project, and the final evaluation of the performance during the data verificationand validation process (see Chapter 8, Radiochemical Data Verification and Validation).
In addition to the evaluation of the analytical methods, the capability of the laboratory to meet allSOW requirements needs to be reviewed andevaluated. Supporting information, such asmethod validation documentation, safetymanuals, licenses and certificates, and qualitymanual are typically submitted with theresponse to the request for proposals (RFP). Ageneric evaluation of the laboratory operationmay be conducted during the initial laboratoryaudit or assessment. This may be an initial
Contents
7.1 Introduction . . . . . . . . . . . . . . . . . . . . . . . . . . 7-17.2 Evaluation of Proposed Analytical Methods . 7-27.3 Initial Evaluation of a Laboratory . . . . . . . . 7-157.4 Ongoing Evaluation of the Laboratory�s
Performance . . . . . . . . . . . . . . . . . . . . . . . . 7-207.5 Summary of Recommendations . . . . . . . . . . 7-327.6 References . . . . . . . . . . . . . . . . . . . . . . . . . . 7-33
Evaluating Methods and Laboratories
7-2MARLAP JULY 2004
onsite audit. This first evaluation covers those generic SOW requirements dealing with thelaboratory�s capability and operation, including verification of adequate facilities,instrumentation, and staffing and staff training and qualifications. Following the first audit,emphasis should be on ensuring the laboratory continues to meet the APSs through a continuousor ongoing evaluation effort.
7.2 Evaluation of Proposed Analytical Methods
A laboratory may submit several methods for a particular APS contained in the SOW, but eachmethod should be evaluated separately and, if appropriate, approved by the project manager ordesignee. The method should be evaluated to be consistent with the overall analytical processthat includes the proposed field sampling and preservation protocols (Chapter 1). The projectmanager may delegate the method review process to a technical evaluation committee (TEC) thathas a radioanalytical specialist. MARLAP recommends that a radioanalytical specialist reviewthe methods for technical adequacy. The acceptance, especially of a new method, may be themost critical aspect of the performance-based approach for method selection. Acceptance of themethod requires the project manager to verify that the method is scientifically sound.
Each step of the method should be evaluated by a radioanalytical specialist in order to understandhow the results are derived. These steps may involve sample digestion, analyte purification anddecontamination steps that use ion exchange, solvent extraction, precipitation or oxidation/reduction applications. Once these steps have been reviewed, and the method evaluation data(e.g., from method validation documentation or various performance evaluation results) confirmthat the proposed method is acceptable, the project manager should have the confidencenecessary to endorse and verify the use of the method in the analysis of the routine samples.
As discussed in Chapter 6, the laboratory should provide method validation and analytical datathat demonstrates method performance. The data should show conclusively that the proposedmethod meets the requirements as defined by the APSs. If method performance is questionable,additional data may be required. For such cases, the project manager may decide to send per-formance testing (PT) materials to the laboratory in order to evaluate or validate the method. Thepreparation of the PT material used to evaluate the method should be based on sound scientificprinciples and representative of the expected sample matrix (see Chapter 6 on method validationoptions using site-specific materials). If there is sufficient reason to believe that the PT materialis an adequate substitute for the sample matrix and that the laboratory will follow the samemethod, then the need to justify each step in the method may be drastically reduced.
7.2.1 Documentation of Required Method Performance
Certain documentation submitted by the laboratory with the proposed methods, as well asavailable external information on the laboratory�s analytical performance, should be reviewed

Evaluating Methods and Laboratories
7-3JULY 2004 MARLAP
and evaluated by the radioanalytical specialist. Table 7.1 outlines where such informationtypically can be found by the TEC. This section will discuss various information categories thatmay be available during the method evaluation process.
TABLE 7.1 � Cross reference of information available for method evaluation
Evaluation ElementAddressed
MethodValidation
Internal andExternal QC
ReportsExternal PE
Programs
Internal/External QAAssessments
Informationfrom RFP andOther Sources
Analyte/Matrix
Process Knowledge
Previous Experience
Radiological HoldingTime
F F
Turnaround Time F F
Unique ProcessSpecifications
Bias F
Method Uncertainty(MQC/MDC)
F
Analyte/InterferenceRange
Method Ruggedness F
Method Specificity F
Information relevant to method evaluation should be present.F Information relevant to method evaluation may be present.
7.2.1.1 Method Validation Documentation
Chapter 6 outlines the various method validation options that can be specified by the projectmanager. In the MARLAP process, the method validation requirements will be contained in theSOW. The laboratory must submit the necessary method validation documentation consistentwith the SOW specification. The laboratory may choose to validate a method to a higher degreeof validation or to submit method validation documentation for a higher degree of validation thanthat specified by the SOW. The radioanalytical specialist or project manager should review thedocumentation to ensure that validation criteria for the number of analyte concentration levelsand replicates meet or exceed the required validation criteria (Chapter 6, Table 6.1). Althoughnot specified in the method validation protocol, some laboratories may include chemical andanalytical interferences in their method validation plan to gain a perspective on the method�sspecificity and ruggedness. However, it should be noted that the graded approach to methodvalidation presented in Chapter 6 does inherently increase the degree of ruggedness in terms of

Evaluating Methods and Laboratories
7-4MARLAP JULY 2004
having the method address site-specific materials which may include chemical and radionuclideinterferences.
In addition to reviewing the documentation for compliance with the method validation protocol,the results of the method validation process should be evaluated to determine if the projectspecific MQOs will be met. The method validation may or may not have been specificallyconducted for the project at hand. When the method has been validated (Chapter 6, Section 6.6)to the SOW specifications (validation level and MQOs), then evaluation of the documentationcan be straight forward. If the method has been previously validated for the MQOs of otherprojects, then the laboratory should provide a justification and calculations to show that themethod validation results will meet the MQOs for the new project. The TEC should verify thesecalculations and review the assumptions and justifications for reasonableness and technicalcorrectness.
7.2.1.2 Internal Quality Control or External PE Program Reports
The documentation of internal QC and external PE program results should be reviewed relativeto the MQOs. Method uncertainty and internal biases can be estimated from the informationavailable in the laboratory�s internal quality control reports, summaries of batch QC results thatmay be submitted with the RFP response and external PE program reports. The TEC shouldreview these documents and, when possible, estimate the method uncertainty and bias for variousanalyte concentration levels. However, it is imperative that no confusion exists in terms of whatmethod produced the results: the proposed method or another method available to the laboratory.This is especially important when reviewing external PE program results. It should also be notedthat although a laboratory may meet performance acceptance criteria for an external PE program,this fact may have no bearing on whether the method will meet the MQOs of the SOW.
Review of the internal batch QC data can provide additional information on typical sampleanalysis times and rates of blank contamination and sample reanalysis. This information isimportant when comparing methods (from the same or between laboratories) in terms of APScharacteristics. The frequency of blank contamination would be very important to national char-acterization studies (groundwater or soil analyses) for the determination of ambient analytelevels. Method evaluation for these projects may weight the blank contamination rate moreheavily than other SOW parameters. The rate of sample reanalysis would be important to projectshaving pending operations that are conducted based on a short sample processing turnaroundtime (TAT). In some site remediation projects, the contractor may remain onsite pendinganalytical results. A delay in reporting data or not meeting a TAT due to sample reanalysis maybe costly. Projects of this nature may weight TAT and low sample reanalyses more heavily thanother SOW parameters.

Evaluating Methods and Laboratories
7-5JULY 2004 MARLAP
7.2.1.3 Method Experience, Previous Projects, and Clients
When permitted by former clients, the laboratory may submit information relative to the previousor ongoing clients and projects for which the proposed method has been used. The TEC shouldverify with the laboratory�s clients that the laboratory has previous experience using the method.When available and allowed, the information should also include the analyte(s) and interferencesand their applicable concentration range, matrix type, and project size in terms of the number ofsamples per week or other time periods. From this information, the TEC can evaluate whether ornot to contact the laboratory�s client for further information on the operational adequacy of themethod. The client may offer some information on the quality of the results based on theirexternal single- or double-blind QC program, percent completion of reports, TAT, and sample re-analysis frequency. The sharing of laboratory assessment reports may be advantageous whenreviewing the performance of the laboratory during its employment of the method.
7.2.1.4 Internal and External Quality Assurance Assessments
When available, internal and external quality assurance assessment reports should be evaluated todetermine the adequacy of the method performance based on previous projects. Problems withthe conduct of the method due to procedural and technical issues may be readily evident. Theseissues may include an ineffective corrective action program creating delayed remedies toproblems, insufficient understanding of the method, inadequate training of staff, internal andproject-specific QC issues, and higher-than-expected failure rates for sample TATs and re-analyses. Information in these reports may disclose problems with a particular method that arenot common to another proposed method. As such, the TEC may give one method a higherweighting factor than another method.
7.2.2 Performance Requirements of the SOW�Analytical Protocol Specifications
Under the performance-based approach to method selection, a laboratory will propose one orseveral analytical methods that can meet the stated APSs and MQOs in the SOW for a givenanalyte and matrix combination. Chapters 3, 5, and 6 discuss the APSs and MQOs in detail interms of their basic description, their inclusion in a SOW, and as key considerations foridentifying existing validated methods or developing new methods. The purpose of this section isto provide guidance on what available information should be evaluated in order to approve thevarious proposed methods.
The radioanalytical specialist should review the process-knowledge information and determine ifthe proposed method is adequately specific, rugged, and applicable to address these issues.Discussions on method specificity and ruggedness may be found on in subsections on pages 7-12and 7-13, respectively.

Evaluating Methods and Laboratories
7-6MARLAP JULY 2004
As discussed in Section 6.5.2 and above, process knowledge is extremely important for identify-ing potential radioanalytical problems on some projects. Historical information or processknowledge may identify chemical and radionuclide interferences, expected analyte and inter-fering radionuclide concentration ranges, sample analyte heterogeneity issues, and the physio-chemical form of the analyte, and the sample matrix substrate. In some special cases, it may benecessary to determine if the radiological holding time will be an issue if the laboratory mustanalyze an alternative nuclide to determine supported and unsupported radionuclides (decayprogeny nuclides) in the matrix.
The following subsections cover key aspects of the SOW that should be addressed during themethod evaluation and approval process.
7.2.2.1 Matrix and Analyte Identification
The TEC should review the method(s) proposed by the laboratory to determine if the methodunder evaluation is applicable for the analyte/matrix combination specified in the SOW. In somecases, several methods may be proposed, including gross screening methods and specificradionuclide or isotopic methods having high specificity and ruggedness (Section 6.5.1.1 hasadditional guidance). Each method should be evaluated on its own application and merit. Whenmethods are proposed by the laboratory that use alternative nuclides (such as decay products) todetermine the analyte of interest, the TEC should carefully review the objective or summary ofthe method to determine if the proposed method is truly applicable for the analyte of interestgiven the radiological holding time and MQOs (i.e., can it properly quantify the analyte ofinterest through decay progeny measurements?). For gross screening techniques, the TEC shouldevaluate the analyte�s decay scheme to determine the underlying gross radiation category (beta,alpha, X-ray, or gamma-ray emitting) and the applicability of the proposed method�s radiationdetection methodology.
Each proposed method should be evaluated to determine if the method can analyze the samplematrix identified in the SOW. A method validated for water cannot be applied to soil sampleswithout modification and validation (Section 6.5). The planning team should have made�through historical process knowledge, previous matrix characterization studies or commonexperience�a determination on the uniqueness of the site-specific matrices compared to typicalmatrices and provided guidance in the SOW as to the level of method validation. In addition, ifthe radioanalytical specialist of the project planing team is concerned that the physiochemicalform of the analyte or the sample matrix substrate may present special problems to the radio-analytical process, a detailed description of the analyte and matrix should have been included inthe SOW. Chapters 12 (Laboratory Sample Preparation) and 13 (Sample Dissolution) discusspossible sample matrix problems and Section 6.5 provides guidance on the need for methodvalidation. The radioanalytical specialist should carefully review the summary of the method todetermine if the proposed method is applicable for the sample matrix.

Evaluating Methods and Laboratories
7-7JULY 2004 MARLAP
At this point, if it is determined that the proposed method(s) is not applicable and cannot meetthe SOW specifications, there is no need to continue the method evaluation process.
7.2.2.2 Radiological Holding and Turnaround Times
The radioanalytical specialist also should review the proposed method in light of the radiologicalholding time, analyte�s half-life and typical sample delivery options and determine if the methodis capable of meeting the MQOs in a reasonable counting period given the typical method param-eters (such as sample weight processed, chemical yields, radiation detection efficiency, branchingratio and background, ingrowth periods for decay progeny analysis, etc.). Radiological holdingtime is defined as the time between the sample collection and the end of the sample-countinginterval, while sample processing TAT refers to the time between sample receipt at the laboratoryand the issuance of an analytical report. The physical (analyte�s half-life) and chemical (stabilityor preservation concerns) characteristics of the analyte, as well as biological degradation forsome matrices, usually will dictate the radiological holding time. Project-specific schedules andpracticalities related to project and laboratory processing capacities normally enter intoestablishing TATs. If the radiological holding time appears to be a critical issue, then the clientshould request information on the typical batch size being processed by the laboratory for thatmethod. This information is needed in the method evaluation and review process. For very short-lived analytes, too large a batch size may result in the later samples having much largeruncertainties than the earlier samples. In these cases, the laboratory will count the sample (orfinal processing products) longer in order to achieve client-requested minimum detectableconcentrations. This is not often practical because the loss of counts due to analyte decay is moresignificant than any gain achieved by counting the sample longer.
In some cases, the laboratory may want to propose two methods for a short-lived analyte: one fornormal delivery and processing schedules and another method for situations when lower detec-tion limits are needed. An example of such a situation is the analysis of 131I in environmentalmedia. A method with adequate detection limits for reasonable radiological holding times isgamma spectrometry. Another method that can be applied for lower detection limits or longerradiological holding times is radiochemical separation followed by beta-gamma coincidencecounting.
Certain projects may be concerned with the chemical speciation of the analyte in the sample. Forthese projects, the radiological holding time should have been specified to ensure that the chem-ical species are not altered prior to processing. The project normally should specify chemicalpreservation specifications applicable at the time of sample collection.
Preservation techniques should be used when deterioration of biological samples may become aproblem (Chapter 10, Field and Sampling Issues that Affect Laboratory Measurements). How-ever, the radiological holding time should be specified to limit problems with sample degrada-

Evaluating Methods and Laboratories
7-8MARLAP JULY 2004
tion. The radioanalytical specialist should evaluate the method in light of the foregoing informa-tion and determine its adequacy to meet the radiological holding time and the pertinent MQOs
A laboratory�s sample (processing) TAT for a method typically is not related to the method�stechnical basis unless the radiological holding time and the TAT are nearly equal for a short-lived analyte. However, sufficient time should be available between the completion of sampleanalysis and the delivery of the analytical report. Meeting the radiological holding time butfailure to meet the TAT will not affect the quality of the analytical results but may place ahardship on the project to meet schedules. The TEC should review the proposed method, theradiological holding time and the TAT to determine if the method can process the samples in areasonable time period to meet the TAT. The sample delivery rate, sample batch size, level ofdata automation and the laboratory�s existing sample processing capacity will affect thelaboratory�s ability to meet the TAT requirement.
7.2.2.3 Unique Processing Specifications
The TEC should review the proposed methods for compliance or applicability to unique sampleprocessing specifications stated in the SOW. Chapter 6 provides a limited discussion on what aproject may identify as unique or special sample process specifications. Examples may includechemical speciation, analyte depth profiles, analyte particle size distribution, analyte hetero-geneity within the sample, wet-to-dry analyte concentration ratios in biologicals, and possiblescaling factors between radionuclides in the sample. In some cases, the proposed method(s) forthe analyte(s) may have to be evaluated with respect to all analytes or other sample preparationspecifications in order to determine method applicability and adequacy.
7.2.2.4 Measurement Quality Objectives
Method performance characteristics (method uncertainty, quantification capability, detectioncapability, applicable analyte concentration range, method specificity, and method ruggedness)will be discussed in the following subsections. For a particular project, MQOs normally will bedeveloped for several (but not all) of the performance characteristics discussed below.
METHOD UNCERTAINTY
The SOW should specify the required method uncertainty at a stated analyte concentration (oractivity level) for each sample matrix and the level of method validation (Section 6.6) needed toqualify the method at the stated analyte concentration.
MARLAP uses the term �method uncertainty� to refer to the predicted uncertainty of a result thatwould be measured if a method were applied to a hypothetical laboratory sample with a specifiedanalyte concentration. As presented in Chapter 6 and formulated in Chapter 20 (Detection andQuantification Capabilities), the method uncertainty of the analyte concentration for a given

Evaluating Methods and Laboratories
7-9JULY 2004 MARLAP
method is determined by mathematically combining the standard uncertainties of the many inputquantities (parameters), involved in the entire radioanalytical process. This will involve makingsome assumptions and normally involve using typical or worst case values for a conservativeestimate of the method uncertainty. Some of these input quantities, and thus the methoduncertainty, vary according to analyte level or concentration in the final measured product; othersdo not. In some cases, the magnitude of the method uncertainty for an analyte may increase inproportion to the magnitude (concentration/activity) of any interfering radionuclide present in thefinal measurement product. Therefore, it is imperative that the TEC evaluate the laboratory�ssubmitted documentation relative to this requirement, especially the information provided onmethod specificity, given the historical or expected interfering nuclides and the neededdecontamination factors (chemical separation factors) to render a good measurement for theanalyte of interest. In evaluating the documentation relevant to meeting the method uncertainty requirement, it isimportant to determine if the method validation requirements stated in the SOW have been met.The TEC should review the submitted method validation documentation and verify that themethod�s performance meets the requirements of Table 6.1 (Chapter 6) for the specified valida-tion level. It is important that the laboratory submit definitive documentation of methodvalidation compliance for the method uncertainty requirement.
The method performance documentation may include documentation or data from methodvalidation, internal or external (organization sending QC samples) QC data, external PE programdata, and results of prequalifying laboratories by sample analyses. By evaluating the actual QCand PE program performance data, it can be determined if the quoted measurement uncertaintyfor a reported QC sample result (calculated by the laboratory) truly reflects the method uncer-tainty under routine processing of samples. The required method uncertainty can be viewed as atarget value for the overall average measurement uncertainty for the samples at a specifiedanalyte concentration. It is important that the precision, as calculated from repeated measure-ments, is consistent with the laboratory�s stated measurement uncertainty for a given sampleresult whose analyte concentration is near the specified concentration. If the quoted measurementuncertainty of a QC or test measurement is quoted to be ± 10 percent and QC or PE program dataindicates a data set standard deviation of ± 20 percent, then the laboratory may not haveidentified all possible uncertainty components or may have underestimated the magnitude of acomponent.
QUANTIFICATION CAPABILITY
A requirement for the quantification capability of a method and the required method validationcriteria may be specified in a SOW. The quantification capability, expressed as the minimumquantifiable concentration (MQC), is the smallest concentration of the analyte that ensures aresult whose relative standard deviation is not greater than a specified value, usually 10 percent.

Evaluating Methods and Laboratories
1The MDC should not be confused with the concept of the critical value (Chapter 20).
7-10MARLAP JULY 2004
The project manager or TEC should review available documentation on the method to determineif the laboratory can meet the method quantification requirement. Method validation documen-tation sent by the laboratory should demonstrate explicitly, or by extrapolation, that the method,using certain input quantities and their uncertainties, can meet the quantification requirement.The method validation acceptance criteria presented in Section 6.6 have been formulated to eval-uate the MQC requirement at the proper analyte concentration level, i.e., action level or otherspecified analyte concentration.
Some projects may send performance testing material spiked at the MQC level as a more in-depth verification of the compliance with this requirement. Laboratories may also submit docu-mentation for internal QC or external PE program results that cover the MQC value. The TECshould evaluate the reported results to determine if the MQC requirement can be met.
DETECTION CAPABILITY
A radiochemical method�s detection capability for an analyte is usually expressed in terms ofminimum detectable concentration (MDC) or activity (MDA). Chapter 19 provides the definitionand mathematical equations for the MDC1 and MDA. A MDC requirement for each analyte/matrix combination may be stated in a SOW. Any proposed method should document the basisand equation for calculating the MDC. The supporting documentation on the method shouldcontain the input quantity values that may be entered into the MDC equation to calculate thedetection capability under a variety of assumptions. The TEC should evaluate the assumptionsand parameter values for reasonableness and practicality. This evaluation is especially importantfor recently validated methods that have a limited routine processing history. MARLAPrecommends that the TEC perform an independent calculation of the method�s MDC usinglaboratory-stated typical or sample-specific parameters.
When the proposed method has been validated recently or previously used on similar projects,sufficient data should exist that either are directly related to testing the method�s detection capa-bility or can be used to estimate the method�s detection capability. Any data submitted thatdocument direct testing of the method�s detection capability should be reviewed for appropri-ateness or applicability, reasonableness, and accuracy. If method detection testing is performed, itnormally will be for one analyte concentration level or value. It should not be expected that theMDC testing process included varying the magnitude of the method�s many parameters over awide range.
The reported quantitative results of the blanks can be used to estimate the MDC to within acertain degree of confidence (for most methods). At or below the MDC value, the majority of themeasurement uncertainty typically is due to the Poisson counting uncertainty. For well-controlled

Evaluating Methods and Laboratories
7-11JULY 2004 MARLAP
methods, the uncertainties of the other method parameters (input quantities), such as sampleweight, detection efficiency, and chemical yield, may range up to 10 percent. Therefore, a simplerule of thumb to estimate the MDC for most methods involves reviewing the measurementuncertainty for the reported blank results. If the blanks were analyzed to meet the MDCrequirement, then the reported MDC (based on blank and sample paired observations) for mostmethods should be between 3 and 4 times the measurement uncertainty of the blank when thebackground counts (per measurement interval) are greater than 10. It is more complicated toestimate the MDC for methods that use low background detectors (such as alpha spectrometry)having background counts less than 10 per counting interval. The TEC should evaluate the blankdata to determine the reasonableness of the quoted MDC values. These rules of thumb can beapplied to actual samples when the quoted analyte concentration value is less than two times itsassociated combined standard uncertainty value.
APPLICABLE ANALYTE CONCENTRATION RANGE
The applicable analyte concentration range can vary substantially depending on whether theproject deals with process waste streams, environmental remediation or monitoring, or environ-mental or waste tank characterization research. The proposed method being evaluated shouldprovide accurate results over the analyte concentration range stated in the SOW. Acceptableanalytical results used in this context means consistent method uncertainty (at a given analyteconcentration) and without significant bias. The range may be over several decades, from aminimum value (the MDC for some projects) to 100 times the action level or MQC.
Due to the effects of the Poisson counting uncertainty, most methods will provide more preciseresults at higher analyte concentration levels compared to those concentration levels near zero. Atconcentration levels near zero, background effects will render the results less precise. If thebackground (instrument or ambient levels of analyte in the matrix) is not well characterized, abias may also exist. For projects or programs (environmental characterization research) that haveno action level requirement, the lower portion of the required concentration range or the MDCrequirement may be most important. For those situations, particular emphasis should be placedon evaluating method and reagent blank data (i.e., net results that take into account inherentanalyte content in the reagents or tracers) to ensure that a bias does not exist. Refer to Section7.2.2.5, �Bias Considerations,� on page 7-13 for additional guidance.
Typically, radiation detection systems are linear in signal response over a very large range ofcount rates. However, depending on the magnitude of the chemical or radionuclide interferencesin the sample, the method may not produce linear results over the entire application range.Therefore, it is critical that when a mixture of radionuclides is present in a sample, the methodmust provide sufficient �analyte selectivity/isolation or impurity decontamination� to ensurevalid results and �method linearity.� In some cases, such as that for pure beta-emitting analytes,the degree of needed decontamination from other interfering nuclides may be as much as sixorders of magnitude.

Evaluating Methods and Laboratories
7-12MARLAP JULY 2004
There are several sources of information available from the laboratory that should be reviewedand possibly evaluated to ensure the method is capable of meeting this MQO. These includemethod validation documentation, previous projects or experience using the method, PE programresults, internal and external QC sample results, and prequalifying test samples. When evaluatingthe data, the TEC should evaluate the method�s performance as a function of analyte concentra-tion with and without interferences. However, this evaluation would be most valid when thesamples were processed to the same MQO (especially MDC or MQC), a situation that may notbe realistic for different projects. If the MDC requirement results in a longer counting time fromone project to another, there may be an impact on the method�s uncertainty for a given analyteconcentration due to difference in the Poisson counting uncertainty. Bias typically is not affectedby increasing the counting time. A graphical plot of this data would be visually helpful and maybe used to determine if the method uncertainty requirement would be met at the action level(extrapolation may be necessary).
METHOD SPECIFICITY
Method specificity refers to the ability of the method to measure the analyte of concern in thepresence of other radionuclide or chemical interferences. The need for or degree of methodspecificity depends on the degree or magnitude of the interferences and their effect on the abilityto measure the analyte of interest. Gross alpha, beta, and gamma-ray methods (which do not havefine resolution) are considered to be methods of low specificity and are used when individualnuclide specificity is not possible or needed. Radiochemical methods involving sample digestion,purification and decontamination steps followed by alpha spectrometry, such as for 239Pu in soil,are considered methods of high specificity. However, the relative degree of specificity of thesenuclide specific methods depends on the number of analyte isolation and interference decon-tamination steps. High-resolution gamma-ray spectrometry employing a germanium (Ge)detector is considered to have better specificity than the lower resolution sodium iodide (NaI)gamma-ray spectrometry.
The TEC should evaluate the proposed methods for adequacy to meet the specificity require-ments stated in the SOW. As mentioned in Chapter 6, methods of low specificity, such as grossradiation detection methods, may be proposed if the methods meet the MQOs. For example,when a single analyte having a relatively elevated action level needs to be evaluated, such as137Cs in soil at an action level of 222 Bq/kg (6 pCi/g), then a method with less specificity (grosscounting methods for gamma-ray or beta emitting nuclides) may be sufficient to meet the MQOs.For this example, a less expensive NaI gamma-ray spectrometric analysis with a lower resolutioncapability may be more desirable compared to a more costly high resolution germanium gamma-ray spectrometric analysis. If greater method specificity for a certain analyte/matrix combinationhas been required in the SOW, then a high resolution non-destructive sample analysis method(such as high resolution gamma-ray spectrometry) or a destructive sample analysis by a detailedradiochemical method would be appropriate. For proposed methods of high specificity, it isimportant that the TEC review and evaluate the basic purification and decontamination steps of
Evaluating Methods and Laboratories
7-13JULY 2004 MARLAP
the method, or the resolution of the radiation detection system, for adequacy in relation to theexpected mixture of analytes and interferences. For radiochemical methods, the TEC may be ableto estimate the needed distribution/partition coefficients, extraction and solubility factors, etc., ofthe various purification steps and compare the values against the needed decontamination factorsfor the interfering chemical or radionuclide interferences.
The adequacy of method specificity can be evaluated by the analytical results from the analysis ofsite-specific PT materials during method validation and/or laboratory prequalifying tests. Afurther discussion on the use of these materials is presented below.
METHOD RUGGEDNESS
Method ruggedness refers to the ability of the method to produce accurate results over widevariations in sample matrix composition and chemical and radionuclide interferences, as well aswhen steps (such as pH adjustments) in the method are varied slightly by the analyst. For someprojects, the matrix composition and level of analyte or interferences may very dramatically in agiven project.
Ruggedness studies have been defined by EPA (2002). A testing protocol for method ruggednesshas been outlined by the American Public Health Association (APHA). Some laboratories mayhave developed methods according to the APHA protocol for method ruggedness or are usingmethods contained in standards methods (APHA, 1998). Documentation on any internalruggedness study may be available from the laboratory.
As mentioned in Chapter 5 and 6, the use of site-specific PT materials is a means of testing theruggedness of a method for a defined project. If ruggedness and method specificity are concernsdue to the sample matrix of a defined project, then a variety of site-specific performance testingmaterials should be sent to the laboratory as part of the prequalification process or as a methodvalidation requirement. National PE programs, such as DOE�s Multiple Analyte PerformanceEvaluation Program (MAPEP) and Quality Assessment Program (QAP), use generic PTmaterials and may not be applicable or representative of the matrices for a defined project. Theresults of the prequalifying or method validation processes using site-specific PT materialsshould be evaluated by the TEC to determine the adequacy of the method to meet this MQOparameter. If the sample matrix and analytes are fairly standard, then no other evaluation of theavailable information may be necessary.
7.2.2.5 Bias Considerations
The method proposed by the laboratory should produce analytical results that are unbiased.MARLAP considers bias to be a persistent difference of the measured result from the true valueof the quantity being measured, which does not vary if the measurement is repeated. Normally,bias cannot be determined from a single result or a few results (unless the bias is large). Bias may

Evaluating Methods and Laboratories
2 In order to standardize against the national standard (NIST), an external performance evaluation program shouldbe implemented by a well-qualified provider that has standardized its reference materials to NIST or is participatingin a NIST traceability program
7-14MARLAP JULY 2004
D 100*
X Y
Yii i
iKnown
Known
=
−
(7.1)
be expressed as the percent deviation in (or deviation from) the �known� analyte concentration.Since bias is estimated by repeated measurements, there will be an uncertainty in the calculatedvalue. It is incumbent upon the project manager or TEC to evaluate the proposed methods forpossible bias over the applicable analyte concentration range. A laboratory should eliminate allknown biases before using a method. However, there may be circumstances, such as theprocessing of site-specific sample matrices, that may produce some inherent bias that is difficultto assess or correct in a reasonable time or economical fashion. For the methods proposed, theproject manager must determine if the magnitude of the bias will significantly affect the dataquality.
A bias can be positive or negative. Methods may have a bias at all analyte concentration levelsdue to the improper determinations of chemical yield, detector efficiency or resolution, subtrac-tion of interferences, and improper assumptions for the analyte�s half-life or an emissionbranching ratio. When reporting an analyte concentration based on a decay progeny analysis,improper ingrowth assumptions may lead to a bias.
MARLAP recommends that the project manager or TEC evaluate the available data provided bythe laboratory or from performance evaluations for bias, based on multiple analyses covering theapplicable analyte concentration range. One means of estimating a bias is through the evaluationof external PE program data.2 For proper evaluation of the PE program sample results, it isessential that the PE program provider use sample preparation techniques that will produceperformance testing (PT) samples (or a sample distribution) having insignificant �within orbetween� sample analyte heterogeneity and whose analyte concentrations are accurately known.
For the purpose of evaluating whether a laboratory method has an observable bias based onmultiple laboratory internal QC samples (matrix or method spikes) or external PE programsamples, the following equations can be used:
where Di is the percent deviation, Xi is an individual analytical result and Yi known is the �known�value for the sample analyzed. The Di should be determined for each test sample in the data set.The mean percent deviation for the method for a series of analyses in the data set can beestimated by the equation:

Evaluating Methods and Laboratories
7-15JULY 2004 MARLAP
( )D
DN
ii
N
= =∑ 1 (7.2)
Refer to various references (ASTM D2777, NBS 1963, Taylor 1990) for applicable tests that maybe performed to determine if there is a statistical difference at a given significance level.
There may be a negative or positive bias at low analyte concentrations due to the improperdetermination of the appropriate detector background or analytical blank value. For an individualblank result, the result (net activity or concentration value) would be considered to be astatistically positive value if the magnitude of its value is greater than 1.65 times the quotedmeasurement uncertainty. An older, much less conservative approach was to consider a reportedvalue as a positive value when the magnitude of a result was greater than 3 times the measure-ment uncertainty.
Since the measurement process is statistical in nature and involves the subtraction of anappropriate background or blank which also has an uncertainty, there is a 50 percent probability(half of the results) that the analytical result for a blank sample will have a negative magnitude,e.g., !1.5 ± 2.0. For an individual blank measurement, the measurement may be considered to beproblematic when the negative magnitude is greater than 2 or 3 times the measurementuncertainty.
For most radionuclides, other than those that are naturally occurring, the major source of apositive blank is from contamination, either cross-contamination from other samples or dirtyglassware during sample processing or from tracer impurities. A poor estimate of the instrumentbackground or ambient analyte levels in the matrix/reagent can lead to results being too negativein magnitude. A statistical test should be performed on a series of the data results to determine ifthere is a negative bias. The relative importance of the negative bias depends on the magnitude ofthe negative bias, magnitude of the action level and type of project.
7.3 Initial Evaluation of a Laboratory
The basic information to be considered in the initial evaluation of a laboratory has beensummarized according to major categories in Figure 7.1. Not all categories will be discussed indetail as subsections. Some categories may be grouped and discussed under a single genericsubsection heading. In order to allow for flexibility, no definitive guidance or detailed acceptancecriteria for the parameters under discussion will be provided.
7.3.1 Review of Quality System Documents
A radiochemical laboratory providing usable analytical data should have a quality manual. Areview of this document by a knowledgeable evaluator can reveal a great deal about the quality

Evaluating Methods and Laboratories
7-16MARLAP JULY 2004
FIGURE 7.1 � Considerations for the initial evaluation of a laboratory
and acceptability of the laboratory relative to the work to be performed. A well-developed qualitymanual contains a description of the quality system and descriptive material covering most otheraspects of a laboratory�s operation. The standard operating procedures, method documentation,list of instrumentation, and personnel resumes should be reviewed. For some projects, the projectmanager may require the laboratory to develop a specific project quality plan, system, andmanual. The following items, taken from the NELAC Quality Systems (NELAC 2002), should bediscussed at a minimum:
� Organization and management � Quality system establishment, audits, essential quality controls and evaluation, and data
verification � Personnel (qualifications and resumes) � Physical facilities (accommodations and environment) � Equipment and reference materials � Measurement traceability and calibration � Test methods and standard operating procedures (methods)

Evaluating Methods and Laboratories
7-17JULY 2004 MARLAP
� Sample handling, sample acceptance policy and sample receipt � Records � Subcontracting analytical samples � Outside support services and supplies � Complaints
The laboratory evaluation should involve a review of the quality system documents forcompleteness, thoroughness, and clarity.
7.3.2 Adequacy of Facilities, Instrumentation, and Staff Levels
Many factors enter into a laboratory�s ability to meet the analytical requirements of a SOW. Theresources and facilities of a laboratory may become stretched depending on the number of clients,the analytical services needed, and the deadlines of the committed work activities. Some SOWsmay request information about the current workload of the laboratory and available facilities,staff and nuclear instrumentation for the specified work scope. The resources needed will varyconsiderably depending on the analysis and number of samples: from minimal bench space,hoods, and nuclear instrumentation for fairly simple gross analyses to maximum bench space,hoods, staff, and nuclear instrumentation for low-level analyses of soil. In addition, the laboratorycapacity also depends on the number of samples that are routinely processed in a batch. Variousfactors may control the batch size, including the hood processing area, bench space, andequipment setup, available number of radiation detectors, counting time, and half-life ofradionuclide, among others.
The adequacy of the facilities, instrumentation, and staff levels can be estimated by two generalmechanisms: detailed supporting information provided by the laboratory in response to the SOWand an initial onsite audit. Information received from the prospective laboratory may provide anestimate of the laboratory�s resources, but an initial onsite audit verifies the actual existence andmaintenance of the resources.
7.3.3 Review of Applicable Prior Work
If required in a SOW, a laboratory will provide a list of clients for whom radioanalytical serviceshad been performed that are considered comparable in terms of work scope, DQOs, MQOs,APSs, and project type. A written or oral verification of the client list should be performed. Aspart of the verification process, the following items related to adherence to contract or projectrequirements should be discussed and documented:
� Radionuclides analyzed; � Sample matrices types; � Laboratory capacity (number of samples per week or another time period); � MQO for method uncertainty, detection and quantification capability;
Evaluating Methods and Laboratories
7-18MARLAP JULY 2004
� Radiological holding times; � Sample turnaround times; � Corrective actions; and � Communications related to schedule, capacity, or quality issues.
It should be noted that under performance-based contracting, a laboratory�s prior work for anagency should be considered, either as a positive or negative performance weighting factor, whenscoring a laboratory�s performance during the technical evaluation process.
7.3.4 Review of General Laboratory Performance
Some laboratories compile a semiannual or annual QA report summarizing the internal QCsample results for the methods used during a given time period, as well as an internal qualityassessment report summarizing the internal and external audit findings and corrective actionstaken. Although the laboratory�s internal quality criteria for a given radionuclide/matrix may bedifferent from the project MQOs, the internal QC sample results can be used to gauge thelaboratory�s performance capabilities. If these documents are available, they should be reviewedfor documentation of process control and pertinent quality parameters such as bias, precision,unusually high number of positive blank detection, chemical recoveries, turnaround times,number of recurring deficiencies or findings, and corrective action effectiveness.
7.3.4.1 Review of Internal QC Results
A quality assessment report may contain a summary of various QA-related activities, includinginternal audits and surveillance, report of conditions adverse to quality, investigation requests,corrective actions, and the results of external PE programs and internal QC samples. The contentand frequency of the reports normally are outlined in the laboratory�s quality manual. Frequently,this type of quality assessment report may be submitted with the laboratory�s response to the RFPwithout request. The TEC may want to specifically request such a report when available.
When the laboratory�s quality system is effectively implemented, the information contained inthese QA reports can be used not only to gauge the quality of the analyses but also the effective-ness and timeliness of such quality system activities as identifying conditions adverse to quality,controlling and monitoring the radioanalytical quality using internal QC samples, and correctiveactions. The internal QC sample results can be used to gauge the laboratory�s performancecapability. Results of the QC samples for a radionuclide and sample matrix should be reviewedfor both the batch QC samples and single- or double-blind samples submitted by the QA officer.Batch QC samples typically include laboratory control samples, method blanks, matrix spikes,splits, and duplicates. Such parameters as acceptable percent deviation for spiked samples,acceptable precision as measured by duplicate sample analyses, false nuclide detection, positiveblanks, and compliance to internal quality requirements should be reviewed, depending on the
Evaluating Methods and Laboratories
7-19JULY 2004 MARLAP
type of QC sample. The single- and double-blind samples submitted independently by the QAofficer are considered more operationally independent than the batch QC samples.
When quality problems are observed by the reviewer, it is important to check if the laboratory�squality system also has found and reported the same problem and whether an investigation orcorrective action has been undertaken.
Additional specific guidance is provided in Chapter 18 (Laboratory Quality Control) onevaluating internal QC samples to meet internal laboratory QC performance criteria. It isrecommended that the project managers review this chapter to gain a perspective on how to usereported internal QC results to gauge a laboratory�s potential to meet project MQOs.
7.3.4.2 External PE Program Results
Typically, a laboratory�s performance or capability to perform high quality radiochemicalanalyses can be evaluated through two external PE program mechanisms. The first mechanism,which may not be available for all projects, is the submittal, as an initial laboratory evaluationprocess, of project-specific PT samples prepared by the organization or a contracted sourcemanufacturer. When previous knowledge or experience exists, well-characterized site-specificmatrix samples containing the nuclides of interest can be used. This approach can use site-specific matrix materials for background samples or for samples spiked with target analytes. Forthis evaluation mechanism, and depending on the number and type of samples, the laboratory�scapability to meet all proposed project MQOs and quality performance specifications may beevaluated.
The second mechanism, available to most projects, is the laboratory�s participation ingovernment or commercial PE programs for radiochemical analyses. Each PE program has itsown acceptable performance criteria related to a laboratory�s bias with respect to the PEprogram�s �known� analyte concentration value. Acceptable performance criteria are establishedfor each nuclide/matrix combination. A PE program may also evaluate a laboratory based on afalse positive analyte detection criterion. Typically, the laboratory�s performance data ingovernment PE programs are provided in reports available to the public. The project manager should be aware that the acceptable performance criteria used by the PEprograms may be inconsistent with or more lenient than the MQOs of the project. Thelaboratory�s performance should be evaluated in terms of the established MQOs of the projectrather than a PE program�s acceptable performance criteria. In some cases, the laboratories couldbe ranked as to their level of performance in these programs.

Evaluating Methods and Laboratories
7-20MARLAP JULY 2004
7.3.4.3 Internal and External Quality Assessment Reports
Most laboratories undergo several external and internal QA audits per year, with resultant auditreports. Typically, a summary of the findings and commitments of internal and external qualityaudits or assessments are tracked on some type of QA database as part of the laboratory�scorrective action process. Access to the audit reports or database information may be limited.This information is not normally requested as part of the RFP process, nor do most laboratoriessubmit such information with their response to an RFP. Therefore, obtaining previous QA auditinformation from a laboratory outside a formal, external, onsite audit process may be limited.
7.3.5 Initial Audit
An initial assessment or audit may be performed to provide assurance that a potentially selectedlaboratory is capable of fulfilling the project requirements in accordance with the SOW.Essentially, the objectives of an initial audit are twofold. The first objective is to verify that whatthe laboratory claims in response to the SOW or RFP, such as the various quality and safetyprograms, are being correctly and fully implemented, and when used during the project period,will ensure that stipulated requirements will be met. The second objective is to determine if thelaboratory has the instruments, facilities, staffing levels and other operational requirementsavailable to handle the anticipated volume of work. In other words, is the laboratory�s proposalrealistic when compared to the actual facilities? To answer this question, auditors will be lookingto see whether a candidate laboratory has all the required elements to meet the project needs.
Detailed guidance and information on what should be evaluated in an initial audit has beenprovided in Appendix E, Section E5.5 and Table E7. This section also contains recommendationson the key items or parameters that should be reviewed during the initial audit. Depending on theproject, other quality or operational parameters/requirements (such as requirements related tochemical speciation or subsampling at the laboratory) not covered in Appendix E should beincluded in the initial audit plan.
7.4 Ongoing Evaluation of the Laboratory�s Performance
The evaluation framework presented here is intended to be sufficiently generic to cover theoperations of a laboratory performing work according to a SOW as recommended in Chapter 5.As described in MARLAP, MQOs are a key component of the SOW. Therefore, the sampleschedule, analyses to be performed, MQOs, and other analytical requirements have been defined.The methods selected by the laboratory have been demonstrated to meet the MQOs and havebeen approved by the project manager. In addition, the laboratory and its programs should haveundergone an initial audit to ensure that the laboratory has met or is capable of meeting projectrequirements, including sample processing capacity, sample TATs, deliverables for analyticalreports, etc. This would include maintaining a satisfactory quality system that includes
Evaluating Methods and Laboratories
7-21JULY 2004 MARLAP
monitoring and controlling the radioanalytical processes through an instrument and internalsample QC program and the acceptable performance in an external PE program.
The ongoing evaluation of a laboratory�s performance includes the evaluation of the methodapplicability or the quality of the data produced, and assessing the laboratory�s quality systemand operations through onsite or desk audits or assessments. The continued method performancecan be evaluated through the laboratory�s internal sample QC program, a possible external QCprogram maintained by the project manager, or an external PE program. It should be noted thatsamples used to control and monitor the quality of laboratory analyses have been definedaccording to their use. For example, batch or external QC samples are used to control as well asmonitor the quality of the analytical process (the process can be stopped immediately if the QCsample results indicate that the process is outside appropriate SOW specifications or laboratorycontrol limits). As defined previously, PT samples are used to compare the performance of theradioanalytical processing to some acceptance criteria but are not used to control the process.
The ongoing evaluation of the laboratory quality system and operations is accomplished througha visit to the laboratory or by a desk audit (the review of records and data from the laboratory).These audits or assessments are more focused on whether the laboratory is meeting projectspecifications rather than whether the laboratory has the capability to meet project or SOWrequirements.
Once a laboratory has initiated work on a project, the laboratory�s performance should beevaluated for the duration of the project. The quality of the radioanalytical measurements, as wellas the pertinent key operational aspects of the laboratory, should be evaluated against therequirements of the MQOs and SOW. Both the quantitative and qualitative measures oflaboratory performance should be evaluated on a continual basis. In addition, the operationalaspects of the laboratory germane to the effective implementation of the project requirementsshould be evaluated/monitored on a continual basis.
7.4.1 Quantitative Measures of Quality
The laboratory�s ongoing demonstrated ability to meet the MQOs and other APS requirementscan be evaluated through various quantitative measures using internal QC data and external PEprogram QC data. From these data, quantitative tests, as outlined in Appendix C can be used tomeasure and monitor the MQO parameters on a short-term basis. Also, the QC and PE programdata can be used to evaluate the laboratory�s performance, on a long-term trending basis, inmeeting other quality related parameters such as bias and precision, unusually high number ofpositive blank detection, false nuclide detection, MDC or MQC adherence, radiological holdingtimes, etc. The following subsections will discuss the use of data from these samples to evaluatethe laboratory�s radioanalytical quality with respect to the requirements.

Evaluating Methods and Laboratories
7-22MARLAP JULY 2004
uMR '∆10 (7.3)
φMR 'uMR
UBGR(7.4)
7.4.1.1 MQO Compliance
MARLAP recommends that project-specific MQOs be established and incorporated into theSOW for laboratory radioanalytical services. Appendix C provides guidance on developing theMQOs for method uncertainty, detection capability, and quantification capability. Establishing agray region and action level are important to the development of the MQOs. For certain researchprograms and characterization studies, the concept of an action level may not be applicable. Forthese studies or programs, the MDC requirement and restrictions on the frequency of falsepositive detections may be more important. As such, the project planning team for theseprograms should establish the basis for their own MQOs and develop tests to evaluate alaboratory�s performance to meet the requirements. These tests may be different from thosepresented below.
MARLAP recommends that a MQO for method uncertainty be established for each analyte/matrix combination. The method uncertainty is affected by laboratory sample preparation, sub-sampling, and the analytical method. In the absence of other information, the required methoduncertainty (uMR) at the upper bound of the gray region (UBGR) may be defined as:
where uMR is the method uncertainty and ∆ is the width of the gray region (difference between theupper and lower bounds of the gray region) as defined in Appendix C. In terms of the relativefraction of the upper bound of the gray region (action level), φMR, is defined:
The following subsections describe methods to quantitatively monitor a laboratory�s performancerelative to meeting this principal MQO through the use of internal or external batch QC samples.In some cases, the laboratory�s internal quality program may have more restrictive quality controllimitations for method performance compared to the proposed control limits used by the projectmanager to monitor adherence to the MQO for method uncertainty. Evaluation of the labora-tory�s performance in NIST-traceable external PE programs will determine the degree of bias ofthe laboratory�s method with respect to the national standard, as opposed to the determination ofthe laboratory�s internal bias through the use of internal QC samples. The tests presented assumethat all known internal (related to QC values and calibrations) and external (calibration differ-ences with respect to the national standard) biases have been defined and eliminated and, as such,the difference between the measured result and the �expected known� value is a result of themethod uncertainty only.

Evaluating Methods and Laboratories
7-23JULY 2004 MARLAP
%D 'SSR&SA
SA× 100% (7.5)
x 'x1 % x2
2(7.6)
USE OF INTERNAL QC SAMPLE RESULTS
For most projects, the SOW will specify that the laboratory incorporate internal QC sampleswithin a defined batch of samples. The QC samples may include a laboratory control sample,sample duplicates, a matrix spike sample and a method or reagent blank, or both. Appendix Cprovides examples on the use of the following quantitative tests to measure a laboratory�sperformance in meeting the MQO for method uncertainty.
Quality Performance Tests and Acceptance Criteria for Quality Control Samples
Laboratory Control Sample (LCS). The analyte concentration of an LCS should be high enoughso that the resulting Poisson counting uncertainty is small and the relative uncertainty limit φMR isappropriate with respect to the action level and the spike concentration chosen. The percentdeviation (%D) for the LCS analysis is defined as
whereSSR is the measured result (spiked sample result) andSA is the spike activity (or concentration) added.
It is assumed that the uncertainty of SA is negligible with respect to the uncertainty of SSR.Refer to Appendix C for the basic assumption and limitation of this test. For long-term trending,the %D results should be plotted graphically in terms of a quality control chart as described inChapter 18. The warning and control limits on %D are summarized below:
Laboratory Control Samples
Statistic: %DWarning limits: (± 2φMR) × 100%Control limits: (± 3φMR) × 100%
Duplicate Analyses. The acceptance criteria for duplicate analysis results depend on the analyteconcentration of the sample, which is estimated by the average of the two measured results x1xand x2.

Evaluating Methods and Laboratories
7-24MARLAP JULY 2004
RPD 'x1 & x2
x× 100% (7.7)
When , the absolute difference of the two measurements is used in the testingx < UBGR x1 & x2protocol. For these tests, only upper warning and control limits are used, because the absolutevalue is being tested.x1 & x2
When , the acceptance criteria may be expressed in terms of the relative percentx̄ $ UBGRdifference (RPD) defined as
The requirements for duplicate analyses are summarized below.
Duplicate Analyses
If :x̄ < UBGRStatistic: x1 & x2Warning limit: 2.83 uMRControl limit: 4.24 uMR
If :x̄ $ UBGR
Statistic: RPD 'x1 & x2
x̄× 100%
Warning limit: 2.83 φMR × 100%Control limit: 4.24 φMR × 100%
Method Blanks. When an aliquant of a blank material is analyzed, the target value is zero.However, the measured value may be either positive or negative. The applicable warning andcontrol uncertainty limits for blank samples are defined as:
Method Blanks
Statistic: Measured Concentration ValueWarning limits: ± 2uMRControl limits: ± 3uMR
Matrix Spikes. The acceptance criteria for matrix spikes are more complicated than thosedescribed above for the other laboratory QC samples because of the pre-existing activity that isinherent to the unspiked sample. The pre-existing activity (or concentration) must be measuredand subtracted from the activity measured after spiking.
MARLAP recommends the �Z score,� defined below, as the test for matrix spikes.
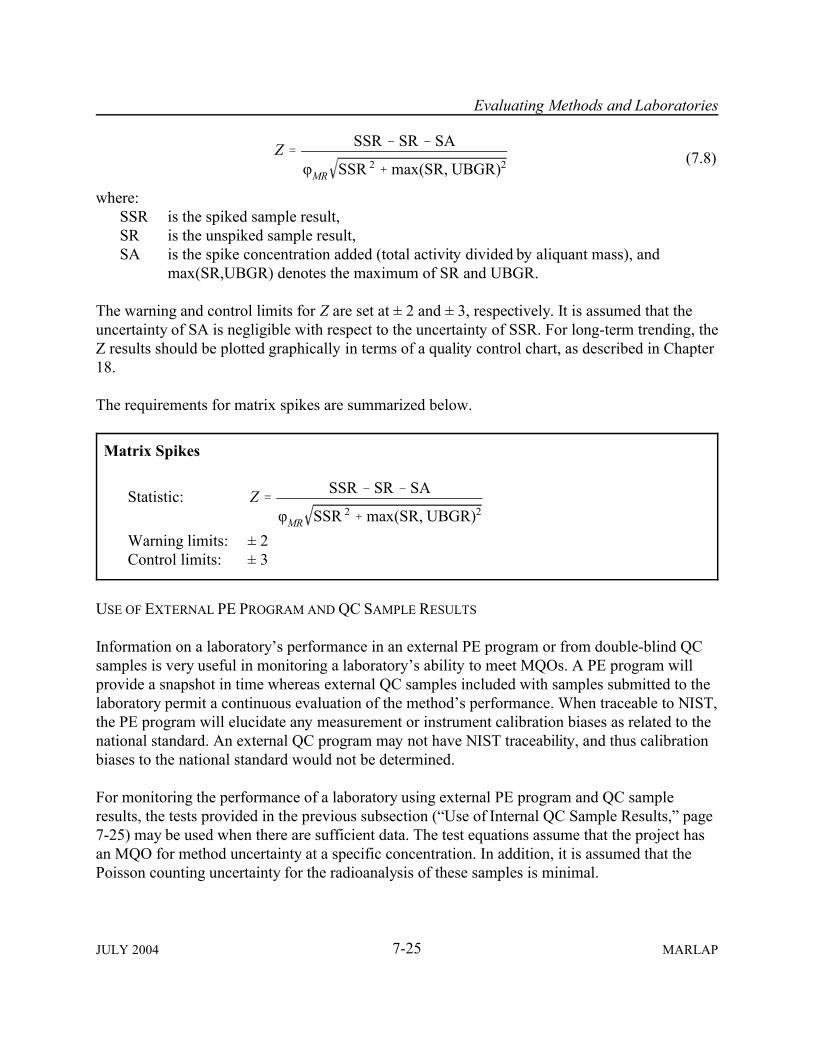
Evaluating Methods and Laboratories
7-25JULY 2004 MARLAP
Z 'SSR & SR & SA
φMR SSR 2 % max(SR, UBGR)2 (7.8)
where:SSR is the spiked sample result,SR is the unspiked sample result,SA is the spike concentration added (total activity divided by aliquant mass), and
max(SR,UBGR) denotes the maximum of SR and UBGR.
The warning and control limits for Z are set at ± 2 and ± 3, respectively. It is assumed that theuncertainty of SA is negligible with respect to the uncertainty of SSR. For long-term trending, theZ results should be plotted graphically in terms of a quality control chart, as described in Chapter18.
The requirements for matrix spikes are summarized below.
Matrix Spikes
Statistic: Z 'SSR & SR & SA
φMR SSR 2 % max(SR, UBGR)2
Warning limits: ± 2Control limits: ± 3
USE OF EXTERNAL PE PROGRAM AND QC SAMPLE RESULTS
Information on a laboratory�s performance in an external PE program or from double-blind QCsamples is very useful in monitoring a laboratory�s ability to meet MQOs. A PE program willprovide a snapshot in time whereas external QC samples included with samples submitted to thelaboratory permit a continuous evaluation of the method�s performance. When traceable to NIST,the PE program will elucidate any measurement or instrument calibration biases as related to thenational standard. An external QC program may not have NIST traceability, and thus calibrationbiases to the national standard would not be determined.
For monitoring the performance of a laboratory using external PE program and QC sampleresults, the tests provided in the previous subsection (�Use of Internal QC Sample Results,� page7-25) may be used when there are sufficient data. The test equations assume that the project hasan MQO for method uncertainty at a specific concentration. In addition, it is assumed that thePoisson counting uncertainty for the radioanalysis of these samples is minimal.
Evaluating Methods and Laboratories
7-26MARLAP JULY 2004
Results from PE Programs
In many SOWs, the laboratory is required to participate in a recognized PE program for thenuclides and media of interest. In some cases, a certificate of participation may be needed as partof response to the RFP. However, it also should be noted that although a laboratory may meetperformance acceptance criteria for an external PE program, this fact may have no bearing onwhether the method will meet the MQOs of the SOW.
Monitoring ongoing laboratory performance is limited due to the minimum frequency of testingof the PE program, i.e., usually quarterly or semiannually. Some PE programs require multiplemeasurements to estimate precision but most only request a single result be reported. In addition,the concentration of the analyte typically never approaches an action level value and the mediaused are not site specific. For PE program samples, when possible, the laboratory should analyzea sample to reach a 1σ Poisson counting uncertainty that is less than five percent.
Multiple Analyses and Results
When a PE program requires the analysis of multiple samples, the laboratory�s measurementprecision and bias (to a �known value�) at the analyte concentration may be estimated andreported by the PE program provider. When only duplicates sample results are reported, then thetests for laboratory control samples and duplicate analyses given in the previous section shouldbe used. The duplicate analysis test can be used as is, but the laboratory control sample testshould be evaluated based on the mean of the duplicate results. By using the mean of the tworesults, the LCS test provides a better estimate of any laboratory measurement bias with respectto the PE program provider. As discussed in Appendix C, the measurement (combined standard)uncertainty of each measured result value should be smaller than the required uMR or φMR.
Results from External QC Samples
The project manager may elect to establish an external QC program wherein QC samples aresubmitted to the laboratory with each batch of routine samples for the purpose of �controlling,�rather than monitoring, the quality of the analytical processes. The types of QC samples mayinclude matrix spikes, blanks, and possibly duplicates if prepared under controlled and exactingprotocols. An agency may use a qualified reference or monitoring laboratory (ANSI N42.23) toprepare the performance testing materials. When available, these QC samples may be preparedfrom site-specific materials.
When acceptance criteria are not met, the organization may issue a stop-work order and requestcorrective actions and reanalysis before routine processing can resume. In order to do this, theSOW must define the performance acceptance criteria and stipulate that the agency ororganization has the right to stop laboratory processing when the performance requirements arenot met. This application is not widespread but may have merit for certain project types. For

Evaluating Methods and Laboratories
7-27JULY 2004 MARLAP
example, research or national monitoring programs may monitor groundwater for specificnaturally occurring radionuclides at state-of-art detection levels. For these programs, frequentfalse positive results, due to the application of incorrect instrument background or an analyticalblank to the analytical result, would be unacceptable. Rather than permit a high rate of falsepositive results to continue, the agency can use the external batch QC samples to detect problemsearly and have the laboratory discontinue sample processing until a root cause is discovered and acorrective action undertaken. Non-conformance of a single analysis to performance criteriawould not warrant the issuance of a stop work order unless a severe blunder has occurred.Typically, a certain amount of statistical trending of the data is in order to truly elucidatedeficiencies.
Since the number of QC samples is similar to the recommendations for the laboratory�s internalbatch QC samples, there should be sufficient data for trending. The statistical tests provided inthe section on �Use of Internal QC Sample Results,� beginning on page 7-25, may be applied tothese QC samples.
7.4.1.2 Other Parameters
The laboratory�s performance in meeting the requirements for the other APSs that are listed inthe SOW should be evaluated quantitatively when possible. In some cases, the informationneeded to perform the evaluations may be found in the final analytical results data package. Forcertain types of evaluations, a follow-up onsite or desk audit may be needed to complete theevaluation, e.g., a review of logbooks on unique processes or software algorithms and theanalytical data base for proper spectral resolution.
RADIOLOGICAL HOLDING AND TURNAROUND TIMES
The data packages or analytical results report should contain the sample collection (reference),sample analysis, and reporting dates. From this information, the radiological holding and sampleprocessing TATs can be calculated and compared against requirements. When a method uses adecay progeny to measure the analyte of interest (222Rn to measure 226Ra), the decay of the parentnuclide and ingrowth of the decay progeny are important parameters for evaluation. Unlessrequested in the SOW, most laboratories do not report the ingrowth factor as a standard output.Therefore, the information on the sample-specific ingrowth factor may not be readily availableand reported only on the data sheets or during audits. When required, these time relatedrequirements will be evaluated for compliance during data verification and validation.
CHEMICAL YIELD
When appropriate, the SOW may specify limits on the chemical yield for each analyte. Forradionuclides, this requirement typically is related to the provision of robust or rugged methodsso that extreme yields become flags indicating potential problems. Wide swings in the chemical

Evaluating Methods and Laboratories
7-28MARLAP JULY 2004
yield may be indicative of method�s difficulty handling matrix or radionuclide interferences. Thedata packages or analytical results report should contain the chemical yield for each analytelisted. This reported value can be compared to the SOW yield limit. When required, theserequirements will be evaluated for compliance during data verification and validation.
SPECTRAL RESOLUTION
Problems with spectral resolution of gamma-ray and alpha spectra cannot be evaluated through areview of the analytical results report. If spectral resolution limits have been stated in the SOW,the evaluator should review and evaluate each sample spectrum against the SOW limit. Spectralinformation may be available in data packages when required or may be obtained during audits.
During an initial audit, a preliminary evaluation of the method�s SOP and review of pastperformance data for spectral resolution should be undertaken. The TEC may want to determinethe baseline or typical spectral resolution for the radiation detection systems that will be used inthe analysis of project samples. Trends of the spectral resolution of each detection system duringthe conduct of the project may be used to determine compliance with a spectral resolutionspecification.
7.4.2 Operational Aspects
Once a laboratory begins providing radioanalytical services, certain operational aspects need tobe reviewed and evaluated periodically to determine if the laboratory is maintaining projectrequirements or if new problems have occurred. It is also important to ensure that the laboratoryhas been properly maintained and is operated and managed in a manner that will not create aliability to any client. Many of the operational areas that were discussed in Sections 7.3.1 and7.3.2 for the initial evaluation of a laboratory also should be evaluated periodically to ensurecommitments are being met. The audit frequency varies according to the organization and theextent of the project or contract. Desk audits can be conducted more frequently than onsite auditsbecause they require fewer resources. However, not all operational aspects may be reviewedduring desk audits. The operational aspects that may be considered during desk and onsite auditsare presented below.
7.4.2.1 Desk Audits
A desk audit is conducted as an off-site activity, usually by a technical representative of theproject manager. A radioanalytical specialist should review all technical aspects of the deskaudit, including method and calculation (data reduction) changes, method performance,instrument recalibrations, corrective actions, and case narratives. The desk audit is most usefulwhen performed periodically to monitor certain activities or programs following an extensiveonsite laboratory audit. However, for some smaller projects, the desk audit may be the only

Evaluating Methods and Laboratories
7-29JULY 2004 MARLAP
assessment mechanism used to monitor the laboratory�s operations. The desk audit may be usedto review or monitor the following operational aspects or items:
� Organization and Management N Changes in key personnel N Reassignments
� Quality System N Internal and external audits conducted, including laboratory certification audits N Corrective action implementations N Quality control and performance evaluations
S Instrument and batch sample QC resultsS External PE program results
N Laboratory data verification (narrative status reports) N Additional method validation studies
� Certificates, licenses, equipment, and reference materials N Standard and tracer certificates N New and updates to instrument calibrations N Instrument repairs and new instruments put into service N NRC/State radioactive materials licence updates N State or EPA drinking water certification status changes
� Personnel N Updates to staff qualification/proficiency for methods N Updates to staff training files
S Radiation and chemical safetyS Quality assuranceS Technical principlesS Hands-on training records
� Radioanalytical Methods and Standard Operating Procedures N Updates to methods and SOPs N Technical basis for updates N Detection limits or method uncertainty studies
� Sample Receipt, Handling and Disposal N Sample receipt acknowledgment N Chain-of-custody N Sample- and waste-disposal tracking logs and manifests

Evaluating Methods and Laboratories
7-30MARLAP JULY 2004
Desk audits may also be used to review the data packages provided by the laboratory and,periodically, to verify certain method results by hand calculations. In addition, verification ofcompliance to radiological holding and turnaround times may be performed during the deskaudit. In the absence of a full data verification and validation program (Chapter 8), the desk auditmay be used to periodically evaluate the detailed instrument and data reduction reports of thedata packages for method adherence, technical correctness and valid application.
7.4.2.2 Onsite Audits
The onsite laboratory audit is more comprehensive and resource intensive than a desk audit. Anonsite audit typically is conducted to assess, periodically and in depth, a laboratory�s capability tomeet project requirements. Section E.5.5 of Appendix E provides guidance on the conduct of aninitial onsite audit during a contract award process. EPA (1997) provides limited guidance on theconduct of an audit for a radiological laboratory. NELAC (2002) provides some generic guidanceon laboratory assessments, although not specifically for a radiological laboratory.
Onsite audits usually cover the operational aspects delineated in Section 7.4.2.1 and also providean opportunity to evaluate the physical conditions at the laboratory, in terms of adequacy andupkeep of the facilities, and the full application or conduct of programs and resources. Informa-tion sent in data packages or submitted for desk audits can be confirmed or verified during anonsite audit. Furthermore, an onsite audit permits the tracking of a sample from receipt throughprocessing to sample storage and disposition and can verify the related instrument and batch QCsamples specific to the sample being tracked. During an onsite audit, the auditors may haveinterviews with the staff to gauge their technical proficiency and familiarity with methods.
For large projects, onsite audits may be formal in nature and have a predefined audit plan, whichhas been developed by a designated audit team, for a specific project or program. The audit teamtypically is comprised of qualified QA representatives and technical experts. MARLAPrecommends that the audit team include a radioanalytical specialist familiar with the project�s orprogram�s technical aspects and requirements.
In addition to the items in Section 7.4.2.1 (�Desk Audits�), the following items and programsshould be assessed during an onsite laboratory audit:
� Organization and Management N Qualifications of assigned laboratory project manager N Implementation of management�s policy on quality N Timeliness of addressing client complaints N Timeliness of implementing corrective actions
� Physical Facilities
Evaluating Methods and Laboratories
7-31JULY 2004 MARLAP
N Adequacy of facilities (sample receipt, processing, instrumentation and storage areas,waste processing and storage, offices, etc.)
N Physical conditions of facilities including laboratories, hoods, bench tops, floors, offices,etc.
N Environmental controls, such as climate control (heating, ventilation, air conditioning)and electrical power regulation
N Sample processing capacity N Sample storage conditions including chain-of-custody lockup areas and cross
contamination control (separation of samples by project and from radioactive sources orwastes)
� Instrumentation and Equipment N Age of nuclear instrumentation and equipment N Functionality of nuclear instrumentation and equipment N Calibrations and QC logs N Maintenance and repair logs N Sample throughput capacity N Contamination control for radiation detectors N Background spectra of radiation detectors
� Methods and Standard Operating Procedures N Use of latest revisions of methods and SOPs (spot check method manuals used by
technical staff) N Conformance to method application (surveillance of method implementation) N Effectiveness of administering the controlled method manual
� Certifications, Licenses and Certificates of Traceability N Ensure existence and applicability of, and conformance to, certifications and licenses N Noted citations during audits related to certifications and licenses N Ensure use of NIST-traceable materials (calibration standards)/review of vendors� report
of NIST traceability
� Waste Management Practices N Adherence to waste management SOPs N Proper packaging, labeling, manifests, etc. N Sample storage and records N Training and qualification records
� Radiological Controls N Adherence to radiological safety SOPs N Contamination control effectiveness (spill control, survey requirements and adherence,
posted or restricted areas, proper ventilation, cleaning policies, etc.)

Evaluating Methods and Laboratories
7-32MARLAP JULY 2004
N Badging and survey adherence
� Personnel N Number and technical depth of processing staff N Training files N Testing/qualifications N Personal interviews to determine familiarity of methods and safety SOPs
� Quality Systems N Performance indicator program (feedback from program)Quality assurance reports (QC
and audits) for all laboratory processing N Ongoing method evaluations and validations N Corrective action program (effectiveness and outstanding issues for all processing; spot
check for implementation of corrective actions) N Records/reports related to audits of vendors used by laboratory N Reagent control program (spot check conformance for effectiveness) N Audits of laboratories that are subcontracted N Laboratory�s data verification and validation processes
� Software Verification and Validation N Spot review of key method calculation and data reduction programs that include MDC,
MQC, and measurement uncertainty; spectral unfolding routines or crosstalk factors;application of instrument background and analytical blanks; etc.
N Spot verification of consistency between electronic data deliverable and data packages
� Radiological Holding and Sample Turnaround Times N Verification of compliance to radiological holding and sample TAT specifications (spot
check samples and confirm paperwork)
7.5 Summary of Recommendations
� MARLAP recommends that a radioanalytical specialist review the methods for technicaladequacy.
� MARLAP recommends that the TEC perform an independent calculation of the method�sMDC using laboratory-stated typical or sample-specific parameters.
� MARLAP recommends that the project manager or TEC evaluate the available data providedby the laboratory or from performance evaluations for bias, based on multiple analysescovering the applicable analyte concentration range.

Evaluating Methods and Laboratories
7-33JULY 2004 MARLAP
� MARLAP recommends that project-specific MQOs be established and incorporated into theSOW for laboratory radioanalytical services.
� MARLAP recommends that a MQO for method uncertainty be established for each analyte/matrix combination.
� MARLAP recommends the �Z score� as the test for matrix spikes.
� MARLAP recommends that an audit team include a radioanalytical specialist familiar withthe project�s or program�s technical aspects and requirements.
7.6 References
American National Standards Institute (ANSI) N42.23. Measurement and AssociatedInstrumentation Quality Assurance for Radioassay Laboratories. 2003.
American Public Health Association (APHA). 1998. Standard Methods for the Examination ofWater and Waste Water, 20th Edition. Washington, DC. Available at: www.standardmethods.org.
American Society for Testing and Materials (ASTM) D2777. Standard Practice forDetermination of Precision and Bias of Applicable Test Methods of Committee D-19 onWater.
American Society for Testing and Materials (ASTM) E177. Standard Practice for Use of theTerms Precision and Bias in ASTM Test Methods. West Conshohocken, PA.
American Society for Testing and Materials (ASTM) E548. Standard Guide for General CriteriaUsed for Evaluating Laboratory Competence. West Conshohocken, PA.
American Society for Testing and Materials (ASTM) E1580. Standard Guide for Surveillance ofAccredited Laboratories. West Conshohocken, PA.
American Society for Testing and Materials (ASTM) E1691. Standard Guide for Evaluation andAssessment of Analytical Chemistry Laboratories. West Conshohocken, PA.
U.S. Environmental Protection Agency (EPA). 1997. Manual for the Certification of Labora-tories Analyzing Drinking Water. EPA 815-B-97-001. Office of Ground Water and DrinkingWater, Washington, DC. Available at: www.epa.gov/safewater/certlab/labfront.html.

Evaluating Methods and Laboratories
7-34MARLAP JULY 2004
U. S. Environmental Protection Agency (EPA). 2002. Guidance for Quality Assurance ProjectPlans. EPA QA/G-5. EPA/240/R-02/009. Office of Environmental Information, Washington,DC. Available at www.epa.gov/quality/qa_docs.html.
International Organization for Standardization (ISO) 17025. General Requirements for theCompetence of Testing and Calibration Laboratories. International Organization forStandardization, Geneva, Switzerland. 1999.
National Bureau of Standards (NBS). 1963. Experimental Statistics. NBS Handbook 91, NationalBureau of Standards, Gaithersburg, MD.
National Environmental Laboratory Accreditation Conference (NELAC). 2002. NELACStandards. Chapter 5, Quality Systems. NELAC, Washington, DC. Available at:www.epa.gov/ttn/nelac/2002standards.htm.
Taylor, John K. 1990. Statistical Techniques for Data Analysis. Lewis Publishers, Chelsea, MI.

8-1JULY 2004 MARLAP
8 RADIOCHEMICAL DATA VERIFICATION ANDVALIDATION
8.1 Introduction
The goal of the data collection process is to produce credible and cost-effective data to meet theneeds of a particular project. The process can be divided into several stages, as illustrated in thedata life cycle (Chapter 1). This chapter is the first of two chapters that address the assessmentphase of the project. Because the efficiency and success of these assessment activities are heavilydependent on the completion of the preceding steps in the data collection process, especially theinitial planning activity (Chapter 2), the integration of planning and assessment is discussed inSection 8.2 prior to presenting material on data verification and validation.
Data verification compares the material delivered by the laboratory to the requirements in thestatement of work (SOW) and identifies problems, if present, that should be investigated duringdata validation. Data validation uses the outputs from data verification and compares the dataproduced with the measurement quality objectives (MQOs) and any other analytical processrequirements contained in the analytical protocol specifications (APSs) developed in the planningprocess. The main focus of data validation is determining data quality relative to the project-specific MQOs. It may not be necessary in all instances to validate all project data. This chapteroutlines a validation plan that specifies the data deliverables and data qualifiers to be assignedthat will facilitate the data quality assessment. The project-specific data validation plan shouldestablish a protocol that prioritizes the data to be validated. This is to eliminate unnecessarilystrict requirements that commit scarce resources to the in-depth evaluation of data points withhigh levels of acceptable uncertainty. For example, results very much above or below an actionlevel may not require rigorous validation, since relatively large measurement uncertainty wouldnot affect the ultimate decision or action. Planners should also identify those samples or data setsthat have less rigorous standards for data quality and defensibility.
This chapter presents suggested criteria to evaluate data and addresses the appropriate functionand limits of radiochemical techniques and measurements. Since calibration is more efficientlyevaluated as part of an audit, this chapter does not recommend that the complete calibration-support documentation be included as part ofthe data package. MARLAP recommends thatcalibration be addressed in a quality systemand through an audit (Chapter 18, LaboratoryQuality Control), although demonstration ofcalibration may be required as part of aproject�s deliverables. Detector calibration,self-absorption curves, and efficiencies shouldbe addressed as part of the evaluation of
Contents
8.1 Introduction . . . . . . . . . . . . . . . . . . . . . . . . . . 8-18.2 Data Assessment Process . . . . . . . . . . . . . . . 8-28.3 Validation Plan . . . . . . . . . . . . . . . . . . . . . . . 8-78.4 Other Essential Elements for Data Validation 8-118.5 Data Verification and Validation Process . . 8-128.6 Validation Report . . . . . . . . . . . . . . . . . . . . 8-298.7 Summary of Recommendations . . . . . . . . . . 8-318.8 Bibliography . . . . . . . . . . . . . . . . . . . . . . . . 8-31
Radiochemical Data Verification and Validation
8-2MARLAP JULY 2004
laboratories during the procurement process and continued during subsequent assessments(Chapter 7, Evaluating Methods and Laboratories). Availability and retention of calibrationrecords are decisions that are project-specific, but should be clearly identified for contract clarityand to assure project completeness (i.e., customer needs met). External sources of information,such as performance evaluation sample results and internal laboratory control samples, provideuseful interim information on calibration status and accuracy.
8.2 Data Assessment Process
Figure 1.1 in Chapter 1 graphically depicts the three phases of the data life cycle�planning,implementation, and assessment�and the associated activities and products of each phase. Whilethese activities are addressed in separate chapters in MARLAP, it should be emphasized thatintegration of planning, sampling, and analysis with subsequent data verification, datavalidation, and data quality assessment (DQA) is essential.
This section reviews the data life cycle from the perspective of the assessment phase and focuseson those issues that have the potential to impact the quality and usability of the data. Section8.2.1 addresses the development of the assessment procedures during project planning. Section8.2.2 considers assessment needs for documentation and a quality system during implementation.Section 8.2.3 focuses on the assessment phase and addresses the interrelationship of the threeassessment processes. This introduction to the data life cycle process emphasizes the importanceof linkages among planning, implementation, and assessment.
8.2.1 Planning Phase of the Data Life Cycle
Directed project planning and the development of the associated data quality objectives (DQOs),MQOs, and other specifications for the project are reviewed in Chapters 2 and 3. These chaptersemphasize the need for planners to thoroughly define the assessment processes (i.e, verification,validation and data quality assessment) in sufficient detail that success or failure in meetinggoals can be determined upon project completion. MARLAP recommends that the assessmentcriteria of a project be established during the directed planning process and documented in therespective plans as part of the project plan documents. This requires the project planning team todevelop detailed procedures for data verification, data validation, and data quality assessment, aswell as identify the actual personnel who will perform assessment or the required qualificationsand expertise of the assessors.
The development of these procedures during the directed planning process will increase thelikelihood that the appropriate documentation will be available for assessment, and that thosegenerating and assessing data will be aware of how the data will be assessed. A secondaryadvantage, which assessment plans have, is that prior to their completion, they often result in thedetection of design flaws (e.g., lack of proper quality control [QC] samples, lack of a field audit)

Radiochemical Data Verification and Validation
8-3JULY 2004 MARLAP
that upon correction will result in the complete information necessary for the proper assessmentof data usability.
The culmination of the planning process is documentation of the outputs of the directed planningprocess in the project plan documents. The project plan documents should capture the DQOs,MQOs, and the optimized data collection design (i.e., analytical protocol specifications, samplingand analysis plans, and standard operating procedures [SOPs]). The project plans should alsoinclude the assessment plans as discussed above, and describe the field, laboratory, safety, andquality assurance (QA) activities in sufficient detail that the project can be implemented asdesigned. Chapter 4 discusses guidance for writing project plan documents.
If the directed planning process, its outputs (DQOs, MQOs, optimized sampling and analysisdesigns), and associated assumptions are not documented well in project plan documents, theassessment phase will have difficulties evaluating the resulting data in terms of the project�sobjectives.
8.2.2 Implementation Phase of the Data Life Cycle
The project plans are executed during the implementation phase. Ideally, the plans would beimplemented as designed, but due to errors, misunderstandings, the uncontrolled environmentsunder which sampling is implemented, and matrix-specific issues that complicate samplehandling and analysis, most project plans are not implemented without some deviation.
Understanding the realities of implementation, the assessment process, in particular the DQAprocess, will evaluate the project�s implementation by considering: (a) if the plans were adequateto meet the project�s DQOs, (b) if the plans were implemented as designed, and (c) if the plans asimplemented were adequate to meet the project DQOs. MARLAP recommends that projectobjectives, implementation activities and QA/QC data be well documented in project plans,reports, and records, since the success of the assessment phase is highly dependent upon theavailability of such information.
Documentation and record keeping during the planning and implementation phase of the data lifecycle are essential to subsequent data verification, data validation, and data quality assessment.Thorough documentation will allow for a determination of data quality and data usability.Missing documentation can result in uncertainty, and a lack of critical documentation (e.g.,critical quality control results) can result in unusable data. The quality and usability of data cannot be assessed if the supporting documentation is not available.
8.2.2.1 Project Objectives
The DQOs, MQOs, and other specifications, requirements, and assumptions developed duringthe planning phase will influence the outcomes during the subsequent implementation and
Radiochemical Data Verification and Validation
8-4MARLAP JULY 2004
assessment phases of the data life cycle. It is important that these objectives, specifications,requirements, and assumptions are well documented and available to those implementing theprogram so they can make informed decisions. This documentation is reviewed during the DQAprocess (see discussions of the reviews of project DQOs in Section 9.6.1.1, sampling plans inSection 9.6.2.1, and analysis plans in Section 9.6.3.1).
8.2.2.2 Documenting Project Activities
The assessment of data in terms of sampling and analytical MQOs requires an accurate record ofQC sample data and compliance with specifications and requirements. If these records aremissing or inadequate, then compliance with APSs, including the MQOs that were identifiedduring the planning phase, will not be ascertainable and will raise questions regarding quality.
Additional documentation is required to assess compliance with plans and contracts, and toassess field and laboratory activities (e.g., compliance with SOPs) and the associatedorganizational systems (e.g., laboratory quality manual). This information is gleaned from thereview of field and laboratory notebooks, deviation reports, chain-of-custody forms, verificationreports, audit reports, surveillance reports, performance evaluation sample analyses, correctiveaction reports and reports to management that may identify deviations, contingencies, and qualityproblems. Assessment of these types of contemporaneous records allow for the assessment ofdata in the context of pertinent issues that may have arisen during project implementation.
Project records should be maintained for an agreed upon period of time, which should bespecified in project plan documents. Record maintenance should comply with all regulatoryrequirements and parallel the useful life of the data for purposes of re-assessment as questionsarise or for purposes of secondary data uses that were not originally anticipated.
8.2.2.3 Quality Assurance/Quality Control
To ensure that the data collection activity generates data of known quality, it is essential that theproject plan documents specify the requirements for an appropriate quality system that is capableof implementing the quality controls and the quality assurance necessary for success.
The quality system will oversee the implementation of QC samples, documentation of QCsample compliance or noncompliance with MQOs, audits, surveillances, performance-testingsample analyses, corrective actions, quality improvement and reports to management. Thedocumentation generated by these quality assurance activities and their outputs during projectimplementation will be a key basis for subsequent assessments and data usability decisions.
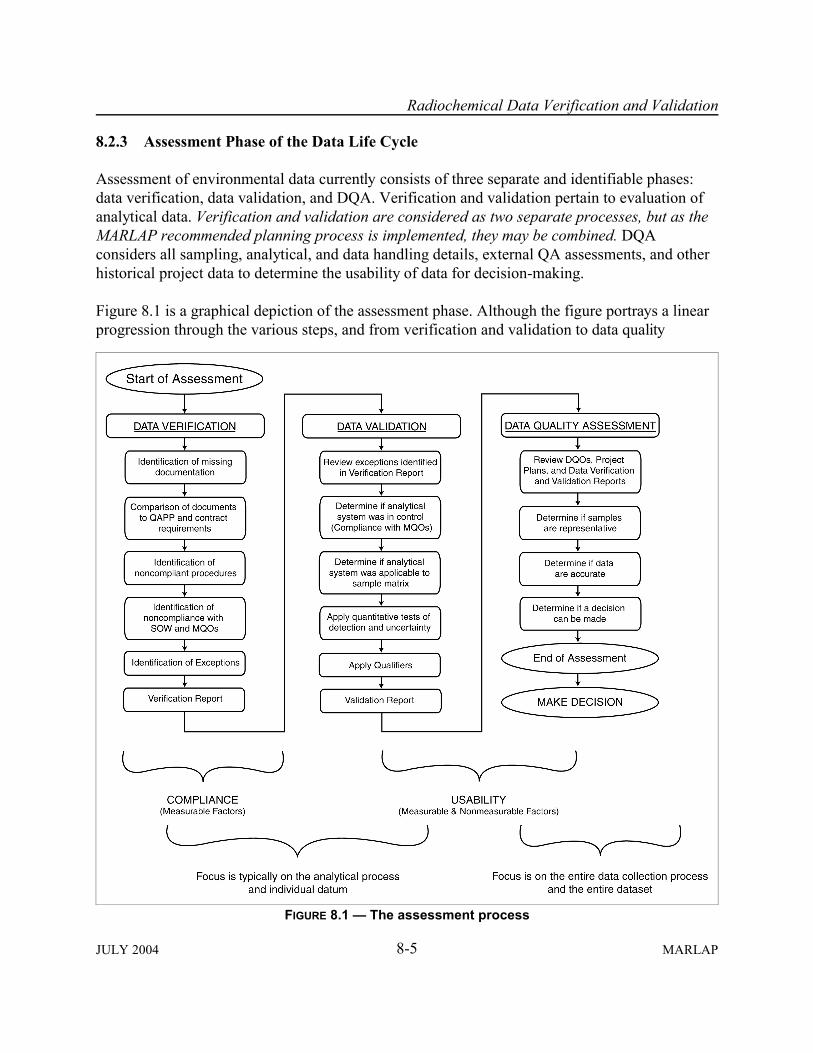
Radiochemical Data Verification and Validation
8-5JULY 2004 MARLAP
FIGURE 8.1 � The assessment process
8.2.3 Assessment Phase of the Data Life Cycle
Assessment of environmental data currently consists of three separate and identifiable phases:data verification, data validation, and DQA. Verification and validation pertain to evaluation ofanalytical data. Verification and validation are considered as two separate processes, but as theMARLAP recommended planning process is implemented, they may be combined. DQAconsiders all sampling, analytical, and data handling details, external QA assessments, and otherhistorical project data to determine the usability of data for decision-making.
Figure 8.1 is a graphical depiction of the assessment phase. Although the figure portrays a linearprogression through the various steps, and from verification and validation to data quality
Radiochemical Data Verification and Validation
8-6MARLAP JULY 2004
assessment, this linear advancement is not entirely necessary. It is possible for parallel progresswithin an assessment process (e.g., existing documents are verified while waiting for theproduction of others) and between assessment processes (e.g., analysis of the DQOs for dataquality assessment while data validation is being completed). Typically, the focus of verificationand validation is on the analytical process and on a data point by data point review, while dataquality assessment considers the entire data collection process and the entire data set as itassesses data quality.
Analytical data verification assures laboratory conditions and operations were compliant with theSOW based on project plan documents. The updated project plan documents specify theanalytical protocols the laboratory should use to produce data of acceptable quality and thecontent of the analytical data package (see Section 1.5, �The MARLAP Process�). Verificationcompares the analytical data package delivered by the laboratory to these requirements(compliance), and checks for consistency and comparability of the data throughout the datapackage, correctness of basic calculations, data for basic calculations, and completeness of theresults to ensure all necessary documentation is available. For example, there may be a SOWspecification that requires the laboratory to correct for spectral interferences for a certain method.Data verification would confirm that a spectral interference correction factor was applied to eachsample analysis. However, the data validation process determines whether the appropriate orcorrect spectral interference correction factor was used for each sample analysis. Data verifica-tion can be accomplished through the use of a plan or a simple checklist. A verification plan orchecklist may be developed from the requirements contained in the SOW, laboratory contract, orproject planning documents. The plan or checklist may include verification of generic laboratoryand specific analytical information (outputs or records) that should be reported in a data packagegenerated by the laboratory. Compliance verification may include a review of laboratory staffsignatures (written or electronic), data and report dates, case narrative reports, sample identifiers,radionuclides and matrices for analyses, methods employed for analyses, preservation of samples,reference/sampling and analysis dates, spectral data, chemical yields, detector-efficiency factors,decay and ingrowth factors, radiological holding times, analytical results, measurementuncertainties, minimum detectable concentrations, daily instrument and batch QC results, etc.
The verification process produces a report identifying which requirements are not met (i.e.,exceptions qualified with an �E� to alert the validator; see Section 8.3.3). The verification reportis used to confirm laboratory compliance with the SOW and to identify problems that should beinvestigated during data validation. Verification works iteratively and interactively with thegenerator (i.e., laboratory) to assure receipt of all necessary data in the correct format. Althoughthe verification process identifies specific problems, the primary function should be to applyappropriate feedback to the laboratory resulting in corrective action improving the analyticalservices before the project is completed.
Validation addresses the reliability of the data. The validation process begins with a review of theverification report and laboratory data package to identify its areas of strength and weakness.

Radiochemical Data Verification and Validation
8-7JULY 2004 MARLAP
This process involves the application of qualifiers that reflect the impact of not meeting theMQOs and any other analytical process requirements. Validation then evaluates the data todetermine the presence or absence of an analyte, and the uncertainty of the measurement process.During validation, the technical reliability and the degree of confidence in reported analyticaldata are considered. The data validator should be a scientist with radiochemistry experience.
Validation flags (i.e., qualifiers) are applied to data that do not meet the performance acceptancecriteria established in the SOW and the project plan documents. The products of the validationprocess are validated data and a validation report stating which data are acceptable, which dataare sufficiently inconsistent with the validation acceptance criteria in the expert opinion of thevalidator, and a summary of the QC sample performance. The appropriate data validation testsshould be established during the project planning phase. The point of validation is to perform asystematic check on a set of data being used to meet the project MQOs and any other analyticalprocess requirements. Documenting that such a check cannot be done is an appropriate andessential validation activity. (For example, applying numerical tests to data already determined tobe unreliable is of no value.)
Data Quality Assessment is the last phase of the data collection process, and consists of ascientific and statistical evaluation of project-wide knowledge to assess the usability of data sets.To assess and document overall data quality and usability, the data quality assessor integrates thedata validation report, field information, assessment reports, and historical project data, andcompares the findings to the original project DQOs. The DQA process uses the combinedfindings of these multi-disciplinary assessments to determine data usability for the intendeddecisions, and to generate a report documenting that usability and the causes of any deficiencies.It may be useful for a validator to work with the assessor to assure the value of the validationprocess (e.g., appropriateness of rejection decision) and to make the process more efficient. DQAwill be covered in Chapter 9.
8.3 Validation Plan
The validation plan should integrate the contributions and requirements of all stakeholders andpresent this information in a clear, concise format. To achieve this goal, validation planningshould be part of initial planning (e.g., directed planning process) to assure that the data will bevalidated efficiently to determine its reliability and technical defensibility in an appropriatecontext and to an appropriate degree.
The validation plan is an integral part of the project plan documents (Chapter 4), and should beincluded as either a section within the plan or as a stand-alone document attached as an appendix.The validation plan should be approved by an authorized representative of the project, thevalidation group performing the validation, and any other stakeholder whose agreement isneeded.

Radiochemical Data Verification and Validation
8-8MARLAP JULY 2004
The information and documentation identified in the validation plans should be communicated tothe laboratory as part of the SOW. Integration of validation plan specifications, contractualrequirements, and validator instructions/contracts is essential to ensure data collection processefficiency. Implementation of the data validation plan ensures that proper laboratory proceduresare followed and that data are reported in a format useful for validation and assessment. This alsoimproves the cost-effectiveness of the data-collection process.
The data validation plan should contain the following information:
� A summary of the project�s technical and quality objectives in terms of sample and analytelists, required measurement uncertainty, and required detection limit and action level on asample/analyte-specific basis. It should specify the scope of validation, e.g., whether all theraw data will be reviewed and in what detail (Section 8.3.1).
� The necessary validation criteria (derived from the MQOs) and performance objectivesdeemed appropriate for achieving project objectives (Section 8.3.2).
� Direction to the validator on what qualifiers are to be used and how final qualifiers areassigned (Section 8.3.3).
� Direction to the validator on the content of the validation report (Section 8.3.4).
8.3.1 Technical and Quality Objectives of the Project
The identity of key analytes and how the sample results drive project decisions should bespecified in the validation plan. In addition, the plan should define the association of requiredquality control samples with project samples.
This section of the validation plan should specify the following:
� Quality control acceptance criteria;
� Level of measurement uncertainty considered unusually high and unacceptable (tests ofunusual uncertainty and rejection); and
� Action level and MQOs for detection and quantification capability (e.g., required detectionand quantification limit).
The quality control acceptance criteria serve two purposes: (1) to establish if the analyticalprocess was in control; and (2) to determine if project requirements were met. If the analyticalprocess is in control, the assumption was that the analysis was performing within establishedlimits and indicates a reasonable match among matrix/analyte/method. Generally, this means that
Radiochemical Data Verification and Validation
8-9JULY 2004 MARLAP
routine data quality expectations are appropriate. The tests of unusual (i.e., analysis not incontrol) uncertainty should verify the data meet the statistical confidence limits for uncertaintyassociated with the planning process. During validation, the uncertainty associated with samplingcannot be estimated. The tests of detection determine the presence or absence of analytes.
8.3.2 Validation Tests
Validating data requires three specific decisions that will allow the validator to qualify the data.The project planning team should determine:
� Which QC samples should be employed and how do they relate to the samples?
� Which validation tests are appropriate?
� What validation limits should be used for the specific tests?
The answers to these questions are driven by the need to know whether the data meets the MQOsfor the project, and the allocation of resources between planning and implementation (i.e.,conservative review may be more costly than real or perceived value in the decision). Thissection of the validation plan should address the following:
� Specific validation tests to be used, and
� Statistical confidence intervals or fixed limit intervals applied to each of the validation testsand criteria based on the MQOs for the project (see Appendix C, Measurement QualityObjectives For Method Uncertainty and Detection And Quantification Capability).
8.3.3 Data Qualifiers
Data qualifiers are codes placed on an analytical result that alert data users to the validator�s orverifier�s concern about the result. This section of the validation plan should outline:
� The basis for rejection or qualification of data; and � The qualification codes that will be assigned.
These issues are discussed in detail in Section 8.5, which provides guidance for assigning dataqualifiers.
The verification process uses a qualifier (�E�) to alert the validator to noncompliance, includingmissing documentation, contract compliance, etc. This qualifier may be removed or replacedduring validation, based on the validator�s interpretation of the effect of the noncompliance onthe data�s integrity.

Radiochemical Data Verification and Validation
8-10MARLAP JULY 2004
E A notice to the validator that something was noncompliant.
The validation process uses the qualifiers listed below to identify data points that do not meet theproject MQOs or other analytical process requirements listed in the SOW or appropriate projectplan document. The assignment of the �J� and �R� qualifiers relies heavily on the judgement andexpertise of the reviewer and therefore, these qualifiers should be assigned as appropriate at theend of data validation.
U A normal, not detected (< critical value) result.
Q A reported combined standard uncertainty, which exceeds the project�s required methoduncertainty.
J An unusually uncertain or estimated result.
R A rejected result: the problems (quantitative or qualitative) are so severe that the data cannot be used.
The data validator should be aware that a data qualifier or a set of qualifiers does not apply to allsimilar data. The data validator should incorporate the project MQOs into the testing andqualifying decision-making process.
During the data validation process the data validator may use additional qualifiers based on QCsample results and acceptance criteria. These qualifiers may be summarized as �U,� �J,� �R,� or�Q� in the final validation report. The final validation reports should also include a summary ofQC sample performance for use by the data assessor.
S A result with a related spike result (laboratory control sample [LCS], matrix spike [MS]or matrix spike duplicate [MSD]) that is outside the control limit for recovery (%R); �S+�or �S-� used to indicate high or low recovery.
P A result with an associated replicate result that exceeds the control limit.
B A result with associated blank result, which is outside the control limit, �B+� or �B-�usedto indicate high or low results.
8.3.4 Reporting and Documentation
The purpose of this section is to define the format and program needs for validation reports andsupporting documentation. This section should include:

Radiochemical Data Verification and Validation
8-11JULY 2004 MARLAP
� Documentation and records that should be included in a validation report;
� Disposition requirements for records and documents from the project;
� Report format, i.e., a summary table with results, uncertainties and qualifiers; and
� Procedures for non-conformance reporting, which detail the means by which the laboratorycommunicates nonconformances against the validation plan. The procedures should includeall instances where the analytical data requirements and validation requirements establishedby the planning process and validation plan, respectively, cannot be met due to sample matrixproblems or unanticipated laboratory issues (loss of critical personnel or equipment).
Detailed information about the validation report is presented in Section 8.6.
8.4 Other Essential Elements for Data Validation
Effective data validation is dependent on:
� A SOW and project plan documents that clearly define the data needs and the data qualityrequirements (i.e., MQOs); and
� A data package that has been verified for completeness, consistency, compliance, andcorrectness.
8.4.1 Statement of Work
The analytical services procurement options should be considered during the planning process.The SOW should specify the QC requirements that will be evaluated by the validator (seeChapter 5, Obtaining Laboratory Services). The elements that should be specified include, butare not limited to:
� External performance evaluation (PE) participation and acceptance criteria; � Replicate sample frequency and acceptance criteria; � LCS and acceptance criteria; � Blank requirements and acceptance criteria; � MS and MSD samples and acceptance criteria; � Uncertainty calculations; and � Sample result equations and calculations including corrections for yield, percent moisture,
efficiencies and blank, if applied.

Radiochemical Data Verification and Validation
8-12MARLAP JULY 2004
Section 8.5.2 provides guidance on evaluating QC sample results based on the project�s MQO formeasurement uncertainty.
8.4.2 Verified Data Deliverables
Verification compares the sample receipt information and the sample report delivered by thelaboratory against the SOW and produces a report that identifies those requirements that were notmet (called exceptions). Verification can be accomplished using a plan or checklist, whichdoesn�t necessarily need to be project-specific. Verification exceptions normally identify:
� Required steps not carried out by the laboratory (i.e., correction for yield, proper signatures);
� Method QC not conducted at the required frequency (i.e., blanks, duplicates); and
� Method QC not meeting pre-set acceptance criteria (i.e., noncompliant laboratory controlsample analysis).
The verifier checks the data package (paper or electronic) for completeness, consistency,correctness, and compliance. Completeness means all required information is present.Consistency means values are the same when reported redundantly on different reports, ortranscribed from one report to another. Correctness means the reported results are based onproperly documented and correctly applied algorithms. Compliance means the data passnumerical QC tests based on parameters or limits derived from the MQOs specified in the SOW.
The verifier should provide, within the verification package, checklists for contract or SOWspecifications, noted deficiencies related to contract compliance, noted discrepancies or obviousquality related problems, and pertinent external QC results. The verification package notes thedeficiencies, discrepancies, and quality-related problems that could not be resolved with thelaboratory. The validator should take this information into consideration during the datavalidation process.
8.5 Data Verification and Validation Process
In its most basic form, data validation focuses on the reliability of each data point. After eachpoint is evaluated, summary conclusions concerning the validity of groups of data (sets) aredrawn and finally, after the reliability of all data sets has been established, an overall conclusionabout the quality and defensibility of a project�s analytical database is reached (DQA).
The first step in establishing the reliability of an analytical measurement is to determine that themeasurement analytical process used in making the measurement is in control. That is, thesample handling and analysis system is performing within an accepted operating range

Radiochemical Data Verification and Validation
8-13JULY 2004 MARLAP
(established by instrument manufacturer, method, contract specifications, or long-term historicallaboratory performance). After it has been determined that the measurement analytical process isin control, it is necessary to demonstrate that the sample is responding as expected whenintroduced into the measurement system.
The measurement process includes devices such as detectors for measuring radioactive decayemissions and balances for determining the mass of materials. The measurement process alsoincludes the software that takes the output from the measurement device and calculates the resultas a quantity of target radionuclide (activity/mass or activity/volume). The measurement processperformance normally is specified by the SOW and appropriate project plan documents, andmonitored by routine laboratory quality control procedures. Laboratory performance against theserequirements is determined by the verification process.
When a sample is analyzed, new sources of variability are encountered in addition to thoseassociated with the measurement process. These sources include laboratory subsampling, samplepreparation (e.g., digestion, leaching, etc.), and sample matrix effects, to list a few. Theseprocesses, taken together with the previously discussed measurement process, comprise theanalytical process.
The performance of the analysis can be predicted based on previous experience with similarmaterials. Analysis performance is monitored by laboratory quality control procedures specifiedin the SOW and appropriate project plan documents. Since each sample matrix, analyte, andmethod set is unique, the evaluation of overall analysis performance and resulting data is the roleof a knowledgeable validator.
Using the validation plan, which specifies QC samples, validation tests, and validation limits,validation occurs in four stages:
� Determine whether the sample handling and analysis system is in control (Section 8.5.1); � Determine whether QC sample analyses meet specified MQOs (Section 8.5.2); � Apply validation tests of detection and unusual uncertainty (Section 8.5.3); and � Determine final data qualifiers and document the results (Section 8.5.4).
For some methods (e.g., gamma spectrometry), identification of the analyte is also a primarydecision. The laboratory�s ability to identify analytes reliably is best checked by auditors andverified by reviewing the instrument�s energy-calibration file.
8.5.1 The Sample Handling and Analysis System
As described in earlier sections of this guidance, it is necessary to know the extent to which thedata delivered for validation meet the requirements of the SOW and appropriate project plandocuments. These documents normally specify the minimum acceptable performance of the
Radiochemical Data Verification and Validation
8-14MARLAP JULY 2004
analytical process. These specifications are the basis of the tests of quality control (QC tests) thatestablish that the sample handling and analysis system is in control at the time the analyses wereperformed. It is also necessary to know that all reporting requirements are complete. Normally,this evaluation against the requirements is made during the data verification process. If the datado not conform to the requirements, notification should be provided in the verification report.
The review of the verification package (and data package) by the validator determines ifsufficient information is provided to proceed with data validation. The outcome of the verifica-tion process is the designation of exceptions to the quality control tests. These exceptions shouldbe flagged with a qualifier (re-evaluated by the validator), which is appended to a data or reportrequirement that does not meet specifications to alert the validator of potential problems. Thevalidator should then determine if sufficient reliable data are available to proceed with validation.The validator should use the data requirements and criteria developed in the validation plan todetermine if the quality control exceptions have an adverse impact on one or more of the datapoints being validated.
Rarely, if ever, should quality control exceptions result in the decision to reject a complete dataset. Those types of situations should have been detected by the laboratory during the analyticalprocess and the samples reanalyzed. The validator should not reject (assign an �R� code) singledata points based on a single QC test exception. Normally, only numerous QC exceptions andfailures in one or more of the tests of detection and uncertainty are sufficient reason to rejectdata. The validation report should fully explain the assignment of all qualifiers as previouslydiscussed.
The following paragraphs discuss some of the more important evaluations that should be appliedto the sample handling and analysis system. Some of these items (e.g., calibration, verification ofself-absorption curves, and efficiency) may be checked during an audit instead of during dataverification and validation. Limited guidance is provided on how the QC test may impact dataquality and defensibility.
8.5.1.1 Sample Descriptors
Sample descriptors include sample identification number, analytical method, analyte, and matrix,among others.
Criteria. Each sample should have a unique identifier code that can be cross-referenced to aunique sample or an internally generated laboratory sample. This unique identifier and associatedsample descriptors should be included in all analytical reports to properly document the sampleand requested analysis (Chapters 10, Field and Sampling Issues that Affect Laboratory Measure-ments, and 11, Sample Receipt, Inspection, and Tracking).
Radiochemical Data Verification and Validation
8-15JULY 2004 MARLAP
The matrix and other characteristics of the sample that affect method selection and performanceshould be clearly identified. The method(s) used in sample preparation and analysis should beidentified. If laboratory replicate analyses are reported for a sample, they should bedistinguishable by a laboratory-assigned code.
Verification. Check that criteria related to the sample description (e.g., stated description ofsample type) have been addressed and pertinent documentation is included in the analytical datapackage. If necessary documentation is missing, the data should be flagged with an �E� code.
Validation. Missing information will decrease the confidence in any result reported on asample(s) and justify the assignment of a �J� code. Missing information may be inferred fromother information in the data package. For example, if the sample matrix is not provided, it maybe inferred from:
� The aliquant units are expressed in units of mass or volume; � The sample preparation method is specific for soils; � The final results are expressed in units of mass; and � The sampling report describes sampling soil.
The majority of related information should support the decision that the exception does notdecrease the confidence in the result. If the supporting information is incomplete or conflicting,the assignment of a �J� code to data points is warranted. If documentation is inadequate tosupport the reporting of a data point, the data point should be qualified with an �R� code.
8.5.1.2 Aliquant Size
Criteria. The aliquant or sample size used for analysis should be documented so that it can bechecked when reviewing calculations, examining dilution factors or analyzing any data thatrequires aliquant as an input. It is also imperative that the appropriate unit (liter, kilogram, etc.) isassigned to the aliquant.
Verification. Check that criteria related to sample aliquanting (e.g., stated aliquant size) havebeen addressed, and pertinent documentation is included in the analytical data package. Ifaliquant size documentation is missing, the data should be flagged with an �E� code.
Validation. The missing information will increase the uncertainty on any result reported on asample(s) and justify the assignment of a �J� code.

Radiochemical Data Verification and Validation
8-16MARLAP JULY 2004
8.5.1.3 Dates of Sample Collection, Preparation, and Analysis
Criteria. The analytical data package should report date of sampling, preparation, and analysis.These data are used to calculate radiological holding times, some of which may be specified inthe sampling and analysis plan.
There are few circumstances where radiological holding times are significant for radionuclides.The best approach to minimize the impact of holding time on analysis is to analyze the samplesas quickly as possible. Holding times may be applied to samples that contain radionuclides withshort half-lives. Holding times would apply to these radionuclides to prevent reporting of highmeasurement uncertainties and MDCs, and to detect the radionuclide, if present at lowconcentration, before it decays to undetectable levels.
Verification. Check that criteria related to sample radiological holding time (e.g., stated date ofsample collection and analysis) have been addressed, and pertinent documentation is included inthe analytical data package. If information on radiological holding time is missing, the datashould be flagged with an �E� code.
If a holding time is specified in the project plan documents or validation plan, the reported valuesshould be compared to this specification. If the holding time is exceeded, the affected criteria(holding time) should be flagged with an �E� code.
Validation. The data points impacted by the missed holding time should be flagged with a �J�code by the validator or the justification for discounting the holding time impact described in thenarrative section of the validation report.
8.5.1.4 Preservation
Criteria. Appropriate preservation is dependent upon analyte and matrix and should be definedin sampling and analysis documentation. Generally, radiochemical samples are preserved toprevent precipitation, adsorption to container walls, etc. The criteria (required presence orabsence) for this QC process should be provided in the sampling and analysis plan (Chapter 10).
Verification. Check that criteria related to sample preservation (e.g., stated preservationtechnique or verification thereof) have been addressed, and pertinent documentation is includedin the analytical data package. If information on sample preparation is missing, the data shouldbe flagged with an �E� code.
Validation. If exceptions to the preservation criteria are noted, the validator should decide if a�J� code should be assigned to data points because the improper preservation increased theoverall uncertainty in the data. In some cases where improper preservation severely impacts data

Radiochemical Data Verification and Validation
8-17JULY 2004 MARLAP
quality or defensibility (e.g., the use of acid preservation in water samples being analyzed for14C), the validator should assign an �R� qualifier. The assessor may elect to use the data, but theyhave the responsibility of addressing the data quality and defensibility in the assessment report.
8.5.1.5 Tracking
Criteria. Each analytical result should be linked to the instrument or detector on which it wascounted. The requirement for this linkage normally is found in the project plan documents. Theanalytical sequence log (or some other suitable record) should be available in the data packagesubmitted by the laboratory.
Verification. Check to see that the criteria related to instrument or detector linkage are found inthe analytical data package. If the data are not linked to a counting instrument or detector, thedata should be flagged with an �E� code.
Validation. The validator may consider the absence of linking a sample to a detection systeminto their evaluation of data quality and usability. At most, this should result in increasing theuncertainty of the determination and possibly assigning a �J� code to the data. This would notoccur normally unless one or more of the detectors used in analyzing the samples was shown tobe unreliable. Then, the inability to link a reliable detector to a sample increases the uncertaintyof the data point(s).
8.5.1.6 Traceability
Criteria. The traceability of standards and reference materials to be used during the analysisshould be specified in the sampling and analysis plan.
Verification. Check that criteria related to traceability of reference materials and standards(completed source manufacturer and internal calibration certificates) have been addressed, andpertinent documentation is included in the analytical data package or has been verified during anaudit. If documentation on the traceability of reference materials and standards is missing, thedata should be flagged with an �E� code.
Validation. The validator may factor the absence of the traceability into their evaluation of dataquality and usability. At most, this should result in increasing the uncertainty of the determina-tion and the possible assignment of a �J� code to the data. This would not occur normally unlessone or more of the standards used in analyzing the samples was shown to be unreliable. Then, theinability to trace a reliable standard to a sample increases the uncertainty of the data point(s).

Radiochemical Data Verification and Validation
8-18MARLAP JULY 2004
8.5.1.7 QC Types and Linkages
Criteria. The type and quantity of QC samples should be identified and listed in the SOW andthe results provided by the laboratory in a summary report. Replicates and matrix spike resultsshould be linked to the original sample results. The approximate level of matrix spike concentra-tions should be specified in the SOW, but the actual levels should be reported by the laboratory.The QC analyses should be linked to the original sample.
Verification. Check that there is linkage of QC samples to project samples and pertinentdocumentation is included in the analytical data package. If linkage information is missing, thedata should be flagged with an �E� code.
Validation. The validator should compare any QC sample exceptions to similar ones thatprecede and follow the nonconforming QC sample. If these are in control, the validator candiscount the impact of the single QC sample exception on the data results (i.e., analyticalblunder). If a trend of failing values is found, the validator should consider if they affected agroup of data points to the extent that the level of uncertainty was increased. This may warrantthe assignment of a �J� code to the data.
8.5.1.8 Chemical Separation (Yield)
Criteria. Yield assesses the effects of the sample matrix and the chemical separation steps on theanalytical result and estimates the analyte loss throughout the total analytical process. Yield istypically measured gravimetrically (with a carrier) or radiometrically (with a radiotracer). All thecomponents in the calculation of the yield should be identified in a defined sequence. Thesespecifications are found in the project plan documents.
Criteria for acceptable chemical yields may be given in the project plan documents. The criteriashould be based on historical data for the method and matrix. In that case, yield is determined onboth quality control samples and actual samples.
The most important yield-related question is whether the yield has been determined accurately.Typically, a yield estimate that is much greater than 100 percent cannot be accurate, but anestimate may also be questionable if the yield is far outside its historical range. Extremely lowyields may lead to large measurement uncertainties.
Verification. Check that criteria related to chemical yield (e.g., calculated gravimetric orradiotracer yield determinations) have been addressed, and pertinent documentation is includedin the analytical data package. If information on chemical yield is missing, the data should beflagged with an �E� code.
Radiochemical Data Verification and Validation
8-19JULY 2004 MARLAP
Validation. The experimentally determined yield is used to normalize the observed sampleresults to 100 percent yield. Exceptions to the yield value outside the range specified in theproject plan documents may result in the validator assigning a �J� qualifier to otherwiseacceptable data.
8.5.1.9 Self-Absorption
Criteria. For some radiochemical analytical methods, the SOW may specify the generation of aself-absorption curve, which correlates mass of sample deposited in a known geometry todetector efficiency.
Verification. For certain radionuclides, check that criteria related to self absorption curves (e.g.,verification or copies of curves (or point-source values) covering the required weight ranges,emission type and energy) have been addressed and pertinent documentation is included in theanalytical data package or has been verified during an audit. If the documentation is missing, thedata should be flagged with an �E� code.
Validation. If required self-absorption curves are missing, the validator may qualify affected datawith a �J� qualifier to signify an increased level of uncertainty in the measurement because of theinability to correct the measured value for self-absorption.
8.5.1.10 Efficiency, Calibration Curves, and Instrument Background
Criteria. For some methods based on decay-emission counting, efficiency is reported asmeasured count rate divided by the disintegration rate. For several methods, these efficiencydeterminations will depend on the energy of the emitted particle. For example, in gamma-rayspectrometry, a curve is fitted (measured activity/absolute disintegration rate) as a function of thegamma-ray energy for which this ratio is determined. A method like alpha spectrometry employstracer radionuclides to determine a sample-specific �effective� efficiency factor, which is aproduct of the chemical yield and the detector efficiency. The specific efficiency criterionrequired for the project may be specified in the SOW. The determination of detector efficiency isa detailed process that is best checked during an audit of the laboratory�s capabilities and isusually not part of the verification and validation process. Instrument background count rate isdetermined for each detector for each region of interest and subtracted from the sample countrate.
Verification. Check that each efficiency determination, efficiency calibration curve, andinstrument background called for in the project plan documents is included in the analytical datapackage, if required. In many cases, this means assessing whether the proper calibration orefficiency was applied for the sample analyzed. If the documentation is missing, the data shouldbe flagged with an �E� code. Each background subtracted should be appropriate for the

Radiochemical Data Verification and Validation
8-20MARLAP JULY 2004
radionuclide of interest. The proper use of crosstalk factors is one example of proper backgroundsubtraction.
Validation. If required factors are missing, the validator may select to qualify affected data witha �J� qualifier to signify an increased level of uncertainty in the measurement because of theinability to correct the measured value for efficiency.
8.5.1.11 Spectrometry Resolution
Criteria. The measured resolution of alpha and gamma-ray spectrometers, in terms of the fullwidth of a peak at half maximum (FWHM), can be used to assess the adequacy of instrumentsetup, detector selectivity, and chemical separation technique that may affect the identificationand quantification of the analyte. When sufficient peak definition (i.e., sufficient number ofcounts to provide an adequate Gaussian peak shape) has been reached for a sample, theresolution of the analyte peak should be evaluated to determine if proper peak identification andseparation or deconvolution was made. Spectral information should be provided in the datapackages to accomplish this evaluation.
Verification. There are no established acceptance criteria, but resolution data (e.g., FWHM)should be provided in the package or available during an audit.
Validation. If required calculations (multiplet analysis) are missing, the validator may elect toqualify affected data with a �J� code to signify an increased level of uncertainty in the measure-ment. In addition, if severe peak interference has not been corrected properly, the data should bequalified with a �J� code. An �R� code may be applied if there is no separation of the analytepeaks.
8.5.1.12 Dilution and Correction Factors
Criteria. Samples for radiochemistry are usually not diluted, but a larger sample may bedigested, taking an aliquant for analysis to obtain a more representative subsample. The dilutionfactors are normally used for tracers and carriers. Dilutions of the stock standards are preparedand added to the samples. This dilution normally affects yield calculations, laboratory controlsamples, and matrix spikes. This data should be provided in the data package so that the finalcalculations of all data affected by dilution factors can be recalculated and confirmed, if required.
Other correction factors that may be applied to the data are dry weight correction, ashed weightcorrection, and correction for a two-phased sample analyzed as separate phases.
Verification. Check that criteria related to sample dilution and correction factors (e.g., factorshave been stated) have been addressed and pertinent documentation is included in the analytical

Radiochemical Data Verification and Validation
8-21JULY 2004 MARLAP
data package. If sample dilution information is missing, the data should be flagged with an �E�code.
Validation. Those results impacted by missing dilution factors should be flagged with a �J� or�R� qualifier, reflecting increased uncertainty in the data point(s). �R� may be warranted if thecalculation cannot be confirmed due to missing data.
8.5.1.13 Counts and Count Time (Duration)
Criteria. The count time for each sample, QC analysis, and instrument background should berecorded in the data package. The ability to detect radionuclides is directly related to the counttime.
Verification. Check that criteria related to instrument counting times (e.g., stated data about testsource and background counting times) have been addressed and pertinent documentation isincluded in the analytical data package. If instrument or detector counting times are missing, thedata should be flagged with an �E� code.
Validation. The validator should estimate the impact of the actual count times on the ability todetect the target analyte and the impact on the uncertainty of the measurement. If the MQOs aremet, the sample should not be qualified for count time. The qualifiers should be adjustedaccordingly and the justification provided in the validation report.
8.5.1.14 Result of Measurement, Uncertainty, Minimum Detectable Concentration, and Units
Criteria. MARLAP recommends that the result of each measurement, its expanded measurementuncertainty, and the estimated sample- or analyte-specific MDC be reported for each sample inthe appropriate units. These values, when compared with each other, provide information aboutprogrammatic problems with the calculations, interference of other substances, and bias. Thereport should state the coverage factor used if calculating expanded measurement uncertainties,and the Type I and Type II error probabilities used to calculate MDCs.
Verification. Check to see that all criteria relating to linkages among result, measurementuncertainties, MDC, and sample identification are found in the analytical data package. If any ofthe criteria or actual linkages are missing, they should be flagged with an �E� code.
Validation. The validator should assign data qualifiers to those data points for which they feelsufficient justification exists. Each qualifier should be discussed in the validation report.

Radiochemical Data Verification and Validation
8-22MARLAP JULY 2004
8.5.2 Quality Control Samples
Historically, data validation has placed a strong emphasis on review of QC sample data(laboratory control samples, duplicates, etc). The assumption is that if the analytical process wasin control and the QC samples responded properly, then the samples would respond properly. Itis possible to have excellent performance on simple matrices (e.g., QC samples), butunacceptable performance on complex matrices reported in the same batch as the QC samples.Directly evaluating the sample performance is essential to determine measurement uncertaintyand the likelihood of false positive and negative detection of the target analyte.
Method blanks and laboratory control samples relate to the analytical batch (a series of similarsamples prepared and analyzed together as a group) quality control function. They are requiredby most analytical service contracts, sampling and analysis plans, and project plan documents.They serve a useful function as monitoring tools that track the continuing analytical processduring extended analytical sequences. They are the most ideal samples analyzed as part of aproject. Normally, their performance is compared to fixed limits derived from historicalperformance or additionally project specific limits derived from the MQOs.
Laboratory duplicates and matrix spikes are quality control samples that directly monitor samplesystem performance. The laboratory duplicates (two equal-sized samples of the material beinganalyzed, prepared, and analyzed separately as part of the same batch) measure the overallprecision of the sample measurement process beginning with laboratory sub-sampling of thesample. Matrix spikes (a sample containing a known amount of target analyte added to thesample) provide a direct measure of how the target analyte responds when the sample is preparedand measured, thereby estimating a possible bias introduced by the sample matrix.
Other QC tests can be applied to determine how the analytical process performs during theanalysis of samples. These are yield, detector efficiency, test-source self-absorption, resolution,and drift. They are the same QC tests that were applied to routine QC samples (blanks andlaboratory control samples) in the previous discussion of the analytical process, but now areapplied to samples. The difference lies in how performance is measured. Fixed limits based onhistorical performance or statistics are usually the basis for evaluating the results of routine QCsamples.
The following paragraphs discuss how QC tests should be used to determine if the results for QCsamples meet the project MQOs. Guidance is provided on how to relate QC sample and sampleperformance to determine sample data quality and defensibility. Direction is also given abouthow to assign data qualifiers to sample data based on the tests of quality control. Appendix Cprovides guidance on developing criteria for evaluating QC sample results. Specifically,Appendix C contains equations that allow for the determination of warning and control limits forQC sample results based on the project�s MQO for measurement uncertainty.

Radiochemical Data Verification and Validation
8-23JULY 2004 MARLAP
8.5.2.1 Method Blank
The method blank (Section 18.4.1) is generated by carrying all reagents and added materialsnormally used to prepare a sample through the same preparation process. It establishes howmuch, if any, of the measured analyte is contributed by the reagents and equipment used in thepreparation process. For an ideal system, there will be no detected concentration or activity.
Measured results are usually corrected for instrument background and may be corrected forreagent background. Therefore, it is possible to obtain final results that are less than zero.
Criteria. The requirement for a method blank is usually established in the SOW and appropriateplan documents. The objective is to establish the target analyte concentration or activityintroduced by the sample preparation sequence. Method blanks are normally analyzed once peranalytical batch.
Other types of blanks, such as field blanks and trip blanks, are used to evaluate aspects of thedata collection effort and laboratory operations that are not directly related to the validation ofenvironmental analytical data quality or technical defensibility. They can be important to theoverall data assessment effort, but are beyond the scope of this guidance (Chapter 10).
See Appendix C (Measurement Quality Objectives for Method Uncertainty and Detection andQuantification Capability) for guidance on developing criteria for evaluating blanks based on theproject�s MQO for method uncertainty.
Verification. If a method blank was required but not performed, or if the required data aremissing, the verifier flags the data with an �E� code.
Validation. If a blank result does not comply with the established criteria, the associated samplesare flagged �B+� to indicate that the blank result is greater than the upper limit, or �B-� toindicate that the blank result is less than the lower limit.
8.5.2.2 Laboratory Control Samples
The laboratory control sample (LCS) is a QC sample of known composition or an artificialsample (created by spiking a clean material similar in chemical and physical properties to thesample), which is prepared and analyzed in the sample manner as the sample (see Section 18.4.3,�Laboratory Control Samples, Matrix Spikes, and Matrix Spike Duplicates�). In an idealsituation, the LCS would give 100 percent of the concentration or activity known to be present inthe fortified sample or standard material. Acceptance criteria for the LCS sample are based on thecomplexity of the matrix and the historical capability of the laboratory and method to recover theactivity. The result normally is expressed as percent recovery.
Radiochemical Data Verification and Validation
8-24MARLAP JULY 2004
Criteria. The objective of the LCS is to measure the response of the analytical process to a QCsample with a matrix similar to the sample. This will allow inferences to be drawn about thereliability of the analytical process.
See Appendix C for guidance on developing control limits for LCS results based on the project�sMQO for method uncertainty.
Verification. If a required LCS is not analyzed, or if required information is missing, the verifierflags the data with an �E� code.
Validation. When the measured result for the LCS is outside the control limits, the associatedsamples are flagged with the �S� qualifier (S+ or S-).
8.5.2.3 Laboratory Replicates
Replicates are used to determine the precision of laboratory preparation and analyticalprocedures. Laboratory replicates are two aliquants selected from the laboratory sample andcarried through preparation and analysis as part of the same batch.
The discussion of field replicates is beyond the scope of this chapter.
Criteria. The objective of replicate analyses is to measure laboratory precision based on eachsample matrix. The variability of the samples due to the analyte�s heterogeneity in the sample isalso reflected in the replicate result. The laboratory may not be in control of the precision.Therefore, replicate results are used to evaluate reproducibility of the complete laboratoryprocess that includes subsampling, preparation, and analytical process.
See Appendix C for guidance on developing control limits for replicate results based on theproject�s MQO for method uncertainty.
Verification. If replicate analyses are required but not performed, or if the required data are notpresent in the report, the verifier flags the data with an �E� code.
Validation. When the replicate analysis is outside the control limit, the associated samples areflagged with the �P� qualifier.
8.5.2.4 Matrix Spikes and Matrix Spike Duplicates
A matrix spike is typically an aliquant of a sample fortified (spiked) with known quantities oftarget radionuclides and subjected to the entire analytical procedure to establish if the method orprocedure is appropriate for the analysis of a particular matrix. In some cases, specifically

Radiochemical Data Verification and Validation
8-25JULY 2004 MARLAP
prepared samples of characterized materials that contain or are spiked with the target radionuc-lide and are consistent with the sample matrix may be used as matrix spikes. Matrix spikeduplicates are used in a similar fashion as laboratory sample replicates, but in cases where thereare insufficient quantities of target radionuclides in the laboratory sample replicates to providestatistically meaningful results.
Criteria. Matrix spike samples provide information about the effect of each sample matrix onthe preparation and measurement methodology. The test uncovers the possible existence ofrecovery problems, based on either a statistical test or a specified fixed control limit.
See Appendix C for guidance on developing criteria for evaluating matrix spikes based on theproject�s MQO for method uncertainty.
Verification. If a required matrix spike analysis was not performed, or if the requiredinformation is missing, the data should be flagged with an �E� code.
Validation. If the results of the matrix spike analysis do not meet the established criteria, thesamples should be qualified with an �S+� or �S-� indicating unacceptable spike recoveries.
8.5.3 Tests of Detection and Unusual Uncertainty
8.5.3.1 Detection
The purpose of a test of detection is to decide if each result for a regular sample is significantlydifferent from zero. Since most radiochemistry methods always produce a result, even if a veryuncertain or negative one, some notion of a non-detected but measured result may be needed forsome projects. A nondetected result is generally as valid as any other measured result, but it istoo small relative to its measurement uncertainty to give high confidence that a positive amountof analyte was actually present in the sample. Ordinarily, if the material being analyzed isactually analyte-free, most results should be �nondetected.�
For some projects, detection may not be an important issue. For example, it may be known thatall the samples contain a particular analyte, and the only question to be answered is whether themean concentration is less than an action level. However, all laboratories should be able toperform a test of detection routinely for each analyte in each sample.
Criteria. An analyte is considered detected when the measured analyte concentration exceeds thecritical value (see Chapter 20, Detection and Quantification Capabilities). Both values arecalculated by the laboratory performing the measurement; so, the detection decision can be madeat the laboratory and indicated in its report. If there is no evidence of additional unquantified

Radiochemical Data Verification and Validation
8-26MARLAP JULY 2004
uncertainty in the result (e.g., lack of statistical control or blank contamination), the laboratory�sdecision may be taken to be final.
Verification. Typically, the role of the verifier is limited to checking that required information,such as the critical value, is present in the report. If information is missing, the result should beflagged with an �E� code.
Validation. The validator examines the result of the measurement, its critical value, and otherinformation associated with the sample and the batch in which it was analyzed, including methodblank results in particular, to make a final determination of whether the analyte has been detectedwith confidence. If the data indicates the analyte has been detected in both the sample and themethod blank, its presence in the sample may be questionable. A quantitative comparison of thetotal amounts of analyte in the sample and method blank, which takes into account the associatedmeasurement uncertainties, may be needed to resolve the question.
8.5.3.2 Detection Capability
Criteria. If the project requires a certain detection capability, the requirement should beexpressed as a required minimum detectable concentration (RMDC). The data report shouldindicate the RMDC and the sample-specific estimate of the actual minimum detectableconcentration (MDC) for each analyte in each sample.
In some situations, it may not be necessary or even possible for a laboratory to meet the MDCrequirement for all analytes in all samples. In particular, if the analyte is present and quantifiableat a concentration much greater than the action level, a failure to meet a contract-requireddetection limit is usually not a cause for concern. A failure to meet the RMDC is more often animportant issue when the analyte is not detected.
Verification. The RMDC specified in the contract is compared to the sample-specific MDCachieved by the method. The analytes that do not meet the RMDC are flagged with an �E� code.
Validation. If the sample-specific MDC estimate exceeds the RMDC, the data user may beunable to make a decision about the sample with the required degree of certainty. A �UJ�qualifier is warranted if the estimated MDC exceeds the RMDC and the analyte was not detectedby the analysis. A final decision about the usability of the data should be made during the dataassessment phase of the data collection process.
An assignment of �R� to the data points affected by this type of exception may be appropriate insome cases, but the narrative report may classify the data as acceptable (no qualifier), �U,� or �J,�based on the results of the tests of detection and uncertainty. This allows the assessor to make an

Radiochemical Data Verification and Validation
8-27JULY 2004 MARLAP
informed judgement about the usability of the data point(s) and allows them the opportunity toprovide a rationale of why the data can be used in the decision process.
8.5.3.3 Large or Unusual Uncertainty
When project planners follow MARLAP�s recommendations for developing MQOs, theydetermine a required method uncertainty at a specified analyte concentration. The requiredmethod uncertainty is normally expressed in concentration units, but it may be expressed as arelative method uncertainty (percent based on the upper bound of the gray region, which isnormally the action level). It is reasonable to expect the laboratory�s combined standarduncertainty at concentrations lower than the action level to be no greater than the requiredmethod uncertainty (expressed in concentration units) and to expect the laboratory�s relativecombined standard uncertainty at concentrations above the action level to be no greater than therequired relative method uncertainty (expressed as a percent). Each measured result should bechecked against these expectations (see Appendix C).
Criteria. The reported combined standard uncertainty is compared to the maximum allowablestandard uncertainty. Either absolute (in concentration units) or relative uncertainties (expressedas a percent) are used in the comparison, depending on the reported concentration. The result isqualified with a �Q� if the reported uncertainty is larger than the requirement allows.
Verification. The test for large uncertainty is straightforward enough to be performed duringeither verification or validation. If there is a contractual requirement for measurement uncertain-ty, the verifier should perform the test and assign the �E� qualifier to results that do not meet therequirement. Note that it may sometimes happen that circumstances beyond the control of thelaboratory make it impossible to meet the requirement.
Validation. If a �Q� qualifier is assigned, the validator may consider any special circumstancesthat tend to explain it, such as interferences, small sample sizes, or long decay times, which werebeyond the control of the laboratory. He or she may choose to remove the qualifier, particularly ifit is apparent that the original uncertainty requirement was too restrictive.
8.5.4 Final Qualification and Reporting
The final step of the validation process is to assign and report final qualifiers for all regularsample results. The basis for assignment of final qualifiers is qualifiers and reasons from allprevious tests, patterns of problems in batches of samples, and validator judgement.
The difficult issue during final qualifier assignment is rejecting data. What follows summarizessome of the issues to consider when thinking about rejecting data.

Radiochemical Data Verification and Validation
8-28MARLAP JULY 2004
Rejecting a result is an unconditional statement that it is not useable for the intended purpose. Aresult should only be rejected when the risks of using it are significant relative to the benefits ofusing whatever information it carries. If the DQA team or users feel data is being rejected forreasons that don't affect usability, they may disregard all validation conclusions. Rejected resultsshould be discarded and not used in the DQA phase of the data life cycle.
There are three bases on which to reject data:
1. Insufficient or only incorrect data are available to make fundamental decisions about dataquality. For example, if correctly computed uncertainty estimates are not available, it isnot possible to do most of the suggested tests. If the intended use depends on a consistent,high level of validation, it may be proper to reject such data.
The missing data should be fundamental. For example, missing certificates for standardsare unlikely to be fundamental if laboratory performance on spiked samples is acceptable.In contrast, if no spiked sample data is available, it may be impossible to determine if amethod gives even roughly correct results, and rejection may be appropriate.
2. Available data indicate that the assumptions underlying the method are not true. Forexample, QC samples may demonstrate that the laboratory�s processes are out of control.Method performance data may indicate that the method simply does not work forparticular samples. These problems should be so severe that is not possible to makequantitative estimates of their effects.
3. A result is �very unusually uncertain.� It is difficult to say what degree of uncertaintymakes a result unusable. Whenever possible, uncertain data should be rejected based onmultiple problems with one result, patterns in related data, and the validator�s judgement,not the outcome of a single test. This requires radiochemistry expertise and knowledge ofthe intended use.
Based on an evaluation of the tentative qualifiers, final qualifiers are assigned to each regularsample result.
After all necessary validation tests have been completed and a series of qualifiers assigned toeach data point based on the results of the tests, a final judgment to determine which, if any, finalqualifiers will be attached to the data should be made. The individual sample data from thelaboratory should retain all the qualifiers. The basic decision making process for each result isalways subject to validator judgement:
� As appropriate, assign a final �R�;
� If �S�, �P�, or �B� were assigned, determine whether the qualifiers warrant the assignment ofan �R�;

Radiochemical Data Verification and Validation
8-29JULY 2004 MARLAP
� If �R� is not assigned, but some test assigned a tentative S, P, B, Q, or J, or a pattern existsthat makes it appropriate, assign a final S, P, B, Q, or J and summarize QC sampleperformance;
� If a final S, B, or J was assigned, + or -, but not both, was tentatively assigned, and thepotential bias is not outweighed by other sources of uncertainty, make the + or - final; and
� For non-R results, if any test assigned a tentative �U,� make it final.
The final validation decision should address the fact that the broader purpose of validation is tocontribute to the total data collection process, i.e., effectively translate and interpret analyticalresults for efficient use by an assessor. This means the validator should examine the full range ofdata available to search for and utilize relationships among the data elements to support theacceptance and use of data that falls outside method or contract specifications and data validationplan guidance.
8.6 Validation Report
The final product of validation is a package that summaries the validation process and itsconclusions in an orderly fashion. This package should include:
� A narrative or summary table written by the validator that summarizes exceptional circum-stances: In particular, it should document anything that prevented executing the plannedvalidation tests. Further, the narrative should include an explicit statement explaining whydata has been rejected or qualified based on the findings of the validation tests and thevalidator�s judgment.
� A list of validated samples that provides a cross-reference of laboratory and client sampleidentifiers: This report should also include other identifiers useful in the context of theproject, such as reporting batch, chain of custody, or other sample management systemsample information.
� A summary of all validated results with associated uncertainty for each regular sample withfinal qualifiers: Unless specified in the sampling and analysis plan, non-detects are reportedas measured, not replaced by a detection limit or other �less than� value.
� A summary of QC sample performance and the potential effect on the data both qualified andnot qualified.
Radiochemical Data Verification and Validation
8-30MARLAP JULY 2004
Assuming the client wants additional information, the following, more detailed reports can beincluded in the validation package. Otherwise, they are simply part of the validation process andthe verification contract compliance:
� A detailed report of all tentative qualifiers and associated reasons for their assignment;
� QC sample reports that document analytical process problems; and
� Reports that summarize performance by method�these should support looking across relatedanalyses at values such as yields and result ratios.
The data in the summary reports should be available in a computer-readable format. If no resultwas obtained for a particular analyte, the result field should be left blank. The validation reportshould package analytical results as effectively as possible for application and use by theindividual assembling and assessing all project data.
The validation report should contain a discussion describing the problem(s) found during thevalidation process. For the validation codes, the discussion summarizes the performance criteriaestablished in the validation plan. If the validation test performance criteria were changed (e.g.,increased or decreased level of unusual uncertainty) because the nature of the sample matrix oranalyte was different than expected, the new criteria should be explained in the report and thequalifiers applied using the new criteria. The approval of the project manager should be obtained(and documented) before the new criteria are applied. The project manager should communicatethe changes to the project planning team to maintain the consensus reached and documentedduring validation planning.
Well-planned and executed analytical activities can be expected to meet reasonable expectationsfor data reliability. This means that for most data points or data sets, the results of the tests ofquality control, detection, and unusual uncertainty will show that the data are of sufficient qualityand defensibility to be forwarded to the assessor with little or no qualification for finalassessment. A small number of points will be rejected because random errors in the analyticalprocess or unanticipated matrix problems resulted in massive failure of several key validationtests.
A smaller number of data points will show conflicting results from the validation tests andpresent the greatest challenge to the validator. The more important the decision and the lower therequired detection limit, the more common this conflict will become, and the more critical it isthat the data validation plan provide guidance to the validator about how to balance theconflicting results. Is the ability to detect the analyte more important than the associatedstatistical unusual uncertainty, or is the presence of the analyte relatively definite but the unusualuncertainty around the project decision point critical to major decisions? The necessary guidanceshould be developed during the planning phase to guide the final judgment of the validator.

Radiochemical Data Verification and Validation
8-31JULY 2004 MARLAP
8.7 Summary of Recommendations
� MARLAP recommends that project objectives, implementation activities and QA/QC data bewell documented in project plans, reports, and records, since the success of the assessmentphase is highly dependent upon the availability of such information.
� MARLAP recommends that calibration be addressed in a quality system and through anaudit, although demonstration of calibration may be required as part of a project�sdeliverables.
� MARLAP recommends that the assessment criteria of a project be established during thedirected planning process and documented in the respective plans as part of the project plandocuments.
� MARLAP recommends that the result of each measurement, its expanded measurementuncertainty, and the estimated sample- or analyte-specific MDC be reported for each samplein the appropriate units.
8.8 Bibliography
American National Standards Institute (ANSI) N13.30. Performance Criteria for Radiobioassay.1996.
U.S. Environmental Protection Agency (EPA). 1994. Contract Laboratory Program NationalFunctional Guidelines for Inorganic Data Review. EPA-540/R-94-013 (PB94-963502).February. Available from www.epa.gov/oerrpage/superfund/programs/clp/download/fginorg.pdf.
U.S. Environmental Protection Agency (EPA). 2002. Guidance on Environmental DataVerification and Data Validation (EPA QA/G-8). EPA/240/R-02/004. Office ofEnvironmental Information, Washington, DC. Available at www.epa.gov/quality/qa_docs.html.

9-1JULY 2004 MARLAP
9 DATA QUALITY ASSESSMENT
9.1 Introduction
This chapter provides an overview of the data quality assessment (DQA) process, the third andfinal process of the overall data assessment phase of a project. Assessment is the last phase in thedata life cycle and precedes the use of data. Assessment�in particular DQA�is intended toevaluate the suitability of project data to answer the underlying project questions or the suitabilityof project data to support the project decisions. The output of this final assessment process is adetermination as to whether a decision can or cannot be made within the project-specified dataquality objectives (DQOs).
The discussions in this chapter assume that prior to the DQA process, the individual dataelements have been subjected to the first two assessment processes, �data verification� and �datavalidation� (see Chapter 8, Radiochemical Data Verification and Validation). The line betweenthese three processes has been blurred for some time and varies from guidance to guidance andpractitioner to practitioner. Although the content of the various processes is the most criticalissue, a common terminology is necessary to minimize confusion and to improve communicationamong planning team members, those who will implement the plans, and those responsible forassessment. MARLAP defines these terms in Section 1.4 (�Key MARLAP Concepts andTerminology�) and the Glossary and discusses assessment in Section 8.2 (�Data AssessmentProcess�).
This chapter is not intended to address the detailed and specific technical issues needed to assessthe data from a specific project but rather to impart a general understanding of the DQA processand its relationship to the other assessment processes, as well as of the planning and implemen-tation phases of the project�s data life cycle. The target audience for this chapter is the projectplanner, project manager, or other member of the planning team who wants to acquire a generalunderstanding of the DQA process; not the statistician, engineer, or radiochemist who is seekingdetailed guidance for the planning or implementation of the assessment phase. Guidance onspecific technical issues is available (EPA, 2000a and b; MARSSIM, 2000; NRC, 1998).
This chapter emphasizes that assessment,although represented as the last phase of theproject�s data life cycle, should be plannedduring the directed planning process, and theneeded documentation should be providedduring the implementation phase of the project.
Section 9.2 reviews the role of DQA in theassessment phase. Section 9.3 discusses thegraded approach to DQA. The role of the DQA
Contents
9.1 Introduction . . . . . . . . . . . . . . . . . . . . . . . . . . 9-19.2 Assessment Phase . . . . . . . . . . . . . . . . . . . . 9-29.3 Graded Approach to Assessment . . . . . . . . . 9-39.4 The Data Quality Assessment Team . . . . . . . 9-49.5 Data Quality Assessment Plan . . . . . . . . . . . 9-49.6 Data Quality Assessment Process . . . . . . . . . 9-59.7 Data Quality Assessment Report . . . . . . . . . 9-259.8 Summary of Recommendations . . . . . . . . . . 9-269.9 References . . . . . . . . . . . . . . . . . . . . . . . . . . 9-27

Data Quality Assessment
9-2MARLAP JULY 2004
team is discussed in Section 9.4. Section 9.5 describes the content of DQA plans. Section 9.6details the activities that are involved in the DQA process.
9.2 Assessment Phase
The assessment phase is discussed in Section 8.2. This present section provides a brief overviewof the individual assessment processes, their distinctions, and how they interrelate.
�Data verification� generally evaluates compliance of the analytical process with project-planand other project-requirement documents, and the statement of work (SOW), and documentscompliance and noncompliance in a data verification report. Data verification is a separateactivity in addition to the checks and review done by field and laboratory personnel duringimplementation. Documentation generated during the implementation phase will be used todetermine if the proper procedures were employed and to determine compliance with project plandocuments (e.g., QAPP), contract-specified requirements, and measurement quality objectives(MQOs). Any data associated with noncompliance will be identified as an �exception,� whichshould elicit further investigation during data validation.
Compliance, exceptions, missing documentation, and the resulting inability to verify complianceshould be recorded in the data verification report. Validation and DQA employ the verificationreport as they address the usability of data in terms of the project DQOs.
�Data validation� qualifies the usability of each datum after interpreting the impacts ofexceptions identified during verification. The validation process should be well defined in avalidation plan that was completed during the planning phase. The validation plan, as with theverification plan or checklist, can range from sections of a project plan to large and detailedstand-alone documents. Regardless of its size or format, the validation plan should address theissues presented in Section 8.3, �Validation Plan.� Data validation begins with a review ofproject objectives and requirements, the data verification report, and the identified exceptions.The data validator determines if the analytical process was in statistical control (Section 8.5.2,�Quality Control Samples�) at the time of sample analysis, and whether the analytical process asimplemented was appropriate for the sample matrix and analytes of interest(Section 8.5.1, �TheSample Handling and Analysis System�). If the system being validated is found to be undercontrol and applicable to the analyte and matrix, then the individual data points can be evaluatedin terms of detection (Section 8.5.3.1), detection capability (Section 8.5.3.2), and unusualuncertainty (Section 8.5.3.3). Following these determinations, the data are assigned qualifiers(Section 8.5.4) and a data validation report is completed (Section 8.6). Validated data are rejectedonly when the impact of an exception is so significant that the datum is unreliable.
While both data validation and DQA processes address usability, the processes address usabilityfrom different perspectives. �Data validation� attempts to interpret the impacts of exceptions

Data Quality Assessment
9-3JULY 2004 MARLAP
identified during verification and the impact of project activities on the usability of an individualdatum. In contrast, �data quality assessment� considers the results of data validation whileevaluating the usability of the entire data set.
During data validation, MARLAP strongly advises against the rejection of data unless there is asignificant argument to do so (Chapter 8). As opposed to rejecting data, it is generally preferablethat data are qualified and that the data validator details the concerns in the data validation report.However, there are times when data should be rejected, and the rationale for the rejection shouldbe explained in the data validation report. There are times when the data validator may havebelieved data should be rejected based on a viable concern, yet during DQA, a decision could bemade to employ the rejected data.
In summary, data validation is a transition from the compliance testing of data verification tousability determinations. The results of data validation, as captured in the qualified data andvalidation reports, will greatly influence the decisions made during the final assessment process,which is discussed in Section 9.6 (�Data Quality Assessment Process).
9.3 Graded Approach to Assessment
The sophistication of the assessment phase�and in particular DQA and the resources applied�should be appropriate for the project (i.e., a �graded approach�). Directed planning for small orless complex projects usually requires fewer resources and typically involves fewer people andproceeds faster. This graded approach to plan design is also applied to the assessment phase.Generally, the greater the importance of a project, the more complex a project, or the greater theramifications of an incorrect decision, the more resources will be expended on assessment ingeneral and DQA in particular.
It is important to note that the depth and thoroughness of a DQA will be affected by thethoroughness of the preceding verification and validation processes. Quality control or statementof work (SOW) compliance issues that are not identified as an �exception� during verification, orqualified during validation, will result in potential error sources not being reviewed and theirpotential impact on data quality will not be evaluated. Thus, while the graded approach toassessment is a valid and necessary management tool, it is necessary to consider all assessmentphase processes (data verification, data validation, and data quality assessment) when assigningresources to assessment.
9.4 The Data Quality Assessment Team
The project planning team is responsible for ensuring that its decisions are scientifically soundand comply with the tolerable decision-error rates established during planning. MARLAPrecommends the involvement of the data assessment specialist(s) on the project planning team

Data Quality Assessment
9-4MARLAP JULY 2004
during the directed planning process. This should result in a more efficient assessment plan andshould increase the likelihood that flaws in the design of the assessment processes will bedetected and corrected during planning. Section 2.4 (�The Project Planning Team�) notes that itis important to have an integrated team of operational and technical experts. The data assessmentspecialist(s) who participated as members of the planning team need not be the final assessors.However, using the same assessors who participated in the directed planning process isadvantageous, since they will be aware of the complexities of the project�s goals and activities.
The actual personnel who will perform data quality assessment, or their requisite qualificationsand expertise, should be specified in the project plan documents. The project planning teamshould choose a qualified data assessor (or team of data assessors) who is technically competentto evaluate the project�s activities and the impact of these activities on the quality and usability ofdata. Multi-disciplinary projects may require a team of assessors (e.g., radiochemist, engineer,statistician) to address the diverse types of expertise needed to assess properly the representa-tiveness of samples, the accuracy of data, and whether decisions can be made within the specifiedlevels of confidence. Throughout this manual, the term �assessment team� will be used to refer tothe assessor expertise needed.
9.5 Data Quality Assessment Plan
To implement the assessment phase as designed and ensure that the usability of data is assessedin terms of the project objectives, a detailed DQA plan should be completed during the planningphase of the data life cycle. This section focuses on the development of the DQA plan and itsrelation to DQOs and MQOs.
The DQA plan should address the concerns and requirements of all stakeholders and present thisinformation in a clear, concise format. Documentation of these DQA specifications, require-ments, instructions, and procedures are essential to assure process efficiency and that properprocedures are followed. Since the success of a DQA depends upon the prior two processes ofthe assessment phase, it is key that the verification and validation processes also be designed anddocumented in respective plans during the planning phase. Chapter 8 lists the types of guidanceand information that should be included in data verification and validation plans.
MARLAP recommends that the DQA process should be designed during the directed planningprocess and documented in a DQA plan. The DQA plan is an integral part of the project plandocuments and can be included as either a section or appendix to the project plan or as a citedstand-alone document. If a stand-alone DQA plan is employed, it should be referenced by theproject plan and subjected to a similar approval process.
The DQA plan should contain the following information:

Data Quality Assessment
9-5JULY 2004 MARLAP
� A short summary and citation to the project documentation that provides sufficient detailabout the project objectives (DQOs), sample and analyte lists, required detection limit, actionlevel, and level of acceptable uncertainty on a sample- or analyte-specific basis;
� Specification of the necessary sampling and analytical assessment criteria (typicallyexpressed as MQOs for selected parameters such as method uncertainty) that are appropriatefor measuring the achievement of project objectives and constitute a basis for usabilitydecisions;
� Identification of the actual assessors or the required qualifications and expertise that arerequired for the assessment team performing the DQA (Section 9.4);
� A description of the steps and procedures (including statistical tests) that will constitute theDQA, from reviewing plans and implementation to authoring a DQA report;
� Specification of the documentation and information to be collected during the project�simplementation;
� A description for any project-specific notification or procedures for documenting the usabilityor non-usability of data for the project�s decisionmaking;
� A description of the content of the DQA report;
� A list of recipients for the DQA report; and
� Disposition and record maintenance requirements.
9.6 Data Quality Assessment Process
MARLAP�s guidance on the DQA process has the same content as other DQA guidance (ASTMD6233; EPA, 2000a and b; MARSSIM, 2000; NRC, 1998; USACE, 1998), however, MARLAPpresents these issues in an order that parallels project implementation more closely. TheMARLAP guidance on the DQA process can be summarized as an assessment process that�following the review of pertinent documents (Section 9.6.1)�answers the following questions:
� Are the samples representative? (Section 9.6.2) � Are the analytical data accurate? (Section 9.6.3) � Can a decision be made? (Section 9.6.4)
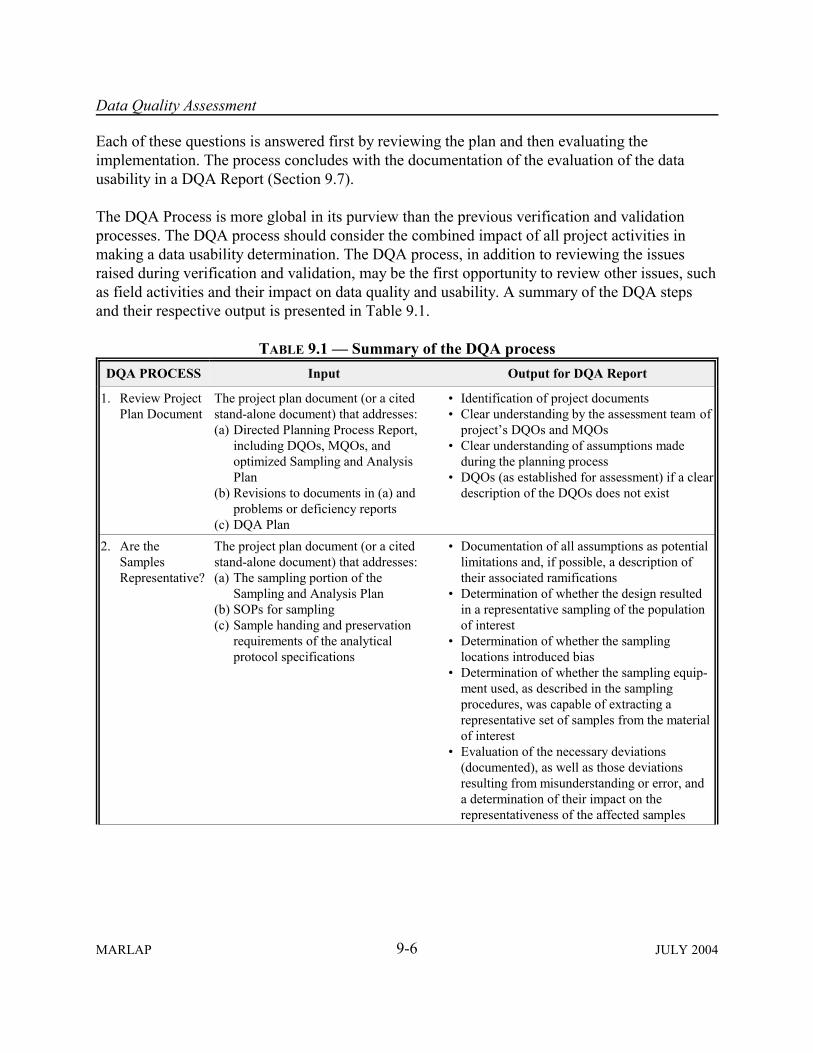
Data Quality Assessment
9-6MARLAP JULY 2004
Each of these questions is answered first by reviewing the plan and then evaluating theimplementation. The process concludes with the documentation of the evaluation of the datausability in a DQA Report (Section 9.7).
The DQA Process is more global in its purview than the previous verification and validationprocesses. The DQA process should consider the combined impact of all project activities inmaking a data usability determination. The DQA process, in addition to reviewing the issuesraised during verification and validation, may be the first opportunity to review other issues, suchas field activities and their impact on data quality and usability. A summary of the DQA stepsand their respective output is presented in Table 9.1.
TABLE 9.1 � Summary of the DQA processDQA PROCESS Input Output for DQA Report
1. Review ProjectPlan Document
The project plan document (or a citedstand-alone document) that addresses:(a) Directed Planning Process Report,
including DQOs, MQOs, andoptimized Sampling and AnalysisPlan
(b) Revisions to documents in (a) andproblems or deficiency reports
(c) DQA Plan
� Identification of project documents � Clear understanding by the assessment team of
project�s DQOs and MQOs � Clear understanding of assumptions made
during the planning process � DQOs (as established for assessment) if a clear
description of the DQOs does not exist
2. Are theSamplesRepresentative?
The project plan document (or a citedstand-alone document) that addresses: (a) The sampling portion of the
Sampling and Analysis Plan(b) SOPs for sampling(c) Sample handing and preservation
requirements of the analyticalprotocol specifications
� Documentation of all assumptions as potentiallimitations and, if possible, a description oftheir associated ramifications
� Determination of whether the design resultedin a representative sampling of the populationof interest
� Determination of whether the samplinglocations introduced bias
� Determination of whether the sampling equip-ment used, as described in the samplingprocedures, was capable of extracting arepresentative set of samples from the materialof interest
� Evaluation of the necessary deviations(documented), as well as those deviationsresulting from misunderstanding or error, anda determination of their impact on therepresentativeness of the affected samples

Data Quality Assessment
DQA PROCESS Input Output for DQA Report
9-7JULY 2004 MARLAP
3. Are the DataAccurate?
The project plan documents (or a citedstand-alone document) which address: (a) The analysis portion of the Sampling
and Analysis Plan(b) Analytical protocol specifications,
including quality controlrequirements and MQOs
(c) SOW(d) The selected analytical protocols and
other SOPs(e) Ongoing evaluations of performance(f) Data Verification and Validation
plans and reports
� Determination of whether the selected methodswere appropriate for the intended applications
� Identification of any potential sources ofinaccuracy
� Assessment of whether the sample analyseswere implemented according to the analysisplan
� Evaluation of the impact of any deviationsfrom the analysis plan on the usability of thedata set
4. Can a Decisionbe Made?
The project plan document (or a citedstand-alone document) that addresses: (a) The DQA plan, including the
statistical tests to be used(b) The DQOs and the tolerable decision
error rates
� Results of the statistical tests. If new tests wereselected, the rationale for their selection andthe reason for the inappropriateness of thestatistical tests selected in the DQA plan
� Graphical representations of the data set andparameter(s) of interest
� Determination of whether the DQOs andtolerable decision error rates were met
� Final determination of whether the data aresuitable for decisionmaking, estimating, oranswering questions within the levels ofcertainty specified during planning
9.6.1 Review of Project Documents
The first step of the DQA process is for the team to identify and become familiar with the DQOsof the project and the DQA plan. Like the planning process, the steps of the DQA process areiterative, but they are presented in this text in a step-wise fashion for discussion purposes.Members of the assessment team may focus on different portions of the project plan documentsand different elements of the planning process. Some may do an in-depth review of the directedplanning process during this step; others will perform this task during a later step. Theassessment team should receive revisions to the project planning documents and should reviewdeficiency reports associated with the project. The first two subsections below discuss the keyproject documents that should be reviewed, at a minimum.
9.6.1.1 The Project DQOs and MQOs
Since the usability of data is measured in terms of the project DQOs, the first step in the DQAprocess is to acquire a thorough understanding of the DQOs. If the DQA will be performed bymore than one assessor, it is essential that the assessment team shares a common understanding
Data Quality Assessment
9-8MARLAP JULY 2004
of the project DQOs and tolerable decision error rates. The assessment team will refer to theseDQOs continually as they make determinations about data usability. The results of the directedplanning process should have been documented in the project plan documents. The project plandocuments, at a minimum, should describe the DQOs and MQOs clearly and in enough detailthat they are not subject to misinterpretation or debate at this last phase of the project.
If the DQOs and MQOs are not described properly in the project plan documents or do notappear to support the project decision, or if questions arise, it may be necessary to review otherplanning documents (such as memoranda) or to consult the project planning team or the coregroup (Section 2.4). If a clear description of the DQOs does not exist, the assessment teamshould record any clarifications the assessment team made to the DQO statement as part of theDQA report.
9.6.1.2 The DQA Plan
If the assessment team was not part of the directed planning process, the team should familiarizeitself with the DQA plan and become clear on the procedures and criteria that are to be used forthe DQA Process. If the assessment team was part of the planning process, but sufficient time haselapsed since the conclusion of planning, the assessment team should review the DQA plan. Ifthe process is not clearly described in a DQA plan or does not appear to support the projectdecision, or if questions arise, it may be necessary to consult the project planning team or thecore group. If necessary, the DQA plan should be revised. If it cannot be, any deviations from itshould be recorded in the DQA report.
During DQA, it is important for the team, including the assessors and statistician, to be able tocommunicate accurately. Unfortunately, this communication can be complicated by the differentmeanings assigned to common words (e.g., samples, homogeneity). The assessment team shouldbe alert to these differences during their deliberations. The assessment team will need todetermine the usage intended by the planning team.
It is important to use a directed planning process to ensure that good communications exist fromplanning through data use. If the statistician and other experts are involved through the data lifecycle and commonly understood terms are employed, chances for success are increased.
9.6.1.3 Summary of the DQA Review
The review of project documents should result in:
� An identification and understanding of project plan documents, including any changes madeto them and any problems encountered with them;

Data Quality Assessment
9-9JULY 2004 MARLAP
� A clear understanding of the DQOs for the project. If a clear description of the DQOs does notexist, the assessment team should reach consensus on the DQOs prior to commencing theDQA and record the DQOs (as they were established for assessment) as part of the DQAreport; and
� A clear understanding of the terminology, procedures, and criteria for the DQA process.
9.6.2 Sample Representativeness
MARLAP does not provide specific guidance on developing sampling designs or a samplingplan. The following discussion of sampling issues during a review of the DQA process isincluded for purposes of completeness.
�Sampling� is the process of obtaining a portion of a population (i.e., the material of interest asdefined during the planning process) that can be used to characterize populations that are toolarge or complex to be evaluated in their entirety. The information gathered from the samples isused to make inferences whose validity reflects how closely the samples represent the propertiesand analyte concentrations of the population. �Representativeness� is the term employed for thedegree to which samples properly reflect their parent populations. A �representative sample,� asdefined in ASTM D6044, is �a sample collected in such a manner that it reflects one or morecharacteristics of interest (as defined by the project objectives) of a population from which it wascollected� (Figure 9.1). Samples collected in the field as a group and subsamples generated as agroup in the laboratory (Appendix F) should reflect the population physically and chemically. Aflaw in any portion of the sample collection or sample analysis design or their implementationcan impact the representativeness of the data and the correctness of associated decisions.Representativeness is a complex issue related to analyte of interest, geographic and temporalunits of concern, and project objectives.
The remainder of this subsection discusses the issues that should be considered in assessing therepresentativeness of the samples: the sampling plan (Section 9.6.2.1) and its implementation(Section 9.6.2.2). MARLAP recommends that all sampling design and statistical assumptions beidentified clearly in project plan documents along with the rationale for their use.
9.6.2.1 Review of the Sampling Plan
The sampling plan and its ability to generate representative samples are assessed in terms of theproject DQOs. The assessors review the project plan with a focus on the approach to samplecollection, including sample preservation, shipping and subsampling in the field and laboratory,and sampling standard operating procedures (SOPs). Ideally the assessors would have beeninvolved in the planning process and would be familiar with the DQOs and MQOs and thedecisions made during the selection of the sampling and analysis design. If the assessors werepart of the project planning team, this review to become familiar with the project plan will go
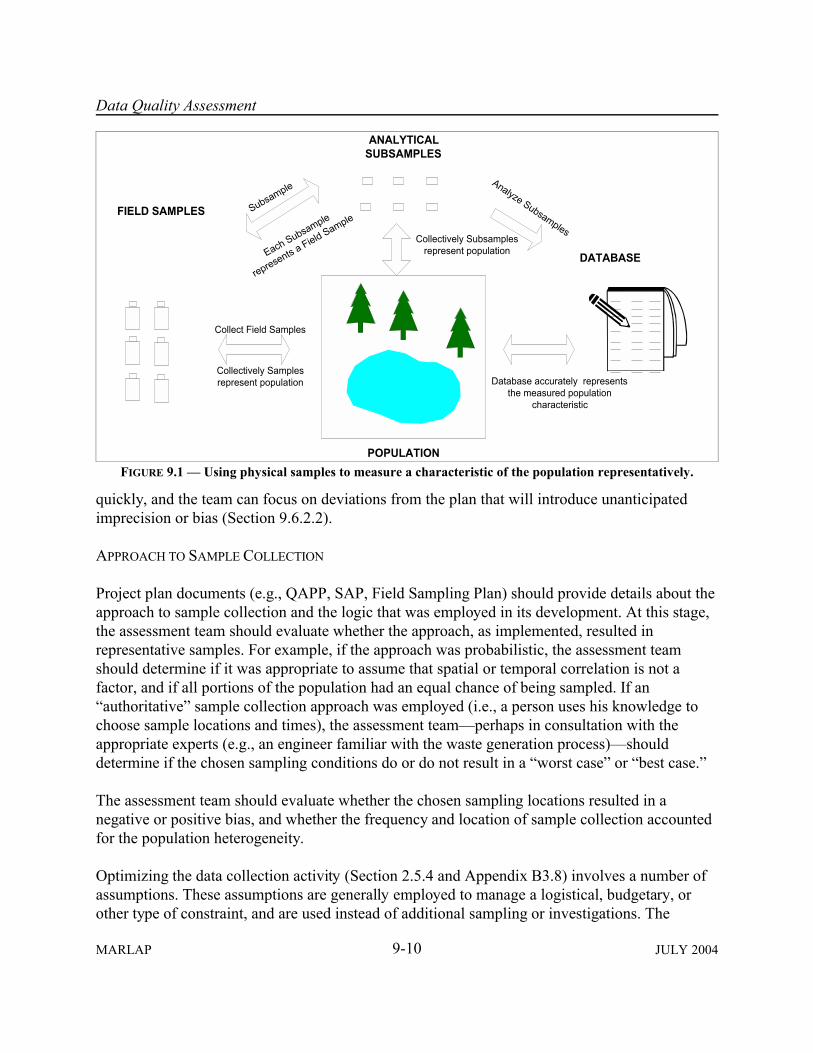
Data Quality Assessment
9-10MARLAP JULY 2004
POPULATION
FIELD SAMPLES
ANALYTICALSUBSAMPLES
DATABASE
Collect Field Samples
Collectively Samplesrepresent population
Subsample
Each Subsample
represents a Field Sample
Analyze Subsamples
Database accurately representsthe measured population
characteristic
Collectively Subsamplesrepresent population
FIGURE 9.1 � Using physical samples to measure a characteristic of the population representatively.
quickly, and the team can focus on deviations from the plan that will introduce unanticipatedimprecision or bias (Section 9.6.2.2).
APPROACH TO SAMPLE COLLECTION
Project plan documents (e.g., QAPP, SAP, Field Sampling Plan) should provide details about theapproach to sample collection and the logic that was employed in its development. At this stage,the assessment team should evaluate whether the approach, as implemented, resulted inrepresentative samples. For example, if the approach was probabilistic, the assessment teamshould determine if it was appropriate to assume that spatial or temporal correlation is not afactor, and if all portions of the population had an equal chance of being sampled. If an�authoritative� sample collection approach was employed (i.e., a person uses his knowledge tochoose sample locations and times), the assessment team�perhaps in consultation with theappropriate experts (e.g., an engineer familiar with the waste generation process)�shoulddetermine if the chosen sampling conditions do or do not result in a �worst case� or �best case.�
The assessment team should evaluate whether the chosen sampling locations resulted in anegative or positive bias, and whether the frequency and location of sample collection accountedfor the population heterogeneity.
Optimizing the data collection activity (Section 2.5.4 and Appendix B3.8) involves a number ofassumptions. These assumptions are generally employed to manage a logistical, budgetary, orother type of constraint, and are used instead of additional sampling or investigations. The

Data Quality Assessment
9-11JULY 2004 MARLAP
assessment team needs to understand these assumptions in order to fulfill its responsibility toreview and evaluate their continued validity based on the project�s implementation. Theassessment team should review the bases for the assumptions made by the planning team becausethey can result in biased samples and incorrect conclusions. For example, if samples are collectedfrom the perimeter of a lagoon to characterize the contents of the lagoon, the planning team�sassumption was that the waste at the lagoon perimeter has the same composition as that wastelocated in the less-accessible center of the lagoon. In this example, there should be information tosupport the assumption, such as historical data, indicating that the waste is relatively homogen-ous and well-mixed. Some assumptions will be stated clearly in project plan documents. Othersmay only come to light after a detailed review. The assessment team should review assumptionsfor their scientific soundness and potential impact on the representativeness of the samples.
Ideally, assumptions would be identified clearly in project plan documents, along with therationale for their use. Unfortunately, this is uncommon, and in some cases, the planners may beunaware of some of the implied assumptions associated with a design choice. The assessmentteam should document any such assumptions in the DQA report as potential limitations and, ifpossible, describe their associated ramifications. The assessment team may also suggestadditional investigations to verify the validity of assumptions which are questionable or key tothe project.
SAMPLING SOPS
Standard operating procedures for sampling should be assessed for their appropriateness andscientific soundness. The assessment team should assess whether the sampling equipment andtheir use, as described in the sampling procedures, were capable of extracting a representative setof samples from the material of interest. The team also should assess whether the equipment�scomposition was compatible with the analyte of interest. At this stage, the assessment teamassumes the sampling device was employed according to the appropriate SOP. Section 9.6.2.2discusses implementation and deviations from the protocols.
In summary, the assessment team should investigate whether:
� The sampling device was compatible with the material being sampled and with the analytes ofinterest;
� The sampling device accommodated all particle sizes and did not discriminate againstportions of the material being sampled;
� The sampling device avoided contamination or loss of sample components;
� The sampling device allowed access to all portions of the material of interest;

Data Quality Assessment
9-12MARLAP JULY 2004
� The sample handling, preparation, and preservation procedures maintained sample integrity;and
� The field and laboratory subsampling procedures resulted in a subsample that accuratelyrepresents the contents of the original sample.
These findings should be detailed in the DQA report.
9.6.2.2 Sampling Plan Implementation
The products of the planning phase are integrated project plan documents that define how theplanners intend the data collection process to be implemented. At this point in the DQA process,the assessment team determines whether sample collection was done according to the plan,reviews any noted deviations from the protocols, identifies any additional deviations, andevaluates the impact of these deviations on sample representativeness and the usability of thedata. The success of this review will be a function of the documentation requirements specifiedduring the planning process, and how thoroughly these requirements were met during samplecollection.
The determination as to whether the plans were implemented as written typically will be basedon a review of documentation generated during the implementation phase, through on-siteassessments, and during verification, if sampling activities (e.g., sample preservation) weresubjected to verification. In some instances, assessment team members may have firsthandknowledge from an audit that they performed, but in general the assessment team will have torely upon documentation generated by others. The assessment team will review field notes,sample forms, chain-of-custody forms, verification reports, audit reports, deviation reports,corrective action documentation, QA reports, and reports to management. The assessment teamalso may choose to interview field personnel to clarify issues or to account for missingdocumentation.
Due to the uncontrolled environments from which most samples are collected, the assessmentteam expects to find some deviations even from the best-prepared plans. Those not documentedin the project deficiency and deviation reports should be detailed in the DQA report. Theassessment team should evaluate these necessary deviations, as well as those deviations resultingfrom misunderstanding or error, and determine their impact on representativeness of the affectedsamples. These findings also should be detailed in the DQA report.
In summary, the assessment team will develop findings and determinations regarding anydeviations from the original plan, the rationale for the deviations, and if the deviations raisequestion of representativeness.

Data Quality Assessment
9-13JULY 2004 MARLAP
9.6.2.3 Data Considerations
Sample representativeness also can be evaluated in light of the resulting data. Favorablecomparisons of the data to existing data sets (especially those data sets collected by differentorganizations and by different methods) offer encouraging evidence of representativeness, butnot absolute confirmation of sample representativeness, since both data sets could suffer from thesame bias and imprecision. The project plan documents should have referenced any credible andapplicable existing data sets identified by the planning team. Comparisons to existing data setsmay offer mutual support for the accuracy of each other, and when differences result they tend toraise questions about both data sets. Quite often, the DQA assessors are looking for confirmatoryor conflicting information. How existing data sets are used during the DQA will be determinedby how much confidence the assessors place in them. If they are very confident in the accuracy ofexisting data sets, then they may classify the new data as unusable if it differs from the existingdata. If there is little confidence in the existing data set, then the assessors may just mention inthe DQA report that the new data set was in agreement or not in agreement. However, if theplanning team has determined that additional data were needed, they probably will not havesufficient confidence in the existing data set for purposes of decisionmaking.
Data comparability is an issue that could be addressed during validation to some degree,depending on the validation plan. However, at this point in the DQA, comparable data sets servea different purpose. For example, the MDCs, concentration units, and the analytical methods maybe the same and allow for data comparison in validation. However, the assessors during DQAwould look for similarities and dissimilarities in reported concentrations for different areas of thepopulations, and whether any differences might be an indication of a bias or imprecision thatmakes the samples less representative. Temporal and spatial plots of the data also may be helpfulin identifying portions of the sampled population that were over- or under-represented by the datacollection activity.
The planning process and development of probabilistic sampling plans typically requireassumptions regarding average concentrations and variances. If the actual average concentrationsand variances are different than anticipated, it is important for the assessment team to evaluatethe ramifications of these differences on sample representativeness. As reported values approachan action level, the greater the need for the sample collection activities to accurately represent thepopulation characteristics of interest.
During the evaluation of sample representativeness, as discussed in the previous subsections, theassessment team has the advantage of hindsight, since they review the sample collection designin light of project outcomes and can determine if the sample collection design could have beenoptimized differently to better achieve project objectives. Findings regarding the representative-ness of samples and how sampling can be optimized should be expeditiously passed to projectmanagers if additional sampling will be performed.
Data Quality Assessment
9-14MARLAP JULY 2004
In summary, results of the evaluation of the sample representativeness are:
� An identification of any assumptions that present limitations and, if possible, a description oftheir associated ramifications;
� A determination of whether the design resulted in a representative sampling of the populationof interest;
� A determination of whether the specified sampling locations, or alternate locations asreported, introduced bias;
� A determination of whether the sampling equipment used, as described in the samplingprocedures or as implemented, was capable of extracting a representative set of samples fromthe material of interest; and
� An evaluation of the necessary deviations from the plan, as well as those deviations resultingfrom misunderstanding or error, and a determination of their impact on the representativenessof the affected samples.
The product of this step is a set of findings regarding the impact of representativeness�or thelack thereof�that affects data usability. Findings and determinations regarding representative-ness will impact the usability of the resulting data to varying degrees. Some findings may be sosignificant (e.g., the wrong waste stream was sampled) that the samples can be determined to benon-representative and the associated data cannot be used; as a result, the DQA need not progressany further. Typically, findings will be subject to interpretation, and the impacts on representa-tiveness will have to be evaluated in light of other DQA findings to determine the usability ofdata.
9.6.3 Data Accuracy
The next step in the DQA process is the evaluation of the analysis process and accuracy of theresulting data. The term �accuracy� describes the closeness of the result of a measurement to thetrue value of the quantity being measured. The accuracy of results may be affected by bothimprecision and bias in the measurement process, and by blunders and loss of statistical control(see Chapter 19, Measurement Uncertainty).
Since MARLAP uses �accuracy� only as a qualitative concept, in accordance with theInternational Vocabulary of Basic and General Terms in Metrology (ISO, 1993), the agreementbetween measured results and true values is evaluated quantitatively in terms of the �precision�and �bias� of the measurement process. �Precision� usually is expressed as a standard deviation,which measures the dispersion of results about their mean. �Bias� is a persistent deviation ofresults from the true value (see Section 6.5.5.7, �Bias Considerations�).
Data Quality Assessment
9-15JULY 2004 MARLAP
During the directed planning process, the project planning team should have made an attempt toidentify and control sources of imprecision and bias (Appendix B3.8). During DQA, theassessment team should evaluate the degree of precision and bias and determine its impact ondata usability. Quality control samples are analyzed for the purpose of assessing precision andbias. Laboratory spiked samples and method blanks typically are used to assess bias, andduplicates are used to assess precision. Since a single measurement of a spike or blank principlecannot distinguish between imprecision and bias, a reliable estimate of bias requires a data setthat includes many such measurements. Control charts of quality control (QC) data, such as fieldduplicates, matrix spikes, and laboratory control samples are graphical representations andprimary tools for monitoring the control of sampling and analytical methods and identifyingprecision and bias trends (Chapter 18, Laboratory Quality Control).
Bias can be identified and controlled through the application of quantitative MQOs to QCsamples, such as blanks, standard reference materials, performance testing samples, calibrationcheck standards, and spikes samples. Blunders (e.g., a method being implemented incorrectly,such as reagents being added in the incorrect order) are usually identified and controlled by well-designed plans that specify quality assurance systems that detail needed training, use ofappropriate SOPs, deficiency reporting systems, assessments, and quality improvementprocesses.
Bias in a data set may be produced by measurement errors that occur in steps of the measurementprocess that are not repeated. Imprecision may be produced by errors that occur in steps that arerepeated many times. The distinction between bias and imprecision is complicated by the factthat some steps, such as instrument calibration and tracer preparation and standardization, arerepeated at varying frequencies. For this reason, the same source of measurement error mayproduce an apparent bias in a small data set and apparent imprecision in a larger data set. Duringdata assessment, an operational definition of bias is needed. This would normally be determinedby the data assessment specialist(s) on the project planning team during the directed planningprocess. For example, a bias may exist if results for analytical spikes (i.e., laboratory controlsamples, matrix spike, matrix spike duplicate), calibration checks, and performance evaluationsamples associated with the data set are mostly low or mostly high, if the results of method blankanalyses tend to be positive or negative, or if audits uncover certain types of biased implementa-tion of the SOPs. At times, the imprecision of small data sets can incorrectly indicate a bias,while at other times, the presence of bias may be masked by imprecision. For example, two orthree samples may be all high or all low by chance, and may be a result of imprecision rather thanbias. On the other hand, it is unlikely that ten samples would all be high or low, and such anoccurrence would be indicative of bias. Statistical methods can be applied to imprecise data setsand used to determine if there are statistically significant differences between data sets orbetween a data set and an established value. If the true value or reference value (e.g., verifiedconcentration for a standard reference material) is known, then statistics can be used to determinewhether there is a bias.
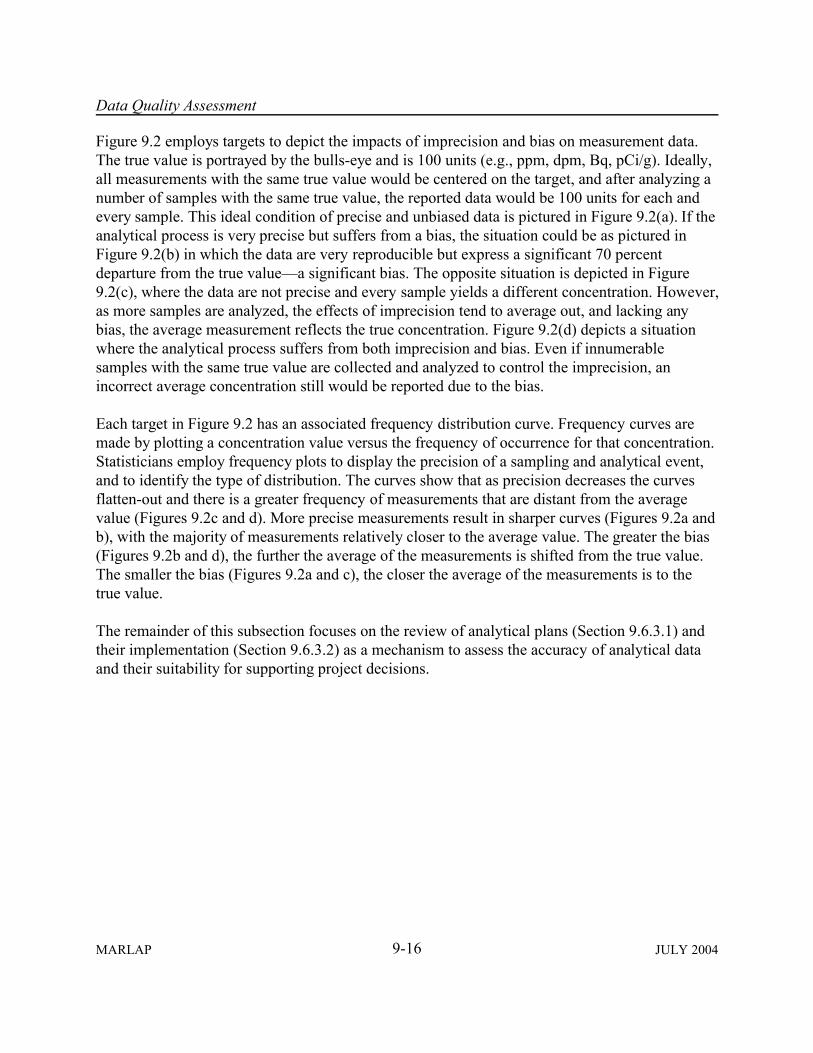
Data Quality Assessment
9-16MARLAP JULY 2004
Figure 9.2 employs targets to depict the impacts of imprecision and bias on measurement data.The true value is portrayed by the bulls-eye and is 100 units (e.g., ppm, dpm, Bq, pCi/g). Ideally,all measurements with the same true value would be centered on the target, and after analyzing anumber of samples with the same true value, the reported data would be 100 units for each andevery sample. This ideal condition of precise and unbiased data is pictured in Figure 9.2(a). If theanalytical process is very precise but suffers from a bias, the situation could be as pictured inFigure 9.2(b) in which the data are very reproducible but express a significant 70 percentdeparture from the true value�a significant bias. The opposite situation is depicted in Figure9.2(c), where the data are not precise and every sample yields a different concentration. However,as more samples are analyzed, the effects of imprecision tend to average out, and lacking anybias, the average measurement reflects the true concentration. Figure 9.2(d) depicts a situationwhere the analytical process suffers from both imprecision and bias. Even if innumerablesamples with the same true value are collected and analyzed to control the imprecision, anincorrect average concentration still would be reported due to the bias.
Each target in Figure 9.2 has an associated frequency distribution curve. Frequency curves aremade by plotting a concentration value versus the frequency of occurrence for that concentration.Statisticians employ frequency plots to display the precision of a sampling and analytical event,and to identify the type of distribution. The curves show that as precision decreases the curvesflatten-out and there is a greater frequency of measurements that are distant from the averagevalue (Figures 9.2c and d). More precise measurements result in sharper curves (Figures 9.2a andb), with the majority of measurements relatively closer to the average value. The greater the bias(Figures 9.2b and d), the further the average of the measurements is shifted from the true value.The smaller the bias (Figures 9.2a and c), the closer the average of the measurements is to thetrue value.
The remainder of this subsection focuses on the review of analytical plans (Section 9.6.3.1) andtheir implementation (Section 9.6.3.2) as a mechanism to assess the accuracy of analytical dataand their suitability for supporting project decisions.
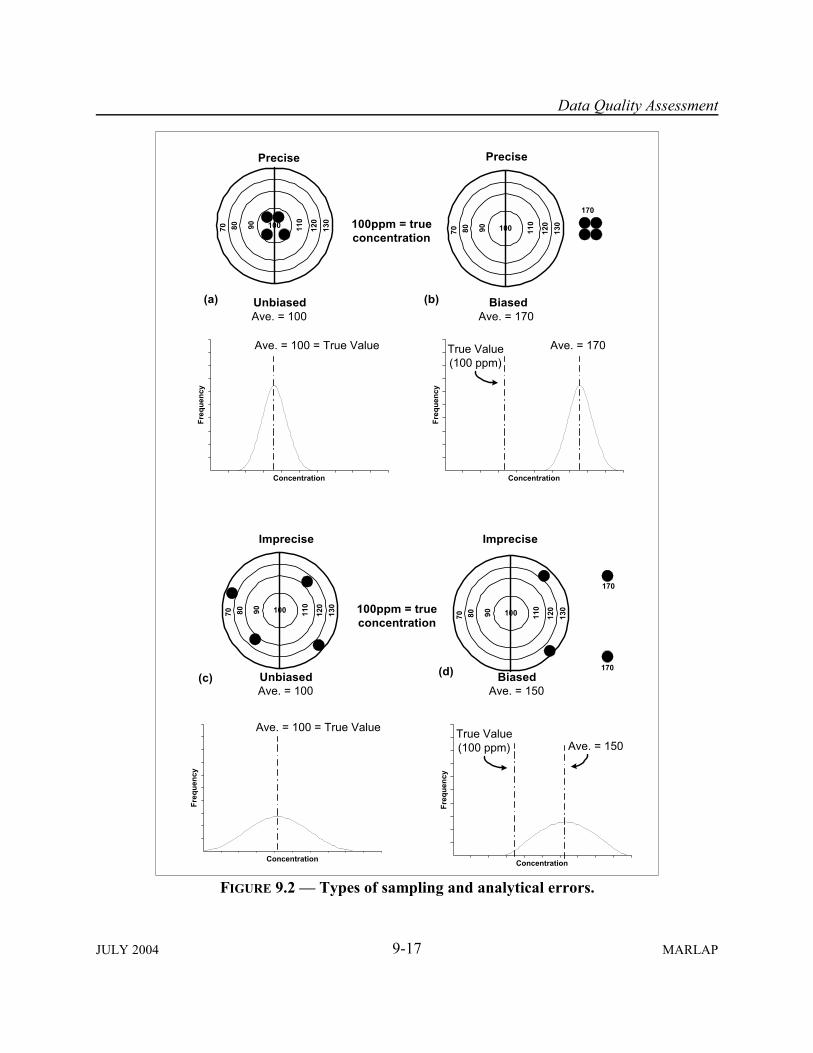
Data Quality Assessment
9-17JULY 2004 MARLAP
10090 110
120
130
8070 10090 110
120
130
8070
100ppm = trueconcentration
Precise
UnbiasedAve. = 100
Precise
BiasedAve. = 170
170Fr
eque
ncy
Concentration
Ave. = 100 = True Value
Freq
uenc
y
Concentration
Ave. = 170True Value(100 ppm)
(a) (b)
10090 110
120
130
8070 10090 110
120
130
8070
100ppm = trueconcentration
Imprecise
UnbiasedAve. = 100
Imprecise
BiasedAve. = 150
170
170
Freq
uenc
y
Concentration
Ave. = 100 = True Value
Freq
uenc
y
Concentration
Ave. = 150True Value(100 ppm)
(c) (d)
FIGURE 9.2 � Types of sampling and analytical errors.

Data Quality Assessment
9-18MARLAP JULY 2004
9.6.3.1 Review of the Analytical Plan
The analytical plan is that portion of the project plan documentation (e.g., in QAPP or SAP) thataddresses the optimized analytical design and other analytical issues (e.g., analytical protocolspecifications, SOPs). Its ability to generate accurate data is assessed in terms of the projectDQOs. The assessment team will refer to the DQOs and the associated MQOs as they review theanalytical protocol specifications to understand how the planning team selected methods anddeveloped the analytical plan. If the assessors were part of the project planning team, this reviewprocess will go quickly and the team can focus on deviations from the plan that will introduceunanticipated imprecision or bias. (The term �analytical plan� is not meant to indicate a separatedocument.)
REVIEW OF THE MQOS, ANALYTICAL PROTOCOL SPECIFICATIONS, AND OPTIMIZED ANALYTICALDESIGN
The assessment team�s review of the analytical plan first should focus on the analytical protocolspecifications, including the MQOs, which were established by the project planning team(Chapter 3). The team should understand how the analytical protocol specifications were used todevelop the SOW (Chapter 5) and select the radioanalytical methods (Chapter 6). If the projectand contractual documentation are silent or inadequate on how they address these key issues, theassessment team may be forced to review the analytical results in terms of the project DQOs anddetermine if the data quality achieved was sufficient to meet the project�s objectives.
As with the approach to sample collection, optimizing the analytical activity involved a numberof assumptions. Assumptions were made when analytical issues were resolved during planningand the decisions were documented in the analytical protocol specifications (Chapter 3). It isimportant for the assessment team to be aware of these assumptions because they can result inbiases and incorrect conclusions. Some assumptions will be clearly stated in the project plandocuments. Others may only come to light after a detailed review. The assessment team shouldreview assumptions for their scientific soundness and potential impact on the data results.
Ideally, assumptions would be identified clearly in project plan documents, along with therationale for their use. Unfortunately, this is uncommon, and in some cases, the planners may beunaware of some of the implied assumptions associated with a design choice. The assessmentteam should document any such assumptions in the DQA report as potential limitations and, ifpossible, describe their associated ramifications. The assessment team may also suggestadditional investigations to verify the validity of assumptions which are questionable or key tothe project.

Data Quality Assessment
9-19JULY 2004 MARLAP
REVIEW OF THE ANALYTICAL PROTOCOLS
The analytical plan and the associated analytical protocols will be reviewed and assessed for theirscientific soundness, applicability to the sample matrix and the ability to generate precise andunbiased data. The analytical protocols review should consider the entire analytical process, fromsample preparation through dissolution and separations, counting, data reduction, and reporting.MARLAP, whose focus is on the analytical process, defines �analytical process� as includingsample handling in the field (e.g., filtration, sample preservation) to ensure that all activities thatcould impact analyses would be considered. The assessment team should consider both samplingand analytical processes in assessing data quality�and such field activities as sample preserva-tion�along with other issues that can affect representativeness (Section 9.6.2). The assessmentteam also should review the contract evaluation (under the performance-based approach) for theselection of the analytical protocols to assure that the documentation showed that the protocolcould meet the analytical protocol specifications (which defines the MQOs).
Since the review of the analytical protocols will be performed with the advantage of hindsightgained from the data verification and data validation reports, the assessment team also shouldattempt to identify any flaws in the analytical protocols that may have resulted in noncompliancewith MQOs. The identification of these flaws is essential if future analyses will be required.
REVIEW OF VERIFICATION AND VALIDATION PLANS
To understand how the verification and validations processes were implemented and the degreeto which the assessors can rely upon their findings, the assessors should familiarize themselveswith the verification and validation plans that were developed during the planning phase. Areview of these plans will indicate the thoroughness of the evaluations and whether the issuesdeemed important to the assessors were evaluated.
9.6.3.2 Analytical Plan Implementation
After reviewing the analytical plan, the assessment team should assess whether sample analyseswere implemented according to the analysis plan. Typically, the first two steps of the assessmentphase�data verification and data validation�have laid most of the groundwork for thisdetermination. However, the issue of whether the plan was implemented as designed needs to bereviewed one final time during the DQA process. This final review is needed since new andpertinent information may have been uncovered during the first steps of the DQA process.
The goal of this assessment of the analytical process with respect to the associated MQOs is toconfirm that the selected method was appropriate for the intended application and to identify anypotential sources of inaccuracy, such as:

Data Quality Assessment
9-20MARLAP JULY 2004
� Laboratory subsampling procedures that resulted in the subsample that may not accuratelyrepresent the content of the original sample;
� Sample dissolution methods that may not have dissolved sample components quantitatively;
� Separation methods whose partitioning coefficients were not applicable to the sample matrix;
� Unanticipated self-absorption that biased test-source measurements;
� Non-selective detection systems that did not resolve interferences; or
� Data reduction routines that lacked needed resolution or appropriate interference corrections.
The success of the assessment of the analytical plan implementation will be a function of thedocumentation requirements specified during the planning process, and how thoroughly theserequirements were met during sample analysis. In some instances, assessment team membersmay have firsthand knowledge from an audit that they performed, but in general the assessmentteam will have to rely upon documentation generated by others.
In addition to verification and validation reports, the assessment team will review pertinentdocuments such as: laboratory notebooks, instrument logs, quality control charts, internalsample-tracking documentation, audit reports, deviation reports, corrective action documentation,performance evaluation sample reports, QA reports, and reports to management provided forverification and validation. To clarify issues or to account for missing documentation, theassessment team may choose to interview laboratory personnel.
Verification and validation reports will be used to identify nonconformance, deviations, andproblems that occurred during the implementation of the analytical plan. The challenge duringDQA is to evaluate the impact of nonconformance, deviations, problems, and qualified data onthe usability of the overall data set and the ability of the data set to support the decision.
Deviations from the plan will be encountered commonly and the assessment team will evaluatethe impact of these deviations upon the accuracy of the analytical data. The deviations and theassessment team�s related findings should be detailed in the data quality assessment report.
The prior verification and validation processes and the prior DQA steps involving the evaluationof sampling are all an attempt to define the quality of data by (1) discovering sources of bias,quantifying their impact, and correcting the reported data; and (2) identifying and quantifyingdata precision. The products of this step are a set of findings regarding the analytical process andtheir impact on data usability. Some findings may be so significant (e.g., the wrong analyticalmethod was employed) that the associated data cannot be used, and as a result, the DQA need notprogress any further. Typically, findings will be subject to interpretation and a final
Data Quality Assessment
9-21JULY 2004 MARLAP
determination as to the impacts will have to wait until the data has been subjected to evaluationsdescribed in Section 9.6.4.
After reviewing the verification and validation reports, the outputs of the analytical dataevaluation are:
� A determination of whether the selected analytical protocols and analytical performancespecifications were appropriate for the intended application;
� An identification of any potential sources of inaccuracy; and
� A determination of whether sample analyses were implemented according to the analysis planand the overall impact of any deviations on the usability of the data set.
9.6.4 Decisions and Tolerable Error Rates
A goal of DQA is to avoid making a decision based on inaccurate data generated by analyticalprotocols found to be out of control or on data generated from samples found to be nonrepresen-tative, and to avoid making decisions based on data of unknown quality. Preferably, a decisionshould be made with data of known quality (i.e., with data of known accuracy from samples ofknown representativeness) and within the degree of confidence specified during the planningphase.
This section focuses on the final determination by the assessment team, who uses the informationtaken from the previous assessment processes and statistics to make a final determination ofwhether the data are suitable for decision-making, estimating, or answering questions within thelevels of certainty specified during planning.
9.6.4.1 Statistical Evaluation of Data
Statistics are used for the collection, presentation, analysis, and interpretation of data. The twomajor branches of statistics, �descriptive statistics� and �inferential statistics,� are applicable todata collection activities. �Descriptive statistics� are those methods that describe populations ofdata. For example, descriptive statistics include the mean, mode, median, variance, andcorrelations between variables, tables, and graphs to describe a set of data. �Inferential statistics�use data taken from population samples to make estimates about the whole population(�inferential estimations�) and to make decisions (�hypothesis testing�). Descriptive statistics isan important tool for managing and investigating data in order that their implications andsignificance to the project goals can be understood.
Sampling and inferential statistics have identical goals�to use samples to make inferences abouta population of interest and to use sample data to make defensible decisions. This similarity is

Data Quality Assessment
9-22MARLAP JULY 2004
the reason why planning processes, such as those described in Chapter 2, couple samplecollection activities with statistical techniques to maximize the representativeness of samples, theaccuracy of data, and the certainty of decisions.
Due to the complexity of some population distributions (Attachment 19A) and the complexmathematics needed to treat these distributions and associated data, it is often best to consultwith someone familiar with statistics to ensure that statistical issues have been addressedproperly. However, it is critical for the non-statistician to realize that statistics has its limitations.The following statistical limitations should be considered when assessment teams and the projectplanning team are planning the assessment phase and making decisions:
� Statistics are used to measure precision and, when true or reference values are known,statistics can be applied to imprecise data to determine if a bias exists. Statistics do notaddress all types of sampling or measurement bias directly.
� If the characteristic of interest in a sample is more similar to that of samples adjacent to it thanto samples that are further removed, the samples are deemed to be �correlated� and are notindependent of each other (i.e., there is a serial correlation such that samples collected close intime or space have more similar concentrations than those samples further removed).Conventional parametric and non-parametric statistics require that samples be independentand are not applicable to populations that have significantly correlated concentrations.
The statistical tests typically are chosen during the directed planning process and are documentedin the project plan documents (e.g., DQA plan, QAPP). However, there are occasions when theconditions encountered during the implementation phase are different than anticipated (e.g., datawere collected without thorough planning, or data are being subjected to an unanticipatedsecondary data use). Under these latter conditions, the statistical tests will be chosen followingdata collection.
The statistical analysis of data consists of a number of steps. The following outline of these stepsis typical of the analyses that a statistician would implement in support of a data qualityassessment.
CALCULATE THE BASIC STATISTICAL PARAMETERS
Statistical �parameters� are fundamental quantities that are used to describe the central tendencyor dispersion of the data being assessed. The mean, median, and mode are examples of statisticalparameters that are used to describe the central tendency, while range, variance, standarddeviation, coefficient of variation, and percentiles are statistical parameters used to describe thedispersion of the data. These basic parameters are used because they offer a means of under-standing the data, facilitating communication and data evaluation, and generally are necessary forsubsequent statistical tests.

Data Quality Assessment
9-23JULY 2004 MARLAP
GRAPHICAL REPRESENTATIONS
Graphical representations of the data are similar to basic statistical parameters in that they are ameans of describing and evaluating data sets. Graphical representations of QC-sample resultsused to evaluate project-specific control limits and warning limits derived from the MQO criteriaare discussed in Appendix C. Graphical representations of field data over space or time have theadditional ability of offering insights, such as identifying temporal and spatial patterns, trends,and correlations. Graphical depictions are also an excellent means of communicating andarchiving information.
REVIEW AND VERIFY TEST ASSUMPTIONS
Statistical tests are the mathematical structure that will be employed to evaluate the project�s datain terms of the project decision, question, or parameter estimate. Statistical tests are notuniversally applicable, and their choice and suitability are based on certain assumptions. Forexample:
� Some tests are suitable for �normal� distributions, while others are designed for other types ofdistributions.
� Some tests assume that the data are random and independent of each other.
� Assumptions that underlie tests for �outliers� should be understood to ensure that hot spots orthe high concentrations symptomatic of skewed distributions (e.g., lognormal) are notincorrectly censored.
� Assumptions are made regarding the types of population distributions whenever data aretransformed before being subjected to a test.
� Assumptions of test robustness need to be reviewed in light of the analyte. For example,radiological data require statistical tests that can accommodate positive and negative numbers.
It is important that a knowledgeable person identify all assumptions that underlie the chosenstatistical tests, and that the data are tested to ensure that the assumptions are met. If any of theassumptions made during planning proved to be not true, the assessment team should evaluatethe appropriateness of the selected statistical tests. Any decision to change statistical tests shouldbe documented in the DQA report.
APPLYING STATISTICAL TESTS
The chosen statistical tests will be a function of the data properties, statistical parameter ofinterest, and the specifics of the decision or question. For example, choice of the appropriate tests

Data Quality Assessment
9-24MARLAP JULY 2004
will vary according to whether the data are continuous or discrete; whether the tests will besingle-tailed or double-tailed, whether a population is being compared to a standard or to asecond population, or whether stratified sampling or simple random sampling was employed.Once the statistical tests are deemed appropriate, they should be applied to the data by anassessor who is familiar with statistics. The outputs from applying the statistical tests andcomparisons to project DQOs are discussed in the following section. Appropriate statistical testsand guidance on their use are available from many sources, including EPA (2000b).
9.6.4.2 Evaluation of Decision Error Rates
The heterogeneity of the material being sampled and the imprecision of the sampling andanalytical processes generate uncertainty in the reported data and in the associated decisions andanswers. The project planning team, having acknowledging this decision uncertainty, will havechosen �tolerable decision errors rates� during the planning process, which balanced resourcecosts against the risk of making a wrong decision or arriving at a wrong answer. During this finalstep of DQA process, the assessment team will use the project�s tolerable levels of decision errorrates as a metric of success.
The DQA process typically corrects data for known biases and then subjects the data to theappropriate statistical tests to make a decision, answer a question, or supply an estimate of aparameter. The assessment team will compare statistical parameters�such as the sample meanand sample variance estimates employed during the planning process�to those that wereactually obtained from sampling. If the distribution was different, if the mean is closer to theaction level, or if the variance is greater or less than estimated, one or all of these factors couldhave an impact on the certainty of the decision. The assessment team also will review the resultsof the statistical tests in light of missing data, outliers, and rejected data. The results of thestatistical tests are then evaluated in terms of the project�s acceptable decision error rates. Theassessment team determines whether a decision could or could not be made, or why the decisioncould not be made, within the project specified decision error rates.
In summary, outputs from this step are:
� Generated statistical parameters;
� Graphical representations of the data set and parameters of interest;
� If new tests were selected, the rationale for selection and the reason for the inappropriatenessof the statistical tests selected in the DQA plan;
� Results of application of the statistical tests; and

Data Quality Assessment
9-25JULY 2004 MARLAP
� A final determination as to whether the data are suitable for decisionmaking, estimating, oranswering questions within the levels of certainty specified during planning.
9.7 Data Quality Assessment Report
The DQA process concludes with the assessment team documenting the output of the statisticaltests and the rationale for why a decision could or could not be made, or why the decision couldnot be made within the project specified decision error rates. The DQA report will documentfindings and recommendations and include or reference the supporting data and information. TheDQA report will summarize the use of the data verification and data validation reports for datasets of concern, especially if rejected for usability in the project�s decisionmaking. The reportalso will document the answers to the three DQA questions:
� Are the samples representative? � Are the data accurate? � Can a decision be made?
Although there is little available guidance on the format for a DQA report, the report shouldcontain, at a minimum:
� An executive summary that briefly answers the three DQA questions and highlights majorissues, recommendations, deviations, and needed corrective actions;
� A summary of the project DQOs used to assess data usability, as well as pertinentdocumentation such as the project plan document, contracts, and SOW;
� A listing of those people who performed the DQA;
� A summary description of the DQA process, as employed, with a discussion of any deviationsfrom the DQA plan designed during the planning process (the DQA plan should be appendedto the report);
� A summary of the data verification and data validation reports that highlights significantfindings and a discussion of their impact on data usability (the data verification and datavalidation reports should be appended to the DQA report);
� A discussion of any missing documentation or information and the impact of their absence onthe DQA process and the usability of the data;

Data Quality Assessment
9-26MARLAP JULY 2004
� A thorough discussion of the three DQA questions addressing the details considered inSections 9.6.2 through 9.6.4 (possible outputs to be incorporated in the report are listed at theconclusion of each these section);
� A discussion of deviations, sampling, analytical and data management problems, concerns,action items, and suggested corrective actions (the contents of this section should behighlighted in the executive summary if the project is ongoing and corrections or changes areneeded to improve the quality and usability of future data); and
� A recommendation or decision on the usability of the data set for the project�s decision-making.
Upon completion, the DQA report should be distributed to the appropriate personnel as specifiedin the DQA plan and archived along with supporting information for the period of time specifiedin the project plan document. Completion of the DQA report concludes the assessment phase andbrings the data life cycle to closure.
9.8 Summary of Recommendations
� MARLAP recommends that the assessment phase of a project (verification, validation, andDQA processes) be designed during the directed planning process and documented in therespective plans as part of the project plan documents.
� MARLAP recommends that project objectives, implementation activities, and QA/QC data bewell documented in project plans, reports, and records, since the success of the assessmentphase is highly dependent upon the availability of such information.
� MARLAP recommends the involvement of the data assessment specialist(s) on the projectplanning team during the directed planning process.
� MARLAP recommends that the DQA process should be designed during the directed planningprocess and documented in a DQA plan.
� MARLAP recommends that all sampling design and statistical assumptions be clearlyidentified in project plan documents along with the rationale for their use.
Data Quality Assessment
9-27JULY 2004 MARLAP
9.9 References
9.9.1 Cited Sources
American Society for Testing and Materials (ASTM) D6044. Guide for Representative Samplingand Management of Waste and Contaminated Media. 1996.
American Society for Testing and Materials (ASTM) D6233. Standard Guide for DataAssessment for Environmental Waste Management Activities. 1998.
U.S. Environmental Protection Agency (EPA). 2000a. Guidance for the Data Quality ObjectiveProcess (EPA QA/G-4). EPA/600/R-96/055, Washington, DC. Available from www.epa.gov/quality/qa_docs.html.
U.S. Environmental Protection Agency (EPA). 2000b. Guidance for Data Quality Assessment:Practical Methods for Data Analysis (EPA QA/G-9). EPA/600/R-96/084, Washington, DC.Available from www.epa.gov/quality/qa_docs.html.
International Organization for Standardization (ISO). 1993. International Vocabulary of Basicand General Terms in Metrology. ISO, Geneva, Switzerland.
MARSSIM. 2000. Multi-Agency Radiation Survey and Site Investigation Manual, Revision 1.NUREG-1575 Rev 1, EPA 402-R-97-016 Rev1, DOE/EH-0624 Rev1. August. Availablefrom www.epa.gov/radiation/marssim/.
U.S. Army Corps of Engineers (USACE). 1998. Technical Project Planning (TPP) Process.Engineer Manual EM-200-1-2.
U.S. Nuclear Regulatory Commission (NRC). 1998. A Nonparametric Statistical Methodologyfor the Design and Analysis of Final Status Decommissioning Surveys. NUREG 1505, Rev. 1.
9.9.2 Other Sources
American Society for Testing and Materials (ASTM). 1997. Standards on EnvironmentalSampling, 2nd Edition, PCN 03-418097-38. West Conshohocken, PA.
American Society for Testing and Materials (ASTM) D5956. Standard Guide for SamplingStrategies for Heterogeneous Wastes. 1996.

Data Quality Assessment
9-28MARLAP JULY 2004
American Society for Testing and Materials (ASTM) D6051. Guide for Composite Sampling andField Subsampling for Environmental Waste Management Activities. 1996.
American Society for Testing and Materials (ASTM) D6311. Standard Guide for Generation ofEnvironmental Data Related to Waste Management Activities: Selection and Optimization ofSampling Design.1998.
American Society for Testing and Materials (ASTM) D6323. Standard Guide for LaboratorySubsampling of Media Related to Waste Management Activities. 1998.
U. S. Environmental Protection Agency (EPA). 2002. Guidance for Quality Assurance ProjectPlans. EPA QA/G-5. EPA/240/R-02/009. Office of Environmental Information, Washington,DC. Available at www.epa.gov/quality/qa_docs.html.
Taylor, J. K. 1990. Quality Assurance of Chemical Measurements. Lewis, Chelsea, Michigan.

A-1JULY 2004 MARLAP
APPENDIX ADIRECTED PLANNING APPROACHES
A.1 Introduction
There are a number of approaches being used for directed planning of environmental operations.Some of these approaches were designed specifically for data collection activities; others areapplications of more general planning philosophies. Many variations to these approaches havebeen made for specific applications. The following are some of the approaches being used:
� Data Quality Objectives (DQO); � Observational Approach (OA); � Streamlined Approach for Environmental Restoration (SAFER); � Technical Project Planning (TPP); � Expedited Site Characterization (ESC); � Value Engineering; � Systems Engineering; � Total Quality Management (TQM); and � Partnering.
Employing any of these approaches assures that sufficient planning is carried out to define aproblem adequately, determine its importance, and develop an approach to solutions prior tospending resources.
This appendix discusses some elements that are common to direct planning processes(Section A.2) and provides in Sections A.3 through A.11 very brief descriptions of the planningapproaches listed above. References are listed at the end of the appendix on each of theapproaches to provide sources of more detailedinformation.
Several directed planning approaches havebeen implemented by the federal sector forenvironmental data collection activities.Project planners should be aware of agencyrequirements for planning. MARLAP does notendorse any one planning approach. Users ofMARLAP are encouraged to consider all theavailable approaches and choose a directedplanning process that is appropriate to theirproject and agency.
Contents
A.1 Introduction . . . . . . . . . . . . . . . . . . . . . . . . . . A-1A.2 Elements Common to Directed Planning
Approaches . . . . . . . . . . . . . . . . . . . . . . . . . . A-2A.3 Data Quality Objectives Process . . . . . . . . . A-2A.4 Observational Approach . . . . . . . . . . . . . . . . A-3A.5 Streamlined Approach for Environmental
Restoration . . . . . . . . . . . . . . . . . . . . . . . . . . A-4A.6 Technical Project Planning . . . . . . . . . . . . . . A-4A.7 Expedited Site Characterization . . . . . . . . . . A-4A.8 Value Engineering . . . . . . . . . . . . . . . . . . . . . A-5A.9 Systems Engineering . . . . . . . . . . . . . . . . . . . A-6A.10 Total Quality Management . . . . . . . . . . . . . . A-6A.11 Partnering . . . . . . . . . . . . . . . . . . . . . . . . . . . A-7A.12 References . . . . . . . . . . . . . . . . . . . . . . . . . . . A-7

Directed Planning Approaches
A-2MARLAP JULY 2004
A.2 Elements Common to Directed Planning Approaches
To achieve the benefits desired from directed planning, all of these approaches address thefollowing essential elements:
1. Defining the problem or need: Identifying the problem(s) facing the stakeholder/customerthat requires attention, or the concern that requires streamlining.
2. Establishing the optimum result: Defining the decision, response, product, or result thatwill address the problem or concern and satisfy the stakeholder/customer.
3. Defining the strategy and determining the quality of the solution: Laying out a decisionrule or framework, roadmap, or wiring diagram to get from the problem or concern to thedesired decision or product and defining the quality of the decision, response, product, orresult that will be acceptable to the stakeholder/customer by establishing specific,quantitative, and qualitative performance measures (e.g., acceptable error in decisions,defects in product, false positive responses).
4. Optimizing the design: Determining what is the optimum, cost-effective way to reach thedecision or create the product while satisfying the desired quality of the decision orproduct.
To most problem solvers, these four elements stem from the basic tenets of the scientific method,which Webster�s defines as �principles and procedures for the systematic pursuit of knowledgeinvolving the recognition and formulation of a problem, the collection of data throughobservation and experiment, and the formulation and testing of hypotheses.�
Each approach requires that a team of customers, stakeholders, and decision makers defines theproblem or concern; a team of technical staff or line operators have the specific knowledge andexpertise to define and then provide the desired product; and both groups work together tounderstand each other�s needs and requirements and to agree on the product to be produced. Theapproaches represent slightly different creative efforts in the problem-solving process. All areintended to facilitate the achievement of optimum results at the lowest cost, generally using teamwork and effective communication to succeed.
A.3 Data Quality Objectives Process
The Data Quality Objectives (DQO) process was created by the U. S. Environmental ProtectionAgency to promote effective communications between decisionmakers, technical staff, andstakeholders on defining and planning the remediation of environmental problems.

Directed Planning Approaches
A-3JULY 2004 MARLAP
The DQO process consists of seven basic steps:
1. State the problem;2. Identify the decision;3. Identify inputs to the decision;4. Define the study boundaries;5. Develop a decision rule;6. Specify limits on decision errors; and7. Optimize the design.
Applying the DQO steps requires effective communication between the parties who have theproblem and the parties who must provide the solution. Additional information about the DQOProcess is provided in Appendix B.
A.4 Observational Approach
The Observational Approach (OA) emphasizes determining what to do next by evaluatingexisting information and iterating between collecting new data and taking further action. Thename �observational approach� is derived from observing parameters during implementation.OA was developed by Karl Terzaghi (Peck, 1969) for geological applications. In miningoperations, there may be substantial uncertainty in the location of valuable geological formations.Information on soil and mineral composition would help to identify such formations. Applicationof OA utilizes the sampling information on soil and mineral composition to direct the digginglocations. OA should be encouraged in situations where uncertainty is large, the vision of what isexpected or required is poor, and the cost of obtaining more certainty is very high.
The philosophy of OA when applied to waste site remediation is that remedial action can beinitiated without fully characterizing the nature and extent of contamination. The approachprovides a logical decision framework through which planning, design, and implementation ofremedial actions can proceed with increased confidence. OA incorporates the concepts of datasufficiency, identification of reasonable deviations, preparation of contingency plans, observationof the systems for deviations, and implementation of the contingency plans. Determinations ofperformance measures and the quality of new data are done as the steps are implemented.
The iterative steps of site characterization, developing and refining a site conceptual model, andidentifying uncertainties in the conceptual model are similar to traditional approaches. Theconcept of addressing uncertainties as reasonable deviations is unique to OA and offers aqualitative description of data sufficiency for proceeding with site remediation.

Directed Planning Approaches
A-4MARLAP JULY 2004
A.5 Streamlined Approach for Environmental Restoration
The Streamlined Approach for Environmental Restoration (SAFER) is an integration of the DQOprocess and OA developed by the U. S. Department of Energy (DOE). The planning andassessment steps of SAFER are the DQO process. The implementation steps of SAFER are theObservational Approach. The approach emphasizing team work between decisionmakers andtechnical staff reduces uncertainty with new data collection and manages remaining uncertaintywith contingency plans. The labels in each SAFER step are slightly different from the DQO andOA steps, but the basic logic is the same. The SAFER planning steps are:
� Develop a conceptual model; � Develop remedial objectives and general response actions; � Identify priority problem(s); � Identify reasonable deviations and possible contingencies; � Pursue limited field studies to focus and expedite scoping; � Develop the decision rule; � Establish acceptable conditions and acceptable uncertainty for achieving objective; and � Design the work plan.
A.6 Technical Project Planning
Technical Project Planning (TPP) (formerly Data Quality Design), developed by the U. S. ArmyCorps of Engineers, is intended for developing data collection programs and defining data qualityobjectives for hazardous, toxic, and radioactive waste sites (HTRW). This systematic process(USACE, 1998) entails a four-phase planning approach in which a planning team�comprised ofdecisionmakers, data users, and data providers�identifies the data needed to support specificproject decisions and develops a data collection program to obtain those data. In Phase I, anoverall site strategy and a detailed project strategy are identified. The data user�s data needs,including the level of acceptable data quality, are defined in Phase II. Phase III entails activitiesto develop sampling and analysis options for the data needed. During phase IV, the TPP teamfinalizes a data collection program that best meets the decisionmakers� short- and long-termneeds within all project and site constraints. The technical personnel complete Phase IV bypreparing detailed project objectives and data quality objectives, finalizing the scope of work,and preparing a detailed cost estimate for the data collection program. The TPP process uses amulti-disciplinary team of decisionmakers, data users, and data implementors focused on sitecloseout.
A.7 Expedited Site Characterization
Expedited Site Characterization (ESC) was developed to support DOE�s Office of Science andTechnology�s Characterization, Monitoring, and Sensor Technology (CMST) program

Directed Planning Approaches
A-5JULY 2004 MARLAP
(Burton, 1993). The ESC process has been developed by American Society for Testing andMaterials (ASTM) as a provisional standard for rapid field-based characterization of soil andgroundwater (ASTM D585). The process is also known as QUICKSITE and �expedited siteconversion.� ESC is based on a core multi-disciplinary team of scientists participating throughoutthe processes of planning, field implementation, data integration, and report writing. ESCrequires clearly defined objectives and data quality requirements that satisfy the needs of the ESCclient, the regulatory authority, and the stakeholders. The technical team uses real-time fieldtechniques, including sophisticated geophysical and environmental sampling methods and an on-site analytical laboratory, to collect environmental information. Onsite computer support allowsthe expert team to analyze data each day and decide where to focus data collection the next day.Within a framework of an approved dynamic work plan, ESC relies on the judgment of thetechnical team as the primary means for selecting the type and location of measurements andsamples throughout the ESC process. The technical team uses on-site data reduction, integrationand interpretation, and on-site decisionmaking to optimize the field investigations.
Traditional site investigations generally are based on a phased engineering approach that collectssamples based on a pre-specified grid pattern and does not provide the framework for makingchanges in direction in the field. A dynamic work plan (Robatt, 1997; Robatt et al., 1998)relies�in part�on an adaptive sampling and analysis program. Rather than specify the sampleanalyses to be performed, the number of samples to be collected and the location of each sample,dynamic work plans specify the decisionmaking logic that will be used in the field to determinewhere the samples will be collected, when the sampling will stop, and what analyses will beperformed. Adaptive sampling and analysis programs change or adapt based on the analyticalresults produced in the field (Johnson, 1993a, b; Robatt, 1998).
A.8 Value Engineering
Value methodology was developed by Lawrence D. Miles in the late 1940s. He used a function-based process (�functional analysis�) to produce goods with greater production and operationalefficiency. Value methodology has evolved and, depending on the specific application, is oftenreferred to as �value engineering,� �value analysis,� �value planning,� or �value management.�In the mid-1960s value engineering was adopted by three federal organizations: the Navy Bureauof Shipyards and Docks, the U. S. Army Corp of Engineers, and the U. S. Bureau of Reclama-tion. In the 1990s, Public Law 104-106 (1996) and OMB Circulars A-131 (1993) and A-11(1997) set out the requirements for the use of value engineering, as appropriate, to reducenonessential procurement and program costs.
Value engineering is a systematic and organized decision-making process to eliminate, withoutimpairing essential functions, anything that increases acquisition, operation, or support costs. Thetechniques used analyze the functions of the program, project, system, equipment, facilities,services, or supplies to determine �best value,� or the best relationship between worth and cost.
Directed Planning Approaches
A-6MARLAP JULY 2004
The method generates, examines, and refines creative alternatives that would produce a productor a process that consistently performs the required basic function at the lowest life-cycle costand is consistent with required performance, reliability, quality, and safety.
A standard job plan is used to guide the process. The six phases of the value engineering job planare:
� Information; � Speculation (or creative); � Evaluation (or analysis); � Evolution (or development); � Presentation (or reporting); and � Implementation (or execution).
Value engineering can be used alone or with other management tools, such as TQM andIntegrated Product and Process Development (IPPD).
A.9 Systems Engineering
Systems engineering brings together a group of multi-disciplinary team members in a structuredanalysis of project needs, system requirements and specifications, and a least-cost strategy forobtaining the desired results. Systems engineering is a logical sequence of activities anddecisions that transforms an operational need into a preferred system configuration and adescription of system performance parameters. Problem and success criteria are defined throughrequirements analysis, functional analysis, and systems analysis and control. Alternativesolutions, evaluation of alternatives, selection of the best life-cycle balanced solution, and thedescription of the solution through the design package are accomplished through synthesis andsystems analysis and control.
The systems engineering process involves iterative application of a series of steps:
� Mission analysis or requirements understanding; � Functional analysis and allocation; � Requirements analysis; � Synthesis; and � System analysis and control.
A.10 Total Quality Management
Total Quality Management (TQM) is a customer-based management philosophy for continuouslyimproving the quality of products (or how work is performed) in order to meet customer

Directed Planning Approaches
A-7JULY 2004 MARLAP
expectations of quality and to measure and produce results aligned with strategic objectives.TQM grew out of two systems developed by Walter Shewhart of Bell Laboratories in the 1920s.Statistical process control was used to measure variance in production systems and to monitorconsistency and diagnose problems in work processes. The �Plan-Do-Check-Act� cycle applied asystematic approach to improving work processes. The work of Deming and others in Japanfollowing World War II expanded the quality philosophy beyond production and inspection to allfunctions within an organization and defined quality as �fit for customer use.�
TQM has been defined as �the application of quantitative methods and the knowledge of peopleto assess and improve (a) materials and services supplied to the organizations, (b) all significantprocesses within the organization, and (c) meeting the needs of the end-user, now and in thefuture� (Houston and Dockstader, 1997). The goal of TQM is to enhance effectiveness ofproviding services or products. This is achieved through an objective, disciplined approach tomaking changes in processes that affect performance. Process improvement focuses onpreventing problems rather than fixing them after they occur. TQM involves everyone in anorganization in controlling and continuously improving how work is done.
A.11 Partnering
Partnering is intended to bring together parties that ordinarily might have differing or competinginterests to create a synergistic effect on an outcome each views as desirable. Partnering is a teambuilding and relationship enhancing technique that seeks to identify and communicate the needs,expectations, and strengths of the participants. Partnering combines the talents of theparticipating organizations in order to develop actions that promote their common goals andobjectives. In the synergistic environment of partnering, creative solutions to problems can bedeveloped. Like TQM, partnering enfranchises all stakeholders (team members) in the decisionprocess and holds them accountable for the end results. Each team member (customer, manage-ment, employee) agrees to share the risks and benefits associated with the enterprise. Like theother approaches, partnering places a premium on open and clear communication amongstakeholders to define the problem and the solution, and to decide upon a course of action.
A.12 References and Other Sources
A.12.1 Data Quality Objectives
Guidance:
American Society for Testing and Materials (ASTM). D5792. Standard Practice for Generationof Environmental Data Related to Waste Management Activities: Development of DataQuality Objectives. West Conshohocken, PA.

Directed Planning Approaches
A-8MARLAP JULY 2004
U. S. Environmental Protection Agency (EPA). 1993. Data Quality Objectives Process forSuperfund. EPA/540/G-93/071 (Interim Final Guidance). Office of Emergency and RemedialResponse. OSWER Directive 9355.9-01. September.
U.S. Environmental Protection Agency (EPA). 2000. Guidance for the Data Quality ObjectiveProcess (EPA QA/G-4). EPA/600/R-96/055, Washington, DC. Available at www.epa.gov/quality/qa_docs.html.
Papers:
Blacker, S. M. 1993. �The Data Quality Objective Process�What It Is and Why It WasCreated.� Proceedings of the Twentieth Annual National Energy and Environmental QualityDivision Conference, American Society for Quality Control.
Blacker, S. and D. Goodman. 1994a. �Risk-Based Decision Making An Integrated Approach forEfficient Site Cleanup.� Environmental Science & Technology, 28:11, pp. 466A-470A.
Blacker, S. and D. Goodman. 1994b. �Risk-Based Decision Making Case Study: Application at aSuperfund Cleanup.� Environmental Science & Technology, 28:11, pp. 471A-477A.
Blacker, S. M. and P. A. Harrington. 1994. �Use of Process Knowledge and Sampling andAnalysis in Characterizing FFC Act Waste � Applying the Data Quality Objective (DQO)Process to Find Solutions.� Proceedings of the Twenty First Annual National Energy andEnvironmental Quality Division Conference, American Society for Quality Control.
Blacker, S. M. and J. Maney. 1993. �The System DQO Planning Process.� EnvironmentalTesting and Analysis. July/August.
Blacker, S. M., J. D. Goodman and J. M. Clark. 1994. �Applying DQOs to the Hanford Tank-Waste Remediation.� Environmental Testing and Analysis, 3:4, p. 38.
Blacker, S., D. Neptune, B. Fairless and R. Ryti. 1990. �Applying Total Quality Principles toSuperfund Planning.� Proceedings of the 17th Annual National Energy Division Conference,American Society for Quality Control.
Carter, M. and D. Bottrell. 1994. �Report on the Status of Implementing Site-SpecificEnvironmental Data Collection Project Planning at the Department of Energy�s (DOE) Officeof Environmental Restoration and Waste Management (EM).� Proceedings of the WasteManagement �94 Conference. Vol 2, pp. 1379-1383.
Directed Planning Approaches
A-9JULY 2004 MARLAP
Goodman, D. and S. Blacker. 1997. �Site Cleanup: An integrated Approach for ProjectOptimization to Minimize Cost and Control Risk.� In: The Encyclopedia of EnvironmentalRemediation. New York: John Wiley & Sons.
Michael, D. I. 1992. �Planning Ahead to Get the Quality of RI Data Needed for RemedySelection: Applying the DQO Process to Superfund Remedial Investigations.� Proceedings ofthe Air and Waste Management Association 85th Annual Meeting.
Michael, D. I. and E. A. Brown. 1992. �Planning Tools that Enhance Remedial DecisionMaking.� Proceedings of the Nineteenth Annual Energy and Environmental Quality DivisionConference, American Society for Quality Control.
Neptune, M. D. and S. M. Blacker. 1990. �Applying Total Quality Principles to SuperfundPlanning: Part I: Upfront Planning in Superfund.� Proceedings of the 17th Annual NationalEnergy Division Conference, American Society for Quality Control.
Neptune, D., E. P. Brantly, M. J. Messner and D. I. Michael. 1990. �Quantitative Decision-Making in Superfund: A Data Quality Objectives Case Study.� Hazardous Material Control,3, pp. 18-27.
Ryti, R. T. and D. Neptune. 1991. �Planning Issues for Superfund Site Remediation.� HazardousMaterials Control, 4, pp. 47-53.
A.12.2 Observational Approach
Papers:
Brown, S. M. 1990. �Application of the Observational Method to Groundwater Remediation.�Proceedings of HAZMAT�90, Atlantic City, NJ.
Ferguson, R. D., G. L. Valet, and F. J. Hood. 1992. Application of the Observational Approach,Weldon Springs Case Study.
Mark, D. L. et al. 1989. �Application of the Observational Method to an Operable UnitFeasibility Study - A Case Study.� Proceedings of Superfund�89, Hazardous Material ControlResearch Institute, Silver Spring, MD, pp. 436-442.
Myers, R. S. and Gianti, S. J. 1989. �The Observational Approach for Site Remediation atFederal Facilities.� Proceedings of Superfund�89, Hazardous Material Control ResearchInstitute, Silver Spring, MD.

Directed Planning Approaches
A-10MARLAP JULY 2004
Peck, R. B. 1969. �Ninth Rankine Lecture, Advantages and Limitations of the ObservationalMethod in Applied Soil Mechanics.� Geotechnique, 19, No. 2, pp.171-187.
Smyth, J. D. and R. D. Quinn. 1991. �The Observational Approach in EnvironmentalRestoration.� Proceedings of the ASCE National Conference of Environmental Engineering,Reno, NV.
Smyth, J. D., J. P. Amaya and M. S. Peffers. 1992. �DOE Developments: ObservationalApproach Implementation at DOE Facilities.� Federal Facilities Environmental Journal,Autumn, pp. 345-355.
Smyth, J. D., J. P. Kolman, and M. S. Peffers. 1992. �Observational Approach ImplementationGuidance: Year-End Report.� Pacific Northwest Laboratory Report PNL-7999.
A.12.3 Streamlined Approach for Environmental Restoration (Safer)
Guidance:
U. S. Department of Energy (DOE). 1993. Remedial Investigation/Feasibility Study (RI/FS)Process, Elements and Techniques Guidance, Module 7 Streamlined Approach forEnvironmental Restoration, Office of Environmental Guidance, RCRA/CERCLA Divisionand Office of Program Support, Regulatory Compliance Division Report DOE/EH-94007658.
Papers:
Bottrell, D. 1993. �DOE�s Development and Application of Planning to Meet EnvironmentalRestoration and Waste Management Data Needs.� Proceedings of the Twentieth AnnualNational Energy & Environmental Quality Division Conference, American Society forQuality Control.
Dailey, R., D. Lillian and D. Smith. 1992. �Streamlined Approach for Environmental Restoration(SAFER): An Overview.� Proceedings of the 1992 Waste Management and EnvironmentalSciences Conference.
Gianti, S., R. Dailey, K. Hull and J. Smyth. 1993. �The Streamlined Approach ForEnvironmental Restoration.� Proceedings of Waste Management �93, 1, pp. 585-587.
Smyth, J. D. and J. P. Amaya. 1994. Streamlined Approach for Environmental Restoration(SAFER): Development, Implementation and Lessons Learned. Pacific Northwest LaboratoryReport PNL-9421/UC-402, Richland, WA.

Directed Planning Approaches
A-11JULY 2004 MARLAP
A.12.4 Technical Project Planning
Guidance:
U. S. Army Corps of Engineers (USACE). 1995. Technical Project Planning Guidance forHazardous, Toxic and Radioactive Waste (HTRW) Data Quality Design. Engineer ManualEM-200-1-2 (superceded by EM-200-1-2, 1998).
U. S. Army Corps of Engineers (USACE). 1998. Technical Project Planning Process. EngineerManual EM-200-1-2.
A.12.5 Expedited Site Characterization
Guidance:
American Society for Testing and Materials (ASTM) D585. Standard Provisional Guide forExpedited Site Characterization of Hazardous Waste Contaminated Sites. WestConshohocken, PA.
Papers:
Bottrell, D. 1993. �DOE�s Development and Application of Planning Processes to MeetEnvironmental Restoration and Waste Management Data Needs.� Proceedings of theTwentieth Annual National Energy & Environmental Quality Division Conference, AmericanSociety for Quality Control.
Burton, J. C., et al. 1993. �Expedited Site Characterization: A Rapid Cost-Effective Process forPreremedial Site Characterization.� Proceeding of Superfund XIV, Vol. II, HazardousMaterials Research and Control Institute, Greenbelt, MD, pp. 809-826.
Burton, J. C. 1994. �Expedited Site Characterization for Remedial Investigations at FederalFacilities.� Proceedings Federal Environmental Restoration III and Waste Minimization IIConference, Vol. II, pp. 1407-1415.
Johnson, R. 1993a �Adaptive Sampling Program Support for Expedited Site Characterization.�ER�93 Environmental Remediation Conference Proceedings.
Johnson, R. 1993b. �Adaptive Sampling Program Support for the Unlined Chromic Acid Pit,Chemical Waste Landfill, Sandia National Laboratory, Albuquerque, New Mexico.� ANL-EAD/TM-2.
Directed Planning Approaches
A-12MARLAP JULY 2004
Robatt, A. 1997. �A Guideline for Dynamic Work Plans and Field Analytics: The Keys to CostEffective Site Cleanup.� Tufts University Center for Field Analytical Studies and Technologyand U.S. EPA, Region 1, Hazardous Waste Division.
Robatt, A. 1998. �A Dynamic Site Investigation: Adaptive Sampling and Analysis Program forOperable Unit 1 at Hanscom Air Force Base, Bedford, Massachusetts.� Tufts UniversityCenter for Field Analytical Studies and Technology and U.S. EPA, Region 1, Office of SiteRemediation and Restoration, Boston, MA.
Robbat, A., S. Smarason, and Y. Gankin. 1998. �Dynamic Work Plans and Field Analytics, TheKey to Cost-Effective Hazardous Waste Site Investigations,� Field Analytical Chemistry andTechnology 2:5, pp. 253-65.
Starke, T. P., C. Purdy, H. Belencan, D. Ferguson and J. C. Burton. 1995. �Expedited SiteCharacterization at the Pantex Plant.� Proceedings of the ER�95 Conference.
A.12.6 Value Engineering
Guidance:
The February 1996 Amendment to the Office of Federal Procurement Policy Act (41 U.S.C. 401et. seq.) (Public Law 104-106, Sec 4306 amended this.)
Federal Acquisitions Regulations. FAR, Part 48, Value Engineering.
Federal Acquisitions Regulations. FAR, Part 52.248-1,-2,-3, Value Engineering SolicitationProvisions and Contract Clauses.
National Defense Authorization Act for Fiscal Year 1996. PL 104-106, Law Requiring ValueEngineering in Executive Agencies. February 10, 1996.
Office of Management and Budget (OMB). 1993. OMB Circular A-131, Value Engineering.
Office of Management and Budget (OMB). 1997. OMB Circular A-11, Preparation andSubmission of Budget Estimates.
U. S. Army. Value Engineering. Army Regulation AR 5-4, Chapter 4 (Reference only).
U. S. Army Corps of Engineers (USACE). Engineer Regulation. ER 5-1-11.
U. S. Department of Energy. 1997. Value Management. Good Practice Guide (GPG-FM-011).

Directed Planning Approaches
A-13JULY 2004 MARLAP
U. S. Department of the Interior (DOI). 1995. Departmental Manual, Management Systems andProcedures, Part 369, Value Engineering, Chapter 1, General Criteria and Policy. May 18,1995.
Books:
Fallon, C. 1990. Value Analysis. The Miles Value Foundation, 2nd Edition.
Kauffman, J. J. 1985. Value Engineering for the Practitioner. North Carolina State University,Raleigh, NC.
Miles, L. D. 1989. Techniques of Value Analysis and Engineering. McGraw-Hill BookCompany, New York, NY.
Mudge, A. E. 1989. Value Engineering, A Systematic Approach. J. Pohl Associates.
Parker, D. 199x. Value Engineering Theory. The Miles Value Foundation.
Papers:
Al-yousefi, A. 1996. �Total Value Management (TVM): A VE-TQM Integration,� Proceedingsof the 1996 SAVE Conference, Society of American Value Engineers.
Blumstein, G. 1996. �FAST Diagramming: A Technique to Facilitate Design Alternatives,�Proceedings of the 1996 SAVE Conference, Society of American Value Engineers.
Maynor, D. 1996. Value Engineering for Radiation Hazards Remediation at the Fernald OU1,Ohio. U.S. DOE, Ohio Field Office.
Morrel, C. 1996. Value Engineering for Radiation Hazards Remediation at Fernald OU4, Ohio.U.S. DOE Reclamation Technical Service Center.
Wixson, J. R. 1987. �Improving Product Development with Value Analysis/Value Engineering:A Total Management Tool,� Proceedings of the Society of American Value Engineers, 22,pp.51-66.
A.12.7 Systems Engineering
Guidance:
Electronic Industries Alliance (EIA). 1994. Systems Engineering. Standard EIA/IS-632.
Directed Planning Approaches
A-14MARLAP JULY 2004
Electronic Industries Alliance (EIA). 1997. Upgrade IS-632, Process for Engineering a System.EIA/SP-3537 Part 1: Process Characteristics and EIA/SP-4028 Part 2: ImplementationGuidance.
International Electrical and Electronics Engineers (IEEE). 1994. Standard for Application andManagement of the Systems Engineering Process. P1220.
U. S. Department of Defense (DOD). 1992. Systems Engineering. MIL-STD-499B.
U. S. Department of Energy (DOE). 1996. Project Execution and Engineering ManagementPlanning. Good Practice Guide GPG-FM-010.
Books:
Boardman, J. 1990. Systems Engineering: An Introduction. New York: Prentice Hall.
Chestnut, H. 1967. System Engineering Methods. New York: John Wiley & Sons.
Churchman, C. W. 1968. The Systems Approach. New York: Dell Publishing Co., Inc.
Eisner, H. 1998. Computer-Aided Systems Engineering (CASE). Englewood Cliffs: Prentice Hall.
Goode, H. H. 1957. Systems Engineering: An Introduction to the Design of Large-Scale Systems.New York: McGraw-Hill.
Machol, R. E. 1965. Systems Engineering Handbook. New York: McGraw-Hill.
Smith, D. B. 1974. Systems Engineering and Management. Reading, MA: Addison-Wesley Publ.Co.
Wymore, A. W. 1976. Systems Engineering Methodology for Interdisciplinary Teams. NewYork: John Wiley & Sons.
Papers:
Bensoussan, A. 1982. �Analysis and Optimization of Systems.� Proceedings of the FifthInternational Conference on Analysis and Optimization of Systems, Versailles, France.December 14-17.
David, H.T. and S. Yoo. 1993. �Where Next? Adaptive Measurement Site Selection for AreaRemediation.� In: Environmental Statistics, Assessment and Forecasting (Richard Cathern,Ed.). Lewis Publishers, MI.
Directed Planning Approaches
A-15JULY 2004 MARLAP
Ljunggren M. and J Sundberg. 1996. �A Systems Engineering Approach to National Solid WasteManagement -- Case Study, Sweden.� Proceedings of the 12th International Conference onSolid Waste Management. November 17-20.
Pacific Northwest Laboratory. 1995. A Systems Engineering Analysis to Examine the EconomicImpact for Treatment of Tritiated Water in the Hanford K-Basin. Report No. PNL-SA-24970.Richland, WA.
A.12.8 Total Quality Management
Guidance:
U. S. Department of the Army. 1992. The Leadership for Total Army Quality Concept Plan.
U. S. Department of Energy (DOE). 1993. Total Quality Management ImplementationGuidelines. DOE/HR-0066.
U. S. Office of Personnel Management (OPM), Federal Quality Institute. 1990. Federal TotalQuality Management Handbook, How to Get Started, Booklet 1: Implementing Total QualityManagement, U. S. Government Printing Office.
Books:
Berk, J. and S. Berk. 1993. Total Quality Management: Implementing Continuous Improvement.Sterling Publishing Co. Inc., New York, NY.
Carr, D. K. and I. D. Littman. 1993. Excellence in Government. Coopers and Lybrand, Arlington,VA.
Dobyns, L. and C. Crawford-Mason. 1994. Thinking about Quality: Progress, Wisdom and theDeming Philosophy. New York: Times Books.
Harrington, H. J. 1991. Business Process Improvement. New York: McGraw-Hill.
Koehler, J. W. and J. M. Pankowski. 1996. Quality Government. Designing, Developing andImplementing TQM. Delray Beach, FL: St. Lucie Press.
Rao, A, L.P. Carr, I. Dambolena, R.J. Kopp, J. Martin, F. Rafii, and P.F. Schlesinger. 1996. TotalQuality Management: A Cross Functional Perspective. New York: John Wiley & Sons.
Walton, M. 1990. Deming Management at Work. New York: Putnam.

Directed Planning Approaches
A-16MARLAP JULY 2004
Papers:
Blacker, S. 1990. �Applying Total Quality Concepts to Environmental Data Operations.�Proceedings of the Eighth International Conference, International Society for QualityControl.
Breisch, R.E. 1996. �Are You Listening?� Quality Progress, pp. 59-62.
Houston, A. and Dockstader, S. L. 1997. Total Quality Leadership: A Primer. Department of theNavy, Total Quality Leadership Office Publication Number 97-02.
Kidder, P. J. and B. Ryan. 1996. �How the Deming Philosophy Transformed the Department ofthe Navy.� National Productivity Review 15:3.
A.12.9 Partnering
Guidance:
U. S. Department of the Army. 1993. Engineering and Design Quality Management, Appendix BPartnering. ER-1110-1-12.
Books:
Hrebniak, L. 1994. We Force in Management: How to Build and Sustain Cooperation. NewYork: Free Press.
Maurer, R. 1992. Caught in the Middle: A Leadership Guide for Partnership in the Workplace.Portland, OR: Productivity Press.
Poirier, C. C. 1994. Business Partnering for Continuous Improvement: How to Forge EnduringAlliances Among Employees, Suppliers, and Customers. New York: Berrett-Koehler.
Papers:
Brown, T. L. 1993. �Is there Power in Partnering?� Industry Week, 242:9, p. 13.
Covey, S. R. 1993. �Win-Win Partnerships.� Executive Excellence, 10:11, pp. 6-7.
Chem-Nuclear Systems, Inc. (CNSI). 1996. Community Partnering Plan: Pennsylvania Low-Level Radioactive Waste Disposal Facility. S80-PL-021, Revision 0. Commonwealth ofPennsylvania, Department of Environmental Protection, Bureau of Radiation.

Directed Planning Approaches
A-17JULY 2004 MARLAP
Mosley, D. and C. C. Moore. 1994. �TQM and Partnering: An Assessment of Two Major ChangeStrategies.� PMNETwork, 18:9, pp. 22-26.
Sanders, S. R. and M. M. Moore. 1992. �Perceptions on Partnering in the Public Sector.� ProjectManagement Journal, 23:4, pp. 13-19.
Simmons, J. 1989. �Partnering Pulls Everything Together.� Journal for Quality & Participation,12, pp. 12-16.
U. S. Army Corps of Engineers (USACE). 1996. �U.S. Corps of Engineers Adopts Partnering.�National Academy of Public Administration Foundation, Washington, DC.

B-1JULY 2004 MARLAP
APPENDIX BTHE DATA QUALITY OBJECTIVES PROCESS
B.1 Introduction
This appendix provides information about the basic framework of the DQO process (ASTM5792; EPA, 2000; NRC, 1998; MARSSIM, 2000). The DQO planning process empowers bothdata users and data suppliers to take control and resolve issues in a stepwise fashion. It bringstogether at the right time all key players from the data user and data supplier constituencies andenables each participant to play a constructive role in clearly defining:
� The problem that requires resolution; � What type, quantity, and quality of data the decisionmaker needs to resolve that problem; � Why the decisionmaker needs that type and quality of data; � How much risk of making a wrong decision is acceptable; and � How the decisionmaker will use the data to make a defensible decision.
The DQO process provides a logic for setting well-defined, achievable objectives and developinga cost-effective, technically sound sampling and analysis design. It balances the data user�stolerance for uncertainty with the available resources for obtaining data. The number of visibleand successful applications of the DQO process has proven its value to the environmentalcommunity. The DQO process is adaptable depending on the complexity of the project and theinput from the decisionmakers. Some users have combined DQO planning with remedy selectionfor restoration projects (e.g., DOE�s Streamlined Approach for Environmental Restoration�seeSection A.5 in Appendix A). Other users have integrated their project scoping meetings with theDQO process. Much of the information that is developed during the DQO process is useful fordeveloping the project plan documents (Chapter 4) and implementing the data validation process(Chapter 8) and the data quality assessment (DQA) process (Chapter 9).
Since its inception, the term �data quality objectives� has been adopted by many organizations,and the definition has been adapted and modified (see box on next page). Throughout this docu-ment, MARLAP uses EPA�s (2000) definitionof DQOs: �Qualitative and quantitativestatements derived from the DQO process thatclarify study objectives, define the appropriatetype of data, and specify the tolerable levels ofpotential decision errors that will be used as thebasis for establishing the quality and quantity ofdata needed to support decisions.�
Contents
B.1 Introduction . . . . . . . . . . . . . . . . . . . . . . . . . . . B-1B.2 Overview of the DQO Process . . . . . . . . . . . . B-2B.3 The Seven Steps of the DQO Process . . . . . . . B-3B.4 References . . . . . . . . . . . . . . . . . . . . . . . . . . . B-24Attachment B1: Decision Error Rates and the Gray
Region for Decisions About Mean Concentrations . . . . . . . . . . . . . . . . . . . . . . . B-26
Attachment B2: Decision Error Rates and the GrayRegion for Detection Decisions . . . . . . . . . . B-36
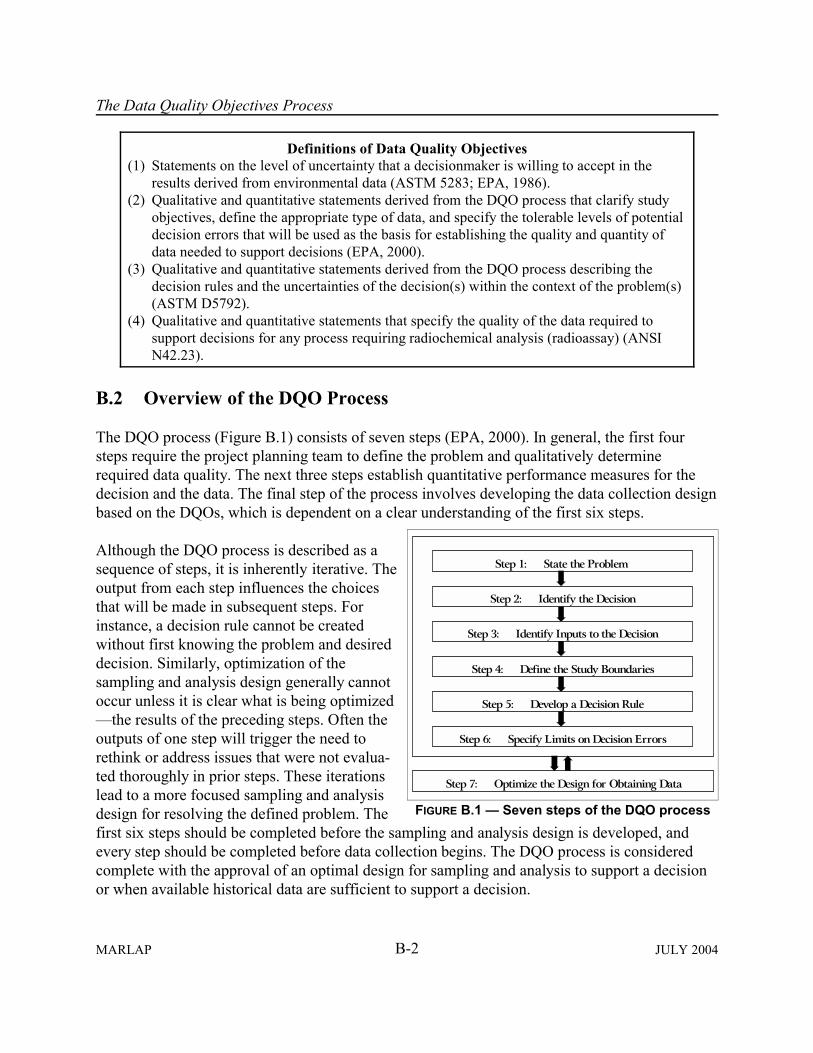
The Data Quality Objectives Process
B-2MARLAP JULY 2004
Step 1: State the Problem
Step 2: Identify the Decision
Step 3: Identify Inputs to the Decision
Step 4: Define the Study Boundaries
Step 5: Develop a Decision Rule
Step 6: Specify Limits on Decision Errors
Step 7: Optimize the Design for Obtaining Data
FIGURE B.1 � Seven steps of the DQO process
Definitions of Data Quality Objectives(1) Statements on the level of uncertainty that a decisionmaker is willing to accept in the
results derived from environmental data (ASTM 5283; EPA, 1986).(2) Qualitative and quantitative statements derived from the DQO process that clarify study
objectives, define the appropriate type of data, and specify the tolerable levels of potentialdecision errors that will be used as the basis for establishing the quality and quantity ofdata needed to support decisions (EPA, 2000).
(3) Qualitative and quantitative statements derived from the DQO process describing thedecision rules and the uncertainties of the decision(s) within the context of the problem(s)(ASTM D5792).
(4) Qualitative and quantitative statements that specify the quality of the data required tosupport decisions for any process requiring radiochemical analysis (radioassay) (ANSIN42.23).
B.2 Overview of the DQO Process
The DQO process (Figure B.1) consists of seven steps (EPA, 2000). In general, the first foursteps require the project planning team to define the problem and qualitatively determinerequired data quality. The next three steps establish quantitative performance measures for thedecision and the data. The final step of the process involves developing the data collection designbased on the DQOs, which is dependent on a clear understanding of the first six steps.
Although the DQO process is described as asequence of steps, it is inherently iterative. Theoutput from each step influences the choicesthat will be made in subsequent steps. Forinstance, a decision rule cannot be createdwithout first knowing the problem and desireddecision. Similarly, optimization of thesampling and analysis design generally cannotoccur unless it is clear what is being optimized�the results of the preceding steps. Often theoutputs of one step will trigger the need torethink or address issues that were not evalua-ted thoroughly in prior steps. These iterationslead to a more focused sampling and analysisdesign for resolving the defined problem. Thefirst six steps should be completed before the sampling and analysis design is developed, andevery step should be completed before data collection begins. The DQO process is consideredcomplete with the approval of an optimal design for sampling and analysis to support a decisionor when available historical data are sufficient to support a decision.
The Data Quality Objectives Process
B-3JULY 2004 MARLAP
In practice, project planning teams often do a cursory job on the first four steps, wanting to getinto technical design issues immediately. Without carefully defining the problem and the desiredresult, the project planning team may develop a design that is technically sound but answers thewrong question, or answers the questions only after the collection of significant quantities ofunnecessary data. Time spent on the first four steps is well spent. Extra effort must be given toassure that Steps 1 to 4 are adequately addressed.
When applying the DQO process, or any planning approach, it is important to document theoutputs of each step to assure that all participants understand and approve the interim products,and that they have a clear record of their progress. It is sometimes useful to circulate an approvalcopy with signature page to ensure agreement of the stakeholders.
B.3 The Seven Steps of the DQO Process
Each step of the DQO process will be discussed in the following sections. Not all items will beapplicable to every project. The project planning team should apply the concepts that areappropriate to the problem.
B.3.1 DQO Process Step 1: State the Problem
The first step is to define the problem clearly. The members of the project planning team presenttheir concerns, identify regulatory issues and threshold levels, and review the site history. Theproject planning team should develop a concise description of the problem. Some elements toinclude in the description might be the study objectives, regulatory context, groups who have aninterest in the study, funding and other resources available, previous study results, and anyobvious sampling design constraints. The more facts, perceptions and concerns of the keystakeholders�including important social, economic, or political issues�that are identifiedduring this step, the better the chances are that the issues driving the decisions and actions will beidentified.
The primary decisionmaker should be identified. The resources and relevant deadlines to addressthe problem are also defined at this time. If possible, a �project conceptual model� should bedeveloped. This will help structure and package the diverse facts into an understandable pictureof what the various issues are and how those issues can be focused into a specific problem.The expected outputs of Step 1 are:
� A conceptual model that packages all the existing information into an understandable pictureof the problem;
� A list of the project planning team members and identification of the decisionmaker;

The Data Quality Objectives Process
B-4MARLAP JULY 2004
� A concise description of the problem; and
� A summary of available resources and relevant deadlines for the study.
B.3.2 DQO Process Step 2: Identify the Decision
During Step 2 of the DQO process, the project planning team defines what decision must bemade or what question the project will attempt to resolve. The decision (or question) could besimple, like whether a particular discharge is or is not in compliance, or the decision could becomplex, such as determining if observed adverse health is being caused by a nonpoint sourcedischarge. Linking the problem and the decision focuses the project planning team on seekingonly that information essential for decisionmaking, saving valuable time and money.
The result may be a comprehensive decision for a straightforward problem, or a sequence ofdecisions for a complex problem. For complex problems with multiple concerns, these concernsshould be ranked in order of importance. Often a complex concern is associated with a series ofdecisions that need to be made. Once these decisions have been identified, they should besequenced in a logical order so the answer to one decision provides input in answering the nextdecision. It may be helpful to develop a logic-flow diagram (decision framework), arraying eachelement of the issue in its proper sequence along with its associated decision that requires ananswer.
The term �action level� is used in this document to denote the numerical value that will cause thedecisionmaker to choose one of the alternative actions. The action level may be a derivedconcentration guideline level, background level, release criteria, regulatory decision limit, etc.The action level is often associated with the type of media, analyte, and concentration limit.Some action levels, such as release criteria for license termination, are expressed in terms of doseor risk. The release criteria typically are based on the total effective dose equivalent (TEDE), thecommitted effective dose equivalent (CEDE), risk of cancer incidence (morbidity), or risk ofcancer death (mortality), and generally cannot be measured directly. A radionuclide-specificpredicted concentration or surface area concentration of specific nuclides that can result in a dose(TEDE or CEDE) or specific risk equal to the release criterion is called the �derived concentra-tion guideline level� (DCGL). A direct comparison can be made between the project�s analyticalmeasurements and the DCGL (MARSSIM, 2000).
The project planning team should define the possible actions that may be taken to solve theproblem. Consideration should be given to the option of taking no action. A decision statementcan then be developed by combining the decisions and the alternative actions. The decision ruleand the related hypothesis test will be more fully developed in the DQO process at Steps 5 and 6.
By defining the problem and its associated decision clearly, the project planning team has alsobegun to define the inputs and boundaries (DQO process Steps 3 and 4). At the end of Step 2, the
The Data Quality Objectives Process
B-5JULY 2004 MARLAP
project planning team has:
� Identified the principal decisions or questions;
� Defined alternative actions that could be taken to solve the problem based on possibleanswers to the principal decisions and questions;
� Combined the principal decisions and questions and the alternative actions into decisionstatements that expresses a choice among alternative actions; and
� Organized multiple decisions.
B.3.3 DQO Process Step 3: Identify Inputs to the Decision
During Step 3, the project planning team makes a formal list of the specific information requiredfor decisionmaking. The project planning team should determine what information is needed andhow it can be acquired. The project planning team should specify if new measurements arerequired for the listed data requirements. The data required are based on outcomes of discussionduring the previous two steps. The project planning team should define the basis for setting theaction level. Depending on the level of detail of the discussion during the previous steps, thenefforts associated with Step 3 may be primarily to capture that information. If the first two stepshave not defined the inputs with enough specificity, then those inputs should be defined here.However, before going further, the output should be reviewed to assure that the problem, thedecision steps and the input are compatible in complete agreement.
An important activity during Step 3 is to determine if the existing data or information, whencompared with the desired information, has significant gaps. If no gaps exist, then the existingdata or information may be sufficient to resolve the problem and make the decision. (Althoughthere may be no gaps in the data, the data may not have enough statistical power to resolve theaction level. See Step 6 for more discussion.) In order to optimize the use of resources, theproject planning team should maximize the use of historical information. If new data arerequired, then this step establishes what new data (inputs) are needed. The specific environmentalvariable or characteristic to be measured should be identified. The DQO process clearly linkssampling and analysis efforts to an action and a decision. This linkage allows the projectplanning team to determine when enough data have been collected.
If the project planning team determines that collection of additional data is needed, the analyticallaboratory acquisition strategy options should be considered at this stage. Identifying suitablecontracting options should be based on the scope, schedule, and budget of the project, and thecapability and availability of laboratory resources during the life of the project, and othertechnical considerations of the project. If an ongoing contract with a laboratory is in place, it isadvisable to involve them with the radioanalytical specialists as early as possible.
The Data Quality Objectives Process
B-6MARLAP JULY 2004
The project planning team should ensure that there are analytical protocols available to provideacceptable measurements. If analytical methods do not exist, the project planning team will needto consider the resources needed to develop a new method, reconsider the approach for providinginput data, or perhaps reformulate the decision statement.
The expected outputs of Step 3 are:
� A list of information needed for decisionmaking; � Determination of whether data exist and are sufficient to resolve the problem; � Determination of what new data, if any, are required; � Definition of the characteristics that define the population and domain of interest; � Definition of the basis for the action level; � Confirmation that appropriate analytical protocols exist to provide the necessary data; and � A review of the planning output to assure the problem, decision, and inputs are fully linked.
B.3.4 DQO Process Step 4: Define the Study Boundaries
In Step 4, the project planning team specifies the spatial and temporal boundaries covered by thedecision statement. The spatial boundaries define the physical aspects to be studied in terms ofgeographic area, media, and any appropriate subpopulations (e.g., an entire plant, entire riverbasin, one discharge, metropolitan air, emissions from a power plant). When appropriate, dividethe population into strata that have relatively homogeneous characteristics. The temporalboundaries describe the time frame the study data will represent (e.g., possible exposure to localresidents over a 30-year period) and when samples should be taken (e.g., instantaneous samples,hourly samples, annual average based on monthly samples, samples after rain events). Changingconditions that could impact the success of sampling and analysis and interpretation need to beconsidered. These factors include weather, temperature, humidity, or amount of sunlight andwind.
The scale of the decision is also defined during this step. The selected scale should be thesmallest, most appropriate subset of the population for which decisions will be made based onthe spatial or temporal boundaries. During Step 4, the project planning team also should identifypractical constraints on sampling and analysis that could interfere with full implementation of thedata collection design. These include time, personnel, equipment, and seasonal or meteorologicalconditions when sampling is not possible or may bias the data.
In practice, the study boundaries are discussed when the project planning team and decision-maker agree on the problem and its associated decision. For instance, a land area that may becontaminated or a collection of waste containers would be identified as part of the problem anddecision definition in Steps 1 and 2. The boundaries also would be considered when determininginputs to the decision in Step 3. If the study boundaries had not been addressed before Step 4 orif new issues were raised during Step 4, then Steps 1, 2, and 3 should be revisited to determine

The Data Quality Objectives Process
B-7JULY 2004 MARLAP
how Step 4 results are now influencing the three previous steps.
The outputs of Step 4 are:
� A detailed description of the spatial and temporal boundaries of the problem; and � Any practical constraints that may interfere with the sampling and analysis activities.
B.3.5 Outputs of DQO Process Steps 1 through 4 Lead Into Steps 5 through 7
At this stage in the DQO process, the project planning team has defined with a substantial degreeof detail the problem, its associated decision, and the inputs and boundaries for addressing thatproblem. The project planning team knows whether it needs new data to fill specific gaps andwhat that data should be. The remaining three steps are highly technical and lead to the selectionof the sampling and analysis design. Even when new data are not required (i.e., a data collectiondesign is not needed), the project planning team should continue with Steps 5 and 6 of the DQOprocess. By establishing the formal decision rule and the quantitative estimates of tolerabledecision error rates, the project planning team is assured that consensus has been reached on theactions to be taken and information to establish criteria for the DQA process.
It is important to emphasize that every effort must be made to assure that Steps 1 through 4 areadequately addressed. If the necessary time is taken in addressing the first four steps carefullyand assuring consensus among the project planning team, then the three remaining steps are lessdifficult.
B.3.6 DQO Process Step 5: Develop a Decision Rule
In Step 5, the project planning team determines the appropriate statistical parameter thatcharacterizes the population, specifies the action level, and integrates previous DQO processoutputs into a single �if ..., then ...� statement (called a �decision rule�) that describes a logicalbasis for choosing among alternative actions.
The four main elements to the decision rule are:
A. THE PARAMETER OF INTEREST. A descriptive measure (e.g., mean, median, or proportion) thatspecifies the characteristic or attribute that the decisionmaker would like to know and that thedata will estimate. The characteristics that define the population and domain of interest wasestablished in Step 3.
B. THE SCALE OF DECISIONMAKING. The smallest, most appropriate subset for which decisionswill be made. The scale of decisionmaking was defined in Step 4.
C. THE ACTION LEVEL. A threshold value of the parameter of interest that provides the criterion

The Data Quality Objectives Process
B-8MARLAP JULY 2004
for choosing among alternatives. Action levels may be based on regulatory standards or theymay be derived from project- and analyte-specific criteria such as dose or risk analysis. Thebasis for the action level was determined in Step 3.
D. THE ALTERNATIVE ACTIONS. The actions the decisionmaker would take, depending on the�true value� of the parameter of interest. The alternative actions were determined in Step 2.
The decision rule is a logical, sequential set of steps to be taken to resolve the problem. Forexample, �If one or more conditions exists then take action 1, otherwise take action 2.�
The outputs of Step 5 are:
� The action level; � The statistical parameter of interest; and � An �if ..., then ...� statement that defines the conditions that would cause the decisionmaker
to choose among alternative courses of action.
PROCEDURE FOR DEVELOPING A DECISION RULE
The outcome of a decision rule is a result: often to take action or not to take action. The decisionrule is an �If..., then...� statement that defines the conditions that would cause the decisionmakerto choose an action. The decision rule establishes the exact criteria for making that choice. Thereare four main elements to a decision rule:
A. The parameter of interest. For example, the mean or median of the concentration of ananalyte.
B. The area over which the measurements are taken. For example, in MARSSIM, a surveyunit.
C. The action level. For example, in MARSSIM, the action level is called the DCGL.D. Alternative actions. For example, if the mean is greater than the action level, then
corrective action must be taken, otherwise the survey unit may be released.
A decision rule is action oriented, so a decision rule has the general form:
If the value of parameter A, over the area B, is greater than C, then take action D,otherwise take action D*.
For example, if:
(A) the true mean concentration of 238U in the(B) surface soil of the survey unit is greater than

The Data Quality Objectives Process
B-9JULY 2004 MARLAP
(C) 30 pCi/g, then(D) remove the soil from the site; otherwise,(D*) leave the soil in place.
The decisionmaker and planning team should be comfortable with the decision rule regarding thecriteria for taking action before any measurements are taken. The input to a decision rule is theresult of measurements. A decision will be made, and action taken, based upon those results.
There is uncertainty with every scientific measurement taken. Sampling uncertainty is due to thenatural spatial and temporal variation in contaminant concentrations across a site. Measurementuncertainty is the variability in a combination of factors that arise during sample analysis.Because there is uncertainty in measurement results, the decision based on them could beincorrect. Controlling decision error is the subject of Step 6 of the DQO process.
B.3.7 DQO Process Step 6: Specify the Limits on Decision Errors
In this step, the project planning team assesses the potential consequences of making a wrongdecision and establishes a tolerable level for making a decision error. The project planning teamdefines the types of decision errors (Type I and II) and the tolerable limits on the decision errorrates. In general, a Type I error is deciding against the default assumption (the null hypothesis)when it is actually true; a Type II error is not deciding against the null hypothesis when it isactually false (see Attachment B1 and Appendix C for detailed discussions). The limits imposedon the probability of making decision errors will be used to establish measurement performancecriteria for the data collection design.
Traditionally, the principles of statistical hypothesis testing have been used to determine tolerablelevels of decision error rates. Other approaches applying decision theory have been applied(Bottrell et al., 1996a, b). Based on an understanding of the possible consequences of making awrong decision in taking alternative actions, the project planning team chooses the nullhypotheses and judges what decision error rates are tolerable for making a Type I or Type IIdecision error.
The project planning team also specifies a range of possible values where the consequences ofdecision errors are relatively minor (the gray region). Specifying a gray region is necessarybecause variability in the population and imprecision in the measurement system combine toproduce variability in the data such that the decision may be �too close to call� when the truevalue is very near the action level. The width of the gray region establishes the distance from theaction level where it is most important that the project planning team control Type II errors. Foradditional information on the gray region, hypothesis testing, and decision errors, see EPA(2000) and NRC (1998).
The tolerable decision error rates are used to establish performance goals for the data collection
The Data Quality Objectives Process
B-10MARLAP JULY 2004
design. Overall variability in the result can be attributed to several sources, including samplelocation, collection, and handling; laboratory handling and analysis; and data handling andanalysis. In many environmental cases, sampling is a much larger source of uncertainty thanlaboratory analyses. The goal is to develop a sampling and analysis design that reduces thechance of making a wrong decision. The greater certainty demanded by the decisionmakers, themore comprehensive and expensive the data collection process is likely to be. In this step, theproject planning team has to come to an agreement on how to determine acceptable analyticaluncertainty and how good the overall data results are required to be. The team has to reach aconsensus on the trade off between the cost of more information and the increased certainty inthe resulting decision.
Often the project planning team does not feel comfortable with the concepts and terminology ofhypothesis testing (Type I and Type II errors, gray region, critical region, tolerable decision errorrates). As a result, the project planning team may have difficulty with (or want to skip) this stepof the directed planning process. If these steps are skipped or insufficiently addressed, it is morelikely that the data will not be of the quality needed for the project. Attachment B1 givesadditional guidance on these concepts. MARLAP recommends that for each radionuclide ofconcern, an action level, gray region, and limits on decision error rates be established during adirected planning process. A stepwise procedure for accomplishing this is given at the end of thissection.
Figure B.2 summarizes the outputs of the decisions made by the project planning team in adecision performance goal diagram (EPA, 2000). The horizontal axis represents the (unknown)true value of the parameter being estimated. The vertical axis represents the decisionmaker�sdesired probability of concluding that the parameter exceeds an action limit. The �gray region�(bounded on one side by the action level) defines an area where the consequences of decisionerror are relatively minor (in other words, it defines how big a divergence from the action levelwe wish to distinguish). The gray region is related to the desired precision of the measurements.The height of the indicated straight lines to the right and left of the gray region depict thedecisionmaker�s tolerance for Type I and Type II errors.
For purposes of this example, the default assumption (null hypothesis) was established as �themeasured concentration exceeds the action level� (Figure B.2a). A Type I error consists inmaking a decision not to take action (e.g., remediate) when that action was in fact required (e.g.,analyte concentrations are really above an action level). The desired limit on the probability ofmaking a Type I error is set at 5 percent if the true concentration is between 100 and 150 and at 1percent if the true concentration exceeds 150. A Type II error is understood as taking an actionwhen in fact that action is not required (e.g., analyte concentrations are really below the actionlevel). The desired limit on the probability of making a Type II error is set at 5 percent if the trueconcentrations is less than 25 and 10 percent if the true concentrations is between 25 and 75.

The Data Quality Objectives Process
B-11JULY 2004 MARLAP
Figure B.2(a) � Decision performance goaldiagram null hypothesis: the parameter exceeds
the action level.
Figure B.2(b) � Decision performance goaldiagram null hypothesis: the parameter is less
than the action level.
In Figure B.2(b), the default assumption (null hypothesis) was established as �the measuredconcentration is less than the action level.� The Type I error is understood as taking an actionwhen in fact that action is not required (e.g., analyte concentrations are really below the actionlevel). The desired limit on the probability of making a Type I error is set at 5 percent if the trueconcentration is less than 25, and at 10 percent if the true concentration is between 25 and 100.The Type II error is understood as making a decision not to take action to solve an environmentalproblem (e.g., to remediate) when that action was in fact required (e.g., analyte concentrationsare really above an action level). The desired limit on the probability of making a Type II error isset at 10 percent if the true concentrations is between 125 and 150 and at 5 percent if the trueconcentrations is over 150.
The output of Step 6 is:
� The project planning team�s quantitative measure of tolerable decision error rates based onconsideration of project resources.
PROCEDURE FOR SPECIFYING LIMITS ON DECISION ERRORS�AN EXAMPLE
Decisionmakers are interested in knowing the true state of some parameter for which action maybe proposed. In Step 5 of the DQO process, the parameter, the action level, and the alternativeactions were specified in a decision rule. But, decisionmakers cannot positively know the truestate because there will always be the potential for uncertainty in estimating the parameter fromdata. There will be sampling uncertainty, due to spatial and temporal variability in concentrationsacross the site and from one sample to the next. There will also be analytical measurementuncertainty due to the variability in the measurement process itself. Since it is impossible toeliminate uncertainty, basing decisions on measurement data opens the possibility of making adecision error. Recognizing that decision errors are possible because of uncertainty is the firststep in controlling them.

The Data Quality Objectives Process
B-12MARLAP JULY 2004
As an example problem, suppose that a decision must be made about whether or not a particularsurvey unit at a site meets established criteria for residual radioactivity concentrations. TableB.1(a) shows the two possible decision errors that might occur in deciding whether or not asurvey unit has been remediated sufficiently so that it may be released. The decision will bebased on concentration measurements taken in the survey unit.
As another example problem, suppose that a decision must be made about whether or not asample contains a particular radionuclide. Table B.1(b) shows the two possible decision errorsthat might occur in deciding whether or not a sample contains the radionuclide. The decision willbe based on a measurement taken on the sample.
TABLE B.1 � Possible decision errors(a) For survey unit release
Decision True StateDeciding a survey unit meets the release criterion . . . . . . . . . when it actually does notDeciding a survey unit does not meet the release criterion . . . when it actually does
(b) For radionuclide detectionDecision True State
Deciding a sample contains the radionuclide . . . . . . . . . . . . . when it actually does notDeciding a sample does not contain the radionuclide . . . . . . . when it actually does
The probability of making a decision error can be controlled by the use of statistical hypothesistesting. In statistical hypothesis testing, data are used to select between a chosen baselinecondition (null hypothesis) and an alternative condition. The test can then be used to decide ifthere is sufficient evidence to indicate that the baseline condition is unlikely and that thealternative condition is more consistent with the data. Actions appropriate to the alternativeconditions would then be appropriate. Otherwise, the default baseline condition remains in placeas the basis for decisions and actions. The burden of proof is placed on rejecting the baselinecondition. The structure of statistical hypothesis testing maintains the baseline condition as beingtrue until significant evidence is presented to indicate that the baseline condition is not true.
The selection of the baseline condition is important to the outcome of the decision process. Thesame set of sample data from a survey unit might lead to different decisions depending on what ischosen as the baseline condition.
In deciding if a sample analyzed for a particular radionuclide actually contains that radionuclide,the two possibilities for the baseline condition are:
1) The sample contains the radionuclide, or 2) The sample does not contain the radionuclide.

The Data Quality Objectives Process
1 Condition 1 could only be used if it were phrased in reference to a particular concentration, e.g. the samplecontains the radionuclide in concentration in excess of x pCi/g. Condition 2 implies a concentration of zero.
B-13JULY 2004 MARLAP
In this instance, suppose Condition 2, the sample does not contain the radionuclide, is taken asthe baseline.1 The measurement result must be high in order to dismiss the assumption that thesample does not contain the radionuclide. If the measurement is high enough, it is no longercredible that the sample does not contain the radionuclide. Therefore it will be decided that thesample does contain the radionuclide. The framework of statistical hypothesis testing allows oneto quantify what is meant by �high enough� and �no longer credible.� The measurement valuethat is considered just �high enough� that the baseline is �no longer credible� is called the�critical value.� The baseline condition is called the �null hypothesis,� usually denoted H0. Thealternate condition is called the alternative hypothesis, usually denoted H1 or HA.
Note that if a poor measurement is made�for example, if the sample containing a concentrationnear the minimum detectable concentration (MDC) is not counted as long as specified in thestandard operating procedures�it will be less likely that a result that is clearly above thevariability in the measurement of a blank sample will be obtained. Thus, it will be less likely thata sample with a concentration of the radionuclide near the MDC will be detected with greaterthan the 95 percent probability that is usually specified in MDC calculations. This is anotherconsequence of the structure of statistical hypothesis testing that maintains the baseline conditionuntil convincing evidence is found to the contrary. Poor or insufficient data often will result inthe null hypothesis being retained even when it is not true. In choosing the baseline condition, it is usually prudent to consider which condition will causethe least harm if it is the one that is acted upon, even if it is not true. This is because the baselinewill continue to be assumed true unless the data are clearly in conflict with it.
In deciding if a survey unit meets the release criteria for a particular radionuclide, the twopossibilities for the baseline condition are:
1) The survey unit does not meet the release criteria, or2) The survey unit meets the release criteria.
Condition 1 is usually taken as the baseline. This means that the measurement result must be lowin order to dismiss the assumption that the survey unit does not meet the release criteria. If themeasurement is low enough, it is no longer credible. Therefore it will be decided that the surveyunit does meet the release criteria. Again, the framework of statistical hypothesis testing allowsone to quantify what is meant by �low enough� and �no longer credible.� The null hypothesis,H0., is that the survey unit does not meet the release criteria; the alternative hypothesis, HA, is thesurvey unit does meet the release criteria. By phrasing the null hypothesis this way, the benefit ofperforming a good survey is that it will be more likely that a survey unit that should be released
The Data Quality Objectives Process
B-14MARLAP JULY 2004
will be released. On the other hand, a poor survey will generally result in retaining theassumption that the release criterion has not been met even if it has. This arrangement providesthe proper incentive for good survey work. The term �Type I error� is assigned to the decision error made by concluding the null hypothesisis not true, when it actually is true. The term �Type II error� is assigned to the decision errormade by concluding the null hypothesis is true, when it actually is not true. The possibility of adecision error can never be totally eliminated, but it can be controlled.
When the decision is to be based on comparing the average of a number of measurements fromsamples taken over some specified area, sampling uncertainty can be reduced by collecting alarger number of samples. Measurement uncertainty can be reduced by analyzing individualsamples several times or using more precise laboratory methods. Which uncertainty is moreeffective to control depends on their relative magnitude. For much environmental work,controlling the sampling uncertainty error by increasing the number of field samples is usuallymore effective than controlling measurement uncertainty by repeated radiochemical analyses.
One thing is certain, however, that reducing decision errors requires the expenditure of moreresources. Drastically controlling decision error probabilities to extremely small values may beunnecessary for making a reasonable decision. If the consequences of a decision error are minor,a reasonable decision might be made based on relatively crude data. On the other hand, if theconsequences of a decision error are severe, sampling and measurement uncertainty should becontrolled as much as reasonably possible. How much is enough? It is up to the decisionmakerand the planning team to decide how much control is enough. They must specify tolerable limitson the probabilities for decision errors. If necessary, efforts to reduce sampling and measurementuncertainty to meet these specified limits can then be investigated.
Throughout the remainder of this example, the decision to be made is going to be based oncomparing the average of a number of measurements from samples taken over a specific area to apre-determined limit. The goal of the decisionmaker and planning team is to design a samplingplan that controls the chance of making a decision error to a tolerable level. The strategy outlinedbelow can be used to specify limits on decision errors:
I. Determine the potential range of the parameter of interest.
II. Choose the null hypothesis and identify the Type I and Type II decision errors.
III. Specify a range of concentrations where the consequences of decision errors are relativelyminor.
IV. Assign tolerable decision error rates outside of the range specified in III.

The Data Quality Objectives Process
B-15JULY 2004 MARLAP
Prob
abilit
y of
Dec
isio
n Er
ror
0.0
0.2
0.4
0.6
0.8
1.0
50403020100True Mean Value of X (Mean Concentration, pCi/g)
Range ofParameterof InterestFIGURE B.3 � Plot is made showing the range of the parameter
of interest on the x-axis
I. DETERMINE POTENTIAL RANGE OF THE PARAMETER OF INTEREST
Establish the range of average concentrations likely to be encountered in the survey unit. Onemust have some idea of the concentration range in order to specify the type of analysis to be doneand the sensitivity it must have. It is also the starting point for deciding what differences inconcentration are important to detect.
In the example shown in FigureB.3, the project planning teamconsiders a range of feasibleconcentrations for the radio-nuclide to be between 0�50pCi/g. This is based on priorexperience of the site, scoping,characterization, andremediation-control survey data.
II. CHOOSE THE NULLHYPOTHESIS AND IDENTIFYDECISION ERRORS
The decision rule states that theaction level will be 30 pCi/g forthe radionuclide. The projectplanning team states the null hypothesis as�
H0: The survey unit concentration exceeds the action level.
The corresponding decision errors are defined as in Table B.2.
TABLE B.2 � Example of possible decision errors with null hypothesis that the averageconcentration in a survey unit is above the action level
Decision True State Consequences ProbabilityDeciding a survey unit isbelow the action level...
...when it actually is abovethe action level (H0).
Type I error α
Deciding a survey unit isabove the action level...
...when it actually is belowthe action level (HA). Type II error β

The Data Quality Objectives Process
B-16MARLAP JULY 2004
0.0
0.2
0.4
0.6
0.8
1.0
50403020100True Mean Value of X (Mean Concentration, pCi/g)
0.0
0.2
0.4
0.6
0.8
1.0
50403020100True Mean Value of X (Mean Concentration, pCi/g)
Below AL (H0 not true)
Above AL(H0 true)
Action Level
Prob
abilit
y of
Dec
isio
n Er
ror
Type II errors can occur when the true concentration is below the action level.
Type I errorscan occurwhen the trueconcentrationis above theaction level.
FIGURE B.4 � A line showing the action level, the type ofdecision error possible at a given value of the true
concentration, and a y-axis showing the acceptable limits onmaking a decision error have been added to Figure B.3
Now that a null hypothesis has been chosen, the meaning of a Type I and a Type II decision erroris also defined. In Figure B.4, a line is added showing the action level. A Type I error occurswhen the null hypothesis is incorrectly rejected. This means that it is decided that a survey unitwith a true mean concentrationabove the action level may bereleased. This is the only kind ofdecision error that can occur if thetrue concentration is at or abovethe action level. A Type II erroroccurs when the null hypothesis isnot rejected when it is false. Thismeans that it is decided that asurvey unit with a true meanconcentration below the actionlevel may not be released. This isthe only kind of decision errorthat can occur if the trueconcentration is below the actionlevel. The type of decision errorpossible at a given value of thetrue concentration is shown, and ay-axis for displaying controllimits on making decision errors,once they have been specified by the project planning team, are also shown in Figure B.4.
III. SPECIFY A RANGE OF CONCENTRATIONS WHERE THE CONSEQUENCES OF DECISION ERRORSARE RELATIVELY MINOR
The gray region, or region of uncertainty, indicates an area where the consequences of a Type IIdecision error are relatively minor. It may not be reasonable to attempt to control decision errorswithin the gray area. The resources expended to distinguish small differences in concentrationcould well exceed the costs associated with making the decision error.
In this example, the question is whether it would really make a major difference in the actiontaken if the concentration is called 30 pCi/g when the true value is 26 or even 22 pCi/g. If not,the gray region might extend from 20 to 30 pCi/g . This is shown in Figure B.5.
The width of the gray region reflects the decisionmaker�s concern for Type II decision errors nearthe action level. The decisionmaker should establish the gray region by balancing the resourcesneeded to �make a close call� versus the consequences of making a Type II decision error. Thecost of collecting data sufficient to distinguish small differences in concentration could exceedthe cost of making a decision error. This is especially true if the consequences of the error are
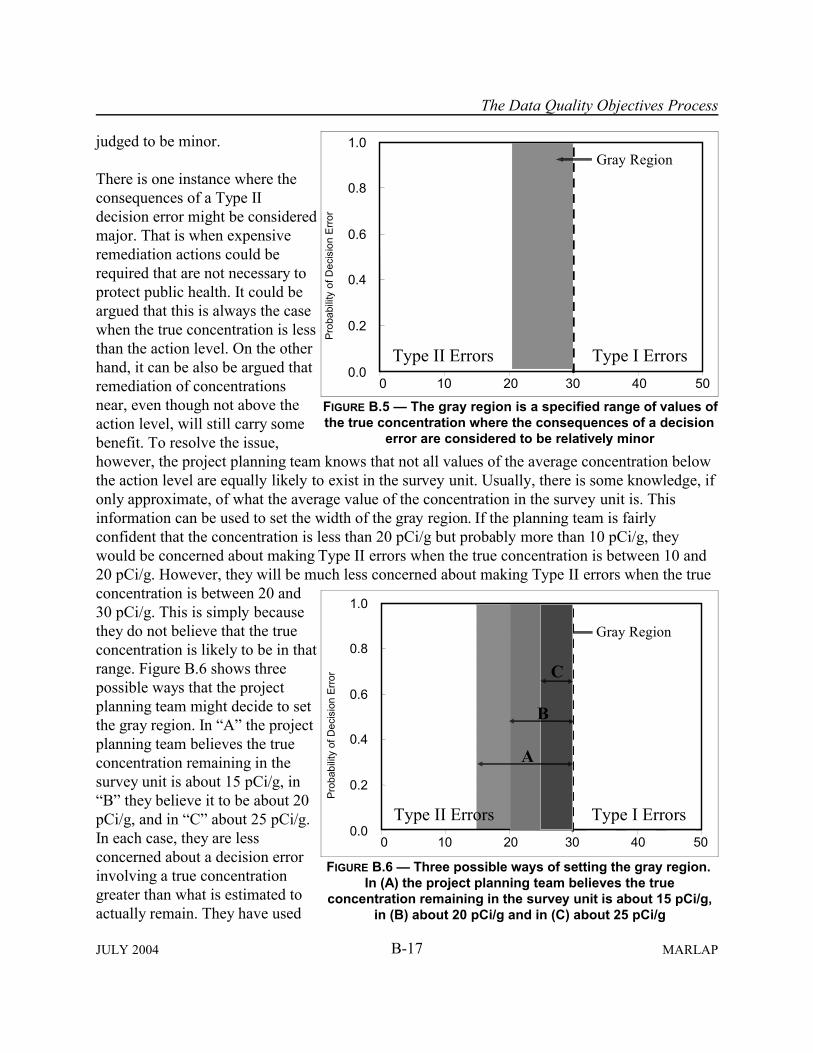
The Data Quality Objectives Process
B-17JULY 2004 MARLAP
Prob
abili
ty o
f Dec
isio
n Er
ror
0.0
0.2
0.4
0.6
0.8
1.0
50403020100
Type II Errors Type I Errors
Gray Region
FIGURE B.5 � The gray region is a specified range of values ofthe true concentration where the consequences of a decision
error are considered to be relatively minor
������������������������������������������������������������������������������������������������������������������������������������������������������������������������������������������������������������������������������������������������������������������������������������������������������������������������������������������������������������������������������������������������������������������������������������������������������������������������������������������������������������������������������������������������������������������������������������������������������������������������������������������������
Prob
abilit
y of
Dec
isio
n Er
ror
0.0
0.2
0.4
0.6
0.8
1.0
50403020100
��������������������������������������������������������������������������������������������������������������������������������������������������������������������������������������������������������������������������������������������������������������������������������������������������������������������������������������������������������������������������������������������������������������������������������Type II Errors Type I Errors
Gray Region
��������������������������������������������������������������������������������������������������������������������������������������������������������������������������������������������������������������������������������
C
B
A
FIGURE B.6 � Three possible ways of setting the gray region.In (A) the project planning team believes the true
concentration remaining in the survey unit is about 15 pCi/g,in (B) about 20 pCi/g and in (C) about 25 pCi/g
judged to be minor.
There is one instance where theconsequences of a Type IIdecision error might be consideredmajor. That is when expensiveremediation actions could berequired that are not necessary toprotect public health. It could beargued that this is always the casewhen the true concentration is lessthan the action level. On the otherhand, it can be also be argued thatremediation of concentrationsnear, even though not above theaction level, will still carry somebenefit. To resolve the issue,however, the project planning team knows that not all values of the average concentration belowthe action level are equally likely to exist in the survey unit. Usually, there is some knowledge, ifonly approximate, of what the average value of the concentration in the survey unit is. Thisinformation can be used to set the width of the gray region. If the planning team is fairlyconfident that the concentration is less than 20 pCi/g but probably more than 10 pCi/g, theywould be concerned about making Type II errors when the true concentration is between 10 and20 pCi/g. However, they will be much less concerned about making Type II errors when the trueconcentration is between 20 and30 pCi/g. This is simply becausethey do not believe that the trueconcentration is likely to be in thatrange. Figure B.6 shows threepossible ways that the projectplanning team might decide to setthe gray region. In �A� the projectplanning team believes the trueconcentration remaining in thesurvey unit is about 15 pCi/g, in�B� they believe it to be about 20pCi/g, and in �C� about 25 pCi/g.In each case, they are lessconcerned about a decision errorinvolving a true concentrationgreater than what is estimated toactually remain. They have used
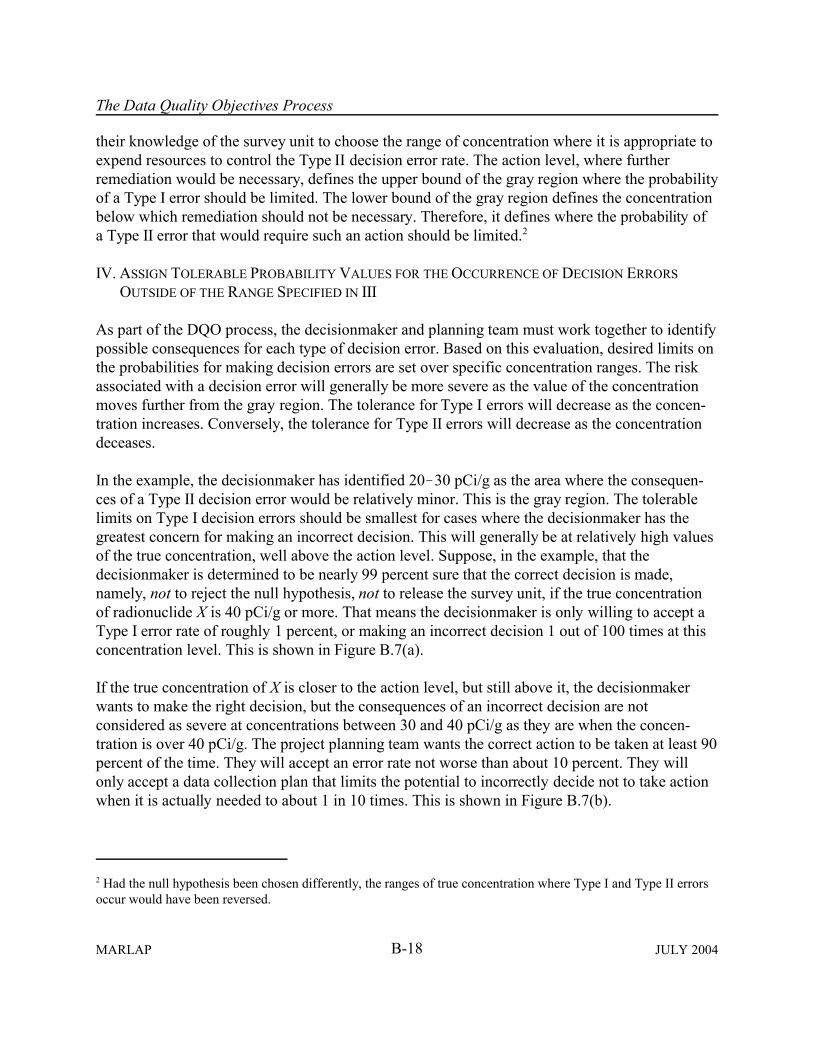
The Data Quality Objectives Process
2 Had the null hypothesis been chosen differently, the ranges of true concentration where Type I and Type II errorsoccur would have been reversed.
B-18MARLAP JULY 2004
their knowledge of the survey unit to choose the range of concentration where it is appropriate toexpend resources to control the Type II decision error rate. The action level, where furtherremediation would be necessary, defines the upper bound of the gray region where the probabilityof a Type I error should be limited. The lower bound of the gray region defines the concentrationbelow which remediation should not be necessary. Therefore, it defines where the probability ofa Type II error that would require such an action should be limited.2
IV. ASSIGN TOLERABLE PROBABILITY VALUES FOR THE OCCURRENCE OF DECISION ERRORSOUTSIDE OF THE RANGE SPECIFIED IN III
As part of the DQO process, the decisionmaker and planning team must work together to identifypossible consequences for each type of decision error. Based on this evaluation, desired limits onthe probabilities for making decision errors are set over specific concentration ranges. The riskassociated with a decision error will generally be more severe as the value of the concentrationmoves further from the gray region. The tolerance for Type I errors will decrease as the concen-tration increases. Conversely, the tolerance for Type II errors will decrease as the concentrationdeceases.
In the example, the decisionmaker has identified 20!30 pCi/g as the area where the consequen-ces of a Type II decision error would be relatively minor. This is the gray region. The tolerablelimits on Type I decision errors should be smallest for cases where the decisionmaker has thegreatest concern for making an incorrect decision. This will generally be at relatively high valuesof the true concentration, well above the action level. Suppose, in the example, that thedecisionmaker is determined to be nearly 99 percent sure that the correct decision is made,namely, not to reject the null hypothesis, not to release the survey unit, if the true concentrationof radionuclide X is 40 pCi/g or more. That means the decisionmaker is only willing to accept aType I error rate of roughly 1 percent, or making an incorrect decision 1 out of 100 times at thisconcentration level. This is shown in Figure B.7(a).
If the true concentration of X is closer to the action level, but still above it, the decisionmakerwants to make the right decision, but the consequences of an incorrect decision are notconsidered as severe at concentrations between 30 and 40 pCi/g as they are when the concen-tration is over 40 pCi/g. The project planning team wants the correct action to be taken at least 90percent of the time. They will accept an error rate not worse than about 10 percent. They willonly accept a data collection plan that limits the potential to incorrectly decide not to take actionwhen it is actually needed to about 1 in 10 times. This is shown in Figure B.7(b).

The Data Quality Objectives Process
B-19JULY 2004 MARLAP
0.0
0.2
0.4
0.6
0.8
1.0
50403020100
Type II Errors Type I Errors
����������������������������������������������������
������������������������������������������������������������������������������������������������������������ 1%
10%20%
5%Pr
obab
ility
of D
ecis
ion
Erro
r
��������������������������
������������������������������������������������������������������������������
(a)
(d)(c) (b)
FIGURE B.7 � Example decision performance goal diagram
The decisionmaker and projectplanning team are also concernedabout wasting resources bycleaning up sites that do notrepresent any substantial risk.Limits of tolerable probability areset low for extreme Type II errors,i.e. failing to release a survey unitwhen the true concentration is farbelow the gray region and theaction level. They want to limitthe chances of deciding to takeaction when it really is not neededto about 1 in 20 if the true con-centration is less than 10 pCi/g.This is shown in Figure B.7(c).
They are more willing to accept higher decision error rates for concentrations nearer to the grayregion. After all, there is some residual risk that will be avoided even though the concentration isbelow the action level. A Type II error probability limit of 20 percent in the 10!20 pCi/g range isagreed upon. They consider this to be an appropriate transition between a range of concentrationswhere Type II errors are of great concern (<10 pCi/g) to a range where Type II errors are of littleconcern. The latter is, by definition, the gray region, which is 20!30 pCi/g in this case . Thechance of taking action when it is not needed within the range 10!20 pCi/g is set at roughly 1 in5. This is shown in Figure B.7(d).
Once the limits on both types of decision error rates have been specified, the information can bedisplayed on a decision performance goal diagram, as shown in Figure B.7, or made into adecision error limits table, as shown in Table B.3. Both are valuable tools for visualizing andevaluating proposed limits for decision errors.
TABLE B.3 � Example decision error limits table
True Concentration Correct DecisionTolerable Probability of Making
a Decision Error0 � 10 pCi/g Does not exceed 5%10 � 20 pCi/g Does not exceed 20%
20 � 30 pCi/g Does not exceed gray region: decision errorprobabilities not controlled
30 � 40 pCi/g Does exceed 10%40 � 50 pCi/g Does exceed 1%

The Data Quality Objectives Process
B-20MARLAP JULY 2004
1.0
0.0
0.2
0.4
0.6
0.8
50403020100True Mean Value of X (Mean Concentration, pCi/g)
Pow
er
��������������������������
���������������������������������������������������������������������������
��������������������������������������������������
������������������������������������������������������������������������������������������������������������
Power =1-Type II Error Probability
= 1 - βType I Error Probability
= α
FIGURE B.8 � A power curve constructed from the decisionperformance goal diagram in Figure B.7
There are no fixed rules for identifying at what level the decisionmaker and project planningteam should be willing to tolerate the probability of decision errors. As a guideline, as thepossible true values of the parameter of interest move closer to the action level, the tolerance fordecision errors usually increases. As the severity of the consequences of a decision errorincreases, the tolerance decreases.
The ultimate goal of the DQO process is to identify the most resource-effective study design thatprovides the type, quantity, and quality of data needed to support defensible decisionmaking. Thedecisionmaker and planning team must evaluate design options and select the one that providesthe best balance between cost and the ability to meet the stated DQOs.
A statistical tool known as an estimated power curve can be extremely useful when investigatingthe performance of alternative survey designs. The probability that the null hypothesis is rejectedwhen it should be rejected iscalled the statistical power of ahypothesis test. It is equal to oneminus the probability of a Type IIerror (1!β). In the example, thenull hypothesis is false wheneverthe true concentration is less thanthe action level. Figure B.8 showsthe power diagram constructedfrom Figure B.7 by replacing thedesired limits on Type II errorprobabilities, β, with the power,1!β. The desired limits on Type Ierror probabilities, α, are carriedover without modification, as isthe gray region. Drawing a smoothdecreasing function through thedesired limits results in thedesired power curve. A decision performance goal diagram with an estimated power curve canhelp the project planning team visually identify information about a proposed study design.
Statisticians can determine the number of measurements needed for a proposed survey designfrom four values identified on the decision performance goal diagram:
(1) The tolerable limit for the probability of making Type I decision errors, α, at the actionlevel AL).
(2) The tolerable limit for the probability of making Type II decision errors, β, along the
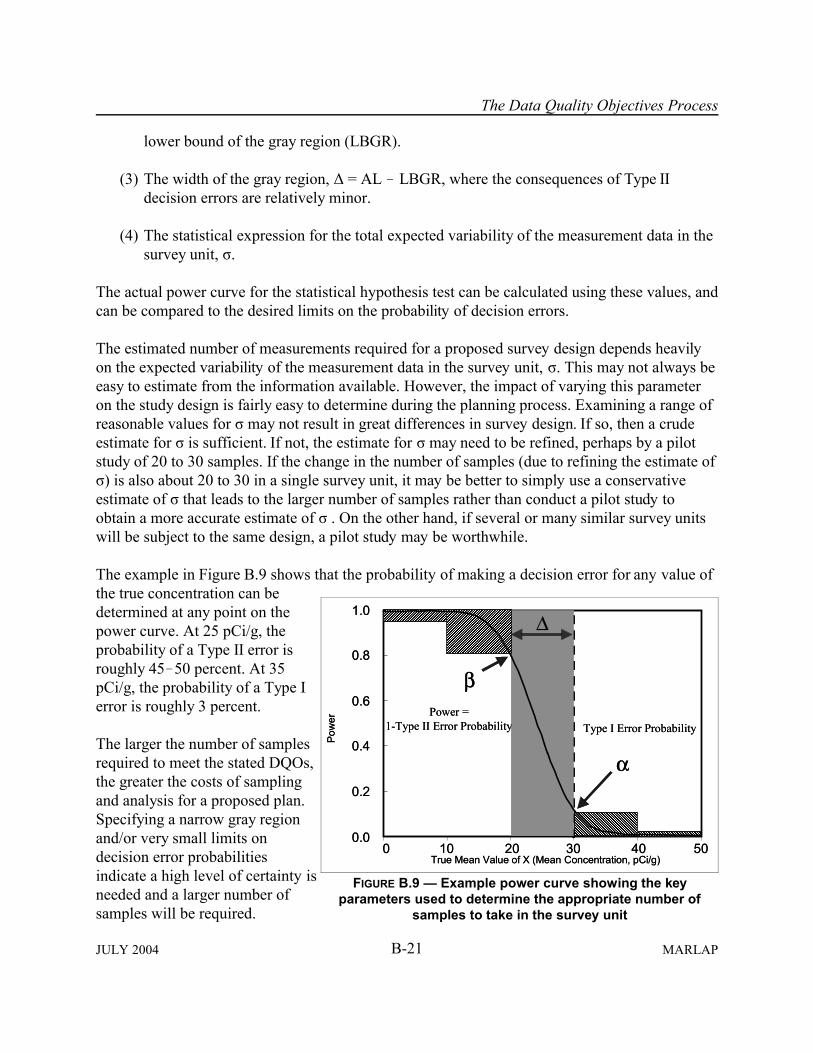
The Data Quality Objectives Process
B-21JULY 2004 MARLAP
1.0
0.0
0.2
0.4
0.6
0.8
50403020100True Mean Value of X (Mean Concentration, pCi/g)
Pow
er
����������������������������������������������������������������������������
����������������������������������������������������������������������������������������������������������
β
∆
α
Power =1-Type II Error Probability Type I Error Probability
FIGURE B.9 � Example power curve showing the keyparameters used to determine the appropriate number of
samples to take in the survey unit
lower bound of the gray region (LBGR).
(3) The width of the gray region, ∆ = AL ! LBGR, where the consequences of Type IIdecision errors are relatively minor.
(4) The statistical expression for the total expected variability of the measurement data in thesurvey unit, σ.
The actual power curve for the statistical hypothesis test can be calculated using these values, andcan be compared to the desired limits on the probability of decision errors.
The estimated number of measurements required for a proposed survey design depends heavilyon the expected variability of the measurement data in the survey unit, σ. This may not always beeasy to estimate from the information available. However, the impact of varying this parameteron the study design is fairly easy to determine during the planning process. Examining a range ofreasonable values for σ may not result in great differences in survey design. If so, then a crudeestimate for σ is sufficient. If not, the estimate for σ may need to be refined, perhaps by a pilotstudy of 20 to 30 samples. If the change in the number of samples (due to refining the estimate ofσ) is also about 20 to 30 in a single survey unit, it may be better to simply use a conservativeestimate of σ that leads to the larger number of samples rather than conduct a pilot study toobtain a more accurate estimate of σ . On the other hand, if several or many similar survey unitswill be subject to the same design, a pilot study may be worthwhile.
The example in Figure B.9 shows that the probability of making a decision error for any value ofthe true concentration can bedetermined at any point on thepower curve. At 25 pCi/g, theprobability of a Type II error isroughly 45!50 percent. At 35pCi/g, the probability of a Type Ierror is roughly 3 percent.
The larger the number of samplesrequired to meet the stated DQOs,the greater the costs of samplingand analysis for a proposed plan.Specifying a narrow gray regionand/or very small limits ondecision error probabilitiesindicate a high level of certainty isneeded and a larger number ofsamples will be required.

The Data Quality Objectives Process
B-22MARLAP JULY 2004
Specifying a wide gray region and/or larger limits on decision error probabilities indicates alower level of certainty is required. A smaller number of samples will be necessary. The requiredlevel of certainty should be consistent with the consequences of making decision errors balancedagainst the cost in numbers of samples to achieve that level of certainty.
If a proposed survey design fails to meet the DQOs within constraints, the decisionmaker andplanning team may need to consider:
� ADJUSTING THE ACCEPTABLE DECISION ERROR RATES. For example, the decisionmaker maybe unsure what probabilities of decision error are acceptable. Beginning with extremelystringent decision error limits with low risk of making a decision error may require anextremely large number of samples at a prohibitive cost. After reconsidering the potentialconsequences of each type of decision error, the decisionmaker and planning team may beable to relax the tolerable rates.
� ADJUST THE WIDTH OF THE GRAY REGION. Generally, an efficient design will result when therelative shift, ∆/σ, lies between the values of 1 and 3. A narrow gray region usually meansthat the proposed survey design will require a large number of samples to meet the specifiedDQOs. By increasing the number of samples, the chances of making a Type II decision erroris reduced, but the potential costs have increased. The wider the gray region, the less stringentthe DQOs. Fewer samples will be required, costs will be reduced but the chances of making aType II decision error have increased. The relative shift, ∆/σ, depends on the width of thegray region, ∆, and also on the estimated data variability, σ. Better estimates of either or bothmay lead to a more efficient survey design. In some cases it may be advantageous to try toreduce σ by using more precise measurement methods or by forming more spatiallyhomogeneous survey units, i.e. adjusting the physical boundaries of the survey units so thatthe anticipated concentrations are more homogeneous with them.
B.3.8 DQO Process Step 7: Optimize the Design for Obtaining Data
By the start of Step 7, the project planning team has established their priority of concerns, thedefinition of the problem, the decision or outcome to address the posed problem, the inputs andboundaries, and the tolerable decision error rates. They have also agreed on decision rules thatincorporate all this information into a logic statement about what action to take in response to thedecision. During Step 7, the hard decisions are made between the planning team�s desire to havemeasurements with greater certainty and the reality of the associated resource needs (time, cost,etc.) for obtaining that certainty. Another viewpoint of this process is illustrated in AttachmentB1. The application of this process to MDC calculations is given in Attachment B2.
During Step 7, the project planning team optimizes the sampling and analytical design andestablishes the measurement quality objectives (MQOs) so the resulting data will meet all theestablished constraints in the most resource-effective manner. The goal is to determine the most

The Data Quality Objectives Process
B-23JULY 2004 MARLAP
efficient design (combination of sample type, sample number and analytical procedures) to meetall the constraints established in the previous steps. Once the technical specialists and the rest ofthe project planning team come to agreement about the sampling and analysis design, theoperational details and theoretical assumptions of the selected design should be documented.
If a proposed design cannot be developed to meet the limits on decision error rates within budgetor other constraints, then the project planning team will have to consider relaxing the errortolerance, adjusting the width of the gray region, redefining the scale of decision, or committingmore funding. There is always a trade off among quality, cost, and time. The project planningteam will need to develop a consensus on how to balance resources and data quality. If theproposed design requires analysis using analytical protocols not readily available, the projectplanning team must consider the resources (time and cost) required to develop and validate amethod, generate method detection limits relevant to media of concern, and develop appropriateQA/QC procedures and criteria (Chapter 6, Selection and Application of an Analytical Method).
If the project entails a preliminary investigation of a site or material for which little is known, theplanners may choose to employ MQOs and requirements that typically are achieved by theselected sampling and analytical procedures. At this early point in the project, the lack of detailedknowledge of the site or material may postpone the need for the extra cost of more expensivesampling and analytical procedures and large numbers of samples, until more site or materialknowledge is acquired. The less-demanding MQOs, however, should be adequate to furtherdefine the site or material. For situations when the measured values are distant from an actionlevel the MQO-compliant data could also be sufficient to support the project decision.
The planning of data collection activities typically is undertaken to determine if a characteristicof an area or item does or does not exist above an action level. Since the area of interest (popula-tion) is usually too large to be submitted to analyses, in its entirety, these data collection activitiesgenerally include sampling. If sampling is done correctly, the field sample or set of field sampleswill represent the characteristics of interest and, if analyzed properly, the information gleanedfrom the samples can be used to make decisions about the larger area. However, if errors occurduring implementation of the project, the samples and associated data may not accurately reflectthe material from which the samples were collected and incorrect decisions could be made.
The planning team attempts to anticipate, quantify, and minimize the uncertainty in decisionsresulting from imprecision, bias, and blunders�in other words, attempts to manage uncertaintyby managing its sources. The effort expended in managing uncertainty is project dependent anddepends upon what constitutes an acceptable level of decision uncertainty and the proximity ofthe data to a decision point. For example, Figure B.10(a) presents a situation where the data havesignificant variability. Yet the variability of the data does not materially add to the uncertainty ofthe decision since the measurements are so far removed from the action level. More resourcescould be expended to control the variability. However, the additional expenditure would beunnecessary, since they would not alter the decision or measurably increase confidence in thedecision.

The Data Quality Objectives Process
B-24MARLAP JULY 2004
Concentration
ActionLevel
Mean
Freq
uenc
y of
Occ
urre
nce
Concentration
ActionLevel
Mean
Freq
uenc
y of
Occ
urre
nce
(a)
(b)
Figure B.10 � How proximity to the action leveldetermines what is an acceptable level of
uncertainty
In contrast, Figure B.10(b) depicts data withrelatively little variability, yet this level ofvariability is significant since the measureddata are adjacent to the action level, whichresults in increased uncertainty in thedecision. Depending upon the consequencesof an incorrect decision, it may be advisableto expend more resources with the intentionof increasing confidence in the decision.
The outputs of Step 7 are:
� The most resource-effective design forsampling and analysis that will obtainthe specific amount and quality of dataneeded to resolve the problem withinthe defined constraints; and
� Detailed plans and criteria for dataassessment.
B.4 References
American National Standards Institute (ANSI) N42.23. American National Standard Measure-ment and Associated Instrument Quality Assurance for Radioassay Laboratories. 2003.
American Society for Testing and Materials (ASTM) D5283. Standard Practice for Generationof Environmental Data Related to Waste Management Activities: Quality Assurance andQuality Control Planning and Implementation. 1992.
American Society for Testing and Materials (ASTM) D5792. Standard Practice for Generationof Environmental Data Related to Waste Management Activities: Development of DataQuality Objectives, 1995.
American Society for Testing and Materials (ASTM) D6051. Standard Guide for CompositeSampling and Field Subsampling for Environmental Waste Management Activities. 1996.
Bottrell, D., S. Blacker, and D. Goodman. 1996a. �Application of Decision Theory Methods tothe Data Quality Objectives Process.� In, Proceedings of the Computing in EnvironmentalResource Management Conference, Air and Waste Management Association.
The Data Quality Objectives Process
B-25JULY 2004 MARLAP
Bottrell, D., N. Wentworth, S. Blacker, and D. Goodman. 1996b. �Improvements to SpecifyingLimits on Decision Errors in the Data Quality Objectives Process.� In, Proceedings of theComputing in Environmental Resource Management Conference, Air and WasteManagement Association.
U.S. Environmental Protection Agency (EPA). 1986. Development of Data Quality Objectives,Description of Stages I and II. Washington, DC.
U.S. Environmental Protection Agency (EPA). 2000. Guidance for the Data Quality ObjectiveProcess (EPA QA/G-4). EPA/600/R-96/055, Washington, DC. Available at www.epa.gov/quality1/qa_docs.html.
MARSSIM. 2000. Multi-Agency Radiation Survey and Site Investigation Manual, Revision 1.NUREG-1575 Rev 1, EPA 402-R-97-016 Rev1, DOE/EH-0624 Rev1. August. Available atwww.epa.gov/radiation/marssim/.
U.S. Nuclear Regulatory Commission (NRC). 1998. A Nonparametric Statistical Methodologyfor the Design and Analysis of Final Status Decommissioning Surveys. NUREG-1505, Rev.1.

B-26MARLAP JULY 2004
0 0.2 0.4 0.6 0.8 1 1.2 1.4 1.6 1.8 2
Conce ntra tion
FIGURE B1.1 � The action level is 1.0
ATTACHMENT B1Decision Error Rates and the Gray Region for DecisionsAbout Mean Concentrations
B1.1 Introduction
This attachment presents additional information on decision error rates and the gray region. Theproject planning team will need to specify a range of possible values where the consequences ofdecision errors are relatively minor�the �gray region.� Specifying a gray region is necessarybecause variability in the population and imprecision in the measurement system combine toproduce variability in the data such that the decision may be �too close to call� when the truevalue is very near the action level. The gray region establishes the minimum separation from theaction level, where it is most important that the project planning team control Type II errors.
B1.2 The Region of Interest
The first step in constructing thegray region is setting the range ofconcentrations that is a region ofinterest (a range of possible values).This normally means defining thelowest and highest average concen-trations at which the contaminant isexpected to exist. Usually there is anaction level (such as the derivedconcentration guideline level,DCGL, a regulatory limit) thatshould not be exceeded. If theproject planning team wants amethod to measure sample concen-trations around this level, they would not select one that worked at concentrations at 10 to 100times the action level, nor would they select one that worked from zero to half the action level.They would want a method that worked well around the action level�perhaps from 0.1 to 10times the action level, or from one-half to two times the action level. For the purpose of theexample in this attachment, the action level is 1.0 and the project planning team selected a regionof interest that is zero to twice the action level (0�2), as shown on the x-axis in Figure B1.1.
B1.3 Measurement Uncertainty at the Action Level
The action level marks the concentration level that the project planning team must be able todistinguish. The project planning team wants to be able to tell if the measured concentration is
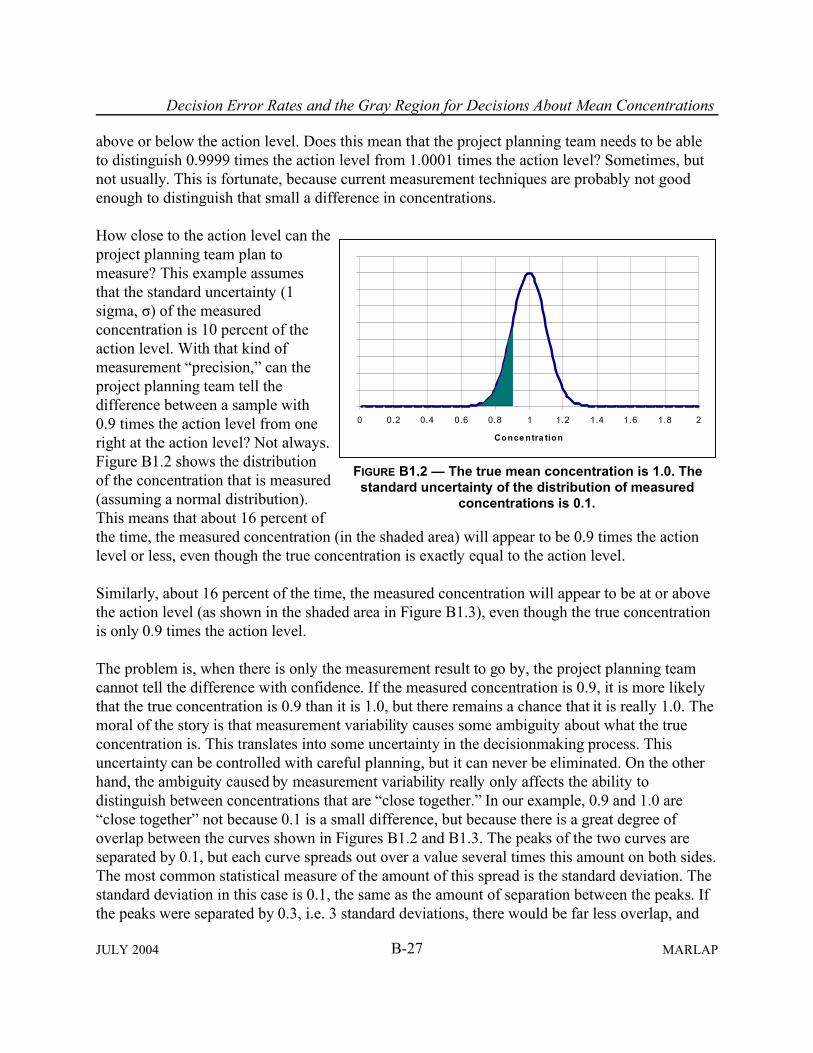
Decision Error Rates and the Gray Region for Decisions About Mean Concentrations
B-27JULY 2004 MARLAP
0 0.2 0.4 0.6 0.8 1 1.2 1.4 1.6 1.8 2
Conce ntra tion
FIGURE B1.2 � The true mean concentration is 1.0. Thestandard uncertainty of the distribution of measured
concentrations is 0.1.
above or below the action level. Does this mean that the project planning team needs to be ableto distinguish 0.9999 times the action level from 1.0001 times the action level? Sometimes, butnot usually. This is fortunate, because current measurement techniques are probably not goodenough to distinguish that small a difference in concentrations.
How close to the action level can theproject planning team plan tomeasure? This example assumesthat the standard uncertainty (1sigma, σ) of the measuredconcentration is 10 percent of theaction level. With that kind ofmeasurement �precision,� can theproject planning team tell thedifference between a sample with0.9 times the action level from oneright at the action level? Not always.Figure B1.2 shows the distributionof the concentration that is measured(assuming a normal distribution).This means that about 16 percent ofthe time, the measured concentration (in the shaded area) will appear to be 0.9 times the actionlevel or less, even though the true concentration is exactly equal to the action level.
Similarly, about 16 percent of the time, the measured concentration will appear to be at or abovethe action level (as shown in the shaded area in Figure B1.3), even though the true concentrationis only 0.9 times the action level.
The problem is, when there is only the measurement result to go by, the project planning teamcannot tell the difference with confidence. If the measured concentration is 0.9, it is more likelythat the true concentration is 0.9 than it is 1.0, but there remains a chance that it is really 1.0. Themoral of the story is that measurement variability causes some ambiguity about what the trueconcentration is. This translates into some uncertainty in the decisionmaking process. Thisuncertainty can be controlled with careful planning, but it can never be eliminated. On the otherhand, the ambiguity caused by measurement variability really only affects the ability todistinguish between concentrations that are �close together.� In our example, 0.9 and 1.0 are�close together� not because 0.1 is a small difference, but because there is a great degree ofoverlap between the curves shown in Figures B1.2 and B1.3. The peaks of the two curves areseparated by 0.1, but each curve spreads out over a value several times this amount on both sides.The most common statistical measure of the amount of this spread is the standard deviation. Thestandard deviation in this case is 0.1, the same as the amount of separation between the peaks. Ifthe peaks were separated by 0.3, i.e. 3 standard deviations, there would be far less overlap, and

Decision Error Rates and the Gray Region for Decisions About Mean Concentrations
B-28MARLAP JULY 2004
0 0.2 0.4 0.6 0.8 1 1.2 1.4 1.6 1.8 2
Conce ntra tion
FIGURE B1.3 � The true mean concentration is 0.9. Thestandard uncertainty of the distribution of measured
concentrations is 0.1.
0 0.2 0.4 0.6 0.8 1 1.2 1.4 1.6 1.8 2
Conce ntra tion
FIGURE B1.4 � If 0.95 is measured, is the true meanconcentration 1.0 (right) or 0.9 (left)? The standard
uncertainty of the distribution of measured concentrationsis 0.1.
far less ambiguity. There would bevery little uncertainty in decidingwhich curve a single measurementbelonged to, and consequentlywhether the mean was 0.7 or 1.0.
From this discussion, at least twovery important conclusions can bedrawn:
(1) True mean concentrations thatare �very close together� are noteasily distinguished by a singlemeasurement.
(2) A useful way for determining what is meant by �very close together� is by measuring theseparation in concentration in standard deviation units. Concentrations that are one or fewerstandard deviations apart are close together, whereas concentrations that are three or morestandard deviations apart are well separated.
From conclusion (1), it is immediately apparent that no matter how small the measurementvariability is, there must be some separation between the concentration values to be distin-guished. It is not possible to determine whether or not the concentration is on one side or theother of �a bright line� (e.g. above or below the action level). Instead, one must be content topick two concentrations separated by a finite amount and attempt to tell them apart. These twoconcentrations define what is known as the gray region, because one cannot be certain aboutdeciding whether concentrations thatlie between the two boundaries areabove or below the action level. Toillustrate this with the example, ifthe measured concentration is0.95�exactly in the middle of thegray region between the twoconcentrations to be distinguished�it is equally likely that the trueconcentration is 0.9 as it is 1.0(Figure B1.4).
To formalize this process ofdistinguishing whether the trueconcentration is above our upperbound or below our lower bound,
Decision Error Rates and the Gray Region for Decisions About Mean Concentrations
B-29JULY 2004 MARLAP
two hypotheses will be defined and a statistical hypothesis test will be used to decide between thetwo.
B1.4 The Null Hypothesis
How does the project planning team decide whether the true concentration is above or below thegray region? By formulating hypotheses. Suppose it has been decided that it is important todistinguish whether the true mean concentration is above 1.0 or below 0.9. These concentrationsthen correspond to the �upper bound of the gray region� (UBGR) and to the �lower bound of thegray region� (LBGR), respectively.
The project planning team starts by asking which mistake is worse: (1) deciding the trueconcentration is less than the action level when it is actually above, or (2) deciding the trueconcentration is above the action level when it is actually below?
Mistake (1) may result in an increased risk to human health in the general population followingsite release, while mistake (2) may result in increased occupational risks or a waste of resourcesthat might have been used to reduce risks elsewhere.
The way to avoid the �worse mistake� is to assume the worse case is true, i.e., make the worsecase the baseline or null hypothesis. For example, to avoid mistake (1), deciding the trueconcentration is less than the action level when it is actually above, the null hypothesis should bethat the true concentration is above the action level. Only when the data provide convincingevidence to the contrary will it be decided that the true concentration is less than the action level.Borderline cases will default to retaining (not rejecting) the null hypothesis.
Note that while the null hypothesis must be, in fact, either true or false, the data cannot prove thatit is true or false with absolute certainty. When the probability of obtaining the given data issufficiently low under the conditions specified by the null hypothesis, it is evidence to decide thatthe null hypothesis should be rejected. On the other hand, if the null hypothesis is not rejected, itis not the same as proving that the null hypothesis is true. It only means that there was notenough evidence, based on the probability of observing the data obtained, to decide to reject it.
Notice that in Figure B.2 (Section B.3.7 on page B-11), the risk that is elevated in the gray regionis that of making a Type II error. That is, in the gray region, the Type II error rate exceeds thetolerable limit set at the boundary of the gray region. The Type I error rate remains fixed. (It isfixed at exactly the value used to determine the critical value for the statistical test.) A Type IIerror is incorrectly accepting (failing to reject) the null hypothesis when it is false. So anotherway to think about choosing the null hypothesis is to decide which mistake is less tolerable, andframing the null hypothesis so that kind of mistake corresponds to a Type I error (i.e., incorrectlyrejecting the null hypothesis when it is actually true).
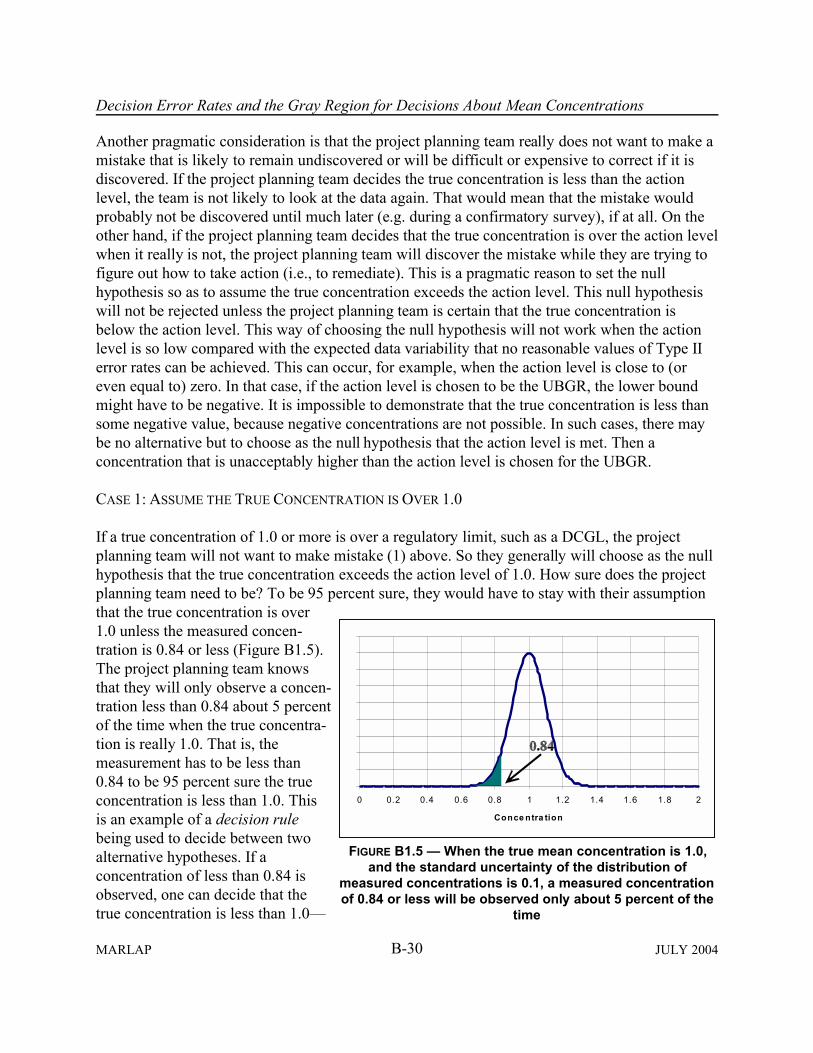
Decision Error Rates and the Gray Region for Decisions About Mean Concentrations
B-30MARLAP JULY 2004
0 0.2 0.4 0.6 0.8 1 1.2 1.4 1.6 1.8 2
Conce ntra tion
FIGURE B1.5 � When the true mean concentration is 1.0,and the standard uncertainty of the distribution of
measured concentrations is 0.1, a measured concentrationof 0.84 or less will be observed only about 5 percent of the
time
Another pragmatic consideration is that the project planning team really does not want to make amistake that is likely to remain undiscovered or will be difficult or expensive to correct if it isdiscovered. If the project planning team decides the true concentration is less than the actionlevel, the team is not likely to look at the data again. That would mean that the mistake wouldprobably not be discovered until much later (e.g. during a confirmatory survey), if at all. On theother hand, if the project planning team decides that the true concentration is over the action levelwhen it really is not, the project planning team will discover the mistake while they are trying tofigure out how to take action (i.e., to remediate). This is a pragmatic reason to set the nullhypothesis so as to assume the true concentration exceeds the action level. This null hypothesiswill not be rejected unless the project planning team is certain that the true concentration isbelow the action level. This way of choosing the null hypothesis will not work when the actionlevel is so low compared with the expected data variability that no reasonable values of Type IIerror rates can be achieved. This can occur, for example, when the action level is close to (oreven equal to) zero. In that case, if the action level is chosen to be the UBGR, the lower boundmight have to be negative. It is impossible to demonstrate that the true concentration is less thansome negative value, because negative concentrations are not possible. In such cases, there maybe no alternative but to choose as the null hypothesis that the action level is met. Then aconcentration that is unacceptably higher than the action level is chosen for the UBGR.
CASE 1: ASSUME THE TRUE CONCENTRATION IS OVER 1.0
If a true concentration of 1.0 or more is over a regulatory limit, such as a DCGL, the projectplanning team will not want to make mistake (1) above. So they generally will choose as the nullhypothesis that the true concentration exceeds the action level of 1.0. How sure does the projectplanning team need to be? To be 95 percent sure, they would have to stay with their assumptionthat the true concentration is over1.0 unless the measured concen-tration is 0.84 or less (Figure B1.5).The project planning team knowsthat they will only observe a concen-tration less than 0.84 about 5 percentof the time when the true concentra-tion is really 1.0. That is, themeasurement has to be less than0.84 to be 95 percent sure the trueconcentration is less than 1.0. Thisis an example of a decision rulebeing used to decide between twoalternative hypotheses. If aconcentration of less than 0.84 isobserved, one can decide that thetrue concentration is less than 1.0�

Decision Error Rates and the Gray Region for Decisions About Mean Concentrations
B-31JULY 2004 MARLAP
0 0.2 0.4 0.6 0.8 1 1.2 1.4 1.6 1.8 2
Conce ntra tion
FIGURE B1.6 � When the true mean concentration is 0.84,and the standard uncertainty of the distribution of
measured concentrations is 0.1, a measured concentrationof 0.84 or less will be observed only about half the time
0 0.2 0.4 0.6 0.8 1 1.2 1.4 1.6 1.8 2
Conce ntra tion
FIGURE B1.7 � When the true mean concentration is 0.68and the standard uncertainty of the distribution of
measured concentrations is 0.1, a measured concentrationover 0.84 will be observed only about 5 percent of the time
i.e., the null hypothesis is rejected. Otherwise, if a concentration over 0.84 is observed, there isnot enough evidence to reject the null hypothesis, and one retains the assumption that the trueconcentration is over 1.0.
But what if the true concentration is0.9 or less? Under the null hypothe-sis, how often will the projectplanning team say that the trueconcentration is over 1.0 when it isreally only 0.84? As seen in FigureB1.6, there is only a 50-50 chance ofmaking the right decision when thetrue concentration really is 0.84.That is the price of being sure theaction level is not exceeded. TheType II error rate, when the trueconcentration is 0.9, is over 50percent.
How low does the true concentrationhave to be in order to have a pretty good chance of deciding that the true concentration is belowthe limit? To be 95 percent sure, the true concentration needs to be twice as far below the actionlevel as the decision point (i.e., critical value), namely at about 0.68. That is, the project planningteam will need a concentration of 0.68 or less to be 95 percent sure that they will be able todecide the true concentration is less than 1.0 (see the unshaded portion in Figure B1.7). The�critical value� (or decision point) is the measured value that divides the measurement resultsinto two different sets: (1) thosevalues that will cause the nullhypothesis to be rejected and(2) those values that will leave thenull hypothesis as the default. Inother words, it is only when the trueconcentration is 0.68 or less that theproject planning team can be prettysure that they will decide the trueconcentration is less than 1.0. Noticethat the project planning team couldchange the decision rule. Forexample, they could decide that ifthe measured concentration is lessthan 0.9, they will reject the nullhypothesis. Examining Figures B1.2
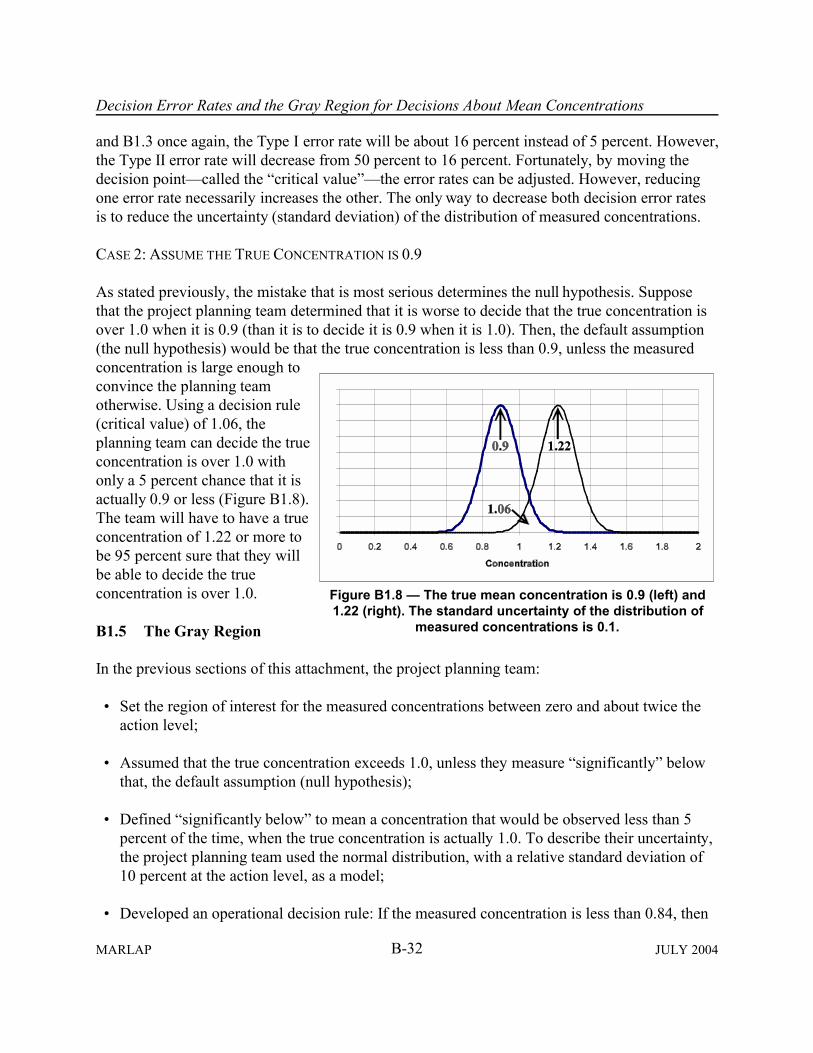
Decision Error Rates and the Gray Region for Decisions About Mean Concentrations
B-32MARLAP JULY 2004
Figure B1.8 � The true mean concentration is 0.9 (left) and1.22 (right). The standard uncertainty of the distribution of
measured concentrations is 0.1.
and B1.3 once again, the Type I error rate will be about 16 percent instead of 5 percent. However,the Type II error rate will decrease from 50 percent to 16 percent. Fortunately, by moving thedecision point�called the �critical value��the error rates can be adjusted. However, reducingone error rate necessarily increases the other. The only way to decrease both decision error ratesis to reduce the uncertainty (standard deviation) of the distribution of measured concentrations.
CASE 2: ASSUME THE TRUE CONCENTRATION IS 0.9
As stated previously, the mistake that is most serious determines the null hypothesis. Supposethat the project planning team determined that it is worse to decide that the true concentration isover 1.0 when it is 0.9 (than it is to decide it is 0.9 when it is 1.0). Then, the default assumption(the null hypothesis) would be that the true concentration is less than 0.9, unless the measuredconcentration is large enough toconvince the planning teamotherwise. Using a decision rule(critical value) of 1.06, theplanning team can decide the trueconcentration is over 1.0 withonly a 5 percent chance that it isactually 0.9 or less (Figure B1.8).The team will have to have a trueconcentration of 1.22 or more tobe 95 percent sure that they willbe able to decide the trueconcentration is over 1.0.
B1.5 The Gray Region
In the previous sections of this attachment, the project planning team:
� Set the region of interest for the measured concentrations between zero and about twice theaction level;
� Assumed that the true concentration exceeds 1.0, unless they measure �significantly� belowthat, the default assumption (null hypothesis);
� Defined �significantly below� to mean a concentration that would be observed less than 5percent of the time, when the true concentration is actually 1.0. To describe their uncertainty,the project planning team used the normal distribution, with a relative standard deviation of10 percent at the action level, as a model;
� Developed an operational decision rule: If the measured concentration is less than 0.84, then
Decision Error Rates and the Gray Region for Decisions About Mean Concentrations
B-33JULY 2004 MARLAP
decide the true concentration is less than 1.0. Otherwise, decide there is not enough reason tochange the default assumption (null hypothesis); and
� Found using this operational decision rule that they were pretty sure (95 percent) of decidingthat the true concentration is less than 1.0 only when the true concentration is actually 0.68 orless.
If the true concentration is between 0.68 and 1.0, all the project planning team really can say isthat the probability of correctly deciding that the true concentration is less than 1.0 will bebetween 5 percent (when the true concentration is just under 1.0) and 95 percent (when the trueconcentration is 0.68). In other words, when the true concentration is in the range of 0.68 to 1.0,the probability of incorrectly deciding that the true concentration is not less than 1.0 (i.e., theprobability of making a Type II error) will be between 5 percent (when the true concentration is0.68) and 95 percent (when the true concentration is just under 1.0). This range of concentrations,0.68 to 1.0, is the �gray region.�
When the null hypothesis is that the true concentration exceeds the action level (1.0), the grayregion is bounded from above by the action level. This is where α (the desired limit on the Type Ierror rate) is set. It is bounded from below at the concentration where β (the desired limit on theType II error rate) is set. There is some flexibility in setting the LBGR. If the project planningteam specifies a concentration, they can calculate the probability β. If they specify β, they cancalculate the value of the true concentration that will be correctly detected as being below 1.0with probability 1!β.
Often it will make sense to set the LBGR at a concentration at, or slightly above, the projectplanning team�s best estimate of the true concentration based on all of the information that isavailable to them. Then the width of the gray region will truly represent the minimum separationin concentration that it is important to detect, namely, that between the action level and whatactually is believed to be there.
In our example, the project planning team found that they needed the true concentration to be0.68 or less to be at least 95 percent sure that they will correctly decide (by observing a measuredvalue of 0.84 or less) that the true concentration is less than 1.0. If the project planning team isnot satisfied with that, the team can find that a true concentration of 0.71 will be correctlydetected 90 percent of the time (also by observing a measured value of 0.84 or less). The criticalvalue, or decision point, is determined by α, not β.
If the project planning team decides to raise the LBGR (i.e., narrow the gray region) the Type IIerror rate at the LBGR goes up. If they lower the LBGR (i.e., widen the gray region) the Type IIerror rate at the LBGR goes down. Nothing substantive is really happening. The project planningteam is merely specifying the ability to detect that the null hypothesis is false (i.e., reject the nullhypothesis because it is not true) at a particular concentration below the action level called the
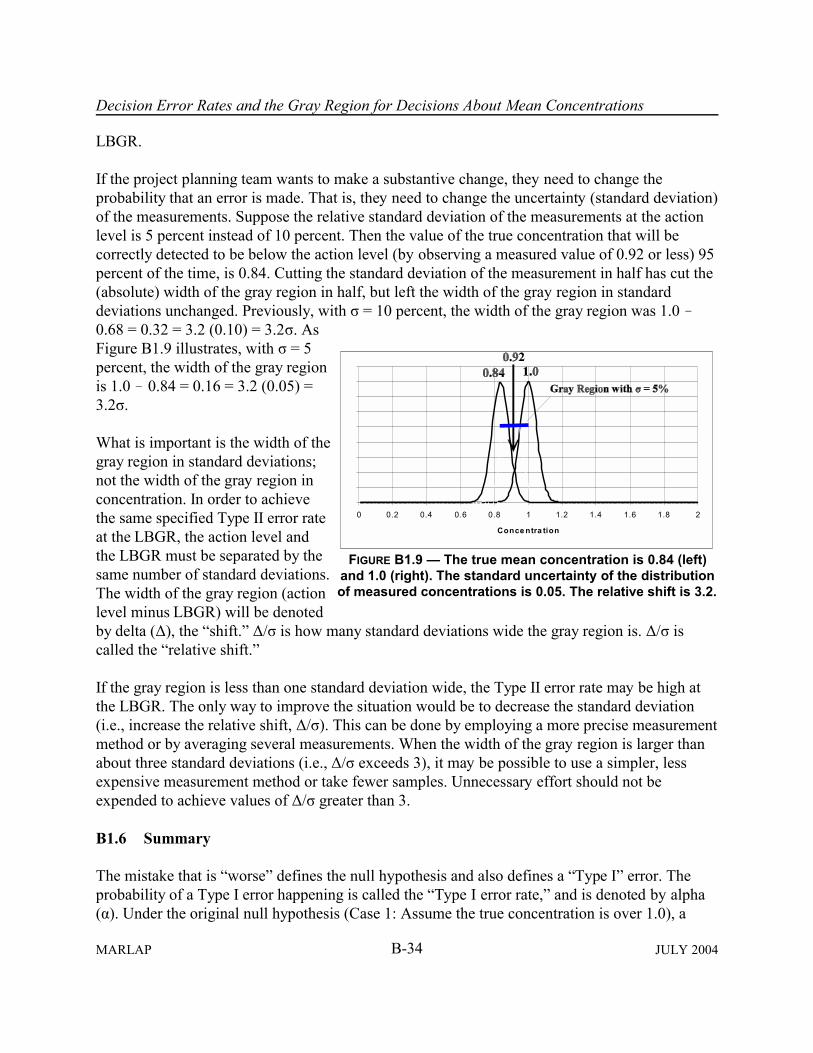
Decision Error Rates and the Gray Region for Decisions About Mean Concentrations
B-34MARLAP JULY 2004
0 0.2 0.4 0.6 0.8 1 1.2 1.4 1.6 1.8 2
Conce ntra tion
FIGURE B1.9 � The true mean concentration is 0.84 (left)and 1.0 (right). The standard uncertainty of the distributionof measured concentrations is 0.05. The relative shift is 3.2.
LBGR.
If the project planning team wants to make a substantive change, they need to change theprobability that an error is made. That is, they need to change the uncertainty (standard deviation)of the measurements. Suppose the relative standard deviation of the measurements at the actionlevel is 5 percent instead of 10 percent. Then the value of the true concentration that will becorrectly detected to be below the action level (by observing a measured value of 0.92 or less) 95percent of the time, is 0.84. Cutting the standard deviation of the measurement in half has cut the(absolute) width of the gray region in half, but left the width of the gray region in standarddeviations unchanged. Previously, with σ = 10 percent, the width of the gray region was 1.0 !0.68 = 0.32 = 3.2 (0.10) = 3.2σ. AsFigure B1.9 illustrates, with σ = 5percent, the width of the gray regionis 1.0 ! 0.84 = 0.16 = 3.2 (0.05) =3.2σ.
What is important is the width of thegray region in standard deviations;not the width of the gray region inconcentration. In order to achievethe same specified Type II error rateat the LBGR, the action level andthe LBGR must be separated by thesame number of standard deviations.The width of the gray region (actionlevel minus LBGR) will be denotedby delta (∆), the �shift.� ∆/σ is how many standard deviations wide the gray region is. ∆/σ iscalled the �relative shift.�
If the gray region is less than one standard deviation wide, the Type II error rate may be high atthe LBGR. The only way to improve the situation would be to decrease the standard deviation(i.e., increase the relative shift, ∆/σ). This can be done by employing a more precise measurementmethod or by averaging several measurements. When the width of the gray region is larger thanabout three standard deviations (i.e., ∆/σ exceeds 3), it may be possible to use a simpler, lessexpensive measurement method or take fewer samples. Unnecessary effort should not beexpended to achieve values of ∆/σ greater than 3.
B1.6 Summary
The mistake that is �worse� defines the null hypothesis and also defines a �Type I� error. Theprobability of a Type I error happening is called the �Type I error rate,� and is denoted by alpha(α). Under the original null hypothesis (Case 1: Assume the true concentration is over 1.0), a
Decision Error Rates and the Gray Region for Decisions About Mean Concentrations
B-35JULY 2004 MARLAP
Type I error would be deciding that the concentration was less than 1.0 when it really was not. Ingeneral, a Type I error is deciding against the null hypothesis when it is actually true. (A Type Ierror is also called a �false positive.� This can be confusing when the null hypothesis appears tobe a �positive� statement. Therefore, MARLAP uses the neutral terminology.)
The �less serious� mistake is called a Type II error, and the probability of it happening is the�Type II error rate,� denoted by beta (β). Under the original null hypothesis that the concentrationwas 1.0 or more, a Type II error would be deciding that the concentration was more than 1.0when it really was not. In general, a Type II error is not deciding against the null hypothesis whenit is actually false.
In both Case 1 and Case 2, the probability of both Type I errors and Type II errors were set to 5percent. The probabilities were calculated at multiples of the standard deviation, assuming anormal distribution. The data may not always be well described by a normal distribution, so adifferent probability distribution may be used. However, the probability of a Type I error isalways calculated as the probability that the decisionmaker will reject the null hypothesis when itis actually true. This is simple enough, as long as there is a clear boundary for the parameter ofinterest.
The parameter of interest in both Case 1 and Case 2 was the true concentration. The trueconcentration had a limit of 1.0. Therefore, all the project planning team had to do was calculatethe probability that they would get a measured concentration that would cause them to decidethat the true concentration was less than 1.0, even though it was equal to 1.0. In the example, theproject planning team actually started with the probability (5 percent) and worked out the criticalvalue. The �critical value� (or decision point) is the measured value that divides the measurementresults into two different sets: (1) those values that will cause the null hypothesis to be rejectedand (2) those values that will leave the null hypothesis as the default.
The Type I and Type II error rates, α and β, often are both set at 5 percent. This is only bytradition. Neither error rate needs to be set at 5 percent, nor do they have to be equal. The way theproject planning team should set the value is by examining the consequences of making a Type Ior a Type II error. What consequences will happen as a result of making each type of error? Thisis a little different than the criterion that was used to define the null hypothesis. It may be that insome circumstances, a Type II error is riskier than a Type I error. In that case, consider making αbigger than β.

B-36MARLAP JULY 2004
ATTACHMENT B2Decision Error Rates and the Gray Region for DetectionDecisions
B2.1 Introduction
This section is provided to present some additional discussion on the subject of applying the DataQuality Objectives (DQO) process to the problem of measurement detection capability. Inparticular, �not detected� does not mean zero radioactivity concentration. To understand this, oneneeds to examine the concept of �minimum detectable concentration� (MDC). This involves theDQO process and limiting decision error rates.
B2.2 The DQO Process Applied to the Detection Limit Problem
STEP 1. PROBLEM STATEMENTTo determine if the material that is being measured contains radioactivity.
STEP 2. IDENTIFY THE DECISIONDecide if the material contains radioactivity at a level that requires action.
STEP 3. IDENTIFY INPUTS TO THE DECISIONWhat level of radioactivity in the material is important to detect?
STEP 4. DEFINE THE STUDY BOUNDARIESHow much material is to be measured, what instrumentation/analysis is available, how muchtime and resources are available for the measurements.
STEP 5. DEVELOP A DECISION RULEThis is an �if...then� rule that specifies the parameter of interest to be measured, and an actionlevel against which it is compared in order to choose between alternative actions. At thisstage, it is assumed that the true value of the parameter can be measured exactly withoutuncertainty. Such a decision rule in this case might be �If the true concentration in the sampleis greater than zero, appropriate action will be taken. Otherwise, no action is required.�
STEP 6. SPECIFY LIMITS ON DECISION ERROR RATESDevelop an operational rule so that when the measurement is made, a decision on theappropriate action to take can be made. This rule takes into account that there is uncertaintyin any measurement, and therefore there is the possibility of making decision errors. Whenthe material is processed and inserted into an instrument, the measurement is made and theinstrument output is a result that is a number. The decision rule involves taking thatnumerical result and comparing it to a pre-determined number called the critical value. If the

Decision Error Rates and the Gray Region for Detection Decisions
B-37JULY 2004 MARLAP
result is greater than the critical value, the decision is made to treat the material as containingradioactivity above the action level, and then taking the appropriate action. The critical valuewill vary depending on the limits on decision errors rates that are specified.
The material either contains radioactivity or it does not. Unfortunately, it is impossible todetermine absolutely whether the material does or does not contain radioactivity. Decisions canonly be based on the result of measurements. There are four possibilities:
� The material does not contain radioactivity, and the measurement results in a value below thecritical value and so it is decided that it does not contain radioactivity.
� The material does contain radioactivity, and the measurement results in a value above thecritical value and so it is decided that it does contain radioactivity.
� The material does not contain radioactivity, and the measurement results in a value above thecritical value and so it is decided that it does contain radioactivity. This would be a decisionerror.
� The material does contain radioactivity, and the measurement results in a value below thecritical value and so it is decided that it does not contain radioactivity. This also would be adecision error.
Note that one never knows if a decision error is made, one only knows the result of themeasurement. Measurements are not perfect, people make mistakes, and decision errors areunavoidable. However, recognizing that decision errors exist does allow their severity to becontrolled. Several steps are necessary in order to create the framework for controlling decisionerror rates. These are described in the following sections.
B2.3 Establish the Concentration Range of Interest
Step three of the DQO process determined a level of radioactivity concentration in the materialthat is important to detect. This is also sometimes called an action level (such as the DCGL, aregulatory limit) that should not be exceeded. It is also important to define a region of interestranging from the lowest to the highest average concentrations at which the contaminant isexpected to exist. If the project planning team wants a method to measure sample concentrationsaround the action level, they would not select one that only worked at concentrations at 10 to 100times the action level, nor would they select one that only worked from zero to half the actionlevel. They would want a method that worked well around the action level�perhaps from 0.1 to10 times the action level, or from one-half to two times the action level. For the purpose of theexample in this attachment, the action level is 1.0 and the project planning team selected a regionof interest that is zero to twice the action level (0�2), as shown on the x-axis of Figure B2.1. The

Decision Error Rates and the Gray Region for Detection Decisions
B-38MARLAP JULY 2004
-1 0 1 2
Figure B2.1 � Region of interest for theconcentration around the action level of 1.0
-1 0 1 2
FIGURE B2.2 (a) � The distribution of blank(background) readings. (b) The true concentration is
0.0. The standard deviation of the distribution ofmeasured concentrations is 0.2.
0 1 0 0 2 0 0 3 0 0
first thing to notice is that Figure B2.1ranges from !1 to 2 and not 0 to 2. Why isthis?
If a blank sample is placed in theinstrument, the �true concentration� is zero.The instrument will produce a reading thatis a number, and not necessarily the samereading each time. This is shown in FigureB2.2(a). Usually, the instrument outputmust be converted to a concentration valueusing a calibration factor. For simplicity,this example will assume that thecalibration factor is 100, and in the remaining figures the measurement results will be showndirectly in concentration. The zero point of concentration is at the average instrument readingwhen �nothing� (a blank) is being measured. In Figure B2.2(a) this is 100. The distribution ofmany measurements of nothing will looklike Figure B2.2(b). This is obtained fromFigure B2.2(a) by subtracting the averageblank reading (100) and dividing by thecalibration factor (also 100). The spread inthese measurement results is characterizedby the standard deviation of thisdistribution. In Figure B2.2(b), the standarddeviation is 0.2. For the problem to beactually addressed, the standard deviationmay be larger or smaller than this, but itwill not be zero. There is always somevariability in measurements, and this willalways cause some uncertainty aboutwhether or not the decisions based on thesemeasurements are correct.
Consider a possible decision rule: Decidethat there is radioactivity in the sample ifthe measurement result is greater than zero.(This means that the �critical value� iszero.)
Figure B2.2 shows that if the critical valuefor the decision is made equal to zero, adecision that there is radioactivity in the

Decision Error Rates and the Gray Region for Detection Decisions
B-39JULY 2004 MARLAP
-1 0 1 2
FIGURE B2.3 � The true concentration is 0.0, and thestandard deviation of the distribution of measured
concentrations is 0.2. A critical value of 0.2 would beexceeded about 16 percent of the time.
-1 0 1 2
Figure B2.4 � The true concentration is 0.2 and thestandard deviation of the distribution of measured
concentrations is 0.2
sample will be made about half the time, even when there is nothing to measure. Also, notice thatunless the instrument reading is negative, it is not possible to decide that there is no radioactivityin the sample. There is nothing contradictory about this. The zero point on the x-axis was chosensimply to be the average measurement of �nothing.� About half the time a measurement ofnothing will be larger, and about half the time it will be smaller. This does not imply anythingabout concentrations being negative. It is about the variability of measurement readings, not thetrue concentration.
Decisionmakers might not be toohappy about a decision rule that willlead them to the wrong conclusionhalf of the time. How can this beimproved? Notice that if the criticalvalue is made larger, the wrongconclusion (that there is radio-activity when there is none) will bemade less often. If the critical valuefor the example is 0.2, it will bedecided that there is radioactivity inthe sample when the measurementresult is greater than 0.2. From theexample in Figure B2.3, this will beestimated to happen about 16percent of the time.
By making the critical value larger and larger, the probability can be reduced practically to zeroof deciding that there is radioactivity when there is not. This apparently happy solution comes ata price. To see that, just consider theopposite situation. Suppose, insteadof �nothing,� there is aconcentration of 0.2 in the sample(in this example, units areirrelevant). If a sample with thisconcentration is measured often, thedistribution of results might looklike Figure B2.4.
Notice that with a critical value of0.2, a decision that there isradioactivity in this sample willonly be made about half the time.Even if the critical value were zero,

Decision Error Rates and the Gray Region for Detection Decisions
B-40MARLAP JULY 2004
a decision that there is radioactivity in the sample would only be made about 84 percent of thetime.
As shown above, there are two types of decision errors that can be made: that there is radio-activity when there is not, or that there is no radioactivity when there is. What the figures show isthat by making the critical value for the decision rule bigger, one can reduce the chances ofmaking first kind of decision error, but doing so will increase the chance of making the secondkind of decision error. Making the critical value for the decision rule smaller will reduce chancesof the second kind of decision error, but will increase the chance of the first kind of decisionerror.
This example used a measurement variability (standard deviation) of 0.2. What if the variabilityis larger or smaller? By looking at the figures, one can conclude that no matter what thevariability actually is:
(1)If a critical value of zero is used, one will conclude that there is radioactivity in a sample thatactually contains nothing about half the time.
(2)If a critical value is selected equal to the standard deviation, one will conclude that there isradioactivity in a sample that actually contains nothing about 16 percent of the time. (A slightmodification of the figures would show that if the critical value equals two times the standarddeviation, one will conclude that there is radioactivity in a sample that actually containsnothing about 2.5 percent of the time.)
(3)If a critical value of zero is used, one will conclude that there is no radioactivity in a samplethat actually contains a concentration that is numerically equal to the standard deviation about16 percent of the time. (A slight modification of the figures would show that if the criticalvalue were equal to zero, one will conclude that there is no radioactivity in a sample thatactually contains a concentration equal to twice the standard deviation about 2.5 percent ofthe time.)
(4)If a critical value is selected equal to the standard deviation, one will conclude that there is noradioactivity in a sample that actually contains a concentration numerically equal to thestandard deviation about half the time.
The key is to notice that it is not the numerical value of the variability alone nor the numericalvalue of the concentration alone, that determines the probability of a decision error. It is the ratioof the concentration to the standard deviation that is important. In essence, the standard deviationdetermines the scale of the x-axis (concentration axis) for this problem. Background determinesthe zero point of the concentration axis.
The MDC for a measurement process is the concentration that the sample must contain so that

Decision Error Rates and the Gray Region for Detection Decisions
B-41JULY 2004 MARLAP
-1 0 1 2
FIGURE B2.5 � The true value of the concentration is 0.66and the standard deviation of the distribution of measured
concentrations is 0.2. A critical value of 0.33 will beexceeded about 95 percent of the time.
-1 0 1 2
FIGURE B2.6 � The true value of the measuredconcentration is 0.0 and the standard deviation of the
measured concentrations is 0.2. A critical value of 0.33would be exceeded about 5 percent of the time.
the probability of a Type II decisionerror is limited to 5 percent. (Othervalues may be chosen, but 5 percentis most commonly used in thiscontext.)
This means that if a samplecontaining a concentration equal tothe MDC is measured, about 95percent of the time the measurementresult will lead to the decision thatthe sample contains radioactivity.This is shown in Figure B2.5.
However, if a sample containing ablank is measured, the probabilitythat the measurement result willlead to the decision that the samplecontains radioactivity will be onlyabout 5 percent. This is shown inFigure B2.6.
For this example, Figure B2.7summarizes the relationship amongthe distribution of measurements ona blank, the critical value, the MDC,and the action level.
The critical value used to limit thedecision error of concluding thatthere is radioactivity in a samplethat actually contains a blank to 5percent, is about 1.5 or 2 times themeasurement variability when measuring a blank. Limiting the decision error of concluding thatthere is no radioactivity in a sample that actually contains a concentration equal to the MDC,results in an MDC that is usually about twice the critical value. Consequently, the MDC isusually about 3 or 4 times the measurement variability when measuring a blank.
B2.4 Estimate the Measurement Variability when Measuring a Blank
The measurement variability when measuring a blank is thus a key parameter for planning. Thebest way to get a handle on this is by making many measurements of a blank sample and

Decision Error Rates and the Gray Region for Detection Decisions
B-42MARLAP JULY 2004
-1 0 1 2
Action Level
MDC
Critical Value
Figure B2.7 � The standard deviation of the normallydistributed measured concentrations is 0.2. The criticalvalue is 0.33, the MDC is 0.66 and the action level is 1.0.
computing the standard deviation ofthe measurement results.
What can be concluded about theability to measure �nothing� (i.e., noanalyte)? Radioactivity present at aconcentration less than the MDCmay be detected, but less than 95percent of the time. If the �trueconcentration� is at half the MDC(right at the critical value), thepresence of radioactivity will bedetected about half the time, andabout half the time it will not.Concentrations lower than thecritical value will be detected lessoften. The only way to do better is to reduce the measurement variability. This usually can onlybe done by either taking more measurements or by using an instrument or measurement processthat has less variability when measuring a blank sample.
So what does it mean if a sample is measured, and a decision was made that there was noradioactivity? (This is another way of saying that no radioactivity was detected.) By itself, such astatement means nothing, and has no value unless one knows the level of radioactivity that couldbe detected if it were there�i.e. the MDC.
Similarly, a criterion for action specifying that no radioactivity be detected in a sample must bequalified by information on how hard one must look. That is, the MDC must be specified, whichin turn implies a certain limit on the variability of the measurement procedure.
In either case, one can never measure zero. One can only decide from a measurement, with aprescribed limit on the probability of being wrong, that if enough radioactivity were there, itwould be found. If it is not found, it does not mean it is not present; it only means that whatevermight be there is unlikely to be more than the MDC.
In conclusion, an action level must be determined, and the MDC must be below it. Only then canradioactivity concentrations of concern can be detected with any degree of certainty. Conversely,specifying a measurement process implies an action level (level of concern) that is at or abovethe MDC.

C-1JULY 2004 MARLAP
APPENDIX CMEASUREMENT QUALITY OBJECTIVES
FOR METHOD UNCERTAINTY ANDDETECTION AND QUANTIFICATION CAPABILITY
C.1 Introduction
This appendix expands on issues related to measurement quality objectives (MQOs) for severalmethod performance characteristics which are introduced in Chapter 3, Key Analytical PlanningIssues and Developing Analytical Protocol Specifications. Specifically, this appendix providesthe rationale and guidance for establishing project-specific MQOs for the following method per-formance characteristics: method uncertainty, detection capability and quantification capability.In addition, it provides guidance in the development of these MQOs for use in the method selec-tion process and guidance in the evaluation of laboratory data based on the MQOs. Section C.2 isa brief overview of statistical hypothesis testing as it is commonly used in a directed planningprocess, such as the Data Quality Objectives (DQO) Process (EPA, 2000). More information onthis subject is provided in Chapter 2, Project Planning Process and Appendix B, The DataQuality Objectives Process. Section C.3 derives MARLAP�s recommended criteria for establish-ing project-specific MQOs for method uncertainty, detection capability, and quantification capa-bility. These criteria for method selection will meet the requirements of a statistically baseddecision-making process. Section C.4 derives MARLAP�s recommended criteria for evaluationof the results of quality control analyses by project managers and data reviewers (see also Chap-ter 8, Radiochemical Data Verification and Validation).
It is assumed that the reader is familiar with the concepts of measurement uncertainty, detectioncapability, and quantification capability, and with terms such as �standard uncertainty,� �mini-mum detectable concentration,� and �minimum quantifiable concentration,� which are intro-duced in Chapter 1, Introduction to MARLAP, and discussed in more detail in Chapter 20,Detection and Quantification Capabilities. MARLAP also uses the term �method uncertainty� torefer to the predicted uncertainty of the result that would be measured if the method were appliedto a hypothetical laboratory sample with a specified analyte concentration. The method uncer-tainty is a characteristic of the analyticalmethod and the measurement process.
C.2 Hypothesis Testing
Within the framework of a directed planningprocess, one considers an �action level,� whichis the contaminant concentration in either apopulation (e.g., a survey unit) or an individual
Contents
C.1 Introduction . . . . . . . . . . . . . . . . . . . . . . . . . . C-1C.2 Hypothesis Testing . . . . . . . . . . . . . . . . . . . . C-1C.3 Development of MQOs for Analytical Protocol
Selection . . . . . . . . . . . . . . . . . . . . . . . . . . . . C-3C.4 The Role of the MQO for Method Uncertainty in
Data Evaluation . . . . . . . . . . . . . . . . . . . . . . . C-9C.5 References . . . . . . . . . . . . . . . . . . . . . . . . . . C-17

MQOs For Method Uncertainty and Detection and Quantification Capability
1 In hypothesis testing, to �accept� the null hypothesis only means not to reject it, and for this reason manystatisticians avoid the word �accept� in this context. A decision not to reject the null hypothesis does not imply thenull hypothesis has been shown to be true.
2 The terms �false positive� and �false negative� are synonyms for �Type I error� and �Type II error,� respectively.However, MARLAP deliberately avoids these terms here, because they may be confusing when the null hypothesisis an apparently �positive� statement, such as X $ AL.
C-2MARLAP JULY 2004
item (e.g., a laboratory sample) that should not be exceeded. Statistical hypothesis testing is usedto decide whether the actual contaminant concentration, denoted by X, is greater than the actionlevel, denoted by AL. For more information on this topic, see EPA (2000), MARSSIM (2000),NRC (1998), or Appendix B of this manual.
In hypothesis testing, one formulates two hypotheses about the value of X, and evaluates themeasurement data to choose which hypothesis to accept and which to reject.1 The two hypothesesare called the null hypothesis H0 and the alternative hypothesis H1. They are mutually exclusiveand together describe all possible values of X under consideration. The null hypothesis ispresumed true unless the data provide evidence to the contrary. Thus the choice of the nullhypothesis determines the burden of proof in the test.
Most often, if the action level is not zero, one assumes it has been exceeded unless the measure-ment results provide evidence to the contrary. In this case, the null hypothesis is H0: X $ AL andthe alternative hypothesis is H1: X < AL. If one instead chooses to assume the action level has notbeen exceeded unless there is evidence to the contrary, then the null hypothesis is H0: X # ALand the alternative hypothesis is H1: X > AL. The latter approach is the only reasonable one ifAL = 0, because it is virtually impossible to obtain statistical evidence that an analyte concentra-tion is exactly zero.
For purposes of illustration, only the two forms of the null hypothesis described above will beconsidered. However, when AL > 0, it is also possible to select a null hypothesis that states that Xdoes not exceed a specified value less than the action level (NRC, 1998). Although this thirdscenario is not explicitly addressed below, the guidance provided here can be adapted for it withfew changes.
In any hypothesis test, there are two possible types of decision errors. A Type I error occurs if thenull hypothesis is rejected when it is, in fact, true. A Type II error occurs if the null hypothesis isnot rejected when it is false.2 Since there is always measurement uncertainty, one cannot elimi-nate the possibility of decision errors. So instead, one specifies the maximum Type I decisionerror rate α that is allowable when the null hypothesis is true. This maximum usually occurswhen X = AL. The most commonly used value of α is 0.05, or 5 %. One also chooses anotherconcentration, denoted here by DL (the �discrimination limit�), that one wishes to be able todistinguish reliably from the action level. One specifies the maximum Type II decision error rate

MQOs For Method Uncertainty and Detection and Quantification Capability
C-3JULY 2004 MARLAP
β that is allowable when X = DL, or, alternatively, the �power� 1 � β of the statistical test whenX = DL. The gray region is then defined as the interval between the two concentrations ALand DL.
The gray region is a set of concentrations close to the action level, where one is willing to tol-erate a Type II decision error rate that is higher than β. For concentrations above the upper boundof the gray region or below the lower bound, the decision error rate is no greater than the speci-fied value (either α or β as appropriate). Ideally, the gray region should be narrow, but in practice,its width is determined by balancing the costs involved, including the cost of measurements andthe estimated cost of a Type II error, possibly using prior information about the project and theparameter being measured.
If H0 is X $ AL (presumed contaminated), then the upper bound of the gray region is AL and thelower bound is DL. If H0 is X # AL (presumed uncontaminated), then the lower bound of thegray region is AL and the upper bound is DL. Since no assumption is made here about whichform of the null hypothesis is being used, the lower and upper bounds of the gray region will bedenoted by LBGR and UBGR, respectively, and not by AL and DL. The width of the gray region(UBGR � LBGR) is denoted by ∆ and called the shift or the required minimum detectabledifference in concentration (EPA, 2000; MARSSIM, 2000; NRC, 1998). See Appendix B, TheData Quality Objectives Process, for graphical illustrations of these concepts.
Chapter 3 of MARLAP recommends that for each radionuclide of concern, an action level, grayregion, and limits on decision error rates be established during a directed planning process.Section C.3 presents guidance on the development of MQOs for the selection and developmentof analytical protocols. Two possible scenarios are considered. In the first scenario, the parameterof interest is the mean analyte concentration for a sampled population. The question to beanswered is whether the population mean is above or below the action level. In the secondscenario a decision is to be made about individual items or specimens, and not about populationparameters. This is the typical scenario in bioassay, for example. Some projects may involve bothscenarios. For example, project planners may want to know whether the mean analyte concentra-tion in a survey unit is above an action level, but they may also be concerned about individualsamples with high analyte concentrations.
C.3 Development of MQOs for Analytical Protocol Selection
This section derives MARLAP�s recommendations for establishing MQOs for the analyticalprotocol selection and development process. Guidance is provided for establishing project-specific MQOs for method uncertainty, detection capability, and quantification capability. Onceselected, these MQOs are used in the initial, ongoing, and final evaluations of the protocols.MARLAP considers two scenarios and develops MQOs for each.
MQOs For Method Uncertainty and Detection and Quantification Capability
C-4MARLAP JULY 2004
σ2 ' σ2M % σ2
S
SCENARIO I: A Decision Is to Be Made about the Mean of a Sampled Population
In this scenario the total variance of the data, , is the sum of two componentsσ2
where is the average analytical method variance (M = �method� or �measurement�) and isσ2M σ2
Sthe variance of the contaminant concentration in the sampled population (S = �sampling�). Thesampling standard deviation σS may be affected by the spatial and temporal distribution of theanalyte, the extent of the survey unit, the physical sample sizes, and the sample collectionprocedures. The analytical standard deviation σM is affected by laboratory sample preparation,subsampling, and analysis procedures. The value of σM may be estimated by the combinedstandard uncertainty of a measured value for a sample whose concentration equals the hypoth-esized population mean concentration (see Chapter 19, Measurement Uncertainty).
The ratio ∆ / σ, called the �relative shift,� determines the number of samples required to achievethe desired decision error rates α and β. The target value for this ratio should be between 1 and 3,as explained in MARSSIM (2000) and NRC (1998). Ideally, to keep the required number ofsamples low, one prefers that ∆ / σ . 3. The cost in number of samples rises rapidly as the ratio∆ / σ falls below 1, but there is little benefit from increasing the ratio much above 3.
Generally, it is easier to control σM than σS. If σS is known (approximately), a target value for σM
can be determined. For example, if σS < ∆ / 3, then a value of σM no greater than ∆2 / 9 & σ2S
ensures that σ # ∆ / 3, as desired. If σS > ∆ / 3, the requirement that the total σ be less than ∆ / 3cannot be met regardless of σM. In the latter case, it is sufficient to make σM negligible in com-parison to σS. Generally, σM can be considered negligible if it is no greater than about σS / 3.
Often one needs a method for choosing σM in the absence of specific information about σS. In thissituation, MARLAP recommends the requirement σM # ∆ / 10 by default. The recommendation isjustified below.
Since it is desirable to have σ # ∆ / 3, this condition is adopted as a primary requirement. Assumefor the moment that σS is large. Then σM should be made negligible by comparison. As mentionedabove, σM can be considered negligible if it is no greater than σS / 3. When this condition is met,further reduction of σM has little effect on σ and therefore is usually not cost-effective. So, theinequality σM # σS / 3 is adopted as a second requirement.
Algebraic manipulation of the equation = and the required inequality σM # σS / 3σ2 σ2M % σ2
Sgives

MQOs For Method Uncertainty and Detection and Quantification Capability
C-5JULY 2004 MARLAP
σM # σ10
σM # ∆3 10
σM # ∆10
σMR '∆10
The inequalities σ # ∆ / 3 and σM # σ / together imply the requirement10
or approximately
The required upper bound for the standard deviation σM will be denoted by σMR. MARLAPrecommends the equation
by default as a requirement in Scenario I when σS is unknown. This upper bound was derivedfrom the assumption that σS was large, but it also ensures that the primary requirement σ # ∆ / 3will be met if σS is small. When the analytical standard deviation σM is less than σMR, the primaryrequirement will be met unless the sampling variance, , is so large that is negligible byσ2
S σ2M
comparison, in which case little benefit can be obtained from further reduction of σM.
The recommended value of σMR is based on the assumption that any known bias in the measure-ment process has been corrected and that any remaining bias is much smaller than the shift, ∆,when a concentration near the gray region is measured. (See Chapter 6, which describes a pro-cedure for testing for bias in the measurement process.)
Achieving an analytical standard deviation σM less than the recommended limit, ∆ / 10, may bedifficult in some situations, particularly when the shift, ∆, is only a fraction of UBGR. When therecommended requirement for σM is too costly to meet, project planners may allow σMR to belarger, especially if σS is believed to be small or if it is not costly to analyze the additionalsamples required because of the larger overall data variance ( ). In this case, projectσ2
M % σ2S
planners may choose σMR to be as large as ∆ / 3 or any calculated value that allows the dataquality objectives to be met at an acceptable cost.
The true standard deviation, σM, is a theoretical quantity and is never known exactly, but the lab-oratory may estimate its value using the methods described in Chapter 19, and Section 19.5.13 inparticular. The laboratory�s estimate of σM will be denoted here by uM and called the �methoduncertainty.� The method uncertainty, when estimated by uncertainty propagation, is the pre-dicted value of the combined standard uncertainty (�one-sigma� uncertainty) of the analytical

MQOs For Method Uncertainty and Detection and Quantification Capability
C-6MARLAP JULY 2004
result for a laboratory sample whose concentration equals UBGR. Note that the term �methoduncertainty� and the symbol uM actually apply not only to the method but to the entire measure-ment process.
In theory, the value σMR is intended to be an upper bound for the true standard deviation of themeasurement process, σM, which is unknown. In practice, σMR is actually used as an upper boundfor the method uncertainty, uM, which may be calculated. Therefore, the value of σMR will becalled the �required method uncertainty� and denoted by uMR . As noted in Chapter 3, MARLAPrecommends that project planners specify an MQO for the method uncertainty, expressed interms of uMR, for each analyte and matrix.
The MQO for method uncertainty is expressed above in terms of the required standard deviationof the measurement process for a laboratory sample whose analyte concentration is at or aboveUBGR. In principle the same MQO may be expressed as a requirement that the minimum quan-tifiable concentration (MQC) be less than or equal to UBGR. Chapter 20 defines the MQC as theanalyte concentration at which the relative standard deviation of the measured value (i.e., therelative method uncertainty) is 1 / kQ, where kQ is some specified positive value. The value of kQin this case should be specified as kQ = UBGR / uMR. In fact, if the lower bound of the gray regionis zero, then one obtains kQ = 10, which is the value most commonly used to define the MQC inother contexts. In practice the requirement for method uncertainty should only be expressed interms of the MQC when kQ = 10, since to define the MQC with any other value of kQ may lead toconfusion.
EXAMPLE C.1 Suppose the action level is 1 and the lower bound of the gray region isBq/g0.6 . If decisions are to be made about survey units based on samples, then the requiredBq/gmethod uncertainty at 1 isBq/g
uMR '∆10
'1 Bq/g & 0.6 Bq/g
10' 0.04 Bq/g
If this uncertainty cannot be achieved, then an uncertainty as large as ∆ / 3 = 0.13 mayBq/gbe allowed if σS is small or if more samples are taken per survey unit.
EXAMPLE C.2 Again suppose the action level is 1 , but this time assume the lowerBq/gbound of the gray region is 0 . In this case the required method uncertainty at 1 isBq/g Bq/g
uMR '∆10
'1 Bq/g & 0 Bq/g
10' 0.1 Bq/g
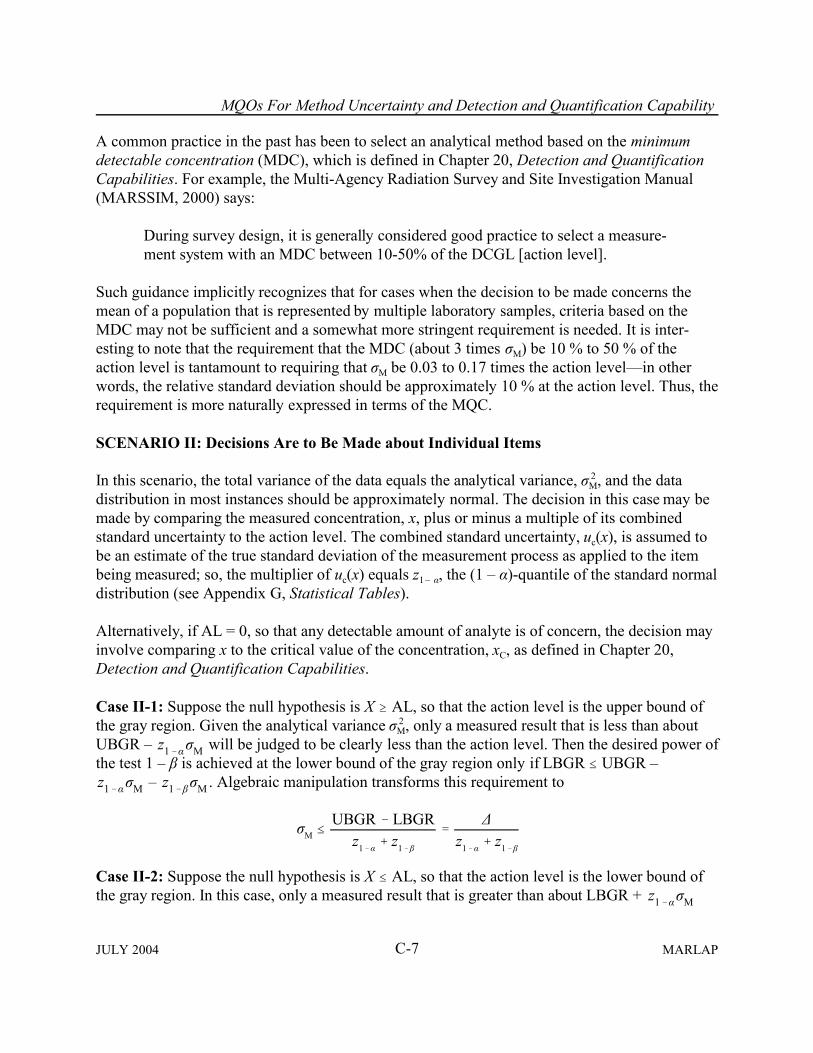
MQOs For Method Uncertainty and Detection and Quantification Capability
C-7JULY 2004 MARLAP
σM # UBGR & LBGRz1&α % z1&β
'∆
z1&α % z1&β
A common practice in the past has been to select an analytical method based on the minimumdetectable concentration (MDC), which is defined in Chapter 20, Detection and QuantificationCapabilities. For example, the Multi-Agency Radiation Survey and Site Investigation Manual(MARSSIM, 2000) says:
During survey design, it is generally considered good practice to select a measure-ment system with an MDC between 10-50% of the DCGL [action level].
Such guidance implicitly recognizes that for cases when the decision to be made concerns themean of a population that is represented by multiple laboratory samples, criteria based on theMDC may not be sufficient and a somewhat more stringent requirement is needed. It is inter-esting to note that the requirement that the MDC (about 3 times σM) be 10 % to 50 % of theaction level is tantamount to requiring that σM be 0.03 to 0.17 times the action level�in otherwords, the relative standard deviation should be approximately 10 % at the action level. Thus, therequirement is more naturally expressed in terms of the MQC.
SCENARIO II: Decisions Are to Be Made about Individual Items
In this scenario, the total variance of the data equals the analytical variance, σM2, and the data
distribution in most instances should be approximately normal. The decision in this case may bemade by comparing the measured concentration, x, plus or minus a multiple of its combinedstandard uncertainty to the action level. The combined standard uncertainty, uc(x), is assumed tobe an estimate of the true standard deviation of the measurement process as applied to the itembeing measured; so, the multiplier of uc(x) equals z1 � α, the (1 � α)-quantile of the standard normaldistribution (see Appendix G, Statistical Tables).
Alternatively, if AL = 0, so that any detectable amount of analyte is of concern, the decision mayinvolve comparing x to the critical value of the concentration, xC, as defined in Chapter 20,Detection and Quantification Capabilities.
Case II-1: Suppose the null hypothesis is X $ AL, so that the action level is the upper bound ofthe gray region. Given the analytical variance σM
2, only a measured result that is less than aboutUBGR � will be judged to be clearly less than the action level. Then the desired power ofz1&ασMthe test 1 � β is achieved at the lower bound of the gray region only if LBGR # UBGR �
� . Algebraic manipulation transforms this requirement toz1&ασM z1&βσM
Case II-2: Suppose the null hypothesis is X # AL, so that the action level is the lower bound ofthe gray region. In this case, only a measured result that is greater than about LBGR + z1&ασM

MQOs For Method Uncertainty and Detection and Quantification Capability
C-8MARLAP JULY 2004
σM # UBGR & LBGRz1&α % z1&β
'∆
z1&α % z1&β
σM # ∆z1&α % z1&β
uMR ' σMR '∆
z1&α % z1&β
σM # UBGRz1&α % z1&β
will be judged to be clearly greater than the action level. The desired power of the test 1 � β isachieved at the upper bound of the gray region only if UBGR $ LBGR + + .z1&ασM z1&βσMAlgebraic manipulation transforms this requirement to
So, in either case, the requirement remains that:
Therefore, MARLAP recommends the use of the equation
as an MQO for method uncertainty when decisions are to be made about individual items (i.e.,laboratory samples) and not about population parameters.
If both α and β are at least 0.05, one may use the value uMR = 0.3∆.
The recommended value of uMR is based on the assumption that any known bias in the measure-ment process has been corrected and that any remaining bias is small relative to the methoduncertainty.
If LBGR = 0, then ∆ = UBGR and σMR = ∆ / (z1 �α + z1 �β) implies
This requirement is essentially equivalent to requiring that the MDC not exceed UBGR. Thus,when LBGR = 0, the MQO may be expressed in terms of the detection capability of the analyticalmethod.
Note that when AL = LBGR = 0, the MQO for detection capability may be derived directly interms of the MDC, since the MDC is defined as the analyte concentration at which the proba-bility of detection is 1 � β when the detection criterion is such that the probability of false detec-tion in a sample with zero analyte concentration is at most α.

MQOs For Method Uncertainty and Detection and Quantification Capability
C-9JULY 2004 MARLAP
EXAMPLE C.3 Suppose the action level is 1 , the lower bound of the gray region is 0.5Bq/L, α = 0.05, and β = 0.10. If decisions are to be made about individual items, then theBq/L
required method uncertainty at 1 isBq/L
.uMR '∆
z1&α % z1&β
'1 Bq/L & 0.5 Bq/L
z0.95 % z0.90
'0.5 Bq/L
1.645 % 1.282' 0.17 Bq/L
C.4 The Role of the MQO for Method Uncertainty in Data Evaluation
This section provides guidance and equations for determining warning and control limits for QCsample results based on the project-specific MQO for method uncertainty. In the MARLAPProcess as described in Chapter 1, these warning and control limits are used in the ongoing eval-uation of protocol performance (see Chapter 7, Evaluating Methods and Laboratories) and in theevaluation of the laboratory data (see Chapter 8, Radiochemical Data Verification andValidation).
C.4.1 Uncertainty Requirements at Various Concentrations
When project planners follow MARLAP�s recommendations for establishing MQOs for methoduncertainty for method selection and development, the maximum allowable standard deviation,σMR, at the upper bound of the gray region is specified. During subsequent data evaluation, thestandard deviation at any concentration less than UBGR should be at most σMR, and the relativestandard deviation at any concentration greater than UBGR should be at most σMR/UBGR, whichwill be denoted here by φMR. Note that, since the true standard deviation can never be knownexactly, in practice the requirement is expressed in terms of the required method uncertainty, uMR,to which the combined standard uncertainty of each result may be compared.
EXAMPLE C.4 Consider the preceding example, in which AL = UBGR = 1 , LBGR =Bq/L0.5 , and uMR = 0.17 . In this case the combined standard uncertainty for any meas-Bq/L Bq/Lured result, x, should be at most 0.17 if x < 1 , and the relative combined standardBq/L Bq/Luncertainty should be at most 0.17 / 1, or 17 %, if x > 1 .Bq/L
In Scenario I, where decisions are made about the mean of a population based on multiple physi-cal samples (e.g., from a survey unit), if the default value uMR = ∆ / 10 is assumed for the requiredmethod uncertainty, then the required bound for the analytical standard deviation as a function ofconcentration is as shown in Figure C.1. The figure shows that the bound, uReq, is constant at allconcentrations, x, below UBGR, and uReq increases with x when x is above UBGR. So, uReq = uMRwhen x < UBGR and uReq = x @ uMR /UBGR when x > UBGR.

MQOs For Method Uncertainty and Detection and Quantification Capability
C-10MARLAP JULY 2004
uc(x) #
UBGR & xz1&α % z1 & β
, if x # LBGR
x & LBGRz1&α % z1 & β
, if x $ UBGR
∆z1&α % z1 & β
, if LBGR # x # UBGR
0 UBGRLBGR
True Concentration (X)
Y = XY = X ± uReq
Mea
sure
d (Y
)
FIGURE C.1 � Required analytical standard deviation (uReq)These requirements can be relaxed somewhat for samples with very high analyte concentrationsas long as the project�s requirements for decision uncertainty are met. However, MARLAP doesnot provide specific guidance to address this issue for Scenario I.
In Scenario II, where decisions are made about individual physical samples, it is possible towiden the required bounds for the standard deviation at any concentration outside the grayregion. For example, suppose UBGR = AL, LBGR is set at some concentration below UBGR,and the decision error probabilities α and β are specified. Then the project planners require the probability of a Type I error not to exceed α when the true concentration is at or above UBGR,and they require the probability of a Type II error not to exceed β when the true concentration isat or below LBGR. The decision rule is based on the combined standard uncertainty of the meas-urement result: any sample whose measured concentration, x, exceeds AL minus z1 �α times thecombined standard uncertainty, uc(x), is assumed to exceed the action level. So, assuming uc(x) isan adequate estimate of the analytical standard deviation, the planners� objectives are met if

MQOs For Method Uncertainty and Detection and Quantification Capability
C-11JULY 2004 MARLAP
uMR '∆10
' 0.35 Bq/g
EXAMPLE C.5 Consider the earlier example in which AL = UBGR = 1.0 , LBGR =Bq/L0.5 , α = 0.05, β = 0.10, and uMR = 0.17 . The less restrictive uncertaintyBq/L Bq/Lrequirement can be expressed as
uc(x) #
1.0 Bq/L & x2.927
, if x # 0.5 Bq/L
x & 0.5 Bq/L2.927
, if x $ 1.0 Bq/L
0.17, if 0.5 Bq/L # x # 1.0 Bq/L
So, if x = 0, the requirement is uc(x) # (1 ) / 2.927 = 0.34 , and, if x = 2 , theBq/L Bq/L Bq/Lrequirement is uc(x) # (2 ! 0.5 ) / 2.927 = 0.51 , which is approximatelyBq/L Bq/L Bq/L26 % in relative terms.
C.4.2 Acceptance Criteria for Quality Control Samples
The next issue to be addressed is how to set warning and control limits for quality control (QC)sample results. These limits will be used by project data assessors to determine whether the lab-oratory appears to be meeting MQOs. Presumably the lab has stricter internal QC requirements(see Chapter 18, Laboratory Quality Control).
The development of acceptance criteria for QC samples will be illustrated with an example.Assume UBGR = 5 (soil) and LBGR = 1.5 . The width of the gray region is ∆ =Bq/g Bq/g5 � 1.5 = 3.5 . Project planners, following MARLAP�s guidance, choose the requiredBq/gmethod uncertainty at 5 (UBGR) to beBq/g
or 7 %. So, the maximum standard uncertainty at analyte concentrations less than 5 shouldBq/gbe uMR = 0.35 , and the maximum relative standard uncertainty at concentrations greaterBq/gthan 5 should be φMR = 0.07, or 7 %.Bq/g
Although it is possible to relax these uncertainty criteria for samples with very high analyte con-centrations, MARLAP recommends that the original criteria be used to develop acceptance limitsfor the results of QC sample analyses.
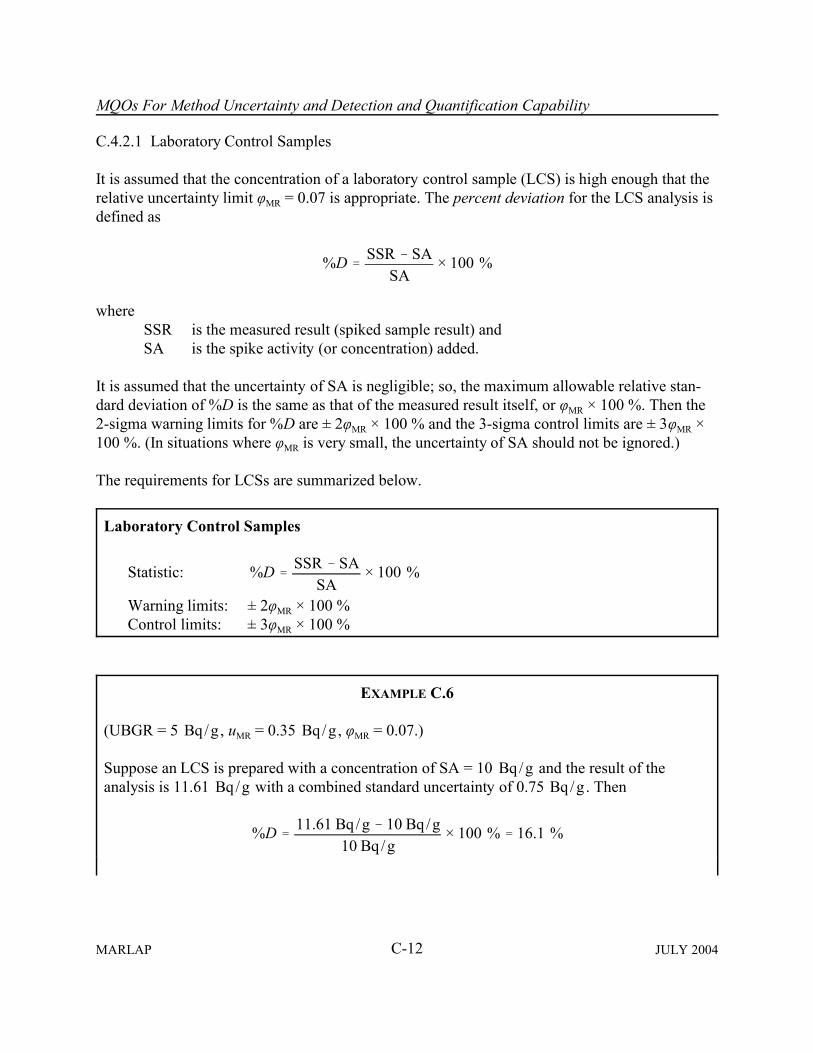
MQOs For Method Uncertainty and Detection and Quantification Capability
C-12MARLAP JULY 2004
%D 'SSR & SA
SA× 100 %
C.4.2.1 Laboratory Control Samples
It is assumed that the concentration of a laboratory control sample (LCS) is high enough that therelative uncertainty limit φMR = 0.07 is appropriate. The percent deviation for the LCS analysis isdefined as
whereSSR is the measured result (spiked sample result) andSA is the spike activity (or concentration) added.
It is assumed that the uncertainty of SA is negligible; so, the maximum allowable relative stan-dard deviation of %D is the same as that of the measured result itself, or φMR × 100 %. Then the2-sigma warning limits for %D are ± 2φMR × 100 % and the 3-sigma control limits are ± 3φMR ×100 %. (In situations where φMR is very small, the uncertainty of SA should not be ignored.)
The requirements for LCSs are summarized below.
Laboratory Control Samples
Statistic: %D 'SSR & SA
SA× 100 %
Warning limits: ± 2φMR × 100 %Control limits: ± 3φMR × 100 %
EXAMPLE C.6
(UBGR = 5 , uMR = 0.35 , φMR = 0.07.)Bq/g Bq/g
Suppose an LCS is prepared with a concentration of SA = 10 and the result of theBq/ganalysis is 11.61 with a combined standard uncertainty of 0.75 . ThenBq/g Bq/g
%D '11.61 Bq/g & 10 Bq/g
10 Bq/g× 100 % ' 16.1 %

MQOs For Method Uncertainty and Detection and Quantification Capability
C-13JULY 2004 MARLAP
x 'x1 % x2
2
2uMR 2 . 2.83 uMR
3uMR 2 . 4.24 uMR
RPD 'x1 & x2
x× 100 %
2φMR 2 × 100 % . 2.83 φMR × 100 %
3φMR 2 × 100 % . 4.24 φMR × 100 %
The warning limits in this case are
± 2φMR × 100 % = ± 14 %and the control limits are
± 3φMR × 100 % = ± 21 %
So, the calculated value of %D is above the upper warning limit but below the control limit.
C.4.2.2 Duplicate Analyses
Acceptance criteria for duplicate analysis results depend on the sample concentration, which isestimated by the average of the two measured results x1 and x2.x
When < UBGR, the warning limit for the absolute difference isx x1 & x2
and the control limit is
Only upper limits are used, because the absolute value is being tested.x1 & x2
When $ UBGR, the acceptance criteria may be expressed in terms of the relative percentxdifference (RPD), which is defined as
The warning limit for RPD is
and the control limit is
The requirements for duplicate analyses are summarized below.

MQOs For Method Uncertainty and Detection and Quantification Capability
C-14MARLAP JULY 2004
Duplicate Analyses
If :x̄ < UBGRStatistic: x1 & x2Warning limit: 2.83 uMRControl limit: 4.24 uMR
If :x̄ $ UBGR
Statistic: RPD 'x1 & x2
x̄× 100 %
Warning limit: 2.83 φMR × 100 %Control limit: 4.24 φMR × 100 %
EXAMPLE C.7
(UBGR = 5 , uMR = 0.35 , φMR = 0.07)Bq/g Bq/g
Suppose duplicate analyses are performed on a laboratory sample and the results of the twomeasurements are
x1 = 9.0 with combined standard uncertainty uc(x1) = 2.0 Bq/g Bq/gx2 = 13.2 with combined standard uncertainty uc(x2) = 2.1 Bq/g Bq/g
The duplicate results are evaluated as follows.
x̄ ' 9.0 Bq/g % 13.2 Bq/g2
' 11.1 Bq/g
Since , the acceptance criteria are expressed in terms of RPD.x̄ $ 5 Bq/g
RPD '9.0 Bq/g & 13.2 Bq/g
11.1 Bq/g× 100 % ' 37.84 %
The warning and control limits for RPD are
Warning limit ' 2.83 × 0.07 × 100 % ' 19.81 %Control limit ' 4.24 × 0.07 × 100 % ' 29.68 %
In this case, the value of RPD is above the control limit. (Also note that the relative standarduncertainties are larger than the 7 % required for concentrations above 5 .)Bq/g

MQOs For Method Uncertainty and Detection and Quantification Capability
C-15JULY 2004 MARLAP
C.4.2.3 Method Blanks
Case 1. If an aliquant of blank material is analyzed, or if a nominal aliquant size is used in thedata reduction, the measured blank result is an activity concentration. The target value is zero,but the measured value may be either positive or negative. So, the 2-sigma warning limits are± 2uMR and the 3-sigma control limits are ± 3uMR.
Case 2. If no blank material is involved (only reagents, tracers, etc., are used), the measuredresult may be a total activity, not a concentration. In this case the method uncertainty limit uMRshould be multiplied by the nominal or typical aliquant size, mS. Then the 2-sigma warning limitsare ± 2uMR mS and the 3-sigma control limits are ± 3 uMR mS.
The requirements for method blanks are summarized below.
Method Blanks
Concentration:Statistic: Measured concentrationWarning limits: ± 2uMRControl limits: ± 3uMR
Total Activity:Statistic: Measured total activityWarning limits: ± 2uMR mSControl limits: ± 3uMR mS
EXAMPLE C.8
(UBGR = 5 , uMR = 0.35 , φMR = 0.07)Bq/g Bq/g
Suppose a method blank is analyzed and the result of the measurement is
x = 0.00020 Bq with combined standard uncertainty uc(x) = 0.00010 Bq
Assuming the nominal aliquant mass is 1.0 g, or mS = 0.001 g, the result is evaluated bycomparing x to the warning and control limits:
± 2uMR mS = ± 0.00070 Bq± 3uMR mS = ± 0.00105 Bq
In this case x is within the warning limits.
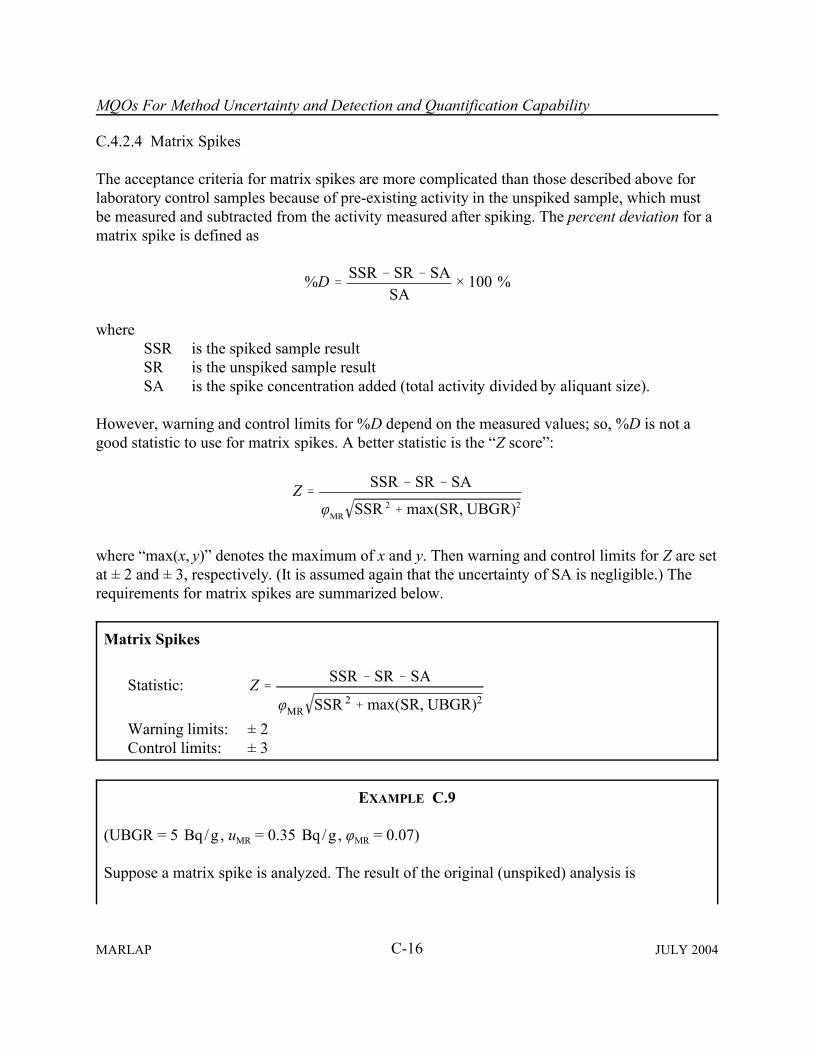
MQOs For Method Uncertainty and Detection and Quantification Capability
C-16MARLAP JULY 2004
%D 'SSR & SR & SA
SA× 100 %
Z 'SSR & SR & SA
φMR SSR 2 % max(SR, UBGR)2
C.4.2.4 Matrix Spikes
The acceptance criteria for matrix spikes are more complicated than those described above forlaboratory control samples because of pre-existing activity in the unspiked sample, which mustbe measured and subtracted from the activity measured after spiking. The percent deviation for amatrix spike is defined as
whereSSR is the spiked sample resultSR is the unspiked sample resultSA is the spike concentration added (total activity divided by aliquant size).
However, warning and control limits for %D depend on the measured values; so, %D is not agood statistic to use for matrix spikes. A better statistic is the �Z score�:
where �max(x, y)� denotes the maximum of x and y. Then warning and control limits for Z are setat ± 2 and ± 3, respectively. (It is assumed again that the uncertainty of SA is negligible.) Therequirements for matrix spikes are summarized below.
Matrix Spikes
Statistic: Z 'SSR & SR & SA
φMR SSR 2 % max(SR, UBGR)2
Warning limits: ± 2Control limits: ± 3
EXAMPLE C.9
(UBGR = 5 , uMR = 0.35 , φMR = 0.07)Bq/g Bq/g
Suppose a matrix spike is analyzed. The result of the original (unspiked) analysis is

MQOs For Method Uncertainty and Detection and Quantification Capability
C-17JULY 2004 MARLAP
SR = 3.5 with combined standard uncertainty uc(SR) = 0.29 Bq/g Bq/g
the spike concentration added is
SA = 10.1 with combined standard uncertainty uc(SA) = 0.31 Bq/g Bq/g
and the result of the analysis of the spiked sample is
SSR = 11.2 with combined standard uncertainty uc(SSR) = 0.55 Bq/g Bq/g
Since SR is less than UBGR (5), max(SR, UBGR) = UBGR = 5. So,
Z 'SSR & SR & SA
φMR SSR2 % UBGR2'
11.2 Bq/g & 3.5 Bq/g & 10.1 Bq/g
0.07 (11.2 Bq/g)2 % (5 Bq/g)2' &2.80
So, Z is less than the lower warning limit (�2) but slightly greater than the lower control limit(�3).
C.5 References
U.S. Environmental Protection Agency (EPA). 2000. Guidance for the Data Quality Objectives(DQO) Process. EPA QA/G-4. EPA/600/R-96/055. Office of Environmental Information,Washington, DC. Available at www.epa.gov/quality/qa_docs.html.
MARSSIM. 2000. Multi-agency Radiation Survey and Site Investigation Manual (MARSSIM)Rev. 1. NUREG-1575, Nuclear Regulatory Commission, Washington, DC. EPA 402-R-97-016, Environmental Protection Agency, Washington, DC. Available from www.epa.gov/radiation/marssim/.
Nuclear Regulatory Commission (NRC). 1998. A Nonparametric Statistical Methodology for theDesign and Analysis of Final Status Decommissioning Surveys. NUREG-1505. NRC,Washington, DC.


D-1JULY 2004 MARLAP
APPENDIX DCONTENT OF PROJECT PLAN DOCUMENTS
D.1 Introduction
Project plan documents were discussed in Chapter 4, Project Plan Documents. This appendixwill discuss appropriate content of plan documents. The content of project plan documents,regardless of the document title or format, will include similar information, including the projectdescription and objectives, identification of those involved in the project activities and theirresponsibilities and authorities, enumeration of the quality control (QC) procedures to befollowed, reference to specific standard operating procedures (SOPs) that will be followed for allaspects of the projects, and Health and Safety protocols.
The discussion of project plan document content in this appendix will rely on EPA�s guidance onelements for a QA project plan (QAPP). MARLAP selected EPA�s QAPP as a model for contentof a project plan document since it is closely associated with the data quality objective (DQO)planning process and because other plan documents lack widely accepted guidance regardingcontent. MARLAP hopes that presentation of a project plan document in one of the mostcommonly used plan formats will facilitate plan writing by those less familiar with the task,provide a framework for reviewing plan documents, and aid in tracking projects.
The discussion of plan content in Sections D2 to D5 follows the outline developed by EPArequirements (EPA, 2001) and guidance (EPA, 2002) for QAPPs for environmental dataoperations. The QAPP elements are presented in four major sections (Table D.1) that are referredto as �groups�:
� Project Management; � Measurement/Data Acquisition; � Assessment/Oversight; and � Data Validation and Usability.
There are many formats that can be used to present the project plan elements. MARLAP does notrecommend any particular plan format over another. The project planning team should focus onthe appropriate content of plan documentsneeded to address the necessary qualityassurance (QA), QC, and other technicalactivities that must be implemented to ensurethat the results of the work performed willsatisfy the stated performance criteria. TableD.2 provides a crosswalk between the table of
Contents
D.1 Introduction . . . . . . . . . . . . . . . . . . . . . . . . . . D-1D.2 Group A: Project Management . . . . . . . . . . . D-5D.3 Group B: Measurement/Data Acquisition . . D-14D.4 Group C: Assessment/Oversight . . . . . . . . . D-26D.5 Group D: Data Validation and Usability . . . D-28D.6 References . . . . . . . . . . . . . . . . . . . . . . . . . . D-31
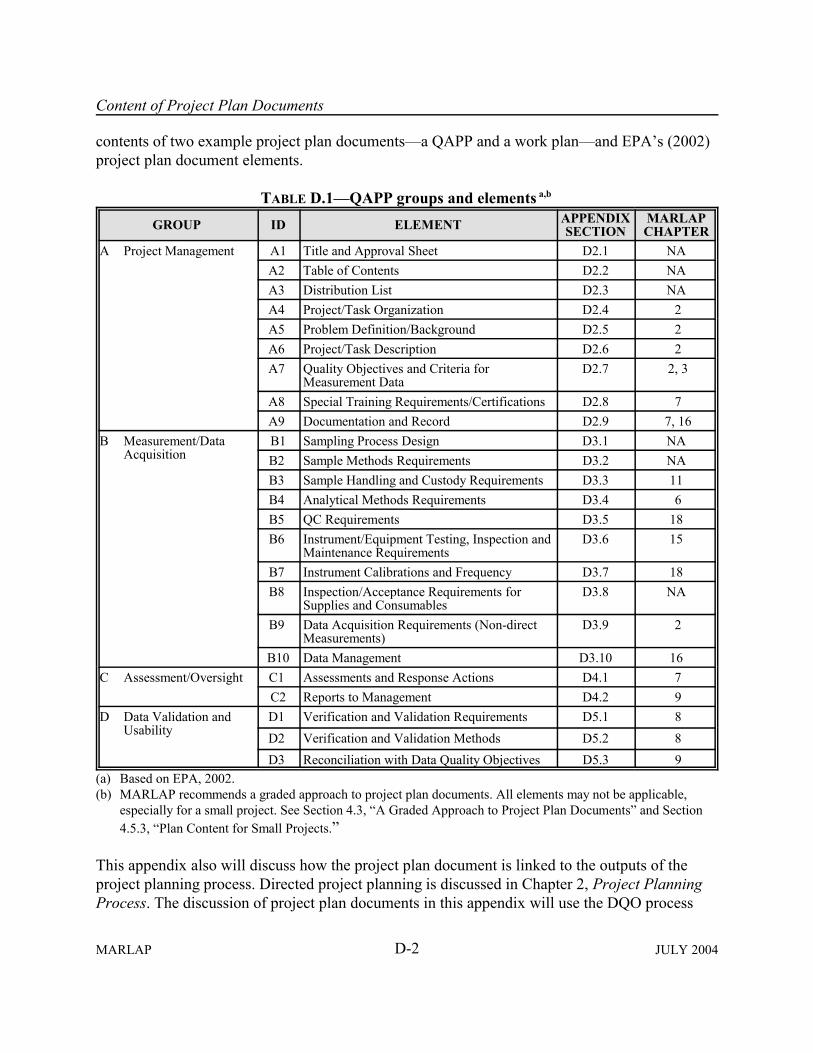
Content of Project Plan Documents
D-2MARLAP JULY 2004
contents of two example project plan documents�a QAPP and a work plan�and EPA�s (2002)project plan document elements.
TABLE D.1�QAPP groups and elements a,b
GROUP ID ELEMENT APPENDIXSECTION
MARLAPCHAPTER
A Project Management
A1 Title and Approval Sheet D2.1 NAA2 Table of Contents D2.2 NAA3 Distribution List D2.3 NAA4 Project/Task Organization D2.4 2A5 Problem Definition/Background D2.5 2A6 Project/Task Description D2.6 2A7 Quality Objectives and Criteria for
Measurement DataD2.7 2, 3
A8 Special Training Requirements/Certifications D2.8 7A9 Documentation and Record D2.9 7, 16
B Measurement/DataAcquisition
B1 Sampling Process Design D3.1 NAB2 Sample Methods Requirements D3.2 NAB3 Sample Handling and Custody Requirements D3.3 11B4 Analytical Methods Requirements D3.4 6B5 QC Requirements D3.5 18B6 Instrument/Equipment Testing, Inspection and
Maintenance RequirementsD3.6 15
B7 Instrument Calibrations and Frequency D3.7 18B8 Inspection/Acceptance Requirements for
Supplies and ConsumablesD3.8 NA
B9 Data Acquisition Requirements (Non-directMeasurements)
D3.9 2
B10 Data Management D3.10 16C Assessment/Oversight
C1 Assessments and Response Actions D4.1 7C2 Reports to Management D4.2 9
D Data Validation andUsability
D1 Verification and Validation Requirements D5.1 8D2 Verification and Validation Methods D5.2 8D3 Reconciliation with Data Quality Objectives D5.3 9
(a) Based on EPA, 2002.(b) MARLAP recommends a graded approach to project plan documents. All elements may not be applicable,
especially for a small project. See Section 4.3, �A Graded Approach to Project Plan Documents� and Section4.5.3, �Plan Content for Small Projects.�
This appendix also will discuss how the project plan document is linked to the outputs of theproject planning process. Directed project planning is discussed in Chapter 2, Project PlanningProcess. The discussion of project plan documents in this appendix will use the DQO process
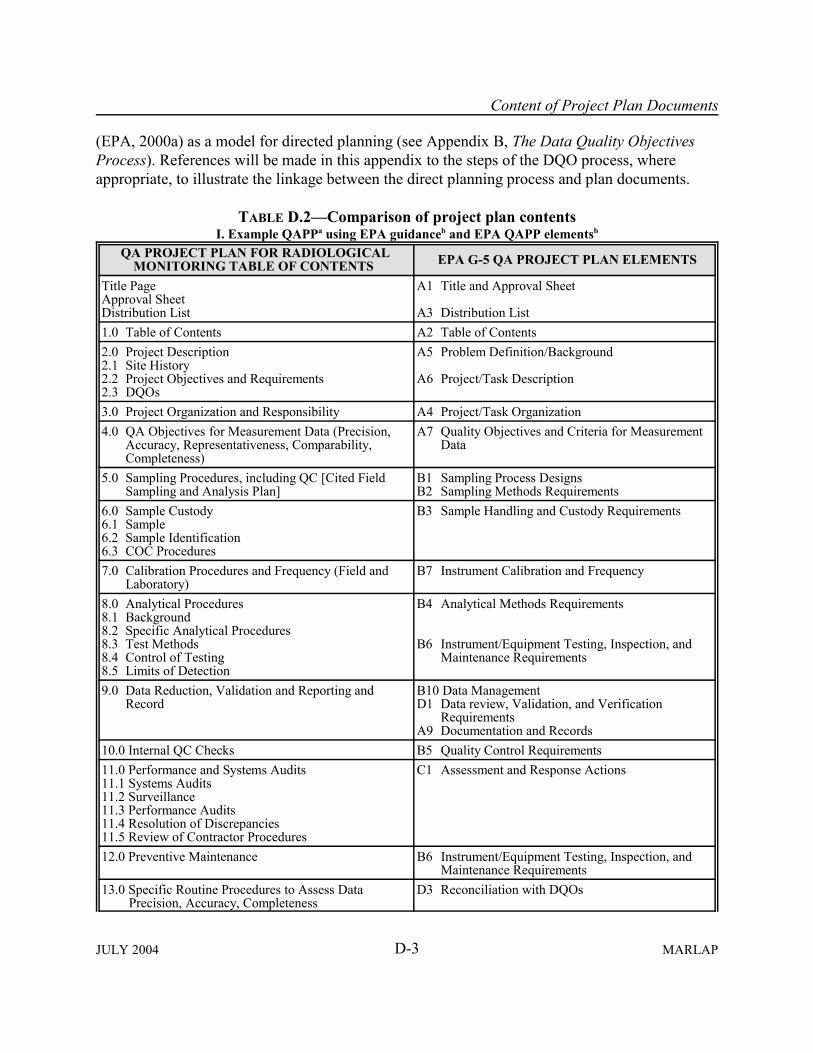
Content of Project Plan Documents
D-3JULY 2004 MARLAP
(EPA, 2000a) as a model for directed planning (see Appendix B, The Data Quality ObjectivesProcess). References will be made in this appendix to the steps of the DQO process, whereappropriate, to illustrate the linkage between the direct planning process and plan documents.
TABLE D.2�Comparison of project plan contentsI. Example QAPPa using EPA guidanceb and EPA QAPP elementsb
QA PROJECT PLAN FOR RADIOLOGICALMONITORING TABLE OF CONTENTS EPA G-5 QA PROJECT PLAN ELEMENTS
Title PageApproval SheetDistribution List
A1 Title and Approval Sheet
A3 Distribution List1.0 Table of Contents A2 Table of Contents2.0 Project Description2.1 Site History2.2 Project Objectives and Requirements2.3 DQOs
A5 Problem Definition/Background
A6 Project/Task Description
3.0 Project Organization and Responsibility A4 Project/Task Organization4.0 QA Objectives for Measurement Data (Precision,
Accuracy, Representativeness, Comparability,Completeness)
A7 Quality Objectives and Criteria for MeasurementData
5.0 Sampling Procedures, including QC [Cited FieldSampling and Analysis Plan]
B1 Sampling Process DesignsB2 Sampling Methods Requirements
6.0 Sample Custody6.1 Sample6.2 Sample Identification6.3 COC Procedures
B3 Sample Handling and Custody Requirements
7.0 Calibration Procedures and Frequency (Field andLaboratory)
B7 Instrument Calibration and Frequency
8.0 Analytical Procedures8.1 Background8.2 Specific Analytical Procedures8.3 Test Methods8.4 Control of Testing 8.5 Limits of Detection
B4 Analytical Methods Requirements
B6 Instrument/Equipment Testing, Inspection, andMaintenance Requirements
9.0 Data Reduction, Validation and Reporting andRecord
B10 Data ManagementD1 Data review, Validation, and Verification
RequirementsA9 Documentation and Records
10.0 Internal QC Checks B5 Quality Control Requirements11.0 Performance and Systems Audits11.1 Systems Audits11.2 Surveillance11.3 Performance Audits11.4 Resolution of Discrepancies11.5 Review of Contractor Procedures
C1 Assessment and Response Actions
12.0 Preventive Maintenance B6 Instrument/Equipment Testing, Inspection, andMaintenance Requirements
13.0 Specific Routine Procedures to Assess Data Precision, Accuracy, Completeness
D3 Reconciliation with DQOs

Content of Project Plan Documents
QA PROJECT PLAN FOR RADIOLOGICALMONITORING TABLE OF CONTENTS EPA G-5 QA PROJECT PLAN ELEMENTS
D-4MARLAP JULY 2004
14.0 Corrective Action15.0 QA Report to Management C2 Response to Management16.0 References
A8 Special Training Requirements/CertificationB8 Inspection/Acceptance Requirements for Supplies
and ConsumablesB9 Data Acquisition Requirement for Non-direct
MeasurementsD2 Verification and Validation Methods
II. Example work planc and EPA QA/G-5 QAPP elementsb
Work Plan Table of Contents EPA QAPP ElementsCover Letter A3 Distribution ListTitle Page (including Document Number, Preparedby/Prepared for Identification)
A1 Title and Approval Sheet
Approvals A1 Title and Approval Sheet Table of Contents A2 Table of Contents1 Introduction/Background Site and Regulatory Background A5 Problem Definition/BackgroundProject Scope and Purpose A6 Project/Task DescriptionProject Organization and Management A4 Project/Task OrganizationData Quality Objectives and Approach A7 Quality Objectives and Criteria for Measurement DataEnvironmental Setting A5 Problem Definition/BackgroundSampling Site Selection, Locations andIdentification
B1 Sampling Process Design
2 Sampling and Analysis PlanObjective B1 Sampling Process DesignQA Objectives for Field Measurements, LaboratoryMeasurements (including Calibration Proceduresand Frequency)
A7 Quality Objectives and Criteria for Measurement DataB7 Instrument Calibrations and Frequency
Sample Collection Procedures B2 Sample Methods RequirementsSample Identification, Handling and Transport B3 Sample Handling and Custody RequirementsSample Analysis B4 Analytical Methods RequirementsSample Tracking and Records B10 Data ManagementData Reduction, Validation and Reporting D1 Data Review, Verification, and Validation
RequirementsD2 Verification and Validation Methods
Internal QC Checks B5 QC Requirements3 QA Project PlanQA Training and Awareness

Content of Project Plan Documents
Work Plan Table of Contents EPA QAPP Elements
D-5JULY 2004 MARLAP
Performance and Systems Audits C1 Assessments and Response ActionsPreventive Maintenance B6 Instrument/Equipment Testing, Inspection, and
Maintenance RequirementsQuality Improvement B6 Instrument/Equipment Testing, Inspection, and
Maintenance RequirementsQA Reports to Management C2 Reports to ManagementPurchase Items and Service Control B8 Inspection/Acceptance Requirements for Supplies and
Consumables4 Data and Records Management PlanObjectivesData ManagementDocument ControlRecords Management SystemAdministrative Records
A9 Documentation and RecordB10 Data Management
5 Data Interpretation PlanApproach for Data EvaluationData Interpretation and Comparisons
D3 Reconciliation with DQOs
6 Risk Analysis Plan �� 7 Health and Safety Plan �� B9 Data Acquisition Requirements (Non-direct
Measurements) A8 Special Training Requirements/Certifications
(a) Plan elements adapted from DOE, 1997.(b) EPA, 2002(c) Plan elements adapted from DOE, 1996.
It should be noted that although the project plan documents will address both sampling andanalysis, MARLAP does not provide guidance on sampling design issues or sample collection.Discussion in D3.1, �Sample Process Design,� and D3.2, �Sample Methods Requirements,� areprovided for completeness and consistency.
D.2 Group A: Project Management
This group consists of nine elements that address project management issues such as organiza-tion of the plan itself, management systems, and a description of project goals, participants andactivities. These elements ensure that the project goals are clearly stated, the approach to be usedis understood, and the project planning decisions are documented.
D.2.1 Project Management (A1): Title and Approval Sheet
The project title sheet should:
� Clearly identify the project in an unambiguous manner;
Content of Project Plan Documents
D-6MARLAP JULY 2004
� Include references to organizational identifiers such as project numbers (when appropriate);
� Clearly label and distinguish between draft and approved versions;
� Include the date of issuance of drafts or final approved version;
� Include revision or version numbers;
� Indicate if the document represents only a portion of the QAPP (e.g., Volume 1 of 4Volumes);
� Include names of the organization(s) preparing the plan document and, if different, for whomthe plan was prepared; and
� Identify clearly on the title page if the document is a controlled copy and subjected to no-copying requirements. If so, indicate the document control number.
QAPPs should be reviewed on an established schedule. QAPPs should be kept current andrevised when necessary. Documented approval, as an amendment to the QAPP, should beobtained for modifications to the QAPP.
The approval sheet documents that the QAPP has been reviewed and approved prior toimplementation. The approval sheet should consist of the name, title, organization, signature andsignature date for:
� The project manager or other person with overall responsibility for the project;
� The QA manager or other person with overall responsibility for the quality of the projectoutputs;
� The project managers or QA managers for all organizations (e.g., sampling organization,laboratories, data validators) implementing project activities; and
� The representative of any oversight or regulatory organization.
The project manager or other person with overall responsibility for the project should require anapproved QA program, management plan, or quality manual that supports all technicaloperations, including data collection and assessment activities.
Content of Project Plan Documents
D-7JULY 2004 MARLAP
D.2.2 Project Management (A2): Table of Contents
The table of contents should:
� List all sections and subsections of the document, references, glossaries, acronyms andabbreviations, appendices (including sections and subsections) and the associated pagenumbers;
� List all attachments and the associated page numbers;
� List all tables and associated page numbers;
� List all figures and diagrams and associated page numbers; and
� List titles of other volumes, if the QAPP consists of more than one volume.
A document control format is useful in maintaining reference to the latest version of the planneddocument, especially when only portions of a document have been copied and are being used toimplement or discuss project activities.
D.2.3 Project Management (A3): Distribution List
The distribution list should identify all individuals, along with their titles and organizations, whowill receive copies and revisions of the approved QAPP and subsequent revisions. Listedindividuals should include, at a minimum, all managers and QA personnel responsible for theimplementation and quality of the data collection activities. The project planning team or the coregroup (Section 2.4) should be included on the document distribution list.
D.2.4 Project Management (A4): Project/Task Organization
This QAPP element should:
� Identify the individuals and/or organizations participating in the project, as well as contactinformation (address, telephone number, fax number, e-mail). The stakeholders, data users,decision makers, and technical planning team members, and the person or organization thatwill be responsible for project implementation, are identified during the directed planningprocess (Appendix B, The DQO Process, Steps 1 and 7).
� Discuss the roles and responsibilities of the individuals and/or organizations that participatein the data collection, including the roles and responsibilities of the data users, decisionmakers, and QA manager.

Content of Project Plan Documents
D-8MARLAP JULY 2004
� Include an organizational chart clearly showing the relationship, lines of authority andcommunication, and mechanisms for information exchange among all project participants.
Complex projects may require more than one organizational chart to properly describe therelationships among participants. At times, to clearly detail an organizations responsibilities andcommunications, a general inter-organizational chart with primary contacts, responsibilities, andcommunications may need to be accompanied by secondary charts that describe intra-organizational contacts, responsibilities, and lines of communication.
One of the keys to successful projects is communication. The QAPP should identify the point ofcontact for resolving field and laboratory problems. The QAPP may also summarize the points ofcontact for dissemination of data to managers, users and the public.
D.2.5 Project Management (A5): Problem Definition/Background
The �Problem Definition/Background� element (A5) and the subsequent elements �Project/TaskDescription� (A6) and �Quality Objectives and Criteria� (A7) constitute the project description.Separating the project description into three elements focuses and encourages the plan authors toaddress all key issues (identification of problem to be solved, description of site history,description of tasks and the quality objectives and data-acceptance criteria), some of which canbe overlooked if a larger, less-focused section is written. Table D.3 provides bulletedcomponents for these three elements. This section and sections D.2.6 and D.2.7 provide a moredetailed discussion of these elements.
TABLE D.3�Content of the three elements that constitute the project descriptionProblem
Definition/Background(A5)
Project/Task Description
(A6)
Objectives and Criteria
(A7)
C Serves as an Introduction C Identifies the �problem to be
solved� or the �question tobe answered�
C Identifies the regulatory,legal or �informationalneeds� drivers
C Presents the historicalperspective
C Describes measurements C Identifies regulatory standards
and action levels C Identifies special personnel,
procedural and equipmentrequirements
C Summarizes assessment tools C Details schedule and milestones C Identifies record and report
requirements
Quality Objectives C Problem definition/Site history C Data inputs C Population boundaries C Tolerable decision error rates
Criteria for Measurement Data C Measurement quality
objectives (MQOs; such as themeasurement uncertainty atsome concentration; thedetection capability; thequantification capability; therange; the specificity; and theruggedness of the method)

Content of Project Plan Documents
D-9JULY 2004 MARLAP
The Problem Definition/Background element provides the implementation team with anunderstanding of the pertinent context of the project. This section does not discuss the details ofproject activities, which are described in a subsequent project management element. Much of theinformation needed for this element was collected and discussed during Step 1 of the DQOprocess (Appendix B3.1). The decision statement was developed during Step 2 of the DQOprocess.
The �Problem Definition/Background� element should:
� Introduce the project;
� Identify the �problem to be solved� or the �question to be answered� upon successfulcompletion of the project�the decision rule (Appendix B3.6);
� Discuss the assumptions, limitations, and scope of the project;
� Identify the regulatory, legal, or �informational needs� drivers that are the underlying reasonsfor the project; and
� Describe the context of the project so that it can be put into a historical perspective. Thissection may include a description and maps of a facility or site, its location, its use, sitetopography, geology and hydrogeology, past data collection activities, historical dataincluding analytes and concentrations, past and present regulatory status, past releases,seriousness and potential risk of any release, site maps, and utilities.
If the data collection activity is in support of a technology evaluation, it should also discuss thepurpose of the demonstrations, how the technology works, its operating conditions, any requiredutilities, its effluents and waste by-products and residues, past and expected efficiencies, andmulti-media mass-balances by analyte and matrix.
D.2.6 Project Management (A6): Project/Task Description
This element of the QAPP provides a discussion of the project and underlying tasks for theimplementation teams. It should provide a description of the work to be performed to resolve theproblem or answer the question, including the following information:
� A description of the measurements and the associated QA/QC procedures that are to be madeduring the course of the project. DQO Step 3 describes existing and needed data inputs, whileStep 7 yields the optimized sampling and analytical designs as well as quality criteria. N Identification of the analytes of interest.

Content of Project Plan Documents
D-10MARLAP JULY 2004
N A summary (preferably a table) of samples type (e.g., grab, spatial or temporalcomposite), number of samples, analyte or analyte class (e.g., 99Tc, transuranic, gammaemitters) and analytical protocol specifications or method.
� A discussion of applicable regulatory standards or action levels to which measurements willbe compared. Identify any applicable regulatory standard (e.g., gross alpha drinking watermaximum contamination limit), or applicable or relevant and appropriate requirements(ARARs) that will be used as a metric or action level during decision-making. The DQO Step6 details action levels and tolerable decision errors that will be the basis for decisions.
� Identify any special requirements required to implement project tasks. N Identify any special training (e.g., hazardous waste site health and safety training (29 CFR
1910.120), radiation safety training). N Identify any special protective clothing and sampling equipment. N Identify any boundary conditions (e.g., only sample after a rainfall of more than 1 inch). N Specify any special document format, chain-of-custody, or archival procedures. N Identify any special sample handling (e.g., freezing of tissue samples), instrumentation, or
non-routine analytical protocols that are required to achieve specified performancecriteria (e.g., very low detection limits) (see also Chapter 3, Key Analytical PlanningIssues and Developing Analytical Protocol Specifications).
� Summarize the assessment tools that will be employed to determine whether measurementdata complied with performance criteria and are suitable to support decision-making. Includea schedule of the assessment events. Assessment tools include performance evaluations,program technical reviews, surveillance, technical and systems audits, and verification andvalidation. Briefly outline: N A first tier of reviews (e.g., when field or lab personnel check each other�s notes or
calculations). N Reviews of the work, notes and calculations of subordinates by the supervisor (e.g.,
review and sign all notebook entries). N The percentage of data subject to review by internal QA staff. N Data verification and validation to be performed by an independent party and the
guidelines or plan to be used. N Assessment of project activities to be conducted by personnel independent of project
activities (e.g., performance evaluation samples, surveillance, audits). N Assessment of how results of the project will be reconciled with the project DQOs (�data
quality assessment�).
� Supply a schedule that includes start and completion dates for tasks and a list of completiondates for important milestones. Dates can be calendric, or as number of days followingapproval of the QAPP, or number of days following commencement of field operations.DQO Steps 1 and 4 identify deadlines and other constraints that can impact scheduling.

Content of Project Plan Documents
D-11JULY 2004 MARLAP
� Identify the records and reports that will be required. This should be a brief but completelisting of necessary reports and records (e.g., field and lab notebooks, sample logbooks,spectra, sample tracking records, laboratory information system print-outs, QA reports,corrective action reports).
� Identify whether the original documents are required or if photocopies are sufficient. Moredetailed information will be presented in �Documentation and Records� (A9) and �DataManagement� (B10).
D.2.7 Project Management (A7): Quality Objectives and Criteria for Measurement Data
This element addresses two closely related but different issues, quality objectives for the projectand criteria used to evaluate the quality of measurement data. The element summarizes outputsfrom all steps of the DQO process. A fundamental principle underlying plan documents is thatrequirements for the data quality must be specified by the project planning team and documented.By clearly stating the intended use of the data and specifying qualitative and quantitative criteriafor system performance, a critical link between the needs of the project planning team and theperformance requirements to be placed on the laboratory data is established. (See Chapter 3 for adiscussion of MQOs.)
D.2.7.1Project�s Quality Objectives
The project�s quality objectives or data quality objectives (DQOs) are qualitative and quantitativestatements that:
� Clarify the intended use of the data (e.g., data will be used to determine if lagoon sedimentcontains 232Th at concentrations greater than or equal to the action level);
� Define the type and quantity of data per matrix needed to support the decision (e.g., 232Thconcentrations in 300 composite sediments samples each composite consisting of 10 samplesrandomly collected from a 100 m2 sampling grid adjacent to the point of discharge);
� Identify the conditions under which the data should be collected (e.g., sediment samplescollected from the top 6 cm of sediment within a 100 m radius of the point of discharge intolagoon #1, following de-watering of the lagoon and prior to sediment removal); and
� Specify tolerable limits on the probability of making a decision error due to uncertainty in thedata and any associated action levels (e.g., 95 percent confidence that the true concentrationis actually below the action level).
Content of Project Plan Documents
D-12MARLAP JULY 2004
Authors of project plan documents are often encouraged to condense the DQO outputs in asummary statement. This approach can have value as long as critical information is not lost in thesummary process and the original information is cited and available for all project participants.The following is an example of a DQO summary statement:
�The purpose of this project is to determine, to within a lateral distance of 10 m, the extent of232Th in soil along a pipeline at concentrations at or above 1,145 mBq/g, with a Type I errorrate less than or equal to 5 percent; and to define within 1 m the vertical extent of measured232Th concentrations greater than 7,400 mBq/g.�
D.2.7.2Specifying Measurement Quality Objectives
Measurement quality objectives (MQOs) or measurements performance criteria are essential tothe success of a project since they establish the necessary quality of the data. The quality of datacan vary as a result of the occurrence and magnitude of three different types of errors (Taylor,1990).
� BLUNDERS�mistakes that occur on occasion and produce erroneous results (e.g., mis-labeling or transcription errors);
� SYSTEMATIC ERRORS�mistakes that are always the same sign and magnitude and producebias (i.e., they are constant no matter how many measurements are made); and
� RANDOM ERRORS�mistakes that vary in sign and magnitude and are unpredictable on anindividual basis (i.e., random differences between repetitive readings) but will average out ifenough measurements are taken.
The frequent occurrence of these types of errors is the reason why data quality is subject toquestion, why there is uncertainty when using data to make decisions and why measurementperformance criteria are necessary.
During the DQO process, project DQOs are used to establish the MQOs. An MQO is a statementof a performance objective or requirement for a particular method performance characteristic.Examples of method performance characteristics include the measurement uncertainty at someconcentration; the detection capability; the quantification capability; the range; the specificity;and the ruggedness of the method. MQOs for the project should be identified and describedwithin this element of the QAPP. MARLAP provides guidance for developing MQOs for selectmethod performance characteristics in Chapter 3 (Key Analytical Planning Issues andDeveloping Analytical Protocol Specifications) and Appendix C (MQOs for Method Uncertaintyand Detection and Quantification Capability).
Content of Project Plan Documents
D-13JULY 2004 MARLAP
D.2.7.3Relation between the Project DQOs, MQOs, and QC Requirements
The ultimate goal of all data collection operations is the collection of appropriately accurate data.Appropriately accurate data are data for which errors caused by imprecision and bias arecontrolled such that it is suitable for use in the context outlined by the DQOs (i.e., the overallerror is less than that specified in the acceptable decision error). During the optimization ofdesign in the planning process, DQO-specified decision error rates are translated into MQOs withthe intention of monitoring, detecting, quantifying and controlling imprecision and analyticalbias. During optimization, precautions are also incorporated into the design with the intention ofpreventing blunders and types of non-measurable bias not susceptible to measurement by QCsamples.
The MQOs provide acceptance or rejection criteria for the quality control samples whose typesand frequency are discussed in the Quality Control Requirements element (B5) (Appendix C).QC samples and the project�s associated MQOs are key�but not the sole mechanisms�formonitoring the achievement of DQOs.
In summary, translating acceptable decision error rates into a design that will produce data ofappropriate precision and bias is often a complex undertaking. The team must consider thesynergistic and antagonistic interactions of the different options for managing errors anduncertainty. Accurate data require not only control of imprecision, but must also control thevarious forms of bias.
D.2.8 Project Management (A8): Special Training Requirements/Certification
All project personnel should be qualified and experienced in their assigned task(s). The purposeof this element is to add additional information regarding special training requirements and howthey will be managed during implementation of the project. This element should:
� Identify and describe any mandated or specialized training or certifications that are required; � Indicate if training records or certificates are included in the QAPP as attachments; � Explain how training will be implemented and certifications obtained; and � Identify how training documentation and certification records will be maintained.
D.2.9 Project Management (A9): Documentation and Record
This element of the QAPP will identify which records are critical to the project, from datageneration in the field to final use. It should include what information needs to be contained inthese records and reports, the formats of the records and reports, and a brief description ofdocument control procedures. The following are suggested records and content:

Content of Project Plan Documents
D-14MARLAP JULY 2004
� SAMPLE COLLECTION RECORDS should include sampling procedures, the names of the personsconducting the activity, sample number, sample collection points, maps and diagrams,equipment/protocol used, climatic conditions, and unusual observations. Bound fieldnotebooks, pre-printed forms, or computerized notebooks can serve as the recording media.Bound field notebooks are generally used to record raw data and make references toprescribed procedures, changes in planned activities and implementation of correctiveactions. Preferably, notebooks will contain pre-numbered pages with date and signature linesand entries will be made in ink. Field QC issues such as field, trip, and equipment rinsateblanks, co-located samples, field-spiked samples, and sample preservation should bedocumented. Telephone logbooks and air bill records should be maintained.
� SAMPLE TRACKING RECORDS document the progression of samples as they travel from theoriginal sampling location to the laboratory and finally to their disposal or archival. Theserecords should contain sample identification, the project name, signatures of the samplecollector, the laboratory custodian and other custodians, and the date and time of receipt. Therecords should document any sample anomalies. If chain-of-custody (COC) is required forthe project, the procedures and requirements should be outlined (Chapter 11, Sample Receipt,Inspection, and Tracking).
� ANALYTICAL QC issues that should be documented include standard traceability, andfrequency and results of QC samples, such as, method and instrument blanks, spikedsamples, replicates, calibration check standards and detection limit studies.
� ANALYTICAL RECORDS should include standard operating procedures for sample receipt,preparation, analysis and report generation. Data report formats and the level of supportinginformation is determined by data use and data assessment needs.
� PROJECT ASSESSMENT RECORDS should include audit check lists and reports, performanceevaluation (PE) sample results, data verification and validation reports, corrective actionreports. The project may want to maintain copies of the laboratory proposal package, pre-award documentation, initial precision and bias test of the analytical protocol and anycorrective action reports.
The QAPP should indicate who is responsible for creating, tracking, and maintaining theserecords and when records can be discarded, as well as any special requirements for computer,microfiche, and paper records.
D.3 Group B: Measurement/Data Acquisition
The Measurement/Data Acquisition group consists of 10 elements that address the actual datacollection activities related to sampling, sample handling, sample analysis and the generation of

Content of Project Plan Documents
D-15JULY 2004 MARLAP
data reports. Although these issues may have been previously considered by project managementelements, the project management section of the QAPP dealt with the overall perspective. Themeasurement/data section contains the details covering design and implementation to ensure thatappropriate protocols are employed and documented. This section also addresses quality controlactivities that will be performed during each phase of data collection from sampling to datareporting.
D.3.1 Measurement/Data Acquisition (B1): Sampling Process Design
This element of the QAPP describes the finalized sampling design that will be used to collectsamples in support of project objectives. The design should describe the matrices to be sampled,where the samples will be taken, the number of samples to be taken, and the sampling frequency.A map of the sampling locations should be included to provide unequivocal sample locationdetermination and documentation.
If a separate sampling and analysis plan or a field sampling and analysis plan has beendeveloped, it can be included by citation or as an appendix. This element will not address thedetails of standard operating procedures for sample collection, which will be covered insubsequent elements. This element will describe the sampling design and the underlying logic, sothat implementation teams can understand the rationale behind and better implement thesampling effort. Understanding the rationale for the decisions will help if plans have to bemodified due to conditions in the field. DQO Step 7 establishes the rationale for and the detailsof the sampling design.
This element should restate the outputs of the planning process and any other considerations andassumptions that impacted the design of the sampling plan, such as:
� The number of samples, including QC samples, sample locations and schedule, and rationalefor the number and location of samples;
� A brief discussion of how the sampling design will facilitate the achievement of projectobjectives;
� A discussion of the population boundaries (temporal and spatial) and any accessibilitylimitations;
� A description of how the sampling design accommodates potential problems caused by thephysical properties of the material being sampled (e.g., large particle size), the characteristicof concern (e.g., potential losses due to the volatility of tritium) or heterogeneity;
� A discussion of the overarching approach to sampling design (e.g., worse case or best casesampling versus average value) and assumptions made in selecting this approach (e.g., an
Content of Project Plan Documents
D-16MARLAP JULY 2004
assumption that the darkened soil adjacent to the leaking tank would present a worse caseestimate of soil contamination);
� A listing of guidance and references that were relied upon when designing the sampling plan;
� Identification of the characteristics of interest (e.g., 99Tc activity), associated statisticalparameters (e.g., mean, standard deviations, 99th percentile), and acceptable false error rates(e.g., false negative rate of less than 5%);
� Identification of relevant action level and how data will be compared to the action level(Appendix B3.2);
� A discussion of the anticipated range of the characteristic of interest and assumed temporaland spatial variations (heterogeneity), anticipated variance, anticipated sources andmagnitude of error (e.g., heterogeneity of material being sampled, sampling imprecision,analytical imprecision), anticipated mean values and distribution of measurements and thebasis (e.g., historical data, similar processes or sites) for any associated assumptions;
� If any level of bias is assumed, what is the assumed magnitude and the basis of theassumption (e.g., historical data, typical analytical bias for matrix type);
� It is usually assumed that the magnitude of measurements made at individual samplinglocations are independent of each other (e.g., no correlation of concentration with location).Geostatistical approaches may be more appropriate if measurements are significantlycorrelated with locations (e.g., serial-correlation, auto-correlation) since serial-correlation canbias estimates of variance and invalidate traditional probabilistic techniques such ashypothesis testing; and
� A discussion of the rationale for choosing non-routine sampling protocols and why these non-routine protocols are expected to produce acceptable precision and bias.
D.3.2 Measurement/Data Acquisition (B2): Sampling Methods Requirements
This element of the QAPP describes the detailed sampling procedures that will be employedduring the project. The preliminary details of sampling methods to be employed were establishedduring Step 7 of the DQO process. The selected sampling procedures should be appropriate to (1)ensure that a representative sample is collected, (2) avoid the introduction of contaminationduring collection, and (3) properly preserve the sample to meet project objectives. Written SOPsshould be included as attachments to the QAPP. This element and the appendices or otherdocuments that it references should in total contain all the project specific details needed tosuccessfully implement the sampling effort as planned. If documents to be cited in the QAPP arenot readily available to all project participants, they must be incorporated as appendices. All
Content of Project Plan Documents
D-17JULY 2004 MARLAP
sampling personnel should sign that they have read the sampling procedures and the health andsafety procedures.
Correct sampling procedures and equipment used in conjunction with a correct sampling designshould result in a collection of samples that in total will represent the population of interest. Adetailed discussion of sampling procedures, equipment and design are beyond the scope ofMARLAP. In general, the selected procedures must be designed to ensure that the equipment isused properly and that the collected samples represent the individual sampling unit from whichsamples are collected. The sampling equipment should be chemically and physically compatiblewith the analyte of concern as well as the sample matrix. The sampling design should facilitateaccess to individual sampling units, result in an appropriate mass/volume of sample such that itmeets or exceeds minimum analytical sample sizes, accommodates short-range heterogeneity(i.e., does not preclude large particle sizes or lose small particles) and reduce or prevent loss ofvolatile components, if appropriate.
This element of the QAPP should:
� Identify the sampling methods to be used for each matrix, including the method number if astandardized method. If methods are to be implemented differently than specified by thestandard method or if the standard method offers alternatives for implementation, thedifferences and alternatives should be specified;
� Identify the performance requirements of the sampling method. If the sampling method ofchoice is unlikely to be able to achieve the level of performance demanded by the projectDQO, the project planning team should be notified;
� Identify the required field QC samples (e.g., trip blank, co-located duplicate);
� Identify any sample equipment preparation (e.g., sharpening of cutting edges, degreasing andcleaning) or site preparation (e.g., removal of overburden, establishing dust-free work spacefor filtering) for each method;
� Identify and preferably generate a list of equipment and supplies needed. For example, thesampling devices, decontamination equipment, sampling containers, consumables (e.g., papertowels), chain-of-custody seals and forms, shipping materials (e.g., bubble-pack, tape), safetyequipment and paper work (e.g., pens, field books);
� Identify and detail logistical procedures for deployment, sample shipment and demobili-zation. If a mobile lab will be used, explain its role and the procedures for sample flow to themobile lab and data flow to the data-user;
Content of Project Plan Documents
D-18MARLAP JULY 2004
� Identify, preferably in a tabular form, sample container types, sizes, preservatives, andholding times;
� Identify procedures that address and correct problems encountered in the field (variances andnonconformance to the established sampling procedures);
� Identify for each sampling method, decontamination procedures and the procedures fordisposing of contaminated equipment and used-decontamination chemicals and waters;
� Identify the disposal procedures for waste residuals generated during the sampling process(e.g., purged well waters, drilling dregs) for each method; and
� Identify oversight procedures (e.g., audits, supervisor review) that ensure that samplingprocedures are implemented properly. The person responsible for implementing correctiveactions should be identified.
D.3.3 Measurement/Data Acquisition (B3): Sample Handling and Custody Requirements
This element of the QAPP details how sample integrity will be maintained and how the samplehistory and its custody will be documented ensuring that (1) samples are collected, transferred,stored, and analyzed by authorized personnel, (2) the physical, chemical and legal integrity ofsamples is maintained, and (3) an accurate written record of the history of custody is maintained.DQO Step 1 describes the regulatory situation which can be used to identify the appropriate levelof sample tracking. The QAPP should state whether COC is required. Sample handling, trackingand COC requirements are discussed in detail in Chapter 11, Sample Receipt, Inspection, andTracking.
In the QAPP, the following elements should be documented:
� INTEGRITY OF SAMPLE CONTAINERS: Describe records to be maintained on the integrity ofsample container and shipping container seals upon receipt. Describe records to bemaintained if specially prepared or pre-cleaned containers are required.
� SECURITY: If wells are being sampled, whether the wellheads were locked or unlocked shouldbe noted. Security of remote sampling sites or automatic samplers not maintained in lockedcages should be discussed.
� SAMPLE IDENTIFICATION: The assignment of sample numbers and the labeling of samplecontainers is explained. If samples are to be assigned coded sample identifications (IDs) topreclude the possibility of bias during analysis, the sample code is one of the few items thatwill not be included in the QAPP, since the lab will receive a copy. The code and sample IDassignment process will have to be described in a separate document, which is made available

Content of Project Plan Documents
D-19JULY 2004 MARLAP
to the field team and the data validators. An example of a sample label should be included inthe QAPP.
� TRACKING OR CUSTODY IN THE FIELD: Procedures for sample tracking or custody while in thefield and during sample shipment should be described. When COC is required, a copy of theCOC form and directions for completion should be included. A list of all materials neededfor tracking or custody procedures should be provided (e.g., bound notebooks, shippingcontainers, shipping labels, tape, custody seals, COC forms).
� SAMPLE PRESERVATION: Sample preservation procedures, if desired, should be clearlydescribed. Preservation of radiological samples is discussed in Chapter 10, Field andSampling Issues that Affect Laboratory Measurements.
� TRACKING OR CUSTODY IN THE LABORATORY: A decision must be made as to whether thelaboratory in general is considered a secure area such that further security is not required oncethe sample is officially received by the laboratory or whether internal tracking or custodyprocedures will be required as the samples are handled by different personnel within the lab.The laboratory�s sample receipt SOP, laboratory security procedures, and�if needed�internal tracking or custody procedures should be described.
� SPECIAL REQUIREMENT: Any special requirements, such as shipping of flammable or toxicsamples, or requirements for verification of sample preservation upon sample receipt by thelaboratory should be clearly described.
� ARCHIVAL: Document the rationale for the request to archive samples, extracts, anddigestates. Describe how samples, extracts, and digestates will be archived. Identify how longsamples, extracts, digestates, reports, and supporting documentation must be maintained.
D.3.4 Measurement/Data Acquisition (B4): Analytical Methods Requirements
This element of the QAPP should identify the analytical protocol specifications (APSs) includingthe MQOs that were employed by the laboratory to select the analytical protocols. (See Chapter 3for guidance on developing APSs.) This element integrates decisions from three DQO steps: Step3 which identified the analyte of interest and needed inputs to the decision, Step 6 that identifiesthe allowable uncertainty, and Step 7 that identifies the optimized analytical design. Input fromall three steps drive the choice of analytical protocols. The discussion of the selected analyticalprotocols should address: subsampling, sample preparation, sample clean-up, radiochemicalseparations, the measurement system, confirmatory analyses and pertinent data calculation andreporting issues. A tabular summary of the analytical protocol by matrix type can facilitatereference for both the plan document development team and the laboratory analytical team.

Content of Project Plan Documents
D-20MARLAP JULY 2004
This element of the QAPP should clearly describe the expected sample matrices (e.g.,groundwater with no sediments, soils with no rocks larger than 2 cm in diameter) and whatshould be done or who should be contacted if sample matrices are different than expected.Subsampling is a key link in the analytical process which is often overlooked during planningleaving important decisions to laboratory staff, this element should specify appropriatesubsampling procedures.
This QAPP element should:
� Identify the laboratories supplying analytical support. If more than one laboratory will beused, detail the analyses supplied by each laboratory;
� Identify analyses to be performed in the field using portable equipment or by a mobile lab;
� Identify the sample preparation techniques. Non-routine preparatory protocols, such as novelradiochemical separations, should be described in detail and documented in an SOP includingpertinent literature citations and the results of validations studies and other performance data,when they exist;
� Identify the analytical protocols to be used. The protocol documentation should describe allnecessary steps including the necessary reagents, apparatus and equipment, standardspreparation, calibration, sample introduction, data calculation, quality control, interferences,and waste disposal;
� If the selected analytical protocols have not been demonstrated for the intended application,the QAPP should include information about the intended procedure, how it will be validated,and what criteria must be met before it is accepted for the project�s application (Chapter 6,Selection and Application of an Analytical Method);
� If potential analytical protocols were not identified during the project planning process andexisting analytical protocols can not meet the MQOs, an analytical protocol will have to bedeveloped and validated (Section 6.6, �Method Validation�). If this issue was not identifiedby the project planning team, the project planning team must be contacted because theoriginal project objectives and the associated MQOs may have to be revisited and changed(Appendix B);
� If both high concentration and low concentration samples are expected, discuss how the twosample types will be identified and handled in a manner that will prevent cross-contaminationor other analytical problems;
� Discuss reporting requirements (e.g., suitable data acquisition and print-outs or electronicdata archival that will capture all necessary information), the proper units (dry weight versus
Content of Project Plan Documents
D-21JULY 2004 MARLAP
wet weight), the method to be employed to report the final result and its uncertainty, andreporting package format requirements; and
� Identify oversight procedures (e.g., QC samples, audits, supervisor review) for ensuring thatanalytical procedures are implemented properly and procedures for correcting problemsencountered in the laboratory. The person responsible for implementing corrective actions inthe lab should be identified.
The project plan document should be a dynamic document, used and updated over the life of theproject as information becomes available or changes. For example, under a performance basedapproach, the analytical protocols requirements in the project plan documents should initiallyreflect the Analytical Protocol Specifications established by the project planning team and issuedin the statement of work (or task order). When the analytical laboratory has been selected(Appendix E, Contracting Laboratory Services) the project plan document should be updated toreflect the identification of the selected laboratory and the analytical protocols, that is, the actualanalytical protocols to be used should be included by citation or inclusion of the SOPs asappendices.
D.3.5 Measurement/Data Acquisition (B5): Quality Control Requirements
This element of the QAPP should include enough detail that the use and evaluation of QCsample results and corrective actions will be performed as planned and support project activities.The QC acceptance limits and the required corrective actions for nonconformances should bedescribed. DQO Step 7 identified the optimized analytical design and the desired MQOs whichwill help determine the QC acceptance criteria. Refer to Chapter 18, Laboratory Quality Control,for a detailed discussion of radioassay QC and quality indicators. A discussion of QCrequirements in the QAPP should include the following information:
� A list of all QC sample types by matrix;
� The frequency of QC sample collection or analysis, preferably a tabular listing;
� A list of QC sample acceptance criteria or warning limits and control limits;
� Procedures for documenting QC sample results;
� Equations and calculations used to evaluate QC sample results and to determine measurementperformance acceptability;
� Actions to be taken if QC samples fail to meet the acceptance criteria; and
� Identification of the appropriate responsible person to whom QC reports should be sent.

Content of Project Plan Documents
D-22MARLAP JULY 2004
Acceptance criteria for QC samples should be based on the project MQOs, in particular the MQOfor measurement uncertainty at some concentration. Appendix C provides guidance ondeveloping acceptance criteria for QC samples based on the project�s MQO for the method�smeasurement uncertainty at some concentration, typically the action level.
D.3.6 Measurement/Data Acquisition (B6): Instrument/Equipment Testing, Inspection,and Maintenance Requirements
The QAPP should include a discussion of testing, inspection and maintenance requirements thatwill be followed to ensure that equipment and instrumentation will be in working order duringimplementation of project activities. An instrument or testing equipment will be deemed to be inworking order if it is maintained according to protocol and it has been inspected and tested andmeets acceptance criteria.
This element of the QAPP should:
� Discuss the maintenance policy for all essential instrumentation and equipment, what itinvolves, its frequency, whether it is performed by internal staff or if it is a contracted service,and whether an inventory of spare parts is maintained;
� Describe the inspection protocols for instrumentation and equipment. This ranges from theroutine inspections (i.e, gases, nebulizers, syringes and tubing) prior to instrument orequipment use and more detailed inspections employed while troubleshooting an instrumentor equipment problem. Mandatory inspection hold points, beyond which work may notproceed, should be identified; and
� Address the frequency and details of equipment and instrument testing. This may involve theweighing of volumes to test automatic diluters or pipets, the use of a standard weight prior toweighing sample aliquots to the use of standards to test sophisticated instrumentation. Ifstandards (e.g., National Institute of Standards and Technology [NIST] standard referencematerial [SRM]) are used during testing, the type, source and uncertainty of standard shouldbe identified.
There is not always a clear distinction between the testing component of this element and theprevious element addressing the use of QC samples to determine whether an instrument is withincontrol. In any case, it is important to describe in either of these elements of the QAPP, allprocedures that are deemed important to determining whether an instrument/equipment is inworking order and within control.

Content of Project Plan Documents
D-23JULY 2004 MARLAP
D.3.7 Measurement/Data Acquisition (B7): Instrument Calibration and Frequency
This element of the QAPP details the calibration procedures including standards, frequencies,evaluation, corrective action measures and documentation. Summary tables may be used tocomplement the more detailed discussions in the text. The following issues should be addressedin this element:
� Identify all tools, gauges, sampling devices, instruments, and test equipment that requirecalibration to maintain acceptable performance;
� Describe the calibration procedures in enough detail in this element or by citation to readilyavailable references so that the calibration can be performed as intended;
� Identify reference equipment (e.g., NIST thermometers) and standards, their sources, and howthey are traceable to national standards. Where national standards are not available, describethe procedures used to document the acceptability of the calibration standard used;
� Identify the frequency of calibration and any conditions (e.g., failed continuing calibrationstandard, power failure) that may be cause for unscheduled calibration;
� Identify the procedure and the acceptance criteria (i.e., in control) to be used to evaluate thecalibration data;
� Identify the corrective actions to be taken if the calibration is not in control. When calibrationis out of control, describe the evaluations to be made to determine the validity andacceptability of measurements performed since the last calibration; and
� Identify how calibration data will be documented, archived and traceable to the correctinstrument/equipment.
See Chapter 15, Quantification of Radionuclides, for a discussion of radiochemical instrumentcalibration.
D.3.8 Measurement/Data Acquisition (B8): Inspection/Acceptance Requirements forSupplies and Consumables
This element of the QAPP deals with inspecting and accepting all supplies and consumables thatmay directly or indirectly affect the quality of the data. For some projects, this information maybe provided by citation to a chemical safety and hygiene plan. The contents of this elementshould contain enough supportive information that the project and the data will be sufficient toundergo solicited and unsolicited reviews. The following detail should be included in thiselement, so the inspection process can be accurately implemented:
Content of Project Plan Documents
D-24MARLAP JULY 2004
� Identify and document all supplies and consumables (e.g., acids, solvents, preservatives,containers, reagents, standards) that have the potential of directly or indirectly impacting thequality of the data collection activity;
� Identify the significant criteria that should be used when choosing supplies and consumables(e.g., grade, purity, activity, concentration, certification);
� Describe the inspection and acceptance procedures that will be used for supplies orconsumables, including who is responsible for inspection, the timing of inspections and theacceptance and rejection criteria. This description should be complete enough to allowreplication of the inspection process. Standards for receiving radiological packages areprovided in 10 CFR 20 Section 20.1906 �Procedures for Receiving and Opening Packages�or an Agreement State equivalent;
� Describe the procedures for checking the accuracy of newly purchased standards, other thanSRMs, by comparison to other standards purchased from other sources;
� Identify any special handling and storage (e.g., refrigerated, in the dark, separate from highconcentration standards, lead shielding) conditions that must be maintained;
� Describe the method of labeling, dating and tracking supplies and consumables and thedisposal method for when their useful life has expired; and
� Describe the procedures and indicate by job function who is responsible for documenting theinspection process and the status of inventories.
D.3.9 Measurement/Data Acquisition (B9): Data Acquisition Requirements for Non-DirectMeasurement Data
This element of the QAPP addresses the use of existing data. Non-direct measurement data isdefined as existing data that is independent of the data generated by the current project�ssampling and analytical activities. Non-direct data may be of the same type (e.g., mBq/g of 232Thin soil) that will complement the data being collected during the project. Other non-direct datamay be of a different type such as weather information from the National Weather Service, orgeological and hydrogeological data from the U.S. Geological Survey. To achieve project objectives it is important that the data obtained from non-direct sources besubjected to scrutiny prior to acceptance and use. Use of existing data is discussed during Step 1and 3 of the DQO process. If existing data of the same type is to be used to achieve projectobjectives, it has to be evaluated in terms of its ability to comply with MQOs established in DQOStep 7. The limitations on the use of non-direct measurements should be established by theproject planning team.

Content of Project Plan Documents
D-25JULY 2004 MARLAP
This element should:
� Identify the type and source of all non-direct data that will be needed to achieve the projectobjectives;
� State whether the same quality criteria and QC sample criteria will be applied to the non-direct measurement data. If the same criteria cannot be applied, then identify criteria that willbe acceptable for the non-direct data but at the same time won�t bias or significantly add tothe uncertainty of decisions for the project;
� Identify whether the data will support qualitative decisions (e.g., rain occurred on the thirdday of sampling) or if the data will be used quantitatively (e.g., used to calculate a meanconcentration that will be compared to an action level);
� Identify whether enough information exists to evaluate the quality of the non-direct data (e.g.,spike and collocated sample data, minimum detectable concentrations, reported measurementuncertainties); and
� If the non-direct data are to be combined with project-collected data, identify the criteria thatwill be used to determine if the non-direct data are comparable (e.g., sampled the samepopulation, same protocol).
D.3.10 Measurement/Data Acquisition (B10): Data Management
This element of the QAPP should present an overview of the data management process from thereceipt of raw data to data storage. The overview should address all interim steps, such as, datatransformations, transmittals, calculations, verifications, validations and data quality assess-ments. The procedures should address how internal checks for errors are made. Laboratoriesshould follow accepted data management practices (EPA, 1995). Applicable SOPs should beincluded as attachments to the QAPP. (See Chapter 16, Data Acquisition, Reduction, andReporting for Nuclear Counting Instrumentation, for a discussion of radiochemical datageneration and reduction.)
The discussion of data management should address the following issues:
� DATA RECORDING: The process of the initial data recording steps (e.g., field notebooks,instrument printouts, electronic data storage of alpha and gamma spectra) should bedescribed. Examples of unique forms or procedures should be described. Describe theprocedures to be used to record final results (e.g., negative counts) and the uncertainty.
� CONVERSIONS AND TRANSFORMATIONS: All data conversions (e.g., dry weight to wet weight),transformations (conversion to logs to facilitate data analysis) and calculation of statistical
Content of Project Plan Documents
D-26MARLAP JULY 2004
parameters (e.g., uncertainties) should be described, including equations and the rationale forthe conversions, transformations and calculations. Computer manipulation of data should bespecified (e.g., software package, macros).
� DATA TRANSMITTALS: Data transmittals occur when data are sent to another location orperson or when it is converted to another format (incorporated into a spreadsheet) or media(printed reports keyed into a computer database). All transmittals and associated QA/QCsteps taken to minimize transcription errors should be described in enough detail to ensuretheir proper implementation.
� DATA REDUCTIONS: Identify and explain the reasons for data reductions. Data reduction is theprocess of changing the number of data items by arithmetic or statistical calculations,standard curves, or concentration factors. A laboratory information management system mayuse a dilution factor or concentration factor to change raw data. These changes often areirreversible and in the process the original data are lost.
� DATA VERIFICATION, VALIDATION AND ASSESSMENTS: Since these assessment issues arediscussed in a subsequent element of the QAPP (D2), only an overview should be providedidentify the timing and frequency of these assessments.
� DATA TRACKING, STORAGE AND RETRIEVAL: Describe the system for tracking and compilingdata as samples are being analyzed, how data are stored, and the mechanism for retrievingdata (e.g., from archived back-up tapes or disks).
� SECURITY: Describe procedures for data and computer security.
D.4 Group C: Assessment/Oversight
The elements of this group are intended to assess progress during the project, facilitate correctiveactions in a timely manner (Section D.4.1), and provide reports to management (Section D.4.2).It should be stressed that early detection of problems and weaknesses�before projectcommencement or soon thereafter�and initiation of corrective actions are important for aproject�s success. The focus of the elements in this group is the implementation of the project asdefined in the QAPP. This group is different from the subsequent group, data validation andusability, which will assesses project data after the data collection activity is complete.
D.4.1 Assessment/Oversight (C1): Assessment and Response Actions
The QAPP authors have a range of assessment choices that can be employed to evaluate on-goingproject activities, which include surveillance, peer review, systems reviews, technical systemsaudits (of field and laboratory operations), and performance evaluations. A detailed discussion of
Content of Project Plan Documents
D-27JULY 2004 MARLAP
laboratory evaluation is presented in Chapter 7, Evaluating Methods and Laboratories. It isimportant to schedule assessments in a timely manner. An assessment has less value if itsfindings become available after completion of the activity. The goal is to uncover problems andweaknesses before project commencement or soon thereafter and initiate corrective actions so theproject is a success.
This element of the QAPP should:
� Identify all assessments by type, frequency and schedule; � Identify the personnel who will implement the assessments; � Identify the criteria, documents, and plans upon which assessments will base their review; � Describe the format of assessment reports; � Identify the time frame for providing the corrective action plan; and � Identify who is responsible for approving corrective actions and ensuring that they are
implemented.
D.4.2 Assessment/Oversight (C2): Reports to Management
Reports to management are a mechanism for focusing management�s attention on project qualityand on project issues that may require the management�s level of authority. To be effectivereports to management and management�s review and response must be timely. The benefit ofthese status reports is the opportunity to alert management of data quality problems, proposeviable solutions and procure additional resources.
At the end of the project, a final project report which includes the documentation of the DQAfindings should be prepared (Chapter 9, Data Quality Assessment). It may also be beneficial forfuture planning efforts for the project planning team to provide a summary of the �lessonlearned� during the project, such as key issues not addressed during planning and discovered inimplementation or assessment, specialist expertise needed on the planning team, experience withimplementing performance-based analytical protocol selection.
This element of the QAPP should address the following issues:
� Identify the various project reports that will be sent to management;
� Identify non-project reports that may discuss issues pertinent to the project (e.g., backlogreports);
� Identify QA reports that provide documentary evidence of quality (e.g., results of independentperformance testing, routine QC monitoring of system performance);

Content of Project Plan Documents
D-28MARLAP JULY 2004
� Identify the content of �reports to management� (e.g., project status, deviations from theQAPP and approved amendments, results of assessments, problems, suggested correctiveactions, status on past corrective actions);
� Identify the frequency and schedule for reports to management;
� Identify the organization or personnel who are responsible for authoring reports; and
� Identify the management personnel who will receive and act upon the assessment reports.
D.5 Group D: Data Validation and Usability
This group of elements ensures that individual data elements conform to the project specificcriteria. This section of the QAPP discusses data verification, data validation and data qualityassessment (DQA), three processes employed to accept, reject or qualify data in an objective andconsistent manner. Although there is good agreement as to the range of issues that the threeelements, in total, should address, within the environmental community there are significantdifferences as to how verification, validation and DQA are defined. The discussion of this groupof elements will use the definitions which are defined Chapter 8, Radiochemical DataVerification and Validation.
D.5.1 Data Validation and Usability (D1): Verification and Validation Requirements
This element of the QAPP addresses requirements for both data verification and data validation.The purpose of this element is to clearly state the criteria for deciding the degree to which eachdata item and the data set as a whole has met the quality specifications described in the�Measurement/Data Acquisition� section of the QAPP. The strength of the conclusions that canbe drawn from the data is directly related to compliance with and deviations from the samplingand analytical design. The requirements can be presented in tabular or narrative form.
Verification procedures and criteria should be established prior to the data evaluation.Requirements for data verification include the following criteria:
� Criteria for determining if specified protocols were employed (e.g., compliance with essentialprocedural steps);
� Criteria for determining if methods were in control (e.g., QC acceptance criteria);
� Criteria for determining if a data report is complete (e.g., list of critical components thatconstitute the report);
Content of Project Plan Documents
D-29JULY 2004 MARLAP
� Criteria for determining if the analysis was performed according to the QAPP and the SOW;
� Criteria and codes used to qualify data; and
� Criteria for summarizing and reporting the results of verification.
A discussion of verification can be found in Chapter 8.
Data validation should be performed by an organization independent of the group that generatedthe data to provide an unbiased evaluation. Validation procedures and criteria should beestablished prior to the data evaluation. Requirements for data validation include the following:
� An approved list of well-defined MQOs and the action level(s) relevant to the project DQOs;
� Criteria for assigning qualifiers based on the approved list of MQOs;
� Criteria for identifying situations when the data validator�s best professional judgement canbe employed and when a strict protocol must be followed; and
� Criteria for summarizing and reporting the results of validation.
A discussion of validation can be found in Chapter 8.
D.5.2 Data Validation and Usability (D2): Verification and Validation Methods
D.5.2.1Data Verification
Data verification or compliance with the SOW is concerned with: complete, consistent,compliant and comparable data. Since the data verification report documents whether laboratoryconditions and operations were compliant with the SOW, the report is often used to determinepayment for laboratory services. Chapter 5, Obtaining Laboratory Services, discusses the need toprepare a SOW for all radioanalytical laboratory work regardless of whether the work iscontracted out or performed in-house.
This element of the QAPP should address the following issues to ensure that data verificationwill focus on the correct issues:
� Identify the documents (e.g., other QAPP sections, SOW, contracts, standard methods) thatdescribe the deliverables and criteria that will be used to evaluate compliance;

Content of Project Plan Documents
D-30MARLAP JULY 2004
� Identify the performance indicators that will be evaluated (e.g., yield, matrix spikes,replicates). See Chapter 18, Laboratory Quality Control, for a discussion of radiochemistryperformance indicators;
� Identify the criteria that will be used to determine �in-control� and �not-in-control�conditions;
� Identify who will perform data verification;
� Describe the contents of the verification report (e.g., a summary of the verification process asapplied; required project activities not performed or not on schedule or not according torequired frequency; procedures that were performed but did not meet acceptance criteria;affected samples; exceptions); and
� Identify who will receive verification reports and the mechanism for its archival.
D.5.2.2Data Validation
Chapter 8, Radiochemical Data Verification and Validation, discusses radiochemical datavalidation in detail. MARLAP recommends that a data validation plan document be included asan appendix to the QAPP. The data validation report will serve as the major input to the processthat evaluates the reliability of measurement data.
This element of the QAPP should address the following issues:
� Describe the deliverables, measurement performance criteria and acceptance criteria that willbe used to evaluate data validity;
� Identify who will perform data validation;
� Describe the contents of the validation report (e.g., a summary of the validation process asapplied; summary of exceptional circumstances; list of validated samples, summary ofvalidated results); and
� Identify who will receive validation reports and the mechanism for its archival.
D.5.3 Data Validation and Usability (D3): Reconciliation with Data Quality Objectives
This element of the QAPP describes how project data will be evaluated to determine its usabilityin decision-making. This evaluation is referred to as the �data quality assessment.� DQA is theprocess that scientifically and statistically evaluates project-wide knowledge in terms of theproject objectives to assess the usability of data. DQA should be ongoing and integrated into the
Content of Project Plan Documents
D-31JULY 2004 MARLAP
project data collection activities. On project diagrams and data life cycles, it is often shown as thelast phase of the data collection activity. However, like any assessment process, DQA should beconsidered throughout the data collection activity to ensure usable data. EPA guidance (EPA,2000b) provides a detailed discussion of that part of the DQA process that addresses statisticalmanipulation of the data. In addition to statistical considerations, the DQA process integrates andconsiders information from the validation report, assessment reports, the field, the conceptualmodel and historical data to arrive at its conclusions regarding data usability. DQA is discussedin Chapter 9, Data Quality Assessment.
The DQA considers the impact of a myriad of data collection activities in addition to measure-ment activities. This element of the QAPP should direct those performing the DQA to:
� Review the QAPP and DQOs; � Review the validation report; � Review reports to management; � Review identified field, sampling, sample handling, analytical and data management
problems associated with project activities; � Review all corrective actions; and � Review all assessment reports and findings (e.g., surveillances, audits, performance
evaluations, peer reviews, management and technical system reviews).
In addition to the above, this element of the QAPP should address the following issues:
� Identify who will perform the DQA; � Identify what issues will be addressed by the DQA; � Identify any statistical tests that will be used to evaluate the data (e.g., tests for normality); � Describe how MQOs will be used to determine the usability of measurement data (i.e., did
the measurement uncertainty in the data significantly affect confidence in the decision?); � Describe how the representativeness of the data will be evaluated (e.g., review the sampling
strategy, the suitability of sampling devices, subsampling procedures, assessment findings); � Describe how the potential impact of non-measurable factors will be considered; � Identify what will be included in the DQA report; and � Identify who will receive the report and the mechanism for its archival.
D.6 References
U.S. Department of Energy (DOE). 1996. Project Plan for the Background Soils Project for thePaducah Gaseous Diffusion Plant, Paducah, Kentucky. Report DOE/OR/07-1414&D2. May.
Content of Project Plan Documents
D-32MARLAP JULY 2004
U.S. Department of Energy (DOE). 1997. Quality Assurance Project Plan for RadiologicalMonitoring at the U.S. DOE Paducah Gaseous Diffusion Plant, Paducah, Kentucky. February.
U.S. Environmental Protection Agency (EPA). 1995. Good Automated Laboratory Practices.Report 2185, EPA, Washington, DC.
U.S. Environmental Protection Agency (EPA). 2000a. Guidance for the Data Quality ObjectiveProcess (EPA QA/G-4). EPA/600/R-96/055, Washington, DC. Available fromwww.epa.gov/quality/qa_docs.html.
U.S. Environmental Protection Agency (EPA). 2000b. Guidance for Data Quality Assessment:Practical Methods for Data Analysis. EPA QA/G-9. EPA/600/R-96/084. Office ofEnvironmental Information, Washington, DC. Available at www.epa.gov/quality/qa_docs.html.
U.S. Environmental Protection Agency (EPA). 2001. EPA Requirements for Quality AssuranceProject Plans. EPA QA/R-5. EPA/240/B-01/003. Office of Environmental Information,Washington, DC. Available at www.epa.gov/quality/qa_docs.html.
U. S. Environmental Protection Agency (EPA). 2002. Guidance for Quality Assurance ProjectPlans. EPA QA/G-5. EPA/240/R-02/009. Office of Environmental Information, Washington,DC. Available at www.epa.gov/quality/qa_docs.html.
Taylor, J. K. 1990. Quality Assurance of Chemical Measurements. Lewis, Chelsea, Michigan.
E-1JULY 2004 MARLAP
APPENDIX E CONTRACTING LABORATORY SERVICES
E.1 Introduction
This appendix provides general guidance on federal contracting and contracting terminology asused for negotiated procurements. Federal agencies, and laboratories doing business with them,must follow applicable provisions of the Federal Acquisition Regulations (FAR) and agency-specific supplements. The examples provided in this appendix are based primarily on proceduresfollowed by the U.S. Geological Survey (USGS).
This appendix addresses selecting a laboratory to establish services that supplement an agency�sin-house activities through the contracting of additional outside support. This appendix offers anumber of principles that may be used when selecting a service provider, establishing acontractual agreement, and later working with a contract laboratory. These principles may also beapplied to contractors that are located outside of the United States. In such cases, legal counselwill need to review and advise an agency concerning pertinent issues related to internationalcontracts.
This appendix also covers laboratory audits that are part of a final selection process and otheractivities that take place until the contract is concluded. Chapter 5 (Obtaining LaboratoryServices) supports this appendix with a general description on how to obtain laboratory services.Chapter 7 (Evaluating Methods and Laboratories) complements this appendix by consideringinformation related to laboratory evaluations that are conducted throughout the term of aproject�whether or not this work is specifically covered by a contract.
Obtaining support for laboratory analyses is already a practice that is familiar to a number offederal and state agencies. The following discussion will apply:
C Agency: A federal or state government office or department, (or potentially any other publicor private institution) that offers a solicitation or other mechanism to obtain outside services;
C Proposer: A person, firm, or commercialfacility that submits a proposal related toproviding services; and
C Contractor: A person or firm that isawarded the contract and is engaged inproviding analytical services.
Contents
E.1 Introduction . . . . . . . . . . . . . . . . . . . . . . . . . . E-1E.3 Request for Proposals�The Solicitation . . . E-7E.4 Proposal Requirements . . . . . . . . . . . . . . . . E-10E.5 Proposal Evaluation and Scoring Procedures E-21E.6 The Award . . . . . . . . . . . . . . . . . . . . . . . . . . E-31E.7 For the Duration of the Contract . . . . . . . . . E-31E.8 Contract Completion . . . . . . . . . . . . . . . . . . E-36E.9 References . . . . . . . . . . . . . . . . . . . . . . . . . . E-36
Contracting Laboratory Services
E-2MARLAP JULY 2004
Furthermore, the size and complexity of some agency projects will clearly exceed the extent ofthe information presented here. In its present form, this appendix serves to touch on many of theissues and considerations that are common to all projects, be they large or small.
MARLAP draws attention to another dimension of the overall contracting process by consideringhow the data quality objectives (DQOs) and measurement quality objectives (MQOs) areincorporated into every stage of a project�as described earlier in greater detail (Chapters 2,Project Planning Process, and 3, Key Analytical Planning Issues and Developing AnalyticalProtocol Specifications). In this regard, an agency�s project managers and staff are given anopportunity to consider options with some foresight and to examine the larger picture, whichconcerns planning short- or long-term projects that utilize a contractor�s services. As services areacquired, and later as work is performed, the specific concepts and goals outlined by the DQOsand MQOs will be revisited. This becomes an iterative process that offers the possibility tofurther define objectives as work is conducted. Whenever the DQOs or MQOs are changed, thecontract should be modified to reflect the new specifications. Employing the MQOs and trackingthe contractor�s progress provides a means by which project managers and contract-laboratorytechnical staff can return and review the project at any point during the contract period. Thisallows for repeated evaluations to further optimize a project�s goals and, if anticipated in thecontract�s language, perhaps even provides for the option to revise or redirect the wayperformance-based work is conducted.
The Office of Federal Procurement Policy (OFPP, 1997) has developed a Performance-BasedService Contracting review checklist to be used as a guide in developing a performance-basedsolicitation. The checklist contains minimum required elements that should be present for acontract to be considered performance-based. Performance-Based Service Contracting focuses onthree elements: a performance work statement; a quality assurance project plan (QAPP); andappropriate incentives, if applicable. The performance work statement defines the requirementsin terms of the objective and measurable outputs. The performance work statement shouldanswer five basic questions: what, when, where, how many, and how well. The work statementshould structure and clearly define the requirements, performance standards, acceptable qualitylevels, methods of surveillance, incentives if applicable and evaluation criteria. A market surveyshould be conducted so that the marketplace and other stakeholders are provided the opportunityto comment on draft performance requirements and standards, the proposed QA project plan, andperformance incentives, if applicable.
A number of benefits arise from establishing a formal working relationship between an agencyand a contractor. For example:
� A contract is a legal document that clearly defines activities and expectations for the benefitof both parties engaged in the contractual relationship.
Contracting Laboratory Services
E-3JULY 2004 MARLAP
� The process of drafting language to cover legal considerations may well include contributionsfrom legal staff. Legal guidance may be obtained as needed at any time during the planningstages or later when a contract is in place. However, the core of a contractor�s proposal, andeventually the contract itself, provide the foundation of technical work that is required tocomplete a project or attain an ongoing program goal. In this regard, aside from legal issuesthat are an integral part of every contract, this appendix�s principal focus is on thelaboratory process or technical work-related content of the contract.
� The statement of work (SOW) first appears as part of the agency�s request for proposal (RFP)and later is essentially incorporated into the proposal by the proposer when responding to theRFP. When work is underway, the SOW becomes a working document that both the agencyand contractor refer to during the life of the contract.
� Legal challenges concerning project results (i.e., laboratory data) may arise during thecontract period. The language in a contract should offer sufficient detail to provide the meansto circumvent potential or anticipated problems. For example, attention to deliveries ofsamples to the laboratory on weekends and holidays or data reporting requirements that aredesigned to support the proper presentation of data in a legal proceeding are importantaspects of many federal- and state-funded contracts.
Overall, this appendix incorporates a sequence that includes both a planning and a selectionprocess. Figure E-1 illustrates a series of general steps from planning before a contract is even inplace to the ultimate termination of the contract. An agency first determines a need as part ofplanning, and along the way advertises this need to solicit proposals from outside serviceproviders who operate analytical laboratory facilities. Planning future work, advertising for, andlater selecting services from proposals submitted to an agency takes time�perhaps six or moremonths pass before a laboratory is selected, a contract is in place, and analytical work begins.The total working duration of a contract, for example, might cover services for a brief time(weeks or months) and in other cases, many contracts may run for a preset one-year period or fora more extended period of three to five years with optional renewal periods during that time.
The MARLAP user will find that planning employs a thought process much like that used toprepare an RFP. In general, one starts with questions that define a project�s needs. Further, bydeveloping Analytical Protocol Specifications (APSs) which include specific MQOs, one entersan iterative process such that�at various times�data quality is checked in relation to workperformed both in-house and by the outside service provider. Overall, planning results in thedevelopment of a project plan document (e.g., QAPP). During planning, a project manager andthe agency staff can consider both routine and special analytical services that may be required toprovide data of definable quality. The SOW serves to integrate all technical and quality aspectsof the project, and to define how specific quality-assurance and quality-control activities areimplemented during the time course of a contract. Also, at an early stage in planning, the agencymay choose to assemble a team to serve as the Technical Evaluation Committee (TEC; Section
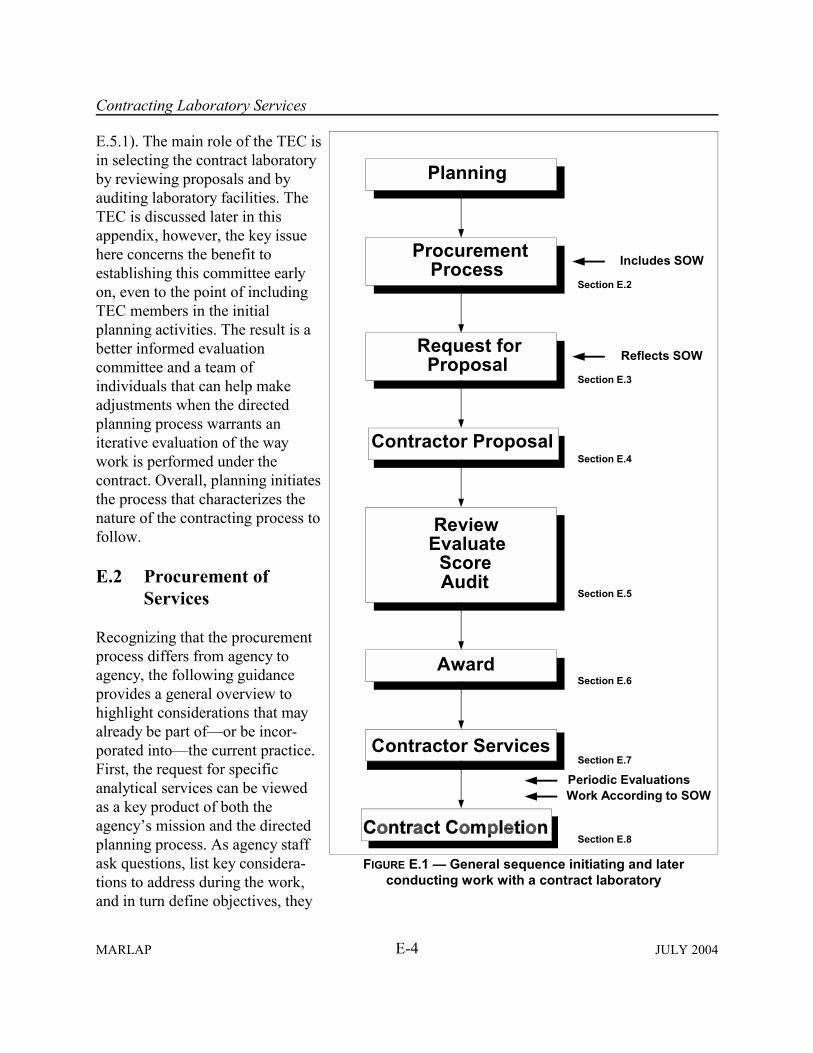
Contracting Laboratory Services
E-4MARLAP JULY 2004
Planning
ProcurementProcess
Request forProposal
Contractor Proposal
ReviewEvaluate
ScoreAudit
Award
Contractor Services
Section E.2
Section E.3
Section E.4
Section E.5
Section E.6
Section E.7
Section E.8
Includes SOW
Reflects SOW
Periodic EvaluationsWork According to SOW
FIGURE E.1 � General sequence initiating and laterconducting work with a contract laboratory
E.5.1). The main role of the TEC isin selecting the contract laboratoryby reviewing proposals and byauditing laboratory facilities. TheTEC is discussed later in thisappendix, however, the key issuehere concerns the benefit toestablishing this committee earlyon, even to the point of includingTEC members in the initialplanning activities. The result is abetter informed evaluationcommittee and a team ofindividuals that can help makeadjustments when the directedplanning process warrants aniterative evaluation of the waywork is performed under thecontract. Overall, planning initiatesthe process that characterizes thenature of the contracting process tofollow.
E.2 Procurement ofServices
Recognizing that the procurementprocess differs from agency toagency, the following guidanceprovides a general overview tohighlight considerations that mayalready be part of�or be incor-porated into�the current practice.First, the request for specificanalytical services can be viewedas a key product of both theagency�s mission and the directedplanning process. As agency staffask questions, list key considera-tions to address during the work,and in turn define objectives, they

Contracting Laboratory Services
E-5JULY 2004 MARLAP
also eliminate unnecessary options to help focus on the most suitable contracting options thatsatisfy the APSs. Thereafter, the scope of the work, schedule, manpower constraints, availabilityof in-house engineering resources, and other technical considerations all enter into estimating anddefining a need for project support. This approach refines the objectives and establishes needsthat may be advertised in a solicitation for outside services. The resulting work or project planshould clearly articulate what is typically known but not limited to the following:
� Site conditions; � Analytes of interest; � Matrices of concern; � How samples are to be collected and handled; � Custody requirements; � Data needs and APSs, including the MQOs; � Stipulated analytical methods, if required; � Applicable regulations; and � Data reporting.
All of this defines the scope of work, such that the agency can initiate a formal request forproposals or arrange for an analysis request as part of a less formal procurement.
E.2.1 Request for Approval of Proposed Procurement Action
If required within an agency, a request is processed using forms and related paperwork todocument information typically including, but not limited to, the following:
� Identification of product or service to be procured; � Title of program or project; � Description of product or service; � Relationship of product or service to overall program or project; � Funding year, projected contract life, amounts, etc.; � Name and phone number of Project Officer(s); � Signature of Project Officer and date � Name and phone number of Contracting Officer; and � Signature of Contracting Officer and date.
An agency may also be required to collect or track information for an RFP with regard to:
� New procurements: type of contract, grant, agreement, proposal, etc. Continuingprocurements: pre-negotiated options, modifications, justification for noncompetitiveprocurement, etc.
� Source information: small business or other set aside, minority business, women-ownedbusiness, etc.

Contracting Laboratory Services
E-6MARLAP JULY 2004
In addition to the information listed above, agency-specific forms used to initiate a procurementrequest may also provide a place to indicate agency approval with names, signature lines, anddate spaces for completion by officials in the office responsible for procurement and contracts.An agency administrator or director above the level of the office of procurement may also signthis form indicating agency approval.
E.2.2 Types of Procurement Mechanisms
Table E.1 lists many of the procurement options available to the project manager. Each optionoffers a solution to a specific need. For example, a purchase order is typically appropriate fortasks with a somewhat limited scope and thus is perhaps most useful when samples are to beprocessed on a one-time basis. In some cases where only one or a limited number of vendors canfulfill the needs of the project, e.g., low-level tritium analysis by helium ingrowth within aspecified time period, a sole source solicitation is commonly used.
TABLE E.1� Examples of procurement options to obtain materials or servicesProcurement Mechanism Example of Specific Use or Application
Purchase order In-house process handled through purchasing staff; limited to small needswithout a formal request or used in conjunction with a solicitation(competitive process) and a limited amount of funding; commonly used topurchase equipment and supplies, but may be used for processing samples.
Sole source solicitation In specific instances, a single or a limited number of service providers areable to offer specific services.
Request for Quotation (RFQ) Formal, main process for establishing contracts�generally addresses amajor, long-term need for contractor support; this is a competitive processbased mainly on cost.
Request for Proposal (RFP) Formal, main process for establishing contracts�generally addresses amajor, long-term need for contractor support; this is a competitive processbased mainly on technical capability.
Modification to an existing contractor delivery order
This approach meets a need that is consistent with the type of contract thatis in place, e.g., agency amends contract to add a method for sampleprocessing that is similar to work already covered.
Basic Ordering Agreement (BOA) Work is arranged with a pre-approved laboratory as described inSection E.2.2.
The process leading to a formal contract provides a more comprehensive view of nearly everyaspect of the work that an agency expects from a contractor. The formal process includes threetypes of procurement: request for quotation (RFQ), request for proposal (RFP), and the basicordering agreement (BOA). The RFQ solicits bidders to provide a quotation for laboratoryservices that have been detailed in the solicitation. The specifications may include the technical,administrative, and contractual requirements for a project. For the RFQ, the contract typically is
Contracting Laboratory Services
E-7JULY 2004 MARLAP
awarded to the lowest bidder that can fulfill the contract specifications without regard to thequality of the service. What appears to be a good price may not entail the use of the best or mostappropriate method or technology. There may be significant advantages in seeking to acquirehigh-technology services as a primary focus in advance of, or along with, concerns pertaining toprice.
For an RFP, there is considerably more work for the agency and the laboratory. The laboratorymust submit a formal proposal addressing all key elements of the solicitation that include how,why, what, when, where and by whom the services are to be performed. The TEC or ContractingOfficer must review all proposals, rank them according to a scoring system and finally assess thecost effectiveness of the proposals before making the final award.
The BOA provides a process that serves to pre-approved service providers. This includes apreliminary advertisement for a particular type of work, such as radioanalytical services. Theagency then selects and approves a number of candidates that respond to the advertisement. Withthis approach, the agency assembles a potential list of approved laboratories that are contacted asneeded to support specific needs. The agency may choose to simply write a task order (defining aspecific scope of work) with a specific pre-approved laboratory, or the agency may initiate acompetitive bidding process for the task order between several or all members on the list of pre-approved laboratories. Once chosen, the laboratory may be guided by a combined statement ofwork or task order that is issued by the agency.
Mechanisms that permit an agency to obtain analyses for a limited number of samples�withoutan established contractual relationship with a specific contractor�may simply be necessitated bythe small number of samples, time constraints where specific analyses are not part of an existingcontract, limitations related to funding, or other consideration. The formal business and legalrequirements of a long-term relationship warrant a stronger contractual foundation for workconducted in a timely fashion, on larger numbers of samples, and over specified periods of time.The contracts described above, with the exception of a BOA, are considered �requirement�contracts and requires the group initiating the solicitation to use only the contracted laboratory,without exception, for the contract period to perform the sample analyses.
E.3 Request for Proposals�The Solicitation
To appreciate the full extent of a competitive process leading to a formal working relationship�between an agency and a contractor�the primary example used hereafter is the solicitation andselection process that starts with the issuance of a RFP, as shown in Figure E-1.
Federal announcements of RFPs can be found on the Federal Business Opportunities (FBO) website (http://vsearch1.eps.gov/servlet/SearchServlet); many agencies also announce their ownRFPs on their own web sites. FBO primarily provides a synopsis or brief description of the type
Contracting Laboratory Services
E-8MARLAP JULY 2004
of work the agency is interested in purchasing. States and local governments also solicitproposals and announce the availability of work in USABID (a compilation of solicitations fromhundreds of city, county, and state agencies). Internet sites that offer access to the FBO and USABID listings can be located through electronic searches using web browser software. Once asite is located, the information can be viewed through public access or commercial Internet-basedservices. In other cases, a state or federal agency may maintain a mailing list with names andaddresses for potentially interested parties. This might include contractors that previouslysupported the Agency or others who have volunteered information for the mailing list.
Once the RFP, state advertisement, or other form of solicitation is publicized, interested partiescan contact the appropriate Agency to obtain all the specific information relevant to completing acandidate laboratory�s contract proposal. For the present discussion, this information is containedin the text of the RFP document. The RFP may be accompanied by a cover letter stating aninvitation to applicants and general information related to the content of a proposal and specificindication for the types of sections or sub-sections the proposal will contain. For example, aproposal divided into three sections technical proposal, representations and certifications, andprice proposal allows the agency to separate pricing from technical information. In this way, theagency considers each candidate first on technical merits before the price of services enters theselection process.
The agency�s RFP is designed to provide a complete description of the proposed work. Forexample, a RFP should inform all candidate laboratories (i.e., proposers) of the estimated numberof samples that are anticipated for processing under the contract. The description of work in theRFP as described in the SOW serves to indicate the types of radionuclide analyses required forthe stated sample types and the number of samples to undergo similar or different processingprotocols. The estimate also has a bearing on cost and other specific project details as describedin the SOW. Additional information provided with the RFP serves to instruct the proposerregarding other technical requirements (APSs), the required number of copies of each section ofthe proposal, proposal deadline, address where proposals are to be sent, and other generalconcerns or specifications relevant to the solicitation.
The cover letter may indicate how each proposer will be notified if its proposal is dropped fromthe competitive range of candidates during the selection process. The letter may also includeprecautionary notes concerning whom to contact or not contact at the agency regarding thepotential contract during the competitive process. Finally, if particular sources are encouraged toapply (e.g., minority or small business), this information will be mentioned in the agency�sinvitation to apply.
E.3.1 Market Research
The Office of Federal Procurement Policy (OFPP, 1997) recommends that the marketplace andother stakeholders be provided the opportunity to comment on draft performance requirements
Contracting Laboratory Services
E-9JULY 2004 MARLAP
and standards. This practice allows for feedback from those people working in the technicalcommunity so that their comments may be incorporated into the final RFP and potentialproposers can develop intelligent proposals.
E.3.2 Period of Contract
The time and resources involved in writing and awarding a major contract generally make itimpractical and cost ineffective to award contracts for less than one or more years. Whilecontracts running for shorter terms are sometimes established, single or multiple year terms arecommonly used to provide the necessary services for some federal or state programs. Monitoringprograms are likely to go long periods of time with renewals or RFPs that continue the work intothe future. Elsewhere, relatively large projects conducting radiation survey and site investigationsmay require a contract process that, for the most part, estimates the time services will be neededto finish work through to the completion of a final status survey. In this case, the contract mayspecify any length of time, but also include the option to renew the contract for a period of timeto bring the project to a close. The relationship between the length of a contract and the type ofproject can be part of the structured planning process that seeks to anticipate every facet of aproject from start to finish.
Multi-year contracts typically are initiated with an award for the first year or two followed by anadditional number of one-year options. In this way, a five-year contract is awarded for one year(or two) with four (or three) one-year option periods to complete the contract�s full term. Thegovernment must exercise its option for each period beyond the base term. Problems that ariseduring any year may result in an agency review of the MQOs or an examination of the currentworking relationship that may result in the agency�s decision to not extend the contract into thenext option year.
E.3.3 Subcontracts
For continuity or for quality assurance (QA), the contract may require one laboratory to handlethe entire analytical work load. However, subcontracting work with the support of an additionallaboratory facility may arise if the project plan calls for a large number of samples requiringquick turnaround times and specific methodologies that are not part of the primary laboratory�ssupport services. A proposer may choose to list a number of subcontractors in the proposal. Thelisting may or may not include other laboratories with whom the proposer has an existing or priorworking relationship. The choice of subcontracting firms may be limited during the proposalprocess. There may be many qualified service providers to meet specific project needs. However,once work is under way, using a limited number of laboratories that qualify for this secondaryrole helps maintain greater control of quality and thus the consistency of data coming from morethan a single laboratory alone. Furthermore, the contractor may prefer working with a specificsubcontractor, but this arrangement is subject to agency approval.
Contracting Laboratory Services
E-10MARLAP JULY 2004
The use of multiple service providers adds complexity to the agency�s tasks of auditing,evaluating, and tracking services. The prime contractor and their subcontractor(s) are held to thesame terms and conditions of the contract. The prime contractor is responsible for theperformance of its subcontract laboratories. In some instances, certain legal considerationsrelated to chain of custody, data quality and reporting, or other concern may limit an agency�soptions and thus restrict the number of laboratories that are part of any one contract.
However, the decision to use an approved subcontractor, or which subcontractor to use, is strictlyup to the prime. Under federal contracting regulations, agencies may not direct a laboratory touse a particular subcontractor, nor may the federal customer deal directly with the subcontractor(without going through the prime contractor). This may create a more convoluted or complexrelationship among the customer, prime contractor, and subcontractors, which in turn may affectturnaround times and quality. Consequently, a laboratory�s quality manual and proposal shouldaddress its approach for ensuring timely and accurate communications between the customer,prime contractor, and subcontractor(s).
E.4 Proposal Requirements
The agency�s RFP will state requirements that each proposer is to cover in its proposal. Theproposal document itself becomes first the object of evaluation and is a reflection of how thecontract and the SOW are structured. Whether one works with a formal contract or a simpleranalysis request, the agency and contractor need to agree to all factors concerning the specificanalytical work. Where written agreements are established, the language should be specific toavoid disputes. Clear communication and complete documentation are critical to a project�ssuccess. For example, the agency�s staff asks questions of itself during the planning process tocreate and later advertise a clearly stated need in the RFP. The contractor then composes aproposal that documents relevant details concerning their laboratory�s administrative andtechnical personnel, training programs, instrumentation, previous project experience, etc.Overall, the proposer should make an effort to address every element presented in the RFP. Theproposer should be as clear and complete as possible to ensure a fair and proper evaluationduring the agency�s selection process.
The planning process will reveal numerous factors related to technical requirements necessary totailor a contract to specific project needs. The following sections may be reviewed by agencystaff (radiochemist or TEC) during planning to determine if additional needs are required beyondthose listed in this manual. agency personnel should consider carefully the need to include everynecessary detail to make a concise RFP. The proposer can read the same sections to anticipate thetypes of issues that are likely to appear in an RFP and that may be addressed in a proposal.

Contracting Laboratory Services
E-11JULY 2004 MARLAP
E.4.1 RFP and Contract Information
There are two basic areas an agency can consider when assembling information to include in anRFP. The proposer is expected to respond with information for each area in its proposal. The firstarea includes a listing of General Laboratory Requirements and Activities. The second area,Technical Components to Laboratory Functions, complements the first, but typically includesmore detailed information.
1) General laboratory requirements � Personnel; � Facilities; � Meeting contract data quality requirements; � Schedule; � Quality manual; � Data deliverables including electronic format; � Licenses and certifications; and � Experience: previous and current contracts; quality of performance.
2) Technical components to laboratory functions � Standard operating procedures; � Instrumentation � Training � Performance evaluation programs; and � Quality system.
The laboratory requirements and technical components indicated above are addressed in thisappendix. Beyond this, there are additional elements that may be required to appear with detaileddescriptions in an RFP and later in a formal proposal. One significant portion of the RFP, and akey element appearing later in the contract itself, is the SOW. This is the third area a proposer isto address, and information in a SOW may vary depending on the nature of the work.
The agency will provide specifications in the RFP regarding the work the contractor willperform. This initiates an interaction between a proposer and the agency and further leads to twodistinct areas of contractor-agency activity. The first concerns development and submitting ofproposals stating how the laboratory work will be conducted to meet specific agency needs. Thesecond concerns agency evaluations of the laboratory�s work according to contract specifications(Section E.5) and the SOW. Once the contract is awarded, a contractor is bound to perform thework as proposed.
Specific sections of each contract cover exactly what is expected of the contractor and itsanalytical facilities to fulfill the terms and conditions of the contract. The SOW describes therequired tasks and deliverables, and presents technical details regarding how tasks are to be

Contracting Laboratory Services
E-12MARLAP JULY 2004
executed. A well written SOW provides technical information and guidance that directs thecontractor to a practice that is technically qualified, meets all relevant regulatory requirements,and appropriately coordinates all work activities. A sample checklist for key information thatmay be in a SOW is presented in Table E.2. Note that not all topics in the list are appropriate foreach project, and in some cases, only a subset is required. The list may also be considered inrelation to less formal working relationships (e.g., purchase order), as well as tasks covered informal contracts.
TABLE E.2 � SOW checklists for the agency and proposerSAMPLE HISTORY____ General background on the problem____ Site conditions____ Regulatory background____ Sample origin____ Analytes and interferences (chemical forms and estimated concentration range)____ Safety issues____ Data use
____ Regulatory compliance____ Litigation
ANALYSIS RELATED____ Number of samples____ Matrix____ Container type and volume____ Receiving and storage requirements____ Special handling considerations____ Custody requirements____ Preservation requirements, if any____ Analytes of interest (specific isotopes or nuclide)____ Measurement Quality Objectives____ Proposed method (if appropriate) and method validation documentation____ Regulatory reporting time requirement (if applicable)____ Analysis time requirements (time issues related to half-lives)____ QC requirements (frequency, type, and acceptance criteria)____ Waste disposal issues during processing____ Licenses and accreditation
OVERSIGHT____ Quality manual____ Required Performance Evaluation Program participation____ Criteria for (blind) QC____ Site visit/data assessment____ Audit (if any)
REPORTING REQUIREMENTS____ Report results as gross, isotopic....____ Reporting units____ Reporting basis (dry weight, ....)____ How to report measurement uncertainties____ Reporting Minimum Detectable Concentration and Minimum Quantifiable Concentration____ Report contents desired and information for electronic data transfer____ Turn-around time requirements____ Electronic deliverables____ Data report format and outline
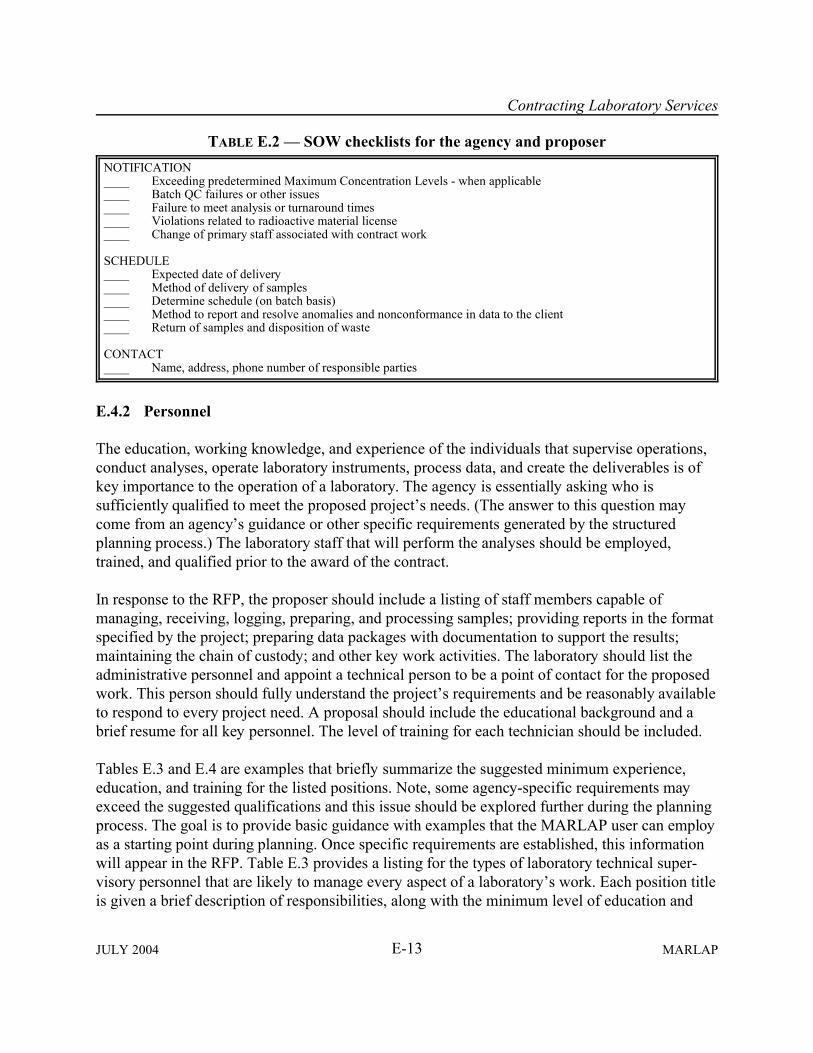
Contracting Laboratory Services
TABLE E.2 � SOW checklists for the agency and proposer
E-13JULY 2004 MARLAP
NOTIFICATION____ Exceeding predetermined Maximum Concentration Levels - when applicable____ Batch QC failures or other issues____ Failure to meet analysis or turnaround times____ Violations related to radioactive material license____ Change of primary staff associated with contract work
SCHEDULE____ Expected date of delivery____ Method of delivery of samples____ Determine schedule (on batch basis)____ Method to report and resolve anomalies and nonconformance in data to the client____ Return of samples and disposition of waste
CONTACT____ Name, address, phone number of responsible parties
E.4.2 Personnel
The education, working knowledge, and experience of the individuals that supervise operations,conduct analyses, operate laboratory instruments, process data, and create the deliverables is ofkey importance to the operation of a laboratory. The agency is essentially asking who issufficiently qualified to meet the proposed project�s needs. (The answer to this question maycome from an agency�s guidance or other specific requirements generated by the structuredplanning process.) The laboratory staff that will perform the analyses should be employed,trained, and qualified prior to the award of the contract.
In response to the RFP, the proposer should include a listing of staff members capable ofmanaging, receiving, logging, preparing, and processing samples; providing reports in the formatspecified by the project; preparing data packages with documentation to support the results;maintaining the chain of custody; and other key work activities. The laboratory should list theadministrative personnel and appoint a technical person to be a point of contact for the proposedwork. This person should fully understand the project�s requirements and be reasonably availableto respond to every project need. A proposal should include the educational background and abrief resume for all key personnel. The level of training for each technician should be included.
Tables E.3 and E.4 are examples that briefly summarize the suggested minimum experience,education, and training for the listed positions. Note, some agency-specific requirements mayexceed the suggested qualifications and this issue should be explored further during the planningprocess. The goal is to provide basic guidance with examples that the MARLAP user can employas a starting point during planning. Once specific requirements are established, this informationwill appear in the RFP. Table E.3 provides a listing for the types of laboratory technical super-visory personnel that are likely to manage every aspect of a laboratory�s work. Each position titleis given a brief description of responsibilities, along with the minimum level of education and
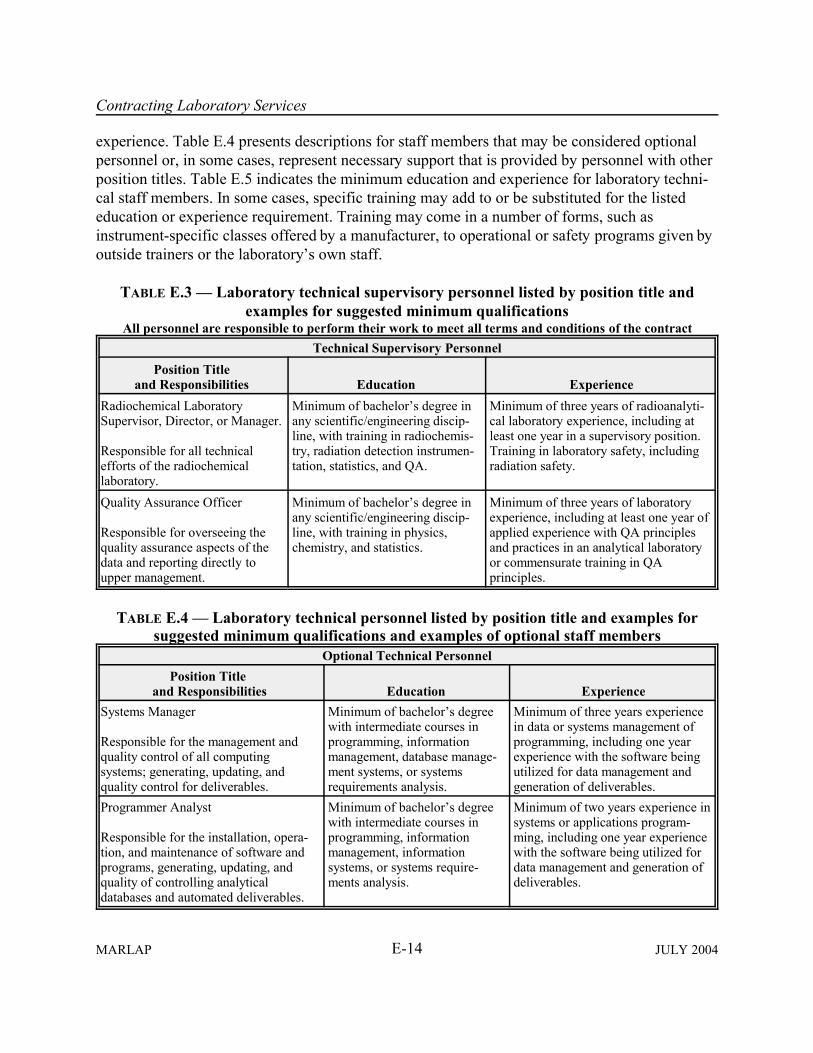
Contracting Laboratory Services
E-14MARLAP JULY 2004
experience. Table E.4 presents descriptions for staff members that may be considered optionalpersonnel or, in some cases, represent necessary support that is provided by personnel with otherposition titles. Table E.5 indicates the minimum education and experience for laboratory techni-cal staff members. In some cases, specific training may add to or be substituted for the listededucation or experience requirement. Training may come in a number of forms, such asinstrument-specific classes offered by a manufacturer, to operational or safety programs given byoutside trainers or the laboratory�s own staff.
TABLE E.3 � Laboratory technical supervisory personnel listed by position title andexamples for suggested minimum qualifications
All personnel are responsible to perform their work to meet all terms and conditions of the contractTechnical Supervisory Personnel
Position Titleand Responsibilities Education Experience
Radiochemical LaboratorySupervisor, Director, or Manager.
Responsible for all technicalefforts of the radiochemicallaboratory.
Minimum of bachelor�s degree inany scientific/engineering discip-line, with training in radiochemis-try, radiation detection instrumen-tation, statistics, and QA.
Minimum of three years of radioanalyti-cal laboratory experience, including atleast one year in a supervisory position.Training in laboratory safety, includingradiation safety.
Quality Assurance Officer
Responsible for overseeing thequality assurance aspects of thedata and reporting directly toupper management.
Minimum of bachelor�s degree inany scientific/engineering discip-line, with training in physics,chemistry, and statistics.
Minimum of three years of laboratoryexperience, including at least one year ofapplied experience with QA principlesand practices in an analytical laboratoryor commensurate training in QAprinciples.
TABLE E.4 � Laboratory technical personnel listed by position title and examples forsuggested minimum qualifications and examples of optional staff members
Optional Technical PersonnelPosition Title
and Responsibilities Education ExperienceSystems Manager
Responsible for the management andquality control of all computingsystems; generating, updating, andquality control for deliverables.
Minimum of bachelor�s degreewith intermediate courses inprogramming, informationmanagement, database manage-ment systems, or systemsrequirements analysis.
Minimum of three years experiencein data or systems management ofprogramming, including one yearexperience with the software beingutilized for data management andgeneration of deliverables.
Programmer Analyst
Responsible for the installation, opera-tion, and maintenance of software andprograms, generating, updating, andquality of controlling analyticaldatabases and automated deliverables.
Minimum of bachelor�s degreewith intermediate courses inprogramming, informationmanagement, informationsystems, or systems require-ments analysis.
Minimum of two years experience insystems or applications program-ming, including one year experiencewith the software being utilized fordata management and generation ofdeliverables.

Contracting Laboratory Services
E-15JULY 2004 MARLAP
TABLE E.5 � Laboratory technical personnel listed by position title and examples forsuggested minimum qualifications
All personnel are responsible to perform their work to meet all terms and conditions of the contract.Technical Staff
Position Title Education ExperienceGammaSpectrometrist
Minimum of bachelor�s degree in chemistry orany physical scientific/engineering discipline.Training courses in gamma spectrometry.
Minimum two years experience in spectro-metric data interpretation. Formal training orone year experience with spectral analysissoftware used to analyze data.
AlphaSpectrometrist
Minimum of bachelor�s degree in chemistry orany physical scientific/engineering discipline.Training courses in alpha spectrometry.
Formal training or one year experience withspectral analysis software used to analyzedata.
Radiochemist Minimum of bachelor�s degree in chemistry orany physical scientific/engineering discipline. Inlieu of the educational requirement, two years ofadditional, equivalent radioanalytical experiencemay be substituted.
Minimum of two years experience withchemistry laboratory procedures, with at leastone year of radiochemistry in conjunctionwith the educational qualifications, including(for example): 1) Operation and maintenanceof radioactivity counting equipment; 2)Alpha/gamma spectrometric data interpreta-tion; 3) Radiochemistry analytical procedures;and 4) Sample preparation for radioactivityanalysis.
Counting RoomTechnician
Minimum of bachelor�s degree in chemistry orany scientific/engineering discipline.
Minimum of one year experience in aradioanalytical laboratory.
LaboratoryTechnician
Minimum of high school diploma and a collegelevel course in general chemistry orequivalent�or college degree in anotherscientific discipline (e.g., biology, geology, etc.)
Minimum of one year experience in aradioanalytical laboratory.
E.4.3 Instrumentation
A proposer�s laboratory must have in place and in good working order the types and requirednumber of instruments necessary to perform the work advertised by the agency. Specific factorsare noted in the RFP, such as: an estimate for the number of samples, length of the contract, andexpected turnaround times which influence the types of equipment needed to support thecontract.
Analytical work can be viewed as a function of current technology. Changes may occur fromtime to time, especially in relation to scientific advancements in equipment, software, etc.Instrumentation represents the mechanical interface between prepared samples and the datagenerated in the laboratory. The capacity to process larger and larger numbers of samples whilesustaining the desired level of analytical sensitivity and accuracy is ultimately a function of thelaboratory�s equipment, and the knowledge and experience of the individuals who operate and
Contracting Laboratory Services
E-16MARLAP JULY 2004
maintain the instruments. Additional support for the laboratory�s on-line activities or the state ofreadiness to maintain a constant or an elevated peak work load comes in the form of back-upinstruments that are available at all times. Information concerning service contracts that providerepairs or replacement when equipment fails to perform is important to meeting contractobligations. Demonstrating that this support will be in place for the duration of the contract is akey element for the proposer to clearly describe in a proposal.
E.4.3.1 Type, Number, and Age of Laboratory Instruments
A description of the types of instruments at a laboratory is an important component of theproposal. The number of each type of instrument available for the proposed work should beindicated in the proposal. This includes various counters, detectors, or other systems used forradioanalytical work. A complete description for each instrument might include the age oracquisition date. This information may be accompanied by a brief description indicating the levelof service an instrument provides at its present location.
E.4.3.2 Service Contract
The types and numbers of service contracts may vary depending on the service provider. Newlypurchased instruments will be covered by a manufacturer�s warranty. Other equipment usedbeyond the initial warranty period may either be supported by extensions to the manufacturer�swarranties or by other commercial services that cover individual instrument or many instrumentsunder a site-wide service contract. Whatever type of support is in place, the contractor will needto state how having or not having such service contracts affects the laboratory�s ability to meetthe terms of the contract and the potential impact related to the SOW.
E.4.4 Narrative to Approach
A proposal can �speak� to the agency�s evaluation team by providing a logical and clearly writtennarrative of how the proposer will attend to every detail listed in the RFP. This approach conveyskey information in a readable format to relate a proposer�s understanding, experience, andworking knowledge of the anticipated work. In this way, the text also illustrates how variouscomponents of the proposal work together to contribute to a unified view of the laboratoryfunctions given the proposed work load as described in the RFP and as detailed in the SOW. Thenext four sections provide examples of proposal topics for which the proposer may apply anarrative format to address how the laboratory is qualified to do the proposed work.
E.4.4.1 Analytical Methods or Protocols
The proposer should list all proposed methods they plan to use. The proposal should also furnishall required method validation documentation to gain approval for use. When addressing use of

Contracting Laboratory Services
E-17JULY 2004 MARLAP
methods, the proposer can describe how a method exhibits the best performance and also offerspecific solutions to meet the agency�s needs.
E.4.4.2 Meeting Contract Measurement Quality Objectives
The agency�s planning process started with a review of questions and issues concerned withgenerating specific project APSs/MQOs. Stating how a proposer intends to meet the APSs/MQOs data quality requirements adds an important section to the proposal. This allows thecompeting laboratories to demonstrate that they understand the requirements of the contract andtheir individual approaches to fulfilling these requirements. Further evidence in support of theproposer�s preparations to meet or exceed the agency�s data quality needs is generally covered ina contract laboratory�s quality manual (Section E.4.5).
E.4.4.3 Data Package
The proposer responds to the RFP by stating how data will be processed under the contract. Anarrative describing the use of personnel, equipment, and facilities illustrates every step inobtaining, recording, storing, formatting, documenting and reporting sample information andanalytical results. The specific information related to all these activities and the requiredinformation as specified by the SOW is gathered into a data package. For example, a standarddata package includes a case narrative, the results (in the format specified by the agency), acontractor data review checklist, any nonconformance memos resulting from the work, agencyand contractor-internal chains of custody, sample and quality control (QC) sample data (thisincludes a results listing, calculation file, data file list, and the counting data) and continuingcalibration data, and standard and tracer source-trace information, when applicable. At theinception of a project, initial calibration data are provided for detectors used for the work. If adetector is recalibrated, or a new detector is placed in service, initial calibration data are providedwhenever those changes apply to the analyses in question.
Specific data from the data package may be further formatted in reports, including electronicformats, as the required deliverables which the contractor will send to the agency. The delivery ofthis information is also specified according to a set schedule.
E.4.4.4 Schedule
The RFP will provide information that allows the proposer to design a schedule that is tailored tothe agency�s need. For example, samples that are part of routine monitoring will arrive at thelaboratory and the appropriate schedule reflects a cycle of activity from sample preparation todelivering a data package to the agency. This type of schedule is repeatedly applied to each set ofsamples. Other projects, surveys, or studies may follow a time line of events from start tocompletion, with distinct sets of samples and unique needs that arise at specific points in time.The proposer will initially outline a schedule that may utilize some cycling of activities at various

Contracting Laboratory Services
E-18MARLAP JULY 2004
stages of the work, but overall the nature of the work may change from stage to stage. Theschedule in this case will reflect how the contractor expects to meet certain unique milestones onspecific calendar dates.
Some projects will have certain requirements to process samples according to a gradedprocessing schedule. The SOW should provide the requirements for the radiological holding timeand sample processing turnaround time. Radiological holding time refers to the time required toprocess the sample�the time differential from the sample receipt date to the final sample matrixcounting date. The sample processing turnaround time normally means the time differential fromthe receipt of the sample at the laboratory (receipt date) to the reporting of the analytical resultsto the agency (analytical report date). As such, the turnaround time includes the radiologicalholding time, the time to generate the analytical results, and the time to report the results to theagency.
Typically, three general time-related categories are stated: routine, expedited, and rush. Routineprocessing is normally a 30-day turnaround time, whereas expedited processing may have aturnaround time greater than five days but less than 30 days. Rush sample processing may have aradiological holding time of less than five days. For short-lived nuclides, the RFP should state therequired radiological holding time, wherein the quantification of the analyte in the sample mustbe complete within a certain time period. The reporting of such results may be the standard 30-day turnaround time requirement. The agency should be reasonable and technically correct indeveloping the required radiological holding and turnaround times.
The RFP should specify a schedule of liquidated or compensatory damages that should beimposed when the laboratory is noncompliant relative to technical requirements, radiologicalholding times, or turnaround times.
E.4.4.5 Sample Storage and Disposal
The RFP should specify the length of time the contractor must store samples after results arereported. In addition, it should state who is economically and physically responsible for thedisposal of the samples. The laboratory should describe how the samples will be stored for thespecified length of time and how it plans to dispose of the samples in accordance with local, stateand federal regulations.
E.4.5 Quality Manual
Only those radiochemistry laboratories that adhere to well-defined quality procedures�pertaining to data validation, internal and external laboratory analytical checks, instrumentprecision and accuracy, personnel training, and setting routine laboratory guidelines�can insurethe highest quality of scientifically valid and defensible data. In routine practice, a laboratory

Contracting Laboratory Services
E-19JULY 2004 MARLAP
prepares a written description of its quality manual that addresses, at a minimum, the followingitems:
� Organization and management; � Quality system establishment, audits, essential quality controls and evaluation and data
verification; � Personnel (qualifications and resumes); � Physical facilities (accommodations and environment); � Equipment and reference materials; � Measurement traceability and calibration; � Test methods and standard operating procedures (methods); � Sample handling, sample acceptance policy and sample receipt; � Records; � Subcontracting analytical samples; � Outside support services and supplies; and � Complaints.
The quality manual may be a separately prepared document that may incorporate or referencealready available and approved laboratory standard operating procedures (SOPs). This manualprovides sufficient detail to demonstrate that the contractor�s measurements and data areappropriate to meet the MQOs and satisfy the terms and conditions of the contract. The manualshould clearly state the objective of the SOP, how the SOP will be executed, and whichperformance standards will be used to evaluate the data. Work-related requirements based onquality assurance are also an integral part of the SOW.
When a proposal is submitted for review, the contracting laboratory generally sends along acurrent copy of its quality manual. Additional details pertaining to the content of a qualitymanual can be found in NELAC (2002), ANSI/ASQC E-4, EPA (1993, 2001, 2002), ISO/IEC17025, and MARSSIM (2000).
E.4.6 Licenses and Accreditations
All laboratories must have appropriate licenses from the U.S. Nuclear Regulatory Commission(NRC) or other jurisdictions (Agreement State, host nation, etc.) to receive, possess, use, transfer,or dispose of radioactive materials (i.e., those licensable as indicated in 10 CFR 30.70, ScheduleA�Exempt Concentrations). A license number and current copy of a laboratory�s licenses aretypically requested with paperwork that one submits to obtain radionuclide materials�forexample, when ordering and arranging to use laboratory standards. Overall, a laboratory�s licensepermits work with certain radionuclides and limits to the quantity of each radionuclide at thelaboratory. A proposer�s license should allow for new work with the types and anticipatedamounts of radionuclides as specified in an RFP. Part of the licensing requirement ensures thatthe laboratory maintains a functioning radiation safety program and properly trains its personnel

Contracting Laboratory Services
E-20MARLAP JULY 2004
in the use and disposal of radioactive materials. For more complete information on licenserequirements, refer to either the NRC, the appropriate state office, or 10 CFR 30.
The laboratory may need to be certified for radioassays by the state in which the lab resides. The RFP should request a copy of the current standing certification(s) to be submitted with theproposal. If the agency expects a laboratory to process samples from numerous states across theUnited States, then additional certifications for other states may or will be required. To requestthat a proposer arrange for certification in multiple states prior to submitting a proposal may beviewed as placing an unfair burden on a candidate laboratory who as yet to learn if it will beawarded a contract. Additional fees, for each state certification, potentially add to a proposer�scost to simply present a proposal. In such cases, an agency may indicate that additional certifica-tion(s)�above that already held for the laboratory�s state of residence�may be required once thecontract is awarded and just prior to initiating the work.
E.4.7 Experience
The contractor, viewed as a single entity made of all its staff members, may have an extensivework history as is exemplified through the number and types of projects and contracts that werepreviously or are currently supported by its laboratory services. This experience is potentially animportant testimonial to the kind of work the contractor is presently able to handle with a highdegree of competence. The agency�s evaluation team will review this information relative to theneed(s) stated in the RFP. The more applicable the track record, the stronger a case the proposerhas when competing for the award.
E.4.7.1 Previous or Current Contracts
In direct relation to the preceding section, the proposer�s staff should respond directly to the RFPwhen asked to provide a list of contracts previously awarded and those they are presentlyfulfilling. Of primary importance, the list should contain contracts that are similar to the oneunder consideration (i.e., similar work load and technical requirements), with the followinginformation:
� Name of the company or agency awarding the contract; � Address; � Phone number; � Name of contact person; and � Scope of contract.
E.4.7.2 Quality of Performance
The agency�s TEC (Section E.5.1) is likely to check a laboratory�s results for its participation in aproficiency program which is sponsored by one of several federal agencies. For example, the

Contracting Laboratory Services
E-21JULY 2004 MARLAP
U.S. Department of Energy (DOE), and National Institute of Standards and Technology (NIST)offer proficiency programs. Records for the laboratory�s results may be reviewed to cover anumber of years. This review indicates quality and consistency in relation to the types of samplesthat the federal agency sends to each laboratory. Thus, at designated times during each year, alaboratory will receive, process, and later report findings for proficiency program samples. Thisroutine is also required for certification by an agency, such as the U.S. Environmental ProtectionAgency (EPA) for drinking water analysis. In this case, to obtain or maintain a certification, thelaboratory must pass (i.e., successfully analyze) on the basis of a specific number of the totalsamples.
E.5 Proposal Evaluation and Scoring Procedures
The initial stages of the evaluation process separate technical considerations from cost. Cost willenter the selection process later on. The agency�s TEC will consider all proposals and then makea first cut (Table E.6 and Section E.5.3 below), whereby some proposals are eliminated based onthe screening process. This selection from among the candidates is based on predeterminedcriteria that are related to the original MQOs and how a proposer�s laboratory is technically ableto support the contract. A lab that is obviously unequipped to perform work according to theSOW is certain to be dropped early in the selection process. In some cases, the stated ability tomeet the analysis request should be verified by the agency, through pre-award audits andproficiency testing, as described below. Letters notifying unsuccessful bidders may be sent at thistime. For information concerning a proposer�s response to this letter, see Section E.5.7.
E.5.1 Evaluation Committee
The agency personnel initially involved in establishing a new contract and starting the selectionprocess include the Contracting Officer (administrative, nontechnical) and Contracting Officer�sRepresentative (technical staff person advising the Contracting Officer). Once all proposals areaccepted by the agency, a team of technical staff members score the technical portion of theproposal. The team is lead by a chairperson who oversees the activities of this TEC. It isrecommended that all members of the TEC have a technical background relevant to the subjectmatter of the contract.
One approach to evaluation includes sending copies of all proposals to each member of thecommittee for individual scoring (Table E.6). The agency, after an appropriate length of time,may conduct a meeting or conference call to discuss the scores and reach a unified decision.Using this approach, each proposal is given a numerical score and these are listed in descendingorder. A �break-point� in the scores is chosen. All candidates above this point are accepted for acontinuation of the selection process. Those below the break point may be notified at this point intime. Note that evaluations performed by some agencies may follow variations on this scoringand decision process.

Contracting Laboratory Services
E-22MARLAP JULY 2004
The TEC must have a complete technical understanding of the subject matter related to theproposed work and the contract that is awarded at the end of the selection process. Theseindividuals are also responsible for responding to any challenge to the agency�s decision to awardthe contract. Their answers to such challenges are based on technical merit in relation to theproposed work (Section E.5.7).
E.5.2 Ground Rules � Questions
The agency�s solicitation should clearly state if and when questions from an individual proposerwill be allowed during the selection process. Information furnished in the agency�s response issimultaneously sent to all competing laboratories.
E.5.3 Scoring/Evaluating Scheme
The agency should prepare an RFP that includes information concerning scoring of proposals orweights for areas of evaluation. This helps a proposer to understand the relative importance ofspecific sections in a proposal and how a proposal will be scored. In this case, the method ofevaluation and the scoring of specific topic areas is outlined in the solicitation. If this informationis not listed in the solicitation and because evaluation formats differ agency to agency, proposersmay wish to contact the agency for additional agency-specific details concerning this process.
An agency may indicate the relative weight an evaluation area holds with regard to the proposedwork for two principle reasons. First, the request is focused to meet a need for a specific type ofwork for a given study, project, or program. This initially allows a proposer to concentrate onareas of greatest importance. Second, if the contractor submits a proposal that lacks sufficientinformation to demonstrate support in a specific area, the agency can then indicate how theproposal does not fulfill the need as stated in the request.
Listed below is an example of some factors and weights that an agency might establish before anRFP is distributed:
DescriptionFactor I . . . .Factor II . . .Factor III . . .Factor IV . .
Factor V . . .Factor VI . .
Technical Merit . . . . . . . . . . . . . . . . . . . . . . . . . . . . . . . .Proposer�s Past Performance . . . . . . . . . . . . . . . . . . . . . .Understanding of the Requirements . . . . . . . . . . . . . . . . .Adequacy and Suitability of Laboratory Equipment and
Resources . . . . . . . . . . . . . . . . . . . . . . . . . . . . . . . . . .Academic Qualifications and Experience of Personnel . .Proposer�s Related Experience . . . . . . . . . . . . . . . . . . . .
Weight252515
151010
The format presented above assigns relative weights for each factor�with greater weight givento more important elements of the proposal. Technical merit (Factor I) includes technical

Contracting Laboratory Services
E-23JULY 2004 MARLAP
approach, method validation, and the ability to meet the MQOs, etc. Factor II includes how wellthe proposer performed in previous projects or related studies. A proposer�s understanding(Factor III) is demonstrated by the laboratory�s programs, commitments as well as certifications,licenses, etc., to ensure the requirements of the RFQ will be met. Adequacy and suitability(Factor IV) is generally an indication that the laboratory is presently situated to accept samplesand conduct the work as proposed. Factor V focuses on topics covered previously in SectionE.4.2 while the proposer�s experience (Factor VI) is considered in Section E.4.7.
An agency may use a Technical Evaluation Sheet�in conjunction with the Proposal EvaluationPlan as outlined in the next section (Table E.6)�to list the total weight for each factor and toprovide a space for the evaluator�s assigned rating. The evaluation sheet also provides areas torecord the RFP number, identity of the proposer, and spaces for total score, remarks, andevaluator�s signature. The scoring and evaluation scheme is based on additional, more detailed,considerations which are briefly discussed in the next three sections (E.5.3.1 to E.5.3.3)
E.5.3.1 Review of Technical Proposal and Quality Manual
Each bidding-contractor laboratory will be asked to submit a technical proposal and a copy of itsquality manual. This document is intended to address all of the technical and general laboratoryrequirements. The proposal and quality manual are reviewed by members of the TEC who areboth familiar with the proposed project and are clearly knowledgeable in the field ofradiochemistry.
Table E.6 is an example of a proposal evaluation plan (based on information from the U.S.Geological Survey). This type of evaluation can be applied to proposals as they are considered bythe TEC.
TABLE E.6 � Example of a proposal evaluation planProposal Evaluation
Objective: To ensure impartial, equitable, and comprehensive evaluation of proposals from contractors desiringto accomplish the work as outlined in the Request for Proposals and to assure selection of the contractor whoseproposal, as submitted, offers optimum satisfaction of the government�s objective with the best composite blendof performance, schedules, and cost.
Basic Philosophy: To obtain the best possible technical effort which satisfies all the requirements of theprocurement at the lowest overall cost to the government.
Evaluation Procedures
1. Distribute proposals and evaluation instructions to Evaluation Committee.
2. Evaluation of proposals individually by each TEC member. Numerical values are recorded with a concisenarrative justification for each rating.

Contracting Laboratory Services
E-24MARLAP JULY 2004
3. The entire committee by group discussion prepares a consensus score for each proposal. Unanimity isattempted, but if not achieved, the Chairperson shall decide the score to be given.
4. A Contract Evaluation Sheet listing the individual score of each TEC member for each proposal and theconsensus score for the proposal is prepared by the Chairperson. The proposals are then ranked indescending order.
5. The Chairperson next prepares an Evaluation Report which includes a Contract Evaluation Sheet, the ratingsheets of each evaluator, a narrative discussion of the strong and weak points of each proposal, and a list ofquestions which must be clarified at negotiation. This summary shall be forwarded to the ContractingOfficer.
6. If required, technical clarification sessions are held with acceptable proposers.
7. Analysis and evaluation of the cost proposal will be made by the Contracting Officer for all proposalsdeemed technically acceptable. The Chairperson of the TEC will perform a quantitative and qualitativeanalysis on the cost proposals or those firms with whom cost negotiations will be conducted.
Evaluation Criteria
The criteria to be used in the evaluation of this proposal are selected before the RFP is issued. In accordance withthe established agency policy, TEC members prepare an average or consensus score for each proposal on thebasis of these criteria and only on these criteria.
A guideline for your numerical rating and rating sheets with assigned weights for each criteria are outlined nextunder Technical Evaluation Guidelines for Numerical Rating.
Technical Evaluation Guidelines for Numerical Rating
1. Each item of the evaluation criteria will be based on a rating of 0 to 10 points. Therefore, each evaluator willscore each item using the following guidelines:
a. Above normal: 9 to 10 points (a quote element which has a high probability of exceeding the expressedRFP requirements).
b. Normal: 6 to 8 points (a quote element which, in all probability, will meet the minimum requirementsestablished in the RFP and Scope of Work).
c. Below normal: 3 to 5 points (a quote element which may fail to meet the stated minimum requirements,but which is of such a nature that it has correction potential).
d. Unacceptable: 0 to 2 points (a quote element which cannot be expected to met the stated minimumrequirements and is of such a nature that drastic revision is necessary for correction).
2. Points will be awarded to each element based on the evaluation of the quote in terms of the questions asked.
3. The evaluator shall make no determination on his or her own as to the relative importance of various itemsof the criteria. The evaluator must apply a 0 to 10 point concept to each item without regard to his or herown opinion concerning one item being of greater significance than another. Each item is given apredetermined weight factor in the Evaluation Plan when the RFP is issued and these weight factors must beused in the evaluation.
Contracting Laboratory Services
E-25JULY 2004 MARLAP
E.5.3.2 Review of Laboratory Accreditation
A copy of the current accreditation(s) should be submitted with the proposal. The agency shouldconfirm the laboratory�s accreditation by contacting the federal or state agency that provided theaccreditation. In some cases, a public listing or code number is provided. Confirming that aspecific code number belongs to a given laboratory will require contacting the agency that issuedthe code.
E.5.3.3 Review of Experience
The laboratory should furnish references in relation to its past or present work (Section E.4.7.1).To the extent possible, this should be done with regard to contracts or projects similar incomposition and size to the proposed project. One or more members of the TEC are responsiblefor developing a list of pertinent questions and then contacting each reference listed by theproposer. The answers obtained from each reference are recorded for use later in the evaluationprocess. In some cases, the laboratory�s previous performance for the same agency should begiven special consideration.
E.5.4 Pre-Award Proficiency Samples
Some agencies may elect to send proficiency or performance testing (PT) samples to thelaboratories that meet a certain scoring criteria in order to demonstrate the laboratory�s analyticalcapability. The composition and number of samples should be determined by the nature of theproposed project. The PT sample matrix should be composed of well-characterized materials. Itis recommended that site-specific PT matrix samples or method validation reference material(MVRM; Chapter 6, Section and Application of an Analytical Method) be used when available.The matrix of which the PT sample is composed must be well characterized and known to theagency staff who supply the sample to the candidate laboratory. For example, if an agency isconcerned with drinking water samples, then the agency�s laboratory may use its own source oftap water as a base for making PT samples. This water, with or without additives, may besupplied for this purpose.
Each competing lab should receive an identical set of PT samples. The RFP should specify whowill bear the cost of analyzing these samples, as well as the scoring scheme, (e.g., pass/fail) or asliding scale. Any lab failing to submit results should be automatically disqualified. The resultsshould be evaluated and each lab given a score. This allows the agency to narrow the selectionfurther�after which only two or three candidate laboratories are considered.
At this point, two additional selection phases remain. A visit to each candidate�s facilities comesnext (Section E.5.5) and thereafter, once all technical considerations are reviewed, the cost of thecontractor�s service is examined last (Section E.5.6).

Contracting Laboratory Services
E-26MARLAP JULY 2004
E.5.5 Pre-Award Audit
A pre-award audit, which may be an initial audit, is often performed to provide assurance that aselected laboratory is capable of performing the required analyses in accordance with the SOW.In other words, is the laboratory�s representation (proposal) realistic when compared to theactual facilities? To answer this question, auditors will be looking to see that a candidatelaboratory appears to have all the required elements to meet the proposed contract�s needs. Insome cases, it may be appropriate to conduct both a pre-award audit, followed by an evaluationafter the work begins (see Section E.6.7 for information on ongoing laboratory evaluations).
The two or three labs with the highest combined scores (for technical proposals and proficiencysamples) may be given an on-site audit.
The pre-award audit is a key evaluating factor that is employed before the evaluation committeemakes a final selection. Many federal agencies, including DOE, EPA, and USGS, havedeveloped forms for this purpose. Some of the key items to observe during an audit include:
� Sample Security � Will the integrity of samples be maintained for chain of custody? Ifpossible, examine the facility�s current or past chain-of-custody practice.
� Methods � Are copies of SOP�s available to every analyst? In some cases, one may checkequations used to identify and quantitate the radionuclides of interest. Additional concernsinclude the potential for interferences, total propagated uncertainty, decision levels, andminimum detectable concentrations.
� Method Validation Documentation � Verify the method validation documentation providedin the response to the RFP. Have there been any QA/QC issues related to the methods? Arethe identified staff (provided in the RFP) qualified to perform the methods?
� Adherence to SOPs � This may include looking to see that sample preparation, chemicalanalysis, and radiometric procedures are performed according to the appropriate SOP.
� Internal QC � Check the files and records.
� External QC/PT samples � Check files and records pertaining to third-party programs.
� Training � Check training logs. Examine analysts� credentials, qualifications, and proficiencyexamination results.
� Instrumentation � Check logs. Are instruments well maintained, is there much down time, aretypes and numbers listed in technical proposal correct? Look for QC chart documentation.
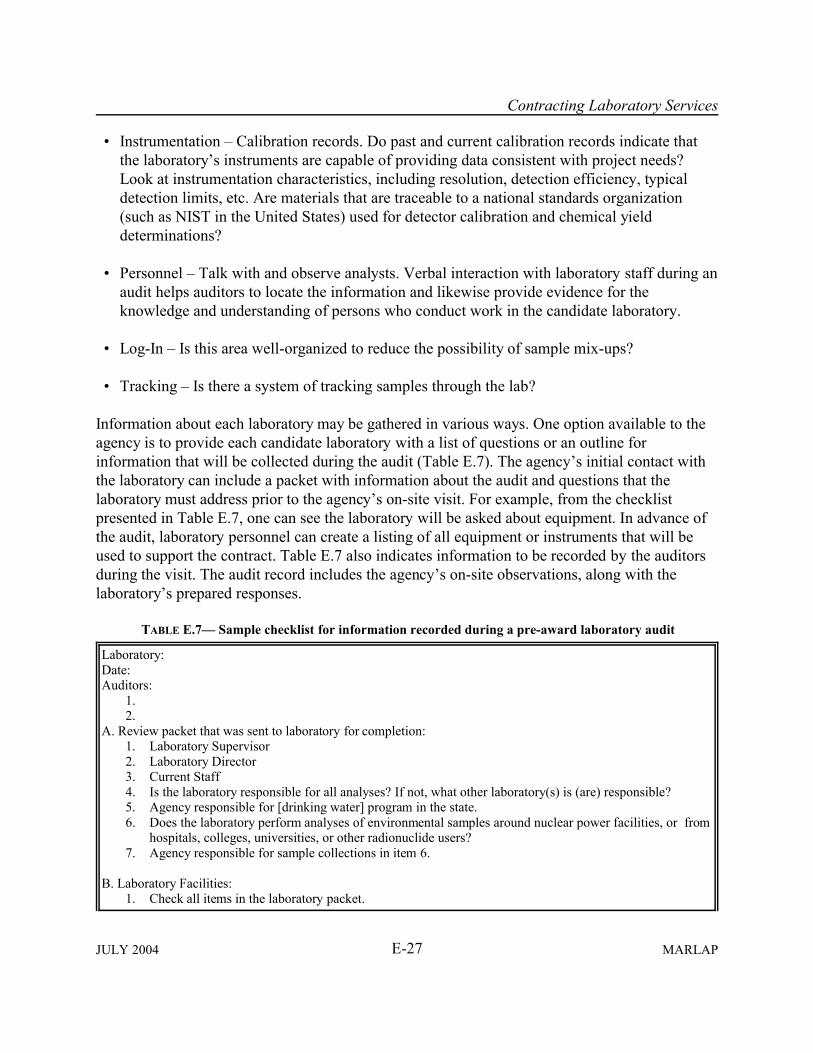
Contracting Laboratory Services
E-27JULY 2004 MARLAP
� Instrumentation � Calibration records. Do past and current calibration records indicate thatthe laboratory�s instruments are capable of providing data consistent with project needs?Look at instrumentation characteristics, including resolution, detection efficiency, typicaldetection limits, etc. Are materials that are traceable to a national standards organization(such as NIST in the United States) used for detector calibration and chemical yielddeterminations?
� Personnel � Talk with and observe analysts. Verbal interaction with laboratory staff during anaudit helps auditors to locate the information and likewise provide evidence for theknowledge and understanding of persons who conduct work in the candidate laboratory.
� Log-In � Is this area well-organized to reduce the possibility of sample mix-ups?
� Tracking � Is there a system of tracking samples through the lab?
Information about each laboratory may be gathered in various ways. One option available to theagency is to provide each candidate laboratory with a list of questions or an outline forinformation that will be collected during the audit (Table E.7). The agency�s initial contact withthe laboratory can include a packet with information about the audit and questions that thelaboratory must address prior to the agency�s on-site visit. For example, from the checklistpresented in Table E.7, one can see the laboratory will be asked about equipment. In advance ofthe audit, laboratory personnel can create a listing of all equipment or instruments that will beused to support the contract. Table E.7 also indicates information to be recorded by the auditorsduring the visit. The audit record includes the agency�s on-site observations, along with thelaboratory�s prepared responses.
TABLE E.7� Sample checklist for information recorded during a pre-award laboratory audit
Laboratory:Date:Auditors:
1.2.
A. Review packet that was sent to laboratory for completion:1. Laboratory Supervisor2. Laboratory Director3. Current Staff4. Is the laboratory responsible for all analyses? If not, what other laboratory(s) is (are) responsible?5. Agency responsible for [drinking water] program in the state.6. Does the laboratory perform analyses of environmental samples around nuclear power facilities, or from
hospitals, colleges, universities, or other radionuclide users?7. Agency responsible for sample collections in item 6.
B. Laboratory Facilities:1. Check all items in the laboratory packet.
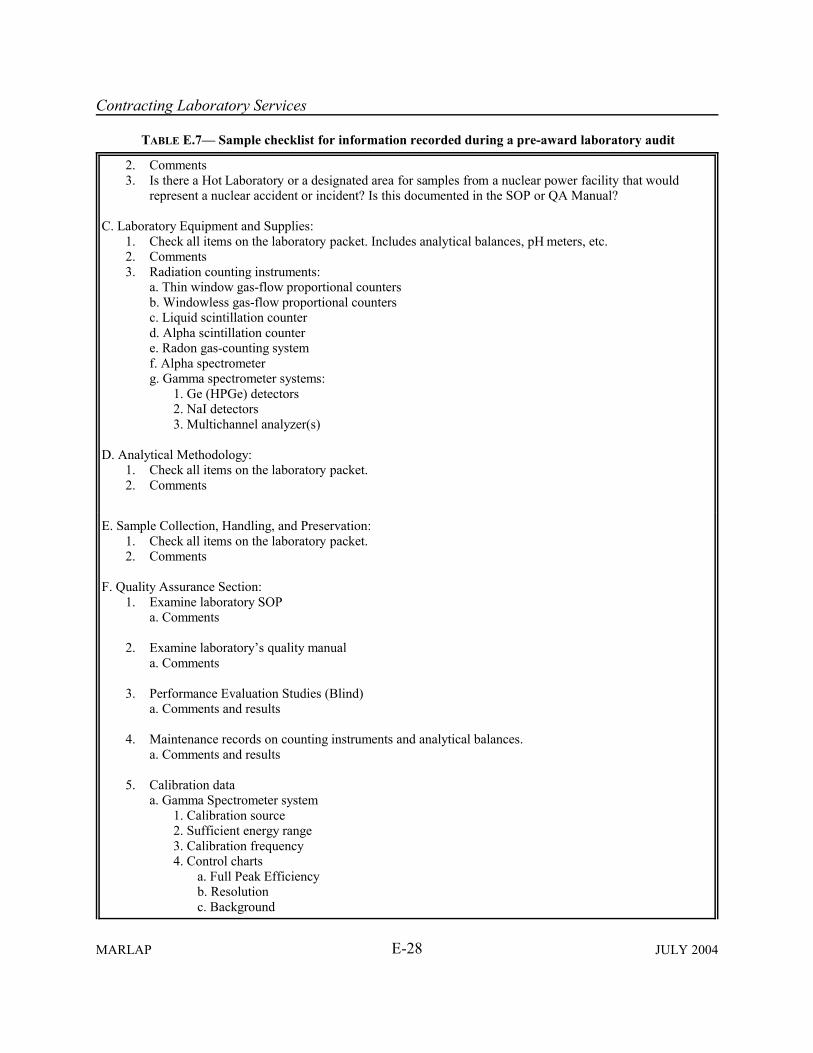
Contracting Laboratory Services
TABLE E.7� Sample checklist for information recorded during a pre-award laboratory audit
E-28MARLAP JULY 2004
2. Comments3. Is there a Hot Laboratory or a designated area for samples from a nuclear power facility that would
represent a nuclear accident or incident? Is this documented in the SOP or QA Manual?
C. Laboratory Equipment and Supplies:1. Check all items on the laboratory packet. Includes analytical balances, pH meters, etc.2. Comments3. Radiation counting instruments:
a. Thin window gas-flow proportional countersb. Windowless gas-flow proportional countersc. Liquid scintillation counterd. Alpha scintillation countere. Radon gas-counting systemf. Alpha spectrometerg. Gamma spectrometer systems:
1. Ge (HPGe) detectors2. NaI detectors3. Multichannel analyzer(s)
D. Analytical Methodology:1. Check all items on the laboratory packet. 2. Comments
E. Sample Collection, Handling, and Preservation:1. Check all items on the laboratory packet. 2. Comments
F. Quality Assurance Section:1. Examine laboratory SOP
a. Comments
2. Examine laboratory�s quality manuala. Comments
3. Performance Evaluation Studies (Blind)a. Comments and results
4. Maintenance records on counting instruments and analytical balances.a. Comments and results
5. Calibration dataa. Gamma Spectrometer system
1. Calibration source2. Sufficient energy range3. Calibration frequency4. Control charts
a. Full Peak Efficiencyb. Resolutionc. Background
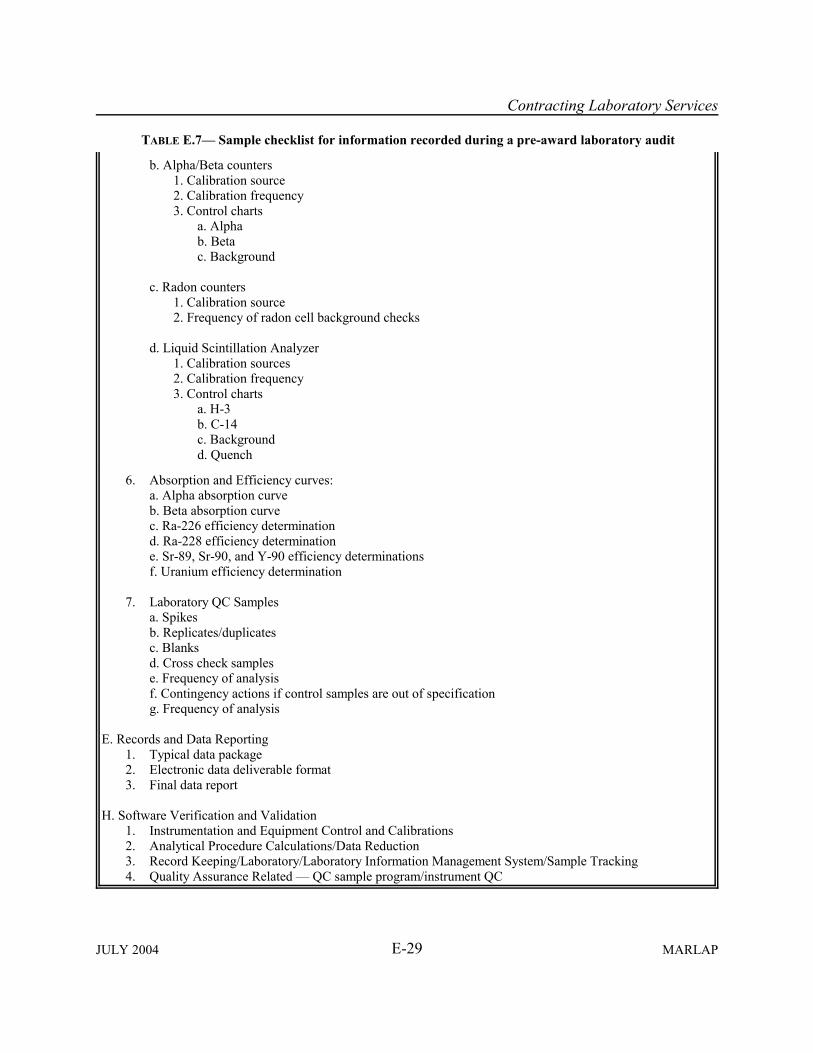
Contracting Laboratory Services
TABLE E.7� Sample checklist for information recorded during a pre-award laboratory audit
E-29JULY 2004 MARLAP
b. Alpha/Beta counters1. Calibration source2. Calibration frequency3. Control charts
a. Alphab. Betac. Background
c. Radon counters1. Calibration source2. Frequency of radon cell background checks
d. Liquid Scintillation Analyzer1. Calibration sources2. Calibration frequency3. Control charts
a. H-3b. C-14c. Backgroundd. Quench
6. Absorption and Efficiency curves:a. Alpha absorption curveb. Beta absorption curvec. Ra-226 efficiency determinationd. Ra-228 efficiency determinatione. Sr-89, Sr-90, and Y-90 efficiency determinationsf. Uranium efficiency determination
7. Laboratory QC Samplesa. Spikesb. Replicates/duplicatesc. Blanksd. Cross check samplese. Frequency of analysisf. Contingency actions if control samples are out of specificationg. Frequency of analysis
E. Records and Data Reporting1. Typical data package2. Electronic data deliverable format3. Final data report
H. Software Verification and Validation1. Instrumentation and Equipment Control and Calibrations2. Analytical Procedure Calculations/Data Reduction3. Record Keeping/Laboratory/Laboratory Information Management System/Sample Tracking4. Quality Assurance Related � QC sample program/instrument QC

Contracting Laboratory Services
E-30MARLAP JULY 2004
E.5.6 Comparison of Prices
To this point, the selection process focuses on technical issues related to conducting work underthe proposed contract. Keeping this separate from cost considerations simplifies the process andhelps to sustain reviewer objectivity. Once the scoring of labs is final, the price of analyses maybe reviewed and compared. Prices are now considered along with inspection results. This part ofthe process is best performed by technical personnel, including members of the TEC who workin either a laboratory or the field setting, and who possess the knowledge to recognize a price thatis reasonable for a given type of analysis. Various scenarios may apply where prices differ:
� Candidates are dropped generally if their proposed prices are extreme.
� Laboratories that score well�aside from their prices that may still be on the high side�aregiven an opportunity to rebid with a best and final cost. This lets laboratories know they haveentered the final stage of the selection process.
A final ranking is based on the technical evaluation, including the proficiency examination andaudit if conducted, and the best-and-final prices submitted by each laboratory.
While there is no way to determine how evaluations may be conducted in the future, some extraconsideration may be given to proposals that offer greater technical capabilities (i.e., those thathouse state-of-the-art or high-tech analytical services) as opposed to fulfilling the minimumrequirements of the RFP.
E.5.7 Debriefing of Unsuccessful Vendors
At an appropriate time in the selection process, all unsuccessful bidders are sent a letter outliningthe reasons that they were not awarded the contract. As noted previously, the RFP should be veryexplicit in illustrating what a proposal should contain and which areas carry more or less weightwith regard to the agency�s evaluation. If so, the agency is able to provide a written response tospecifically identify areas of the proposal where the contractor lacks the appropriate services or isapparently unable to present a sufficiently strong case documenting an ability to do the work.Also, as stated previously, the proposer must present as clear a case as possible and write into theproposal all relevant information. A simple deletion of key information will put a capableproposer out of the running in spite of the experience, support, and services they are able torender an agency.
If a contractor wishes an individual debriefing, the agency can arrange to have the TEC meetwith the contractor�s representatives. This meeting allows for an informal exchange to furtherexplore issues to the satisfaction of the proposer. This exchange may offer the agency anopportunity to restate and further clarify the expected minimum qualifications that are required ofthe proposer.
Contracting Laboratory Services
E-31JULY 2004 MARLAP
A more formal approach contesting the agency�s decision follows after a protest is lodged by thecontractor. In this case, the agency�s TEC and the contractor�s representatives are accompaniedby legal council for both sides.
E.6 The Award
The selection process ends when the agency personnel designate which contractor will receivethe award. Several steps follow in advance of formally presenting the award. This essentiallyincludes in-house processing, a review by the agency�s legal department, and a final review bythe contract staff. These activities verify that the entire selection process was followed properlyand that the contract�s paperwork is correct. The agency�s contracts office then signs the properdocuments and the paperwork is sent to the contractor. The contract becomes effective as of thedate when the government�s contracting officer signs.
E.7 For the Duration of the Contract
After the award is made, the agency enters into a working relationship with the contractlaboratory and work begins. Over the period of the contract, the agency will send samples,receive deliverables, and periodically check the laboratory�s performance. The work according tothe SOW and the activities associated with performance checks and laboratory evaluations aretopics covered beginning with the next section. Furthermore, as data are delivered to the agency,invoices will be sent by the contractor to the agency. The agency will process the invoices insteps: that receipt of data is initially confirmed, the results are appropriate (i.e., valid), and finallythat the invoice is paid. This activity may occur routinely as invoices arrive�weekly, monthly, orat some other time interval throughout the course of a contract.
Keep in mind that the structured planning process is iterative in nature and may come into play atany point during a contract period. For example, federal or state laboratories engaging contract-support services may be involved in routine monitoring of numerous sampling sites. For sets ofsamples that are repeatedly taken from a common location over the course of years, only thediscovery of unique results or change in performance-based methods may instigate an iterationand a review of the MQOs. For other types of projects, such as a location undergoing aMARSSIM-site survey, the project plan may change as preliminary survey work enters a periodof discovery�e.g., during a scoping or characterization survey (MARSSIM, 2000). Even duringa final status survey, discovery of some previously unknown source of radioactive contaminationmay force one to restate not only the problem, but to reconsider every step in the planningprocess. Modification of a contract may be necessary to address these circumstances.
Contracting Laboratory Services
E-32MARLAP JULY 2004
E.7.1 Managing a Contract
Communication is key to the successful management and execution of the contract. Problems,schedule, delays, potential overruns, etc., can only be resolved quickly if communicationsbetween the laboratory and agency are conducted promptly.
A key element in managing a contract is the timely verification (assessment) of the data packagesprovided by the laboratory. Early identification of problems allows for corrective actions toimprove laboratory performance and, if necessary, the cessation of laboratory analyses untilsolutions can be instituted to prevent the production of large amounts of data which are unusable.Note that some sample matrices and processing methods can be problematic for even the bestlaboratories. Thus the contract manager must be able to discern between failures due tolegitimate reasons and poor laboratory performance.
E.7.2 Responsibility of the Contractor
First and foremost, the responsibility of the laboratory is to meet the performance criteria of thecontract. If the SOW is appropriately written, this provides guidance necessary to ensure the dataproduced will meet the project planning goals and be of definable quality. Similarly, thelaboratory must communicate anticipated or unforeseen problems as soon as possible. Again, thiscould easily occur with complex, unusual, or problematic sample matrices. Communication isvital to make sure that matrix interferences are recognized as early as possible, and thatsubsequent analyses are planned accordingly.
The laboratory�s managers must plan the analysis�that is, have supplies, facilities, staff, andinstruments available as needed�and schedule the analysis to meet the agency�s due date. In thelatter case, a brief buffer period might be included for unanticipated problems and delays, thusallowing the laboratory the opportunity to take appropriate corrective action on problemsencountered during an analysis.
E.7.3 Responsibility of the Agency
During the period of the contract, the agency is responsible for employing external qualityassurance oversight. Thus the performance of the laboratory should be monitored continually toinsure the agency is receiving compliant results. Just because a laboratory produces acceptableresults at the beginning of its performance on a contract does not necessarily mean that it willcontinue to do so throughout the entire contract period. For example, the quality of the data candegenerate at times when an unusually heavy workload is encountered by an environmentallaboratory. One way to monitor this performance is to review the results of internal and externalquality assurance programs. This may in part take the form of site visits (including onsite audits),inclusion of QC samples, evaluation of performance in Performance Evaluations orintercomparison programs, desk audits, and data assessments.

Contracting Laboratory Services
E-33JULY 2004 MARLAP
E.7.4 Anomalies and Nonconformance
The contractor must document and report all deviations from the method and unexpectedobservations that may be of significance to the data user. Such deviations should be documentedin the narrative section of the data package produced by the contract laboratory. Each narrativeshould be monitored closely to assure that the laboratory is documenting departures fromcontract requirements or acceptable practice. The agency�s reviewer should assure that thereason(s) given for the departures are clearly explained and are credible. The repeated reportingof the same deviation may be an indication of internal laboratory problems.
E.7.5 Laboratory Assessment
As work under a contract progresses over time, there are two principle means to assess alaboratory�s performance: by having the laboratory process quality control samples (SectionE.7.5.1 and E.7.5.2), and by agency personnel visiting the laboratory to conduct on-siteevaluations (Section E.7.5.3).
E.7.5.1 Performance Testing and Quality Control Samples
A laboratory�s performance is checked in one of several ways, including the use of agency PTsamples, the laboratory�s QC samples, laboratory participation in a performance evaluationprogram, agency certification program, and through agency audits, which may include an on-sitevisit.
There are several approaches to determining that an analysis is accurate and that the data reflect atrue result. One check on each analysis comes from the laboratory�s own QC measures. Thecontractor will routinely run standards, prepared spiked samples, and blanks, along with thesamples submitted by the agency. Calibrations are also performed and a laboratory technician isexpected to record information to document instrument performance.
Another avenue for monitoring performance comes with measures taken by the agency, includingthe incorporation of a number of double-blind PT samples, with each batch of samples sent to thecontract laboratory. The preparation of double-blind PT samples for matrices other than water isdifficult. A sample designated as a blind PT sample is one that the contractor knows is submittedby the agency for performance testing purposes. A double-blind sample is presented to thelaboratory as if it were just another sample with no indication that this is for performance testingpurposes. In the former case, the samples may be labeled in such a manner that the laboratoryrecognizes these as PT samples. In the latter case, unless the agency takes steps to use verysimilar containers and labeling as that for the field samples, the laboratory may recognize thedouble-blind PT samples for what they are. This in effect compromises the use of a double-blindsample. In each case, the agency knows the level or amount of each radionuclide in the blindsample.
Contracting Laboratory Services
E-34MARLAP JULY 2004
When the analysis for a set of samples is complete and data are sent to the agency, the agency inturn checks the results for the PT samples and then performs data validation. In the case ofcharacterization studies, one may continue to check results for PT samples, but data validationpackages may not be required. If the double-blind results are not within reasonable limits, theagency will need to examine how these specific data may indicate a problem. In the meantime,work on subsequent sample sets cannot go forward until the problem is resolved. Some or allsamples in the questionable batch may need to be reanalyzed depending on the findings for thePT samples. This is a case where storage of samples by the laboratory�e.g., from three to sixmonths after analyses are performed�allows the agency to back track and designate specificsamples for further or repeated analyses. The one exception to going back and doing additionalanalyses arises for samples containing radionuclides with short half lives. This type of samplerequires a more immediate assessment to allow for repeated analyses, if needed.
Where data validation is required, the agency will routinely look at results for the PT samplesthat are added to the sample sets collected in the field. An additional QA measure includes aroutine examination�for example, on a monthly or quarterly basis�of the laboratory�s resultsfor their own internal QC samples. This includes laboratory samples prepared as spikes,duplicates, and blanks that are also run along with the agency samples.
The agency can also schedule times to monitor a contractor laboratory�s participation in aperformance evaluation program�for example, those supported by the DOE, EPA, NIST, orNRC. Each laboratory, including the agency�s own facilities, are expected to participate in suchprograms. The agency will also check to see if a laboratory�s accreditation (if required) is currentand this is something that should be maintained along with participation in a federally sponsoredperformance evaluation program. In general, the states accredit laboratories within theirjurisdiction.
E.7.5.2 Laboratory Performance Evaluation Programs
Participating in an interlaboratory testing program (such as the PE programs mentioned inSection E.7.5.1) is the best way for a laboratory to demonstrate or an agency to evaluate a labora-tory�s measurement quality in comparison to other laboratories or to performance acceptancecriteria. Furthermore, because MARLAP promotes consistency among radiochemistry labora-tories, it is scientifically, programmatically, and economically advantageous to embrace theconcept of a common basis for radioanalytical measurements�a measurement quality systemthat is ultimately traced to a national standards organization. ANSI N42.23 defines a system inwhich the quality and traceability of service laboratory measurements can be demonstratedthrough reference (and monitoring) laboratories. The service (in this case the contracted)laboratory should analyze traceable reference performance testing materials to examine the biasand precision of an analytical methodology or an analyst. Traceable reference material, a sampleof known analyte concentration, is prepared from standard reference material obtained from anational standards body (NIST in the United States) or derived reference material supplied by a
Contracting Laboratory Services
E-35JULY 2004 MARLAP
traceable radioactive source manufacturer (compliance with ANSI N42.22 for source manufac-turers in the United States). Demonstration of measurement performance and traceability shall beconducted at an appropriate frequency.
E.7.5.3 Laboratory Evaluations Performed During the Contract Period
An audit before awarding a contract emphasizes an examination of availability of instruments,facilities, and the potential to handle the anticipated volume of work. This also includesrecognizing that the proper personnel are in place to support the contract. After the award, alaboratory evaluation will place additional weight on how instruments and personnel arefunctioning on a daily basis. Thus, logbooks, charts, or other documentation that are produced asthe work progresses are now examined. This type of evaluation during the contract period uses anapproach that differs from the pre-award audit (Section E.5.5). The format and documentation foran on-site audit may differ from agency to agency. An agency may wish to examine the EPAforms (EPA, 1997) and either adopt these or modify them to accommodate radionuclide workthat includes sample matrices other than water or additional nuclides not presently listed.
There are two types of evaluations or audits that can be performed during the life of a contract.The first involves agency personnel that visit the contractor�s facilities. The second approachincludes activities conducted by agency personnel without visiting the laboratory.
In the former case, agency personnel examine documentation at the laboratory, including eachinstrument�s logbook which is used to record background values, or to ensure that QC charts arecurrent. During this type of evaluation, the agency and contractor personnel have an opportunityto communicate face-to-face, which is a benefit to both parties when clarification or additionaldetail is needed. For example, this audit�s goal essentially is to check the capability of thelaboratory to perform the ongoing work according to the contract work. In this case, an auditormay request to see one or more data packages, and then follow the information described in eachpackage�including such items as sample tracking and documentation concerning samplepreparation and analysis�to verify that the laboratory is now accomplishing the work asdescribed by the SOW and in conformance with the quality manual.
In the latter case, one conducts what might be called a desk audit, where agency personnel reviewthe contract and examine records or documentation that have come in as part of the project�sdeliverables. For the most part, the agency should constantly be monitoring activities under thecontract, and in this sense, a desk audit is a daily activity without a formal process being appliedat any specific point in time. However, depending on the agency�s practice, if on-site visits arenot made, then a desk audit becomes the only means to track activities under the contract. Oneapproach to a desk audit is thus a periodic review�for example, every 6 or 12 months�of QCrecords to track the laboratory�s performance over that period of time. This allows the agency todetermine if there are deviations, shifts, or other trends that appear over time.

Contracting Laboratory Services
E-36MARLAP JULY 2004
Each evaluation presents an additional opportunity to monitor various laboratory parameters,such as turnaround time. This is most important in cases when samples contain radionuclideshaving short half lives. During an on-site evaluation, the agency is able to determine if additionalemphasis is required to tighten the time frame between sample receipt and analysis. The personalinteraction between agency and laboratory permits a constructive dialog and facilitates anunderstanding of the possible means to increase or maintain the efficiency when processing andanalyzing samples at the contractor�s facility.
E.8 Contract Completion
There are several general areas of concern at the close of a contract that may be addresseddifferently depending on the agency or nature of the project under a given contract. For example,agency personnel who monitor contracts will review invoices to be certain that work is completeand that the corresponding results are considered acceptable. Once such monitoring activityprovides the proper verification that the work is complete, then the agency�s financial officeprocesses all related bills and makes final payment for the work.
The laboratory should send in final deliverables, including routine submissions of raw data orrecords, as is the practice under the contract. Also, when applicable, agency-owned equipmentshared with the laboratory during the contract period will be returned. The disposition of samplesstill in storage at the contractor�s facility and additional records or other raw data must bedecided and specified. The agency may wish to receive all or part of these items�otherwise,disposal of sample materials and documents held by the contractor must be arranged.
In some cases, work under the contract may create conditions where more time is necessary toprocess samples that remain or to process additional work that arises during the latter part of thecontract period. Depending on the agency, funding, nature of the project, or other factor, thecontract may be extended for a period of time, which may vary from weeks to months.Otherwise, once the contract comes to a close, the work ceases.
E.9 References
American National Standards Institute (ANSI). N42.22. American National Standard�Traceability of Radioactive Sources to the National Institute of Standards and Technology(NIST) and Associated Instrument Quality Control. 1995.
American National Standards Institute (ANSI). N42.23. American National Standard�Measurement and Associated Instrument Quality Assurance for Radioassay Laboratories.2003.
Contracting Laboratory Services
E-37JULY 2004 MARLAP
American Society for Quality Control (ANSI/ASQC) E-4. Specifications and Guidelines forQuality Systems for Environmental Data Collection and Environmental TechnologyPrograms. 1995. American Society for Quality Control, Milwaukee, Wisconsin.
U.S. Environmental Protection Agency (EPA). 1993. Quality Assurance for SuperfundEnvironmental Data Collection Activities. Publication 9200.2-16FS, EPA, Office of SolidWaste and Emergency Response, Washington, DC.
U.S. Environmental Protection Agency (EPA). 1997. Manual for the Certification of Labora-tories Analyzing Drinking Water. EPA 815-B-97-001. Office of Ground Water and DrinkingWater, Washington, DC. Available at: www.epa.gov/safewater/certlab/labfront.html.
U.S. Environmental Protection Agency (EPA). 2001. EPA Requirements for Quality AssuranceProject Plans (EPA QA/R-5). EPA/240/B-01/003. Office of Environmental Information,Washington, DC. Available at: www.epa.gov/quality/qa_docs.html.
U. S. Environmental Protection Agency (EPA). 2002. Guidance for Quality Assurance ProjectPlans. EPA QA/G-5. EPA/240/R-02/009. Office of Environmental Information, Washington,DC. Available at www.epa.gov/quality/qa_docs.html.
International Standards Organization/International Electrotechnical Commission (ISO/IEC)17025. General Requirements for the Competence of Testing and Calibration Laboratories,International Organization for Standardization, Geneva, Switzerland. December 1999, 26 pp.
MARSSIM. 2000. Multi-Agency Radiation Survey and Site Investigation Manual, Revision 1.NUREG-1575 Rev 1, EPA 402-R-97-016 Rev1, DOE/EH-0624 Rev1. August. Availablefrom www.epa.gov/radiation/marssim/.
National Environmental Laboratory Accreditation Conference (NELAC). 2002. Quality SystemsAppendix D, Essential Quality Control Requirements. Revision 17. July 12. Available at:www.epa.gov/ttn/nelac/2002standards.html.
Office of Federal Procurement Policy (OFPP). 1997. Performance-Based Service Contracting(PBSC) Solicitation/Contract/Task Order Review Checklist. August 8. Available at:www.arnet.gov/Library/OFPP/PolicyDocs/pbscckls.html.
U.S. Code of Federal Regulations, Title 10, Part 30, Rules of General Applicability to DomesticLicensing of Byproduct Material.


( ) Indicates the section in which the term is first used in MARLAP.Italicized words or phrases have their own definitions in this glossary.
JULY 2004 MARLAPi
GLOSSARY
absorption (10.3.2): The uptake of particles of a gas or liquid by a solid or liquid, or uptake ofparticles of a liquid by a solid, and retention of the material throughout the external and internalstructure of the uptaking material. Compare with adsorption.
abundance (16.2.2): See emission probability per decay event.
accreditation (4.5.3, Table 4.2): A process by which an agency or organization evaluates andrecognizes a program of study or an institution as meeting certain predetermined qualifications orstandards through activities which may include performance testing, written examinations orfacility audits. Accreditation may be performed by an independent organization, or a federal,state, or local authority. Accreditation is acknowledged by the accrediting organizations issuingof permits, licences, or certificates.
accuracy (1.4.8): The closeness of a measured result to the true value of the quantity beingmeasured. Various recognized authorities have given the word accuracy different technicaldefinitions, expressed in terms of bias and imprecision. MARLAP avoids all of these technicaldefinitions and uses the term �accuracy� in its common, ordinary sense, which is consistent withits definition in ISO (1993a).
acquisition strategy options (2.5, Table 2.1): Alternative ways to collect needed data.
action level (1.4.9): The term action level is used in this document to denote the value of aquantity that will cause the decisionmaker to choose one of the alternative actions. The actionlevel may be a derived concentration guideline level (DCGL), background level, release criteria,regulatory decision limit, etc. The action level is often associated with the type of media, analyteand concentration limit. Some action levels, such as the release criteria for license termination,are expressed in terms of dose or risk. See total effective dose equivalent (TEDE) and committedeffective dose equivalent (CEDE).
activity, chemical (a) (10.3.5): (1) A thermodynamic quantity used in place of molalconcentration in equilibrium expressions for reactions of real (nonideal) solutions. Activityindicates the actual behavior of ions in solution as a result of their interactions with the solventand with each other. Ions deviate from ideal behavior as their concentration in solution increasesand are not as effective in their chemical and physical behavior as their molar concentrationwould indicate. Thus, their effective concentration, a, is less than their stoichiometricconcentration, c. (2) A measure of the effective molal concentration, c, in moles/Kg, of an ionunder real (nonideal) solution conditions.

Glossary
( ) Indicates the section in which the term is first used in MARLAP.Italicized words or phrases have their own definitions in this glossary.
MARLAP JULY 2004ii
activity, of radionuclides (A) (2.5.4.1): Mean rate of nuclear decay occurring in a given quantityof material.
activity coefficient (γ) (14.6.1): (1) A fractional number that represents the extent that ionsdeviate from ideal behavior in solution (see activity, chemical). The activity coefficient multipliedtimes the molal concentration of ions in solution equals the chemical activity: a = γ · c, where γ#1; thus, the activity coefficient is a correction factor applied to molal concentrations. At infinitedilution where behavior is ideal, γ = 1.0, but it decreases as the concentration of ions increases.(2) The ratio of effective (apparent) concentration of an ion in solution to the stoichiometricconcentration, γ = a/c.
adsorption (6.5.1.1): Uptake of particles of a gas, liquid, or solid onto the surface of anothersubstance, usually a solid. Compare with absorption.
adsorption chromatography (14.7.1): A chromatographic method that partitions (separates)components of a mixture through their different adsorption characteristics on a stationary solidphase and their different solubilities in a mobile liquid phase.
affinity chromatography (14.7.1): A chromatographic method that partitions (separates) proteinsand nucleic acids in a mobile phase based on highly selective, very specific complementarybonds with antibody groups (ligands) that are chemically bonded to an inert solid matrix actingas the stationary phase.
aliquant (3.3.1.2): A representative portion of a homogeneous sample removed for the purposeof analysis or other chemical treatment. The quantity removed is not an evenly divisible part ofthe whole sample. An �aliquot� (a term not used in MARLAP) by contrast, is an evenly divisiblepart of the whole.
alternate analyte (2.5): Analyte whose concentration, because of an established relationship(e.g., secular equilibrium) can be used to quantitatively determine the concentration of a targetanalyte. An alternate analyte may be selected for analysis in place of a target analyte because ofease of analysis, lower analytical costs, better methodologies available, etc. (see alternateradionuclide).
alternate radionuclide (3.3.4): An �easy-to-measure� radionuclide that is used to estimate theamount of a radionuclide that is more difficult or costly to measure. Known or expectedrelationships between the radionuclide and its alternate can be used to establish a factor foramount of the hard-to-measure radionuclide (see alternate analyte).

Glossary
( ) Indicates the section in which the term is first used in MARLAP.Italicized words or phrases have their own definitions in this glossary.
JULY 2004 MARLAPiii
alternative hypothesis (H1 or HA) (2.5, Table 2.1): One of two mutually exclusive statementstested in a statistical hypothesis test (compare with null hypothesis). The null hypothesis ispresumed to be true unless the test provides sufficient evidence to the contrary, in which case thenull hypothesis is rejected and the alternative hypothesis is accepted.
analyte (1.4.7): The component (e.g., a radionuclide or chemical compound) for which a sampleis analyzed.
analysis (3.3.1): Analysis refers to the identification or quantification process for determining aradionuclide in a radionuclide/matrix combination. Examples of analyses are the measurementof 3H in water, 90Sr in milk, 239Pu in soil, etc.
analytical data requirements (1.1): Measurement performance criteria used to select and decidehow the laboratory analyses will be conducted and used for the initial, ongoing, and finalevaluation of the laboratory�s performance and the laboratory data. The project-specificanalytical data requirements establish measurement performance criteria and decisions on howthe laboratory analyses will be conducted (e.g., method selection, etc.) in a performance-basedapproach to data quality.
analytical method (1.4.6): A major component of an analytical protocol that normally includeswritten procedures for sample digestion, chemical separation (if required), and counting (analytequantification through radioactive decay emission or atom-counting measurement techniques.Also called laboratory method.
analytical performance measure (2.3.3): A qualitative or quantitative aspect of the analysis,initially defined based on the analyte, its desired detection level and the sample matrix. See alsomeasurement quality objectives.
analytical plan (9.6.3): The portion of the project plan documents that addresses the optimizedanalytical design and other analytical issues (e.g., analytical protocol specifications, standardoperating procedures).
analytical process (1.3): The analytical process is a general term used by MARLAP to refer to acompilation of actions starting from the time a sample is collected and ending with the reportingof data. These are the actions that must be accomplished once a sample is collected in order toproduce analytical data. These actions typically include field sample preparation and preserva-tion, sample receipt and inspection, laboratory sample preparation, sample dissolution, chemicalseparations, preparation of samples for instrument measurements, instrument measurements,data reduction, data reporting, and the quality control of the process.
Glossary
( ) Indicates the section in which the term is first used in MARLAP.Italicized words or phrases have their own definitions in this glossary.
MARLAP JULY 2004iv
analytical protocol (1.4.3): A compilation of specific procedures/methods that are performed insuccession for a particular analytical process. With a performance-based approach, there may bea number of appropriate analytical protocols for a particular analytical process. The analyticalprotocol is generally more inclusive of the activities that make up the analytical process than isthe analytical method. See also analytical process.
analytical protocol specification (APS) (1.4.10): The output of a directed planning process thatcontains the project�s analytical data needs and requirements in an organized, concise form. Thelevel of specificity in the APSs should be limited to those requirements that are consideredessential to meeting the project�s analytical data requirements to allow the laboratory theflexibility of selecting the protocols or methods that meet the analytical requirements.
anion (13.2.2): An ion with a negative charge.
anion exchanger (14.7.4.2): An ion-exchange resin consisting of chemical groups, bonded to aninert matrix, with a net positive charge. The positive species are electrostatically bonded tonegative, labile ions bonded to an inert matrix. Anions in solution replace the labile ions on theexchanger by forming electrostatic bonds with the charged groups. The strength of attraction,which depends on the charge, size, and degree of solvation of the anion, provides a means forseparating analyte ions.
aqueous samples (10.3.1): Samples for which the matrix is water, including surface water,groundwater, drinking water, precipitation, or runoff.
arithmetic mean ( x̄ ) (1.4.8): The sum of a series of measured values, divided by the number ofvalues. The arithmetic mean is also called the �average.� If the measured values are denoted byx1, x2, �, xN, the arithmetic mean is equal to (x1 + x2 + @@@ + xN) / N. (See also expectation andsample mean.)
assessment team (9.4): A team of data assessors (or qualified data assessor) who are technicallycompetent to evaluate the project�s activities and the impact of these activities on the quality andusability of data.
audit (5.3.8): An assessment to provide assurance that a selected laboratory is capable of or isfulfilling the specifications of the request for proposals or statement of work. A pre-award auditverifies that a laboratory has the ability that it can meet the analytical requirements of the requestfor proposals or statement of work. After the award, an audit of a laboratory will assess theperformance of the laboratory to verify that it is complying with statement of work and
Glossary
( ) Indicates the section in which the term is first used in MARLAP.Italicized words or phrases have their own definitions in this glossary.
JULY 2004 MARLAPv
contractual requirements. Thus, the examination of logbooks, charts, or other documentation thatare produced as the work progresses.
authoritative sample collection approach (9.6.2.1): An approach wherein professionalknowledge is used to choose sample locations and times.
auto-oxidation-reduction (disproportionation) (14.2.3): An oxidation-reduction reaction inwhich a single chemical species acts simultaneously as an oxidizing and reducing agent.
average (6.5.1.1): See arithmetic mean.
background, anthropogenic (3.3.1): Background radiation levels caused by radionuclides in theenvironment resulting from human activities, such as the atmospheric testing of nuclear weapons.
background, environmental (3.3.1): See background level. The presence of naturally occurringradiation or radionuclides in the environment.
background, instrument (6.5.5.3): Radiation detected by an instrument when no source ispresent. The background radiation that is detected may come from radionuclides in the materialsof construction of the detector, its housing, its electronics and the building as well as theenvironment and natural radiation.
background level (2.5): This term usually refers to the presence of radioactivity or radiation inthe environment. From an analytical perspective, the presence of background radioactivity insamples needs to be considered when clarifying the radioanalytical aspects of the decision orstudy question. Many radionuclides are present in measurable quantities in the environment.Natural background radiation is due to both primordial and cosmogenic radionuclides.Anthropogenic background is due to radionuclides that are in the environment as a result ofhuman activities, for example, the atmospheric testing of nuclear weapons.
basic ordering agreement (BOA) (5.1): A process that serves to pre-certify potential analyticalservice providers. A list of approved laboratories is assembled and contacted as needed tosupport specific needs. A task order is used to define a specific scope of work within a BOA.
batch processing (6.4): A procedure that involves preparing a group of individual samplestogether for analysis in such a way that allows the group to be associated with a set of qualitycontrol samples.
Glossary
( ) Indicates the section in which the term is first used in MARLAP.Italicized words or phrases have their own definitions in this glossary.
MARLAP JULY 2004vi
becquerel (Bq) (1.4.9): Special name for the SI derived unit of activity (of radionuclides), equalto one nuclear transformation per second. The traditional unit is the curie (Ci). The relationshipbetween these units is 3.7×10¹⁰ Bq = 1 Ci.
bias (of an estimator) (1.4.8): If X is an estimator for the true value of parameter θ, then the biasof X is µX ! θ, where µX denotes the expectation of X.
bias (of measurement) (1.4.8): See systematic error.
bias (of a measurement process) (1.4.8): The bias of a measurement process is a persistentdeviation of the mean measured result from the true or accepted reference value of the quantitybeing measured, which does not vary if a measurement is repeated. See also bias (of anestimator) and bias (of measurement).
bioassay (10.2.11.2): A procedure to monitor internal radiation exposure by performing in vitroor in vivo measurements, primarily urine analysis, fecal analysis, or whole-body counting.
blind sample (18.4.2): A sample whose concentration is not known to the analyst. Blind samplesare used to assess analytical performance. A double-blind sample is a sample whose concentra-tion and identity as a sample is known to the submitter but not to the analyst. The double-blindsample should be treated as a routine sample by the analyst, so it is important that the double-blind sample is identical in appearance to routine samples.
blunder (7.4.1.1): A mistake made by a person performing an analytical task that produces an asignificant error in the result.
branching ratio (7.2.2.2): See emission probability per decay event.
breakthrough (14.7.4.1): Appearance of certain ions in the output solution (eluate) of an ion-exchange column. These ions are not bonded to the exchange groups of the column because thegroups are already occupied by these or other ions, and the resin is essentially saturated.
calibration (1.4.8): The set of operations that establish, under specified conditions, therelationship between values indicated by a measuring instrument or measuring system, or valuesrepresented by a material measure, and the corresponding known value of a measurand.
calibration source (15.1): A prepared source, made from a certified reference material(standard), that is used for calibrating instruments.

Glossary
( ) Indicates the section in which the term is first used in MARLAP.Italicized words or phrases have their own definitions in this glossary.
JULY 2004 MARLAPvii
carrier (14.1): (1) A stable isotopic form of a tracer element or nonisotopic material added toeffectively increase the quantity of a tracer element during radiochemical procedures, ensuringconventional behavior of the element in solution. (2) A substance in appreciable amount that,when associated with a tracer of a specified substance, will carry the tracer with it through achemical or physical process, or prevent the tracer from undergoing nonspecific processes due toits low concentration (IUPAC, 1995). A stable isotope of a radionuclide (usually the analyte)added to increase the total amount of that element so that a measurable mass of the element ispresent.
carrier-free tracer (14.2.6): (1) A radioactive isotope tracer that is essentially free from stable(nonradioactive) isotopes of the element in question. (2) Addition of a specific, nonradioactiveisotope of an element to change the measured isotopic abundance of the element in the sample.Such materials are usually designated as nonisotopic material or marked with the symbol �c.f.�(see radiotracer).
carrier gas (14.5.1): An inert gas, such as nitrogen or helium, serving as the mobile phase in agas-liquid chromatographic system. The carrier gas sweeps the sample in through the system.
cation (13.2.2): An ion with a positive charge.
cation exchanger (14.3.4.2): An ion-exchange resin consisting of chemical groups, bonded to aninert matrix, with a net negative charge. The negative species are electrostatically bonded topositive, labile ions. Cations, in solution, replace the labile ions on the exchanger by formingelectrostatic bonds with the charged groups. The strength of attraction, which depends on thecharge, size, and degree of solvation of the cation, provides a means for separating analyte ions.
Cerenkov radiation (14.10.9.10): Cerenkov radiation is emitted in the ultraviolet spectrum whena fast charged particle traverses a dielectric medium (like water) at a velocity exceeding thevelocity of light in that medium. It is analogous to the �sonic boom� generated by a craftexceeding the speed of sound.
certified reference material (CRM) (1.6, Figure 1.3): A reference material, accompanied by acertificate, one or more of whose property values are certified by a procedure which establishesits traceability to an accurate realization of the unit in which the property values are expressed,and for which each certified value is accompanied by an uncertainty at a stated level ofconfidence (ISO, 1992).
chain-of-custody (1.4.10): Procedures that provide the means to trace the possession andhandling of a sample from collection to data reporting.

Glossary
( ) Indicates the section in which the term is first used in MARLAP.Italicized words or phrases have their own definitions in this glossary.
MARLAP JULY 2004viii
check source (15.2): A material used to validate the operability of a radiation measurementdevice, sometimes used for instrument quality control. See calibration source, test source, andsource, radioactive.
chelate (14.3.2): A complex ion or compound that consists of a ligand bonded (coordinated) to ametal atom or ion through two or more nonmetal atoms forming a ring structure with the metalatom or ion. Ligands may be inorganic ions, such as Cl, F, or carbonate, or organic compoundsof two, four, or six functional groups containing atoms of S, N, O, or P.
chelating agent (14.3.2): The compound containing the ligand that forms a chelate with metalatoms or ions.
chemical separations (1.1): The removal of all undesirable materials (elements, compounds,etc.) from a sample through chemical means so that only the intended analyte is isolated andmeasured.
chemical speciation (2.5): The chemical state or form of an analyte in a sample. When thechemical species of the analyte in a sample from a new project varies from the chemical speciesfor which an analytical method was validated, then the method should be altered and revalidated.
chromatography (6.6.3.4): A group of separation techniques based on the unequal distribution(partition) of substances between two immiscible phases, one moving past the other. The mobilephase passes over the surfaces of the stationary phase.
coagulation (14.8.5): (1) The process in which colloidal particles or macromolecules cometogether to form larger masses (see colloid and colloidal solution). (2) Addition of an excessquantity of electrolyte to a colloidal solution neutralizing the electrical bilayer of the colloidalparticles and permitting their agglomeration to form larger particles that easily settle (precipitate).Also called �flocculation.�
coefficient of variation (CV) (19.5.2.2): The coefficient of variation of a nonnegative randomvariable is the ratio of its standard deviation to its mean.
coefficient of thermal (volume) expansion (19E.3): ratio of the change in volume (of a material)per unit volume to the change in temperature, at constant pressure. If V denotes volume, ρdenotes density, and T denotes temperature, then the coefficient of thermal expansion, β, is givenby
Glossary
( ) Indicates the section in which the term is first used in MARLAP.Italicized words or phrases have their own definitions in this glossary.
JULY 2004 MARLAPix
β ' 1V
dVdT
' &1ρ
dρdT
.
collectors (14.8.5): Substances used for the unspecific concentration of trace substances.Colloidal precipitates are excellent collectors because of their great adsorption capacity.Unspecific carriers such as manganese dioxide, sulfides, and hydrated oxides are frequently usedas collectors (also called �scavengers�).
colloid (13.2.5): Any form of matter with at least one dimension that is less than one micron butmore than one nanometer. This dimension is larger in size than that of a true solution but smallerthan particles of an ordinary suspension. They are too small to be observed by a light microscopebut larger than molecular size. Colloidal particles are usually aggregates of hundreds orthousands of smaller molecules or macromolecules.
colloidal solution (13.4.1): Sometimes called a �colloidal dispersion.� (1) A mixture formedfrom the dispersion of one phase (dispersed phase) within a second phase (continuous phase) inwhich one phase has colloidal dimensions. A colloidal solution contains dispersed particles witha very high surface-area-to-mass ratio and, thus, a great adsorption capacity. The solution will notusually settle by gravity since the colloidal particles are very small and charged by attraction ofions to their surfaces, but they will pass through ordinary filter paper. (2) In radiochemistry, acolloidal solution refers to the dispersion of solid particles in the solution phase. (The mixture isnot a true solution because particles of the dispersed phase are larger than typical ions andmolecules.)
column chromatography (14.3.4.2): A chromatographic procedure employing a solid phasepacked in a glass or metal column. A liquid phase is passed through the column under pressuresupplied by gravity or pumping action. Column chromatography can accommodate largerquantities of materials than other methods of chromatography and, thus, can separate largerloads. It can also provide more separating power with an increased ratio of solid phase to analyte.
combined standard uncertainty (1.4.7): Standard uncertainty of an output estimate calculated bycombining the standard uncertainties of the input estimates. See also expanded uncertainty anduncertainty (of measurement). The combined standard uncertainty of y is denoted by uc(y).
combined variance (19.3.3): The square of the combined standard uncertainty. The combinedvariance of y is denoted by u2
c(y).

Glossary
( ) Indicates the section in which the term is first used in MARLAP.Italicized words or phrases have their own definitions in this glossary.
MARLAP JULY 2004x
committed effective dose equivalent (CEDE) (2.5.2.1): The sum of the committed doseequivalent to various tissues in the body, each multiplied by the appropriate weighting factor(MARSSIM, 2000). CEDE is expressed in units of sievert (Sv) or rem. See action level, doseequivalent, and total effective dose equivalent.
common ion (14.8.3.1): Ions that appear in the equilibrium expressions of reactions. The term isoften used to refer to an additional source of the reacting ions.
common-ion effect (14.8.3.1): An increase in concentration of ions participating in a reactionbecause of the addition of one of the ions from another source causing a shift in the equilibriumof the reaction.
comparability (1.4.11): A measure of the confidence with which one data set can be compared toanother. Comparability is one of the five principal data quality indicators, which are qualitativeand quantitative descriptors used in interpreting the degree of acceptability or utility of data.
completeness (1.4.11): A measure of the amount of valid data obtained from a measurementsystem compared to the amount that was expected to be obtained under correct, normalconditions. Completeness is one of the five principal data quality indicators. See alsocomparability.
complex (13.2.4): Another name for a coordination compound.
complex ion (13.2.4): An ion formed when a metal atom or ion forms coordination bonds withone or more nonmetal atoms in molecules or anions. Examples are Th(NO3)2
+2, Ra(EDTA)!2,U(CO3)5
!6, and Fe(H2O)6+2.
compliance (8.2.2.2): In terms of data, compliance means that the data passes numerical qualitycontrol tests based on parameters or limits derived from the measurement quality objectivesspecified in the statement of work.
component (of combined standard uncertainty) (19.2): The component of the combinedstandard uncertainty of an output estimate, uc(y), generated by the standard uncertainty of aninput estimate, u(xi), is the product of the standard uncertainty, u(xi), and the absolute value ofthe sensitivity coefficient, My / Mxi. The uncertainty component generated by u(xi) may be denotedby ui(y).
concentration range (2.5, Table 2.1): The minimum and maximum concentration of an analyteexpected to be present in a sample for a given project. While most analytical protocols are

Glossary
( ) Indicates the section in which the term is first used in MARLAP.Italicized words or phrases have their own definitions in this glossary.
JULY 2004 MARLAPxi
applicable over a fairly large range of concentration for the radionuclide of interest, performanceover a required concentration range can serve as a measurement quality objective for the protocolselection process and some analytical protocols may be eliminated if they cannot accommodatethe expected range of concentration.
conceptual site model (2.3.2): A general approach to planning field investigations that is usefulfor any type of environmental reconnaissance or investigation plan with a primary focus on thesurface and subsurface environment.
consistency (8.4.2): Values that are the same when reported redundantly on different reports ortranscribed from one report to another.
control chart (18.1): A graphical representation of data taken from a repetitive measurement orprocess. Control charts may be developed for various characteristics (e.g., mean, standarddeviation, range, etc.) of the data. A control chart has two basic uses: 1) as a tool to judge if aprocess was in control, and 2) as an aid in achieving and maintaining statistical control. Forapplications related to radiation detection instrumentation or radiochemical processes, the mean(center line) value of a historical characteristic (e.g., mean detector response), subsequent datavalues and control limits placed symmetrically above and below the center line are displayed on acontrol chart. See statistical control.
control limit (3.3.7.3): Predetermined values, usually plotted on a control chart, which define theacceptable range of the monitored variable. There can be both upper and lower limits; however,when changes in only one direction are of concern, only one limit is necessary. When a measuredvalue exceeds the control limits, one must stop the measurement process, investigate theproblem, and take corrective action.� See warning limit.
coordination bond (14.3.1): (1) The chemical bond between the nonmetal atoms of a ligand anda metal atom or ion, which forms a coordination compound or complex ion. The bond is formedwhen the ligand donates one or more electron pairs to the metal atom or ion. (2) In more generalterms, a covalent bond formed in which one atom donates both of the shared electrons; oftencalled a coordination-covalent bond.
coordination compound (14.3.1): A compound containing coordination bonds in a molecule orion; also called a �complex.�
coordination number (14.3.1): (1) The number of nonmetal atoms donating electrons to a metalatom or ion in the formation of a complex ion or coordination compound. For example, the

Glossary
( ) Indicates the section in which the term is first used in MARLAP.Italicized words or phrases have their own definitions in this glossary.
MARLAP JULY 2004xii
coordination number is five in U(CO3)5!6 (2) The number of atoms, ions, molecules, or groups
surrounding an atom or ion in a coordination compound, complex ion, or crystal structure.
coprecipitation (14.1): A process used to precipitate a radionuclide that is not present insufficient concentration to exceed the solubility product of the radionuclide and precipitate. Astable ion, chemically similar to the radionuclide, is added in a quantity sufficient to precipitateand carry with it the radionuclide.
core group (core team) (2.4.1): A subgroup of the project planning team, which includes theproject manager and other key members of the project planning team, who meet at agreed uponintervals to review the project�s progress, respond to unexpected events, clarify questions raised,revisit and revise project requirements as necessary, and communicate the basis for previousassumptions.
correction (8.2.1): A value algebraically added to the uncorrected result of a measurement tocompensate for a systematic effect.
correction factor (8.5.1.12): A numerical factor by which the result of an uncorrected result of ameasurement is multiplied to compensate for a systematic effect.
corrective action reports (8.2.2.2): Documentation of required steps taken to correct an out ofcontrol situation.
correctness (8.4.2): The reported results are based on properly documented and correctly appliedalgorithms.
correlate (18.4.5): Two random variables are correlated if their covariance is nonzero.
correlation coefficient (19.3.3): The correlation coefficient of two random variables is equal totheir covariance divided by the product of their standard deviations.
cosmogenic radionuclide (3.3.1): Radionuclides that result from the collision of cosmic-rayparticles with stable elements in the atmosphere, primarily atmospheric gases. See background,environmental.
counting efficiency (15.2.2): The ratio of the events detected (and registered) by a radiationdetection system to the number of particle or photons emitted from a radioactive source. Thecounting efficiency may be a function of many variables, such as radiation energy, sourcecomposition, and source or detector geometry.
Glossary
( ) Indicates the section in which the term is first used in MARLAP.Italicized words or phrases have their own definitions in this glossary.
JULY 2004 MARLAPxiii
counting error (19.3.5): See counting uncertainty; error (of measurement). MARLAP uses theterm counting uncertainty to maintain a clear distinction between the concepts of measurementerror and uncertainty.
counting uncertainty (18.3.4): Component of measurement uncertainty caused by the randomnature of radioactive decay and radiation counting.
count rate (14A.2.2): The number of decay particles detected per unit time of a source.Generally the count rate is uncorrected for detector efficiency. The count rate divided by thedetector efficiency for a specific particle and energy will yield the source activity.
count time (2.5): The time interval for the counting of a sample or source by a radiation detector.Depending upon the context used, this can be either the �clock� time (the entire period requiredto count the sample), or �live� time (the period during which the detector is actually counting).Live time is always less than or equal to clock time.
covariance (19.3.3): The covariance of two random variables X and Y, denoted by Cov(X,Y) orσX,Y, is a measure of the association between them, and is defined as E([X ! µX][Y ! µY]).
coverage factor (1.4.7): The value k multiplied by the combined standard uncertainty uc(y) togive the expanded uncertainty, U.
coverage probability (19.3.6): Approximate probability that the reported uncertainty interval willcontain the value of the measurand.
critical level (20B.1): See critical value.
critical value (SC) (3B.2): In the context of analyte detection, the minimum measured value (e.g.,of the instrument signal or the analyte concentration) required to give confidence that a positive(nonzero) amount of analyte is present in the material analyzed. The critical value is sometimescalled the critical level or decision level.
cross-contamination (3.4, Table 3.1): Cross-contamination occurs when radioactive material inone sample is inadvertently transferred to an uncontaminated sample, which can result fromusing contaminated sampling equipment and chemicals, and improperly cleaned glassware,crucibles, grinders, etc. Cross-contamination may also occur from spills, as well as airbornedusts of contaminated materials.

Glossary
( ) Indicates the section in which the term is first used in MARLAP.Italicized words or phrases have their own definitions in this glossary.
MARLAP JULY 2004xiv
crosstalk (7.4.2.2): A phenomenon in gas-proportional counting or liquid-scintillation countingwhen an emission of an alpha particle is recorded as a beta particle count or vice versa. This isdue to the ionization effects of the particles at different energies.
cumulative distribution function (19A.1): See distribution function.
curie (Ci) (1.4.9): Traditional non-SI unit of activity (of radionuclides), equal to 3.7 × 10¹⁰ Bq.Because the curie is such a large value, the more common unit is the picocurie (pCi), equal to10!12 Ci.
data assessment (2.1): Assessment of environmental data consists of three separate andidentifiable phases: data verification, data validation, and data quality assessment.
data collection activities (1.3): Examples of data collection activities include site-characteriza-tion activities, site cleanup and compliance-demonstration activities, decommissioning of nuclearfacilities, remedial and removal actions, effluent monitoring of licensed facilities, licensetermination activities, environmental site monitoring, background studies, routine ambientmonitoring, and waste management activities.
data life cycle (1.4.1): A useful and structured means of considering the major phases of projectsthat involve data collection activities. The three phases of the data life cycle are the planningphase, the implementation phase, and the assessment phase.
data package (1.4.11): The information the laboratory should produce after processing samplesso that data verification, validation, and quality assessment can be done (see Chapter 16, Section16.7).
data qualifier (8.1): Data validation begins with a review of project objectives and requirements,the data verification report, and the identified exceptions. If the system being validated is foundto be in control and applicable to the analyte and matrix, then the individual data points can beevaluated in terms of detection, imprecision, and bias. The data are then assigned data qualifiers.Validated data are rejected only when the impact of an exception is so significant that a datum isunreliable.
data quality assessment (1.1): The scientific and statistical evaluation of data to determine ifdata are the right type, quality, and quantity to support their intended use.

Glossary
( ) Indicates the section in which the term is first used in MARLAP.Italicized words or phrases have their own definitions in this glossary.
JULY 2004 MARLAPxv
data quality assessment plan (1.4.1, Figure 1.1): A project plan document that describes thedata quality assessment process including data quality assessment specifications, requirements,instructions, and procedures.
data quality indicator (DQI) (3.3.7): Qualitative and quantitative descriptor used in interpretingthe degree of acceptability or utility of data. The principal DQIs are precision, bias,representativeness, comparability, and completeness. These five DQIs are also referred to by theacronym PARCC�the �A� refers to accuracy rather than bias.
data quality objective (DQO) (1.4.9): DQOs are qualitative and quantitative statements derivedfrom the DQO process that clarify the study objectives, define the most appropriate type of datato collect, determine the most appropriate conditions from which to collect the data, and specifytolerable limits on decision error rates. Because DQOs will be used to establish the quality andquantity of data needed to support decisions, they should encompass the total uncertaintyresulting from all data collection activities, including analytical and sampling activities.
data quality objective process (1.6.3): A systematic strategic planning tool based on the scientificmethod that identifies and defines the type, quality, and quantity of data needed to satisfy aspecified use. DQOs are the qualitative and quantitative outputs from the DQO process.
data quality requirement (2.1): See measurement quality objective.
data reduction (1.1): The processing of data after generation to produce a radionuclideconcentration with the required units.
data transcription (8.5): The component of the analytical process involving copying or recordingdata from measurement logs or instrumentation.
data usability (1.4.11): The scientific and statistical evaluation of data sets to determine if dataare of the right type, quality, and quantity to support their intended use (data quality objectives).The data quality assessor integrates the data validation report, field information, assessmentreports, and historical project data to determine data usability for the intended decisions.
data validation (1.1): The evaluation of data to determine the presence or absence of an analyteand to establish the uncertainty of the measurement process for contaminants of concern. Datavalidation qualifies the usability of each datum (after interpreting the impacts of exceptionsidentified during data verification) by comparing the data produced with the measurement qualityobjectives and any other analytical process requirements contained in the analytical protocolspecifications developed in the planning process.
Glossary
( ) Indicates the section in which the term is first used in MARLAP.Italicized words or phrases have their own definitions in this glossary.
MARLAP JULY 2004xvi
data validation plan (1.4.1, Figure 1.1): A project plan document that ensures that properlaboratory procedures are followed and data are reported in a format useful for validation andassessment, and will improve the cost-effectiveness of the data collection process.
data verification (1.2): Assures that laboratory conditions and operations were compliant withthe statement of work, sampling and analysis plan, and quality assurance project plan, andidentifies problems, if present, that should be investigated during data validation. Dataverification compares the material delivered by the laboratory to these requirements(compliance), and checks for consistency and comparability of the data throughout the datapackage and completeness of the results to ensure all necessary documentation is available.
decay chain (3.3.8): A decay chain or �decay series� begins with a parent radionuclide (alsocalled a �parent nuclide�). As a result of the radioactive decay process, one element istransformed into another. The newly formed element, the decay product or progeny, may itself beradioactive and eventually decay to form another nuclide. Moreover, this third decay product maybe unstable and in turn decay to form a fourth, fifth or more generations of other radioactivedecay products. The final decay product in the series will be a stable element. Elements withextremely long half-lives may be treated as if stable in the majority of cases. Examples ofimportant naturally occurring decay chains include the uranium series, the thorium series, and theactinium series. See radioactive equilibrium.
decay emissions (6.2): The emissions of alpha or beta particles (β+ or β!) or gamma rays from anatomic nucleus, which accompany a nuclear transformation from one atom to another or from ahigher nuclear energy state to lower one.
decay factor (14A.2.2): Also referred to as the �decay-correction factor.� The factor that is usedto compensate for radioactive decay of a specific radionuclide between two points in time.
decay series (3.3.4): See decay chain.
decision error rate (1.4.9): The probability of making a wrong decision under specifiedconditions. In the context of the DQO process, one considers two types of decision errors (Type Iand Type II). The project planning team determines the tolerable decision error rates.
decision level (20.2.2): See critical value.
decision performance criteria (2.1): Another way to express the concept of using directedproject planning as a tool for project management to identify and document the qualitative andquantitative statements that define the project objectives and the acceptable rate of making
Glossary
( ) Indicates the section in which the term is first used in MARLAP.Italicized words or phrases have their own definitions in this glossary.
JULY 2004 MARLAPxvii
decision errors that will be used as the basis for establishing the quality and quantity of dataneeded to support the decision. See data quality objective.
decision rule (2.3.3): The rule developed during directed planning to get from the problem orconcern to the desired decision and define the limits on the decision error rates that will beacceptable to the stakeholder or customer. Sometimes called a �decision statement.� Thedecision rule can take the form of �if �then�� statements for choosing among decisions oralternative actions. For a complex problem, it may be helpful to develop a decision tree, arrayingeach element of the issue in its proper sequence along with the possible actions. The decisionrule identifies (1) the action level that will be a basis for decision and (2) the statistical parameterthat is to be compared to the action level.
decision tree (2.5.3): See decision rule. Also referred to as a �logic flow diagram� or �decisionframework.�
decision uncertainty (1.4.7): Refers to uncertainty in the decisionmaking process due to theprobability of making a wrong decision because of measurement uncertainties and samplingstatistics. Decision uncertainty is usually expressed as by the estimated probability of a decisionerror under specified assumptions.
decommissioning (1.3): The process of removing a facility or site from operation, followed bydecontamination, and license termination (or termination of authorization for operation) ifappropriate. The process of decommissioning is to reduce the residual radioactivity in structures,materials, soils, groundwater, and other media at the site to acceptable levels based on acceptablerisk, so that the site may be used without restrictions.
deconvolution (8.5.1.11): The process of resolving multiple gamma-spectral peaks intoindividual components.
deflocculation (14.8.5): The process whereby coagulated particles pass back into the colloidalstate. Deflocculation may be accomplished by adding a small amount of electrolyte to producethe electrical double-layer characteristic of colloidal particles. Also called �peptization.� Also seecoagulation and colloidal solution.
degrees of freedom (6A.2): In a statistical estimation based on a series of observations, thenumber of observations minus the number of parameters estimated. See effective degrees offreedom.

Glossary
( ) Indicates the section in which the term is first used in MARLAP.Italicized words or phrases have their own definitions in this glossary.
MARLAP JULY 2004xviii
dentate (14.3.1): Term used to categorize ligands that describes the number of nonmetal atomswith electron pairs used by a ligand for coordinate bond formation (unidentate, bidentate, etc.).
derived concentration guideline level (DCGL) (2.5.2.1): A derived radionuclide-specific activityconcentration within a survey unit corresponding to the release criterion. DCGLs are derivedfrom activity/dose relationships through various exposure pathway scenarios.
descriptive statistics (9.6.4.1): Statistical methods that are used to determine and use the mean,mode, median, variance, and correlations among variables, tables, and graphs to describe a set ofdata.
detection capability (1.4.7): The capability of a measurement process to distinguish smallamounts of analyte from zero. It may be expressed in terms of the minimum detectableconcentration.
detection limit (2.5, Table 2.1): The smallest value of the amount or concentration of analytethat ensures a specified high probability of detection. Also called �minimum detectable value.�
deviation reports (9.2.2.2): Documentation of any changes from the analysis plan that may affectdata utility.
digestion (6.6): (1) Heating a precipitate over time; used to form larger crystals after initialprecipitation. (2) The dissolution of a sample by chemical means, typically through the additionof a strong acid or base.
directed planning process (1.2): A systematic framework focused on defining the data needed tosupport an informed decision for a specific project. Directed planning provides a logic for settingwell-defined, achievable objectives and developing a cost-effective, technically sound samplingand analysis design that balances the data user�s tolerance for uncertainty in the decision processand the available resources for obtaining data to support a decision. Directed planning helps toeliminate poor or inadequate sampling and analysis designs.
disproportionation (autoxidation-reduction) (14.2.3): An oxidation-reduction reaction in whicha chemical species is simultaneously oxidized and reduced.
dissolve (6.5.1.1): To form a solution by mixing a solute with a solvent. The particles of thesolute solvent mix intimately at the atomic, molecular, and ionic levels with the particles of thesolvent, and the solute particles are surrounded by particles of the solvent.

Glossary
( ) Indicates the section in which the term is first used in MARLAP.Italicized words or phrases have their own definitions in this glossary.
JULY 2004 MARLAPxix
distillation (12.2.1.2): Separation of a volatile component(s) of a liquid mixture or solution byboiling the mixture to vaporize the component and subsequent condensation and collection of thecomponents as a liquid.
distribution (3B.2): The distribution of a random variable is a mathematical description of itspossible values and their probabilities. The distribution is uniquely determined by its distributionfunction.
distribution (partition) coefficient (15.4.5.5): An equilibrium constant that represents the ratio ofthe concentration of a solute distributed between two immiscible solvents.
distribution function (19A.1): The distribution function, or cumulative distribution function, of arandom variable X is the function F defined by F(x) = Pr[X # x].
dose-based regulation (2.3.2): A regulation whose allowable radionuclide concentration limitsare based on the dose received by an individual or population.
dose equivalent (2.5.2.1): A quantity that expresses all radiations on a common scale forcalculating the effective absorbed dose. This quantity is the product of absorbed dose (grays orrads) multiplied by a quality factor and any other modifying factors (MARSSIM, 2000). The�quality factor� adjusts the absorbed dose because not all types of ionizing radiation create thesame effect on human tissue. For example, a dose equivalent of one sievert (Sv) requires 1 gray(Gy) of beta or gamma radiation, but only 0.05 Gy of alpha radiation or 0.1 Gy of neutronradiation. Because the sievert is a large unit, radiation doses often are expressed in millisieverts(mSv). See committed effective dose equivalent and total effective dose equivalent.
duplicates (1.4.8): Two equal-sized samples of the material being analyzed, prepared, andanalyzed separately as part of the same batch, used in the laboratory to measure the overallprecision of the sample measurement process beginning with laboratory subsampling of the fieldsample.
dynamic work plan (4.4.2): A type of work plan that specifies the decisionmaking logic to beused in the field to determine where the samples will be collected, when the sampling will stop,and what analyses will be performed. This is in contrast to a work plan that specifies the numberof samples to be collected and the location of each sample.
effective degrees of freedom (νeff) (6A.2): A parameter associated with a combined standarduncertainty, uc(y), analogous to the number of degrees of freedom for a Type A evaluation ofstandard uncertainty, which describes the reliability of the uncertainty estimate and which may

Glossary
( ) Indicates the section in which the term is first used in MARLAP.Italicized words or phrases have their own definitions in this glossary.
MARLAP JULY 2004xx
be used to select the coverage factor for a desired coverage probability. The number of effectivedegrees of freedom is determined using the Welch-Satterthwaite formula.
efficiency (2.5.4.2): See counting efficiency.
electrodeposition (14.1): Depositing (plating or coating) a metal onto the surface of an electrodeby electrochemical reduction of its cations in solution.
electronegativity (14.2.2): The ability of an atom to attract electrons in a covalent bond.
electron density (13.2.3): A term representing the relative electron concentration in part of amolecule. The term indicates the unequal distribution of valence electrons in a molecule.Unequal distribution is the result of electronegativity differences of atoms in the bonds of themolecule and the geometry of the bonds; the results is a polar molecule.
eluant (14.7.4.1): A liquid or solution acting as the moving phase in a chromatographic system.
eluate (14.7.4.1): The liquid or solution that has passed over or through the stationary phase in achromatographic system. The eluate may contain components of the analyzed solution, analytes,or impurities. In column chromatography, it is the liquid coming out of the column. The processis referred to as �eluting.�
emission probability per decay event (Ee) (16.2.2): The fraction of total decay events for which aparticular particle or photon is emitted. Also called the �branching fraction� or �branching ratio.�
emulsion (14.4.3): (1) A colloidal solution in which both the dispersed phase and continuousphase are immiscible liquids (2) A permanent colloidal solution in which either the dispersedphase or continuous phase is water, usually oil in water or water in oil. See gel.
environmental compliance (4.2): Agreement with environmental laws and regulations.
environmental data collection process (2.1): Consists of a series of elements (e.g., planning,developing project plan documents, contracting for services, sampling, analysis, dataverification, data validation, and data quality assessment), which are directed at the use of thedata in decisionmaking.
error (of measurement) (1.4.7): The difference between a measured result and the value of themeasurand. The error of a measurement is primarily a theoretical concept, since its value is neverknown. See also random error, systematic error, and uncertainty (of measurement).

Glossary
( ) Indicates the section in which the term is first used in MARLAP.Italicized words or phrases have their own definitions in this glossary.
JULY 2004 MARLAPxxi
estimator (18B.2): A random variable whose value is used to estimate an unknown parameter, θ,is called an estimator for θ. Generally, an estimator is a function of experimental data.
exception (8.2.3): A concept in data verification meaning a failure to meet a requirement.
excluded particles (14.7.6): Chemical components in a gel-filtration chromatographic systemthat do not enter the solid-phase matrix during separation; these components spend less time inthe system and are the first to be eluted in a single fraction during chromatography.
exclusion chromatography (14.7.6): See gel-filtration chromatography.
excursion (1.6.2): Departure from the expected condition during laboratory analysis.
expanded uncertainty (1.4.7): �The product, U, of the combined standard uncertainty of ameasured value y and a coverage factor k chosen so that the interval from y ! U to y + U has adesired high probability of containing the value of the measurand� (ISO, 1995).
expectation (19.2.2): The expectation of a random variable X, denoted by E(X) or µX, is ameasure of the center of its distribution (a measure of central tendency) and is defined as aprobability-weighted average of the possible numerical values. Other terms for the expectationvalue of X are the expected value and the mean.
expected value (18.3.2): See expectation.
expedited site characterization (2.3.2): A process used to identify all relevant contaminantmigration pathways and determine the distribution, concentration, and fate of the contaminantsfor the purpose of evaluating risk, determining regulatory compliance, and designing remediationsystems.
experimental standard deviation (6A.2): A measure of the dispersion of the results of repeatedmeasurements of the same quantity, given explicitly by
s(qk) '1
n & 1 jn
k'1(qk & q̄)2
where q1, q2, �, qn are the results of the measurements, and is their arithmetic mean (ISO,q̄1993a).

Glossary
( ) Indicates the section in which the term is first used in MARLAP.Italicized words or phrases have their own definitions in this glossary.
MARLAP JULY 2004xxii
external assessment (4.2): Part of the evaluation process used to measure the performance oreffectiveness of a system and its elements. As an example, this could be information (audit,performance evaluation, inspection, etc.) related to a method�s development, validation, andcontrol that is done by personnel outside of the laboratory and is part of the laboratory qualityassurance program.
extraction chromatography (14.4.4): A solid-phase extraction method performed in achromatographic column that uses a resin material consisting of an extractant absorbed onto aninert polymeric support matrix.
false acceptance (20.2.2): See Type II decision error.
false negative (20.2.1): See Type II decision error. MARLAP avoids the terms �false negative�and �false positive� because they may be confusing in some contexts.
false positive (14.10.9.9): See Type I decision error. MARLAP avoids the terms �false negative�and �false positive� because they may be confusing in some contexts.
false rejection (20.2.1): See Type I decision error.
femtogram (fg) (6.5.5.5): Unit of mass equal to 10-15 grams.
flocculation (14.8.5): See coagulation and deflocculation.
formation constant (14.3.2): The equilibrium constant for the formation of a complex ion orcoordination molecule. The magnitude of the constant represents the stability of the complex.Also called �stability constant.�
fractional distillation (14.5.2): Separation of liquid components of a mixture by repeatedvolatilization of the liquid components and condensation of their vapors within a fractionationcolumn. Repeated volatilization and condensation produces a decreasing temperature gradient upthe column that promotes the collection of the more volatile components (lower boiling pointcomponents) at the upper end of the column and return of the less volatile components at thelower end of the column. The process initially enriches the vapors in the more volatilecomponents, and they separate first as lower boiling point fractions.
fractionation column (14.5.3): A distillation column that allows repeated volatilization andcondensation steps within the length of the column, accomplishing fractional distillation ofcomponents of a mixture in one distillation process by producing a temperature gradient that
Glossary
( ) Indicates the section in which the term is first used in MARLAP.Italicized words or phrases have their own definitions in this glossary.
JULY 2004 MARLAPxxiii
decreases up the length of the column (see fractional distillation). The column is designed withplates or packing material inside the column to increase the surface area for condensation.
frequency plots (9.6.3): Statisticians employ frequency plots to display the imprecision of asampling and analytical event and to identify the type of distribution.
fusion (1.4.10): See sample dissolution.
full width of a peak at half maximum (FWHM) (8.5.11): A measure of the resolution of aspectral peak used in alpha or gamma spectrometry: the full peak-width energy (FW) at one-halfmaximum peak height (HM).
full width of a peak at tenth maximum (FWTM) (15.1): A measure of the resolution of aspectral peak used in alpha or gamma spectrometry: the full peak-width energy (FW) at one-tenthmaximum peak height (TM).
gas chromatography (GC) (14.5.2): See gas-liquid phase chromatography.
gas-liquid phase chromatography (GLPC) (14.7.1): A chromatographic separation processusing a mobile gas phase (carrier gas) in conjunction with a low-volatility liquid phase that isabsorbed onto an inert, solid-phase matrix to produce a stationary phase. The components of theanalytical mixture are vaporized and swept through the column by the carrier gas.
gel (14.7.4.2, Table 14.9): (1) A colloidal solution that is highly viscous, usually coagulated intoa semirigid or jellylike solid. (2) Gelatinous masses formed from the flocculation of emulsions.
gel-exclusion chromatography (14.7.6): See gel-filtration chromatography.
gel-filtration chromatography (14.7.6): A column chromatographic separation process using asolid, inert polymeric matrix with pores that admit molecules less than a certain hydrodynamicsize (molecular weight) but exclude larger molecules. The excluded molecules are separatedfrom the included molecules by traveling only outside the matrix and are first eluted in bulk fromthe column. The included molecules, depending on size, spend different amounts of time in thepores of matrix and are separated by size.
general analytical planning issues (3.3): Activities to be identified and resolved during adirected planning process. Typically, the resolution of general analytical planning issuesnormally results, at a minimum, in an analyte list, identified matrices of concern, measurement

Glossary
( ) Indicates the section in which the term is first used in MARLAP.Italicized words or phrases have their own definitions in this glossary.
MARLAP JULY 2004xxiv
quality objectives, and established frequencies and acceptance criteria for quality control samples.
graded approach (2.3): A process of basing the level of management controls applied to an itemor work on the intended use of the results and the degree of confidence needed in the quality ofthe results. MARLAP recommends a graded approach to project planning because of thediversity of environmental data collection activities. This diversity in the type of project and thedata to be collected impacts the content and extent of the detail to be presented in the projectplan documents.
gray region (1.6.3): The range of possible values in which the consequences of decision errorsare relatively minor. Specifying a gray region is necessary because variability in the targetanalyte in a population and imprecision in the measurement system combine to producevariability in the data such that the decision may be �too close to call� when the true value is verynear the action level. The gray region establishes the minimum distance from the action levelwhere it is most important that the project planning team control Type II errors.
GUM (1.4.7): Guide to the Expression of Uncertainty in Measurement (ISO, 1995).
half-life (T½ or t½) (1.4.8): The time required for one-half of the atoms of a particular radionuc-lide in a sample to disintegrate or undergo nuclear transformation.
heterogeneity (2.5): (1) �Spatial heterogeneity,� a type of distributional heterogeneity, refers tothe nonuniformity of the distribution of an analyte of concern within a matrix. Spatial hetero-geneity affects sampling, sample processing, and sample preparation. See homogenization. (2)The �distributional heterogeneity� of a lot depends not only on the variations among particles butalso on their spatial distribution. Thus, the distributional heterogeneity may change, for example,when the material is shaken or mixed. (3) The �constitutional� (or �compositional�) hetero-geneity of a lot is determined by variations among the particles without regard to their locationsin the lot. It is an intrinsic property of the lot itself, which cannot be changed without alteringindividual particles.
high-level waste (HLW) (1.3): (1) irradiated reactor fuel; (2) liquid wastes resulting from theoperation of the first-cycle solvent extraction system, or equivalent, and the concentrated wastesfrom subsequent extraction cycles, or equivalent, in a facility for reprocessing irradiated reactorfuel; (3) solids into which such liquid wastes have been converted.
high-pressure liquid chromatography (HPLC) (14.7.7): A column chromatography processusing various solid-liquid phase systems in which the liquid phase is pumped through the systemat high pressures. The process permits rapid, highly efficient separation when compared to many

Glossary
( ) Indicates the section in which the term is first used in MARLAP.Italicized words or phrases have their own definitions in this glossary.
JULY 2004 MARLAPxxv
other chromatographic systems and is, therefore, also referred to as �high-performance liquidchromatography.�
holdback carrier (14.8.4.4): A nonradioactive carrier of a radionuclide used to prevent thatparticular radioactive species from contaminating other radioactive species in a chemicaloperation (IUPAC, 2001).
homogeneous distribution coefficient (D) (14.8.4.1): The equality constant in the equationrepresenting the homogeneous distribution law. Values of D greater than one represent removalof a foreign ion by inclusion during coprecipitation (see homogeneous distribution law).
homogeneous distribution law (14.8.4.1): A description of one mechanism in whichcoprecipitation by inclusion occurs (the less common mechanism). The amount of ioncoprecipitating is linearly proportional to the ratio of the concentration of the ion in solution tothe concentration of the coprecipitating agent in solution. Equilibrium between the precipitateand the solution is obtained (during digestion) and the crystals become completely homogeneouswith respect to the foreign ions (impurities) (see homogeneous distribution coefficient anddigestion).
homogenization (3.4, Table 3.1): Producing a uniform distribution of analytes and particlesthroughout a sample.
hydration (14.3.1): Association of water molecules with ions or molecules in solution.
hydration sphere (14.3.1): Water molecules that are associated with ions or molecules insolution. The inner-hydration sphere (primary hydration sphere) consists of several watermolecules directly bonded to ions through ion-dipole interactions and to molecules throughdipole-dipole interactions including hydrogen bonding. The outer hydration sphere (secondaryhydration sphere) is water molecules less tightly bound through hydrogen bonding to themolecules of the inner-hydration sphere.
hydrolysis: (1) A chemical reaction of water with another compound in which either thecompound or water is divided. (2) A reaction of water with ions that divides (lyses) watermolecules to produce an excess of hydrogen ions or excess of hydroxyl ions in solution (an acidicor basic solution). Cations form complex ions with hydroxyl ions as ligands producing an acidicsolution: Fe+3 + H2O 6 Fe(OH)+2 + H+1. Anions form covalent bonds with the hydrogen ionproducing weak acids and a basic solution: F!1 + H2O 6 HF + OH!1.

Glossary
( ) Indicates the section in which the term is first used in MARLAP.Italicized words or phrases have their own definitions in this glossary.
MARLAP JULY 2004xxvi
hypothesis testing (2.5, Table 2.1): The use of statistical procedures to decide whether a nullhypothesis should be rejected in favor of an alternative hypothesis or not rejected (see alsostatistical test).
immobile phase (14.7.1): See stationary phase.
imprecision (1.4.8): Variation of the results in a set of replicate measurements. This can beexpressed as the standard deviation or coefficient of variation (relative standard deviation)(IUPAC, 1997). See precision.
included particle (14.7.6): The chemical forms that are separated by gel-filtration chroma-tography. They enter the solid-phase matrix of the chromatographic system and are separated byhydrodynamic size (molecular weight), eluting in inverse order by size.
inclusion (14.7.1): Replacement of an ion in a crystal lattice by a foreign ion similar in size andcharge to form a mixed crystal or solid solution. Inclusion is one mechanism by which ions arecoprecipitated with another substance precipitating from solution.
in control (1.6.2): The analytical process has met the quality control acceptance criteria andproject requirements. If the analytical process is in control, the assumption is that the analysiswas performed within established limits and indicates a reasonable match among matrix, analyte,and method.
independent (19.2.2): A collection of random variables X1, X2, �, Xn is independent if Pr[X1 #x1, X2 # x2, �, Xn # xn] = Pr[X1 # x1 ] @ Pr[X2 # x2] @ @ @ Pr[Xn # xn] for all real numbers x1, x2, �, xn.Intuitively, the collection is said to be independent if knowledge of the values of any subset ofthe variables provides no information about the likely values of the other variables.
inferential statistics (9.6.4.1): Using data obtained from samples to make estimates about apopulation (inferential estimations) and to make decisions (hypothesis testing). Sampling andinferential statistics have identical goals: to use samples to make inferences about a populationof interest and to use sample data to make defensible decisions.
inner (primary) hydration sphere (14.3.1): See hydration sphere.
input estimate (3A.5): Measured value of an input quantity. See output estimate.

Glossary
( ) Indicates the section in which the term is first used in MARLAP.Italicized words or phrases have their own definitions in this glossary.
JULY 2004 MARLAPxxvii
input quantity (6.5.5.1): Any of the quantities in a mathematical measurement model whosevalues are measured and used to calculate the value of another quantity, called the outputquantity. See input estimate.
interferences (1.4.9): The presence of other chemicals or radionuclides in a sample that hinderthe ability to analyze for the radionuclide of interest. See method specificity.
ion-exchange chromatography (6.6.2.3): A separation method based on the reversible exchangeof ions in a mobile phase with ions bonded to a solid ionic phase. Ions that are bonded lessstrongly to the solid phase (of opposite charge) are displaced by ions that are more stronglybonded. Separation of analyte ions depends on the relative strength of bonding to the solid phase.Those less strongly bonded ions are released from the solid phase earlier and eluted sooner.
ion-product (14.8.3.1): The number calculated by substituting the molar concentration of ionsthat could form a precipitate into the solubility-product expression of the precipitatingcompound. The ion-product is used to determine if a precipitate will form from the concentrationof ions in solution. If the ion-product is larger than the solubility-product constant, precipitationwill occur; if it is smaller, precipitation will not occur.
isomeric transition (14.10.9.12): The transition, via gamma-ray emission (or internal conver-sion), of a nucleus from a high-energy state to a lower-energy state without accompanyingparticle emission, e.g., 99mTc ÷ 99Tc + γ.
isotope (3.3.4): Any of two or more nuclides having the same number of protons in their nuclei(same atomic number), but differing in the number of neutrons (different mass numbers, forexample 58Co, 59Co, and 60Co). See radionuclide.
isotope dilution analysis (14.10.7): A method of quantitative analysis based on the measurementof the isotopic abundance of an element after isotopic dilution of the test portion.
key analytical planning issue (1.6.1): An issue that has a significant effect on the selection anddevelopment of analytical protocols or an issue that has the potential to be a significantcontributor of uncertainty to the analytical process and ultimately the resulting data.
laboratory control sample (2.5.4.2): A standard material of known composition or an artificialsample (created by fortification of a clean material similar in nature to the sample), which isprepared and analyzed in the same manner as the sample. In an ideal situation, the result of ananalysis of the laboratory control sample should be equivalent to (give 100 percent of) the target

Glossary
( ) Indicates the section in which the term is first used in MARLAP.Italicized words or phrases have their own definitions in this glossary.
MARLAP JULY 2004xxviii
analyte concentration or activity known to be present in the fortified sample or standard material.The result normally is expressed as percent recovery. See also quality control sample.
Laboratory Information Management System (LIMS) (11.2.1): An automated informationsystem used at a laboratory to collect and track data regarding sample analysis, laboratory qualitycontrol operability information, final result calculation, report generation, etc.
laboratory method (6.2): Includes all physical, chemical, and radiometric processes conducted ata laboratory in order to provide an analytical result. These processes may include samplepreparation, dissolution, chemical separation, mounting for counting, nuclear instrumentationcounting, and analytical calculations. Also called analytical method.
law of propagation of uncertainty (19.1): See uncertainty propagation formula.
level of confidence (1.4.11): See coverage probability.
ligand (14.3.1): A molecule, atom, or ion that donates at least one electron pair to a metal atomor ion to form a coordination molecule or complex ion. See dentate.
linearity (7.2.2.5): The degree to which the response curve for a measuring device, such as ananalytical balance, follows a straight line between the calibration points. The linearity is usuallyspecified by the maximum deviation of the response curve from such a straight line.
liquid chromatography (LC) (14.7.1): A chromatographic process using a mobile liquid-phase.
liquid-phase chromatography (LPC) (14.7.1): A chromatographic process in which the mobileand stationary phases are both liquids. Separation is based on relative solubility between twoliquid phases. The stationary phase is a nonvolatile liquid coated onto an inert solid matrix or aliquid trapped in or bound to a solid matrix. Also called �liquid-partition chromatography.�
logarithmic distribution coefficient (λ) (14.8.4.1): The equality constant in the equationrepresenting the Logarithmic Distribution Law. Values of λ greater than one represent removal ofa foreign ion by inclusion during coprecipitation, and the larger the value, the more effective andselective the process is for a specific ion. Generally, the logarithmic distribution coefficientdecreases with temperature, so coprecipitation by inclusion is favored by lower temperature.
Logarithmic Distribution Law (14.8.4.1): A description of one mechanism by whichcoprecipitation by inclusion occurs (the more common mechanism). The amount of ioncoprecipitated is logarithmically proportional to the amount of primary ion in the solution during

Glossary
( ) Indicates the section in which the term is first used in MARLAP.Italicized words or phrases have their own definitions in this glossary.
JULY 2004 MARLAPxxix
crystallization. Crystal are grown in a slow and orderly process, such as precipitation fromhomogeneous solution, and each crystal surface, as it is formed, is in equilibrium with thesolution. As a result, the concentration of a foreign ion (impurity) varies continuously from thecenter to the periphery of the crystal (see logarithmic distribution coefficient).
logic statement (2.6): The output from the directed planning process about what must be done toobtain the desired answer.
lower limit of detection (LLD) (14.10.9.5): (1) �The smallest concentration of radioactivematerial in a sample that will yield a net count, above the measurement process (MP) blank, thatwill be detected with at least 95 percent probability with no greater than a 5 percent probability offalsely concluding that a blank observation represents a �real� signal� (NRC, 1984). (2) �Anestimated detection limit that is related to the characteristics of the counting instrument� (EPA,1980).
low-pressure chromatography (14.7.1): Column chromatography in which a liquid phase ispassed through a column under pressure supplied by gravity or a low-pressure pump.
Lucas cell (10.5.4.4): A specially designed, high-efficiency cell for the analysis of radon gas withits progeny. The cell is coated with a zinc sulfide phosphor material that releases ultraviolet lightwhen the alpha particles from radon and its progeny interact with the phosphor.
Marinelli beaker (6.5.3): A counting container that allows the source to surround the detector,thus maximizing the geometrical efficiency. It consists of a cylindrical sample container with aninverted well in the bottom that fits over the detector. Also called a �reentrant beaker.�
MARLAP Process (1.4): A performance-based approach that develops Analytical ProtocolSpecifications, and uses these requirements as criteria for the analytical protocol selection,development, and evaluation processes, and as criteria for the evaluation of the resultinglaboratory data. This process, which spans the three phases of the data life cycle for a project, isthe basis for achieving MARLAP�s basic goal of ensuring that radioanalytical data will meet aproject�s or program�s data requirements or needs.
masking (14.4.3): The prevention of reactions that are normally expected to occur through thepresence or addition of a masking agent (reagent).
masking agent (14.4.3): A substance that is responsible for converting a chemical form, whichwould have otherwise participated in some usual chemical reaction, into a derivative that will notparticipate in the reaction.

Glossary
( ) Indicates the section in which the term is first used in MARLAP.Italicized words or phrases have their own definitions in this glossary.
MARLAP JULY 2004xxx
matrix of concern (1.4.10): Those matrices identified during the directed project planningprocess from which samples may be taken. Typical matrices include: surface soil, subsurfacesoil, sediment, surface water, ground water, drinking water, process effluents or wastes, airparticulates, biota, structural materials, and metals.
matrix-specific analytical planning issue (3.1): Key analytical planning issue specific to thatmatrix, such as filtration and preservation issues for water samples.
matrix spike (3.3.10): An aliquant of a sample prepared by adding a known quantity of targetanalytes to specified amount of matrix and subjected to the entire analytical procedure toestablish if the method or procedure is appropriate for the analysis of the particular matrix.
matrix spike duplicate (MSD) (9.6.3): A second replicate matrix spike prepared in thelaboratory and analyzed to evaluate the precision of the measurement process.
Maximum Contaminant Level (MCL) (2.5.2.1): The highest level of a contaminant that isallowed in drinking water. MCLs are set as close as feasible to the level believed to cause nohuman health impact, while using the best available treatment technology and taking cost intoconsideration. MCLs are enforceable standards.
mean (1.4.8): See expectation (compare with arithmetic mean and sample mean).
mean concentration (2.5.2.3): A weighted average of all the possible values of an analyteconcentration, where the weight of a value is determined by its probability.
measurand (1.4.7): �Particular quantity subject to measurement�(ISO, 1993a).
measurement performance criteria (1.2): See measurement quality objectives.
measurement process (1.3): Analytical method of defined structure that has been brought into astate of statistical control, such that its imprecision and bias are fixed, given the measurementconditions (IUPAC, 1995).
measurement quality objective (MQO) (1.4.9): The analytical data requirements of the dataquality objectives are project- or program-specific and can be quantitative or qualitative. Theseanalytical data requirements serve as measurement performance criteria or objectives of theanalytical process. MARLAP refers to these performance objectives as measurement qualityobjectives (MQOs). Examples of quantitative MQOs include statements of required analytedetectability and the uncertainty of the analytical protocol at a specified radionuclide concentra-

Glossary
( ) Indicates the section in which the term is first used in MARLAP.Italicized words or phrases have their own definitions in this glossary.
JULY 2004 MARLAPxxxi
tion, such as the action level. Examples of qualitative MQOs include statements of the requiredspecificity of the analytical protocol, e.g., the ability to analyze for the radionuclide of interestgiven the presence of interferences.
measurement uncertainty (1.4.7): See uncertainty (of measurement).
measurement variability (2.5.2.2): The variability in the measurement data for a survey unit is acombination of the imprecision of the measurement process and the real spatial variability of theanalyte concentration.
median (9.6.4.1): A median of a distribution is any number that splits the range of possiblevalues into two equally likely portions, or, to be more rigorous, a 0.5-quantile. See arithmeticmean.
method (1.4.5): See analytical method.
method blank (Figure 3.3): A sample assumed to be essentially target analyte-free that is carriedthrough the radiochemical preparation, analysis, mounting and measurement process in the samemanner as a routine sample of a given matrix.
method control (6.1): Those functions and steps taken to ensure that the validated method asroutinely used produces data values within the limits of the measurement quality objectives.Method control is synonymous with process control in most quality assurance programs.
method detection limit (MDL) (3B.4): �The minimum concentration of a substance that can bemeasured and reported with 99 percent confidence that the analyte concentration is greater thanzero � determined from analysis of a sample in a given matrix containing the analyte�(40 CFR 136, Appendix B).
method performance characteristics (3.3.7): The characteristics of a specific analytical methodsuch as method uncertainty, method range, method specificity, and method ruggedness.MARLAP recommends developing measurement quality objectives for select methodperformance characteristics, particularly for the uncertainty (of measurement) at a specifiedconcentration (typically the action level).
method range (1.4.9): The lowest and highest concentration of an analyte that a method canaccurately detect.

Glossary
( ) Indicates the section in which the term is first used in MARLAP.Italicized words or phrases have their own definitions in this glossary.
MARLAP JULY 2004xxxii
method ruggedness (1.4.9): The relative stability of method performance for small variations inmethod parameter values.
method specificity (1.4.9): The ability of the method to measure the analyte of concern in thepresence of interferences.
method uncertainty (3.3.7): Method uncertainty refers to the predicted uncertainty of the resultthat would be measured if the method were applied to a hypothetical laboratory sample with aspecified analyte concentration. Although individual measurement uncertainties will vary fromone measured result to another, the required method uncertainty is a target value for theindividual measurement uncertainties, and is an estimate of uncertainty (of measurement) beforethe sample is actually measured. See also uncertainty (of measurement).
method validation (5.3): The demonstration that the radioanalytical method selected for theanalysis of a particular radionuclide in a given matrix is capable of providing analytical results tomeet the project�s measurement quality objectives and any other requirements in the analyticalprotocol specifications. See project method validation.
method validation reference material (MVRM) (5.5.2): Reference materials that have the sameor similar chemical and physical properties as the proposed project samples, which can be usedto validate the laboratory�s methods.
metrology (1.4.7): The science of measurement.
minimum detectable amount (MDA) (3B.3): The minimum detectable value of the amount ofanalyte in a sample. Same definition as the minimum detectable concentration but related to thequantity (activity) of a radionuclide rather than the concentration of a radionuclide. May becalled the �minimum detectable activity� when used to mean the activity of a radionuclide (seeANSI N13.30 and N42.23).
minimum detectable concentration (MDC) (2.5.3): The minimum detectable value of the analyteconcentration in a sample. ISO refers to the MDC as the minimum detectable value of the netstate variable. They define this as the smallest (true) value of the net state variable that gives aspecified probability that the value of the response variable will exceed its critical value�i.e.,that the material analyzed is not blank.
minimum detectable value (20.2.1): An estimate of the smallest true value of the measurand thatensures a specified high probability, 1 ! β, of detection. The definition of the minimum
Glossary
( ) Indicates the section in which the term is first used in MARLAP.Italicized words or phrases have their own definitions in this glossary.
JULY 2004 MARLAPxxxiii
detectable value presupposes that an appropriate detection criterion has been specified (seecritical value).
minimum quantifiable concentration (MQC) (3.3.7): The minimum quantifiable concentration,or the minimum quantifiable value of the analyte concentration, is defined as the smallestconcentration of analyte whose presence in a laboratory sample ensures the relative standarddeviation of the measurement does not exceed a specified value, usually 10 percent.
minimum quantifiable value (20.2.7): The smallest value of the measurand that ensures therelative standard deviation of the measurement does not exceed a specified value, usually 10percent (see also minimum quantifiable concentration).
mixed waste (1.3): Waste that contains both radioactive and hazardous chemicals.
mobile phase (14.7.1): The phase in a chromatographic system that is moving with respect to thestationary phase; either a liquid or a gas phase.
moving phase (14.7.1): See mobile phase.
net count rate: (16.3.2): The net count rate is the value resulting form the subtraction of thebackground count rate (instrument background or appropriate blank) from the total (gross) countrate of a source or sample.
nonaqueous samples (10.3.5): Liquid-sample matrices consisting of a wide range of organic/solvents, organic compounds dissolved in water, oils, lubricants, etc.
nonconformance (5.3.7): An instance in which the contractor does not meet the performancecriteria of the contract or departs from contract requirements or acceptable practice.
nuclear decay (15.3): A spontaneous nuclear transformation.
nuclear counting (1.6): The measurement of alpha, beta or photon emissions fromradionuclides.
nuclide (1.1): A species of atom, characterized by its mass number, atomic number, and nuclearenergy state, providing that the mean half-life in that state is long enough to be observable(IUPAC, 1995).

Glossary
( ) Indicates the section in which the term is first used in MARLAP.Italicized words or phrases have their own definitions in this glossary.
MARLAP JULY 2004xxxiv
nuclide-specific analysis (3.3.8.3): Radiochemical analysis performed to isolate and measure aspecific radionuclide.
null hypothesis (H0) (2.5, Table 2.1): One of two mutually exclusive statements tested in astatistical hypothesis test (compare with alternative hypothesis). The null hypothesis is presumedto be true unless the test provides sufficient evidence to the contrary, in which case the nullhypothesis is rejected and the alternative hypothesis is accepted.
occlusion (14.8.3.1): The mechanical entrapment of a foreign ion between subsequent layersduring crystal formation. A mechanism of coprecipitation.
Ostwald ripening (14.8.3.2): Growth of larger crystals during precipitation by first dissolvingsmaller crystals and allowing the larger crystals to form.
outer (secondary) hydration sphere (14.3.1): See hydration sphere.
outlier (9.6.4.1): A value in a group of observations, so far separated from the remainder of thevalues as to suggest that they may be from a different population, or the result of an error inmeasurement (ISO, 1993b).
output estimate (3A.5): The calculated value of an output quantity (see input estimate).
output quantity (19.3.2): The quantity in a mathematical measurement model whose value iscalculated from the measured values of other quantities in the model (see input quantity andoutput estimate).
oxidation (6.4): The increase in oxidation number of an atom in a chemical form during achemical reaction. Increase in oxidation number is a result of the loss of electron(s) by the atomor the decrease in electron density when the atom bonds to a more electronegative element orbreaks a bond to a less electronegative element.
oxidation-reduction (redox) reaction (10.3.3): A chemical reaction in which electrons areredistributed among the atoms, molecules, or ions in the reaction.
oxidation number (6.4): An arbitrary number indicating the relative electron density of an atomor ion of an element in the combined state, relative to the electron density of the element in thepure state. The oxidation number increases as the electron density decreases and decreases as theelectron density increases.

Glossary
( ) Indicates the section in which the term is first used in MARLAP.Italicized words or phrases have their own definitions in this glossary.
JULY 2004 MARLAPxxxv
oxidation state (6.4): See oxidation number.
oxidizing agent (10.5.2): The chemical species in an oxidation-reduction reaction that causesoxidation of another chemical species by accepting or attracting electrons. The oxidizing agent isreduced during the reaction.
paper chromatography (14.7.1): A chromatographic process in which the stationary phase issome type of absorbent paper. The mobile phase is a pure liquid or solution.
parameter of interest (2.5, Table 2.1): A descriptive measure (e.g., mean, median, or proportion)that specifies the characteristic or attribute that the decisionmaker would like to know and thatthe data will estimate.
PARCC (3.3.7): �Precision, accuracy, representativeness, comparability, and completeness.� Seedata quality indicators.
parent radionuclide (3.3.4): The initial radionuclide in a decay chain that decays to form one ormore progeny.
partition (distribution) coefficient: See distribution coefficient.
peptization: See deflocculation.
percentile (19A.1): If X is a random variable and p is a number between 0 and 1, then a 100pth
percentile of X is any number xp such that the probability that X < xp is at most p and theprobability that X # xp is at least p. For example, if x0.95 is a 95th percentile of X then Pr[X < x0.95]# 0.95 and Pr[X # x0.95] $ 0.95. See quantile.
performance-based approach (1.2): Defining the analytical data needs and requirements of aproject in terms of measurable goals during the planning phase of a project. In a performance-based approach, the project-specific analytical data requirements that are determined during adirected planning process serve as measurement performance criteria for selections and decisionson how the laboratory analyses will be conducted. The project-specific analytical datarequirements are also used for the initial, ongoing, and final evaluation of the laboratory�sperformance and the laboratory data.
performance-based approach to method selection (6.1): The process wherein a validatedmethod is selected based on a demonstrated capability to meet defined quality and laboratoryperformance criteria.
Glossary
( ) Indicates the section in which the term is first used in MARLAP.Italicized words or phrases have their own definitions in this glossary.
MARLAP JULY 2004xxxvi
performance evaluation program (5.3.5): A laboratory�s participation in an internal or externalprogram of analyzing performance testing samples appropriate for the analytes and matricesunder consideration (i.e., performance evaluation (PE) program traceable to a national standardsbody, such as the National Institute of Standards and Technology in the United States).
performance evaluation sample (3.3.10): Reference material samples used to evaluate theperformance of the laboratory. Also called performance testing (PT) samples or materials.
performance indicator (1.6.2): Instrument- or protocol-related parameter routinely monitored toassess the laboratory�s estimate of such controls as chemical yield, instrument background,uncertainty (of measurement), precision, and bias.
performance testing (PT): See performance evaluation program.
picocurie (pCi) (1.4.9): 10-12 curie.
planchet (10.3.2): A metallic disk (with or without a raised edge) that is used for the analysis ofa radioactive material after the material has been filtered, evaporated, electroplated, or dried.Evaporation of water samples for gross alpha and beta analysis often will take place directly inthe planchet.
Poisson distribution (18.3.2): A random variable X has the Poisson distribution with parameter λif for any nonnegative integer k,
Pr[X ' k] ' λke&λ
k!In this case both the mean and variance of X are numerically equal to λ. The Poisson distributionis often used as a model for the result of a nuclear counting measurement.
polymorphism (14.8.3.1): The existence of a chemical substance in two or more physical forms,such as different crystalline forms.
postprecipitation (14.8.4.3): The subsequent precipitation of a chemically different species uponthe surface of an initial precipitate; usually, but not necessarily, including a common ion(IUPAC, 1997).
precision (1.4.8): The closeness of agreement between independent test results obtained byapplying the experimental procedure under stipulated conditions. Precision may be expressed asthe standard deviation (IUPAC, 1997). See imprecision.
Glossary
( ) Indicates the section in which the term is first used in MARLAP.Italicized words or phrases have their own definitions in this glossary.
JULY 2004 MARLAPxxxvii
prescribed methods (6.1): Methods that have been selected by the industry for internal use or bya regulatory agency for specific programs. Methods that have been validated for a specificapplication by national standard setting organizations, such as ASTM, ANSI, AOAC, etc., mayalso be used as prescribed methods by industry and government agencies.
primary (inner) hydration sphere (14.3.1): See hydration sphere.
primordial radionuclide (3.3.1): A naturally occurring radionuclide found in the earth that hasexisted since the formation (~4.5 billion years) of the Earth, e.g., 232Th and 238U.
principal decision (2.7.3): The principal decision or study question for a project is identifiedduring Step 2 of the data quality objectives process. The principal decision could be simple, likewhether a particular discharge is or is not in compliance, or it could be complex, such asdetermining if an observed adverse health effect is being caused by a nonpoint source discharge.
principal study question (2.7.3): See principal decision.
probabilistic sampling plan (9.6.2.3): Using assumptions regarding average concentrations andvariances of samples and matrix by the planning team during the development of the samplingplan.
probability (1.4.7): �A real number in the scale 0 to 1 attached to a random event� (ISO, 1993b).The probability of an event may be interpreted in more than one way. When the event in questionis a particular outcome of an experiment (or measurement), the probability of the event maydescribe the relative frequency of the event in many trials of the experiment, or it may describeone�s degree of belief that the event occurs (or will occur) in a single trial.
probability density function (pdf) (19A.1): A probability density function for a random variableX is a function f(x) such that the probability of any event a # X # b is equal to the value of theintegral . The pdf, when it exists, equals the derivative of the distribution function.Ib
a f(x)dx
process knowledge (1.4.10): Information about the radionuclide(s) of concern derived fromhistorical knowledge about the production of the sampled matrix or waste stream.
progeny (3.3.4): The product resulting from the radioactive disintegration or nucleartransformation of its parent radionuclide. See decay chain.
project method validation (6.1): The demonstrated method applicability for a particular project.See method validation.

Glossary
( ) Indicates the section in which the term is first used in MARLAP.Italicized words or phrases have their own definitions in this glossary.
MARLAP JULY 2004xxxviii
project narrative statement (4.3): Description of environmental data collection activities, such asbasic studies or small projects, which only require a discussion of the experimental process andits objectives. Other titles used for project narrative statements are quality assurance narrativestatement and proposal quality assurance plan. Basic studies and small projects generally are ofshort duration or of limited scope and could include proof of concept studies, exploratoryprojects, small data collection tasks, feasibility studies, qualitative screens, or initial work toexplore assumptions or correlations.
project plan documents (1.1): Gives the data user�s expectations and requirements, which aredeveloped during the planning process, where the Analytical Protocol Specifications (whichinclude the measurement quality objectives) are documented, along with the standard operatingprocedures, health and safety protocols and quality assurance/quality control procedures for thefield and laboratory analytical teams. Project plan, work plan, quality assurance project plan,field sampling plan, sampling and analysis plan, and dynamic work plan are some of the namescommonly used for project plan documents.
project planning team (2.1): Consists of all the parties who have a vested interest or caninfluence the outcome (stakeholders), such as program and project managers, regulators, thepublic, project engineers, health and safety advisors, and specialists in statistics, health physics,chemical analysis, radiochemical analysis, field sampling, quality assurance, quality control,data assessment, hydrology and geology, contract management, and field operation. The projectplanning team will define the decision(s) to be made (or the question the project will attempt toresolve) and the inputs and boundaries to the decision using a directed planning process.
project quality objectives (2.1): See decision performance criteria and data quality objective.
project specific plan (4.3): Addresses design, work processes, and inspection, and incorporates,by citation, site-wide plans that address records management, quality improvement, procurement,and assessment.
propagation of uncertainty (15.2.5): See uncertainty propagation.
protocol (1.4.3): See analytical protocol.
protocol performance demonstration (3.1): See method validation.
qualifiers (8.1): Code applied to the data by a data validator to indicate a verifiable or potentialdata deficiency or bias (EPA, 2002).
Glossary
( ) Indicates the section in which the term is first used in MARLAP.Italicized words or phrases have their own definitions in this glossary.
JULY 2004 MARLAPxxxix
quality assurance (QA) (1.3): An integrated system of management activities involvingplanning, implementation, assessment, reporting, and quality improvement to ensure that aprocess, item, or service is of the type and quality needed and expected.
quality assurance project plan (QAPP) (1.4.11): A formal document describing in detail thenecessary quality assurance, quality control, and other technical activities that must beimplemented to ensure that the results of the work performed will satisfy the stated performancecriteria. The QAPP describes policy, organization, and functional activities and the data qualityobjectives and measures necessary to achieve adequate data for use in selecting the appropriateremedy.
quality control (QC) (1.4.3): The overall system of technical activities whose purpose is tomeasure and control the quality of a process or service so that it meets the needs of the users orperformance objectives.
quality control sample (1.4.3): Sample analyzed for the purpose of assessing imprecision andbias. See also blanks, matrix spikes, replicates, and laboratory control sample.
quality control test (8.5.1): Comparison of quality control results with stipulated acceptancecriteria.
quality indicator (2.5.4.2): Measurable attribute of the attainment of the necessary quality for aparticular environmental decision. Precision, bias, completeness, and sensitivity are commondata quality indicators for which quantitative measurement quality objectives could bedeveloped during the planning process.
quality system (9.2.2.3): The quality system oversees the implementation of quality controlsamples, documentation of quality control sample compliance or noncompliance withmeasurement quality objectives, audits, surveillances, performance evaluation sample analyses,corrective actions, quality improvement, and reports to management.
quantification capability (1.4.9): The ability of a measurement process to quantify themeasurand precisely, usually expressed in terms of the minimum quantifiable value.
quantification limit (20.2.1): See minimum quantifiable value.
quantile (6.6.2, Table 6.1): A p-quantile of a random variable X is any value xp such that theprobability that X < xp is at most p and the probability that X # xp is at least p. (See percentile.)
Glossary
( ) Indicates the section in which the term is first used in MARLAP.Italicized words or phrases have their own definitions in this glossary.
MARLAP JULY 2004xl
quench (7.2): A term used to describe the process in liquid-scintillation counting when theproduction of light is inhibited or the light signal is partially absorbed during the transfer of lightto the photocathode.
radioactive (1.1): Exhibiting radioactivity, or containing radionuclides.
radioactive decay (3A.4): �Nuclear decay in which particles or electromagnetic radiation areemitted or the nucleus undergoes spontaneous fission or electron capture.� (IUPAC, 1994)
radioactive equilibrium (3.3.4): One of three distinct relationships that arise when a radionuclidedecays and creates progeny that are also radioactive: (1) secular equilibrium occurs when half-lifeof the progeny is much less than the half-life of the parent (for a single progeny, the total activityreaches a maximum of about twice the initial activity, and then displays the characteristic half-life of the parent�usually no change over normal measurement intervals); (2) transient equilib-rium occurs when the half-life of the progeny is less than the half-life of the parent (for a singleprogeny, total activity passes through a maximum, and then decreases with the characteristichalf-life of the parent); and (3) no equilibrium occurs when the half-life of the progeny is greaterthan the half-life of the parent (total activity decreases continually after time zero).
radioactivity (2.5.4.1): The property of certain nuclides of undergoing radioactive decay.
radioanalytical specialist (2.1): Key technical experts who participate on the project planningteam. Radioanalytical specialists may provide expertise in radiochemistry and radiation/nuclidemeasurement systems, and have knowledge of the characteristics of the analytes of concern toevaluate their fate and transport. They may also provide knowledge about sample transportationissues, preparation, preservation, sample size, subsampling, available analytical protocols, andachievable analytical data quality.
radiochemical analysis (5.3.5): The analysis of a sample matrix for its radionuclide content,both qualitatively and quantitatively.
radiocolloid (14.4.6.2): A colloidal form of a radionuclide tracer produced by sorption of theradionuclide onto a preexisting colloidal impurity, such as dust, cellulose fibers, glass fragments,organic material, and polymeric metal hydrolysis products, or by polycondensation of amonomeric species consisting of aggregates of a thousand to ten million radioactive atoms.
radiological holding time (6.5): The time required to process the sample. Also refers to the timedifferential between the sample collection date and the final sample counting (analysis) date.

Glossary
( ) Indicates the section in which the term is first used in MARLAP.Italicized words or phrases have their own definitions in this glossary.
JULY 2004 MARLAPxli
radiolysis (14.1): Decomposition of any material as a result of exposure to radiation.
radionuclide (1.1): A nuclide that is radioactive (capable of undergoing radioactive decay).
radionuclide of interest (1.4.10): The radionuclide or target analyte that the planning team hasdetermined important for a project. Also called radionuclide of concern or target radionuclide.
radiotracer (6.5.2): (1) A radioactive isotope of the analyte that is added to the sample tomeasure any losses of the analyte during the chemical separations or other processes employedin the analysis (the chemical yield). (2) A radioactive element that is present in only extremelyminute quantities, on the order of 10!15 to 10!11 Molar.
random effect (3A.4): Any effect in a measurement process that causes the measured result tovary randomly when the measurement is repeated.
random error (3A.4): A result of a measurement minus the mean that would result from aninfinite number of measurements of the same measurand carried out under repeatabilityconditions (ISO, 1993a).
random variable (19.3.1): The numerical outcome of an experiment, such as a laboratorymeasurement, that produces varying results when repeated.
reagent blank (12.6.5): Consists of the analytical reagent(s) in the procedure without the targetanalyte or sample matrix, introduced into the analytical procedure at the appropriate point andcarried through all subsequent steps to determine the contribution of the reagents and of theinvolved analytical steps.
recovery (2.5.4.2): The ratio of the amount of analyte measured in a spiked or laboratory controlsample, to the amount of analyte added, and is usually expressed as a percentage. For a matrixspike, the measured amount of analyte is first decreased by the measured amount of analyte inthe sample that was present before spiking. Compare with yield.
redox (13.2.3): An acronym for oxidation-reduction.
reducing agent (13.4.1, Table 13.2): The chemical in an oxidation-reduction reaction thatreduces another chemical by providing electrons. The reducing agent is oxidized during thereaction.

Glossary
( ) Indicates the section in which the term is first used in MARLAP.Italicized words or phrases have their own definitions in this glossary.
MARLAP JULY 2004xlii
reducing; reduction (13.4.1, Table 13.2): The decrease in oxidation number of an atom in achemical form during a chemical reaction. The decrease is a result of the gain of electron(s) by anatom or the increase in electron density by an atom when it bonds to a less electronegativeelement or breaks a bond to a more electronegative element.
regulatory decision limit (2.5.2.1): The numerical value that will cause the decisionmaker tochoose one of the alternative actions. An example of such a limit for drinking water is themaximum contaminant level (MCL). See action level.
rejected result (8.3.3): A result that is unusable for the intended purpose. A result should only berejected when the risks of using it are significant relative to the benefits of using whateverinformation it carries. Rejected data should be qualified as such and not used in the data qualityassessment phase of the data life cycle.
relative standard deviation (RSD) (6.5.5.2): See coefficient of variation.
relative standard uncertainty (3.3.7.1.2): The ratio of the standard uncertainty of a measuredresult to the result itself. The relative standard uncertainty of x may be denoted by ur(x).
relative variance (19A.1): The relative variance of a random variable is the square of thecoefficient of variation.
release criterion (1.3): A regulatory limit expressed in terms of dose or risk. The release criterionis typically based on the total effective dose equivalent (TEDE), the committed effective doseequivalent (CEDE), risk of cancer incidence (morbidity), or risk of cancer death (mortality), andgenerally can not be measured directly.
repeatability (of results of measurement) (6.6): The closeness of the agreement between theresults of successive measurements of the same measurand carried out under the same�repeatability conditions� of measurement. �Repeatability conditions� include the samemeasurement procedure, the same observer (or analyst), the same measuring instrument usedunder the same conditions, the same location, and repetition over a short period of time.Repeatability may be expressed quantitatively in terms of the dispersion characteristics of theresults (Adapted from ISO, 1993a.).
replicates (3.3.10): Two or more aliquants of a homogeneous sample whose independentmeasurements are used to determine the precision of laboratory preparation and analyticalprocedures.

Glossary
( ) Indicates the section in which the term is first used in MARLAP.Italicized words or phrases have their own definitions in this glossary.
JULY 2004 MARLAPxliii
representativeness (2.5.4): (1) The degree to which samples properly reflect their parentpopulations. (2) A representative sample is a sample collected in such a manner that it reflectsone or more characteristics of interest (as defined by the project objectives) of a population fromwhich it was collected. (3) One of the five principal data quality indicators (precision, bias,representativeness, comparability, and completeness).
reproducibility (of results of measurement) (6.4): The closeness of the agreement between theresults of measurements of the same measurand carried out under changed conditions ofmeasurement. A valid statement of reproducibility requires specification of the conditionschanged. The changed conditions may include principle of measurement, method ofmeasurement, observer (or analyst), measuring instrument, reference standard, location,conditions of use, and time. Reproducibility may be expressed quantitatively in terms of thedispersion characteristics of the results. Results are usually understood to be corrected results.(Adapted from ISO, 1993a.).
request for proposals (RFP) (5.1): An advertisement from a contracting agency to solicitproposals from outside providers during a negotiated procurement. See statement of work.
required minimum detectable concentration (RMDC) (8.5.3.2): An upper limit for the minimumdetectable concentration required by some projects.
resin (14.4.5.1): A synthetic or naturally occurring polymer used in ion-exchange chromatog-raphy as the solid stationary phase.
resolution (8.5.1.11): The peak definition of alpha, gamma-ray, and liquid-scintillationspectrometers, in terms of the full width of a peak at half maximum (FWHM), which can be usedto assess the adequacy of instrument setup, detector sensitivity, and chemical separationtechniques that may affect the identification, specification, and quantification of the analyte.
response variable (20.2.1): The variable that gives the observable result of a measurement�inradiochemistry, typically a gross count or count rate.
robustness (5.3.9): The ability of a method to deal with large fluctuations in interference levelsand variations in matrix. (See method ruggedness.)
ruggedness (1.4.9): See method ruggedness.

Glossary
( ) Indicates the section in which the term is first used in MARLAP.Italicized words or phrases have their own definitions in this glossary.
MARLAP JULY 2004xliv
sample mean '
jN
i'1xi
N
sample (1.1): (1) A portion of material selected from a larger quantity of material. (2) A set ofindividual samples or measurements drawn from a population whose properties are studied togain information about the entire population.
sample descriptors (8.5.1.1): Information that should be supplied to the laboratory includingsample ID, analytical method to be used, analyte, and matrix.
sample digestion (1.4.6): Solubilizing an analyte or analytes and its host matrix. Acid digestion,fusion, and microwave digestion are some common sample digestion techniques.
sample dissolution (1.1): See sample digestion.
sample management (2.7.2): Includes administrative and quality assurance aspects coveringsample receipt, control, storage, and disposition.
sample mean (9.6.4.2): An estimate of the mean of the distribution calculated form a statisticalsample of observations. The sample mean equals the sum of the observed values divided by thenumber of values, N. If the observed values are x1, x2, x3,�, xN, then the sample mean is given by
sample population (3.3.7.1.2): A set of individual samples or measurements drawn from apopulation whose properties are studied to gain information about the entire population.
sample processing turnaround time (5.3.6): The time differential from the receipt of the sampleat the laboratory to the reporting of the analytical results.
sample tracking (1.4.5): Identifying and following a sample through the steps of the analyticalprocess including: field sample preparation and preservation; sample receipt and inspection;laboratory sample preparation; sample dissolution; chemical separation of radionuclides ofinterest; preparation of sample for instrument measurement; instrument measurement; and datareduction and reporting.
sample variance (9.6.4.2): An estimate of the variance of a distribution calculated from astatistical sample of observations. If the observed values are x1, x2, x3,�, xN, and the sample meanis , then the sample variance is given by:x̄
Glossary
( ) Indicates the section in which the term is first used in MARLAP.Italicized words or phrases have their own definitions in this glossary.
JULY 2004 MARLAPxlv
s 2 '1
N & 1 jN
i'1(xi & x̄ )2
sampling and analysis plan (SAP) (1.5): See project plan documents.
saturated solution (14.8.2): A solution that contains the maximum amount of substance that candissolve in a prescribed amount of solvent at a given temperature. The dissolved substance is inequilibrium with any undissolved substance.
scale of decision (2.5, Table 2.1): The spatial and temporal bounds to which the decision willapply. The scale of decision selected should be the smallest, most appropriate subset of thepopulation for which decisions will be made based on the spatial or temporal boundaries.
scavengers (14.8.5): See collectors.
screening method (6.5.5.3): An economical gross measurement (alpha, beta, gamma) used in atiered approach to method selection that can be applied to analyte concentrations below ananalyte level in the analytical protocol specifications or below a fraction of the specified actionlevel.
secondary (outer) hydration sphere (14.3.1): See hydration sphere.
self absorption (6.4): The absorption of nuclear particle or photon emissions within a matrixduring the counting of a sample by a detector.
sensitivity (2.5.4.2): (1) The ratio of the change in an output to the change in an input. (2) Theterm �sensitivity� is also frequently used as a synonym for �detection capability.� See minimumdetectable concentration.
sensitivity analysis (2.5.4): Identifies the portions of the analytical protocols that potentially havethe most impact on the decision.
sensitivity coefficient (19.4.3): The sensitivity coefficient for an input estimate, xi, used tocalculate an output estimate, y = f(x1,x2,�,xN), is the value of the partial derivative, Mf / Mxi,evaluated at x1, x2, �, xN. The sensitivity coefficient represents the ratio of the change in y to asmall change in xi.

Glossary
( ) Indicates the section in which the term is first used in MARLAP.Italicized words or phrases have their own definitions in this glossary.
MARLAP JULY 2004xlvi
separation factor (14.4.3): In ion-exchange chromatography, the ratio of the distributioncoefficients for two ions determined under identical experimental conditions. Separation factor(α) = Kd,1/Kd,2. The ratio determines the separability of the two ions by an ion-exchange system;separation occurs when α…1.
serial correlation (9.6.4.1): When the characteristic of interest in a sample is more similar to thatof samples adjacent to it than to samples that are further removed, the samples are deemed to becorrelated and are not independent of each other (i.e., there is a serial correlation such thatsamples collected close in time or space have more similar concentrations than those samplesfurther removed.).
sigma (σ) (3A.3): The symbol σ and the term �sigma� are properly used to denote a true standarddeviation. The term �sigma� is sometimes used informally to mean �standard uncertainty,� and�k-sigma� is used to mean an expanded uncertainty calculated using the coverage factor k.
significance level (α) (6A.2): In a hypothesis test, a specified upper limit for the probability of aType I decision error.
smears (10.6.1): See swipes.
solid-phase extraction (SPE) (14.4.5): A solvent extraction system in which one of the liquidphases is made stationary by adsorption onto a solid support. The other phase is mobile (seeextraction chromatography).
solid-phase extraction membrane (14.4.5): A solid-phase extraction system in which theadsorbent material is embedded into a membrane producing an evenly distributed phase, whichreduces the channeling problems associated with columns.
solubility (14.2.1): The maximum amount of a particular solute that can be dissolved in aparticular solvent under specified conditions (a saturated solution) without precipitating.Solubility may be expressed in terms of concentration, molality, mole fraction, etc.
solubility equilibrium (14.8.3.1): The equilibrium that describes a solid dissolving in a solvent toproduce a saturated solution.
solubility-product constant (14.8.3.1): The equilibrium constant (Ksp) for a solid dissolving in asolvent to produce a saturated solution.
Glossary
( ) Indicates the section in which the term is first used in MARLAP.Italicized words or phrases have their own definitions in this glossary.
JULY 2004 MARLAPxlvii
solute (10.3.3.2): The substance that dissolves in a solvent to form a solution. A solute can be asolid, liquid, or gas. In radiochemistry, it is commonly a solid or liquid.
solution (10.2.9): A homogeneous mixture of one substance with another, usually a liquid with agas or solid. The particles of the solute (molecules, atoms, or ions) are discrete and mix withparticles of the solvent at the atomic, ionic, or molecular level.
solvent (10.2.9): The substance that dissolves the solute to form a solution. The solvent can be asolid, liquid, or gas; but in radiochemistry, it is commonly a liquid.
solvent extraction (10.5.4.1): A separation process that selectively removes soluble componentsfrom a mixture with a solvent. The process is based on the solubility of the components of themixture in the solvent when compared to their solubility in the mixture. In liquid-liquidextraction, the process is based on an unequal distribution (partition) of the solute between thetwo immiscible liquids.
source, radioactive (3.3.4): A quantity of material configured for radiation measurement. Seealso calibration source, check source, and test source.
spatial variability (2.5.2.2): The nonuniformity of an analyte concentration over the total area ofa site.
specificity (1.4.9): See method specificity.
spike (1.4.8): See matrix spike.
spillover (15.4.2.1): See crosstalk.
spurious error (18.3.3): A measurement error caused by a human blunder, instrumentmalfunction, or other unexpected or abnormal event.
stability constant (14.3.2): See formation constant.
stakeholder (2.2): Anyone with an interest in the outcome of a project. For a cleanup project,some of the stakeholders could be federal, regional, state, and tribal environmental agencies withregulatory interests (e.g., Nuclear Regulatory Commission or Environmental Protection Agency);states with have direct interest in transportation, storage and disposition of wastes, and a range ofother issues; city and county governments with interest in the operations and safety at sites aswell as economic development and site transition; and site advisory boards, citizens groups,
Glossary
( ) Indicates the section in which the term is first used in MARLAP.Italicized words or phrases have their own definitions in this glossary.
MARLAP JULY 2004xlviii
licensees, special interest groups, and other members of the public with interest in cleanupactivities at the site.
standard deviation (3A.3): The standard deviation of a random variable X, denoted by σX, is ameasure of the width of its distribution, and is defined as the positive square root of the varianceof X.
standard operating procedure (SOP) (4.1): Routine laboratory procedures documented forlaboratory personnel to follow.
standard reference material (SRM) (6A.1): A certified reference material issued by theNational Institute of Standards and Technology (NIST) in the United States. A SRM is certifiedby NIST for specific chemical or physical properties and is issued with a certificate that reportsthe results of the characterization and indicates the intended use of the material.
standard uncertainty (1.4.7): The uncertainty of a measured value expressed as an estimatedstandard deviation, often call a �1-sigma� (1-σ) uncertainty. The standard uncertainty of a valuex is denoted by u(x).
statement of work (SOW) (1.4.11): The part of a request for proposals, contract, or otheragreement that describes the project�s scope, schedule, technical specifications, and performancerequirements for all radioanalytical laboratory services.
stationary phase (14.7.4.1): The phase in a chromatographic system that is not moving withrespect to the mobile phase. The stationary phase can be a solid, a nonvolatile liquid coated ontoan inert matrix, or a substance trapped in an inert matrix.
statistical control (1.4.8): The condition describing a process from which all special causes havebeen removed, evidenced on a control chart by the absence of points beyond the control limitsand by the absence of nonrandom patterns or trends within the control limits. A special cause is asource of variation that is intermittent, unpredictable, or unstable. See control chart, in control,and control limits.
statistical parameter (2.5, Table 2.1): A quantity used in describing the probability distributionof a random variable� (ISO, 1993b).
statistical test (4.6.2.3): A statistical procedure to decide whether a null hypothesis should berejected in favor of the alternative hypothesis or not rejected.� This also can be called ahypothesis test.

Glossary
( ) Indicates the section in which the term is first used in MARLAP.Italicized words or phrases have their own definitions in this glossary.
JULY 2004 MARLAPxlix
subsample (12.3.1.4): (1) A portion of a sample removed for testing. (2) To remove a portion ofa sample for testing.
subsampling factor (19.5.12): As used in MARLAP, a variable, FS, inserted into themathematical model for an analytical measurement to represent the ratio of the analyteconcentration of the subsample to the analyte concentration of the original sample. Thesubsampling factor is always estimated to be 1 but has an uncertainty that contributes to thecombined standard uncertainty of the measured result.
surface adsorption (14.8.3.3, Table 14.12): (1) Adsorption of particles of a substance onto thesurface of another substance. (2) A mechanism of coprecipitation in which ions are adsorbedfrom solution onto the surfaces of precipitated particles.
survey (2.3.2): �An evaluation of the radiological conditions and potential hazards incident to theproduction, use, transfer, release, disposal, or presence of radioactive materials or other sourcesof radiation. When appropriate, such an evaluation includes the a physical survey of the locationof radioactive material and measurements or calculations of levels of radiation, or concentrationsof quantities of radioactive material present� (Shleien, 1992). A survey is a semiquantitativemeasure of the gross radiological conditions of a material or area (for dose and contamination). Ascreen is a qualitative assessment to determine the type of radionuclides (alpha, beta, gamma)and the relative amount (high, medium, low) of each that might be present.
survey unit (2.5.2.4): A geographical area consisting of structures or land areas of specified sizeand shape at a remediated site for which a separate decision will be made whether the unit attainsthe site-specific reference-based cleanup standard for the designated pollution parameter. Surveyunits are generally formed by grouping contiguous site areas with a similar use history and thesame classification of contamination potential. Survey units are established to facilitate thesurvey process and the statistical analysis of survey data. (MARSSIM, 2000)
suspension (10.3.3.2): A mixture in which small particles of a solid, liquid, or gas are dispersedin a liquid or gas. The dispersed particles are larger than colloidal particles and produce anopaque or turbid mixture that will settle on standing by gravity and be retained by paper filters.See colloids and colloidal solution.
swipes (10.6.1): A filter pad used to determine the level of general radioactive contaminationwhen it is wiped over a specific area, about 100 cm2 in area. Also called smears or wipes.
systematic effect (3A.4): Any effect in a measurement process that does not vary randomly whenthe measurement is repeated.

Glossary
( ) Indicates the section in which the term is first used in MARLAP.Italicized words or phrases have their own definitions in this glossary.
MARLAP JULY 2004l
systematic error (3A.4): The mean value that would result from an infinite number of measure-ments of the same measurand carried out under repeatability conditions minus a true value of themeasurand (ISO, 1993a).
systematic planning process (1.4.2): See directed planning process.
target analyte (3.3.1): A radionuclide on the target analyte list. Also called radionuclide ofinterest or �radionuclide of concern.� See analyte.
target analyte list (3.3.1): A list of the radionuclides of concern for the project.
target radionuclide (18.4.1): See radionuclide of interest.
technical evaluation committee (TEC) (5.3.9): A team of technical staff members that assists inthe selection of a contract laboratory by reviewing proposals and by auditing laboratory facilities.
technical proposal (5.5.1.): A document, submitted by a laboratory bidding on a contract, whichaddresses all of the technical and general laboratory requirements within a request for proposalsand statement of work.
temporal trend (2.5, Table 2.1): Effects that time have on the analyte concentration in the matrixor sample. The temporal boundaries describe the time frame the study data will represent (e.g.,possible exposure to local residents over a 30-year period) and when samples should be taken(e.g., instantaneous samples, hourly samples, annual average based on monthly samples, samplesafter rain events).
tests of detection (8.3.1): Tests of detection determine the presence or absence of analytes.Normally, only numerous quality control exceptions and failures in one or more of the tests ofdetection and uncertainty are sufficient reason to reject data.
tests of unusual uncertainty (8.3.1): Part of the validation plan that specifies the level ofmeasurement uncertainty considered unusually high and unacceptable.
test source (14.10.9.7): The final radioanalytical processing product or matrix (e.g., precipitate,solution, filter) that is introduced into a measurement instrument. A test source is prepared fromlaboratory sample material for the purpose of determining its radioactive constituents. Seecalibration source, check source, and source, radioactive.

Glossary
( ) Indicates the section in which the term is first used in MARLAP.Italicized words or phrases have their own definitions in this glossary.
JULY 2004 MARLAPli
thin-layer chromatography (14.7.3): A chromatographic process in which a thin layer of astationary phase in coated onto a solid support such as a plastic or glass plate. The stationarymaterial is an absorbing solid and the mobile phase is a liquid.
tolerable decision error rates (2.3.3): The limits on decision error rates that will be acceptableto the stakeholder/customer.
tolerance limit (18.3.3): A value, that may or may not have a statistical basis, which is used asthe measure of acceptable or unacceptable values. A tolerance limit is sometimes referred to as a�Go/No Go� limit. See warning limit, control chart.
total effective dose equivalent (TEDE) (2.5.2.1): The sum of the effective dose equivalent (forexternal exposure) and the committed effective dose equivalent (for internal exposure). TEDE isexpressed in units of sievert (Sv) or rem (MARSSIM, 2000). See action level, dose equivalent,and total effective dose equivalent.
total propagated uncertainty (TPU) (19.2): See combined standard uncertainty, which is thepreferred term.
traceability (8.5.1.5): �Property of the result of a measurement or the value of a standardwhereby it can be related to stated references, usually national or international standards, throughan unbroken chain of comparisons all having stated uncertainties� (ISO, 1993a).
tracer (1.4.8): See radiotracer.
Type A evaluation (of uncertainty) (19.3.3): �Method of evaluation of uncertainty by thestatistical analysis of series of observations� (ISO, 1995).
Type B evaluation (of uncertainty) (19.3.3): �Method of evaluation of uncertainty by meansother than the statistical analysis of series of observations� (ISO, 1995); any method ofuncertainty evaluation that is not a Type A evaluation.
Type I decision error (2.5.3): In a hypothesis test, the error made by rejecting the null hypothesiswhen it is true. A Type I decision error is sometimes called a �false rejection� or a �falsepositive.�
Type II decision error (2.5.3): In a hypothesis test, the error made by failing to reject the nullhypothesis when it is false. A Type II decision error is sometimes called a �false acceptance� ora �false negative.�
Glossary
( ) Indicates the section in which the term is first used in MARLAP.Italicized words or phrases have their own definitions in this glossary.
MARLAP JULY 2004lii
uncertainty (1.4.7): The term �uncertainty� is used with several shades of meaning in MARLAP.In general it refers to a lack of complete knowledge about something of interest; however, inChapter 19 it usually refers to �uncertainty (of measurement).�
uncertainty (of measurement) (3.3.4): �Parameter, associated with the result of a measurement,that characterizes the dispersion of the values that could reasonably be attributed to themeasurand� (ISO, 1993a).
uncertainty interval (19.3.6): The interval from y ! U to y + U, where y is the measured resultand U is its expanded uncertainty.
uncertainty propagation (19.1): Mathematical technique for combining the standarduncertainties of the input estimates for a mathematical model to obtain the combined standarduncertainty of the output estimate.
uncertainty propagation formula (first-order) (19.4.3): the generalized mathematical equationthat describes how standard uncertainties and covariances of input estimates combine to producethe combined standard uncertainty of an output estimate. When the output estimate is calculatedas y = , where f is a differentiable function of the input estimates x1, x2, �, xN, thef(x1,x2, ...,xN)uncertainty propagation formula may be written as follows:
.u 2c (y) 'j
N
i'1
MfMxi
2
u 2(xi) % 2 jN&1
i'1jN
j' i%1
MfMxi
MfMxj
u(xi,xj)
This formula is derived by approximating the function by a first-order Taylor poly-f(x1,x2, ...,xN)nomial. In the Guide to the Expression of Uncertainty of Measurement, the uncertainty propaga-tion formula is called the �law of propagation of uncertainty� (ISO, 1995).
unsaturated solution (14.8.2): A solution whose concentration of solute is less than that of asaturated solution. The solution contains less solute than the amount of solute will dissolve at thetemperature of the solution, and no solid form of the solute is present.
validation (1.1): See data validation.
validation criterion (2.5.4.2): Specification, derived from the measurement quality objectivesand other analytical requirements, deemed appropriate for evaluating data relative to the project�sanalytical requirements. Addressed in the validation plan.

Glossary
( ) Indicates the section in which the term is first used in MARLAP.Italicized words or phrases have their own definitions in this glossary.
JULY 2004 MARLAPliii
validation flags (1.4.11): Qualifiers that are applied to data that do not meet the acceptancecriteria established to assure data meets the needs of the project. See also data qualifier.
validation plan (2.7.4.2): An integral part of the initial planning process that specifies the datadeliverables and data qualifiers to be assigned that will facilitate the data quality assessment.
variance (9.6.2.3): The variance of a random variable X, denoted by Var(X), , or V(X), isσ2X
defined as E[(X ! µX)2],where µX denotes the mean of X. The variance also equals E(X2) ! µX2.
verification (1.2): See data verification.
volatility (10.3.4.1): The tendency of a liquid or solid to readily become a vapor (evaporates orsublimes) at a given temperature. More volatile substances have higher vapor pressures than lessvolatile substances.
volatilization (10.3.3.2, Table 10.1): A separation method using the volatility of liquids or solidsto isolate them from nonvolatile substances, or to isolate a gas from a liquid.
warning limit (3.3.7.3): Predetermined values plotted on a control chart between the central lineand the control limits, which may be used to give an early indication of possible problems withthe monitored process before they become more significant. The monitored variable willoccasionally fall outside the warning limits even when the process is in control; so, the fact that asingle measurement has exceeded the warning limits is generally not a sufficient reason to takeimmediate corrective action. See tolerance limit.
weight distribution coefficient (14.7.4.1): In ion-exchange chromatography, the ratio of theweight of an ion absorbed on one gram of dry ion-exchange resin to the weight of the ion thatremains in one milliliter of solution after equilibrium has been established. The ratio is a measureof attraction of an ion for a resin. Comparison of the weight distribution coefficient for ions in ananalytical mixture is a reflection of the ability of the ion-exchange process to separate the ions(see separation factor).
Welch-Satterthwaite formula (19C.2): An equation used to calculate the effective degrees offreedom for the combined standard uncertainty of an output estimate when the number ofdegrees of freedom for the standard uncertainty of each input estimate is provided (ISO, 1995).
work plan (1.6.1): The primary and integrating plan document when the data collection activityis a smaller supportive component of a more comprehensive project. The work plan for a siteinvestigation will specify the number of samples to be collected, the location of each sample, and

Glossary
( ) Indicates the section in which the term is first used in MARLAP.Italicized words or phrases have their own definitions in this glossary.
MARLAP JULY 2004liv
the analyses to be performed. A newer concept is to develop a dynamic work plan that specifiesthe decisionmaking logic used to determine where the samples will be collected, when thesampling will stop, and what analyses will be performed, rather than specify the number ofsamples to be collected and the location of each sample.
year: (1) Mean solar or tropical year is 365.2422 days (31,556,296 seconds) and is used forcalculations involving activity and half-life corrections. (2) Calendar year, i.e., 12 months, isusually used in the regulatory sense when determining compliance.
yield (1.6.2): The ratio of the amount of radiotracer or carrier determined in a sample analysis tothe amount of radiotracer or carrier originally added to a sample. The yield is an estimate of theanalyte during analytical processing. It is used as a correction factor to determine the amount ofradionuclide (analyte) originally present in the sample. Yield is typically measured gravi-metrically (via a carrier) or radiometrically (via a radiotracer). Compare with recovery.
Sources
American National Standards Institute (ANSI) N13.30. Performance Criteria for Radiobioassay.1996.
American National Standards Institute (ANSI) N42.23. Measurement and AssociatedInstrumentation Quality Assurance for Radioassay Laboratories. 2003.
U.S. Environmental Protection Agency (EPA). 1980. Upgrading Environmental Radiation Data,Health Physics Society Committee Report HPSR-1, EPA, 520/1-80-012, EPA, Office ofRadiation Programs, Washington, DC.
U.S. Environmental Protection Agency (EPA). 2002. Guidance on Environmental DataVerification and Data Validation (EPA QA/G-8). EPA/240/R-02/004. Office ofEnvironmental Information, Washington, DC. Available at www.epa.gov/quality/qa_docs.html.
International Organization for Standardization (ISO). 1992. Guide 30: Terms and DefinitionsUsed in Connection with Reference Materials. ISO, Geneva, Switzerland.
International Organization for Standardization (ISO). 1993a. International Vocabulary of Basicand General Terms in Metrology. 2nd Edition. ISO, Geneva, Switzerland.

Glossary
( ) Indicates the section in which the term is first used in MARLAP.Italicized words or phrases have their own definitions in this glossary.
JULY 2004 MARLAPlv
International Organization for Standardization (ISO). 1993b. Statistics � Vocabulary andSymbols � Part 1: Probability and General Statistical Terms. ISO 3534-1. ISO, Geneva,Switzerland.
International Organization for Standardization (ISO). 1995. Guide to the Expression of Uncer-tainty in Measurement. ISO, Geneva, Switzerland.
International Organization for Standardization (ISO). 1997. Capability of Detection � Part 1:Terms and Definitions. ISO 11843-1. ISO, Geneva, Switzerland.
International Union of Pure and Applied Chemistry (IUPAC). 1994. �Nomenclature forRadioanalytical Chemistry.� Pure and Applied Chemistry, 66, p. 2513-2526. Available atwww.iupac.org/publications/compendium/R.html.
International Union of Pure and Applied Chemistry (IUPAC). 1995. Nomenclature in Evaluationof Analytical Methods Including Detection and Quantification Capabilities. Pure and AppliedChemistry 67:10, pp. 1699�1723. Available at www.iupac.org/reports/1993/6511uden/index.html.
International Union of Pure and Applied Chemistry (IUPAC). 1997. Compendium of ChemicalTerminology: The Gold Book, Second Edition. A. D. McNaught and A. Wilkinson, eds.Blackwell Science. Available at www.iupac.org/publications/compendium/index.html.
International Union of Pure and Applied Chemistry (IUPAC). 2001. Nomenclature for Isotope,Nuclear and Radioanalytical Techniques (Provisional Draft). Research Triangle Park, NC.Available at www.iupac.org/reports/provisional/abstract01/karol_310801.html.
MARSSIM. 2000. Multi-Agency Radiation Survey and Site Investigation Manual, Revision 1.NUREG-1575 Rev 1, EPA 402-R-97-016 Rev1, DOE/EH-0624 Rev1. August. Availablefrom www.epa.gov/radiation/marssim/.
U.S. Nuclear Regulatory Commission (NRC). 1984. Lower Limit of Detection: Definition andElaboration of a Proposed Position for Radiological Effluent and EnvironmentalMeasurements. NUREG/CR-4007. NRC, Washington, DC.
Shleien, Bernard, ed. 1992. The Health Physics and Radiological Health Handbook. SilverSpring, MD: Scinta Inc.


BIBLIOGRAPHIC DATA SHEET(See instructions on the reverse)
NRC FORM 335(2-89)NRCM 1102,3201, 3202
U.S. NUCLEAR REGULATORY COMMISSION 1. REPORT NUMBER (Assigned by NRC, Add Vol., Supp., Rev., and Addendum Numbers, if any.)
NUREG-1576, Vol. 1EPA 402-B-04-001A
NTIS PB2004-105421
DATE REPORT PUBLISHEDMONTH
JulyYEAR
20044. FIN OR GRANT NUMBER
2. TITLE AND SUBTITLE
Multi-Agency Radiological Laboratory Analytical Protocols Manual (MARLAP),Volume I: Chapters 1-9 and Appendices A-E
5. AUTHOR(S) 6. TYPE OF REPORT
7. PERIOD COVERED (Inclusive Dates)
8. PERFORMING ORGANIZATION - NAME AND ADDRESS (If NRC, provide Division, Office or Region, U.S. Nuclear Regulatory Commission, and mailing address; if contractor,
Department of Defense, Washington, DC 20301-3400 Food and Drug Administration, Rockville, MD 20857
9. SPONSORING ORGANIZATION - NAME AND ADDRESS (If NRC, type "Same as above"; if contractor, provide NRC Division, Office or Region, U.S. Nuclear Regulatory Commission,
Same as above
provide name and mailing address.)
and mailing address.)
10. SUPPLEMENTARY NOTES
Rateb (Boby) Abu-Eid, NRC Project Manager11. ABSTRACT (200 words or less)
The Multi-Agency Radiological Laboratory Analytical Protocols (MARLAP) manual provides guidance for the planning,implementation, and assessment of projects that require the laboratory analysis of radionuclides. MARLAP's goal is to provideguidance for project planners, managers, and laboratory personnel to ensure that radioanalytical laboratory data will meet aproject's or program's data requirements. The manual offers a framework for national consistency in the form of aperformance-based approach for meeting data requirements that is scientifically rigorous and flexible enough to be applied to adiversity of projects and programs. The guidance in MARLAP is designed to help ensure the generation of radioanalytical dataof known quality, appropriate for its intended use. Examples of data collection activities that MARLAP supports include sitecharacterization, site cleanup and compliance demonstration, decommissioning of nuclear facilities, emergency response,remedial and removal actions, effluent monitoring of licensed facilities, environmental site monitoring, background studies, andwaste management activities.
MARLAP is organized into two parts. Part I, Volume 1, is intended for project planners and managers, provides the basicframework of the directed planning process as it applies to projects requiring radioanalytical data for decision making. Part II,Volumes 2 and 3, is intended for laboratory personnel.
12. KEY WORDS/DESCRIPTORS (List words or phrases that will assist researchers in locating the report.)
Multi-Agency Radiological Laboratory Analytical Protocols, MARLAP, radiological , laboratory, laboratory sample, analytical protocols, performance-based approach, planning, measurement, quality assurance, survey(s), decommissioning, statistics, waste management, radioanalytical laboratory services, data validation, data quality assessment, data collection
14. SECURITY CLASSIFICATION
13. AVAILABILITY STATEMENT
unlimited
(This Page)
unclassified(This Report)
unclassified15. NUMBER OF PAGES
16. PRICE
NRC FORM 335 (2-89) This form was electronically produced by Elite Federal Forms, Inc.
3.
Department of Energy, Washington, DC 20585-0119 National Institute of Standards and Technology, Gaithersburg, MD 20899Department of Homeland Security, Washington, DC 20528 Nuclear Regulatory Commission, Washington, DC 20555-0001Environmental Protection Agency, Washington, DC 20460-0001 U.S. Geological Survey, Reston, VA 20192