mujaffarnagar city - national urban health …nuhm.upnrhm.gov.in/urban/pip/muzaffarnagarpip.pdfpage...
TRANSCRIPT
Page | 1
Mujaffarnagar City
Program Implementation Plan
National Urban Health Mission
Prepared by District Health Officials with support from Urban Health Initiative

Page | 2
District Profile
Muzaffarnagar is located at northern part of Uttar Pradesh.The district of Muzaffarnagar forms a portion of
division Saharanpur, andsituated at Ganges, between the districts of Meerut on the South and Saharanpur on the
North. On the east the river Ganges forms the boundary between this district and the Bijnortahsil of the district of
same name and in the west district Shamli.
The population of Muzaffarnagar is 2936073.According to 2011 census, the total population of the district was
enumerated as 41,38,605 of which 19,44,065 are Females and 2,194,540 are Males. The District accounts for about
2.07% of the total population of the state. While one in 4 persons in the District reside in urban areas, it is around two
per ten persons in the State. Muslims constitute around 38 % while Hindus constitute 60 % of the of the Districts
Population. The SC/ST population of the district is 13.51%, which is lower than the State percentage of 21.29 %. The
district comprises of nine blocks namely Khatauli, Jansath, Morna, Purkazi, Baghra, Charthawal,
SadarShahpur&Budhana. Morna&Meghakhri blocks are high in malaria endemicity with API 2.86& 2.2 respectively.
Basic Socioeconomic and Demographic Characteristics
S. No. Characteristics State District
1 Total Population (Census, 2011) Rural Population
199581477 2744920 2276524
2 Population in age group (0-6 yrs) (Census, 2011) Total Male Female
29728235
104598415 94985062
418051
225001 193050
3 Decadal Growth Rate (2001-2011) (Census, 2011)
20.09 16.8
4 Density of population (persons per Sq. Km) (Census, 2011)
828 1033/sqkm
5 Total Literacy Rate (Census, 2011) Male Female
79.24 59.26
79.11 60%
6 Total Number of schools Primary Middle High School
- - -
1180 815 343 22
7 Total school going Total (Males) Total (Females)
- - -
126919 62122 64396
8 Number of Anganwadi centres - 2144
9 Per cent of population Below Poverty Line
10.4%

Page | 3
10 Mean Age at Marriage (DLHS, 2007-08) Male Female % marrying below legal age: Males % marrying below legal age: Females
21.6
43.3 32.9
N.A
14.6
11 Sex Ratios (No. of F/1000 M) Census, 2011) Overall Sex Ratios Child Sex Ratios
908 899
886 858
12 Infant Mortality Rate (AHS, 2010-11) 71 54
13 Neonatal Mortality Rate (2010-11) (AHS, 2010-11)
50 36
14 Under five mortality (AHS, 2010-2011) 94 72
15 Maternal mortality Rate (SRS or State report)
395 337(AHS)
16 Crude Birth Rate (2010-11)( AHS, 2010-11)
25.5 24.2
17 Crude Death Rate (2010-11)(AHS, 2011) 8.6 9
18 Total Fertility Rate (NFHS,3) 3.8 3.5(AHS)
19 Estimated number of pregnant women (2011-2012) (service statistics)
- 73069
20 Estimated number of infants (0-1 yrs) (2011-2012) (Service statistics)
- 65879
Maternal Health Indicators
B Maternal Health Indicators State District
B1 ANC (DLHS, 2007-08)
1 Per cent of women who received complete ANC (3 visits+ at least l TT+100 or more IFA tablets/syrup consumed)
21.9 35.2
2 At least one TT injections received 62.9 72.5
3 Received 100+ IFA tablets/syrup 41.6 N.A
4 percent of women who received ANC during first trimester of pregnancy
25.1 67.5(AHS)
B2 Place and assistance at Delivery (DLHS, 2007-08)
1 Percentage of Institutional Deliveries 24.5 31.2%
2 Percentage of Safe Deliveries (Institutional+ home delivery attended by Doc/ANM/TBA)
30.3 6.9
3 Government Institutional deliveries (2011-12)
- 18074
4 Private Institutional deliveries (2010-11) - -
B3 Pregnancy, Delivery and Post Delivery -
Page | 4
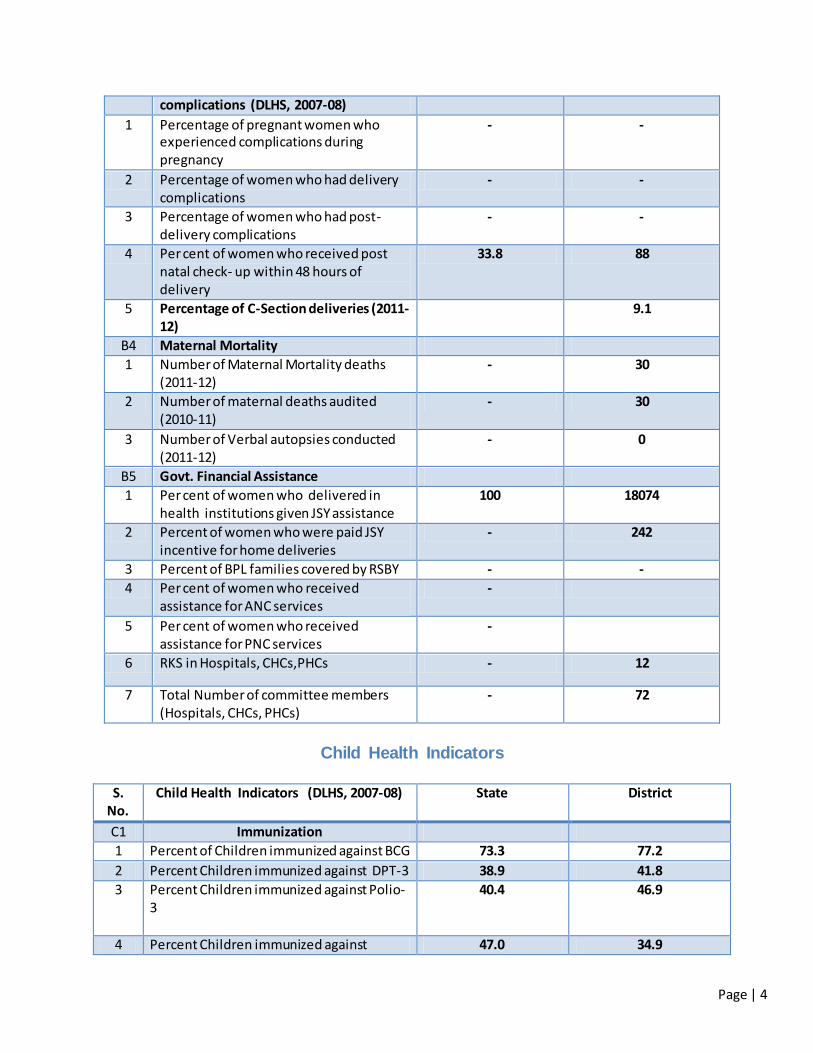
complications (DLHS, 2007-08)
1 Percentage of pregnant women who experienced complications during pregnancy
- -
2 Percentage of women who had delivery complications
- -
3 Percentage of women who had post- delivery complications
- -
4 Per cent of women who received post natal check- up within 48 hours of delivery
33.8 88
5 Percentage of C-Section deliveries (2011-12)
9.1
B4 Maternal Mortality
1 Number of Maternal Mortality deaths (2011-12)
- 30
2 Number of maternal deaths audited (2010-11)
- 30
3 Number of Verbal autopsies conducted (2011-12)
- 0
B5 Govt. Financial Assistance
1 Per cent of women who delivered in health institutions given JSY assistance
100 18074
2 Percent of women who were paid JSY incentive for home deliveries
- 242
3 Percent of BPL families covered by RSBY - -
4 Per cent of women who received assistance for ANC services
-
5 Per cent of women who received assistance for PNC services
-
6 RKS in Hospitals, CHCs,PHCs - 12
7 Total Number of committee members (Hospitals, CHCs, PHCs)
- 72
Child Health Indicators
S.
No. Child Health Indicators (DLHS, 2007-08) State District
C1 Immunization
1 Percent of Children immunized against BCG 73.3 77.2
2 Percent Children immunized against DPT-3 38.9 41.8
3 Percent Children immunized against Polio-3
40.4 46.9
4 Percent Children immunized against 47.0 34.9

Page | 5
Measles
5 Percent Children who received at least one dose of vitamin A
32.2 50.1
6 Percent Children fully immunized. Fully Immunization coverage
30.3 34.9
7 Infant deaths reported (2011-12) - NA
C2 Breast-feeding (DLHS, 2007-08)
1 Children who received Collustrum 15.4 5.1
2 Children exclusively breastfed 19.4 1.9
3 Median duration of breastfeeding 8.2 74.1
C3 Malnutrition (2011-2012)
1 Children with malnutrition (Grade III) - 2018
2 Children with malnutrition (Grade IV) -
C4 Diarrhoea (DLHS, 2007-08) -
1 Percent of children who suffered from diarrhoea
-
2 Given ORS to children during diarrhea - 5.8
C5 ARI (DLHS, 2007-08) -
1 Children who suffered from ARI - 84
2 Children who sought advice/treatment - 84
C6 School Health Programs (2011-12) -
1 Percentage aware of personal hygiene - -
2 Percentage ever received IFA -
3 Percentage ever received TT - -
C7 Adolescent Health program (2011-12) -
1 Percentage aware of personal hygiene 77.0
2 Percentage ever received IFA
3 Percentage aware about FP 79.8 N.A
4 Percentage aware of RTI/STI 30.0 N.A
Public Health Infrastructure in the Districts Index Status
District Hospital 01
District Women Hospital 01
District PPC 0
Tehsil PPCs 2
CHC (Block level) 1
CHC (Non Block) 1
B HPC 8
Addl./New PHCs (Total)
Govt. Accommodation 37
Other Govt. Accomodation 0
Private Accommodation 0
Sub-Centres (Total) 286

Page | 6
Govt. Accommodation 227
Private Accommodation 59
First Referral Units (FRU) 2
24x7 Units 10
Accredited Sub-Centres (JSY) 41
RogiKalyan Samiti (RKS) 12
VHSC 457
Urban Family Welfare Centres 0
Urban Health Posts 1
ASHA ( 5th Phase training) 1127
MUZAFFARNAGAR -MAP

Page | 7
CITY PROFILE
Name of The City: Muzaffarnagar
Status of the City: District Headquarter
Table 1: Demographic Profile (Based on 2011 census)
Total Population of city (in lakhs) 3.92768
Slum Population (in lakhs) 115000
Slum Population as percentage of urban population 29%
Number of Notified Slums 31
Number of slums not notified 0
No. of Slum Households 18975
No. of slums covered under slum improvement programme (BSUP,IDSMT,etc.)
31
Number of slums where households have individual water connections* 31
Number of slums connected to sewerage network* 0
Number of slums having a Primary school 26
No. of slums having AWC 31
No. of slums having primary health care facility 15
Page | 8
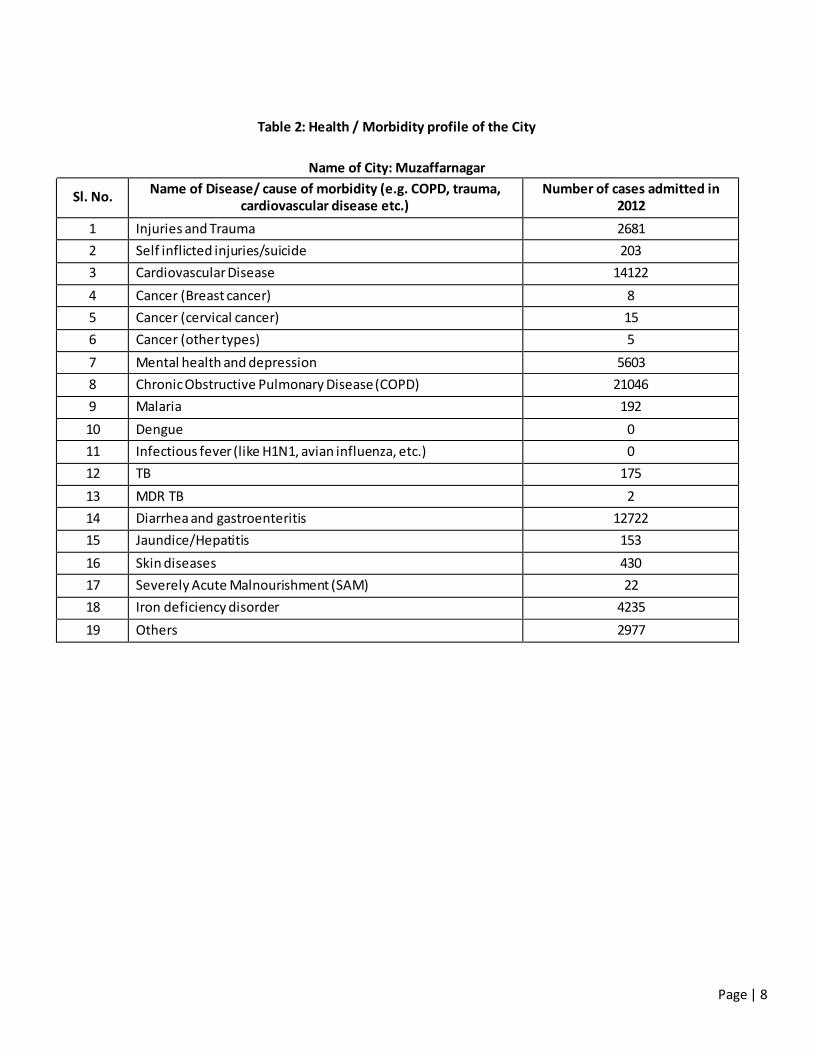
Table 2: Health / Morbidity profile of the City
Name of City: Muzaffarnagar
Sl. No. Name of Disease/ cause of morbidity (e.g. COPD, trauma,
cardiovascular disease etc.) Number of cases admitted in
2012
1 Injuries and Trauma 2681
2 Self inflicted injuries/suicide 203
3 Cardiovascular Disease 14122
4 Cancer (Breast cancer) 8
5 Cancer (cervical cancer) 15
6 Cancer (other types) 5
7 Mental health and depression 5603
8 Chronic Obstructive Pulmonary Disease (COPD) 21046
9 Malaria 192
10 Dengue 0
11 Infectious fever (like H1N1, avian influenza, etc.) 0
12 TB 175
13 MDR TB 2
14 Diarrhea and gastroenteritis 12722
15 Jaundice/Hepatitis 153
16 Skin diseases 430
17 Severely Acute Malnourishment (SAM) 22
18 Iron deficiency disorder 4235
19 Others 2977
Page | 9
Quality
of
housing
Quality of
sanitation
(kutcha/
pucca/mi
xed)
(IHL,commu
nity toilets,
OD)
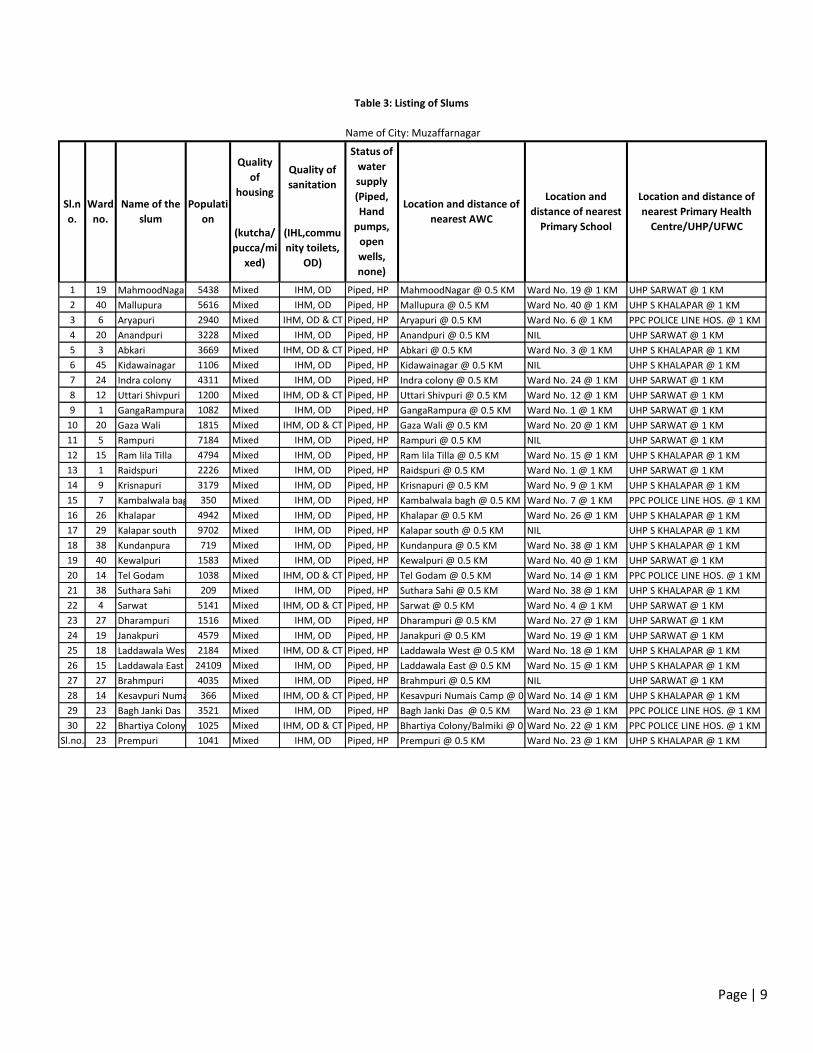
1 19 MahmoodNagar 5438 Mixed IHM, OD Piped, HP MahmoodNagar @ 0.5 KM Ward No. 19 @ 1 KM UHP SARWAT @ 1 KM
2 40 Mallupura 5616 Mixed IHM, OD Piped, HP Mallupura @ 0.5 KM Ward No. 40 @ 1 KM UHP S KHALAPAR @ 1 KM
3 6 Aryapuri 2940 Mixed IHM, OD & CT Piped, HP Aryapuri @ 0.5 KM Ward No. 6 @ 1 KM PPC POLICE LINE HOS. @ 1 KM
4 20 Anandpuri 3228 Mixed IHM, OD Piped, HP Anandpuri @ 0.5 KM NIL UHP SARWAT @ 1 KM
5 3 Abkari 3669 Mixed IHM, OD & CT Piped, HP Abkari @ 0.5 KM Ward No. 3 @ 1 KM UHP S KHALAPAR @ 1 KM
6 45 Kidawainagar 1106 Mixed IHM, OD Piped, HP Kidawainagar @ 0.5 KM NIL UHP S KHALAPAR @ 1 KM
7 24 Indra colony 4311 Mixed IHM, OD Piped, HP Indra colony @ 0.5 KM Ward No. 24 @ 1 KM UHP SARWAT @ 1 KM
8 12 Uttari Shivpuri 1200 Mixed IHM, OD & CT Piped, HP Uttari Shivpuri @ 0.5 KM Ward No. 12 @ 1 KM UHP SARWAT @ 1 KM
9 1 GangaRampura 1082 Mixed IHM, OD Piped, HP GangaRampura @ 0.5 KM Ward No. 1 @ 1 KM UHP SARWAT @ 1 KM
10 20 Gaza Wali 1815 Mixed IHM, OD & CT Piped, HP Gaza Wali @ 0.5 KM Ward No. 20 @ 1 KM UHP SARWAT @ 1 KM
11 5 Rampuri 7184 Mixed IHM, OD Piped, HP Rampuri @ 0.5 KM NIL UHP SARWAT @ 1 KM
12 15 Ram lila Tilla 4794 Mixed IHM, OD Piped, HP Ram lila Tilla @ 0.5 KM Ward No. 15 @ 1 KM UHP S KHALAPAR @ 1 KM
13 1 Raidspuri 2226 Mixed IHM, OD Piped, HP Raidspuri @ 0.5 KM Ward No. 1 @ 1 KM UHP SARWAT @ 1 KM
14 9 Krisnapuri 3179 Mixed IHM, OD Piped, HP Krisnapuri @ 0.5 KM Ward No. 9 @ 1 KM UHP S KHALAPAR @ 1 KM
15 7 Kambalwala bagh 350 Mixed IHM, OD Piped, HP Kambalwala bagh @ 0.5 KM Ward No. 7 @ 1 KM PPC POLICE LINE HOS. @ 1 KM
16 26 Khalapar 4942 Mixed IHM, OD Piped, HP Khalapar @ 0.5 KM Ward No. 26 @ 1 KM UHP S KHALAPAR @ 1 KM
17 29 Kalapar south 9702 Mixed IHM, OD Piped, HP Kalapar south @ 0.5 KM NIL UHP S KHALAPAR @ 1 KM
18 38 Kundanpura 719 Mixed IHM, OD Piped, HP Kundanpura @ 0.5 KM Ward No. 38 @ 1 KM UHP S KHALAPAR @ 1 KM
19 40 Kewalpuri 1583 Mixed IHM, OD Piped, HP Kewalpuri @ 0.5 KM Ward No. 40 @ 1 KM UHP SARWAT @ 1 KM
20 14 Tel Godam 1038 Mixed IHM, OD & CT Piped, HP Tel Godam @ 0.5 KM Ward No. 14 @ 1 KM PPC POLICE LINE HOS. @ 1 KM
21 38 Suthara Sahi 209 Mixed IHM, OD Piped, HP Suthara Sahi @ 0.5 KM Ward No. 38 @ 1 KM UHP S KHALAPAR @ 1 KM
22 4 Sarwat 5141 Mixed IHM, OD & CT Piped, HP Sarwat @ 0.5 KM Ward No. 4 @ 1 KM UHP SARWAT @ 1 KM
23 27 Dharampuri 1516 Mixed IHM, OD Piped, HP Dharampuri @ 0.5 KM Ward No. 27 @ 1 KM UHP SARWAT @ 1 KM
24 19 Janakpuri 4579 Mixed IHM, OD Piped, HP Janakpuri @ 0.5 KM Ward No. 19 @ 1 KM UHP SARWAT @ 1 KM
25 18 Laddawala West 2184 Mixed IHM, OD & CT Piped, HP Laddawala West @ 0.5 KM Ward No. 18 @ 1 KM UHP S KHALAPAR @ 1 KM
26 15 Laddawala East 24109 Mixed IHM, OD Piped, HP Laddawala East @ 0.5 KM Ward No. 15 @ 1 KM UHP S KHALAPAR @ 1 KM
27 27 Brahmpuri 4035 Mixed IHM, OD Piped, HP Brahmpuri @ 0.5 KM NIL UHP SARWAT @ 1 KM
28 14 Kesavpuri Numais Camp366 Mixed IHM, OD & CT Piped, HP Kesavpuri Numais Camp @ 0.5 KMWard No. 14 @ 1 KM UHP S KHALAPAR @ 1 KM
29 23 Bagh Janki Das 3521 Mixed IHM, OD Piped, HP Bagh Janki Das @ 0.5 KM Ward No. 23 @ 1 KM PPC POLICE LINE HOS. @ 1 KM
30 22 Bhartiya Colony/Balmiki1025 Mixed IHM, OD & CT Piped, HP Bhartiya Colony/Balmiki @ 0.5 KMWard No. 22 @ 1 KM PPC POLICE LINE HOS. @ 1 KM
Sl.no. 23 Prempuri 1041 Mixed IHM, OD Piped, HP Prempuri @ 0.5 KM Ward No. 23 @ 1 KM UHP S KHALAPAR @ 1 KM
Table 3: Listing of Slums
Name of City: Muzaffarnagar
Location and
distance of nearest
Primary School
Location and distance of
nearest Primary Health
Centre/UHP/UFWC
Sl.n
o.
Ward
no.
Name of the
slum
Populati
on
Status of
water
supply
(Piped,
Hand
pumps,
open
wells,
none)
Location and distance of
nearest AWC
Page | 10
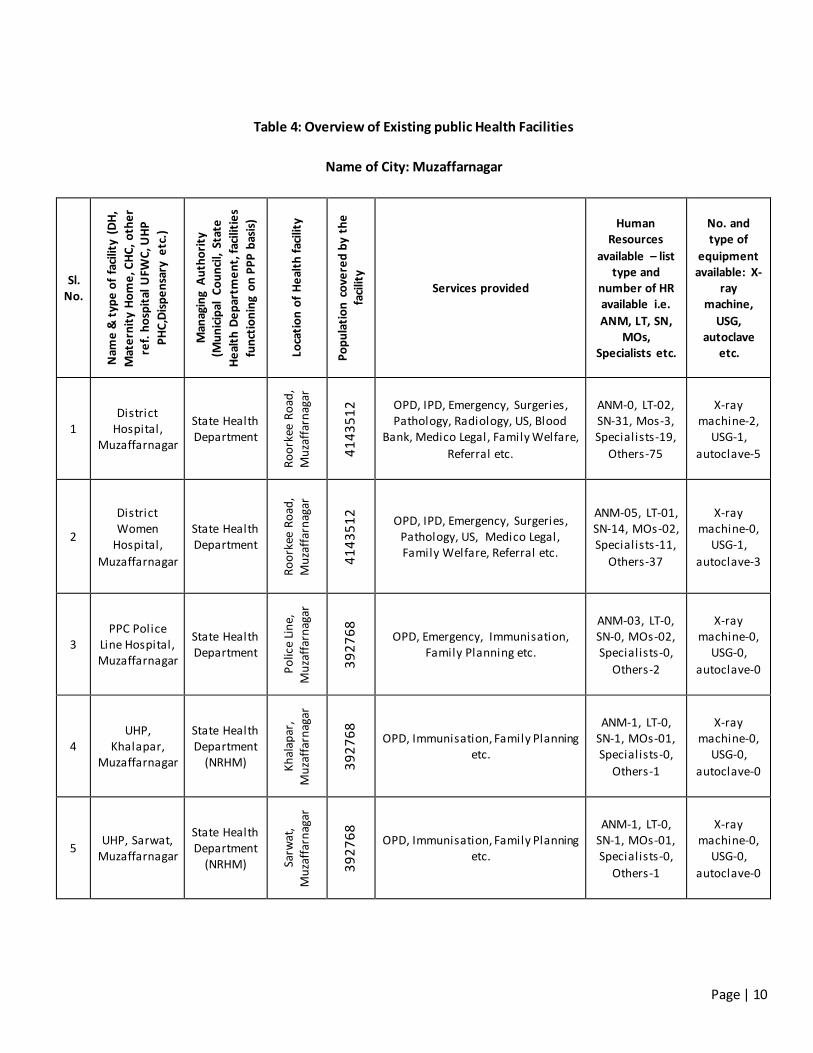
Table 4: Overview of Existing public Health Facilities
Name of City: Muzaffarnagar
Sl. No.
Nam
e &
typ
e o
f fa
cilit
y (D
H,
Mat
ern
ity
Ho
me
, CH
C,
oth
er
ref.
ho
spit
al U
FWC
, UH
P
PH
C,D
isp
en
sary
etc
.)
Man
agin
g A
uth
ori
ty
(Mu
nic
ipal
Co
un
cil,
Stat
e
He
alth
De
par
tme
nt,
fac
iliti
es
fun
ctio
nin
g o
n P
PP
bas
is)
Loca
tio
n o
f H
eal
th f
acili
ty
Po
pu
lati
on
co
vere
d b
y th
e
faci
lity
Services provided
Human Resources
available – list type and
number of HR available i.e.
ANM, LT, SN, MOs,
Specialists etc.
No. and type of
equipment available: X-
ray machine,
USG, autoclave
etc.
1 District
Hospital, Muzaffarnagar
State Health Department
Ro
ork
ee R
oad
, M
uza
ffar
nag
ar
41
43
51
2
OPD, IPD, Emergency, Surgeries, Pathology, Radiology, US, Blood
Bank, Medico Legal, Family Welfare,
Referral etc.
ANM-0, LT-02, SN-31, Mos-3, Specialists-19,
Others-75
X-ray machine-2,
USG-1,
autoclave-5
2
District Women
Hospital,
Muzaffarnagar
State Health Department
Ro
ork
ee R
oad
, M
uza
ffar
nag
ar
41
43
51
2
OPD, IPD, Emergency, Surgeries, Pathology, US, Medico Legal, Family Welfare, Referral etc.
ANM-05, LT-01, SN-14, MOs-02, Specialists-11,
Others-37
X-ray machine-0,
USG-1,
autoclave-3
3 PPC Police
Line Hospital, Muzaffarnagar
State Health Department
Po
lice
Lin
e,
Mu
zaff
arn
agar
39
27
68
OPD, Emergency, Immunisation, Family Planning etc.
ANM-03, LT-0, SN-0, MOs-02, Specialists-0,
Others-2
X-ray machine-0,
USG-0,
autoclave-0
4 UHP,
Khalapar, Muzaffarnagar
State Health Department
(NRHM) Kh
alap
ar,
Mu
zaff
arn
agar
39
27
68
OPD, Immunisation, Family Planning etc.
ANM-1, LT-0, SN-1, MOs-01, Specialists-0,
Others-1
X-ray machine-0,
USG-0,
autoclave-0
5 UHP, Sarwat,
Muzaffarnagar
State Health Department
(NRHM) Sarw
at,
Mu
zaff
arn
agar
39
27
68
OPD, Immunisation, Family Planning etc.
ANM-1, LT-0, SN-1, MOs-01, Specialists-0,
Others-1
X-ray machine-0,
USG-0,
autoclave-0

Page | 11
City Level Indicators and Targets
Name of City: Muzaffarnagar
Processes & Inputs
Indicators Baseline
(as applicable)
Number Proposed
(2013-14)
Number
Achieved
(2013-14)
Community Processes
1. Number of Mahila Arogya Samiti (MAS) formed * 0 114
2. Number of MAS members trained * 0 1140
3. Number of Accredited Social Health Activists (ASHAs) selected and trained *
0 57
Health Systems 0
4. Number of ANMs recruited * 0 40
5. No. of Special Outreach health camps organized in the slum/HFAs * 0 40
6. No. of UHNDs organized in the slums and vulnerable areas * 0 115
7. Number of UPHCs made operational * 0 8
8. Number of UCHCs made operational * 0 0
9. No. of RKS created at UPHC and UCHC * 0 8
10. OPD attendance in the UPHCs 0 0
11. No. of deliveries conducted in public health facilities 0 0
RCH Services 0 0
12. ANC early registration in first trimester 0 2750
13. Number of women who had ANC check-up in their first trimester of pregnancy
2750
14. TT (2nd dose) coverage among pregnant women
2750
15. No. of children fully immunised (through public health facilities)
2500
16. No. of Severely Acute Malnourished (SAM) children identified and referred for treatment
11
Communicable Diseases
17. No. of malaria cases detected through blood examination
100
18. No. of TB cases identified through chest symptomatic
72
19. No. of suspected TB cases referred for sputum examination
720
20. No. of MDR-TB cases put under DOTS-plus
2
Non Communicable Diseases
21. No. of Diabetes cases screened in the city
1400
22. No. of Cancer cases screened in the city
15
23. No. of Hypertension cases screened in the city
2800

Page | 12
CITY PROFILE
Name of The City: Khatauli
Status of the City: Tehsil Head Quarter District-Muzaffarnagar
Table 1: Demographic Profile (Based on 2011 census)
Total Population of city (in lakhs) 0.72949
Slum Population (in lakhs) 0.20000
Slum Population as percentage of urban population 27%
Number of Notified Slums 22
Number of slums not notified 0
No. of Slum Households 3232
No. of slums covered under slum improvement programme (BSUP,IDSMT,etc.)
22
Number of slums where households have individual water connections* 22
Number of slums connected to sewerage network* 0
Number of slums having a Primary school 14
No. of slums having AWC 0
No. of slums having primary health care facility 13

Page | 13
Table 2: Health / Morbidity profile of the City
Name of City: Khatauli
Sl. No. Name of Disease/ cause of morbidity (e.g. COPD, trauma,
cardiovascular disease etc.) Number of cases admitted in 2012
1 Injuries and Trauma 1172
2 Self inflicted injuries/suicide 63
3 Cardiovascular Disease 2826
4 Cancer (Breast cancer) 2
5 Cancer (cervical cancer) 3
6 Cancer (other types) 1
7 Mental health and depression 1121
8 Chronic Obstructive Pulmonary Disease (COPD) 4322
9 Malaria 39
10 Dengue 0
11 Infectious fever (like H1N1, avian influenza, etc.) 0
12 TB 33
13 MDR TB 0
14 Diarrhea and gastroenteritis 2515
15 Jaundice/Hepatitis 29
16 Skin diseases 88
17 Severely Acute Malnourishment (SAM) 71
18 Iron deficiency disorder 813
19 Others 598

Page | 14
Quality of
housing
Quality of
sanitation
(kutcha/p
ucca/mixe
d)
(IHL,comm
unity
toilets,
OD)
1 18 MutFariq 1899 Mixed IHM, OD Piped, HP N.A. NILL CHC KHATAULI @ 1 KM
2 25 Mittulala Purvi 1639 Mixed IHM, OD Piped, HP N.A. Ward No. 25 @ 1 KMCHC KHATAULI @ 1 KM
3 20 Islamnagar 1029 Mixed IHM, OD Piped, HP N.A. Ward No. 20 @ 1 KMCHC KHATAULI @ 1 KM
4 4 Sahampuri west 1086 Mixed IHM, OD Piped, HP N.A. Ward No. 4 @ 1 KMCHC KHATAULI @ 1 KM
5 5 Pakka Bagh 1151 Mixed IHM, OD Piped, HP N.A. Ward No. 5 @ 1 KMCHC KHATAULI @ 1 KM
6 19 Kajyan East 358 Mixed IHM, OD Piped, HP N.A. Ward No. 19 @ 1 KMCHC KHATAULI @ 1 KM
7 6 KashiRam 107 Mixed IHM, OD Piped, HP N.A. Ward No. 6 @ 1 KMCHC KHATAULI @ 1 KM
8 6 Tagayan North 624 Mixed IHM, OD Piped, HP N.A. Ward No. 6 @ 1 KMCHC KHATAULI @ 1 KM
9 21 Sarafan South 1961 Mixed IHM, OD Piped, HP N.A. Ward No. 21 @ 1 KMCHC KHATAULI @ 1 KM
10 15 Sarafan East 350 Mixed IHM, OD Piped, HP N.A. Ward No. 15 @ 1 KMCHC KHATAULI @ 1 KM
11 2 Sarafat Colony 843 Mixed IHM, OD Piped, HP N.A. Ward No. 2 @ 1 KMCHC KHATAULI @ 1 KM
12 3 Saini nagar 596 Mixed IHM, OD Piped, HP N.A. NILL CHC KHATAULI @ 1 KM
13 18 Sahamouri Mustfari 133 Mixed IHM, OD Piped, HP N.A. NILL CHC KHATAULI @ 1 KM
14 12 Nayi Basti South 1069 Mixed IHM, OD Piped, HP N.A. NILL CHC KHATAULI @ 1 KM
15 1 Devidas 1432 Mixed IHM, OD Piped, HP N.A. NILL CHC KHATAULI @ 1 KM
16 2 Devidas East 409 Mixed IHM, OD Piped, HP N.A. Ward No. 2 @ 1 KMCHC KHATAULI @ 1 KM
17 9 Jumma Peeth 58 Mixed IHM, OD Piped, HP N.A. Ward No. 9 @ 1 KMCHC KHATAULI @ 1 KM
18 16 Jainnagar 361 Mixed IHM, OD Piped, HP N.A. Ward No. 16 @ 1 KMCHC KHATAULI @ 1 KM
19 7 Lal Mohd.. 1359 Mixed IHM, OD Piped, HP N.A. Ward No. 7 @ 1 KMCHC KHATAULI @ 1 KM
20 8 Nayi Abadi 813 Mixed IHM, OD Piped, HP N.A. NILL CHC KHATAULI @ 1 KM
21 11 Nayi Basti 187 Mixed IHM, OD Piped, HP N.A. NILL CHC KHATAULI @ 1 KM
22 23 Balak Ram 1926 Mixed IHM, OD Piped, HP N.A. NILL CHC KHATAULI @ 1 KM
Table 3: Listing of Slums
Name of City: Khatauli
Location
and
distance
of nearest
Primary
School
Location and distance of
nearest Primary Health
Centre/UHP/UFWC
Sl.n
o.
Ward
no.
Name of the
slum
Populat
ion
Status of
water
supply
(Piped,
Hand
pumps,
open
wells,
none)
Locati
on and
distan
ce of
neares
t AWC

Page | 15
Table 4: Overview of Existing public Health Facilities
Name of City: Khatauli
Sl.
No.
Name & type of facility (DH,
Maternity Home, CHC,
other ref. hospital
UFWC, UHP PHC,Dispensar
y etc.)
Managing Authority (Municipal
Council, State
Health Departmen
t, facilities functioning
on PPP basis)
Locatio
n of Health
facility
Populatio
n covered by the
facility
Services provided
Human Resources
available – list type and
number of HR available
i.e. ANM, LT, SN, MOs,
Specialists etc.
No. and type of equipment
available: X-ray machine,
USG, autoclave etc.
1 Community
Health Centre, Khatauli
State Health Department
Roorkee Road, Khatauli
433910
OPD, IPD, Emergency, Surgeries, Pathology, Radiology, US, Medico
Legal, Family Welfare,
Referral etc.
ANM-02, LT-01, SN-01,
MOs-3, Specialists-
02, Others-10
X-ray machine-1, USG-1,
autoclave-2

Page | 16
City Level Indicators and Targets
Name of City: Khatauli
Processes & Inputs
Indicators Baseline
(as applicable)
Number Proposed
(2013-14)
Number
Achieved
(2013-14)
Community Processes
1. Number of Mahila Arogya Samiti (MAS) formed *
20
2. Number of MAS members trained *
200
3. Number of Accredited Social Health Activists (ASHAs) selected and trained *
10
Health Systems
4. Number of ANMs recruited *
5
5. No. of Special Outreach health camps organized in the slum/HFAs *
8
6. No. of UHNDs organized in the slums and vulnerable areas *
20
7. Number of UPHCs made operational *
1
8. Number of UCHCs made operational *
0
9. No. of RKS created at UPHC and UCHC *
1
10. OPD attendance in the UPHCs
0
11. No. of deliveries conducted in public health facilities
550
RCH Services
12. ANC early registration in first trimester 2160 1080
13. Number of women who had ANC check-up in their first trimester of pregnancy
2160 1080
14. TT (2nd dose) coverage among pregnant women 2160 1080
15. No. of children fully immunised (through public health facilities) 1960 980
16. No. of Severely Acute Malnourished (SAM) children identified and referred for treatment
14 7
Communicable Diseases
17. No. of malaria cases detected through blood examination 40 15
18. No. of TB cases identified through chest symptomatic 28 14
19. No. of suspected TB cases referred for sputum examination 280 140
20. No. of MDR-TB cases put under DOTS-plus 0 0
Non Communicable Diseases
21. No. of Diabetes cases screened in the city 565 283
22. No. of Cancer cases screened in the city 6 3
23. No. of Hypertension cases screened in the city 1120 560

Page | 17
CITY PROFILE
Name of The City: Budhana
Status of the City: Tehsil Head Quarter District-Muzaffarnagar
Table 1: Demographic Profile (Based on 2011 census)
Total Population of city (in lakhs) 0.53722
Slum Population (in lakhs) 0.10500
Slum Population as percentage of urban population 19%
Number of Notified Slums 10
Number of slums not notified 0
No. of Slum Households 1688
No. of slums covered under slum improvement programme (BSUP,IDSMT,etc.) 10
Number of slums where households have individual water connections* 10
Number of slums connected to sewerage network* 0
Number of slums having a Primary school 4
No. of slums having AWC 0
No. of slums having primary health care facility 7

Page | 18
Table 2: Health / Morbidity profile of the City
Name of City: Budhana
Sl. No. Name of Disease/ cause of morbidity (e.g. COPD, trauma,
cardiovascular disease etc.) Number of cases admitted
in 2012
1 Injuries and Trauma 682
2 Self inflicted injuries/suicide 41
3 Cardiovascular Disease 1811
4 Cancer (Breast cancer) 0
5 Cancer (cervical cancer) 1
6 Cancer (other types) 0
7 Mental health and depression 753
8 Chronic Obstructive Pulmonary Disease (COPD) 2865
9 Malaria 29
10 Dengue 0
11 Infectious fever (like H1N1, avian influenza, etc.) 0
12 TB 21
13 MDR TB 0
14 Diarrhea and gastroenteritis 1683
15 Jaundice/Hepatitis 20
16 Skin diseases 59
17 Severely Acute Malnourishment (SAM) 47
18 Iron deficiency disorder 542
19 Others 403

Page | 19
Quality
of
housing
Quality of
sanitation
(kutcha/
pucca/mi
xed)
(IHL,com
munity
toilets,
OD)
1 2 Mandi 597 Mixed IHM, OD Piped, HP N.A. Ward No. 2 @ 1 KM PHC BUDHANA @ 1 KM
2 6 Pachhala West 2551 Mixed IHM, OD Piped, HP N.A. Ward No. 6 @ 1 KM PHC BUDHANA @ 1 KM
3 8 Pachhala East 1799 Mixed IHM, OD Piped, HP N.A. Ward No. 8 @ 1 KM PHC BUDHANA @ 1 KM
4 10 Kaziwada South 191 Mixed IHM, OD Piped, HP N.A. NILL PHC BUDHANA @ 1 KM
5 2 Khakhrowana 656 Mixed IHM, OD Piped, HP N.A. NILL PHC BUDHANA @ 1 KM
6 17 Shahbaz 469 Mixed IHM, OD Piped, HP N.A. NILL PHC BUDHANA @ 1 KM
7 17 Shahibada 92 Mixed IHM, OD Piped, HP N.A. NILL PHC BUDHANA @ 1 KM
8 1 Chamaran 87 Mixed IHM, OD Piped, HP N.A. Ward No. 1 @ 1 KM PHC BUDHANA @ 1 KM
9 13 Nai Basti 175 Mixed IHM, OD Piped, HP N.A. NILL PHC BUDHANA @ 1 KM
10 11 Bhatwada South 3509 Mixed IHM, OD Piped, HP N.A. NILL PHC BUDHANA @ 1 KM
Table 3: Listing of Slums
Name of City: Budhana
Location and
distance of nearest
Primary School
Location and distance of
nearest Primary Health
Centre/UHP/UFWC
Sl.
no
.
Ward
no.
Name of the
slum
Popula
tion
Status of
water
supply
(Piped,
Hand
pumps,
open wells,
none)
Locati
on
and
distan
ce of
neare
st
AWC

Page | 20
Sl.
No.
Name & type of
facility (DH,
Maternity Home,
CHC, other ref.
hospital UFWC,
UHP
PHC,Dispensary
etc.)
Managing
Authority
(Municipal
Council, State
Health
Department,
facilities
functioning on
PPP basis)
Location
of Health
facility
Populati
on
covered
by the
facility
Services
provided
Human Resources
available – list type
and number of HR
available i.e. ANM,
LT, SN, MOs,
Specialists etc.
No. and type of
equipment
available: X-ray
machine, USG,
autoclave etc.
1Primary Health
Centre, Budhana
State Health
Department
Kandhla
Road,
Budhana
443529
OPD, IPD,
Emergency,
Pathology,
Radiology,
Medico Legal,
Family
Welfare,
Referral etc.
ANM-02, LT-02, SN-
01, MOs-2, Specialists-
02, Others-10
X-ray machine-0,
USG-0, autoclave-
1
Table 4: Overview of Existing public Health Facilities
Name of City: Budhana
Page | 21
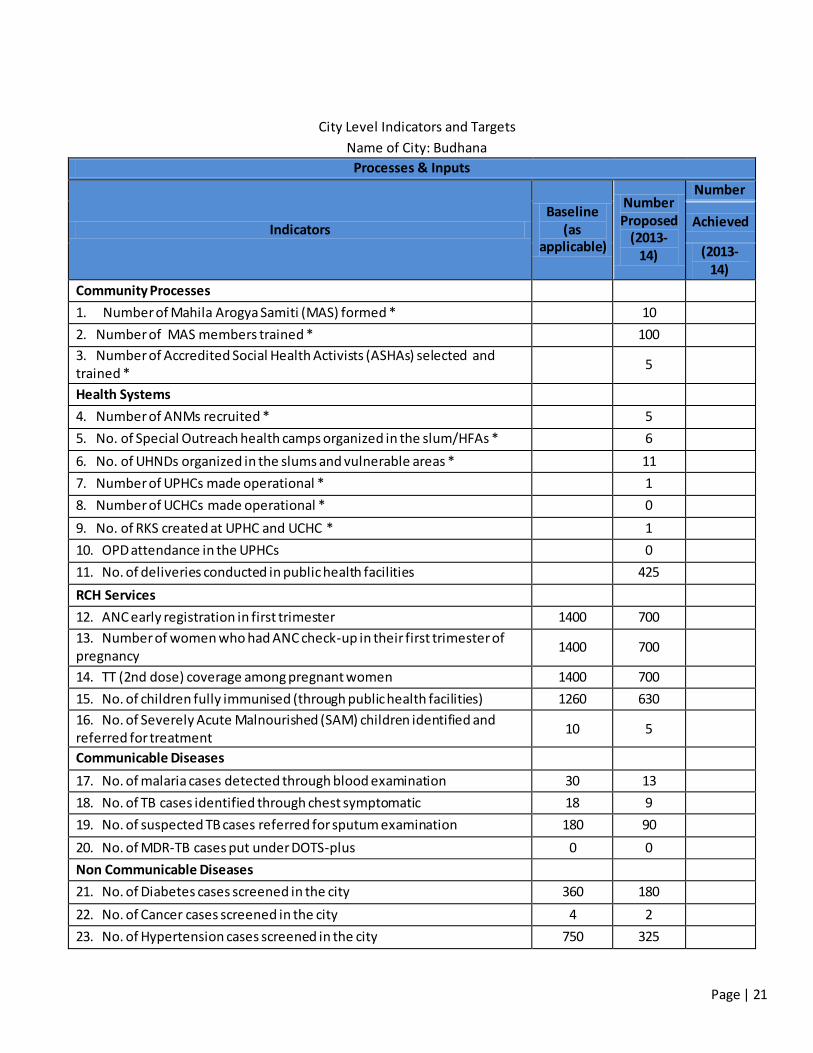
City Level Indicators and Targets Name of City: Budhana Processes & Inputs
Indicators Baseline
(as applicable)
Number Proposed
(2013-14)
Number
Achieved
(2013-14)
Community Processes
1. Number of Mahila Arogya Samiti (MAS) formed *
10
2. Number of MAS members trained *
100
3. Number of Accredited Social Health Activists (ASHAs) selected and trained *
5
Health Systems
4. Number of ANMs recruited *
5
5. No. of Special Outreach health camps organized in the slum/HFAs *
6
6. No. of UHNDs organized in the slums and vulnerable areas *
11
7. Number of UPHCs made operational *
1
8. Number of UCHCs made operational *
0
9. No. of RKS created at UPHC and UCHC *
1
10. OPD attendance in the UPHCs
0
11. No. of deliveries conducted in public health facilities
425
RCH Services
12. ANC early registration in first trimester 1400 700
13. Number of women who had ANC check-up in their first trimester of pregnancy
1400 700
14. TT (2nd dose) coverage among pregnant women 1400 700
15. No. of children fully immunised (through public health facilities) 1260 630
16. No. of Severely Acute Malnourished (SAM) children identified and referred for treatment
10 5
Communicable Diseases
17. No. of malaria cases detected through blood examination 30 13
18. No. of TB cases identified through chest symptomatic 18 9
19. No. of suspected TB cases referred for sputum examination 180 90
20. No. of MDR-TB cases put under DOTS-plus 0 0
Non Communicable Diseases
21. No. of Diabetes cases screened in the city 360 180
22. No. of Cancer cases screened in the city 4 2
23. No. of Hypertension cases screened in the city 750 325

Page | 22