mt todd gold project surface water assessment - hydrology · mt todd gold project surface water...
TRANSCRIPT
Vista Gold Australia Pty Ltd
Mt Todd Gold Project
Surface Water Assessment - Hydrology
May 2013

Mt Todd Gold Project Surface Water Assessment - Hydrology
This Mine Site Surface Water Assessment - Hydrology Study (“Report”):
1. has been prepared by GHD Australia Pty Ltd] (“GHD”) for Vista Gold Australia Pty Ltd;
2. may only be used and relied on by Vista Gold Australia Pty Ltd;
3. must not be copied to, used by, or relied on by any person other than Vista Gold Australia Pty Ltd without the prior written consent of GHD;
4. may only be used for the purpose of the Mt Todd Gold Project.
GHD and its servants, employees and officers otherwise expressly disclaim responsibility to any person other than Vista Gold Australia Pty Ltd arising from or in connection with this Report.
To the maximum extent permitted by law, all implied warranties and conditions in relation to the services provided by GHD and the Report are excluded unless they are expressly stated to apply in this Report.
The services undertaken by GHD in connection with preparing this Report:
were limited to those specifically detailed in this Report;
did not include GHD undertaking any site visits.
The opinions, conclusions and any recommendations in this Report are based on assumptions made by GHD when undertaking services and preparing the Report (“Assumptions”), including (but not limited to):
GoldSim Water Balance model provided by Tetra Tech.
GHD expressly disclaims responsibility for any error in, or omission from, this Report arising from or in connection with any of the Assumptions being incorrect.
Subject to the paragraphs in this section of the Report, the opinions, conclusions and any recommendations in this Report are based on conditions encountered and information reviewed at the time of preparation and may be relied on until 6 months, after which time, GHD expressly disclaims responsibility for any error in, or omission from, this Report arising from or in connection with those opinions, conclusions and any recommendations.

Mt Todd Gold Project
Surface Water Assessment - Hydrology
Contents
Executive Summary i
1. Introduction 1
1.1 Overview 1
1.2 Key Elements of the Project 2
2. Water Containment 4
2.1 Infrastructure 4
2.2 Climate 9
2.3 Surface Runoff 10
2.4 Seepage 11
2.5 Tailings Reclaim Water 12
2.6 Water Demands 13
2.7 Water Balance Modelling 14
2.8 Summary of Water Balance Results 19
2.9 Summary 26
3. Stormwater Management 28
3.1 Introduction 28
3.2 Existing infrastructure 28
3.3 Previous Flood Studies 28
3.4 New Design Flood Modelling 31
3.5 Hydraulic Flood Routing 35
3.6 Potential Stormwater Drainage Impacts 37
4. Flood Management Measures 41
4.1 Flooding 41
4.2 Diversion Channels and Levees 41
4.3 Cross Drainage Structures and Haul Roads 43
4.4 Channel Protection 45
4.5 Prevention of Surface Water Contamination 45
4.6 Mine Pit Water 45
4.7 Material Storage Dump Areas 45
4.8 Processing Plant Areas 46
4.9 Undisturbed Areas 46
4.10 Extreme Rainfall Event Management 46

Mt Todd Gold Project
Surface Water Assessment - Hydrology
4.11 Surface Water Monitoring 46
5. References 49
Table Index
Table 1 Development Footprints 5
Table 2 Water Storage Characteristics 5
Table 3 Pump Capacity 6
Table 4 Creek Catchment Diversions 8
Table 5 Water Management Operating Rules 8
Table 6 Stochastic Rainfall Model Parameters 9
Table 7 Mean Monthly Evaporation 9
Table 8 Catchment Areas for Retention Ponds 11
Table 9 Seepage Parameters 12
Table 10 Tailings Reclaim Water 13
Table 11 Simulated Rates of Water Supply to Processing Plant and
Percentage Days Failure 22
Table 12 Simulated Rates of Water Supply for Dust Suppression and
Percentage Days Failure 23
Table 13 Simulated Rates of Transfer to Equalisation Pond 24
Table 14 Simulated Percentage Days when Untreated Water Overflows
to Creeks 25
Table 15 Knight Piesold Study Flood Peaks 30
Table 16 Knight Piesold Study Flood Levels 30
Table 17 GHD Flood Discharge 31
Table 18 IFD Rainfall Data for Mt Todd Mine 33
Table 19 Rational Method Inputs for Flood Peak Estimation 34
Table 20 Design Flood Peak Estimates 35
Table 21 Existing Surface Water Level Monitoring 47
Figure Index
Figure 1 Mine Footprint 4
Figure 2 Batman Pit Void Space 7
Figure 3 Simulated Post Closure Water Levels in Batman Pit (Tetra
Tech May 2013, Figure 6.5) 21
Figure 4 Schematic of Mine Water Supply System 22
Figure 5 AGC Woodward-Clyde Study Modelled Flood Extents 29

Mt Todd Gold Project
Surface Water Assessment - Hydrology
Figure 6 Diversions at the WRD 31
Figure 7 Modelled Catchments 32
Figure 8 Extent of Hydraulic Flood Routing Models 36
Figure 9 Modelled 100-year ARI Flood Extent 39
Figure 10 Simulated Channel Flow Velocities for the 100-year ARI event 40
Figure 11 Modelled 10-year ARI Flood Extent 42
Figure 12 Stow Creek Diversion 44
Figure 13 Horseshoe Creek Diversion 44

i Mt Todd Gold Project
Surface Water Assessment - Hydrology
Executive Summary
This report considers the water management issues relating to the re-establishment and renewed
operation of the Mt Todd Gold Project. Its scope includes an assessment of existing water containment
infrastructure through water balance modelling and an appraisal of flood risk and existing stormwater
management. Issues relating to water quality are addressed in a separate report.
Vista Gold Australia Pty Ltd proposes to re-establish and operate the Mt Todd Gold Mine, located 55km
north of Katherine and 250km south of Darwin.
The Mt Todd Gold Mine was most recently mined for gold in the 1990s. Mining operations ceased in the
2000s and have been in a care and maintenance phase since then. Existing mine site infrastructure
comprises an open cut pit, tailings dam, waste rock dump (WRD), heap leach pad (HLP) and the remains
of processing facilities. Water retention ponds are located downstream of the WRD, HLP and processing
plant to capture surface runoff and seepage. The operation of this infrastructure to contain runoff from
disturbed and undisturbed areas of the mine has been investigated by means of water balance models.
It has been suggested that storm rainfall during the last two wet seasons has been in excess of a 100-
year ARI and is therefore likely to exceed the design criteria of water management infrastructure on the
site. An examination of rainfall records at Katherine shows that the total wet season rainfall between Nov
2010 and May 2011 was only the 5th highest of the 139 years on record and the following wet season
was only the 63rd highest. In terms of monthly rainfall, December 2010 has a total that is equivalent to
about a 5-year ARI and the December 2011 is more frequent than this ARI. It is possible that shorter
duration rainfall events were more extreme in terms of the expected frequency of occurrence.
Significant hazard water storage infrastructure is likely to be designed for the containment of at least
monthly and preferably extreme wet season rainfall and should therefore be able to contain rainfall such
as that falling in 2010 and 2011, which records at Katherine suggest was not as extreme as suggested.
Shorter duration rainfall is of more consequence to water conveyance infrastructure and it is possible that
channel capacities and less significant storages may have been exceeded by short duration high
intensity rainfall during 2010 and 2011.
Water Balance
Production phase water balance modelling is based on a 12-year sequence of daily rainfall and pan
evaporation compiled from on-site records (1993 to 2010). Statistics from the rainfall record have been
used in conjunction with a stochastic model to prepare 100 x 12 year daily sequences of rainfall for input
to the water balance model. The use of stochastic sequences provides a robust assessment of the
performance of water containment infrastructure. A separate post closure phase water balance model
contains mean monthly values of rainfall and evaporation which are recursively applied to a 600 year
period of simulation.
Water balance models simulate runoff from undisturbed areas of the mine and local upstream
catchments by means of the USDA Curve Number method. The AWBM method has been implemented
for the Edith River catchment. Seepage from the WRD and HLP is modelled as a proportion of daily
rainfall lagged by a specified number of days. The HLP includes a decay function to represent the
reduction in seepage after rehabilitation. Estimates of seepage from the tailings storage facility (TSF)
have been obtained from an external finite element analysis. Groundwater flows in to or out of storage
ii Mt Todd Gold Project
Surface Water Assessment - Hydrology
facilities and the pit have not been represented in water balance models. Recent studies have shown
that groundwater inflows will range from a few litres per second at the start of mining to approximately 31
L/s during the final months of mining and values are likely to be in excess of 13 L/s for most of the
production period.
The mine site currently has nine storage facilities which hold water as their primary or secondary function
and many are linked by a network of pipes. The water management strategy during mine operation is to
eliminate overflows to the downstream environment in all but extreme storm rainfall events by
transferring stored water to the WTP for treatment and subsequent re-use or discharge to the
downstream environment under discharge licence conditions.
Water balance models have been created by previous studies:
1. GoldSim Model, December 2010 - MtToddWB 10.6Mtpy Pre-&Production&Clsure JAN2011.gsm –
simulates the performance of water containment infrastructure during pre-production, production and
closure phases of the mine’s life cycle.
2. Goldsim Model, January 2012 - MtToddWB_LOM2011Update _Phase1&2_120118b_FLOW – is an
update of the Goldsim model in (1) and simulates the production phase, only.
3. Spreadsheet Models - Water Balance_12-08-10_100MT.xls and Water Balance_12-08-10_BIG.xls –
both models are restricted to an assessment of the performance of tailings storage facilities during
the production phase of the mine’s life cycle i.e. dam crest level requirements and plant make-up
water.
4. Goldsim Model, December, 2010 - MtToddWB 10.6Mtpy Post-Closure 12Dec2010.gsm – focuses on
quantifying the treatment stream during the post closure phase of the mine’s life cycle.
5. A recent water balance has been carried out by Tetra Tech and is summarised in ‘Mt Todd Gold
Project, Hydrogeology’, May 2013. The water balance covers a 500-year period representative of the
post closure phase of the mine and focuses on inflows and outflows to Batman Pit including
groundwater.
The performance of water management infrastructure during the production phase was assessed from
output generated by the latest Goldsim Model MtToddWB_Production_PFS_45K - Vista Gold Australia
Pty Ltd, 2013 and MtToddWB_LOM2011Update_Post-Closure_PPT_Chooser, May 2012, 2010.
The capacity of the equalisation pond (30,000m3, source 2013 Goldsim model) in conjunction with a
WTP capacity of 300 m3/h (years 1 to 3) and 500 m
3/h (years 4 to 12) is sufficient to receive transfers
from Batman Pit (RP3), WRD retention pond (RP1), heap leach pad (HLP) and the low grade ore
retention pond (RP2) to prevent overflows from these facilities during normal operating conditions.
However, the model results show instances of overflow at RP1, RP2, HLP and RP5 which are likely to be
the result of insufficient pump capacity on pipelines to the equalisation pond during high intensity rainfall
events. Overflows from the stormwater sediment pond (RP5) are to be expected given its function as a
sediment trap rather than a water retention pond. Simulations indicate no overflow from Batman Pit.
It should be noted that the water management procedure leading up to and during extreme peak rainfall
is likely to invoke different operating rules to those represented in the Goldsim water balance which are
representative of normal operating conditions. This could involve measures such as the temporary
transfer of excess water to the TSF. Furthermore, because simulated overflows from retention ponds to
the downstream environment occur as a consequence of extreme rainfall, it is likely that such events will
iii Mt Todd Gold Project
Surface Water Assessment - Hydrology
involve widespread rainfall and therefore flow within receiving waters will also be elevated. In this
situation high dilution ratios will help reduce the impact of mine water discharge to the Edith River.
The results of the water balance also show that estimates of reclaim water and seepage from the TSF
together with a similar magnitude of contribution from the RWD and WTP will be sufficient in meeting
mine water demands over the life of mine (LOM). However, this assessment assumes the RWD is an
unlimited water resource. The risk of shortfall in water supply is considered to be an economic risk rather
than an environmental impact
The simulated annual average output of water treatment plant varies from 2.6 to 4.4 GL/yr over the LOM
and assumes transfers from RP1, RP2, RP5 and RP3 occur whenever there is spare storage capacity
within the equalisation pond. The model shows that a relatively small amount of excess water may be
discharged from the WTP to the Edith River during the first three years of operation. This is most
probably caused by the adoption of a fixed water transfer operating rule regardless of mine production
and is not expected to occur during actual operations when rates of transfer will be dynamically
controlled.
The water balance during production years makes a number of assumptions. No net groundwater inflow
to Batman Pit and the pit is assumed to contain 1799 ML of water at the commencement of the
production phase. The rates of reclaim water and seepage outflow from the TSF have been determined
independently of the Goldsim water balance. Diversion drains around the WRD are assumed to have
been constructed and will divert 29% of catchment runoff away from the retention pond.
Some discrepancies exist between modelled and reported areas of development footprints for the Low
Grade Ore Stockpiles, Batman Pit, to a lesser extent the Waste Rock Dump, and the proposed period of
mine production. Underestimation of the development footprint of the pit will have a significant impact on
expected inflow and this may affect assumptions regarding transfer rates to the WTP from the pit which
may then impact transfers from other areas of the mine.
The results of a Goldsim post closure water balance indicate that water levels in Batman Pit are
expected to reach equilibrium at a level of between 975 m and 977 m (169 m and 167 m below the 1144
m top of pit level). However, this assumes no groundwater inflow which recent investigations indicate
could be up to 31L/s.
The results of a more recent water balance for the post closure period includes groundwater inflows
(Tetra Tech, May 2013) and suggests that the pit lake water level will rise relatively rapidly following
cessation of pit dewatering and reach equilibrium after 345 years at an elevation of approximately -15
mAHD. At this elevation the surface area of ponded water is expected have evaporation rates which
balance inflows from rainfall and groundwater.
Stormwater Management
The Mt Todd Mine is traversed by four creeks which drain into the Edith River to the south of the mine.
Horseshoe and Batman Creeks feed Stow Creek which borders the proposed TSF and then flows into
the Edith River. Horseshoe Creek flows along the eastern boundary of the mine, Batman Creek flows
through the centre of the mine and Burrell Creek flows along the south western corner of the mine.
Flooding along these creeks has the potential to encroach on storage embankments, plant, pit and other
infrastructure. Hydrologic modelling in conjunction with 1-D hydraulic models has been used to extend
the existing flood outlines from previous studies and to assess flood immunity and impacts on existing
and proposed mine infrastructure, particularly storage embankments.

iv Mt Todd Gold Project
Surface Water Assessment - Hydrology
Flood modelling has shown that most of the existing mine infrastructure is located outside the 100-year
ARI design flood extent of creeks passing through the mine area. The notable exceptions are the future
TSF2 which encroaches on the area of flooding along Horseshoe Creek and Stow Creek, also the area
of proposed Low Grade Ore Stockpiles and ROM which encroach on the flood extent of Batman Creek.
The design of the new TSF2 includes diversion channels and levees along Horseshoe Creek and Stow
Creek to protect the embankment from flooding and erosion. Diversion channels have been designed for
100-year ARI flood events and comprise lined rip-rap channels with a width and length on Stow Creek of
approximately 60m and 850m, respectively, and a nominal depth of 4.2m. The width and length of the
diversion channel on Horseshoe Creek will be approximately 40m and 550m, respectively, with a
nominal depth of 2.5m.
The existing TSF1 is protected from flooding along Horseshoe Creek by means of a creek diversion
channel which modelling shows has sufficient capacity to accommodate the 100-year ARI design flood
event.
Upgrade or re-design of existing drains and levees to protect areas of the processing plant against the
100-year ARI flood event along Batman Creek is required. Drainage across the processing plant site will
be limited by the installation of cut-off drains to divert uncontaminated runoff from around the site and
into Batman Creek via a settling pond. All stormwater runoff from within the site will be directed toward
the existing drainage channel on the east side of the proposed process plant.
Run-of-Mine and additional Low Grade Ore Stockpiles will require collection ditches to capture runoff and
seepage from stockpiles for conveyance to retention ponds. The location and quantity of runoff is not yet
known and will need to be assessed during the design phase to determine the required channel and
storage embankment height.
Mitigation includes diversion structures to limit the runoff from undisturbed areas of the mine and
upstream catchments from reaching water containment and plant infrastructure. Diversions are also
present upstream of the low grade ore stockpiles and around the HLP with the purpose of collecting
runoff from these disturbed areas of the mine and directing it into storage ponds for transfer to the waste
water treatment plant. Diversion drains have been constructed around the western and eastern margins
of the WRD retention pond (GHD, Nov 2010) to divert uncontaminated runoff away from the pond and
thereby reduce the risk of overtopping. Diverted water will report to local creeks downstream of the pond.
Overtopping of cross drainage structures and haul roads is likely to be an infrequent occurrence but
upgrades to existing stormwater drainage, erosion and sediment controls, including the vegetation of
verges, will be necessary to minimise damage during less extreme but more frequent storm events.
Locations where flood peak velocities are expected to exceed 2m/s and thus have the potential to cause
scouring of unlined channels have been identified. Whilst the majority of these locations are sufficiently
distant from mine infrastructure to be of no immediate risk, the section of Batman Creek adjacent to the
processing plant is likely to experience high velocity flows during extreme flood events. Rip-rap
protection to earthwork embankments adjacent to the existing drainage channel on the east side of the
proposed process plant will be installed for channel protection. Sections of Stow Creek in the vicinity of
the proposed embankment of TSF2 are also expected to experience high flow velocity during extreme
flood events. Scour protection measures will include placement of rip-rap in association with proposed
channel diversion works.
The following additional mitigation measures are proposed for the management of storm water runoff:

v Mt Todd Gold Project
Surface Water Assessment - Hydrology
Ensure flood immunity by siting mine infrastructure outside the 100-year ARI flood extent;
The potential for contamination of receiving waters has been reduced by segregation of “clean”
stormwater runoff from “dirty” stormwater runoff and the collection and treatment of “dirty” stormwater
runoff from areas within the mine site;
The amount of pit water needing treatment has been reduced by minimising the stormwater runoff
entering the pit by construction of bunds around the pit perimeter;
The amount of stormwater runoff from material stores has been minimised through appropriate
design of batter slopes and drainage collection systems;
During rainfall events that exceed the design capacity of water containment infrastructure, excess
inflow may need to be redirected back into the active TSF up to the height of beached tailings or
allowed to overflow to the environment. It is assumed that retention ponds have been designed to
overflow whilst maintaining the safety of embankment structures.
Monitoring
Water monitoring stations are required to obtain the rate of surface water runoff entering and exiting the
mine site to assist with the efficient operation of water management infrastructure and to demonstrate
compliance with discharge licence conditions. In addition, it would be advantageous to obtain data that
could be used to validate parameters used in water balance models; this would comprise storage levels,
runoff from disturbed areas of the mine and pumping rates between storage infrastructure.
Monitoring has been carried out at a number of locations throughout the mine site. Whilst this provides
valuable information for the operation of infrastructure its value to the long-term management and
planning of water containment is often impaired by a lack of information on the duration and rate of flow.
Recommended improvements to monitoring during operation of the mine include:
Monitoring of water levels at locations on Batman Creek and Horseshoe Creek just upstream of mine
infrastructure together with the derivation of stage – discharge relationships for existing monitoring
sites just downstream of the mine site;
Installation of hourly or continuous monitoring of water levels at the weirs downstream of the WRD
would assist with the estimation of seepage rates from the waste rock dump. However, this
information could also be obtained from existing monitoring of water levels in the retention pond so
long as monitoring of transfers and any other outflows is carried out in tandem.

1 Mt Todd Gold Project
Surface Water Assessment - Hydrology
1. Introduction
1.1 Overview
Vista Gold Australia Pty Ltd (Vista Gold) proposes to re-establish and operate the Mt Todd Gold Mine,
located 55km north of Katherine and 250km south of Darwin. The mine site is accessed via Jatbula Road
(restricted mine access road), approximately 10km west of the Stuart Highway (the main highway
between Darwin and Adelaide).
The Mt Todd Gold Mine site was most recently previously mined for gold in the 1990s. Mining operations
ceased in the 2000s and have been in a care and maintenance phase since that time. Mining
infrastructure such as tailings dams, WRDs, mine pit and remains of processing facilities remain on site.
The new mining operation will be by conventional open-pit truck and shovel methods, using large haul
trucks, hydraulic shovels and front-end loaders to transport material to the crusher, ore stockpiles and
waste dump facilities. Approximately 17.8 million tonnes per annum (Mtpa) of ore will be carbon in leach
(CIL) leached leading to recovery of gold dore (unrefined gold). The CIL tailings will be detoxified and
sent to an impoundment from which plant process water will be recycled.
A number of previous studies have investigated the design and operation of water management
infrastructure, the most recent being Envirotech Monitoring’s Mt Todd Water Management Plan 2011/12.
This report provides information in support of the Mt Todd Gold Project Environmental Impact Statement
and addresses the Guidelines for the Preparation of a Draft Environmental Impact Statement, Mt Todd
Gold Project Katherine Region, NRETAS (2011) i.e.
Description of catchments, their boundaries, area and topography. Indicate location of infrastructure
footprints;
An estimate of the effects from current and future pits, water stores and operational processes on
surface water distribution;
Areas of inundation, drainage lines, surface-water flow directions, creeks and receiving waterways.
Existing surface drainage patterns, flows (including flood level contours) and discharge rates;
Size of drainage lines, creeks and waterways, and frequency of extreme rainfall events; and
Describe the current surface water monitoring program, any proposed modifications to the program.
The report is based on the descriptions of the mine footprint as provided by Vista Gold Australia Pty Ltd
and contained within the models:
GoldSim Pro (Version 10.5) simulation software MtToddWB_Production_PFS_45K.gsm; and
MtToddWB_LOM2011Update_Post-Closure_PPT_Chooser.
This report considers water management issues relating to the re-establishment and renewed operation
of the mine. The report is divided into two main sections which:
Assess the performance of water containment infrastructure; and
Appraise stormwater management.

2 Mt Todd Gold Project
Surface Water Assessment - Hydrology
The operation of infrastructure to contain runoff from disturbed and undisturbed areas of the mine has
been investigated by means of water balance models
Previous flood mapping studies are available and have been used to assist with the appraisal of
stormwater management.
1.2 Key Elements of the Project
The key elements of the Project include:
Mining and Mining Infrastructure
Extension of the existing Batman Pit from its current depth of 114m to approximately 588m and
surface area of 40 hectares (ha) to approximately 137ha;
Expansion of the existing waste rock dump (WRD) from a height of 24m to approximately 350m, and
a footprint of 70ha to approximately 217ha. The dump currently contains 16Mt of waste rock and the
expansion will provide total capacity of up to 510 Mt;
Construction of a Run of Mine (ROM) pad and ore stockpile;
Construction of an ANFO (Ammonium Nitrate and Fuel Oil (ANFO) Facility;
Construction of heavy and light vehicle workshop and administration offices, and facilities comprising
wash down area, tyre change facility, lube storage facility etc.; and
Construction of haul roads and access roads.
Process Plant and Associated Facilities
Ore Processing Plant capable of processing approximately 50,000 tonnes per day (tpd) of ore;
Processing and / or reclamation of the existing low grade ore (LGO) stockpile and scats stockpile,
and construction and processing of new LGO stockpile with a footprint of 25ha;
Raising the existing tailings storage facility (TSF1) from 16m to approximately 34m;
Construction of a new TSF2, approximately 300ha in area and up to 60m high;
Diversion of Horseshoe Creek and Stow Creek adjacent to TSF2 to provide flood protection;
Rehabilitation of the existing heap Ieach pad (HLP) if residual HLP material is not processed through
the new plant;
Chemical and reagent storage and handling facility; and
Process plant workshops, administration offices, control room etc.
Other Infrastructure
Gas fired Power Station, including re-routing of the existing gas pipe line;
Anaerobic treatment wetlands, approximately 10ha in area;
A 2m high raising of the raw water dam (RWD) and an increase in the area of inundation;
Construction of saddle dams at the RWD and TSF1;
Construction of three coffer dams at Retention Pond 1 (RP1) and deepening of RP1;

3 Mt Todd Gold Project
Surface Water Assessment - Hydrology
500 m3/h capacity water treatment plant;
Security gate house;
Potential re-alignment of access roads;
Site wide drainage; and
Modification to existing fuel storage and distribution facility.
The construction and operations workforces are expected to peak at approximately 450 and 350
personnel, respectively.
The Project, based on current known data, will have a life of around 19 years inclusive of construction,
operations and closure. Construction is anticipated to commence in the first quarter of 2014 and take two
years, including 6 months pre-production. The mine is scheduled to operate for a further 13 years.
Closure and rehabilitation of the mine is expected to take four years.
4 Mt Todd Gold Project
Surface Water Assessment - Hydrology
2. Water Containment
2.1 Infrastructure
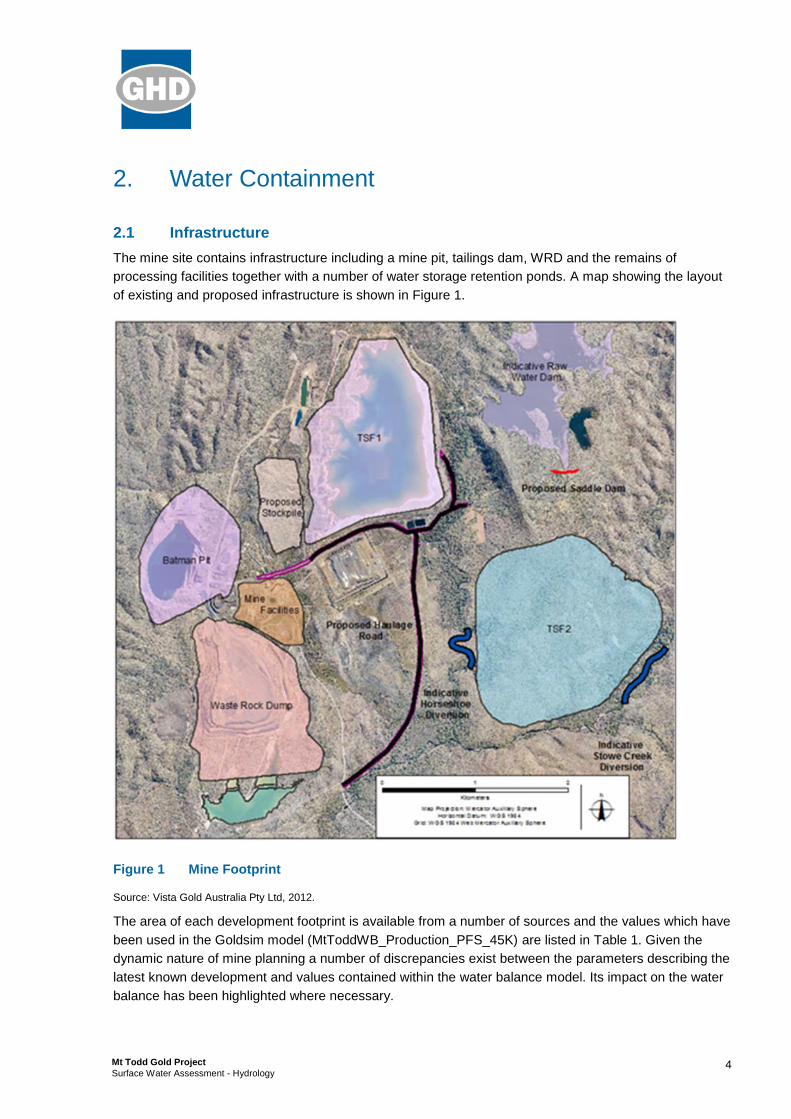
The mine site contains infrastructure including a mine pit, tailings dam, WRD and the remains of
processing facilities together with a number of water storage retention ponds. A map showing the layout
of existing and proposed infrastructure is shown in Figure 1.
Figure 1 Mine Footprint
Source: Vista Gold Australia Pty Ltd, 2012.
The area of each development footprint is available from a number of sources and the values which have
been used in the Goldsim model (MtToddWB_Production_PFS_45K) are listed in Table 1. Given the
dynamic nature of mine planning a number of discrepancies exist between the parameters describing the
latest known development and values contained within the water balance model. Its impact on the water
balance has been highlighted where necessary.

5 Mt Todd Gold Project
Surface Water Assessment - Hydrology
Table 1 Development Footprints
Facility Area (ha)
Waste Rock Dump 61 to 202.5a
Low Grade Ore Stockpile 11.3 a b
Batman Pit 32.5 a
Heap Leach Pad 37
Plant, WTP, Operations and administration 22
Tailings Storage Facility TSF1 (RP7) 156.0
Tailings Storage Facility TSF2 (RP8) 300.0
Source: Goldsim Model MtToddWB_Production_PFS_45K - Vista Gold Australia Pty Ltd, 2013
Notes: a proposed maximum development footprints WRD = 217ha LGOS = 47ha Batman Pit = 137ha
b excludes LGOS pad
The mine site consists of nine storage facilities which will store water as their primary or secondary
function (Table 2) and a pipe/pumping network (Table 3) that aims to eliminate overflows from retention
ponds to the downstream environment during all but extreme storm rainfall events. Whilst the pit is not
strictly speaking a storage facility it has been included in the table.
Pit dimensions will change during the life of mine from a current depth of 114m (RL 74 m) to a final depth
of 588m (RL -400m). The storage characteristics of the expanded pit during future development phases
are shown in Figure 2. The results of Goldsim Model water balance modelling are available for the
existing pit storage characteristics (pit area 32.5 ha), only.
Table 2 Water Storage Characteristics
Retention Pond Storage Capacity (ML) Maximum Storage
Level (m) Initial Storage Volume (ML)
WRD RP1 1226 1119.00 926.8
Low Grade Ore Pad RP2 10.4 1130.00 2.5
Batman Pit RP3 11970 1144.00 1799.1 b
HLP 67.5 1135.50 31.8
Stormwater Sediment Pond RP5
13.7 1128.00 3.1
TSF1 RP7 4680 1136.50 0
TSF2 unknown unknown unknown
Raw Water Dam Infinite a infinite infinite
Equalisation pond 30 c 1128.00 0
Source: Goldsim Model MtToddWB_Production_PFS_45K - Vista Gold Australia Pty Ltd, 2013 Notes: a Goldsim Model assumes
infinite storage source due to lack of reliable data to establish storage curve b based on output from Pre-production model which in
turn relies on observed water elevations and dewatering rules based on current discharge permit (ref Tetra Tech memo 21/2/2013) c storage is reported to be equivalent to 5 days water treatment capacity (36 ML) but in fact is only 30 ML within the Goldsim model

6 Mt Todd Gold Project
Surface Water Assessment - Hydrology
Table 3 Pump Capacity
Source Destination Capacity (m3/h)
Time Scaling Factor applied to Pump capacity
WRD RP1 WTP 443 1
Raw Water Dam Dust suppression 50 1
Low Grade Ore Pad RP2 WTP 266 0.3
Stormwater Runoff RP5 WTP 70 0.5
HLP Facility WTP 194 1
Batman Pit RP3 WTP 443 1
Tailings Storage Facility TSF1 WTP 360 1
WTP Dust suppression 50 1
Source: Goldsim Model MtToddWB_Production_PFS_45K - Vista Gold Australia Pty Ltd, 2013
Discrepancies exist between modelled and reported areas of development footprints for the Low Grade
Ore Stockpile, Batman Pit and to a lesser extent the Waste Rock Dump. Inflow to their respective
retention ponds comprises external catchment runoff, seepage from material stores (or pit wall runoff in
the case of Batman Pit) and direct rainfall over ponds each of which involves a different method of
calculation and magnitude of unit runoff depth. The greatest unit runoff is generated by direct rainfall over
ponds and pit walls. These two sources exhibit 5 times the runoff depth per unit area than is generated
by rainfall over catchment areas (surface runoff) or material stores (seepage).
The underestimation of pit area by the Goldsim model may result in an underestimate of the pit wall area
and ponded water area whilst overestimating the area of catchment runoff. This will result in a significant
underestimate of pit inflow due to the differences in unit runoff depth. Therefore a water balance on an
expanded pit is likely to change the assumptions regarding required transfer rates to the WTP from the
pit and possibly transfers from other areas of the mine.
The underestimation of the Low Grade Stockpile footprint is not expected to cause a significant impact
on the water balance. As mentioned above seepage and catchment runoff have a similar unit runoff
depth and therefore changes to the areas will not significantly affect the water balance.
Discrepancies in the final footprint of the Waste Rock Dump are of less significance to the overall water
balance.
Diversion channels isolate runoff from undisturbed areas, such as the upper reaches of Horseshoe
Creek and Burrell Creek, and thereby reduce the amount of water entering the mine site water
management system (Table 4). Diversions are used to divert runoff from disturbed areas of the mine and
direct it into water retention ponds. Other diversion structures are used to protect infrastructure by re-
aligning the course of creeks and do not alter the water balance of the mine site e.g. proposed diversions
along Horseshoe and Stow Creeks.

7 Mt Todd Gold Project
Surface Water Assessment - Hydrology
600
700
800
900
1000
1100
1200
0 2 4 6 8 10 12
Leve
l m
Volume mill m3
Batman Pit - Existing
Void Space Ground Level Start Water Level
600
700
800
900
1000
1100
1200
0 2 4 6 8 10 12
Leve
l m
Volume mill m3
Batman Pit - years 1 to 3
Void Space
600
700
800
900
1000
1100
1200
0 2 4 6 8 10 12
Leve
l m
Volume mill m3
Batman Pit - years 4 to 6
Void Space
600
700
800
900
1000
1100
1200
0 2 4 6 8 10 12
Leve
l m
Volume mill m3
Batman Pit - years 7 to 12
Void Space
Figure 2 Batman Pit Void Space
8 Mt Todd Gold Project
Surface Water Assessment - Hydrology
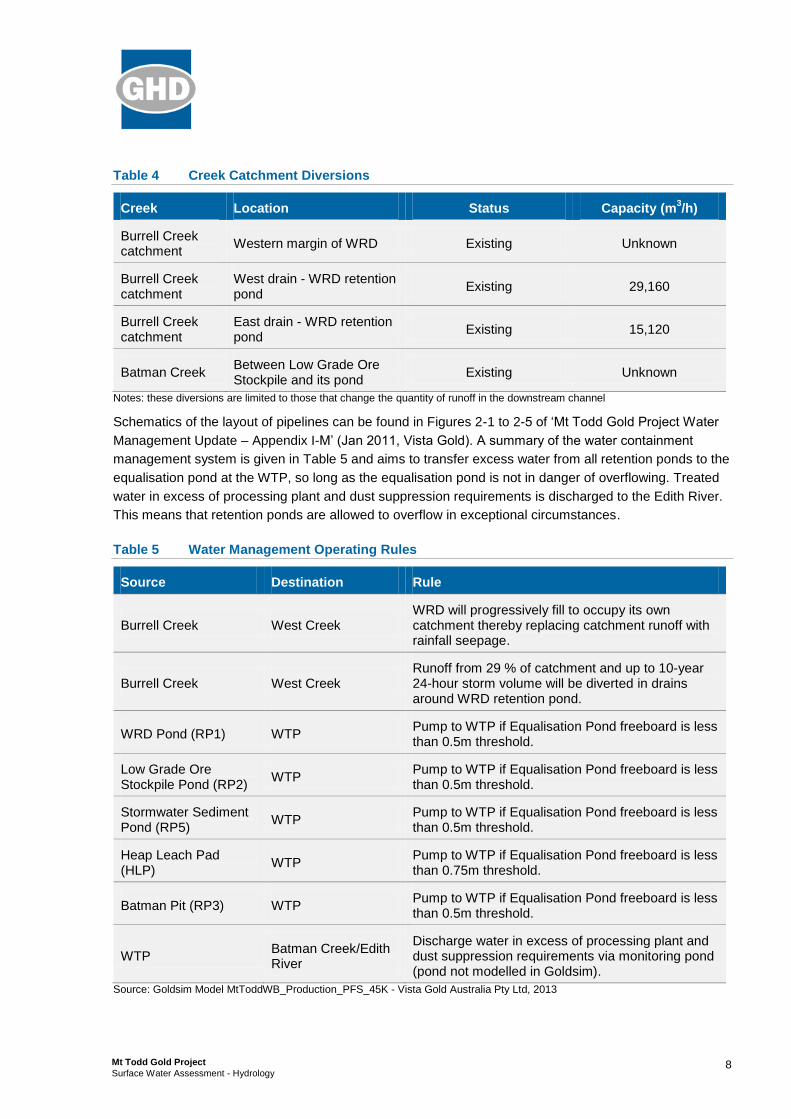
Table 4 Creek Catchment Diversions
Creek Location Status Capacity (m3/h)
Burrell Creek catchment
Western margin of WRD Existing Unknown
Burrell Creek catchment
West drain - WRD retention pond
Existing 29,160
Burrell Creek catchment
East drain - WRD retention pond
Existing 15,120
Batman Creek Between Low Grade Ore Stockpile and its pond
Existing Unknown
Notes: these diversions are limited to those that change the quantity of runoff in the downstream channel
Schematics of the layout of pipelines can be found in Figures 2-1 to 2-5 of ‘Mt Todd Gold Project Water
Management Update – Appendix I-M’ (Jan 2011, Vista Gold). A summary of the water containment
management system is given in Table 5 and aims to transfer excess water from all retention ponds to the
equalisation pond at the WTP, so long as the equalisation pond is not in danger of overflowing. Treated
water in excess of processing plant and dust suppression requirements is discharged to the Edith River.
This means that retention ponds are allowed to overflow in exceptional circumstances.
Table 5 Water Management Operating Rules
Source Destination Rule
Burrell Creek West Creek WRD will progressively fill to occupy its own catchment thereby replacing catchment runoff with rainfall seepage.
Burrell Creek West Creek Runoff from 29 % of catchment and up to 10-year 24-hour storm volume will be diverted in drains around WRD retention pond.
WRD Pond (RP1) WTP Pump to WTP if Equalisation Pond freeboard is less than 0.5m threshold.
Low Grade Ore Stockpile Pond (RP2)
WTP Pump to WTP if Equalisation Pond freeboard is less than 0.5m threshold.
Stormwater Sediment Pond (RP5)
WTP Pump to WTP if Equalisation Pond freeboard is less than 0.5m threshold.
Heap Leach Pad (HLP)
WTP Pump to WTP if Equalisation Pond freeboard is less than 0.75m threshold.
Batman Pit (RP3) WTP Pump to WTP if Equalisation Pond freeboard is less than 0.5m threshold.
WTP Batman Creek/Edith River
Discharge water in excess of processing plant and dust suppression requirements via monitoring pond (pond not modelled in Goldsim).
Source: Goldsim Model MtToddWB_Production_PFS_45K - Vista Gold Australia Pty Ltd, 2013

9 Mt Todd Gold Project
Surface Water Assessment - Hydrology
It is understood that in exceptional circumstances water can be temporarily transferred to the TSF should
retention ponds be in danger of overflowing and there is insufficient capacity in the WTP. This option was
not included in the Goldsim water balance.
2.2 Climate
The production phase water balance model has been set up to run with a stochastic precipitation model
which is able to generate multiple sequences of daily rainfall covering the life of mine production (12
years). This provides an envelope of expected conditions representative of overly dry years ranging to
overly wet years.
The stochastic model uses a Weibull distribution with a slope parameter value of 1 that causes it to
collapse to an exponential distribution. The distribution is defined by a minimum daily rainfall of 0 mm; a
mean daily rainfall based on defined mean monthly rainfall totals for the wet season (Table 6) factored
upwards by 1.2 (dry season rainfall is 0 mm); and, a maximum daily rainfall of 257 mm which is the 100-
year 24-hour design storm rainfall (source published Bureau of Meteorology IFD database). Rainfall is
generated for randomly determined durations with a target mean length of 3 days and a defined target
probability of occurrence (Table 6). The source of mean monthly rainfall values and target probabilities is
not stated but it is assumed to have been extracted from historical on site rainfall records. It has been
stated by Tetra Tech that on-site records (1993 to 2010) have been in-filled and extended using adjusted
records from Katherine (rainfall increased by 19%).
Table 6 Stochastic Rainfall Model Parameters
Parameter October November December January February March April
Mean Monthly Rainfall
a (mm)
35 111 239 292 259 193 38
Expected Probability
0.12 0.26 0.44 0.49 0.52 0.36 0.13
Source: Goldsim Model MtToddWB_Production_PFS_45K - Vista Gold Australia Pty Ltd, 2013. Notes: a rainfall is multiplied by
1.2 in model
The relatively low variability in evaporation permits the use of mean monthly pan evaporation adjusted by
a pan factor of 0.9, which delivers a slightly conservative estimate. The Goldsim model contains data
representing three alternative climatic conditions termed; dry, average and wet (Table 7). However, the
model has been run using an average climatic condition where annual evaporation is 2574 mm. The
source of evaporation data is not stated but it is believed to be based on mine site records.
Table 7 Mean Monthly Evaporation
Scenario Oct Nov Dec Jan Feb Mar Apr May Jun Jul Aug Sep
Dry (mm/day) 7.3 8.5 8.7 9.0 8.5 8.2 8.2 7.5 6.3 4.9 5.5 5.7
Ave. (mm/day) 7.0 8.1 8.6 8.5 8.2 7.7 7.6 6.9 5.9 5.1 5.3 5.8
Wet (mm/day) 6.6 7.8 8.7 8.6 7.6 7.6 7.8 6.6 5.5 4.8 4.7 5.5
Source: Goldsim Model MtToddWB_Production_PFS_45K - Vista Gold Australia Pty Ltd, 2013 Notes: 1 rainfall is multiplied by 1.2
in model

10 Mt Todd Gold Project
Surface Water Assessment - Hydrology
A post closure phase water balance model (Goldsim model - MtToddWB_LOM2011Update_Post-
Closure_PPT_Chooser) contains the following two options for representing future rainfall conditions both
of which are based on a rainfall sequence developed from the record at Katherine and updated with
recent site records:
Sampled over the entire 137-year record (1873 to 2012) and repeated approximately 4 times to
achieve a 600 year period; and
Sampled over the most recent 20-year subset of the 137-year sequence and repeated 30 times to
achieve a 600 year period.
Rainfall data does not include any adjustment for climate change as there is no official means of
adjusting long term sequences of daily rainfall.
A daily sequence of evaporation has been compiled from monthly evaporation which is believed to be
based on mine site records. A pan factor of 0.78 has been used to adjust the data to rates of evaporation
from an open water surface.
The mean annual rainfall for the period 2010-2030 at the mine site is 1280 mm and the mean annual
potential evaporation is 2470 mm (excluding pan factor of 0.78). Including the pan factor of 0.78,
adjusted evaporation becomes 1926.6 mm annually.
It has been suggested that storm rainfall during recent wet seasons has been in excess of a 100-year
ARI and is therefore likely to exceed the design criteria of most water management infrastructure on the
site. Examination of rainfall records show that the total wet season rainfall between Nov 2010 and May
2011 was only the 5th highest at Katherine (available record 1873 to 2012 at gauge number 14902)
which equates to about a 30-year ARI (using Log Pearson distribution), whilst the following wet season
was only the 63rd highest out of the 139 year record at Katherine and has a more frequent 2-year ARI. In
terms of monthly rainfall, December 2010 has a total that is equivalent to about a 5-year ARI and
December 2011 is more frequent than this ARI. It is possible that shorter duration rainfall events were
more extreme in terms of frequency of occurrence. However, major water storage infrastructure is likely
to be designed for the containment of at least monthly and preferably wet season rainfall which records
at Katherine suggest was not as extreme as suggested for these longer durations in 2010 and 2011.
Shorter duration rainfall is of more consequence to water conveyance infrastructure and it is possible that
channel capacities and smaller storages (RP2 and RP5) may have been exceeded by short duration high
intensity rainfall events in the 2010 and 2011 wet seasons.
2.3 Surface Runoff
Runoff is captured in retention ponds from a significant area within the mine lease boundary (Table 8)
and has been represented within the water balance model by means of the USDA Curve Number
method. Land use and the characteristics of soil texture are used to select a ‘curve number’ which is
input to empirical formulae to calculate the depth of runoff from daily rainfall and evaporation. Curve
numbers for the mine site vary between 80 and 95 and were calibrated by previous studies using rainfall
and runoff records for the period October 2008 to September 2010 (Tetra Tech memorandum Dec,
2010). Curve numbers have recently been checked using site conditions and processes as they occurred
in real time from 2008 to present and synthetically extended to October 2012 (Goldsim Model
MtToddWB_Calibration Model_20120518_FINAL - Vista Gold Australia Pty Ltd, 2012).

11 Mt Todd Gold Project
Surface Water Assessment - Hydrology
Table 8 Catchment Areas for Retention Ponds
Retention Pond Catchment area [ha]
Waste Rock Dump RP1 – Production start to end 177 to 35
Low Grade Ore Pad RP2 32
Stormwater Sediment Pond RP5 33
Batman Pit RP3 – including pit and pit walls 24
Raw Water Dam a -
Total 266 to 124
Source: Goldsim Model MtToddWB_Production_PFS_45K - Vista Gold Australia Pty Ltd, 2013
Notes a RWD is modelled as an infinite resource
The calibration of curve numbers relies on water balance calculations using detailed records of inflows,
outflows and changes in pond storage. The absence of continuous records of flow rates through
pipelines and the coarse time resolution of water level records at weirs prevent an accurate appraisal of
curve numbers.
Whilst it is reported that flows within the Edith River have been modelled by the Australian Water
Balance method (AWBM) this information is not used by the model as controlled discharges only occur
from the water treatment plant and are therefore not controlled by the dilution capacity of the Edith River.
The AWBM model rainfall – runoff parameters (Soil storage capacity = 50, BFI = 0.1, Ks = 0.25 and Kb =
0) were obtained by calibration using an unspecified set of observed Edith River flows, rainfall and
evaporation records. The performance of the calibrated model has been reported to be generally
conservative (lower than observed flow) in terms of simulated flow especially for baseflows. It is also
reported that the “…the ratio of annual totals between observed and modelled results equal to 1.2” (Tetra
Tech memo 14/1/2013).
The capacity of water storage facilities to contain runoff from mine affected areas has been investigated
by water balance modelling and the results summarised in Section 2.8. The combined mean annual
inflow to retention ponds has been estimated from the 100 x 12 year stochastic simulations to be 2.6
GL/year.
2.4 Seepage
Seepage occurs from the WRD, HLP and Low Grade Ore Stockpiles and is modelled in the water
balance as a proportion of daily rainfall lagged by a specified number of days (Table 9). No description of
the method to obtain these parameters by previous studies has been found.
Estimates of seepage from the WRD can be derived from the water level records at v-notch weirs located
downstream of the dump. However, a relationship between seepage and rainfall requires the comparison
of flow at the v-notch weir with coincident records of rainfall over the WRD. A comparison has not been
made due to the difference in time resolution between the two records. Water levels at the v-notch weirs
are recorded once daily whereas rainfall is monitored continuously.

12 Mt Todd Gold Project
Surface Water Assessment - Hydrology
Table 9 Seepage Parameters
Facility Parameters
Proportion of rainfall Lag time (days)
Waste Rock Dump uncovered 0.25 30
Heap Leach Pad
covered 0 0
uncovered wet season 0.8 25 – 65
uncovered dry season 0.5 25 – 65
Tailings Storage Facility 1 uncovered a-
a-
Low Grade Ore Stockpiles uncovered 0.25 0
Source: Goldsim Model MtToddWB_Production_PFS_45K - Vista Gold Australia Pty Ltd, 2013
Notes: aestimated as 10% of reclaim water
The HLP may be decommissioned in the first year (if ore is not re-processed), and a decay function
attempts to simulate the achievement of a steady-state infiltration. After a period of time the amount of
water seeping into the pile reaches equilibrium as the pad dries out. An estimate of the time it takes to
reach this equilibrium is obtained from a decay function using a factor of -0.46, and achieves an
infiltration rate equal to 10% of the initial rate after 10 years.
Seepage from the tailings storage facilities (existing and future) will be transferred to the water treatment
plant. A SeepW finite element analysis was carried out by a previous study (Tetra Tech memorandum,
Sep 2010) to determine seepage rates from the existing TSF. Seepage rates from the future TSF have
been scaled from those determined for the existing TSF. The water balance assumes a seepage rate
equal to 10% of reclaimed water is sent to the WTP and values are given in Table 10. The remaining
volume of reclaimed water is sent to the processing plant.
Groundwater seepage in to, or out of, the pit has not been included in the water balance of the mine. A
recent study indicates that “Predicted groundwater inflows ranged from a few litres per second at the
start of mining to approximately 31 L/s during the final months of mining” (Section 6.2.1 ‘Mount Todd
Gold Project, Hydrogeology’. Tetra Tech. May 2013). The exclusion of groundwater inflows to the pit may
alter the assumptions regarding required transfers to the WTP.
The ability of water storage facilities to contain seepage inflow from mine dumps and stockpiles has been
investigated by water balance modelling and results are summarised in Section 2.8. The combined mean
annual seepage has been estimated from 100 x 12 year stochastic rainfall simulations to be 0.8 GL/year.
2.5 Tailings Reclaim Water
Table 10 lists the estimated quantity of water that is expected to be reclaimed from the TSF for use in the
plant. Any residual plant water requirement will be made up by transfers from the Raw Water Dam.

13 Mt Todd Gold Project
Surface Water Assessment - Hydrology
Table 10 Tailings Reclaim Water
Year Estimated Reclaim Water from Tailings during Dry and Wet Seasons
(m3/day)
1 0
2 0
3 9600 - 19200
4 9600 - 19200
5 9600 - 19200
6 9600 - 19200
7 9600 - 19200
8 10200 - 19200
9 10200 - 19200
10 10200 - 19200
11 10200 - 19200
12 10200 - 19200
13 10200 - 19200
14 10200 - 19200
15 10200 - 19200
Source: Goldsim Model MtToddWB_Production_PFS_45K - Vista Gold Australia Pty Ltd, 2013
The TSF will comprise two dams. The existing dam (TSF1) will be raised in six stages to a level
approximately 34m above ground level. A second dam (TSF2) will be constructed to the south east and
will have a height of about 60m above ground level.
The projected heights of the TSFs as they are raised to accommodate the volume of tailings over the life
span of the mine production phase were previously investigated by water balance models
(HydroGeoLogica, December 2010). No description of the water balance models is known to exist and it
is assumed that one model (Water Balance_12-08-10_BIG.xls, HydroGeoLogica 2010) represents TSF1
up to production year 7 and the second model (Water Balance_12-08-10_100MT.xls HydroGeoLogica
2010) represents TSF2 for production years 7 to 17. It is assumed that the TSF water balance models
have been updated with the latest mine development information.
2.6 Water Demands
2.6.1 Construction Phase
Water will be sprayed onto unsealed roads to suppress dust by means of water carts. It is assumed that
this will be treated water of an acceptable quality or failing this supplied directly or indirectly from the Raw

14 Mt Todd Gold Project
Surface Water Assessment - Hydrology
Water Dam. Also, potable water will be required for an expected workforce of up to 450 people
(estimated rate of 45 m3/day based on assumed consumption of 100 L/person/day).
The capacity of the raw water dam should be more than sufficient to meet water demands during the
construction phase.
2.6.2 Operational Phase
A new ore processing plant will be constructed and its water requirements are estimated to be 24,230
m3/day (30,000 tpd production) for the first three years and thereafter 36,409 m
3/day (45,000 tpd
production) (source Tetra Tech memo, 14/1/2013 and Goldsim Model MtToddWB_Production_PFS_45K
- Vista Gold Australia Pty Ltd, 2013) (The actual water demand for the processing plant based on a
production of 50,000tpd is 30,000m3/day). 16% of this amount is assumed to be needed for
elution/potable (Tetra Tech Memo 14/1/2013). Raw water will be utilised for crusher sprays, reagent
make-up, potable water production, process water make-up, gland water, filter plant seal water make-up,
and fire water reserve. The processing plant demand is scheduled to be supplied from one or more of the
following sources whilst elution/potable would be supplied from the Raw Water Dam:
TSF reclaim water
Water Treatment Plant
Raw Water Dam.
A small quantity of water will be required for fire-fighting purposes and for use by on-site personnel in the
plant and control area (35 m3/day and 1.7 m
3/h, respectively). Water will be obtained from the Raw Water
Dam and treated via filtration, chlorination and ultra violet sterilisation at an on-site facility.
Water is also required for cooling purposes in the electrical power generation plant and its quantity is
estimated to be about 20 m3/h.
The demand for water for the purpose of dust suppression is estimated to vary between 220 m3/day and
1153 m3/day (Goldsim Model MtToddWB_Production_PFS_45K - Vista Gold Australia Pty Ltd, 2013)
depending on the season and is supplied from the WTP in the first instance and thereafter from the
RWD.
The capacity of water storage facilities to meet water demands for the abovementioned purposes has
been investigated by water balance modelling and its results are summarised in Section 2.8.
2.7 Water Balance Modelling
2.7.1 Available Models
The operation of infrastructure to contain runoff from disturbed and undisturbed areas of the mine has
been investigated by means of water balance models.
Previous studies have created a number of water balance models which are largely independent and
focus on different phases of the mine’s life cycle. The exception is the use of outputs from the
spreadsheet models of the TSF, which calculate the demand for plant make-up water, and its input to the
production phase Goldsim model. Available models consist of:

15 Mt Todd Gold Project
Surface Water Assessment - Hydrology
1. Goldsim Model MtToddWB_Production_PFS_45K - Vista Gold Australia Pty Ltd, 2013 – this updated
version of a previous Goldsim Model - MtToddWB_LOM2011Update_Phase1&2_120118b_FLOW
simulates the performance of water containment infrastructure during the production phase of the
mine’s life cycle (the model outputs results for a 12 year period).
2. Spreadsheet Models - Water Balance_12-08-10_100MT.xls and Water Balance_12-08-10_BIG.xls –
both models are restricted to an assessment of the performance of tailings storage facilities during
the production phase of the mine’s life cycle i.e. dam crest level requirements and plant make-up
water.
3. Goldsim Model - MtToddWB_LOM2011Update_Post-Closure_PPT_Chooser.gsm is an update of a
previous model MtToddWB 10.6Mtpy Post-Closure 12Dec2010.gsm and focuses on quantifying the
treatment stream during the post closure phase of the mine’s life cycle.
4. A further model is available for the pre-production phase (previously defined as October 1, 2012 to
August 1, 2014) - MtToddWB_PreProduction_20120523_Final. The model is used to assess the
dewatering time for RP3, water treatment for ponds RP3, RP7 and RP1 and the frequency of
overtopping events during the pre-production phase. The model uses wet, dry and average climate
scenarios. The wet scenario is based on rainfall for the year 2011/12 and Edith River flows from the
year 2008/09 with the data repeated for each of the two years of simulation. Years with the driest and
average rainfall were determined from a synthetic rainfall record (length 2000-10). The chosen
scenarios are largely synthetic due to the mixture of data source time lines and the repetition of data
in successive years and this makes an assessment of the severity of the scenarios by statistical
frequency analysis, problematic.
The updated production phase water balance model (Goldsim Model MtToddWB_Production_PFS_45K)
is described in Tetra Tech memo 14/1/2013 and by comments within the code of the model. A previous
Goldsim model of the production phase was documented in the following reports:
‘Mt Todd Water Balance - Care and Maintenance Model Calibration and Forward Modeling
Predictions', Hydrogeologica and Tetra Tech, December 2010; and
'Mt Todd Mine Life Water Balance, 10.6 Mtonnes/year Mine Plan', Hydrogeologica, December 2010.
A more recent water balance has been carried out by Tetra Tech and is summarised in Mt Todd Gold
Project, Hydrogeology, May 2013. The water balance covers a 500-year period representative of the post
closure phase of the mine and focuses on inflows and outflows to Batman Pit including groundwater
inflow.
A brief description of available water balance models is given in the following sections and the simulation
results from the models are summarised in Section 2.8.
2.7.2 Production Phase Goldsim Model
The Goldsim model represents the daily containment and transfer of rainfall, seepage and runoff from
catchment areas during the production phase of the mine (12 years) using stochastically generated daily
rainfall sequences. The assumed mine production period differs from the latest proposal which is for a
13-year production period. Given the use of a probabilistic approach to rainfall it is considered unlikely
that the extension of the simulation would significantly alter the study outcome.
The stochastic model differs from those proposed for use in Australia by eWater (Stochastic Climate
Library) but it is beyond the scope of this report to assess the significance of any differences resulting

16 Mt Todd Gold Project
Surface Water Assessment - Hydrology
from the application of the selected stochastic model. The following is a brief description of the main
components of the model:
The model assumes that the water treatment plant is implemented within the first year of mine
production. Transfers to the water treatment plant equalisation pond from the TSF (reclaimed water
and seepage), WRD retention pond, low grade ore pond, stormwater retention pond, Batman Pit and
the HLP retention pond (seepage) are determined by the model using inputs of daily climate data,
rainfall-runoff coefficients and required freeboard criteria. Transfers to the equalisation pond proceed
so long as water level remains below the prescribed freeboard within the equalisation pond otherwise
uncontrolled discharges from retention ponds throughout the mine are permitted. The size of the
water treatment plant equalisation pond has been determined by model simulation to reduce the risk
of overflows.
The model relies on an external calculation of available reclaim water from the TSF. Outflows of
seepage and reclaimed water from the TSF are obtained from a SeepW analysis which was carried
out by previous studies and the output from a spreadsheet water balance model described in Section
2.7.3. It is assumed that the spreadsheet models have been updated in tandem with the Goldsim
model to be representative of the latest mine development plan.
Water supply from the RWD is assumed to be infinite due to the problems encountered in calculating
a storage curve because of uncertainties in topographic data for the storage basin.
The HLP may be closed at the beginning of the production phase and seepage flows which are
transferred to the water treatment plant are reduced accordingly.
Modelling of Batman Pit assumes that groundwater inflows and outflows are negligible and are not
included in the water balance. Recent work by hydrogeologists indicates that average groundwater
inflow could vary between a few litres per second and 31 L/s over the production period of the mine.
Model simulations for the production period commence with a pit water level equivalent to about 1.8
million m3 (1081 m) which is about 15% of the reported maximum volume of 12 million m
3 (1144 m).
The selected start level is reported to have been obtained from the results of the Pre-production
Goldsim model.
Water in excess of processing plant and dust suppression requirements is pumped from the WTP via
a monitoring pond to Batman Creek/Edith River throughout the year.
Validation of the water balance model has involved comparison of the date, layout and operation of water
containment infrastructure with reported information. The absence of continuous records of transfers
between water management facilities, together with periodic rather than continuous recording of runoff
from disturbed areas (e.g. v-notch weirs downstream of WRD) have prevented a meaningful validation of
rainfall-runoff coefficients or seepage rates.
2.7.3 Production Phase Spreadsheet Model of TSFs
Spreadsheet models represent a monthly water balance of inflows to the existing and future tailings
storage facilities comprising dry tailings, entrained water and rainfall, and outflows comprising
evaporation and reclaim water. Models representative of simulations carried out in the past were
available for review and represent the period of mine production.
The primary output of the model is a time series of the dam crest levels that will be required to contain
projected inflows of dry tailings and entrained water, together with output of the quantity of accumulated

17 Mt Todd Gold Project
Surface Water Assessment - Hydrology
free water during each month of the production period. Also available are time series of simulated
monthly volumes of dry tailings and entrained water within both tailings storage facilities (TSF1 and
TSF2), together with the surface area of free water and its distance from the dam.
Outputs which are available for use in Goldsim model water balances comprise free water volume at the
time of closure of both tailings storage facilities, also the plant water requirement for the calculation of
make-up water demand on the equalisation pond during times when the raw water dam is empty.
Two spreadsheets are available (Water Balance_12-08-10_100MT.xls and Water Balance_12-08-
10_BIG.xls) and represent the staged construction of storage capacity (embankment lifts) during the
following periods:
Oct 2012 to Jul 2018 – representing six ‘lifts’ (2012, 2014, 2015, 2016, 2017, 2018); and
Aug 2018 to Jan 2028 – representing four ‘lifts’ (2018, 2019, 2022, 2025).
There appears to be no formal documentation for the spreadsheet models.
The model contains mean monthly values of rainfall and evaporation (adjusted by a constant pan factor
of 0.72) which are recursively applied in each year of the simulation to calculate the volume of free water.
A Probable Maximum Precipitation (PMP) 24-hour storm volume has been included in the water balance
to assess dam crest elevation requirements. No seepage into or out of the tailings storage facilities has
been included. The model appears to assume that seepage inflows and outflows are balanced.
A catchment and impoundment area of 75.318 ha is assumed for the existing TSF which excludes the
proportion (~70%) of the Horseshoe Creek catchment that is diverted around the eastern side of the
facility. An area of 1.65ha has been used for the future facility.
Tailings production is defined within the model for the purposes of calculating the volume of dry tailings
and entrained water. Monthly production has been pro-rated from an annual value of 10,650,000 tonnes
(Tom Dyer, MDA, Oct 2010). The slurry solids by weight is assumed to be 50%.
Water use by the plant is assumed to be 1,536m3/h (Tom DeMull, Nov 2010) less reclaim water which
varies between 500m3/h and 1,000m
3/h. The tailings water facility does not include inflows from the water
treatment plant.
The model contains storage curves for various levels of tailings deposits ranging between 133.5m to
158.0m in the first TSF1 (RP7) and 118.0m to 183.6m in the second TSF2 (RP8). No details are
available regarding the source of this data and it is therefore assumed to be correct.
The lack of formal documentation regarding the source of model contents hampered a thorough
validation of the models.
Model assumptions regarding the balance of seepage inflows and outflows along with the source of
information used to compile storage curves, tailings production and water use data have not been
reviewed. Given the changes to mine development it is assumed that the reviewed spreadsheet models
have been superseded and that the required data for input to the Goldsim water balance model relating
to TSF reclaim water has been obtained from an alternative source.

18 Mt Todd Gold Project
Surface Water Assessment - Hydrology
2.7.4 Post Closure Phase Goldsim Model
This Goldsim model estimates the annual treatment stream during the post closure phase of the mine’s
life cycle determined over a period of 600 years. It is unclear why this particular length of simulation was
chosen. The treatment stream comprises:
Seepage flows from the WRD;
Seepage flows from the HLP; and
Seepage flows from TSF.
Runoff from the low grade ore stockpiles and the plant area are not included, presumably because these
areas will be decommissioned and allowed to drain untreated into Batman Creek.
The model has been implemented within Goldsim and uses a monthly time step. Some model details are
given in ‘Mt Todd Mine Life Water Balance – 10.6 Mtpy Mine Plan', Hydrogeologica, December 2010.
The model contains daily values of rainfall and evaporation (adjusted by a constant pan factor of 0.78) for
two alternative periods of 137 years and 20 years. The user can recursively apply either period of daily
values to achieve a simulation of 600 years. It is unclear why these periods are applied recursively as
other model inputs are fixed and thus the response of the system does not change after the first period of
simulated rainfall.
Climate change is an emerging issue and the effects are, at this stage, complex to quantify. The absence
of a representation of the year on year variability in rainfall or the effects of climate change prevent a
robust assessment of water management performance or an assessment of specific drivers to mitigate
climate change.
The water balance of Batman Pit includes runoff from the pit walls and is modelled as a percentage
(75%) of rainfall. This is a conservatively high runoff factor commensurate with the purposes of the water
balance in determining potential overflows from the pit. The calculation of the exposed area of pit wall
takes into account the changing water level in the pit.
Surface runoff and seepage flow from the WRD are modelled by means of a combined runoff factor
which specifies that during the wet season (November to April) outflows amount to 5% of rainfall and will
take 30 days to reach the WRD outlet. It is assumed that seepage during the dry period is insignificant.
Surface runoff and seepage from the HLP is also modelled as a combined percentage of rainfall. It is
assumed that 5% of rainfall would drain from the pad during all months and take between 25 and 65
days to reach the outlet. It is understood that these values were obtained by model calibration (Tetra
Tech memo, Dec 2010).
A SeepW finite element seepage analysis has been carried out (Tetra Tech memo, Sep 2010) to
determine rates of seepage from the first TSF1 (RP7). Seepage rates from the second TSF2 (RP8) have
been scaled from these rates. Given the changes to the design of the second TSF2 estimates of
seepage may need to be revised.
The potential for overflows from Batman Pit are assessed by means of a daily water balance of inflows
(rainfall over water surface and runoff from pit walls) and outflows (evaporation from water surface).
Groundwater inflows and outflows are assumed to be negligible and have not been included. Recent
work by hydrogeologists indicates that average groundwater inflow could vary between a few litres per
second and 31L/s.
19 Mt Todd Gold Project
Surface Water Assessment - Hydrology
The simulation makes the assumption that 5.09 million m3 of water will be present within the pit at the
beginning of the simulation. The model shows the pit as having a maximum storage capacity of just over
222 million m3 and a maximum footprint of 117.4ha. This differs from the latest proposed footprint of
137ha and will therefore cause an underestimation of pit inflow. However, it is unlikely to significantly
alter the outcome of the water balance.
The lack of records for transfers from the HLP pond make further checks on the validity of seepage rates
and response times problematic.
2.7.5 Post Closure Phase Tetra Tech Groundwater Model
A recent water balance involving the simulation of groundwater inflows to Batman Pit during a post
closure period of 500 years has been carried out by Tetra Tech, May 2013.
Modelling has represented inflows to the pit from groundwater seepage, direct rainfall and runoff from pit
walls. Evaporation from the ponded surface represents the only pit outflow. Details of the extent of pit
excavation and areas of external catchment, pit wall and ponded surface are not provided. Groundwater
inflows were obtained from the results of a MODFLOW groundwater model.
The lack of details regarding the extent of excavated pit makes a comparison with the results of Goldsim
modelling problematic. Given that this modelling was carried out more recently it is assumed its results
will be more representative of the latest mine development plan.
2.8 Summary of Water Balance Results
It has been assumed that the proposed system will consist of infrastructure and operations in line with
those described in Table 5 of this report as represented by the contents of available water balance
models. Some discrepancies exist between modelled and reported areas of development footprints for
the Low Grade Ore Stockpile, Batman Pit, to a lesser extent the Waste Rock Dump, and in the expected
period of mine production. Differences in the development footprint of the pit will have a significant
impact on expected inflow and may alter the assumptions regarding transfer rates to the WTP from the
pit which may then impact transfers from other areas of the mine.
The following summary of water management performance during the production phase is extracted from
the Goldsim Model - MtToddWB_Production_PFS_45K - Vista Gold Australia Pty Ltd, 2013 and is based
on probabilistic output (100 x 12-year daily sequences). No assessment regarding the validity of the
stochastic rainfall generation model has been made.
The performance during post closure is obtained from the Goldsim model – ‘MtToddWB_LOM2011
Update_Post-Closure_PPT_Chooser, July 2012.
2.8.1 TSF Production Phase
Available water reclaim rates during the dry season increase slightly from 9,600 m3/day to 10,200 m
3/day
after seven years and is assumed to reflect the change from TSF1 to TSF2. Wet season water reclaim
rates remain constant throughout the production period (19,200 m3/day). Ninety percent of this total is
transferred to the equalisation pond and 10 percent is sent directly to the WTP (Goldsim Model
MtToddWB_Production_PFS_45K - Vista Gold Australia Pty Ltd, 2013).
20 Mt Todd Gold Project
Surface Water Assessment - Hydrology
2.8.2 TSF Post-closure Phase
Water reclaim rates from the future TSF1 are estimated to vary between 6.5 m3/day and 52.5 m
3/day
whilst those of TSF2 will vary between 25 m3/day and 176 m
3/day. This water will need to be transferred
to the water treatment plant until a passive treatment cell has been constructed.
2.8.3 Water Containment Facilities - Production Phase
An equalisation pond with a capacity of 30,000 m3 in association with a WTP rate of 300 m
3/h (years 1 to
3) and 500 m3/h (years 4 to 12) is sufficient to receive transfers from the WRD retention pond (RP1), low
grade ore retention pond (RP2), stormwater sediment pond (RP5), TSF1/2, HLP and Batman Pit (RP3)
to prevent uncontrolled overflows from these facilities and the equalisation pond during normal operation.
However, the model results show instances of overflow at the WRD retention pond (RP1), low grade ore
retention pond (RP2) and stormwater sediment pond (RP5) (Table 14). This is most likely the result of
insufficient pump capacity on pipelines to the equalisation pond during high intensity rainfall events. The
water management strategy leading up to and during extreme peak rainfall is likely to invoke different
operating rules to those that are represented in the Goldsim water balance which are representative of
normal operating conditions. This could involve measures such as the temporary transfer of excess
water to the TSFs.
Overflows from the stormwater sediment pond (RP5) are to be expected given its function as a sediment
trap rather than a water retention pond.
Overflows from the WRD retention pond (RP1) are less likely during later years of production because
the WRD progressively fills the catchment and surface runoff is replaced by less intense seepage flow.
A maximum storage capacity in the HLP of 67,545 m3 is assumed by the water balance model and the
model indicates a number of spills during the first three years. After year 3 the model estimates a
maximum storage of only 7,615 m3 is utilised on any one day which reflects the decommissioning and
the consequent reduction in seepage inflow.
2.8.4 Water Containment Facilities - Post-Closure
Seepage rates from the WRD are estimated to range between 0 and 2304 m3/day and will be treated at
the water treatment plant until a passive treatment cell has been constructed.
Water levels in Batman Pit are estimated to rise over a long period of time before reaching equilibrium
(Figure 3) at which point evaporation balances inflow from groundwater, surface runoff and rainfall.
The results of a Goldsim water balance indicate that water levels in Batman Pit are expected to reach
equilibrium at a level of between 975 m and 977 m (169 m and 167 m below the 1144 m top of pit level).
However, this assumes no groundwater inflow which recent investigations indicate could be up to 31L/s.
The results of a more recent water balance for a 500 year post closure period which included
groundwater inflows of between a few litres per second and 31 L/s show that “….pit lake water level rose
relatively rapidly following cessation of pit dewatering and after 345 years had reached approximate
steady-state at an elevation of approximately -15 mAHD and with the water surface covering an area of
approximately 656,250 m2 (65.625 ha). Starting at that time, the modelled water surface elevation
fluctuated between approximately -15.054 and -14.941 mAHD ….” (Section 6.2. Tetra Tech. May 2013).

21 Mt Todd Gold Project
Surface Water Assessment - Hydrology
Figure 3 Simulated Post Closure Water Levels in Batman Pit (Tetra Tech May 2013, Figure 6.5)
2.8.5 Water Supply - Construction Phase
No details have been found but water demands are expected to be relatively small and given the
relatively large size of the raw water dam are expected to be met without difficulty.
2.8.6 Water Supply - Production Phase
Water demands comprise mainly of the requirements for:
processing - 24,230 m3/day for years 1 to 3 and 36,409 m
3/day for years 4 to 12; and
dust suppression – average daily demand of 562 m3/day where the monthly demand has a maximum
of 1153 m3/day in July/August and a minimum of 220 m
3/day between November and March.
A schematic of the mine infrastructure and transfers associated with the supply of these demands is
shown in Figure 4.

22 Mt Todd Gold Project
Surface Water Assessment - Hydrology
Water Containment Water Supply Demands
Transfers
Transfers
Transfers
TSF1 &2
WTP
RWD
RP1RP2RP3RP5HLP
Processing Plant
Dust Suppression
EQP
Figure 4 Schematic of Mine Water Supply System
The simulated minimum and maximum daily rates of supply to meet processing plant and dust
suppression demands are summarised in Table 11 and Table 12. The results have been extracted from
100 simulations of stochastically generated 12 year sequences of daily rainfall input. Therefore,
maximum or minimum values for each water source do not necessarily occur on the same day and thus
the values from individual resources do not necessarily add up to the reported combined inflow total.
The simulation results confirm that processing plant water demands can be supplied without failure by a
combination of supply from the WTP, RWD (assuming an infinite resource) and reclaim water from the
TSF. The WTP contributes a minimum daily flow of 6,950 m3/day during years 1 to 3 and 12,000 m
3/day
during years 4 to 12. Shortfalls in the processing plant demand are made up by transfers from the RWD
and/or TSF at maximum rates of 17,030 m3/day and 17,280 m
3/day, respectively.
Table 11 Simulated Rates of Water Supply to Processing Plant and Percentage Days Failure
Component Year
1 2 3 4 5 6 7 8 9 10 11 12
Maximum from WTP (m
3/day)
7200 7200 7200 12000 12000 12000 12000 12000 12000 12000 12000 12000
Minimum from WTP (m
3/day)
6950 6950 6950 6950 12000 12000 12000 12000 12000 12000 12000 12000
Maximum from RWD (m
3/day)
17030 8390 8390 8390 15769 15229 15229 15229 15229 15229 15229 15229
Minimum from RWD (m
3/day)
0 0 0 0 7129 7129 7129 7129 7129 7129 7129 7129
Maximum from TSF (m
3/day)
17280 17280 17280 17280 17280 17280 17280 17280 17280 17280 17280 17280

23 Mt Todd Gold Project
Surface Water Assessment - Hydrology
Component Year
1 2 3 4 5 6 7 8 9 10 11 12
Minimum from TSF (m
3/day)
0 8640 8640 8640 8640 9180 9180 9180 9180 9180 9180 9180
Maximum combined inflow (m
3/day)
24230 24230 24230 36409 36409 36409 36409 36409 36409 36409 36409 36409
Minimum combined inflow (m
3/day)
24230 24230 24230 24230 36409 36409 36409 36409 36409 36409 36409 36409
% No days with failure in supplying demand
0 0 0 0 0 0 0 0 0 0 0 0
Source: 100 x 12 year sequences generated by Goldsim Model MtToddWB_Production_PFS_45K - Vista Gold Australia Pty Ltd, 2013 Note: maximum values do not necessarily occur on the same day and therefore rows are not additive.
Water supply for dust suppression is obtained from the WTP and RWD. Transfers will be made to a
storage tank with a capacity equivalent to two days maximum dust suppression (2 days x 1153 m3/day x
0.95 = 2191 m3). The simulation results in Table 12 include both the requirement for tank top-up water
and dust suppression. The simulation shows that the majority of water requirements are sourced from
the RWD and that after year 3 a failure in supply can be expected in approximately 4 percent of days in
each year and is most probably the consequence of limitations in the assumed transfer infrastructure.
Table 12 Simulated Rates of Water Supply for Dust Suppression and Percentage Days Failure
Type Year
1 2 3 4 5 6 7 8 9 10 11 12
Maximum supplied from RWD (m
3/day)
b
2651 2651 2609 2647 2645 2631 2644 2637 2622 2649 2638 2651
Maximum from WTP (m
3/day)
250 250 250 250 0 0 0 0 0 0 0 0
Maximum combined from RWD+WTP (m
3/day)
a b
2651 2651 2609 2647 2645 2631 2644 2637 2622 2649 2638 2650
% No days with failure in supplying demand
b
0.3 0.0 0.0 2.9 3.6 3.5 3.6 3.7 3.5 3.6 3.6 3.7
source: 100 x 12 year sequences generated by Goldsim Model MtToddWB_Production_PFS_45K - Vista Gold Australia Pty Ltd, 2013 Note:
a maximum values do not necessarily occur on the same day and therefore rows are not additive
b includes top up
water for dust tank
2.8.7 Water Supply - Post-closure Phase
No details were reported and it is assumed that there will be no on-going demand for water.

24 Mt Todd Gold Project
Surface Water Assessment - Hydrology
2.8.8 Overflows to the environment - Production Phase
Model simulations have assumed a WTP with a capacity of 300 m3/h for years 1 to 3 and 500 m
3/h for
years 4 to 12, in association with an equalisation pond capacity of 30,000 m3 and a combined pump
capacity for transfers from retention ponds (including TSF) to the equalisation pond of 37,315 m3/day
(Table 3).
The simulated maximum rate of inflow to the equalisation pond (Table 13) is constant (30,595 m3/day)
during production years and is controlled by a combination of equalisation pond capacity and its net rate
of evaporation together with available treatment capacity. A relatively small amount of excess water is
discharged from the WTP during the first three years of operation (maximum 250 m3/day). This is most
probably caused by the adoption of a fixed water transfer operating rule regardless of mine production
and is not expected to occur during actual operations when rates of transfer will be dynamically
controlled.
Simulations show that the EQP and WTP are able to prevent overflows from retention ponds during
normal operating conditions. However, the results also show that overflow from the WRD retention pond
(RP1), low grade ore retention pond (RP2), HLP and stormwater sediment pond (RP5) can occur during
high intensity storms and is possibly the result of insufficient pump capacity on pipelines to the
equalisation pond. The simulated frequency and maximum rate of overflow during the production period
is reported in Table 14.
The water management strategy leading up to and during extreme peak rainfall is likely to invoke
different operating rules to those represented in the Goldsim water balance which are representative of
normal operating conditions. This could involve measures such as the temporary transfer of excess
water to the TSFs. Also, given the occurrence of overflows during periods of extreme rainfall it is likely
that flows within the Edith River will also be higher than normal and the dilution criteria for discharge may
not be contravened.
No overflows from Batman Pit were predicted by the water balance simulation during production or post
closure phases as evaporation is expected to balance inflows. Any net groundwater inflows have not
been included in the water balance during production years.
Table 13 Simulated Rates of Transfer to Equalisation Pond
Type Year
1 2 3 4 5 6 7 8 9 10 11 12
Maximum combined inflow (m
3/day)
30595 30595 30595 30595 30595 30595 30595 30595 30595 30595 30595 30595
Minimum combined inflow (m
3/day)
0 960 960 960 960 1020 1020 1020 1020 1020 1020 1020
Maximum discharge to Edith River (m
3/day)
250 250 250 250 0 0 0 0 0 0 0 0
Minimum discharge
0 0 0 0 0 0 0 0 0 0 0 0

25 Mt Todd Gold Project
Surface Water Assessment - Hydrology
Type Year
1 2 3 4 5 6 7 8 9 10 11 12
to Edith River (m
3/day)
Source: 100 x 12 year sequences generated by Goldsim Model MtToddWB_Production_PFS_45K - Vista Gold Australia Pty Ltd, 2013
Table 14 Simulated Percentage Days when Untreated Water Overflows to Creeks
Pond
Year
1 2 3 4 5 6 7 8 9 10 11 12 Max. Spill (m
3/day)
RP1 5.2 8.3 9.5 6.0 0.0 0.0 0.0 0.0 0.0 0.0 0.0 0.0 329,400
RP2 1.5 2.5 1.9 1.5 0.7 0.6 0.7 0.5 0.7 0.6 0.7 0.7 48,018
RP3 0.0 0.0 0.0 0.0 0.0 0.0 0.0 0.0 0.0 0.0 0.0 0.0 0
RP5 2.3 3.2 2.8 2.4 1.2 1.1 1.2 1.0 1.1 1.1 1.2 1.2 52,036
HLP 6.1 14.6 8.9 0.0 0.0 0.0 0.0 0.0 0.0 0.0 0.0 0.0 9,226
Source: 100 x 12 year sequences generated by Goldsim Model MtToddWB_Production_PFS_45K - Vista Gold Australia Pty Ltd, 2013
2.8.9 Over Flows to the Environment - Post-closure Phase
Daily treatment rates are estimated to vary from 180 m3/day during early times after pit closure to rates
approaching 39 m3/day at much later times.
2.8.10 Model Assumptions
The water present in Batman Pit at the commencement of the production phase is 1.8 million m3
(1081 m) which is about 15% of the reported maximum volume of about 12 million m3 (1144 m).
Simulations have not considered groundwater inflows or outflows and recent investigations indicate that
groundwater inflows could occur up to 31L/s.
The west catchment diversions at the WRD are constructed and will capture and divert runoff away from
the pond from 22% of the catchment and up to a 10-year, 24-hour storm event (12.3m3/s) (GHD, 2010).
The WRD will reach a maximum footprint of 202.5 ha after two years of production.
Discharge into the Edith River of excess water from the WTP can occur at any time of the year.
The RWD has been modelled as an infinite resource due to uncertainties in topographic data preventing
the calculation of a storage curve.
Reclaim water from the TSF (TSF1 and TSF2) is estimated to be 19,200m3/day during the wet season
and between 9,600m3/day and 10,200m
3/day in the dry season. Bleed water from the TSF is estimated
to be 1,920m3/day in the wet season and 960m
3/day during the dry season.

26 Mt Todd Gold Project
Surface Water Assessment - Hydrology
2.9 Summary
2.9.1 Production Phase
The performance of water containment infrastructure has been assessed by means of a Goldsim water
balance model (Goldsim Model MtToddWB_Production_PFS_45K - Vista Gold Australia Pty Ltd, 2013).
A water balance representing the 12-year production phase of the mine has been simulated using
stochastic methods to generate rainfall input. The assumed mine production period differs from the
latest proposal which is for a 13-year production period. With the exception of the discrepancies in the
development footprint of the Low Grade Ore Stockpiles and Batman Pit (Table 1) the model appears to
have represented the physical extent of proposed mine development albeit in a shorter than expected
time schedule. This broadly faithful representation in partnership with a probabilistic approach represents
a reasonably robust assessment of water containment capacity. It is unlikely that the extension of the
simulation by three years would significantly alter the study outcome in terms of WTP capacity or annual
frequency of retention pond overflow.
The water balance demonstrates that a WTP with capacity of 300 m3/h in years 1 to 3 and 500 m
3/h is
able to limit the incidence of overflows from retention ponds to periods of high intensity rainfall which are
likely to have a relatively low frequency of occurrence during the life of mine. Simulated overflows to the
downstream environment will occur as a consequence of extreme rainfall that exceeds the design criteria
of infrastructure and it is likely that such events will involve widespread rainfall. Therefore, it is also likely
that at the same time flows within receiving waters and the Edith River will also be elevated due to high
rainfall over their own catchments. As a result the dilution criteria to allow mine water discharge may not
be contravened.
The water balance has also shown that process water demands can be met without failure from
combined transfers from the WTP, RWD and TSF. However, this assessment has not investigated any
limits to the available supply from the RWD.
The following summary is limited to the reporting of averages calculated from the output of all 100
stochastic simulations:
Catchment draining into mine affected areas (RP1, RP2, RP5) – 266ha decreasing to 124ha over
LOM;
Combined surface runoff entering retention ponds (RP1, RP2, RP5, excluding the TSF where runoff
is not modelled explicitly in the water balance and is assumed to be represented by tailings reclaim
water) – 2.6 GL/yr;
Estimated reclaim water from tailings – 5.2 GL/yr;
Combined seepage from material stores entering retention ponds (RP1, HLP, TSF) – 0.8 GL/yr;
Combined water retention and sediment pond storage (RP1, RP2, HLP, RP5, TSF) – 18 GL;
Total water demand (process plant) – 8.8 increasing to 13.2 GL/yr during LOM and supplied from:
– Average supply from WTP – 2.6 to 4.4 GL/yr
– Average supply from TSF – 4.7 to 4.8 GL/yr
– Average supply from RWD – 1.5 to 4.0 GL/yr
Total water demand (dust suppression) – 0.2 GL/yr and supplied mainly from RWD:

27 Mt Todd Gold Project
Surface Water Assessment - Hydrology
– Average supply from WTP – <0.01 GL/yr
– Average supply from RWD – 0.2 GL/yr
– Average excess discharge from WTP to the downstream environment – 0.02 GL/yr during first 3
years and thereafter 0 GL/yr;
Combined average uncontrolled overflow from retention ponds to the downstream environment –
between 0.02 and 0.06 GL/yr.
The Goldsim water balance makes a number of assumptions which include no net groundwater inflow to
Batman Pit. Also, the quantity of reclaim water available from the TSF for use in water supply has been
determined externally to the Goldsim model and has not involved a water balance of the TSF within the
model. Furthermore, the simulation of water supply assumes an unlimited water supply from the RWD.
The risk of shortfall in water supply is considered to be an economic risk rather than an environmental
impact.
It is unclear what design storm rainfall event was used in the original design of the water management
system, however, it is unlikely that design criteria exceeded a 100-year ARI as this is a generally
accepted upper limit for the design of water containment storage. The severity of long duration storm
rainfall during recent wet seasons is unlikely to have been in excess of a 100-year ARI (see Section 2.2)
and it can be expected that the performance of larger storage infrastructure would not have been
compromised. However, it is possible that shorter duration storm events were more extreme and smaller
storage together with conveyance infrastructure might have been compromised.
2.9.2 Post-Production Phase
The following results of a water balance for the post closure phase were obtained from the Goldsim
model - MtToddWB_LOM2011Update_Post-Closure_PPT_Chooser, July 2012:
Seepage rates from the TSF are estimated to decrease to 39m3/day;
Seepage rates from the WRD are estimated to be up to 2304m3/day; and
Water levels in Batman Pit are expected to reach equilibrium level of between 975 m and 977 m
(relative to 1144 m top of pit) where evaporation equals inflow from rainfall. However, this assumes
no groundwater inflow which recent investigations indicate could be up to 31L/s.
A more recent water balance carried out by Tetra Tech (May 2013) has included groundwater inflow to
Batman Pit and suggests that water levels will reach equilibrium after 345 years at an elevation of
approximately -15mAHD.
The water balance simulation for the post closure phase does not include adjustments to rainfall that
represent the effects of climate change, natural or otherwise.

28 Mt Todd Gold Project
Surface Water Assessment - Hydrology
3. Stormwater Management
3.1 Introduction
The Mt Todd Mine is traversed by four creeks which drain into the Edith River to the south. Horseshoe
Creek and Batman Creek flow through the centre of the mine whilst West Creek passes close to the
western boundary and Stow Creek flows along the southern edge of the mine.
Storm rainfall during recent wet seasons has reportedly been in excess of a 100-year Average
Recurrence Interval (ARI) which likely exceeds the design criteria of most water management
infrastructure on site. It is therefore to be expected that the performance of existing stormwater
conveyance infrastructure has been compromised (Section 3.2).
An assessment of the potential impacts of flooding from Horseshoe Creek, Batman Creek, West Creek
and Stow Creek was undertaken to confirm the adequacy of existing/proposed stormwater management
measures from an environmental perspective. This assessment included:
Extending the description of flood peak and flood levels provided by previous studies through new
modelling;
Delineating catchment areas and identifying key catchment properties;
Evaluating the hydraulic performance of creeks flowing through the site;
Indicating critical regions for flood management based on inundation and scour risk; and
Recommending flood management strategies.
A number of studies have previously been carried out for the mine site and details are summarised in
Section 3.3. Where existing information was inadequate new modelling was carried out consisting of a
hydrological assessment to determine flood peak discharge and hydraulic flood routing to derive an
indication of flood immunity and the potential for scour (Section 3.4).
3.2 Existing infrastructure
Diversion structures exist along Horseshoe Creek, Batman Creek and Burrell Creek and are used to limit
the runoff from undisturbed areas of the mine and their upstream catchments from reaching existing
water containment and plant infrastructure.
Diversions are also present upstream of the low grade ore (LGO) stockpile and around the heap leach
pad (HLP) but with the purpose of collecting runoff from disturbed areas of the mine and directing it into
storage ponds for transfer to the water treatment plant.
Diversion drains have been constructed around the western margins of the existing waste rock dam
(WRD) retention pond (GHD, Nov 2010). The drains reduce the volume of uncontaminated runoff
entering the pond and thereby reduce the risk of overtopping. Diverted water will report to local creeks
downstream of the pond.
3.3 Previous Flood Studies
Three hydrological studies of the mine area are known to have been carried out and a summary of their
purpose and significant results are given below. Previous studies have limited their assessment of flood

29 Mt Todd Gold Project
Surface Water Assessment - Hydrology
inundation to reaches in the lower half of the mine area. In order to extend an understanding of flooding
extent, levels and velocities additional hydrological and hydraulic flood modelling has been undertaken
for the 10 and 100 year ARI design events.
AGC Woodward-Clyde (Oct 1992) – This study estimated the extent of flood inundation along the lower
sections of Batman Creek and Horseshoe Creek during a 100-year ARI storm event. Flood peak
discharge was estimated by means of the Rational Method and flood extents derived from water levels
modelled by HEC2 and interpolation within 2m contour maps. Whilst a map of flood extents (Figure 5)
was produced values of flood peak discharge and flood level were not reported.
Figure 5 AGC Woodward-Clyde Study Modelled Flood Extents
Knight Piesold (July 1995) – This study estimated flood levels along Horseshoe Creek adjacent to the
site of the TSF to assist with the design of engineering works to protect the tailings embankment. Flood
discharges for 10-year, 20-year and 100-year ARI storm events were calculated by means of RORB
modelling software and flood levels determined with a HEC-2 water surface profile model. Flood
discharges were calculated for both the north-west tributary upstream of the TSF and the north -east
tributary which is now occupied by the Raw Water Dam. Modelling took into consideration the attenuating
effects of the dam in deriving flood peaks in Horseshoe Creek downstream of the confluence. The flood
peak discharges determined by the study are reported in Table 15 and flood levels determined by the
study are reproduced in Table 16.

30 Mt Todd Gold Project
Surface Water Assessment - Hydrology
Table 15 Knight Piesold Study Flood Peaks
ARI (yrs) North-west
tributary (m3/s)
North-east tributary (m
3/s)
Downstream of confluence (m
3/s)
10 75 52 127
20 90 64 154
100 135 92 227
Source: Knight Piesold, July 1995 and includes attenuating effect of RWD
Table 16 Knight Piesold Study Flood Levels
ARI (yrs) Northern end of TSF Confluence of tributaries Southern end of TSF
10 131.3 125.5 122.3
20 131.3 125.7 122.4
100 131.7 126.1 122.8
Source: Knight Piesold, July 1995
The report indicated that flood depths next to the tailings embankment would be 1 to 1.9 m during a 100-
year ARI event with velocities in the channel of between 2 and 3 m/s reducing to 1 m/s over the
floodplain. The study proposed the diversion of the north western creek by means of a 420 m long
channel along the northern end of the TSF. It also recommended the re-alignment of the creek to further
protect the embankment but no maps illustrating this alignment have been found.
GHD (Nov 2010) – This study calculated the capacity of drains to reduce the volume of runoff entering
the WRD retention pond from undisturbed areas to the east and west (Figure 6). Flood discharges from
surrounding catchments during 10-year ARI storm event were calculated by means of the Rational
Method (Table 17). Drains were sized using standard open channel flow calculations. The drains have
been designed with a capacity to divert flows up to a 10-year ARI storm event as the volume of overflow
during more severe events is considered to be insignificant relative to the pond capacity due to the
infrequency and shortness of such extreme events. The drains are considered to be effective in reducing
the catchment area contributing runoff to the pond by 20% during storm events with a magnitude of less
than a 10-year ARI.
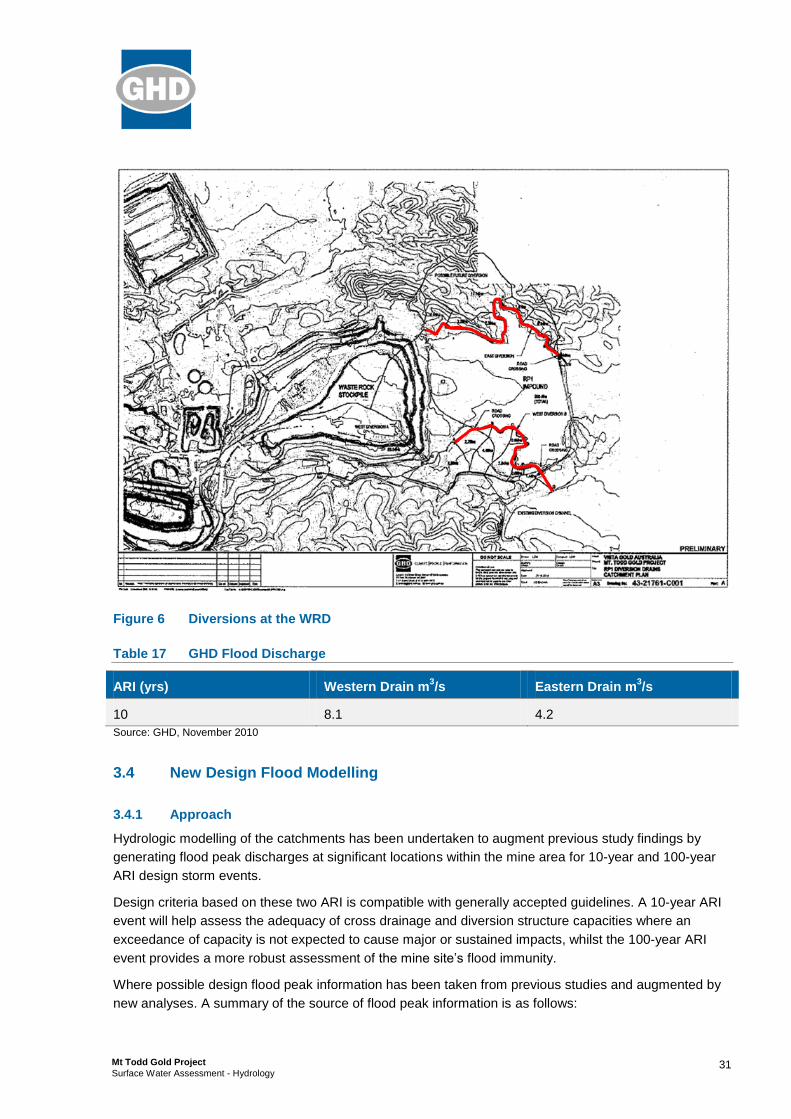
31 Mt Todd Gold Project
Surface Water Assessment - Hydrology
Figure 6 Diversions at the WRD
Table 17 GHD Flood Discharge
ARI (yrs) Western Drain m3/s Eastern Drain m
3/s
10 8.1 4.2
Source: GHD, November 2010
3.4 New Design Flood Modelling
3.4.1 Approach
Hydrologic modelling of the catchments has been undertaken to augment previous study findings by
generating flood peak discharges at significant locations within the mine area for 10-year and 100-year
ARI design storm events.
Design criteria based on these two ARI is compatible with generally accepted guidelines. A 10-year ARI
event will help assess the adequacy of cross drainage and diversion structure capacities where an
exceedance of capacity is not expected to cause major or sustained impacts, whilst the 100-year ARI
event provides a more robust assessment of the mine site’s flood immunity.
Where possible design flood peak information has been taken from previous studies and augmented by
new analyses. A summary of the source of flood peak information is as follows:

32 Mt Todd Gold Project
Surface Water Assessment - Hydrology
Horseshoe Creek, with flood peaks at locations downstream of the confluence of the north-western
and north-eastern (including Raw Water Dam) tributaries, also along the north-western tributary at
the northern end of the TSF, extracted from the previous study by Knight Piesold (July 1995).
Batman Creek at a location just upstream of Batman Pit was calculated by the Rational Method.
Catchments draining into Burrell Creek were also calculated with the Rational Method.
Catchments draining into Stow Creek calculated by the Rational Method.
In the absence of flood peak estimates for most of the catchments, recourse to new modelling involving
the application of the Rational Method was required. The Australian Rainfall and Runoff (ARR) from
Engineers Australia (1987) provides slightly different methodologies for the application of the Rational
Method in different areas of Australia. Due to the sparseness of recorded flood frequency information,
runoff coefficients have only been defined for flood events up to and including the 10-year ARI. The
calculation of design flood peaks for more extreme events relies on frequency factors to scale up the 10-
year ARI event.
Figure 7 shows the catchments for which flood peaks have been determined and the following sections
provide a description of model input data and results.
Figure 7 Modelled Catchments

33 Mt Todd Gold Project
Surface Water Assessment - Hydrology
3.4.2 Input Data
Design storm rainfall for 10-year and 100-year ARIs was obtained for the mine site from the Bureau of
Meteorology website for standard design storm durations ranging from 15 minutes to 72 hours (Table
18). The Intensity-Frequency-Duration (IFD) values are determined from the bureau’s rainfall database
which includes interpolated data for areas which have not benefited from continuously recording rain
gauges such as the mine site.
Storm durations have been determined on the basis of the concept of catchment ‘Time of Concentration’.
The Bransby-Williams formula was used to determine the time of concentration at each location and
values are reported in Table 19.
Table 18 IFD Rainfall Data for Mt Todd Mine
Storm Duration Average Recurrence Interval
1-year 2-years 5-years 10-years 20-years 50-years 100-years
5 minutes 116 149 186 209 241 283 317
6 minutes 108 139 174 195 225 265 296
10 minutes 89.9 115 144 161 186 218 244
20 minutes 68.9 88 109 122 140 163 182
30 minutes 57.3 73 90.3 101 115 134 150
1 hour 38.7 49.3 60.8 67.7 77.4 90.4 101
2 hours 23.7 30.3 37.4 41.7 47.7 55.7 62
3 hours 17.3 22.1 27.3 30.5 34.9 40.8 45.4
6 hours 9.89 12.6 15.7 17.6 20.2 23.6 26.4
12 hours 5.84 7.49 9.4 10.6 12.2 14.3 16
24 hours 3.68 4.75 6.07 6.88 7.99 9.5 10.7
48 hours 2.37 3.09 4.04 4.64 5.45 6.57 7.47
72 hours 1.72 2.26 3 3.47 4.11 4.99 5.71

34 Mt Todd Gold Project
Surface Water Assessment - Hydrology
Table 19 Rational Method Inputs for Flood Peak Estimation
Parameter Batman Creek
West/ Burrell Creek
Stow Creek
Horseshoe Creek {north
west tributary}
Horseshoe Creek {north
east tributary} 1
Area (km2) 6.58 1.16 101.27 13.06 24.70
Flow Path Length (km) 5.59 1.34 24.68 8.25 12.01
Flow Path Slope (m/km) 11.56 13.56 6.45 5.72 2.68
Time of Concentration (hrs) 2.74 0.76 10.35 4.35 6.92
100-year ARI Runoff Coefficient 0.99 0.99 0.99 0.99 0.99
100-year ARI Rainfall Intensity (mm/h)
57 98.4 19.6 - 2 -
2
10-year ARI Rainfall Intensity (mm/h)
32 67.6 - - 2 -
2
Notes:1 includes RWD basin
2 flood peaks sourced from Knight Piesold report (1995)
The extent of upstream catchments for creeks intersecting the site was delineated with Arc-Hydro® using
the 30 m Shuttle Radar Topography Mission (SRTM) digital elevation model acquired from Geoscience
Australia (2011). Local sub-catchment areas within the mine site have not been included; this will not
affect design flood peak estimates due to relatively small extent of these sub-catchments compared to
upstream areas and their shorter response times. The lengths of the main channels and the equal area
slopes as required for application of the Rational Method were calculated using the same SRTM
elevation data set.
The catchment areas surrounding the mine comprise low lying hills with rural land use and land cover
consisting of scrub and long grass. Runoff coefficients for the Rational Method calculations were
determined using the Department of Main Roads Road Drainage and Design Manual (2007), assuming
100% rural catchments and are listed in Table 19.
3.4.3 Design Flood Peak Results
Design flood peak discharges are available for Horseshoe Creek from a previous study by Knight Piesold
(1995) and are considered to be adequate for the purposes of this assessment. New design flood peak
modelling based on the Rational Method was required for the catchments of Batman Creek, Burrell/West
Creek and Stow Creek (see catchments shown in Figure 7).
A summary of the adopted design flood peaks for each of the creeks is given in Table 20. The results for
Horseshoe Creek as derived from the Knight Piesold (1995) study do not include the likely additional
attenuating effects created by the proposed 2m increase in dam height and are therefore slightly
conservative in terms of downstream flood magnitude.

35 Mt Todd Gold Project
Surface Water Assessment - Hydrology
Table 20 Design Flood Peak Estimates
Parameter Batman Creek
West / Burrell Creek
Stow Creek
Horseshoe Creek {north
west tributary}
1
Horseshoe Creek {north
east tributary}
1
Horseshoe Creek
{downstream of confluence}
1
10-year Peak (m
3/s)
58 20 - 75 52 127
100-year Peak (m
3/s)
103 34 546 135 92 227
1 source Knight Piesold report (1995)
3.5 Hydraulic Flood Routing
3.5.1 Approach
Maps showing the outline of the 100-year design flood event are available from the previous study of
AGC Woodward-Clyde (1992) but are limited in geographical extent (Figure 5). Therefore the results of
new hydraulic flood routing using inputs from hydrologic modelling (Table 20) have been used to extend
existing flood outlines and to assess likely velocities. This information will be used to assess flood
immunity and impacts on existing and proposed mine infrastructure and the potential for scour.
A steady state 1-D hydraulic model was constructed for each creek using HEC-RAS vers 4.1 (United
States Army Corps of Engineers, 2013). A 1-D steady state model has been selected because flows
occur in well-defined channels and the inter-change of flows between channel and floodplain is not
expected to be significant.
3.5.2 Hydraulic Model Data
The geometry of channels and floodplains for Batman, West/Burrell and Horseshoe Creeks was defined
at cross sections along each watercourse from a 1 m digital elevation map of the mine area (Figure 8).
This was augmented by 5 m digital elevation data to define the geometry of channels and floodplains
along Stow Creek.

36 Mt Todd Gold Project
Surface Water Assessment - Hydrology
Figure 8 Extent of Hydraulic Flood Routing Models
The Manning’s ‘n’ roughness coefficient has been used to represent the effects of surface friction on the
conveyance flood peak flows through channels and over floodplains. Estimates for roughness
coefficients were determined by analysis of aerial photography and with reference to industry standard
tables (Chow, 1959). A value of 0.04 was applied to the main channel and a value of 0.08 was used for
the floodplain.
Within the mine area two road crossings exist on Batman Creek and they comprise circular culverts of 2
x 1.6m diameter for the northern crossing and circular culverts of 8 x 1.1m diameter for the southern
crossing.
The upstream boundary condition in hydraulic models is obtained from the design flood peaks estimated
by hydrologic modelling (Table 20).
The downstream boundary representative of tailwater conditions in the lower reaches of Batman Creek,
Horseshoe Creek and Stow Creek has been represented by a water level of 120.5m. This level
corresponds to a level extrapolated from Stow Creek during what was calculated to be a 100-year event
(Knight Piesold, 1995). A normal flow depth specified by the stream bed slope was used in Burrell Creek
since the lower end of the model is not expected to have significant backwater effects from West Creek
or the Edith River due to the relatively steep terrain.
Any errors due to the assumptions regarding downstream boundary conditions are not expected to
significantly impact water levels in the vicinity of mine infrastructure due to the distance involved. Details
of the channel alignments and the extents of the cross-sections of the simulated channels and
floodplains are provided in Figure 8 and Figure 9.
37 Mt Todd Gold Project
Surface Water Assessment - Hydrology
3.5.3 Hydraulic Model Results
Flood Immunity
The results of hydraulic flood routing have been used to create an outline defining the extent of flooding
during a 100-year ARI design event. Overlaying this outline onto the footprint of mine infrastructure
allows an assessment of flood immunity (Figure 9). This indicates:
Significant encroachment of flood waters into the proposed TSF2, to a lesser extent into the LGO
Stockpile and to a minor extent into the mine facilities;
The capacity of the diversion channel which collects uncontaminated runoff from catchments of
Burrell Creek to the west of the WRD is exceeded at some locations along its length;
Inundation of significant reaches of the realigned site access road; and
The culverts on Batman Creek create a significant flow obstruction and backwater effect.
Given the absence of surveyed spot heights of infrastructure together with the approximation of flood
outlines between the locations of model cross sections this analysis is not suitable for design of
structures associated with flood mitigation.
Flood Velocity
Channel scour and degradation is dependent on the channel flow velocities. Commonly accepted
guidelines indicate that flows with a velocity in excess of 2 m/sec have the potential to cause scouring in
unlined channels. The locations where flow velocities are simulated to exceed this threshold are
depicted in Figure 10. Whilst this includes reaches on Batman Creek adjacent to mine facilities and along
Horseshoe Creek adjacent to site access and haul roads areas of potential significance are along Stow
Creek next to the proposed location of the embankment for the TSF2.
3.6 Potential Stormwater Drainage Impacts
Construction and operation of the mine has the potential to create the following hydrologic impacts:
Inundation of mine infrastructure due to flooding from local runoff;
Change in local flow regime due to creek diversions; and
Change in local flow regime due to construction of haulage roads across waterways.
Flood hazards within the mine site comprise:
Accumulation of direct rainfall in Batman Pit and the Heap Leach Pad creating a pond of potentially
contaminated water requiring disposal;
Inundation of Batman Pit and the Heap Leach Pad should the flood levees be breached;
Accumulation of direct rainfall in the Tailings Storage Facilities and Equalisation Pond resulting in a
breach of embankments and discharge of contaminated water;
Excessive runoff from the WRD and LGO Stockpile and accumulation of direct rainfall in the
respective Retention Ponds resulting in uncontrolled discharges of potentially contaminated water;
Erosion of the embankments and batters of the WRD, LGO Stockpile and Tailings Storage Facilities
possibly resulting in increased sediment loads and a deterioration of downstream water quality; and

38 Mt Todd Gold Project
Surface Water Assessment - Hydrology
Erosion of flood levees and increased sediment loads in runoff.
Construction of cross drainage structures such as culverts and causeways may result in:
Obstruction of natural waterways due to the build-up of sediment and/or debris resulting in an
increase in upstream water levels due to a reduction of existing flow area;
Increase in outlet velocities and therefore scouring; and
Changes in waterway sediment load.
Scour protection will be required at:
Locations where a narrowing of flow paths or an abrupt change in flow path direction or steep
gradients occur, either within channels due to cross drainage structures and natural features or on
floodplains due to obstacles or prominent landforms; however
Potential future flood management interventions such as culverts, channel diversions and flood
levees have not been assessed but may alter existing flow paths and could result in other areas
requiring erosion protection.
It should be noted that some storm rainfall events during recent wet seasons have reportedly been in
excess of a 100-year ARI design storm event, and likely exceed the design criteria of most water
management infrastructure on site. Therefore, it is to be expected that the performance of existing
storage and conveyance infrastructure has been compromised.
3.6.1 Potential Surface Water Contamination
Material Storage Dump Areas
Spoil dump areas may contain contaminated soil particles that can reduce surface water quality if
allowed to discharge into the natural environment.
Excess water accumulation around the outside of the spoil dump areas could potentially erode the inert
spoil banks, causing sediment-laden runoff into natural channels.
Process Plant Areas
Surface water runoff from the plant areas may contain traces of heavy metals and soil particles that can
reduce surface water quality if allowed into natural watercourses.

39 Mt Todd Gold Project
Surface Water Assessment - Hydrology
Figure 9 Modelled 100-year ARI Flood Extent

40 Mt Todd Gold Project
Surface Water Assessment - Hydrology
Figure 10 Simulated Channel Flow Velocities for the 100-year ARI event
41 Mt Todd Gold Project
Surface Water Assessment - Hydrology
4. Flood Management Measures
The following mitigation measures are proposed to minimise potential impacts during the production phase.
4.1 Flooding
Batman Creek, Horseshoe Creek, Burrell Creek and Stow Creek flow through or next to the mine area
and therefore have the potential to encroach on storage embankments and to inundate plant, pit and
other mine infrastructure. Potential flooding of the pit, process plant area and material storage dumps
has been minimised during their design by siting these facilities away from flood inundation areas or
through the construction of flood protection barriers/levees around each mine area. No further mitigation
measures are required.
Whilst it is recommended that proposed infrastructure is located outside the 100-year ARI flood extent to
minimise flood risk it is recognised that this is not always practical. For example, the proposed footprint of
the TSF2 and LGO Stockpiles will encroach on the 100-year ARI design flood extent. Construction of
diversion channels or flood protection levees will be required around these areas and other proposed
infrastructure at risk.
4.2 Diversion Channels and Levees
Diversion channels already exist at the following locations:
LGO Stockpile has a diversion structure that diverts water from the stockpile and conveys it to a
retention pond and away from Batman Creek. Erosion of this channel has occurred during storm
events although it is reported that the quality of the embankment has been improved following the
2008-09 wet season;
HLP generates runoff and seepage which is collected by a moat. The pad will either be reprocessed
or decommissioned and the site rehabilitated after the return to operations;
WRD has a diversion channel which collects uncontaminated runoff from catchments of Burrell Creek
to the west. The design capacity of this channel is not known but flood modelling shows that the
channel capacity may be less than the 10-year ARI flood event at some locations along its length
(Figure 11);
TSF1 embankment is protected against flood flows in Horseshoe Creek by means of a diversion
channel which flood modelling shows has a capacity equivalent to the 100-year design flood event.
Diversion channels are also located to the west of TSF1 and divert runoff northwards towards
Horseshoe Creek; and
In addition to diversion channels at the WRD, diversion channels have recently been constructed at
WRD retention pond to collect uncontaminated water from surrounding catchments. The WRD
retention pond has diversion channels for the collection of uncontaminated runoff to its west and east
(Figure 6). The channels have a capacity equivalent to 10-year ARI catchment runoff and thereby
reduce the catchment area contributing runoff to the pond by 20% during storm events with a
magnitude of less than a 10-year ARI.

42 Mt Todd Gold Project
Surface Water Assessment - Hydrology
Figure 11 Modelled 10-year ARI Flood Extent
Diversion channels are proposed at the following facilities and will be designed to minimise channel side
slopes, to keep maximum velocities below 2.0m/s and channel depths below 2.5m:
Run-of-Mine and additional LGO Stockpile will require collection ditches to capture runoff and
seepage from stockpiles for conveyance to retention ponds. The location and quantity of runoff is not
yet known and will need to be assessed during the design phase to determine the required channel
and storage embankment height:
– Cut-off perimeter drains with a capacity equivalent to the 10-year design storm event will be
required for the diversion of uncontaminated runoff around stockpiles and into Batman Creek.
– Hydraulic modelling has demonstrated that small areas of the proposed stockpiles will encroach
on the 100-year flood extent of Batman Creek and will require mitigation measures to reduce
flood risk. The backing-up of flood water behind culverts on Batman Creek is likely to be a
contributing factor and therefore re-design of culverts may assist in reducing flood risk.

43 Mt Todd Gold Project
Surface Water Assessment - Hydrology
Alternatively, construction of a levee with a height equivalent to the 100-year flood peak level plus
freeboard or construction of a stream diversion to bypass the portion of Batman Creek which
loops back toward the stockpile;
Clay borrow area will require erosion protection and sediment control structures to manage runoff
from the low permeability area.
New diversion channels and levees along Horseshoe Creek and Stow Creek have been designed to
protect the embankment of TSF 2 from flooding and erosion. Diversion channels have been designed
for the following 100-year ARI flood events:
– Stow Creek (Figure 12) designed for a peak flow of approximately 656m3/s. The channel will be
lined with rip-rap to reduce potential scour and erosion. The channel will have a width and length
of approximately 60m and 850m, respectively, and a nominal depth of 4.2m.
– Horseshoe Creek (Figure 13) designed to accommodate a peak flow of approximately 182m3/s
comprising 100m3/s of runoff from the Horseshoe Creek catchment and 82m
3/s of overflow from
the existing raw water supply dam. The channel will be lined with rip-rap to reduce scour and
erosion and have a width and length of approximately 40m and 550m, respectively, and a
nominal depth of 2.5m.
Upgrade or re-design of existing drains and levees in limited areas of the processing plant to cope
with a 100-year ARI flood event plus freeboard from Batman Creek.
– Drainage across the processing plant site will be limited by the installation of cut-off drains to
divert uncontaminated runoff from around the site and into Batman Creek via a settling pond.
– Stormwater vee-drains will be designed to collect water alongside plant roads and with drainage
conveyed beneath the roads via corrugated steel culverts to prevent scouring of plant roads. All
stormwater runoff will be directed toward the existing drainage channel on the east side of the
proposed process plant.
4.3 Cross Drainage Structures and Haul Roads
Flood modelling shows that these existing cross drainage structures on Batman Creek and Horseshoe
Creek will be overtopped during the 10-year and 100-year ARI flood events, also a significant length of
the road adjacent to the TSF1 will be inundated. The model results also show that these culverts cause
backwater effects upstream but this does not appear to cause inundation of mine infrastructure.
Furthermore, this backwater effect only occurs during extreme flood events and is therefore unlikely to be
a frequent occurrence.
Overtopping of cross drainage structures and haul roads is likely to be an infrequent occurrence but
upgrades to existing stormwater drainage, erosion and sediment controls, including the vegetation of
verges, will be necessary to minimise damage during less extreme but more frequent storm events.
Similar protection measures will be required for new roads with suitable cross drainage structures to
convey drainage beneath roads to prevent scour.

44 Mt Todd Gold Project
Surface Water Assessment - Hydrology
Figure 12 Stow Creek Diversion
Figure 13 Horseshoe Creek Diversion

45 Mt Todd Gold Project
Surface Water Assessment - Hydrology
4.4 Channel Protection
An indication of the erosion potential of 100-year ARI flood flows has been obtained from the velocity
results of hydraulic flood routing. This shows a number of locations along creeks may experience flow
velocities of greater than 2m/s (Figure 10).
Whilst the majority of these locations are sufficiently distant from mine infrastructure to be of no
immediate risk, the section of Batman Creek adjacent to the processing plant is likely to experience high
velocity flows during extreme flood events. Rip-rap protection to earthwork embankments adjacent to the
existing drainage channel on the east side of the proposed process plant will be installed for channel
protection.
Sections of Stow Creek in the vicinity of the proposed embankment of TSF2 are also expected to
experience high flow velocity during extreme flood events. Scour protection measures will include the
placement of rip-rap along the proposed channel diversion works.
4.5 Prevention of Surface Water Contamination
The potential for contamination of receiving waters has been reduced by segregation of “clean”
stormwater runoff from “dirty” stormwater runoff and the collection and treatment of “dirty” stormwater
runoff from areas within the mine site.
“Dirty” stormwater runoff emanates from disturbed mining areas including mine pits (pit water) and
material storage dumps. “Clean” stormwater runoff results from rainfall on undisturbed areas.
The method by which surface water contamination is to be minimised is provided below for each of the
land use areas.
4.6 Mine Pit Water
Mine pit water will evaporate or be pumped to the water treatment plant where it will re-used in mining
operations. The amount of pit water needing treatment has been reduced by minimising the stormwater
runoff into the pit by construction of runoff barriers (e.g. engineered mounds/levees) around the mine pit.
4.7 Material Storage Dump Areas
WRD construction will include 8m wide benches at 30m vertical intervals on the face of the WRD and
each lift will be constructed at 34o. These benches will function as stormwater drainages and as access
for closure cover installation, reclamation activities and maintenance. In general stormwater runoff from
material storage dumps has been minimised or will be minimised by:
Constructing dumps in a manner that dissipates runoff through seepage and evaporation;
Constructing the outer batter slopes of dumps with inert overburden material;
Construction of perimeter drains that collect runoff from the outer batter slopes and perimeter areas;
Construction of drainage lines that convey runoff from dump perimeter drains to water retention
ponds; and
Construction of water retention ponds that are sized to capture an ARI wet season rainfall
appropriate to their hazard category plus an appropriate freeboard allowance for sedimentation.

46 Mt Todd Gold Project
Surface Water Assessment - Hydrology
4.8 Processing Plant Areas
Surface water runoff from the plant area may contain traces of heavy metals, dust and soil particles that
can reduce surface water quality if allowed into natural watercourses. The plant area will be surrounded
by a bund forming a controlled drainage area.
4.9 Undisturbed Areas
Runoff from undisturbed land within and upstream of the mine site will be kept separate from “dirty”
runoff from undisturbed areas within the mine site. “Clean” runoff will be diverted downstream of the mine
site with no further treatment.
4.10 Extreme Rainfall Event Management
During extreme rainfall events in excess of the water management system design, the following
procedures are proposed:
Regular comparison of storage levels with prescribed Mandatory Reporting Levels will provide
advance warning of potential containment issues and the early implementation of measures to help
maintain storage levels within design guidelines during higher than normal rainfall periods;
If all water storages are at or near capacity, excess water will be redirected to the TSF up to the
height of beached tailings for temporary storage;
Additional stand- by pumps will be used to increase the transfer capacity between affected ponds
and the TSF or pit; and
Water retention ponds have been designed to overflow and discharge to the natural environment.
4.11 Surface Water Monitoring
Water monitoring stations will be positioned to obtain the rate of surface water runoff entering and exiting
the mine site to assist with the efficient operation of water management and to demonstrate compliance
with discharge licence conditions.
In addition, it would be advantageous to obtain data that can be used to validate parameters used in
water balance models; this would comprise storage levels, runoff from disturbed areas of the mine and
pumping rates between storage infrastructures.
Monitoring of various parameters has been carried out at a number of locations throughout the mine site
(Table 21). Whilst this provides valuable information for the operation of infrastructure its value to the
long-term management and planning of water containment is often impaired by a lack of information on
the duration and rate of flow.
For example, water level during outflow from the WRD into the downstream retention pond is recorded at
three weirs on a daily basis. Without information on the duration of outflow it must be assumed that the
recorded water level at the weirs is representative of the flow throughout that day, which can lead to
gross under or overestimation of flow rates. Also, unless rating curves are established for gauges that
record water levels in creeks the rate of runoff from disturbed areas of the mine site cannot be
established. An assessment of storage inflow from undisturbed areas by means of water balance
calculation is problematic due to the absence of accurate data on the rate of transfer through pumping.

47 Mt Todd Gold Project
Surface Water Assessment - Hydrology
Table 21 Existing Surface Water Level Monitoring
Parameter Location Frequency
Rainfall Yard, Tailings Dam and Security Gate Daily
Evaporation Yard Daily
Syphon flow WRD retention pond Continuous during operation
Spillage WRD retention pond Continuous during operation
Spillage Low Grade Ore Pad retention pond Continuous during operation
Spillage Stormwater retention pond Continuous during operation
River stage Edith River SW2, SW4 Daily
River stage Horseshoe Creek SW1, SW11 Daily
River stage Batman Creek SW5 Daily
River stage Stow Creek SW3, SW12 Daily
Pumping WRD Continuous during operation
Runoff WRD weirs 1, 2 and 3 Weekly
Water level WRD retention pond Daily
Water level Low Grade Ore Pad retention pond Daily
Water level Stormwater retention pond Daily
Water level Batman Pit Daily
Water level TSF Daily
Water level HLP Daily
Recommended improvements to monitoring include:
Monitoring of water levels at locations on Batman Creek and Horseshoe Creek just upstream of mine
infrastructure (low grade ore stockpile on Batman Creek and tailings storage facility on Horseshoe
Creek), together with the derivation of stage – discharge relationships for existing monitoring sites
just downstream of the mine site, would provide a means of quantifying the runoff from the disturbed
areas of the mine. This would also provide information on flows from incremental areas along both
creeks and thus a way of calibrating the runoff coefficients used in water balance models. Given the
size of catchments it is likely that flows within the creeks are quite variable and therefore a
meaningful assessment of runoff requires hourly or continuous monitoring during storm events;
Installation of hourly or continuous monitoring of water levels at the weirs downstream of the WRD
during times of flow would provide a direct assessment of seepage rates from the dump. However, it
is recognised that the same information can be obtained from records of water levels in the retention
pond so long as records of other inflows and outflows are maintained in tandem; and

48 Mt Todd Gold Project
Surface Water Assessment - Hydrology
Similarly, continuation of the measurement of transfers between water containment facilities will
assist in determining the quantity of runoff entering ponds from disturbed areas and thus provide a
means of verifying the required capacity of storage and pumps, and assist with decision making
during operation.

49 Mt Todd Gold Project
Surface Water Assessment - Hydrology
5. References
AGC Woodward-Clyde, Appendix to Draft EIS, October 1992.
Chow, V.T. Open Channel Hydraulics. New York, NY: McGraw-Hill Book. 1959.
Department of Main Roads Road Drainage and Design Manual, 2007.
Envirotech Monitoring, Mt Todd Water Management Plan, 2011/12.
GHD, Mount Todd Mine, RP1 Diversion Drainage, November 2010.
Hydrogeologica and Tetra Tech, Memorandum, ‘Mt Todd Water Balance - Care and Maintenance Model
Calibration and Forward Modelling Predictions', December 2010.
Hydrogeologica, memorandum, 'Mt Todd Mine Life Water Balance, 10.6 Mtonnes/year Mine Plan',
December 2010.
Knight Piesold, unknown report title, July 1995.
EPA (formerly NRETAS), Guidelines for the Preparation of a Draft Environmental Impact Statement, Mt
Todd Gold Project Katherine Region, NT, September 2011.
Tetra Tech, memorandum,’Mt Todd Closure – Synthetic Climate Data Series Development’, May 2010.
Tetra Tech, memorandum, ’Mt Todd Closure – Drawdown Analysis’, September 2010.
Tetra Tech, memorandum, ‘45K tpd Site Wide Water Balance, Mt Todd project - Final’, 14 January 2013
Tetra Tech Mt Todd Gold Project, Hydrogeology. May 2013.
Vista Gold Australia Pty Ltd, Mt Todd Gold Project Water Management Update – Appendix I-M’, January
2011.
Vista Gold Australia Pty Ltd, previously available Goldsim models:
MtToddWB 10.6Mtpy Pre-&Production&Clsure JAN2011.
MtToddWB 10.6Mtpy Post-Closure 12Dec2010.
Vista Gold Australia Pty Ltd , latest available Goldsim models:
MtToddWB_LOM2011Update_Phase1&2_120118b_FLOW, January 2012.
MtToddWB_LOM2011Update_Post-Closure_PPT_Chooser, May 2012.
MtToddWB_Calibration Model_20120518_FINAL.

43/21801/04/424694 Mt Todd Gold Project Surface Water Assessment - Hydrology
GHD
201 Charlotte Street Brisbane QLD 4000
GPO Box 668 Brisbane QLD 4001
T: (07) 3316 3000 F: (07) 3316 3333 E: [email protected]
© GHD 2013
This document is and shall remain the property of GHD. The document may only be used for the purpose
for which it was commissioned and in accordance with the Terms of Engagement for the commission.
Unauthorised use of this document in any form whatsoever is prohibited.
Document Status
Rev No.
Author Reviewer Approved for Issue
Name Signature Name Signature Date
1 Peter Dunn Ian McCardle
Ian McCardle
16/05/2013
2 Brent Murdoch – Vista Gold
edits to table 19 & 20 as per email dates 13/9/2013