msc programme in urban management and development thesis1)34583.pdf · msc programme in urban...
TRANSCRIPT

ru
MSc Programme in Urban Management and Development
Rotterdam, The Netherlands
September 2010
Thesis
Title: The Development of Social Cohesion in Public Housing. A Study in A Flat Housing Project in Sukaramai, Medan
Ferri Ichsan, Indonesia
Specialization: Urban Social Development
Supervisor: Dr. Wim Blauw and Ir. Suryanto, MSP.
UMD 6

The Development of Social Cohesion in Public Housing. A Study in A Flat Housing Project in
Sukaramai, Medan
ii
Summary
The Indonesian government through PERUMNAS (Indonesian National Housing
Corporation) has launched walk up apartment or flat housing as an alternative
means of providing houses for low middle-income. Unfortunately, many of them
have been loosing their quality of environment including as happening in the
public flat housing, RUSUN Sukaramai Medan. The decreasing physical
environment in flat housing is worsened by social problems that exist in the
neighbourhood. The limited private space and more usage of common facilities
tend to stimulate conflicts among tenants. This condition is more complicated
since tenants of the flat housing come from various backgrounds. Problems
commonly occurred between those differences which potentially disrupt the
neighbourhood harmony and eventually could loosen community bonds.
The concept of social cohesion emerges to deal with the rapid and radical changes
which have been eroding the mechanisms that have usually assured the
maintenance of community bonds. Social cohesion in this respect has helped to
create a sense of belonging, trust, and security and has given a situation to support
willingness to enhance living conditions which are needed to promote a stable, co-
operative, and sustainable community.
Identification of various factors influencing social cohesion in the social flat
housing is necessary to enrich the concept itself as well as better formulating
public housing policy. By putting social cohesion into considerations, it will
develop more comprehensive understanding about how investment in
neighbourhoods and communities will create integration and cohesion especially
when resources are limited.
It is evident from the study that level of social cohesion within each
neighbourhood of the flat housing estate, RUSUN Sukaramai is significantly
different. It gives an early indication that various social and physical
characteristics in each neighbourhood tend to influence social cohesion. Place
attachment, functional social support, and civic activities are the social cohesion
domains that are significantly different among neighbourhoods in the estate, while
tolerance of diversity is likely to be indifferent among neighbourhoods.
Aspects of physical environment in the housing estate give more fairly influence
to place attachment than to any other social cohesion domains. Several aspects
such as like dwelling type, general housing condition, neighbourhood
infrastructure, home component, room size, quality of rooms are significantly
positively associated with place attachment. It is also positively related with the
neighbourhood condition in terms of peacefulness and safety. High level of those
two aspects is associated with high level of place attachment.Condition of
inequality reflected by job satisfaction and having financial difficulty is also
considered influencing social cohesion in relation with place attachment. People
who are more satisfied with their job and who are not having financial difficulties
tend to have high level of place attachment.
In terms of social support, only dwelling type and job satisfaction that are
significantly related with it. It turns out that residents in row flat housing tend to
have more social support than in mushroom type of flats.

The Development of Social Cohesion in Public Housing. A Study in A Flat Housing Project in
Sukaramai, Medan
iii
Involvement tenants in housing management apparently could increase social
cohesion in relation with civic activities and tolerance of diversity. High level of
tolerance of diversity could also be achieved by minimizing the rate of
victimization in the neighbourhood, and also by improving tenants‟ occupation by
more engaging them in formal sector.
Aspects of physical environment in the housing estate as well as neighbourhood
condition are not the only factors influencing social cohesion. It is quiet
significant that social condition of the residents may have effect to those kinds of
relationship. It is found in the study result that education level has quiet significant
effect to the relationship between place attachment and various aspects of housing
condition. Household type apparently has fair effect on the relationship between
tolerance of diversity and involvement in housing management.
Key words: social cohesion, place attachment, social support, civic activities,
tolerance of diversity, inequality

The Development of Social Cohesion in Public Housing. A Study in A Flat Housing Project in
Sukaramai, Medan
iv
Acknowledgements
First of all, I would like to greatly thank to Allah, The Most Gracious and Most
Merciful, through His will and blessing giving me strength and determination so
that I finally pass through my study both in Master in Regional and Urban
Planning (Magister Perencanaan Kota dan Daerah/ MPKD) at Gadjah Mada
University (GMU) and Master in Urban Management and Development at
Institute for Housing and Urban Development Studies (IHS).
This thesis is the final part of my study, and many great persons have contributed
to this work. I would like to express my sincere gratitude to those persons who
have given me much help during the thesis writing.
I am very much indebted to my supervisor at IHS, Dr. Wim Blauw, during thesis
period for broadening my knowledge about the topic for my research and
constantly guiding me to be on the right track. However, this topic would not be
clearly feasible without contribution of my supervisor at GMU, Ir. Suryanto,
MSP. who encouraged me to intensively learn about it. He has given me a
fundamental step to do further research at IHS. My gratitude is also to all RMT
lectures particularly Maria Zwanenberg and Yiping Fang who have given
significant help building my research.
Also my appreciation to all lectures both in IHS and GMU who have challenged
me with new perspective and knowledge about urban management and
development. Hopefully, all those knowledge could be beneficial to development
of Medan, the city where I am working on now.
My study time in Netherlands would not be smooth without any support from
Cocky, Rene, Ruud and other staffs in course bureau and financial department of
IHS. Likewise, Mbak Putri, Pak Alex and other staffs in Sekretariat MPKD for
their assistance. I thank to all of them.
I am also very grateful to Bappenas and Neso for helping me pursuing my master
degree through their scholarship. This opportunity is also inseparable from help
and support from all my colleagues in BAPPEDA Kota Medan, particularly the
current and former head of the office, Ir. Syaiful Bahri and Ir. Harmes Joni, M.Si,
who strongly encouraged me to advance my study.
To all UMD 6 participants, thank you for the time we have spent together. It was a
really great time knowing you and your culture, giving me different perspective
about the world.
I would much appreciate the work that had been done to my survey team: Putri,
Eka, Johan and Eno who helped me during the fieldwork period.
I would like to dedicate this work to my respectful late father and beloved mother
who have raised me and educated me so tenderly that I can be what I am now.
There is nothing equally that can be repaid for your kindness. Also to Bapak and
Mamak for your enduringly motivation and pray, as to all my brothers and sisters
who always support me to study in Netherlands.
Finally to my dearest wife and lovely son, Liza and Rafli who have given me
countless help and support which kept me eager to finish this work. Thank to both
of you for your compassion.

The Development of Social Cohesion in Public Housing. A Study in A Flat Housing Project in
Sukaramai, Medan
v
Foreword
The main reason I raised this topic to become my research was particularly backed
to my deep concern about the provision of urban housing mainly for the low
middle-income people. The principle of housing provision in the early period of
social housing development was mainly to achieve shelter outcomes such as
affordability, adequacy, and appropriateness. Consequently, standard technical
design was applied to most social housing in Indonesia including flat housing. The
later was supposedly to be an alternative solution of housing provision in big
cities with dense population regarding the shortcoming of land in urban areas
either due to high price or the availability of the land itself to be utilized for
housing development.
Over time, many of those flat housings turned to decrease their quality of
environment. Dirtiness, muddle, and dilapidated buildings are common sights that
are mostly found in those housings. The situation is exacerbated by the negative
perception of people outside the estates labelling the areas as places with high
criminality and youth delinquency, although it has never been really proved or
objectively measured. All in all, flat housings become the least favour of citizen to
occupy apart of the difficulty of adaptation and adjustment living in this type of
housing by Indonesian society. Hence, housing policy should unforgettably take
into consideration housing management in order to make the housing as a better
place to live in harmony and peacefulness, and eventually make it sustainable.
Therefore, I use social cohesion concept to identify problems happened in the
locality by exploring factors that might be considered having influence either in
strengthening or weakening social cohesion. Social cohesion is useful to bring
back community bonds that have been eroded by rapid and radical changes in
urban life especially in an area whose resources are limited.
I hope the result study which is found in this research will much benefit to enrich
academic literature, although I realize that this work is still far from sophisticated
quality of academic work. Moreover, I also expect that it could also reinforce
housing policy in Indonesia especially in my region where I am working on now.
Finally, any suggestion and critique are very appreciated to make this study
getting better understanding.

The Development of Social Cohesion in Public Housing. A Study in A Flat Housing Project in
Sukaramai, Medan
vi
Abbreviations
PERUMNAS Perusahaan Perumahan Nasional (Indonesian national
Housing Corporation)
PPRS Perhimpunan Penghuni Rumah Susun (Housing Tenant
Association)
RUSUN Rumah Susun (Public Flat Housing)
PKK Pendidikan Kesejahteraan Keluarga (Programme for family
welfare education)

The Development of Social Cohesion in Public Housing. A Study in A Flat Housing Project in
Sukaramai, Medan
vii
Table of Contents
Summary ............................................................................................. ii
Acknowledgements ............................................................................ iv
Foreword............................................................................................... v
Abbreviations ..................................................................................... vi
Table of Contents .............................................................................. vii
List of Tables ...................................................................................... ix
List of Charts ........................................................................................ x
List of Figures .................................................................................... xi
Chapter 1 : Introduction ..................................................................... 1
1.1 Background .................................................................................................... 1 1.2 Problem Statement ......................................................................................... 2
1.3 Research Questions ........................................................................................ 3 1.4 Research Objectives ....................................................................................... 4
1.5 Research Benefits........................................................................................... 4
1.6 Research Scope .............................................................................................. 4
Chapter 2 : Literature review ............................................................. 5
2.1 Social Cohesion ............................................................................................. 5
2.1.1 Concept of Social Cohesion .................................................................... 5
2.1.2 The Importance of Social Cohesion ........................................................ 9 2.1.3 Factors Influencing Social Cohesion .................................................... 10
2.4 Flat Housing in Indonesia ............................................................................ 16 2.4.1 Flat Housing Policy............................................................................... 16 2.4.2 The Role of Flat Housing Actors .......................................................... 17
2.5 Conclusion and Theoretical Framework ...................................................... 17
Chapter 3 : Research methodology .................................................. 20
3.1 Research Type and Strategy......................................................................... 20 3.2 Sampling Method ......................................................................................... 20
3.2.1 Unit of Analysis .................................................................................... 20 3.2.2 Population ............................................................................................. 20
3.2.3 Sample Size ........................................................................................... 20 3.3 Variables and Indicators .............................................................................. 21 3.4 Data Collection Method ............................................................................... 22 3.5 Method of Analysis ...................................................................................... 22
3.5.1 Statistical techniques ............................................................................. 22 3.5.2 Measurement of scale ........................................................................... 23

The Development of Social Cohesion in Public Housing. A Study in A Flat Housing Project in
Sukaramai, Medan
viii
3.5.3 Reliability of scale ................................................................................ 23 3.5.4 Analyzing Procedure ............................................................................. 23
3.6 Research Stages ........................................................................................... 25
Chapter 4 : Data Analysis ................................................................ 26
4.1 Description about Location of the Research Area ....................................... 26 4.2. Physical Condition ...................................................................................... 27
4.2.1 Housing Design ..................................................................................... 27
4.3 Social demographic condition of the estate ................................................. 28 4.4 Community Activities of Housing Tenants ................................................. 29 4.5 Results .......................................................................................................... 29
4.5.1 Social condition of respondents ............................................................ 29 4.5.2 Economic condition of respondents ...................................................... 32
4.5.3 Scale assessment ................................................................................... 35 4.5.4 Social cohesion within each type of flats .............................................. 36 4.5.5 Housing and neighbourhood condition within the public housing ....... 43
4.5.6 Relationship housing, neighbourhood, and inequality condition with
social cohesion ................................................................................... 48 4.5.7 Influence of social condition toward the relationship between social
cohesion and housing, neighbourhood, and inequality condition ...... 52
Chapter 5 : Conclusion and Recommendation .............................. 55
5.1 Conclusion ................................................................................................... 55
5.2 Recommendation ......................................................................................... 57
Bibliography ...................................................................................... 60
Annex 1: List of questionnaire ......................................................... 62
Annex 2: Reliability of scale analysis .............................................. 69
Annex 3: Partial correlation analysis .............................................. 74

The Development of Social Cohesion in Public Housing. A Study in A Flat Housing Project in
Sukaramai, Medan
ix
List of Tables
Table 4-1: Respondents’ level of education .................................................................................................. 31
Table 4-2: Distribution of respondent’s job ................................................................................................. 34
Table 4-3: Job satisfaction ............................................................................................................................. 35
Table 4-4Scale of place attachment within each type of flat ....................................................................... 37
Table 4-5: Mean score of place attachment ................................................................................................. 37
Table 4-6: Mean difference of place attachment among neighbourhoods ................................................. 37
Table 4-7: Number of neighbours known .................................................................................................... 38
Table 4-8: Mean difference of number of neighbours among neighbourhoods ........................................ 38
Table 4-9: Neighbourhood interaction ......................................................................................................... 39
Table 4-10: Mean difference of neighbourhood interaction among neighbourhoods............................... 39
Table 4-11Mean score of frequency following social activities ................................................................... 40
Table 4-12: Mean difference of level of social activities followed by the respondents .............................. 40
Table 4-13: Mean score of social support ..................................................................................................... 41
Table 4-14: Mean difference of social support ............................................................................................. 41
Table 4-15: level of civic activities................................................................................................................. 42
Table 4-16: Mean difference of level of civic activities ................................................................................ 42
Table 4-17: Mean score of tolerance of diversity ......................................................................................... 43
Table 4-18: Mean difference of tolerance of dicersity ................................................................................. 43
Table 4-19: General condition of housing in last five years ........................................................................ 45
Table 4-20: physical housing condition based on respondent’s satisfaction .............................................. 46
Table 4-21: Mean difference of aspects of housing condition among flats ................................................ 47
Table 4-22: Neighbourhood priorities .......................................................................................................... 47
Table 4-23: Neighbourhood condition .......................................................................................................... 48

The Development of Social Cohesion in Public Housing. A Study in A Flat Housing Project in
Sukaramai, Medan
x
List of Charts
Chart 4-1Respondents’ ethnics ..................................................................................................................... 30
Chart 4-2Respondents’ religion .................................................................................................................... 30
Chart 4-3Composition of respondents’ age.................................................................................................. 32
Chart 4-4: Financial hardships ..................................................................................................................... 33
Chart 4-5: Formal/ informal sector of job ................................................................................................... 34
Chart 4-6: Having neighbours based on their location ............................................................................... 38
Chart 4-7: Length of stay .............................................................................................................................. 44
Chart 4-8: Home ownership .......................................................................................................................... 45

The Development of Social Cohesion in Public Housing. A Study in A Flat Housing Project in
Sukaramai, Medan
xi
List of Figures
Figure 2-1: Dimensions of social cohesion, showing social, economic and cultural context ....................... 7
Figure 2-2: Modified human ecologist or determinist theory diagram ...................................................... 12
Figure 2-3: The cycle of labelling and exclusion in public housing ............................................................ 15
Figure 2-4: Conceptual framework. The development of social cohesion within public housing ............ 18
Figure 3-1: Research framework .................................................................................................................. 25
Figure 4-1: Aerial view of location of RUSUN Sukaramai Medan ............................................................ 26
Figure 4-2: Building types of living unit in RUSUN Sukaramai Medan .................................................. 27
Figure 4-3: Physical condition of the estate ................................................................................................. 43


Chapter 1 : Introduction
1.1 Background
In the early period of social flat housing (vertical multi-family housing)
development in Indonesia, its objectives are mainly to provide housing for the low
middle income in the big cities considered having dense population such as
Jakarta, Surabaya, Palembang, and Medan. The housing is regarded as the efficient
and instant way to provide houses in a dense urban area that frequently has a
problem with the shortage of land and the soaring-up land price to build houses.
Obviously, Indonesian housing policy much emphasized on the principles of
affordability, adequacy, and appropriateness which are popularly known as the
shelter outcome, and slightly neglected the non shelter outcomes such as emotional
wellbeing, family functioning, community life and so on.
Over time, some flat housing estates are having social and environmental problems
after they have been occupied for a certain period of time. Problems like noise,
juvenile delinquency, rubbish, litter, and victimization have become common
problems in the neighbourhood. People outside the estate mostly consider as a bad
neigbourhood. Either the tenants or tenant association failed to maintain the
building and its environment making it deteriorated. However, this situation can
not be apart of the responsibility of PERUMNAS (Indonesian National Housing
Corporation) and local government.
Problems in flat housing are quite unique. Starting with the community formation
that is not every tenant knows others and added up by social, economical, and
cultural differences among dwellers make those condition, if not handled well,
possible to create social tension between the new and existing residents, the
majority and minority ethnic, the young generation and elderly, disadvantaged and
advantaged, and others. It will create disharmony within the neighbourhood and
weaken the community bonds. In the worst scenario it will not only be costly to
maintain but could threaten community welfare.
The similar situation also happens in one of the social flat housing in Medan,
named RUSUN Sukaramai Medan. The development of this housing, beside to
provide housing for the low middle income, has a function to minimize the spatial
segregation in Medan. The residential development in Medan is still dominantly
shaped based on the ethnic, and level of income. There are some areas dominantly
inhabited by several particular ethnics and also there are some areas populated by
the high or low income people. Issue of ethnic difference especially between
Indonesian indigenous ethnics and non Indonesian ethnic, in this case Tiongkok
(Chinese descendents) living in Medan is quite obvious in real community life. For
several times, massive social conflicts occurred, even tough they were triggered by
the political situation, eventually they came up with this issue, for instance the
riots happened in 1998 after the resignation of President Soeharto which resulted
many causalities and materials experienced by the Tiongkok. Until now, it can not
be said that the RUSUN Sukaramai that is occupied by various ethnics including
Tiongkok, and other local ethnics has shaped a comfort and harmony living for its
residents even tough it has been occupied for quite long time, 24 years. It is
indicated with the various neighbourhood problems happened in the area such as

The Development of Social Cohesion in Public Housing. A Study in A Flat Housing Project in
Sukaramai, Medan
2
rubbish and litter lying around, deteriorated physical building, noise from the stalls
selling food and drink at noon and VCD sellers, and hanged clothes wash. It also
has failed to give secure feeling for the residents since social disturbance such as
juvenile delinquency, burglary and theft, vandalism and property damaging. This
situation potentially weakens the social cohesion in that community.
The indication of low social cohesion in the flat of Sukaramai is described by
Hardy (1996) that shown with the low participation of the residents in maintaining
their environment, only 28,1% of respondents considered highly participated. The
study also shows that only 35,7% of the environment regarded good. Another
research is conducted by Nuralamsyah (1993) that investigated the communication
among residents and neighbourhood harmony. The research suggests that most of
the residents still use their local language instead of the national one. It is one thing
why the social mix in the flats is difficult to achieve. The communication occurred
more intensively with their side neighbors, whilst communication with different
floor neighbors only occurred for some particular needs. She also suggested that
conflict did not much happen because the difficulty of tenants to adjust with their
environment (Nuralamsyah, 1993). Even tough the frequency of conflict is
relatively rare, that situation can not be assumed as a good parameter, because for
some people they prefer to avoid the conflict rather than solve the problems which
is usually called palliative behavior. If this situation kept happened, it will
potentially create bigger conflicts.
1.2 Problem Statement
Housing plays a significant role for individuals or households‟ well being. It is just
not only giving people‟s roof for their head. How and where people are housed is a
part of their social economic life. Housing also gives opportunity in accessing
financial or other resources. Related studies revealed that housing was one of the
indicators in social exclusion (DeVellis, 2003 inStone and Hulse, 2007, Pallant,
2007). Housings located in areas characterized with deprivation, they are
indicating the high level of social exclusion.
In the other hand, urbanization and globalization have dramatically changed social-
economic life especially in big cities. They apparently erode the traditional values
that used to become bondage for residents actively involving in their community.
Urban life, nowadays, is more characterized with anonymity and heterogeneity.
Urbanites have many choices to build social relationships outside their
neighbourhood based on common interests, political ideas, hobbies, and so on
(Fischer, 1984). It turns out that urbanization has caused loosing community bond
and reducing social cohesion.
Due to high level of urbanization and population growth, the number of housing
demand is likewise increasing. To solve the problem of housing shortage,
Indonesia government through PERUMNAS in 1960s – 1970 started to develop
massive public housing especially in big cities such as Jakarta, Surabaya, Medan,
and Bandung. The program was aimed to give affordable housing for low middle
income people. Those public housings were built horizontally within large areas.
During the year 1970s, the Indonesia government established a new approach of
providing public housing by developing flat-type housings or four floors-walk up
apartments. It aimed to address land shortage in terms of availability and high

The Development of Social Cohesion in Public Housing. A Study in A Flat Housing Project in
Sukaramai, Medan
3
price in cities. Building housing vertically also helped cities in utilizing the land
efficiently and to close the low income people with job opportunities.
Over time, the latter of public housing turned the areas into declining environment
or neighbourhood as evident in many cities in Indonesia. They were much
characterized with deteriorated buildings, social disorders, criminality, devalued
public infrastructures, and uncleanness. This situation stimulated stereotypes from
the outsiders. Taylor in his research (1998) explained that stereotypes from people
outside the neighbourhood exacerbate the conditions and lose self-worth and
confidence of the tenants. Apparently the similar situation happened in many
American cities where public housing became a symbol of failure in consumer
society (Taylor, 1998).
The reduced role of government in providing public services, as the paradigm shift
of government and also the limitation of local budget, has given chance to review
the concept of social cohesion that has been sundered in modern life. It helps to
strengthen local capacity based on common values, sense of belonging, trust and
norms in order to collectively solve local problems.
Several aspects of housing are manifestly or latently related with the development
of social cohesion within a community. Factors such as the location of the housing
are related with the ability of people to move in relation with accessibility to other
resources. Housing management plays an important role in behavioural change
(Manzi, 2010). The diverse nature of public housing like flat types, housing
tenures, facilities, also contributes to social interaction and integration which
finally can promote social cohesion. Involvement of the tenants in the management
as well helps to empower them and brings sense of belonging to their area.
Besides influenced by the condition of physical environment and neighbourhood,
social and cultural environment within the community could also have impact oh
social cohesion.
1.3 Research Questions
As we know that, the social cohesion is needed to make a better living in a
community by strengthening the social capital and reducing the differences,
cleavage and inequality. It mainly aims to shape the sustainability in the
community that can indirectly affect to the resident welfare. Housing plays an
important role to improve the social cohesion in terms of provision, allocation, and
maintenance.
This research would like to derive empirical situation about the social cohesion in
flat housing of Sukarmai based on neighbourhood level that is referred by dwelling
type and how the housing condition including its neighbourhood contributes to the
development social cohesion in that area by looking their degree of correlation. In
order to do that, the following questions will be addressed, as:
1. How is social cohesion within each type of flats in the public housing estate?
2. How do aspects of housing and neighbourhood as well as inequality condition
significantly relate with social cohesion? Into what extent does the relationship
take place?

The Development of Social Cohesion in Public Housing. A Study in A Flat Housing Project in
Sukaramai, Medan
4
3. How does social condition influence the relationship between social cohesion
and aspects of housing and neighourhood?
1.4 Research Objectives
Complying with the research questions above, this research would like to:
1. To briefly compare the difference of social cohesion level within each
neighbourhood in the housing estate. These findings could lead to the
assumption that different physical and social environment in each
neighbourhood may influence social cohesion.;
2. To identify aspects of housing and neighbourhood as well as the inequality
conditions which are significantly related with social cohesion and to identify
their strength of relationship;
3. To investigate whether the relationship between social cohesion and aspects of
housing and neighbourhood condition is mediated or intervened by social
condition or the relationship is independently influenced by social condition;
1.5 Research Benefits
Since there is not much literature about social cohesion in Indonesian context,
especially within a community, this research is expected to be the starting point for
the practitioners and academics to take into account the social cohesion approach
seeing from the housing aspect in solving the social economic problems. This
study also enriches the concept of social cohesion within developing countries
while the available resources much occurred in developed countries. This study
only focuses on the social housing provided for the low middle income people,
because the group in that community is reluctant to be segregated than other
housing types occupied by better income people. Even tough the result of this
research can not be generalized to all social housing in Indonesia, at least it can be
a base in understanding the local issues with similar characteristics.
By doing this research, it is expected to know the level of each social cohesion
domain within the research location, and to identify housing aspects that either
positively or negatively contributes to social cohesion. Aspects of housing related
with social cohesion are needed to be identified so that there will be some changes
that can be done to improve the quality of housing.
For the local government, the research recommendations can be used for enriching
the approaches used in devising the housing policies especially for the low middle
income. For the housing providers/ manager along with the residents, this research
is beneficial for them to increase their housing management
1.6 Research Scope
This study will focus on the social cohesion in the flat community by exploring the
domains of social cohesion after they have been living together for a particular
time, during which they must handle with the differences of social, economical,
and cultural background of the dwellers that is possible to dwindle it. Since they
live in same areas, housing aspects and neighbourhood condition will be examined
in this research to know its contribution to the creating of social cohesion.

The Development of Social Cohesion in Public Housing. A Study in A Flat Housing Project in
Sukaramai, Medan
5
Chapter 2 : Literature review
2.1 Social Cohesion
The persistently increasing number of migrations has become a strategic issue to
be dealt with in the urban development of developing countries unremarkably
Indonesian cities especially in the metropolitan area like Jakarta, Surabaya, and
Medan that are populated by people with various different social backgrounds.
This condition is coupled with the modernization and globalization that seem
unavoidable to date. Those situations sharpen conflicts and disparity in urban areas
while the urbanization problems themselves still have many challenges to be
solved. The Council of Europe (2005) said that globalization is still perceived as a
factor of insecurity given that, through its excessive support of neo-liberal values,
it destabilizes the reference points and institutions which guarantee social
cohesion. It also promotes poverty and social divisions. All matters have
significantly contributed to the transformation of social and economic as well as
the demographic structure in urban society.
In the urban planning agenda, the strengthening of local capacity has become an
alternative solution and is urgently required to reduce the increasing conflicts and
disparity between the advantaged and disadvantaged, the indigenous and migrant,
and the majority and minority. Enhancing the social cohesion seems a proper way
to achieve it, which considers on the strengthening of social connectedness, often
referred to in the terms of “social capital”, reducing the differences, cleavages, and
inequalities between groups of people and people living in different geographical
areas, often referred to as the social exclusion (Stone and Hulse, 2007).
2.1.1 Concept of Social Cohesion
To fully understand about the concept of social cohesion, this section will
elaborate the definition of social cohesion from various sources of literature, and
the dimensions of social cohesion that are used to measure the social cohesion in a
society.
2.1.1.1 Definition
There have been many different conceptual approaches to social cohesion,
although it has been much and long discussed by academicians, practitioners as
well as governments in much of European countries, They vary according to
period, culture and differ from one another in terms of the areas of life or groups
concerned and the methods used to develop concepts of social cohesion.
Cohesion based on its etymological sense means as the inherence of a group, all of
whose components are closely connected. Like in biology where a living
organism„s cohesion comes from the integration of its elementary parts, social
cohesion derives from the connection between individuals and bodies (Europe,
2005). Bollen and Hoyle (1990) suggested a theoretical definition of cohesion that
a situation where individual group members feel “stuck” to or a part of, particular
social group (Bruhn, 2009). In a simple way, cohesion means the opposite of
disintegration or division. Therefore, links and unity are two basic criteria in this
matter (Europe, 2005).
The Development of Social Cohesion in Public Housing. A Study in A Flat Housing Project in
Sukaramai, Medan
6
Social cohesion is something that can be seen in daily activities in groups of
community (Forrest and Kearns, 2001) indicated by intimate, face-to-face
communication, exhibit cooperation and conflict, and have members spending
great deal of time together and know well each other (Cooley, 1909 in Bruhn,
2009). However, the Council of Europe (2005) argued that cohesive communities
can only be achieved as long as they can function and grow in harmony together
rather than in conflict. That can be worked out, if the community as whole is able
to acknowledge that individuals have a right to equality and respect and appreciate
diversity within it. Deutch (1949) also found that group members who were
rewarded on a cooperative basis were more cohesive than members rewarded on a
competitive basis (Bruhn, 2009). The degree of social cohesion can also be
described as the ability of members of community to cooperate and respond
collectively to achieve their common goals and to deal with economic, social,
political, or environmental stress that affect them (Europe, 2005).
Regarding the diverse nature of a community is something quite challenging in
addressing social cohesion especially in an urban context where society, now, is
more characterized by various social backgrounds such as economical status and
ethnics. It has proved that people with common background tend to group rather
than with different one (Sim et al., 2003).
Social cohesion, in this respect, is not something created from a homogeneous
community based on ethnic, religion or any other social status, since it is more
possible to create conflict among others and tends to be isolated. LGA et al. (2002)
suggested there should be a common vision and sense of belonging in a cohesive
community process (Robinson, 2003, Stone and Hulse, 2007) based on sense of
hope, trust, and reciprocity (Europe, 2005). In order to achieve shared values, it is
important to reduce disparities in wealth and income and enable people to have a
sense that they are involved in common initiatives, dealing with shared challenges
so that they feel they come from the same members of community. Briefly, a
cohesive community will involve people in participation and governance within a
framework of accepted values and institutions (Europe, 2005).
In conclusion, based on that literature, social cohesion can be defined as a feeling
of integration, attachment to the area and cooperation rather than conflict among
group members in a particular level of community developed through intense
interaction in daily life as well as harmony life by reducing inequality and
respecting to the nature of diversity existed in that group or community.
2.1.1.2 Related Aspects Embedded in Social Cohesion
Social cohesion is a broad concept, and still having difficulty whenever it comes to
the operationalization. It is a multi-dimensional concept that is inter-related each
other. There is no specific agreement about its definition, measurement and
application. Leaving it with a specified discipline will lead to ignorance of other
aspects which have either strong or weak relation that contributes to social
cohesion.
However, some researchers come out with several aspects used to look at and
measure social cohesion. Forrest and Kerns (2001) describe social cohesion into
five domains. Those five domains are common values and a civic culture; social
order and social control; social solidarity and reductions in wealth disparities;

The Development of Social Cohesion in Public Housing. A Study in A Flat Housing Project in
Sukaramai, Medan
7
social networks and social capital; and place attachment and identity. Stone and
Hulse (2007) suggest that social cohesion consists of three dimensions. They
suggested that social cohesion is an overlapping and dynamic interaction between
social connectedness, under the notion of social capital, and inequalities under the
concept of social exclusion. They also add cultural environment as the third
dimension of social cohesion which is evident in some works, even tough
sometimes contested under dimension of social capital. Cultural environment is the
situation where social interactions takes place and encompasses ideas about shared
values, common purposes, and place attachment/ belonging and shared identity.
Figure 2-1: Dimensions of social cohesion, showing social, economic and cultural context
Source: Stone and Hulse (2007)
Furthermore, for the necessity of this research, it will more focus on five main
aspects of social cohesion which are most essential in describing social cohesion, -
that is, place attachment, social support, civic culture, inequality, and tolerance of
diversity. Other aspects like social order and social control as Forrest and Kerns
(2001) suggested as mentioned above are separately explained in the
neighbourhood section., since this research tries to explain the degree of social
cohesion in a neighbourhood and how it is influenced by housing and
neighbourhood condition. Below will be briefly outlined those aspects.
a. Place attachment
The concept of place attachment or sense of place simply defined as the connection
between people and location has been evolved for over years in various fields of
research (Payton, 2003). Williams and Stewart (1998) defined place attachment as
the collection of meanings, beliefs, symbols, values, and feelings that people or
groups relate with a particular locality.
Brown (1987) developed tow models of place attachment, -that is, functional place
attachment and emotional place attachment based on the prevalent literatures.
Functional place attachment, or place dependence, relates to functionality or the
ability of the resources available in the locality to meet the needs or goals of
individuals (Payton, 2003). Functional place attachment in terms of the quality of
the place is influenced by two factors: 1) the extent to which the place satisfies

The Development of Social Cohesion in Public Housing. A Study in A Flat Housing Project in
Sukaramai, Medan
8
user needs and 2) the comparison to other available places (Shumaker and Taylor,
1983).
Emotional place attachment, or place identity, relates to the emotional aspects of a
individual-place relationship and how that place influences to an individual„s self-
identity (Schreyer, et al., 1981; Williams & Roggenbuck, 1989 in Payton, 2003).
This feeling of connectedness to place can lead to sense of belonging or purpose
that helps give meaning to life (Tuan, 1980 in Payton, 2003).
b. Social support
Social support is defined as the network of family, friends, neighbours, and
community members which is present in time of need to provide psychological,
physical, financial, or other kinds of help (Bruhn, 2009).
There are two ways of measuring social support based on Sherbourne and Stewart
(1991). First is by looking at functional support which refers to the degree of
interpersonal relationship that may serve particular functions. Those functions
includes (1) emotional support which involves caring, love and empathy, (2)
instrumental support described as tangible or physical support, (3) information,
guidance, suggestion, or feedback that is helpful to provide solution to a problem,
(4) appraisal support which refers to information relevant to self-assessment, and
(5) social companionship, which means engaging leisure and recreational activities
with other. The second approach of measuring social support emphasizes on
structure of interpersonal relationships. Structure regards to the presence and
quantity of social relationships (e.g. marital status, household type, group
membership, and the number of friends or neighbour one has) and
interconnectedness of someone„s social relationships or social networks for
instance the degree to which someone„s friends know each other.
c. Civic culture
Civic culture is the perception of individuals in a community through which they
are willing to voluntarily participate in some actions and activities as response to
locally social problem. They regard the responsibility of caring social problems is
placed within community itself rather than resting the problem on the government
(Haddad, 2006).
Civic action itself takes various forms. It could be defined as individuals who
donate their time, money or other resources to something they regard valuable to
their community (Payton, 2003). Many benefits can be derived through that kind
of participation. Arai & Pedlar (1997) in Payton (2003) suggest that it can
strengthen friendship and connectedness in the community while Prestby,
Wandersman, Florin, Rich, & Chavis (1990) suggest that it can enhance
community empowerment through improvements in interpersonal relationships
and social fabric (Payton, 2003) and furthermore it will strengthen social cohesion
(Forrest and Kearns, 2001).
d. Tolerance of diversity
As Stone and Hulse (2007) argued that cultural aspect becomes one of the
important aspects that is need to be taken into account when investigating social

The Development of Social Cohesion in Public Housing. A Study in A Flat Housing Project in
Sukaramai, Medan
9
cohesion. The cultural aspect is one of the diversities besides income level, age,
and any other differences that can be commonly found in an urban community. In
a community with various and overlapping identities, tolerance of diversity
becomes a key tool of success to reach harmonious living and cooperation among
those groups. It helps them integrated but also maintains racial harmony as well as
stimulates community bonding (Sim et al., 2003). However Chan et al. (2006: 292)
contrarily argued that social cohesion does not really require values such as
tolerance or appreciate for diversity (Stone and Hulse, 2007).
e. Inequality
Inequality becomes the main concern when discussing about social exclusion. It
refers to deprivations experienced by the poor or who are at risk of poverty due to
social disparities in life chances. Inequality becomes one of social exclusion
indicators, which is willing to asses individuals who find themselves excluded
from the opportunities accessible to the majority of the population in a particular
area in which they live (Avramov, 2006).
Although not specifically mentioned by Forrest and Kearns (2001), they suggest
that inequality in terms of wealth disparity must be reduced in order to develop
social cohesion. They include reduction in wealth disparity as one of social
cohesion domains by giving equal opportunities and access to welfare benefits.
This argument, then, is strengthened by Stone and Hulse (2007) who mention
inequality is a factor that can weaken social cohesion.
2.1.1.3 Social Cohesion Perspectives
It is debatable whether social cohesion is regarded as a cause or consequence of
social and economic outcomes. Those two variables are correlated and influence
each other. When social cohesion is considered as an independent variable, it
means that high level of social cohesion can contribute to the achievement of
positive social and economical outcomes. This implies that policies and programs
that will be undertaken are to enhance levels of social cohesion or to reverse its
perceived weakening. Examples for this such as urban or community renewal for
older public housing estates in order to build social relationships and social capital
as a means of achieving some particular outcomes like reconnecting residents with
jobs or education and training, reducing turnover and increasing residential
stability, and reducing stigma as well as increasing pride in the neighbourhood.
Another example is a residential participation programme which focuses on
building trust, cooperation and mutual support (Stone and Hulse, 2007).
In the other hand, if it is indicated as a dependent variable then it means that the
achievement of levels of social cohesion is relied on social, economical, and
political factors. The policy implication of this perspective may involve support for
strategic interference by governments to improve facilities and services related
with the strengthening of social cohesion (Stone and Hulse, 2007).
2.1.2 The Importance of Social Cohesion
Within the context of urban life where globalization and modernization has been
much overwhelmed byr daily social dynamics, society is likely to be characterized
with heterogeneity and anonymity as well as individualism. Social cohesion is

The Development of Social Cohesion in Public Housing. A Study in A Flat Housing Project in
Sukaramai, Medan
10
important in a modern society focusing on the rights of individuals and having to
deal with rapid and radical changes that are eroding the mechanisms that have
usually assured the maintenance of community bonds. It has an even more
significant role in achieving equilibrium, which deals with both individual
development and sense of belonging and combines together individual freedom
and social justice, economic efficiency and fair distribution of resources, diversity
and agreed rules for resolving all disputes peacefully (Europe, 2005).
Social cohesion in this respect has helped to create a sense of belonging, trust, and
security and has given a situation to support willingness to enhance living
conditions which are needed to improve economic situation. The aspect of sense of
belonging not only creates wealth, but also helps access to the fairest distribution
of its outcomes.
This sense of belonging, however, deals with confronting issues given that
strongly cohesive communities or neighbourhoods are possible to have conflicts
with one another and contribute to divided and fragmented city. It is because
citizens that have strong attachment and loyalty to their place could be in conflicts
with any sense of common national purposes or macro-cohesion (Forrest and
Kearns, 2001).
Regardless the possible conflicting intentions with macro-cohesion, social
cohesion is also an important determinant of the quality of life, where a
community with a high level of cohesion is characterized by voluntary, high in
intimacy, and reciprocal services tends to be health-promoting. It also can generate
social capital through number of mechanisms and can easily get support from
community members (Bruhn, 2009).
It is expected that social cohesion is increasingly taken into account in a decision
making of investment either by local authorities or other stakeholders. By putting
social cohesion into considerations, it will develop more comprehensive
understanding about how investment in neighbourhoods and communities will
create integration and cohesion especially when resources are limited.
Furthermore, social cohesion is an instrument to promote a stable, co-operative,
and sustainable community (Europe, 2005).
2.1.3 Factors Influencing Social Cohesion
Social cohesion is a community development process that requires its members to
actively participate in community groups and activities based on shared trust
(Forrest and Kearns, 2001, Sim et al., 2003). It is an on going process that can be
modified through time by social change (Bruhn, 2009).
It seems right that people that live longer in an area will have more local friends
(Forrest and Kearns, 2001), but there is a complex process that makes people want
to interact each other and eventually produce a stable community. Community
characterized with by population profile is likely to develop cooperation to resolve
their common problems since they know well each other.
There are many factors that are indicated to influence development of social
cohesion. Europe (2005) focused on two approaches of social cohesion
development. First is by looking at positive approach that contributes to social
cohesion. It emphasizes how community members can have access and

The Development of Social Cohesion in Public Housing. A Study in A Flat Housing Project in
Sukaramai, Medan
11
opportunities to have a reasonable and good quality of life. The second is from
negative approach focusing on the weakening of social cohesion. The latter one is
much more related with inequality that can create social exclusion. There are also
some evidences that high crime rate and feeling of insecurity contribute to the
weakening of social cohesion.
It has been shown that in many English towns housing significantly contributed to
the disturbance happened in 2001 triggered by high levels of spatial segregation,
which were assumed to lead to different population„s living, working, and
socializing separately (Robinson, 2005). The Singapore national government also
had recognized that housing can be an effective tool to promote social integration
through mixed residence housing policy (Sim et al., 2003).
The aim of this research is to investigate to what extent does the public housing
mainly the walk up apartment type of housing estate with its multiple dimension of
life influence social cohesion within the neighbourhood. Social cohesion as the
object of this study is part of the several objectives that want to be achieved
through development of public housing towards sustainability.
Some issues that are relevant with the weakening of social cohesion are poor and
deprived condition; the increasing of economic migration; rapid globalization and
the instant reporting of world affairs that can give impact to local area within
hours; tensions due to current economic difficulties; increased terrorist threat and
radical potential from disaffected and isolated individuals; issues between
intergenerational groups, income groups and between temporary and permanent
residents; demographic changes; conflicting priorities of public services
(Government, 2008).
2.1.3.1 The Influence of Physical Environment and Neighbourhood
to Social Cohesion
Human Ecologist or Determinist and Effective Environment Theory
This section will elaborate related theories that explain how spatial structure within
a neighbourhood can influence social behaviour and related with this research, that
social behaviour will be transformed into social interaction that develops social
cohesion. These theories will be used later as the theoretical framework of the
research.
A popular theory that describes models of urban life is human ecological theory.
Human ecologists believe that there is one way relationship between the structure
of the environment and the behaviour of individual. They argued that the mode of
individual behaviour is determined by the environment, and that person either
adapt or fails to survive (Krupat, 1985).
One of the proponents of human ecologist or determinist theory is Louis Wirth
through his significantly influential essay entitled “Urbanism as a way of Life” (1938). He argued that the city by its characteristics - which he defined as size,
density and heterogeneity - has significantly changed the social life. With cities
inhabited by large number of people, there will be a wide range of differentiation
among them in terms of a variety on racial, ethnic, economic, and class lines.
Those variations tend to weaken community bonds. It will be difficult to have
consensus in the absence of community, and eventually it will destroy the moral

The Development of Social Cohesion in Public Housing. A Study in A Flat Housing Project in
Sukaramai, Medan
12
order. He then claimed that density even makes it more difficult, since unengaged
people are likely to constantly compete with each other. With close physical
proximity coupled with great social distance, it will generate a sense of loneliness,
nervous, tension, and mutual irritation. The fact that heterogeneity comes along
with size makes the problem more complicated. He argued that heterogeneity tends
to breakdown the family unit and segment the individual even further.
What Wirth (1938) said in his work seemed strongly anti urban. His argument
about how city dictates the way of life of its citizen came to criticize opinions even
from the human ecologist perspective itself such as Amos Hawley (1979, 1981)
(Krupat, 1985). Environmental psychologists have a different perspective from
what determinist theory had proposed. They argued that the relationship between
individual and environment is more likely a dynamic and mutual influence
process. To some condition that people must live where and as they are, they will
adapt in the first time, but later on they are constantly changing and influencing the
environment according to their demand to the environment. If it is not flexible
enough, they may just decide to leave (Krupat, 1985). In other word as Michelson
(1971) stated in Krupat (1985), humans have the ability to choose moving in or out
of environments depending on their preferences. Jonathan Freedman (1975) also
suggested that the city has a positive and negative effect to individuals depending
on their characteristics or the requirements to the situation (Krupat, 1985).
Another thing from Wirth„s point of view that is contested is about proximity.
Different from rural areas where proximity has plays a significant role in getting
friends and building social networks, in urban area, proximity is less significant,
because common interests have more to do as the factor for people build
relationships (Krupat, 1985).
Human ecologists influence much for urban planners. They believe that with good
quality of design and technology, the physical environment can give impact to
social behaviour. They assume the values and benefits for society that want to be
achieved can directly result from the physical environment. In the other hand,
social scientists tend to deny the direct influence of environment, arguing that
culture and social structure are the key determinant (Gans, 1972).
Figure 2-2: Modified human ecologist or determinist theory diagram
The social scientists argue that the physical environment is only considered as
potential environment. The social system and culture of the people who will use it
determine to what extent the environment becomes an effective environment. The
effective environment is the version of potential environment that is apparently or
latently adopted by users (Gans, 1972). He took an example about the preference

The Development of Social Cohesion in Public Housing. A Study in A Flat Housing Project in
Sukaramai, Medan
13
of people to live in a single-unit house or in a walk up-apartment regarding of
healthy child-rearing. He said that from the perspective of urban planners, it is
better if children are raised in single-family housing than in apartment, but social
scientists said it more relates to social, economic, and cultural condition within
those families. He as well emphasizes that technologically better housing must be
seen in the context of user„s available choices. If single-family housing is located
in the area far from job places, it will not be advantage for people vulnerable with
job security. For those kinds of people, the modernity offered in urban centre can
be offset by deprivations resulted from budget constraints.
Still in housing design, the necessity of recognizing culture condition is evident
like for some cultures that regard overcrowding perceive differently from others.
For some cultures, overcrowding is not regarded something that disrupts social
system and results in depression and conflict. In contrast, they regard such high
value on sociability and living in social proximity (Gans, 1972).
Neighbourhood and Social Cohesion
Neighbourhood by its definition simply means that a set of people living nearby. It
is a natural social group which just like the family requires early-on the intense
loyalties of its residents and their active involvement with one another (Keller,
1968). Forrest and Kearns (2001) divided neighbourhood into three typologies.
First is the neighbourhood referring to community, that is the local domain of
friendships and casual acquaintance which seems remaining important in our daily
lives. Second is the nighbourhood as context, particularly in the negative sense of
stigmatization, ill health, and the development of antisocial behaviour as a result of
social exclusion. Third is neighbourhood as commodity that functions as a domain
of safety and security as well as compatible lifestyle packaged and sold as called
enclave.
Over time, neighbourhood in modern cities inevitably has been loosening its
significance due to urbanism (Keller, 1968). Many urbanites have lost their ties to
neighbourhood as opposed to rural people that are still much been relied on their
neighbourhood for livelihood development. Networks used to be based on locality,
now, may be replaced with common interests, hobbies, alliances, occupations, and
so on that all those networks can found outside of neighbourhood. This is
exacerbated with the rapid development of information and communication
technology that make urbanites easier to have acquaintances and build
relationships. However, the absence of local ties does not mean reducing
urbanite„s personal bonds. Several studies showed that local relationships are still
important but more specialist roles in individuals‟ lives (Forrest and Kearns, 2001)
and alternatives to extra-local ones (Keller, 1968).
Neighbourhood has different meanings to nature of area. For disadvantaged areas,
quality of neighbouring is an important element for inhabitants„ ability to deal with
a decaying and unattractive physical environment, while in more affluent areas,
quality of physical environment in the neighbourhood is more important rather
than having engaged within a great degree of social interaction (Forrest and
Kearns, 2001).
In the study done by Ellen and Turner (1997), there is a significant correlation
between various neighbourhood conditions and individual outcomes, at every stage

The Development of Social Cohesion in Public Housing. A Study in A Flat Housing Project in
Sukaramai, Medan
14
in a person„s life and across social and economic dimensions. For example, elderly
people and those out of labour force are likely to be more dependent on local ties
(Forrest and Kearns, 2001).
The way the neighbourhood plays an important role in socialization, not only by its
internal composition and dynamics, but also by the external perceptions of
residents in other neighbourhood and of institutions and agencies which play a key
role in opportunity structures (Forrest and Kearns, 2001). The external perceptions
of areas affect behavior and attitude of residents which may either reinforce or
weaken social cohesion (Forrest and Kearns, 2001).
There is a short of agreement what distinguishes between successful and
unsuccessful neighbourhood is the degree of social cohesion. The basic
assumption is the disadvantaged neighbourhoods lack of necessary ingredients to
foster social cohesion. They also in general lack the necessary qualities of self-
help, mutuality and trust which could help in their regeneration (Forrest and
Kearns, 2001).
However, despite the macro process of disorder, dislocation and social and
economic transformation which may change social life within a community or
neigbourhood, the residents still do their daily routine activities as usual. This may
help normalize social relations. It is the residentially based networks which carry
an important role in the routines of mundane life and these routines are possibly be
the foundation of social cohesion – through them we learn tolerance, co-operation
and acquire a sense of social order and belonging (Forrest and Kearns, 2001).
2.1.3.2 The Stereotypes of Public Housing
Social or public housing program was initially launched as the solution of housing
shortage especially for the low middle income people living in cities. Rapid
population growth coupled with urbanization turn into such high demand in
houses. Meanwhile, from the supply side, the production of houses was still unable
to accommodate all levels of social class due to soaring land price which make the
low income people excluded from housing market in city centre area.
Over time, many public housings become deteriorated and make unattractive place
to live in. They become a symbol of failure in consumer society. They become the
last living place option. People with no other option usually tend to concentrate
living where few people want, characterized with poor design and quality and bad
environment (Taylor, 1998). Whereas, housing is supposed to play an important
role for individual„s life. It does not only give individuals physical shelter, “a roof
over one„s head”, but how and where they are housed are part of many aspects of
individual wellbeing and social economic life (Stone and Hulse, 2007). Access to
housing is the key determinant for household„s ability to move. Household„
housing condition and housing market location are much related with financial and
other resources (Sim et al., 2003).
Many public housings even in American cities are characterized by deprivation,
poverty and unemployment (Taylor, 1998, Sim et al., 2003). People saw them as
double marginality, since they are considered as having least positive identity.
Locations selected for public housing are likely to solidify racial spatial
concentration (Sim et al., 2003). Public housing residents usually do not have
overlapping communities that others have. Strong social and political networks

The Development of Social Cohesion in Public Housing. A Study in A Flat Housing Project in
Sukaramai, Medan
15
built upon working-class community were relied on work ties. Abrams and others
have argued that survival and integration nowadays depends on ties that go outside
the immediate neighbourhood or kinship networks. In that case, residents in these
areas are more excluded, with neither the strong ties within the neighbourhood of
the past nor the sparser, overlapping networks required today (Taylor, 1998).
There are some common situations that help to survive, but poverty tends to create
conflict and suspicion, as stereotypes from outside are defected onto neighbours.
Cole & Smith„s research (1996) found that stereotypes about the public housing
estates make it difficult to differentiate between real and imaginary problems that
the estate deals with. The portray from the media always puts the estate in the
crime section of local paper describing that taxis, buses and delivery vans avoid the
most notorious areas. Residents bear with post-code discrimination: employers lose
interest once they know the address; financial institutions are unwilling to lend. There
is little reason for outsiders to visit the estate or test the popular image against reality
(Taylor, 1998).
Figure 2-3: The cycle of labelling and exclusion in public housing
Source: Taylor (1988)
Some policy tools have been tried to improve living condition in terms of
eliminating social exclusion. Some countries like Netherlands, American, and
Singapore (Sim et al., 2003) use the concept of racial and economic mixing of
housing in order to prevent spatial segregation.
Arguments for mixed-community, still debatable, are they contribute to choice and
equality, avoiding concentration of deprivation, and help to address social
exclusion and social cohesion. Camina and Wood (2009) also suggested that
mixed communities can increase social interaction, encouraging the spread of
mainstream social norms and values, building social capital, opening job
opportunities through more various social contacts, overcoming place-based
stigma, drawing additional services to the neighbourhood (Manzi, 2010).
Housing management of mixed communities rely on two specific and linked
discourses. The first is a “cultural discourse” based on the notions that housing
management can lead to behavioural change and enhanced self-worth. The other
one relates to “social control” arguing that peer-group pressure will lead to social
norms (Manzi, 2010).

The Development of Social Cohesion in Public Housing. A Study in A Flat Housing Project in
Sukaramai, Medan
16
The mixing of different income groups and the interspersing of private housing
developments within public housing estates have also help to reduce the social
stratification within the society, therefore achieving ethnic and social integration
(Sim et al., 2003). Moreover, the estate should also be integrated with commercial,
recreational, institutional and other facilities to accommodate the daily needs of
population with various social backgrounds.
Taylor believed that to eliminate social exclusion within public housing estates, it
has to be done by reversing social exclusion cycle (as shown in fig. 3) He believed
that it can help to build confidence and capacity on the estate itself. Some
suggestions he proposed to reverse the social exclusion such as diversification of
tenure; make the tenants as “the landlord”; community-based management; tenant
involvement, and viable economy.
2.4 Flat Housing in Indonesia
This section would like to give briefly description about the flat housing polices to
derive the illustration how the Indonesian flat housing policies will contribute to
the shaping of social cohesion in flat communities. As we know that, the limitation
of dwelling space in the flats enforces the tenants to adapt the situation and have to
be tolerant to the diversity of the nature of the flats to achieve the sustainable
communities.
2.4.1 Flat Housing Policy
Development of flat housing in Indonesia has begun massively since 1980 in some
cities considered have high population density like Jakarta, Surabaya, Medan,
Palembang, and Bandung. On that day, the flat housing is aimed to revitalize the
urban housing environment whose condition had been deteriorated forming the
slums. The flat development is also regarded to tackle the housing provision
problem for the low middle income considering their low capability to access the
housing market in urban centre, since the land price on that area tend to highly
increase due to the shortage of land for housing.
Through the process, flat housings are more needed since the migration like in
other big cities unable to avoid making the housing demand increased and the
landed social housing type is hardly to implement especially in the urban centre
area. In fact, I argue in the future, the existence of flat housing type will replace the
latter type.
Indonesian government has issued Flat Housing Act 1985 to regulate the flat
housing development. The flat housing development in this respect is the public
housing which takes form as a four floor walk up apartment provided for low
middle income people. The development of flat housing relies on the principle of
public welfare, justice and equality, and stability and harmony in living. It aims to
fulfil the housing need proper for society mainly the low middle income, ensuring
the law assurance in its usage and to improve the capacity and benefit of land in
the urban area by paying attention to the natural resource sustainability and
creating housing environment completed, harmonious, and balanced.

The Development of Social Cohesion in Public Housing. A Study in A Flat Housing Project in
Sukaramai, Medan
17
2.4.2 The Role of Flat Housing Actors
Indonesian regulations about the flat housing have regulated also the role of the
key players in the flat housings in the context of development, management, and
monitoring aspects. The following sections will describe each of their role
including the government and local authorities, and dweller groups and
management institution.
2.4.2.1 Tenants, Tenant Association, and Management Institution
The tenants are considered the most important key players in the maintaining the
environment and neighborhood to create conducive condition in communities. In
order to regulate and take care of the common interest in terms of ownership,
dwelling, and management within a flat housing estate, the tenants must establish a
tenant association. The association functions to develop a healthy, secured, and
balanced environment, to regulate and develop tenants‟ concerns, and to manage
the housing and its environment. Its main duty is to pursue tenants so that they can
live together within their housing and environment in sense of harmony, coherence
and stability, to appoint or form and supervise the management institution in terms
of the flat and environment management, determine the sanction to the offence of
the community principle established.
In case of the tenant association appointing or forming the management institution,
it will run duties such as conducting the inspection and maintaining the cleanliness
and repairing the flats and its environment upon the shared parts, properties, and
land. It also controls the order and security of the dwellers as well as the usage of
the shared parts, properties, and land accordance to their function, and reports
periodically to the tenant group including the problems and the alternative
solutions for them. All cost will be proportionally borne to the tenants or owner
through the association.
2.4.2.2 Government and Local Authorities
The development of social flat housing is fully under responsibility and
supervision of central government. The role of government is establishing the
policy in regulating and fostering the flats including the technical and
administrative conditions of flat development, decent dwelling permit, the tenure,
dwelling, management and monitoring regulation.
The local authority function to formulate the short and long run regulation of flat
development based on the national government policies given. The regulation
accommodates local context such as urban and regional plan.
2.5 Conclusion and Theoretical Framework
As urbanism is justified loosing social relationships within local communities, the
declining role of government in providing public services has turned to reflect the
concept of social cohesion. This concept is emerged basically on the common
values and a sense of belonging to locality (LGA et al., 2002). It, then, is
developed to have tolerance of diversity as opposed to increasing urbanization
characterized with the variety of social backgrounds (Stone and Hulse, 2007).
Through this concept, it is expected to create social order and social control which
is necessary to the foundation of collective pursuits and by that can be a tool to

The Development of Social Cohesion in Public Housing. A Study in A Flat Housing Project in
Sukaramai, Medan
18
solve the neighbourhood problems (Forrest and Kearns, 2001). In order to achieve
social cohesion, it is necessary to reduce wealth disparity and any other indicators
of social exclusion (Europe, 2005). It is difficult to foster social cohesion within a
situation indicated with high level of social exclusion. Instead, it weakens social
cohesion.
As human ecologist or determinist proponents argues that physical environment
where human live can affect the social behaviour. It may influence people„s mind
and perception and directs them into some kinds of particular activities. In the
other hand social scientists believe that social and cultural condition of the people
that are going to use the built environment are much determinant to their
behaviour, and later on create effective environment.
Using the same approach with determinist and effective environment theory, it can
be assumed that housing and its neighbourhood play a significant role in shaping
social cohesion. In the other hand, several aspects of housing, in a particular
degree of condition, can lead to the presence of sense of inequality both for
residents as general and among themselves. This condition could affect social
cohesion, since the inequality could lead to social exclusion (Stone and Hulse,
2007).
Figure 2-4: Conceptual framework. The development of social cohesion within public housing
For instance, the location where public housing is located strategically contributes
to opening livelihood opportunities. Good housing quality also can enhance the
social cohesion, where the residents have pride to their housing that can effect to
their sense of belonging to the environment. Similar will be happened for good
housing management especially if it includes the involvement of the residents in
determining the priorities for their area that will lead to cohesion and integration
since they are encouraged to have sense of belonging to the area. It improves the
effectiveness with which housing and neighbourhood services are delivered, and
can also give residents new skills and confidence. It can help to make
neighbourhood desirable places, in which to live and is a key component of
building social capital. In terms of housing design and layout, it is possible to
influence the social cohesion, since the typical dwelling types in flat housing

The Development of Social Cohesion in Public Housing. A Study in A Flat Housing Project in
Sukaramai, Medan
19
regarded to the limitation of dwelling space enforce the dwellers to more interact
to other dwellers and together use the common space. The residents must have
good adaptation and tolerance to others in order to build a harmony living and
avoid reduce tension.
Good neighbourhood condition is essential to encourage the community cohesion
through creating a safety, peaceful, and healthy environment so that every resident
can live in harmony and diminish the negative perception or stigma which is
usually attached to many walk-up public housing estates including in Indonesia.

The Development of Social Cohesion in Public Housing. A Study in A Flat Housing Project in
Sukaramai, Medan
20
Chapter 3 : Research methodology
3.1 Research Type and Strategy
The type of this research is basically a descriptive study which aims to describe
strength of relationship between social cohesion and housing and neighbourhood
condition as well as the inequality by using statistic as the tool for analysis.
A descriptive study is designed to provide further insight into the research problem
by describing the variables of interest. It can be used for examining associative
relationships. A survey will be conducted as the strategy of this research using
questionnaire based on Likert scale of measurement consisting of five levels and
categorical questions.
This study is using deductive approach which tries to explain the basic theory of
human ecologist or determinist theory coupled with potential and effective
environment concept that describe the influence of physical environment and
social economic condition towards human behaviour. Using that analytical
research framework, this research argues that housing condition with its
complexity and its neighbourhood are indicated to influence either positively or
negatively social cohesion.
3.2 Sampling Method
3.2.1 Unit of Analysis
This research is about developing study cohesion within a community. It is one of
the requirements needed to achieve broader context, - that is, empowerment. By
enhancing social cohesion, it is expected the community can build their own
confidence and furthermore develop their capacity that will be helpful to solve
immediate problems.
Based on Friedman (1992) in Putera (2006), it is said that concept of
empowerment focuses on household level that must be empowered first so that
individual in household could create and at the end achieve optimum result.
Related with that, the population of this research will be taken within household
level.
3.2.2 Population
The population of this research are households in the public housing of Sukaramai,
Medan. There are 400 households based on the number of dwelling unit in the
housing estate or about 2.000 inhabitants with the assumption the number of
household size is 5 people. The later figure can be higher since some households
have multi family type.
3.2.3 Sample Size
The determination of number of sample is based on the research objectives. For
this purpose, this research uses basic assumption as:
Confidence level is 95%
Population size is 2.500 people

The Development of Social Cohesion in Public Housing. A Study in A Flat Housing Project in
Sukaramai, Medan
21
Sampling error is 10% with 80/20 split which means that the population in the
research area is quite varied in terms of socioeconomic condition that can be
justified as controlled variables, which in this research could be age, sex,
ethnics, and religion
Based on the table of sample size suggested by Salant and Dalman (1994) and
using those above assumptions the minimum sample size needed for this research
will be 93 households. To simplify collecting data, the sample sized used in this
research will be 120 households which will be equally divided into 40 households,
since there are three neighbourhood in the estate based.
3.3 Variables and Indicators
Variables and indicators derived from the related literature sources are then
operationalized to answer each research question as can be seen on the table
below.
1. How is social cohesion within each type of flats in the public housing estate?
Main concept Variables Indicators Questions Data source
Social
Cohesion
Place
Attachment
Functional place
attachment
13
Questionnaire
Emotional place attachment 13 Questionnaire
Social Support Functional support 26 Questionnaire
Structure of interpersonal
relationship
18, 19, 20,
21, 22, 23
Questionnaire
Tolerance of diversity
Respecting differences 31 Questionnaire
Identification of problems
due to differences
29 Questionnaire
Civic activities Voluntarily neighbourhood
activities
27 Questionnaire
2. How do aspects of housing and neighbourhood as well as inequality condition
significantly relate with social cohesion? Into what extent does the relationship
take place?
Main concept Variables Indicators Questions Data source
Housing
condition
Dwelling unit Dwelling type 14 Questionnaire
Place living on 15 Questionnaire
Status of
tenants
Home ownership 16 Questionnaire
Length of stay 17 Questionnaire
Physical environment
Housing infrastructure 37 Questionnaire
Housing services 38 Questionnaire
General housing condition 39 Questionnaire
Home components 40 Questionnaire
Size of rooms 41 Questionnaire
Quality of rooms 42 Questionnaire
Room number 43 Questionnaire
Housing management
Involvement in housing management
44 Questionnaire
Neighbourhood Neighbourhood
condition
Peacefulness 32, 33 Questionnaire
Safety 34, 35 Questionnaire
Neighbourhood problems 28 Questionnaire
Victimization 36 Questionnaire

The Development of Social Cohesion in Public Housing. A Study in A Flat Housing Project in
Sukaramai, Medan
22
Main concept Variables Indicators Questions Data source
Inequality Financial condition
Labour force status 8 Questionnaire Satisfaction with current job 9 Questionnaire
Expected job 10 Questionnaire
Access to job opportunities 11 Questionnaire
Financial hardship 12 Questionnaire
3. How does social condition influence the relationship between social cohesion and
aspects of housing and neighourhood?
Main concept Variables Indicators Questions Data source
Social and economic
condition
Demographic condition
Age 1 Questionnaire
Sex 2 Questionnaire
Ethnics 3 Questionnaire
Religion 4 Questionnaire
Household type 5 Questionnaire
Educational condition
Education level 6 Questionnaire
3.4 Data Collection Method
a. Primary data
Primary data will be collected through questionnaire randomly distributed to
households in the estate. The selection of households that would become
respondents is based on quota sample technique ensuring the equal number of
respondents for each flats type (F21, F36, and F54). Each flats type is
considered as a single neighbourhood which then can be compared into what
extent the level of social cohesion exists. Since the sample size based on the
calculation above is 120 households, every flats type will be distributed into 40
households accordingly.
b. Secondary data
Secondary data will be collected from previous related researches in this area
of study, the latest district in figure produced by statistic agency, any
information from the sub district authority related with socioeconomic
condition of the estate, and the written fundamental principle of tenant
association. Internet is also used to get the secondary data like map, pictures
and other related information.
3.5 Method of Analysis
3.5.1 Statistical techniques
The process of development of social cohesion in a community is taken place for a
particular of time in a complex way. As has been discussed in chapter 2 that social
cohesion can be considered either as dependent variable or independent one, which
means that it can be regarded as the outcome of several factors or the cause of a
particular outcome respectively. For instance, bad quality of housing management
in terms of low maintaining the physical environment will directly weaken social
cohesion. It is also regarded as the consequence of low social cohesion that is
failed to build cooperative and communal action in keeping the environment in
such a level of decent quality of neighbourhood environment.

The Development of Social Cohesion in Public Housing. A Study in A Flat Housing Project in
Sukaramai, Medan
23
Therefore, the relationship between social cohesion and factors indicated affecting
it like housing, neighbourhood and inequality condition will be analyzed in two
ways of directional relationship or in statistical terms called 2-tailed tests of
significance. Correlation and measure of association will be employed to find out
the strength of relationship between two variables. The difference in using between
those two analyses is only located on the data level of measurement. The former
one will be used to describe the degree of relationship between two interval
variables or it also can be used when one variable is dichotomous (Pallant, 2007).
While the former one can be used whenever two variables that are going to be
analyzed are both nominal variables (Liebetrau, 1983).
3.5.2 Measurement of scale
In this research, several scales of variables will be used. Using scale in social
research is very important, since most of the variables would likely to describe
perception and attitude, both of which are qualitative type of data. Using scale will
transform qualitative data into quantitative order.
Ordering the score in the scale from the lowest to highest one will show the
gradation of respondents‟ perception or favour. The likert scale will be used for the
scale of this research. The likert scale in this research will use a scale of score from
one as the lowest level of perception to five as the highest one.
There are some variables in this research using sub scales. Sub scales are used
based on the literature where there are some particular variables consisting of
several indicators that later on will be combined into a score. In this research,
variables that will use sub scales are place attachment, neighbourhood interaction,
social activities, functional social support, satisfaction with the neighbourhood
infrastructure and service, home components, size of rooms, and quality of rooms
in the dwelling unit.
3.5.3 Reliability of scale
Since this research is using scales, then it is important to find the reliability of the
scales themselves especially when they are not using the available scales derived
from literature which is considered having been proven their reliability. There are
many reasons to find the reliability of scale. One of the main issues regards to its
internal consistency. It is about how the items that comprise the scale “hang
together” (Pallant, 2007). One of the most common forms of internal consistency
reliability is Cronbach„s alpha coefficient. The value of alpha is ranging from zero
to one. It will equal to zero if the true score is not measured at all and there is only
an error component. Conversely, when all items measure only the true score and
there is no error component, it will be 1.0 (Garson, 2010). Normally, the
Cronbach„s alpha coefficient of scale should be above 0.7 (DeVellis, 2003 in
Pallant, 2007). However, the alpha values are quite susceptible to the number of
items in the scale. Scales with short items for instance scales with fewer than ten
items are frequently found having low Cronbach„s alpha (e.g. 0.5) (Pallant, 2007).
3.5.4 Analyzing Procedure
Before going through the analysis, Cronbach„s alpha coefficient will be run
beforehand to find the internal consistency of the scales used. Scales that have
alpha„s value more than 0.5 can be forwarded to the next step, while the scales that

The Development of Social Cohesion in Public Housing. A Study in A Flat Housing Project in
Sukaramai, Medan
24
have alpha„s value less than 0.5 will be modified by dropping out the items within
the related scale that can significantly increase the value of Cronbach„s alpha. The
value of 0.5 is taken as the referring point because scales that are used in this
research consist of fewer than ten items. However, as aforementioned above,
dropping out the items must consider the number of items in the scales. For the
purpose of this research, the dropped items in a scale will still be analysed
separately.
After deriving the reliability of scales, the next step to be done is to answer the
first research question, “How is social cohesion within each type of flats in the
public housing estate”. Since there is still no specific model to quantify social
cohesion due to its complexity, the measurement of level of social cohesion will be
undertaken by looking at the five domains of social cohesion; place attachment,
social support, social support, civic activities, and condition of inequality within
each neighbourhood as aforementioned. Mean scores, and summing up of same
responds will be used to analyze this question. By doing this it can be known
whether a particular neighbourhood with its own characteristic has different level
of social cohesion among others.
Correlation technique of analysis will be used to answer the second research
question, “How do aspects of housing and neighbourhood as well as inequality
condition significantly relate with social cohesion? Into what extent does the
relationship take place?”. The analysis will use Pearson product moment
correlation to find the relationship between two continuous (interval) variables. It
could be also used if one of the two variables is a dichotomous variable.
The value of the correlation coefficient will be defined into three categories as
suggested by Cohen (1988), that is, small, medium, and large relationship. The
value range for those categories would be 0.10 to 0.29, 0.30 to 0.49, and 0.50 to
1.0 respectively (Pallant, 2007).
Significance test will also be automatically shown in this analysis describing the
significance of relationship of both variables whether the relationship is not
randomly occurred.
For the third research question, “How does social condition influence the
relationship between social cohesion and aspects of housing and neighourhood?”,
partial correlation will be applied. Partial correlation is actually using Pearson
moment correlation, but with additional variable as called control variable. It is
usually a variable that is suspected influencing the relationship between two
observed variable (original variable). In this research, social condition will be
control variable.
The extent to which the control variable may influence the relationship will be
identified by comparing the controlled correlation with the original correlation. If
there is no difference between those two correlation values, then the interference is
that the control variables have no effect. But, if the partial correlation approache 0,
the interference is that the original correlation is spurious meaning that there is no
direct causal relationship between the two observed (original) variables because
the control variables are either common anteceding causes, or intervening variables
(Garson, 2010).

The Development of Social Cohesion in Public Housing. A Study in A Flat Housing Project in
Sukaramai, Medan
25
3.6 Research Stages
1. Research background (research proposal writing)
Formulation of the research background, problem definition, research
questions, objective, and hypothesis
Conducting the literature review, mainly on theoretical discussion on social
capital, social exclusion, social housing policy, the importance of housing
in strengthening the social cohesion
Determining the research method, including sampling technique.
2. Data collection
Data compilation is conducted by: (1) descriptive observation aimed to
picture general situation of the communities and environment related with
the research problems (2) giving the questionnaire to the respondents
formulated from related literature sources, and; (3) Secondary data
collection from housing providers, sub district authority, and related
institutions.
The fieldwork for this research will be conducted on August-September
2009 and June 2010.
3. Data Analysis
4. Result formulation
5. Conclusions and recommendations
Conclusions
Recommendations
Figure 3-1: Research framework
Research
background
Problem
definition
Research
questions
Objective
Literature
review
Research
method
(sampling
technique)
Data collection
Secondary data
Literature study
Data AnalysisResult formulationConclusion and
recommendation
Primary data
Observation
Questionnaire for the resident
respondents

The Development of Social Cohesion in Public Housing. A Study in A Flat Housing Project in
Sukaramai, Medan
26
Chapter 4 : Data Analysis
4.1 Description about Location of the Research Area
Flat Housing (RUSUN) Sukaramai is the first social housing built vertically in
Medan. It was built in 1984 by the National Housing Corporation (PERUMNAS)
on the 14.442 m2 of an area owned by the government, and starting to be occupied
since 1988. The project was started as a result of incident of fire that burned many
houses nearby the location of public housing in 1985. The victims were given a
priority to occupy the public housing. It is located on a street named Jalan Arief
Rachman Hakim in district of Sukaramai II, City of Medan, North Sumatera,
Indonesia. The area surrounding the public housing estate are characterized with a
high density of population, 350 inhabitants per hectare, and mixed economic
activities, dominantly commercial ones. The majority of population in this district
is inhabited by Chinese ethnic, around 60%, and followed by Javanese and
Bataknese (source: Medan Area District 2008).
Figure 4-1: Aerial view of location of RUSUN Sukaramai Medan
Source: Google map (2010)
The housing tenure of the public housing is based on a home purchase system
meaning that the tenants can finish the installment repayment until a maximum
period of 20 years. It can be assumed that all tenants have managed their
installment since the public housing has already been inhabited for 22 years up to
now. But, not all of the owners still live in the housing. According to the Head of
tenant association, PPRS (Perhimpunan Penghuni Rumah Susun) RUSUN
Sukaramai, many owners have left and sold or rented their units to other people.
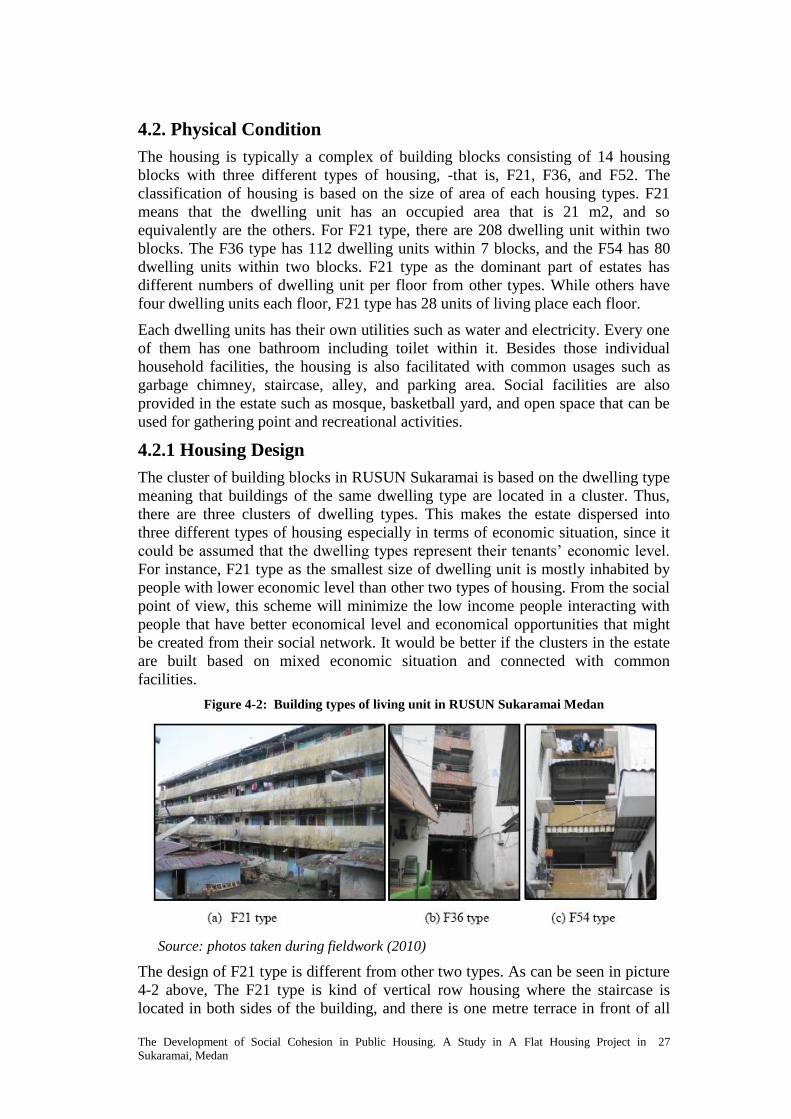
The Development of Social Cohesion in Public Housing. A Study in A Flat Housing Project in
Sukaramai, Medan
27
4.2. Physical Condition
The housing is typically a complex of building blocks consisting of 14 housing
blocks with three different types of housing, -that is, F21, F36, and F52. The
classification of housing is based on the size of area of each housing types. F21
means that the dwelling unit has an occupied area that is 21 m2, and so
equivalently are the others. For F21 type, there are 208 dwelling unit within two
blocks. The F36 type has 112 dwelling units within 7 blocks, and the F54 has 80
dwelling units within two blocks. F21 type as the dominant part of estates has
different numbers of dwelling unit per floor from other types. While others have
four dwelling units each floor, F21 type has 28 units of living place each floor.
Each dwelling units has their own utilities such as water and electricity. Every one
of them has one bathroom including toilet within it. Besides those individual
household facilities, the housing is also facilitated with common usages such as
garbage chimney, staircase, alley, and parking area. Social facilities are also
provided in the estate such as mosque, basketball yard, and open space that can be
used for gathering point and recreational activities.
4.2.1 Housing Design
The cluster of building blocks in RUSUN Sukaramai is based on the dwelling type
meaning that buildings of the same dwelling type are located in a cluster. Thus,
there are three clusters of dwelling types. This makes the estate dispersed into
three different types of housing especially in terms of economic situation, since it
could be assumed that the dwelling types represent their tenants‟ economic level.
For instance, F21 type as the smallest size of dwelling unit is mostly inhabited by
people with lower economic level than other two types of housing. From the social
point of view, this scheme will minimize the low income people interacting with
people that have better economical level and economical opportunities that might
be created from their social network. It would be better if the clusters in the estate
are built based on mixed economic situation and connected with common
facilities.
Figure 4-2: Building types of living unit in RUSUN Sukaramai Medan
Source: photos taken during fieldwork (2010)
The design of F21 type is different from other two types. As can be seen in picture
4-2 above, The F21 type is kind of vertical row housing where the staircase is
located in both sides of the building, and there is one metre terrace in front of all

The Development of Social Cohesion in Public Housing. A Study in A Flat Housing Project in
Sukaramai, Medan
28
dwelling units. Between two dwelling units is separated by a wall. The design of
other two dwelling types, F36 and F54, is about similar. The difference is mainly
on the size.
In flats F21, tenants living in the middle of the buildings are indicated to have less
mobility since the staircase as the housing facility is located at both sides of the
building. Tenants living nearby the staircase are less comfortable since their living
unit will be passed by other tenants willing to use the staircase and reducing their
privacy. In flats F36 and F54, the tenants have equal access to the staircase as their
main facility toward their mobility, and they have much more privacy than F21
type.
The air circulation in the living unit using ventilation is primarily designed to
make the air in the room able to circulate naturally so that no air conditioner would
be required. However, the limited space in the living unit requires the number of
people living in each of dwelling types should be limited as well to maintain the
comfort (DR. Ir. Firman Tambun et al., 1992).
The design of rooms in the living unit of RUSUN Sukaramai is likely to be similar
to other prevailing vertical public housings in Indonesia. RUSUN Sukaramai as
many other vertical public housings in Indonesia is a massive housing production
that is part of the Indonesian government using the technical standard applied to all
of them. Meanwhile, the spatial design for the rooms is much related with the
resident„s behaviour which is different from one ethnic to other one since each of
them has their own characteristics and habits.
The mobility of tenants in a dwelling unit is also constrained by the number of
people living in the same roof. Thus, there should be limitation in terms of number
of people that can live in a dwelling unit. However, for some ethnics, living with
extended family apart of nucleus family has been accustomed.
4.3 Social demographic condition of the estate
Since the housing was initially provided for housing the victims of fire, which
happened in 1983 nearby the location where now the public housing of Sukaramai
stands, the composition of the tenants is dominated by Chinese ethnic which was
the largest portion of people whose house were burned on that time. The Chinese
ethnic composes 80 percent of total residents in this estate, followed by Javanese 8
percent, and the rest of percentage is occupied by other ethnics such as Batak,
Padang, Malay, Aceh and Nias (Source: Sub district office of Sukaramai II).
The majority of the tenants are Buddha followers composed of around 80%, and
followed by Muslim around 16.7%. Other religions are also there such as
Protestant Christian 2%, and Catholic and Hind composing 0.5% respectively
(Source: Sub district office of Sukaramai II).
According to sub district authority, most of the tenants are unemployed. Over 50%
of inhabitants do not have a job, 10% have their own business, and 8% of the
tenants are engaged as workers. Others are more likely working in informal sectors
such as driver, house maid, electricity repairmen, painter, and so on.

The Development of Social Cohesion in Public Housing. A Study in A Flat Housing Project in
Sukaramai, Medan
29
4.4 Community Activities of Housing Tenants
To build solidarity and harmony of living among the residents, there are several
social activities that have been conducted in the neighbourhood such as integrated
health service or Posyandu (Pos Pelayanan Terpadu) for baby helath monitoring,
and pregnant women which is taken place at sub district office, Thai Chi
gymnastics performed at the open space, Programme for Family Welfare
Education / PKK (Pemberdayaan Kesejahteraan Keluarga) for the housewives,
Quran Recitation, National Ceremonies by having sport competitions.
Other forms of social activities recorded in the flats are wedding ceremonies,
funerals, rotating saving groups (arisan) that are undertaken incidentally and
involving only few people (source: Head of Neighbourhood Unit).
4.5 Results
This section will firstly elaborate about the research finding obtained from the
questionnaire distributed during the fieldwork. Descriptive statistic will be applied
like frequency, percentage, and mean score. This step is useful to get description
about respondents in terms of socio-demographic condition and to obtain the
preliminary analysis about the social dynamic and possible relationship which
might occur due to different social condition among the tenants.
Secondly, scale assessment will be explained through significant consistency of
reliability test using Cronbach„s alpha indicator. This part is to identify the
reliability of scales that had been used during the fieldwork. Items within the
scales that has the least “corrected item – total correlation” and the highest value of
“Cronbach's alpha if item deleted” will be prioritized to be dropped out, and new
scale will be applied to further analysis.
The last part of this section will focus on the analysis of relationship between
variables of social cohesion and factors influencing it within the estate including
the housing and neighbourhood condition together with the situation of inequality
in terms of economic condition. Next, the correlation between those two aspects
will be examined in the level of various social conditions to find out the significant
difference of correlation among dichotomous variables of social condition.
4.5.1 Social condition of respondents
4.5.1.1 Ethnic
The majority of the respondents in RUSUN Sukaramai are Tionghoa/ Chinese
ethnic people. More than 50 percent of the respondents, 63.3%, are people with
Tionghoa ethnic. The second major ethnic of respondents living in the estate is
Javanese people which consist of 20%. Those figures are predictable since at the
early operation of this public housing was mainly to provide shelter for the fire
causalities happened nearby where now RUSUN Sukaramai is located. The
causalities were mostly Chinese. Based on the research done by DR. Ir. Firman
Tambun et al. (1992), this situation is also caused by the reality that Chinese
people are more easily to live in the vertically multi family houses, since they had
been used to live in shop houses. For them, it was not so difficult to adapt living in
the flats compared to Indonesian ethnics living also in the estate that still regard
the land as an entity of their housing property.

The Development of Social Cohesion in Public Housing. A Study in A Flat Housing Project in
Sukaramai, Medan
30
Moreover, compared to other dwelling types, in flats F21 the Chinese is not so
dominant although they are still the major ethnic in the neighbourhood. 45% of the
respondents living in F21 are Chinese. It is lower than F36 and F54 type, - that is,
87.50% and 57.50% respectively.
Chart 4-1Respondents’ ethnics
However, the composition of respondents is more varied in F21 with Chinese,
Javanese, and Bataknese compose the big three of ethnic composition while in
flats F36 and F54, the composition is more likely homogenous with Chinese as the
single majority of ethnic composition.
4.5.1.2 Religion
As the Chinese people dominate the respondents‟ composition, so does Buddha
becomes the major religion in the estate since usually Chinese people are Buddha
followers. It is indicated by description of respondents‟ religion. 55% of total
respondents of the estate embrace Buddha as their religion, followed by Moslem
34.2%, Catholic 5.8%, Christian 4.2%, and Hind 0.8%.
The composition of religion within each dwelling type can be seen at chapter 4-2
below. The composition of religion in each dwelling types is not much different
from that of ethnic. The most mixed composition in terms of religion can be found
in flats F21 with Muslim as the highest percentage of composition, 50%, while in
flats F36 and F54, Buddha becomes the major religion with 75% and 52.50%
respectively.
Chart 4-2Respondents’ religion
4.5.1.3 Education level
Almost 47% of the respondents achieve their highest education level in junior high
school and only 25.8% of them have senior high school as their highest education

The Development of Social Cohesion in Public Housing. A Study in A Flat Housing Project in
Sukaramai, Medan
31
level and 0.8% graduated from university/ diploma. 20.8%, in fact, are failed to
finish their elementary school and 5.8% of them do not go to school at all. These
numbers reflect that most of the residents in the estate are a low educated
community.
Table 4-1: Respondents’ level of education
What an interesting figure is that the high concentration of low level of education
is located in flats F54 which is considered as the flats that is occupied by people
with a better economy referred to the selling price. As can be seen on the table 4-1
below that 65% of the respondents in flats F54 only had junior high school and
17.5% of them dropped out their elementary school. In fact, in flats F21 as the
“cheapest‟ residence has the highest percentage of respondents having senior high
school which is about 37.5%, and 2.5% of them graduated from the university/
diploma. This condition might be related by other factors such as the composition
of age group and length of stay which will be described later on different section.
Briefly, the highest young age group is found in flats F21 which is about 50% of
the respondents living in that flats are less than 39 years old1. This figure is much
higher than other two types of flats. In terms of length of stay, it is also found that
tenants who are living less than 5 years are mostly found in flat F21 which is about
52,5% of the F21 respondents.
In conclusion, the newly occupying residents in F21 are mostly young generation
which had different situation in terms of better education opportunities from other
two types of flats who mostly have been living in those places for longer time.
4.5.1.4 Age
The age of respondents varies from 23 to 73. The young age group is mostly found
at flats F21. Around 50% of F21 respondents ages less than or equal to 39 years
1 Age group division is based on the quartile derived from respondent„s age

The Development of Social Cohesion in Public Housing. A Study in A Flat Housing Project in
Sukaramai, Medan
32
old. In the other hand, the old age group, over or equal to 50 years old mostly
inhabits flats F36. The middle age group from 40 to 49 years old is mostly found
in flats F54. The more mature group of age, above 39 years old, mostly lives in
F54 and F36. There are 80% and 67.5% of each respondent respectively.
Chart 4-3Composition of respondents’ age
4.5.1.4 Household type
In general, most of the households of respondents in the estate are couple
households. 92.5% of the respondents live together with their spouse, children, or
relatives. The majority of the couple household is families with dependent children
which is about 65.8% of the total respondents of the estate, and followed by
household without children about 13.3%. The typical of household type within
each type of flats is not very much different. Within all types, above 60% of each
typical respondent are couples with dependant children in their home with highest
percentage, 72.5%, is found at flats F54 followed by flats F36 about 65%. Single
household is mostly found at flats F21 and F54, which is about 10% of both of
them, while at flats F36 has only 2.5%.
4.5.2 Economic condition of respondents
As illustrated in Chapter 2 (Literature Review) that inequality is one of the aspects
that can weaken social cohesion. This inequality is usually described in the
economic condition of a community. Several indicators of economic condition
such as financial hardships, job sector, and satisfaction with the current job are
outlined in this section.

The Development of Social Cohesion in Public Housing. A Study in A Flat Housing Project in
Sukaramai, Medan
33
Financial hardships
Financial hardships are measured by giving the respondents conditions about
several financial difficulties that might have been experienced by them. The
presence of having one of those difficulties is considered as a financial hardship.
Summing up of the financial hardship within a neighbourhood shows to what
extent a neighbourhood is overwhelmed by financial difficulties.
Chart 4-4: Financial hardships
From the chart 4-4, it can be see that respondents in flats F21 are having the most
financial hardships for all conditions compared to other flats. The highest
percentage of financial difficulty they experienced is asking financial help from
friends or family. This condition is similarly experienced by the respondents in
flats F36 and flats F54, which is about 20% and 35% accordingly of each type of
flats respondent. The second most financial difficulty experienced by the
respondents is “couldn„t pay electricity, gas, or telephone bills on time”. About
25% of respondents in flats F21 are having condition where they couldn„t pay the
bills, while 2.5% and 10% of respondents in flats F36 and F54 are having the same
situation.
Condition of current job
Around 32.5% of respondents of flats F21 answer “others” as their job. This high
figure is because in reality many tenants in this flats do not have regular job. They
might work for a short period of time, or longer. Their wage is usually low and
without insurance.
Respondents that have business helped by family member or hiring irregular
employee are quite high in these three neighbourhoods. Around 20%, 37.5%, and
32.5% of respondents living in F21, F36, and F54 respectively are engaged in this
type of business.

The Development of Social Cohesion in Public Housing. A Study in A Flat Housing Project in
Sukaramai, Medan
34
Table 4-2: Distribution of respondent’s job
Another type of job that is significant in terms of percentage is self employed. This
kind of job is done by 25%, 37.5%, and 22.5% of respondents living in flats F21,
F36, and F54 accordingly.
By observing figures in the table 4-2 given above, it can be calculated the
distribution of formal/ informal sector of job within each flats. Based on the list of
jobs in table 4-4 above, formal sector involve teachers, private company employee,
and business owner with regular employee, while the rest of list is categorized
engaging in informal sector. Chart 4-5 gives the distribution of formal/ informal
sector of job. High percentage of informal sector is found in flats F36 and F21 as
high as 82.5% and 80% respectively. In flats F54, there are only 57.5% of
respondents engaging in informal sector.
Chart 4-5: Formal/ informal sector of job
In terms of job satisfaction, respondents in flats F54 have the highest mean score
of satisfaction with their current job within the estate. From the mean score, 3.45,
it could be concluded that F54 respondents are quiet satisfied. About 85% of the
F54 respondents are expecting the same job in the next 12 months. Respondents in
flats F21 have the lowest mean score of satisfaction with their current job as high
as 3.0. This value is considered neither satisfied nor dissatisfied meaning that they
are not sure about the satisfaction with current job. About 60% of them are still
expecting the same job in the next 12 months. Respondents in flats F36 have less
expecting the same job in the next 12 months than respondents in flats 21. About
57.5% of them feel that way.

The Development of Social Cohesion in Public Housing. A Study in A Flat Housing Project in
Sukaramai, Medan
35
Table 4-3: Job satisfaction
4.5.3 Scale assessment
There are several variables in this research using scale. Items within the scale
should be tested its reliability to make sure that they measure based on the same
underlying construct. Variables that are using scale are: place attachment,
neighbourhood interaction, neighbourhood activities, social support, civic
activities, satisfaction with neighbourhood infrastructure, satisfaction with
neighbourhood service, satisfaction with home/ building component, satisfaction
with the size of rooms in living unit, and satisfaction with the quality of rooms in
living unit.
Based on the reliability test, there are seven variables whose value Cronbach„s
alpha is over 0.7. Those variables are neighbourhood activities, social support,
satisfaction with neighbourhood infrastructure, satisfaction with neighbourhood
service, satisfaction with home/ building component, satisfaction with the size of
rooms in living unit, and satisfaction with the quality of rooms in living unit2.
The value of Cronbach„s alpha of housing variables are significantly reliable.
Almost all variables of housing condition are above 0.9. Only scale of satisfaction
with neighbourhood infrastructure has relatively lower value of Cronbachs„ alpha
than other variables of housing condition. Its value is 0.746.
Thus, all the variables that have Cronbach„s alpha value more than 0.7 are
considered reliable and can be furthermore used to analyze. The alpha value of 0.7
is normally taken as the referring point of the reliability test. However, as had been
mentioned in the last chapter, that point 0.5 could be takes as the referring point if
the scale has fewer than ten items (Pallant, 2007).
In that case, the variable like neighbourhood interaction whose value of
Cronbach„s alpha is only 0.686 (<0.7 or >0.5) can be still used.
For the variables that have Cronbach„s alpha value below than 0.5 like place
attachment and civic activities, then items that has the least “corrected item – total
correlation” and the highest value of “Cronbach's alpha if item deleted” within the
related scale will be prioritized to dropped out. In this case, for scale of “place
attachment”, item “advantage of living in the area” will be dropped out. This item,
2 See Appendix 1: Reliability of scale analysis

The Development of Social Cohesion in Public Housing. A Study in A Flat Housing Project in
Sukaramai, Medan
36
then, will be analyzed individually and regards it as one of housing condition
variables. Although the Cronbach„s alpha value, after the item “advantage of living
in the area” is dropped out, is not significantly increasing the alpha value and still
lower than 0.5, the scale of place attachment, without item “advantage of living in
the area”, is still kept, considering that its alpha value, 0.491, has been much
closed to 0.5.
Another scale whose alpha value is below 0.5 is civic activities. Its value is only
0.443. The highest Cronbach„s alpha value that can be increased by deleting items
is 0.493. It can be achieved by deleting item “Civic activity (election)”. The value,
0.493, is still considered acceptable due to its closeness with the value, 0.5.
4.5.4 Social cohesion within each type of flats
This section describes the level of social cohesion domains within each type of
flats in the estate. The main objective of this description is to preliminarily identify
whether the different physical environment influence level of social cohesion,
although it also must be looked at from the social condition perspective.
4.5.4.1 Place Attachment
This variable is measured by a scale using five items asking to the respondents
how they agree with the following items:
It is a good place to raise my children
I am willing to invest time or effort to make this an even better place
I sometimes feel like I don„t belong in this place*
What happens to this place is important to me
Moving out from this area will be the best option for my future*
The third and fifth items are reverse order question which means that in the
analysis the order will be reversed.
Items are developed based on the definition of place attachment used by Payton
(2003). He suggested place attachment into two categories. The first is functional
place attachment which means the functionality of one place to the users, how it
benefit to them. In this respect, the users feel attached to their area because it gives
them several functions. The second is emotional place attachment. In the later one,
the attachment to place is more like psychological relationship to the people
(users). The place could be meaningful due to the length of time people engage
with the place in terms of such as living. It could be also because the place gives
much impressive memory to them.
In the table 4-4 given below, it can be seen that almost items of place attachment
have the highest mean score in flats F54 besides the item “I sometimes feel like I
don„t belong in this place” which has the highest mean score in flats F36. It is
slightly higher than F54. F21 type has the lowest mean score of place attachment
excluding the item “It is a good place to raise my children”. Regardless its lack of
attractiveness of physical environment in terms of housing condition, the
respondents in flats F21 still better perceive their neighbourhood as a good place to
raise their children compared to flats F36 that has lower mean score than F21,
which is about 2.90 for F36 and 3.08 for F21. However these values actually is
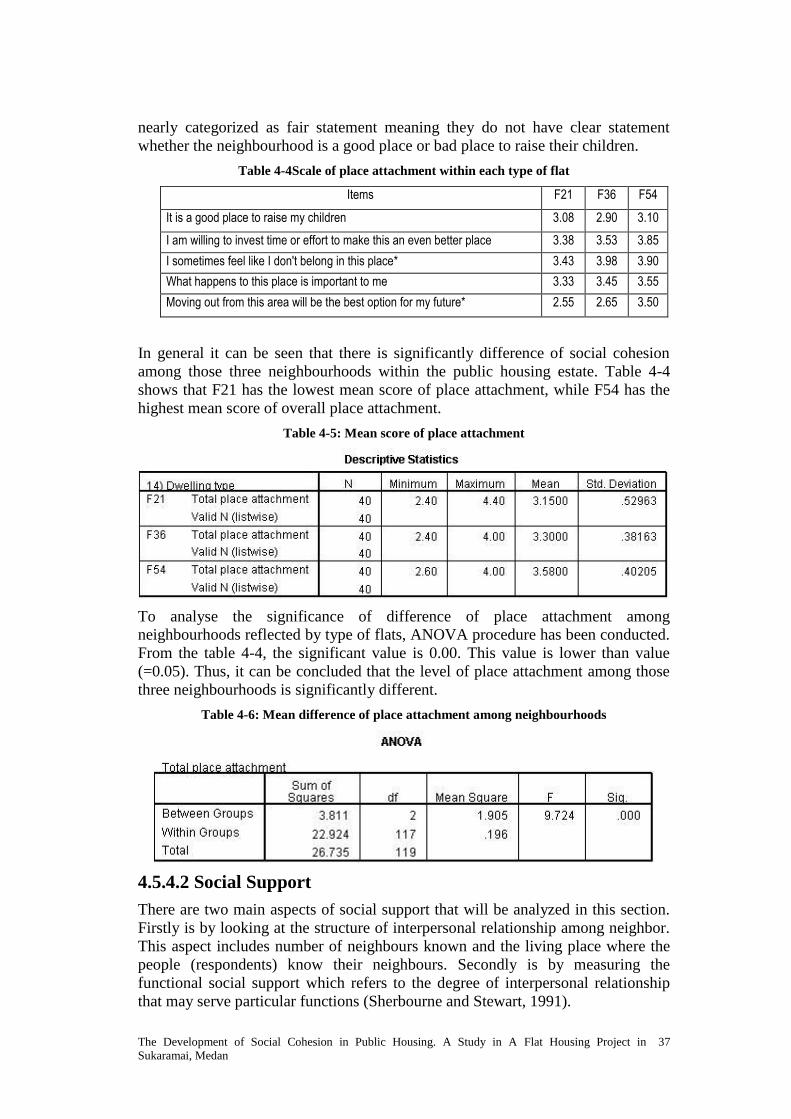
The Development of Social Cohesion in Public Housing. A Study in A Flat Housing Project in
Sukaramai, Medan
37
nearly categorized as fair statement meaning they do not have clear statement
whether the neighbourhood is a good place or bad place to raise their children.
Table 4-4Scale of place attachment within each type of flat
Items F21 F36 F54
It is a good place to raise my children 3.08 2.90 3.10
I am willing to invest time or effort to make this an even better place 3.38 3.53 3.85
I sometimes feel like I don't belong in this place* 3.43 3.98 3.90
What happens to this place is important to me 3.33 3.45 3.55
Moving out from this area will be the best option for my future* 2.55 2.65 3.50
In general it can be seen that there is significantly difference of social cohesion
among those three neighbourhoods within the public housing estate. Table 4-4
shows that F21 has the lowest mean score of place attachment, while F54 has the
highest mean score of overall place attachment.
Table 4-5: Mean score of place attachment
To analyse the significance of difference of place attachment among
neighbourhoods reflected by type of flats, ANOVA procedure has been conducted.
From the table 4-4, the significant value is 0.00. This value is lower than value
(=0.05). Thus, it can be concluded that the level of place attachment among those
three neighbourhoods is significantly different.
Table 4-6: Mean difference of place attachment among neighbourhoods
4.5.4.2 Social Support
There are two main aspects of social support that will be analyzed in this section.
Firstly is by looking at the structure of interpersonal relationship among neighbor.
This aspect includes number of neighbours known and the living place where the
people (respondents) know their neighbours. Secondly is by measuring the
functional social support which refers to the degree of interpersonal relationship
that may serve particular functions (Sherbourne and Stewart, 1991).

The Development of Social Cohesion in Public Housing. A Study in A Flat Housing Project in
Sukaramai, Medan
38
a. Structure of interpersonal relationship
It is necessary to find out the number of neighbours known to identify how high
their network with the other tenants in the housing estate. This network could
indicate how much social support they will get from the neighbourhood. From the
table 4-5 given below, the mean score of number of neighbours known for both
flats F21 and F54 is 3.85 and 3.95 respectively. The values are almost 4,
categorized as 30 up to 40 neighbours in the estate that he/she knows.
Table 4-7: Number of neighbours known
However the difference of mean score among three neighbourhoods is not
significant. From the table 4-6 given below, it is indicated by the significant value,
0.125, derived from ANOVA test which is higher than value (=0.05).
Table 4-8: Mean difference of number of neighbours among neighbourhoods
Chart 4-6: Having neighbours based on their location
Besides identifying the number of neighbours, the location where the neighbours
live is necessary to find out the social interaction pattern they develop during their

The Development of Social Cohesion in Public Housing. A Study in A Flat Housing Project in
Sukaramai, Medan
39
stay in the estate. Respondents of flats F36 and F54 meet their neighbours wider
than F21. It can be seen from the chart 4-4 that percentage of respondents that
know other tenants besides those living in the same floor is more found in flats
F36 and F54. This figure gives indication that respondents in flats F21 are less
knowing neighbours living not with the same floor with them than other two types
of flats. It might be caused due to the design of the building. Since F21 is designed
with a type of vertical row housing with 28 dwelling units in each floor, then a
tenant in this flats must have more “same floor” neighbours than other two type
flats designed with a type of mushroom that only has 4 dwelling unit in each floor.
Respondent in the later one are likely to have a willingness to also know other
tenants apart those living in the same floor with them. Level of interaction within
each neighbourhood itself can be seen from the table 4-9 below. The highest level
of interaction is taken place in flats F21 whose mean score is 2.79. This score is
closed to the point 3 which means the frequency of neighbourhood interaction only
sometimes occurs. Furthermore, in general these three neighbourhoods do not have
high level of neighbourhood interaction. After flat F21, flats F54 has the second
highest level of neighbourhood interaction.
Table 4-9: Neighbourhood interaction
However the mean score of neighbourhood interaction is not significantly different
among three neighbourhoods. In the table 4-10 given below, the significant value
is 0.403, higher than value (=0.05) which means there is no difference of
neighbourhood interaction among neighbourhoods.
Table 4-10: Mean difference of neighbourhood interaction among neighbourhoods
As has been illustrated in the previous section on this chapter, according to local
Head of Neighbourhood unit, several neighbourhood activities are taken place
within the estate. These activities are intended to enhance solidarity and harmony
among the tenants both within the neighbourhood and outside their
neighbourhood.

The Development of Social Cohesion in Public Housing. A Study in A Flat Housing Project in
Sukaramai, Medan
40
Level of social activities that are followed by the respondents is shown on the table
4-11 below. It is measured by the frequency of social activities that have been
followed by the respondents.
Table 4-11Mean score of frequency following social activities
Flats F36 has the highest mean score of level of frequency of social activities
followed by the respondents, followed by flats F21. It turns out that level of social
frequency of social activities is not so high. Only 2.42 and 2.40 point that F36 and
F21 can have for the mean score. These values are lower than 3 as the indication of
medium level of frequency.
The difference among neighbourhoods in terms of type flats is not so significant.
The significant value obtained from ANOVA test shows the value is 0.576, much
higher than value (=0.05).
Table 4-12: Mean difference of level of social activities followed by the respondents
b. Functional social support
This variable is using scale consisting of seven items. Respondents are asked about
how often the following items of support in their neighbourhood available in case
they need it. They are given options that were ranging from none of the time to all
of the time as the highest score. The following items are:
Someone you can count on to listen to you when you need to talk
Someone to take you to the doctor if you needed it
Someone that can watch my children while they are playing around
Someone to help with daily chores if you were sick
Someone to turn to for suggestions about how to deal with a personal problem
Someone to give you information to help you understand a situation
Someone to do something enjoyable with like play games, sport, or other
recreational activities

The Development of Social Cohesion in Public Housing. A Study in A Flat Housing Project in
Sukaramai, Medan
41
From the table 4-11 below, it can be seen that flats F21 has the highest mean score
of social support, although the value is not so high since it is lower than 3.0 as the
median score referring that the social support is only available at some of the time.
The value is much higher than flats F36 and F54. The typical neighbourhood in
F21 characterized with low income area tends to induce the tenant relying much on
their neighbours and its design ease them to get help.
Table 4-13: Mean score of social support
The difference of mean score among neighbourhoods is also significant as can be
seen on table 4-12 below. The significant value of this difference is 0.004, much
lower than value (=0.05).
Table 4-14: Mean difference of social support
4.5.4.3 Civic activities
Civic activities are measured by the “yes” or “no” questions towards a list of civic
activities that have been done by the respondents. Those civic activities are
activities that are undertaken to improve their neighbourhood condition as a
response to locally social problem. The participation of respondents in civic
activities could take form in terms of donation of time, money, or other resources
to something they regard valuable to their community (Payton, 2003).
Number of civic activities followed by the respondents from the list given is
computed and defined as the level of civic activities compared among
neighbourhoods.

The Development of Social Cohesion in Public Housing. A Study in A Flat Housing Project in
Sukaramai, Medan
42
Table 4-15: level of civic activities
The highest level of civic activities indicated by its mean score from the table 4-14
above is found in flats F21 as high as 1.3, followed by F36 and F54. This value is
defined as the number of civic activities that have been followed by the
respondents. The maximum value that is possible that can be achieved is 6
(considering the number of civic activities given in the list). Thus, as we can see
that within those three neighbourhood, the level of civic activities is no so high. If
it might be categorized into three groups from low, middle, and high level of civic
activities, then it can be considered as low civic activities.
The difference of level of civic activities among three neighbourhoods is actually
significant. It is indicated by the result of ANOVA test as seen on the table 4-14
above, where the significant value of this difference is 0.048, lower than value
(=0.05).
Table 4-16: Mean difference of level of civic activities
4.5.4.4 Tolerance of Diversity
Variable “tolerance of diversity” is measured by the statement about how they
agree the diversity in terms of different ethnics and cultural background which
exists in their neighbourhood could make a better place. The graduation of
agreement is given as the option for the answer ranging from 1 to 5 point, where 5
shows strongly agree with the statement. Generally, the mean scores for the three
neighbourhoods are quite high. The mean score of three neighbourhoods are higher
3.0 for F21 and F36, and almost closed to 4.0. It means that the two
neighbourhoods quite agree that the diversity within their neighbourhood will
make a better place. F54 is the neighbourhood that has the highest mean score of
tolerance of diversity. Its mean score is as high as 4.47 higher than 4.0 which
means that respondents in this neighbourhood agree that the diversity within their
neighbourhood will make a better place. However the difference of mean score of

The Development of Social Cohesion in Public Housing. A Study in A Flat Housing Project in
Sukaramai, Medan
43
tolerance of diversity among neighbourhood within the public housing is not
significant. It might be happened that the difference occurs randomly.
Table 4-17: Mean score of tolerance of diversity
Table 4-18: Mean difference of tolerance of dicersity
4.5.5 Housing and neighbourhood condition within the public
housing
After more than 20 years operating, the public housing RUSUN Sukaramai has
been dramatically changed. Both social composition of dwellers and physical
environment and have been extremely different from the beginning of the estate
firstly occupied in 1988. The failure to maintain the physical building and also the
environment has made the physical appearance less attractive as can be seen in the
figure 4-3 given below. It also includes bad performance of housing management
where PERUMNAS as the housing developer has gradually reduced their
responsibility managing the housing since it is expected that after more than 20
years the housing built, most of the dwellers have finished their installment and
become full owner of their property, and furthermore through tenant association,
PPRS, it replaces PERUMNAS„s responsibility in managing and maintaining the
building as well as the environment. Unfortunately, the condition does not improve
and remain the same. It is difficult in this estate to create a stable community, one
thing that is necessary to build cooperation among neighbourhood. Instead, turn
over level in the estate is quite high.
Figure 4-3: Physical condition of the estate

The Development of Social Cohesion in Public Housing. A Study in A Flat Housing Project in
Sukaramai, Medan
44
From the chart 4-7 given below, respondents in flats F36 (57.5%) and F54 (50%)
have been living in the neighbourhood for more than 16 years, while in F21, this
number is much lower, only 42.5% of respondents have been quiet long living in
the neighbourhood. The extreme condition is found in flats F21, where the
majority of the respondents (52.5%) have been just living in the neighbourhood for
less than five years.
Chart 4-7: Length of stay
There is an indication that some people used to live in the public housing leave to
other places and rent or sell their property to other people especially in flats F21. It
is not surprising finding out that there are many respondents which are renter.
From the chart 4-8, about 65% of respondents living in F21 are renter. This figure
is the highest percentage of renter among other two flats, which are still dominated
by outright owner.
Taylor (1998) explained this situation as process of labeling and exclusion in
public housing. People that have chance will leave, and people with least choice
will replace them. Subsequently, the public housing becomes the last resort to be
chosen. This situation actually has been happening in flats F21. Although the stage
of labeling and exclusion in this flats has never been studied or measured, people
outside the neighbourhood have given a stigma to the neighbourhood including
respondents in other flats. Stigmatization in flats F21 include such as the presence
of drug users, high crime rate, high unemployment, and dirtiness.

The Development of Social Cohesion in Public Housing. A Study in A Flat Housing Project in
Sukaramai, Medan
45
Chart 4-8: Home ownership
Compared to other two flats, based on the visual observation physical environment
in flat F21 is indeed worse. General view, when entering this neighbourhood is
dilapidated building, litter lying around and hanging laundry (see figure 4-3a).
Table 4-19 shows about the trend of general condition of housing during last five
years. It is evident that in three flats, there is no neighbourhood showing that the
general condition of housing in five years is improving. In those three flats,
respondents consider their housing condition as a condition between worsened and
remain the same. Flats 21 has the lowest mean score (2.7), followed by flats F36
and F54.
Table 4-19: General condition of housing in last five years
The aforementioned condition surely affects tenants‟ perception about their
environment and neighbourhood. It, then, influences their mind to the locally social
life, for instance their togetherness.
4.5.5.1 Housing condition
As has been described above about the general condition of physical environment,
this section elaborates in detail physical aspects of housing condition that might
influence social cohesion. Those aspects include neighbourhood infrastructure,
neighbourhood service, home component, size of rooms in the living unit, quality
of the rooms, and number of rooms.
The first five main aspects of housing condition is measures using a scale
consisting of several items. They are measured by the respondent„s satisfaction
about each of item within the respective scale. The first aspect, neighourhood
infrastructure, is asked about satisfaction about several kinds of public

The Development of Social Cohesion in Public Housing. A Study in A Flat Housing Project in
Sukaramai, Medan
46
infrastructure provided in the neighbourhood. Those are water supply, electricity,
telephone line, and sanitation. The second, neighbourhood service, is measured by
the satisfaction of given neighbourhood services such as garbage carrying, outdoor
lighting, public safety, the maintenance of the building and neighbourhood
facilities, drainage and road maintenance. The third, home component is measured
by the satisfaction of building component of the living unit such as the wall, floor,
window, door, ventilation, and ceiling. The third and fourth aspect of housing
condition, room size and quality of rooms, are measured by the satisfaction of each
rooms in the living unit toward their size and quality.
The last aspect of housing condition is measured by the satisfaction of number of
rooms available in the living unit.
Table 4-20 shows the result of mean score of each aspect of housing condition. It
can bee seen that flats F21 has the lowest means score for all six aspects of
housing condition but neighbourhood service. Flat F36 has the lowest mean score
in the later one. Contrast with flats F21, flats F54 has the highest mean score for all
aspects of housing condition, and their value are also quiet high. Their level of
satisfaction, except neighbourhood service, is between neutral and satisfied.
Table 4-20: physical housing condition based on respondent’s satisfaction
Based on the ANOVA test, the difference of mean score among three flats is
significant except the aspect of neighbourhood infrastructure and neighbourhood
service. It could happen because all flats are provided with the equal access to the
infrastructure and service by local government and PERUMNAS. The difference is
started to be present in relation with the unique facilities given to each flats like
home component, room size, quality of rooms and number of rooms.
Among aspects of housing condition, neighbourhood service has relatively lower
mean score. Its mean score is below 3 for all flats. It means respondents are not
really satisfied with the neighbourhood service. The dissatisfaction of respondents
with the neighbourhood service is mainly due to their dissatisfaction with garbage
carrying and building maintenance. These two services give low mean score to the
value of overall neighbourhood service.
This situation is reflected in the neighbourhood priorities by which the respondents
are asked about the priorities that are needed to improve their neighbourhood.
From the table 4-21, it can be seen that environment cleanness and repairing
building and its facilities become the first two priorities of each neighbourhood.

The Development of Social Cohesion in Public Housing. A Study in A Flat Housing Project in
Sukaramai, Medan
47
Table 4-21: Mean difference of aspects of housing condition among flats
Table 4-22: Neighbourhood priorities
4.5.5.2 Neighbourhood condition
As housing condition may influence social cohesion, so does neighbourhood
condition (Forrest and Kearns, 2001) contributing to the social cohesion. An
unsafe, violent and disorder neighbourhood might weaken social cohesion.
Neighbourhood will be indicated by the residents getting suspicious to others and
it will be difficult to build common vision and cooperation among them that is
needed to solve locally social problems.
This section gives description of respondent„s perception about neighbourhood
condition where they have been living for a particular time in the area. Aspects
such as safety, peacefulness, trend of violence, and victimization become the prime
concern of the housing estate, and indicate the neighbourhood condition.

The Development of Social Cohesion in Public Housing. A Study in A Flat Housing Project in
Sukaramai, Medan
48
Table 4-23: Neighbourhood condition
As seen in table 4-23, the safety in three neighbourhoods is considered quiet safe,
although their values of mean score are not so high, still below point 4 which
refers the neighbourhood is safe. Flat F21 has the lowest mean score (3.59), while
F36 has the highest one.
Referring to aspect of peacefulness, flats F21 has much different mean score from
other flats. The value is much lower than others, and it is the lowest mean score
among three neighbourhoods which is about 2.93. It means that flats 21 strongly
tends to be indicated by neither marked by peacefulness nor violence. Contrast to
flats F21, in flats F36 and F54 the neighbourhoods strongly tends to be indicated
by peacefulness, especially in flat F54 that has the highest mean score (3.73).
However, from the trend of violence in five years there is more positive trend in
flats F21 that the violence is decreasing than other two flats than in other flats.
Although the trend is not so significant, since from the mean score (2.98), it shows
that the condition is likely to remain the same. Respondents in flats F21 are more
being victim of the violence. There are about four people or 10 percent of F21
respondents who ever been assault or mugging. This number is the highest
percentage among three neighbourhoods. Next is in flats F54 which occurs three
cases.
4.5.6 Relationship housing, neighbourhood, and inequality
condition with social cohesion
Based on the descriptive situation about housing and neighbourhood condition
above, this section is describing the relationship between social cohesion and
factors that might influence it such as housing, neighbourhood, and inequality
condition. The relationship is measured by using correlation analysis.
In order to fulfil for running the procedure of analysis, there are several variables
that are transformed into categorical/ dichotomous variable since correlation
analysis only handle with both interval data, or one of them is categorical data
(Pallant, 2007).
Variables that are transformed into categorical data are such as dwelling type (F21
and non F21); home ownership (renter and owner); length of stay (less than 10
years and 11 years or above); job sector (informal and formal sector); financial
difficulty (having financial difficulties and not having financial difficulty).
The correlation analysis result two outputs, -that is, coefficient of correlation and
significant value. The former one shows the strength of relationship which ranges
from -1.0 to +1.0, while the former describe the significance of relationship
whether the relationship between two variables is significantly related.
This study focuses more on the relationship that is significant, although coefficient
of correlation is not so high, instead a case of relationship that has a high
coefficient of correlation but is not significant.

The Development of Social Cohesion in Public Housing. A Study in A Flat Housing Project in
Sukaramai, Medan
49
The following analysis of relationships is outlined in relation with social cohesion
domains, which are place attachment, social support, civic activities, and tolerance
of diversity.
4.5.6.1 Place attachment
In relation with housing condition, there are seven aspects that significantly relate
with place attachment of social cohesion domains. Those include dwelling type,
neighbourhood infrastructure, home components, room size, the quality of rooms,
general housing condition, and number of rooms available in the living unit (see
Annex 2).
Although they are significantly related with place attachment, their relationship is
considered small according to Cohen (1988) in Pallant (2007), referring to their
coefficients which are below 0.29.
Satisfaction with the number of rooms within living unit mostly influence place
attachment among aspects of housing condition (0.291). The positive relationship
between both of them shows that the increasing value of satisfaction with number
of rooms will increase place attachment, and so does the other way around.
Following the number of rooms is dwelling type (0.290) and neighbourhood
infrastructure (0.283). Respondents living in non F21 type, which is in flats F36
and F54, have more positively influence to their place attachment, and the better
quality of neighbourhood infrastructure will positively build place attachment. The
other aspects of housing condition that are significantly related such as home
components, room size, quality of rooms, general housing condition home show
positively small relationship with place attachment. From this description, it can be
concluded that condition of physical environment within the housing estate is, in a
particular level, related with tenants‟ attitude to their locality.
Condition of neighbourhood through peacefulness aspect gives more degree of
relationship with place attachment than those of physical environment in the
housing estate. It has the highest coefficient of relationship among all factors
(0.326), and regarded as medium relationship. The other aspect within the
neighbourhood that affects place attachment is safety. It is true that in many
literature sources suggesting that safety is one of aspects in neighbourhood that can
develop social cohesion (Forrest and Kearns, 2001).
Besides housing and neighbourhood condition, it is evident that condition of
inequality also relates to place attachment. Both job satisfaction and experience of
having financial difficulty are significantly related with place attachment. Their
relationship is considered small since their coefficients are only 0.245 and 0.259.
The former implies that people that are more satisfied with their job have more
sense to their locality. Due to two ways of relationship, the coefficient also means
that the increasing of place attachment affect somehow job satisfaction. The later
one, since the order puts those having financial difficulty is higher in terms of
number of coding than those who„s not, implies that the movement from having
financial difficulty to absence of having financial difficulty enhances place
attachment. It is also evident respondents that are working in informal or formal
sector are not significantly related with place attachment.

The Development of Social Cohesion in Public Housing. A Study in A Flat Housing Project in
Sukaramai, Medan
50
4.5.6.2 Social Support
In order to analyze the functional social support within the neigbourhood, it is
good to identify beforehand how many of neighbours respondents know, how
often they interact with their neighbours, and what level of social activities. Result
of correlation analysis below shows how those variables are influenced by the
physical characteristics of respondents‟ dwelling place and their perception toward
their neighbourhood.
As can be seen in appendix 2 in part of neighbours known at the back of this thesis
report, number of neighbours known is significantly related with aspects of
housing condition, and not significantly related with neighbourhood condition and
inequality. Four aspects of housing condition significantly related with number of
neighbours known are home ownership, length of stay, neighbourhood service, and
involvement in housing management. The length of stay becomes the aspect that is
mostly related with the number of neighbours known. It is logic that people living
in the neighbourhood longer than others will have more neighbours. The
relationship between both of them is also quite high (0.478), considered as medium
relationship. The next highest coefficient of relationship with the number of
neighbours known would be home ownership. “Owner” tenants tend to have more
neighbours than “renters”. It happens because most of the owners have been living
in the neighbourhood for quiet a long time compared to renters, and most of the
tenants are still owners except in flats F213
Negative relationship is found between neighbourhood service and number of
neighbours known (-0.245). It might be indicating that people who are more
satisfied with neighbourhood service tend to have fewer neighbours than who are
not. This situation happens, possibly, because people than have been satisfied with
neighbourhood service will not rely much on the community to maintain their
environment. Moreover, they are reluctant to have many neighbours. It could also
be explained from relationship between “involvement in housing management”
and “number of neighbours known” that is obviously related with the coefficient
up to 0.293. People that are more involved in the management of housing are
likely to have more neighbours, since they must know their both physical and
social environment to do that.
However, it is found that there is no aspect of housing and neigbourhood as well as
inequality that are significantly related with “neighbourhood interaction”. It seems
that the process of interaction within the neighbourhood happens randomly. The
difference of level of neighbourhood interaction among three neighbourhoods as
shown in table 4-9 above is considered not significant. In that table, respondents in
flats F21 have the highest level of interaction. Regardless its significant value, the
coefficient of correlation between dwelling type, referred to a neighbourhood,
shows negative value (-0.102). The negative value implies that the direction of
relationship occurs in the other way around, meaning that an increasing value of a
variable would decrease the other variable, which is in this case, the “dwelling
type” of non flats F21 as the higher order rank would have less interaction than
that of flats F21.
3 see Chart 4-8

The Development of Social Cohesion in Public Housing. A Study in A Flat Housing Project in
Sukaramai, Medan
51
Complying with the “number of neighbours known”, the level of participation of
“social activities” has almost similar significance of relationship with the „factor‟
variables. “Home ownership” and “length of stay” are also significantly related
with “social activities”, although they are not so related with “social activities” as
number of “neighbours known”. Their coefficients of correlation, both, are 0.260
and 0.217 respectively. The same explanation might be still relevant. Tenants that
live longer mostly are owner, and since they have known the neighbourhood quiet
well, it is not difficult for them to participate in social activities, especially the
social activities have been undertaken for long time4. Satisfaction with
“neighbourhood infrastructure” also positively develops social cohesion in terms
of social activities (0.182), and so does “financial difficulty” (0.210) which implies
people with having financial difficulty are reluctant to participate in social
activities as opposed to people without having financial difficulty.
In terms of functional social support, it is only housing condition that influences
social support. Aspect of housing condition that is significantly related with social
support is “dwelling unit”. The coefficient of correlation between both of them is -
0.298. The negative value of correlation shows the reverse way of relationship.
Since “dwelling type” is categorized into two groups, -that is, flats 21 and non flats
21, Respondents living in flats 21 are having more “social support” than
respondents living in non flats. Factor of inequality indicated by job satisfaction
also influences social cohesion. Its small relationship (0.26) with social support
implies that respondents that are slightly satisfied job will have less social support
than people are much satisfied with their job, or in the other word dissatisfaction of
job tends to weaken social cohesion in terms of social support.
4.5.6.3 Civic activities
Civic activities as a manifestation of the presence of civic culture in a community have
several factors that can reinforce or weaken the process. In the context of this study,
based on the correlation analysis, it has significant relationship with “place living on”
and “involvement in housing management”. Both are aspects of housing condition.
The former has small relationship (-0.236) and the later has medium relationship
(0.358) with “civic activity”. It is found that there was a small negative
relationship between place living on and civic activity. Respondents living in
lower floor of the building tend to do more civic activities than in upper floor. In
relation with “involvement in housing management”, once again, it is very
important in respect to the development of social cohesion. Involving tenants in
housing management will increase their sense of belonging and confidence to
together with others improving the neighbourhood by participating in come civic
activities. It is also evident that condition of neighbourhood and inequality is not
significantly related with the level of “civic activities”.
4.5.6.4 Tolerance of Diversity
Within context of urban life which is much characterized by heterogeneity in terms
of religions, ethnics, age, income level, and so on there should be tolerance of
diversity in a community to promote a harmony social life. Tolerance of diversity
depends on the respect of differences and appreciates them existed in the
4 see Chapter 4.4

The Development of Social Cohesion in Public Housing. A Study in A Flat Housing Project in
Sukaramai, Medan
52
community. First thing to do to have that based on the correlation analysis is by
minimizing the “victimization” since this variable is significantly related with
“tolerance of diversity” with the coefficient of correlation as high as 0.497. This
value is quiet high and regarded as medium relationship, almost having large
relationship (≥ 0.50). A tenant that have been ever being victimized or people
being around someone having been ever being victimized are difficult to have
tolerance to other people, since they are likely to be distrust to them. Involving
tenants in housing management also plays an important role to develop tolerance
of diversity. It has significant relationship with the later one with the coefficient of
correlation as high as 0.195.
Another factor that is related with “tolerance of diversity” is job sector (formal/
informal sector). Its relationship is 0.188, considered having small relationship
with job sector. The result also shows that respondents working in formal sector
are more tolerated than in informal sector based on its positive value of direct of
relationship (informal sector coded as 1, and formal sector coded as 2).
4.5.7 Influence of social condition toward the relationship between
social cohesion and housing, neighbourhood, and inequality
condition
As had been discussed above, it is evident that housing and neighbourhood
condition influence social cohesion in some its particular domains. Inequality also
has a significant role in relation with social cohesion. However, those relationships
should be further analyzed in order to find out whether they are purely related each
other, or their relationships are just because other factors embedded in
respondents„ characteristics like social condition which are more relevant when
they perceive their neighbourhood. This argument is came up from the concept of
social scientists arguing human ecologist (determinist) theory explaining that
physical environment indirectly influences human behaviour, instead they argued
that social condition also plays an important role determining human behaviour
(Gans, 1972).
In order to identify whether social condition has effect on the strength of
relationship between two observed variables, partial correlation is used in this
study. Partial correlation was used to explore relationship between two variables,
while controlling for other variable (Pallant, 2007). For the purpose of this
research, only the relationships which are considered significant are described in
this section. Those are the relationships that have been analyzed in Pearson
correlation beforehand5.
The interference of control variable can be known by comparing the controlled
correlation and the original correlation. The margin values between two those
kinds of correlation shows the extent to which control variables intervene the
original correlation.
5 Detail of partial correlation analysis can bee seen in Appendix 2.

The Development of Social Cohesion in Public Housing. A Study in A Flat Housing Project in
Sukaramai, Medan
53
Controlling variables of social condition with the various relationships toward
place attachment
Regarding place attachment, as one of social cohesion domains, it is found that it is
not only housing and neighbourhood condition that influence social cohesion. In
some extent, several relationships between several aspects of housing and place
attachment are partly due to the influence of social condition, which is in this study
only education level considered having significant influence. For instance, there
was small, positive correlation between “home component” and “place
attachment”, controlling for “education level”, r = 0.191, with high level of
satisfaction with home component being associated with high level of place
attachment. An inspection to zero order correlation (original correlation), r =
0.253, suggesting that controlling for education level had very much effect on the
strength of the relationship between these two variables, since there was quiet high
decrease in the strength of correlation (from 0.253 to 0.191). Other variables of
housing condition regarding their relationship with place attachment that are much
influenced by the impact of education level are quality of rooms (from 0.229 to
0.142), room size (from 0.237 to 0.148), dwelling type (from 0.290 to 0.254),
neighbourhood infrastructure (0.282 to 0.227), general housing condition (from
0.207 to 0.166) and number of rooms (from 0.291 to 0.248). In shortly all
relationships between aspects of housing condition and place attachment are much
influenced by education level. The other social conditions, such as sex, age, ethnic,
religion and household type have only little effect on the strength of relationship
between variables of housing condition and place attachment. In terms of
relationship between variables of neighbourhood condition and place attachment,
only the relationship between “safety” and “place attachment” is considered
having much influenced by education level (0.226 to 0.177).
Controlling variables of social condition with the various relationships toward social
support
In some relationships between the number of neigbours known and variables of
housing considered significant, it is evident that social condition may influence
their correlation. In fact, the relationship between “length of stay” and “number of
neighbours known” is considered spurious meaning there is no direct causal link
between these two variables. It can be found from the values of partial correlation,
by controlling all social condition variables (sex; age; ethnic; religion; household
type; and education level), which are almost to zero (0.0). In shortly, the longer
people live in the area is not associated with the number of neighbours, instead
their relationship is merely due to social condition of the people.

The Development of Social Cohesion in Public Housing. A Study in A Flat Housing Project in
Sukaramai, Medan
54
Toward level of social activity, there is no single variable of housing condition
considered fully associated with it. Its relationship with home ownership is partly
due to age, while its relationship with neighbourhood infrastructure is slightly
influenced by age, religion, and education. In terms of social support, it is found
that social condition does not influence the relationship between social support and
dwelling type, and between social support and job satisfaction. The small, negative
correlation between dwelling type and social support (-0.298) is not merely
influenced by social condition. People living in Flats 21 neighbourhood are not
influenced by their social condition in getting high level of social support. This
happens also with the high level of job satisfaction being associated with high
level of social support is not related with social condition.
Controlling variables of social condition with the various relationships toward civic
activity
Factors influencing people to do civic activities, apparently, are not only due to
“place living on” and “involvement in housing management”. It is found that the
relationship between “places living on” and “civic activity” is mediated or
anteceded by all social condition (sex, age, ethnic, religion, household type and
education level), while the relationship between involvement in housing
management and civic activity is not merely influenced by social condition.
Controlling variables of social condition with the various relationships toward
tolerance of diversity
It is found that people that have high level of tolerance of diversity is not fully
related with the high level of their involvement in housing management, the
absence of victimization, or working in formal sector. In the relationship between
involvement in housing management and tolerance of diversity, it is much
influenced by household type whether the respondent is a single family or couple
one, and slightly influenced by ethnic. Household type also slightly influences the
relationship between experience of being victimized and tolerance of diversity
(from 0.497 to 0.447), while in the relationship between working sector (formal/
informal sector) and tolerance of diversity, it is determinant key (from 0.188 to
0.134) influencing the relationship. Other social conditions such as sex, ethnic and
religion only have little effect to the later relationship.

The Development of Social Cohesion in Public Housing. A Study in A Flat Housing Project in
Sukaramai, Medan
55
Chapter 5 : Conclusion and Recommendation
As the number of population in urban areas keep increasing especially in big cities,
the housing demand inevitably also increases while the amount of land that can
used to build houses is decreasing mainly in city centre. The scarcity of land is
exacerbated with the soaring up land price which is unreachable for low middle
income people.
Government through PERUMNAS has launched walk up apartment or flat housing
as an alternative means of providing houses for low middle income especially in
big cities like Jakarta, Palembang, Bandung, Medan, and so on. Unfortunately
most of flat housings have been loosing their quality of environment with the
indications such as dilapidated building and unclean environment. The decreasing
physical environment in flat housing is worsened by social problems that exist in
the neighbourhood. The limited private space and more usage of common facilities
are likely to stimulate conflicts among tenants. In fact, stigmatization about flat
housing from people outside the estate makes the situation getting worse.
For Indonesian people, living in a relatively dense place and unusual habits to
dwell in the vertical housing makes the process of adjustment and adaptation of
living in flat housing more difficult. For them, living in flats maybe is not the best
option. Those who have least choice will stay, and those who have chance will
leave the estate and be replaced with others. Finally, the estate will be occupied
mostly with people who have less capacity. This situation will threaten the
viability of the housing.
The gradually reducing responsibility of local government and housing operator in
maintaining the building and its environment requires the tenants to have more
control over their own neighbourhood. This could be happened only if the tenants
could build same understanding and cooperation in order to solve locally social
problems. A cohesive community can only be achieved as long as harmony and
social order are put in place.
5.1 Conclusion
This study emphasizes on development social cohesion within a housing estate
called RUSUN Sukaramai. This housing is a flat public housing located in Medan,
North Sumatera. The main objective of this study is to explore factors that might
positively or negatively influence social cohesion. The framework of this study is
basically taken from human ecologist theory suggesting that physical environment
could influence human behaviour. This theory, then, was argued by social
scientists suggesting that social and cultural condition is more determinant
influencing human behaviour. They considered physical environment as a potential
environment. To transform it into an effective environment where people in a
particular physical setting could do several activities as expected by the planners,
they must regard to the social and cultural condition of people that are going to use
the potential environment. Hence, using the same approach, this research comes up
with the hypothesis that housing condition within a neighbourhood could influence
social cohesion. The concept of social cohesion itself is outlined with its domains,
- that is, place attachment, social support, civic activity, and tolerance of diversity.

The Development of Social Cohesion in Public Housing. A Study in A Flat Housing Project in
Sukaramai, Medan
56
The first research question, ―How is social cohesion within each type of flats in
the public housing estate?” is aimed to get the first impression whether three
neighbourhoods in RUSUN Sukaramai referred by its dwelling (flat) type are
significantly different in term of level of social cohesion. The variety in physical
and social condition arguably gives different outputs of social cohesion. The
different output of social cohesion among neighbourhoods will be a leading way to
explore factors influencing social cohesion through correlation analysis.
It is found that level of some social cohesion domains among neighbourhoods is
significantly different. Place attachment, functional social support, and civic
activity are the social cohesion domains that are significantly different among
neighbourhood, while structure of interpersonal relationship indicated by number
of neighbours known, neighbourhood interaction, and social activity is not
significantly different among neighbourhoods. The level of place attachment and
functional social support within each neighbourhood can be considered having
moderate level, while civic activity within each neighbourhood is considered
having modest level. The difference output of structure of interpersonal
relationship might happen randomly, without any relationship with neighbourhood.
It is also evident that among neighbourhoods, there is no significant difference in
terms of tolerance of diversity. It seems that people in the housing estate have the
same perception in respect to diversity. They moderately regard diversity or
difference as something that can make their neighbourhood place to live.
Furthermore, based on the descriptive findings about different output of social
cohesion in the housing estate given in the first research question, correlation
analysis is applied to answer the second research question, “How do aspects of
housing and neighbourhood as well as inequality condition significantly relate
with social cohesion? Into what extent does the relationship take place?”. This
step is necessary to identify factors related with housing and neighbourhood
condition as well as the inequality that influence social cohesion by identifying the
strength of relationship between two variables.
Result study shows that several aspects of housing condition significantly relate
with place attachment. Those aspects include dwelling type, neighbourhood
infrastructure, home component, room size, quality of rooms, general housing
condition, and number of rooms. It can bee seen that most of aspects of physical
environment in living unit and the neighbourhood are significantly related with
place attachment. All those aspect have a small and positive relationship with
place attachment. It implies that high level of quality in terms of physical
environment measured by the satisfaction is slightly associated with place
attachment.
Besides housing condition, some aspects of neighbourhood condition also
significantly relate to place attachment. A neighbourhood characterized by high
level of peacefulness and safety is related with place attachment. Satisfied with the
job and the absence of having financial difficulty, as well, have small, positive,
and significant relationship with place attachment.
In relation with the social support, dwelling type has a small, negative, and
significant relationship. It can be concluded that people living in flats F21 have
more social support than they who live in flats F36 and flats F54. It might be
related with the flat design, where flats F21 which takes form as a vertically row

The Development of Social Cohesion in Public Housing. A Study in A Flat Housing Project in
Sukaramai, Medan
57
housing with more dwelling units laid in one floor than other flats encourage
people to help each other. Job satisfaction also has small, positive, and significant
relationship with social support. High level of satisfaction with the current job is
associated with high level of social support.
Civic activity is positively, slightly and significantly related with involvement in
housing management. The more the tenants are involved in housing management
is associated with their willingness to participate in civic activities.
As had been mentioned above that there is no significant difference of tolerance of
diversity taken place within the estate. Apparently, it is significantly related with
involvement in housing management, experience of being victimized, and job
sector. The first and the later one have small, positive relationship with tolerance
of diversity, while the second one has medium and positive relationship with
tolerance of diversity. Hence, minimizing victimization incidents in the
neighbourhood would increase tolerance of diversity among tenants.
However, all the aforementioned factors that influence social cohesion are not
mainly due to physical aspect of housing condition, neighbourhood situation or
inequality. All those significant relationship, some, are influenced by social
condition. Partial correlation that had been undertaken to answer the third research
question, ―How does social condition influence the relationship between social
cohesion and aspects of housing and neighourhood?” , found that several aspects
of social condition such as sex, age, ethnic, religion, household type, and education
level has significant effect to those relationship. In fact, there are used to be some
relationships that are significant, but they are actually spurious, since the
relationships happen due to interference of social condition as called control
variable.
It is found in study result that education level has quiet significant effect to the
relationship between place attachment and various aspects of housing condition
such as home component, room size, and quality of rooms. It also has significant
interference to the relationship between place attachment and neighbourhood
safety. The spurious relationship is found in the relationship between civic activity
and place living on. All aspects of social condition may intervene the relationship,
hence it could be concluded that civic activity is not related with place living on,
instead social condition of the tenants influence it.
The relationship between tolerance of diversity and involvement in housing
management apparently occur due to fair effect of household type. It also happens
in the relationship between tolerance of diversity and job sector that household
type influences the relationship.
5.2 Recommendation
The development of public flat housings in Indonesia can not be totally considered
unsuccessful. Regardless the tendency that many of them have been loosing their
quality of environment, the writer argues that this type of public housing should be
persistently promoted, since this type of housing more efficiently utilizes urban
land than the landed public housing consuming extensive land.
The housing provision for low middle-income people commonly much focuses on
the financial aspect. To make it financially viable, usually housing developers or

The Development of Social Cohesion in Public Housing. A Study in A Flat Housing Project in
Sukaramai, Medan
58
housing corporations compromise other aspect such as comfortableness and
appropriateness. They commonly use minimum standard usually regarding to the
health standard when designing and building the housing. It apparently neglects
the development of individual and family well being.
It is indeed such a dilemma that in one side the government should be able to
provide houses for the low middle-income people with the price as low as possible,
but in one side the housing corporations or developers will downgrade the quality
of the building by minimizing the size of rooms within a living unit and/or
building materials. They also provide the housing estate with minimum common
open space.
This study reveals that physical condition of housing is significantly related to
place attachment as one of social cohesion domains. Place attachment could bring
up sense of belonging among the residents since they will fell “home” to their
living place and hence, willingly maintain or improve their environment. Payton
(2003) suggested that place attachment has strongly correlation with civic activity.
The later is necessary to improve neighbourhood environment based on residents‟
voluntary participation particularly within the places that have limited resources.
Aspects such as quality, size and number of rooms within the living unit as well as
flat type should be reconsidered by housing corporations or developers, although
they always argue with the reason, efficiency of resources. There should be more
rational trade off between financial aspect and quality of the living places. This is
to make the housing more sustainable. The government should also encourage this
policy, toward future flat housing development, by providing housing subsidy of
development. By that, the housing developers could pay more attention to the
quality of the living places without pushing over the number of living units to be
built. They could also provide more attractive physical environment particularly
for the common space to bring up the residents together and stimulate them to
more interact.
The government mainly local authority should give appropriate public service and
infrastructure to the housing estate, which was frequently neglected, leaving the
area behind. By improving the quality of the environment in the housing estate, it
will enhance residents‟ pride to the area.
However, the neighbourhood service is not merely government‟s responsibility.
All residents should aware of their neighbourhood and take responsibility. It could
be achieved as long as there is a common vision, and a particular level of civic
culture within the neighbourhood.
The later as aforementioned is much related with place attachment. This study also
shows that civic activity is related with the involvement of residents in housing
management. Hence, PPRS as the official tenant association within the housing
estate should be able to bring all community levels in the neighbourhood to
actively involve in housing management in any form of action so that they are
willing to participate in any activities conducted to improve the neighbourhood.
PERUMNAS should also give more responsibility to PPRS to take care the area.
Not only would involving residents in housing management enhance civic activity,
but it also could bring up tolerance of diversity among neighbours. Living in
harmony would be much easier achieved, if people could have respect to the

The Development of Social Cohesion in Public Housing. A Study in A Flat Housing Project in
Sukaramai, Medan
59
differences existing in their neighbourhood. Based on the study result, this should
be done along with minimizing victimization incidence within the neighbourhood.
Once again, the role of PPRS in this part is so determinant to organize the residents
keeping their neighbourhood. Saegert (2004) suggested that an organized
community would likely to have fewer problems with crime.
Besides improving the condition of physical environment, the tenants and PPRS
should also together keep the peacefulness and safety in the neighbourhood.
Hence, the tenants will not only regard their neighbourhood as physical
environment, but also they will also be attached to their neighbourhood due to the
conducive situation of living in the area.
With the enormous role of PPRS, local government together with PERUMNAS
should have given a kind of technical assistance to enhance the capacity of its
members in managing the housing estate.
Apart of that the housing is mainly provided for low middle-income people, the
government should consider combining the estate with a particular proportion of high
income people. This strategy besides to uplift the economical condition of the area, it
is also to create chances of making job opportunities for the low middle-income
people, since the later tend to rely on the former one. Hence, label of exclusion in the
area will gradually be diminished, and the area starts to confidently develop.
A following research about differentiation between renting flat housing and
purchasing flat housing toward social cohesion should be undertaken to get more
comprehensive study. The former one, nowadays, becomes more popular than the
former one in the context of Indonesian housing policy. The recent government
program so called “a thousand towers of flat housing” based on rent tenure would
be a good time to do the research. This research would identify whether the renting
type of flat housing would give higher or lower social cohesion than the
purchasing system, and how will the sustainability of rent flat housing be achieved
considering that the housing will only be occupied for short period of time.

The Development of Social Cohesion in Public Housing. A Study in A Flat Housing Project in
Sukaramai, Medan
60
Bibliography
Avramov, D. (2006) Social exclusion and social security, Brussels: European
Comission.
Brown, B. B. (1987) Territoriality. in Altman, D. S. I. (Ed.) Handbook of
environmental psychology, New York: John Wiley.
Bruhn, J. (2009) Social cohesion and related concepts: Social support and social
capital. The Group Effect, Arizona: Springer US.
DR. IR. Firman Tambun, M. S., DRS. Ivan Razali, M. P. & IR. Nurlisa, M. S.
(1992) Kebijakan Perumahan di Indonesia. Evaluasi terhadap Rumah
Susun di Kotamadya Medan (Housing Policies in Indonesia. Evaluation of
Flats Housing in Medan). Medan: Lembaga Penelitian Universitas
Sumatera Utara (Research Center of University of North Sumatera).
Council of Europe (2005) Concerted development of social cohesion indicators.
Methodological guide, Brussels.
Fischer, C. S. (1984) The urban experience, San Diego: Harcourt Brace
Jovanovich.
Forrest, R. & Kearns, A. (2001) Social cohesion, social capital, and the
neighbourhood‟, Urban Studies, vol. 38, no. 12, May, pp. 2125-2143.
Gans, H. J. (1972) The Potential Environment and the Effective Environment.
People and Plans. Harmondsworth: Penguin Press.
Garson, G. D. (2010) Reliability Analysis. from Statnotes: Topics in multivariate
analysis, [Online], Available:
http://faculty.chass.ncsu.edu/garson/pa765/statnote.htm. [07/20/2010]
Welsh Assembly Government (2008) All Wales community cohesion strategy,
[Online], Available: http://www.thefangroups.org/ downloads/
All%20Wales%20Community%20Cohesion%20Strategy.pdf [13 Aug
2009]
Haddad, M. A. (2006) Civic Responsibility and patterns of voluntary participation
around the world. Comparative Political Studies, vol. 39, pp. 1220 - 1242.
Hardy, Jhon (1996), Partisipasi keluarga dalam pemeliharaan lingkungan pada
Rumah Susun Perumnas Sukaramai-Medan (Household participation in
neigbourhood maintenance in RUSUN Sukaramai Medan), Thesis, Medan:
Program Pascasarjana Universitas Sumatera Utara
Home Office (2003) Building a picture of community cohesion, London: Home
Office
Keller, S. (1968) The urban neighbourhood. A sociological perspective, New
York: Random House.
Krupat, E. (1985) Definitions and models of urban life. People in cities. The urban
environment and its effects. Cambridge: Cambridge University Press.
LGA (Local Government Association) (2002) Guidance on community cohesion,
London: LGA.

The Development of Social Cohesion in Public Housing. A Study in A Flat Housing Project in
Sukaramai, Medan
61
Liebetrau, A. M. (1983) Measures of association, Newbury Park: SAGE
Publications, Inc.
Manzi, T. (2010) Promoting responsibility, shaping behaviour: Housing
management, mixed communities and the construction of citizenship,
Housing Studies, vol. 25, pp. 5-19.
Nuralamsyah, Lubis, Suwardi, and S., Siswo (1993), Komunikasi antar pribadi
dan kerukunan bertetangga / Interpersonal communication and harmony
neighbouring, Medan: Laporan Penelitian, Lembaga Penelitian Universitas
Indonesia
Pallant, J. (2007) SPSS survival manual. A step by step guide to data analysis
using SPSS for windows, Berkshire: Open University Press.
Payton, M. A. (2003) Influence of place attachment and social capital on civic
action: A study at Sherburne National Wildlife Refuge. Natural Resources
Science and Management Program, Minnesota: University of Minnesota.
Robinson, D. (2003) Delivering housing services to support community cohesion,
Centre for Regional Economic and Social Research, Sheffield Hallam
University.
Robinson, D. (2005) The Search for community cohesion: Key themes and
dominant concepts of the public policy agenda, Urban Studies, vol. 42, pp
1411-1427.
Saegert, S. & Winkel, G. (2004) Crime, Social Capital, and Community
Participation. American Journal of Community Psychology, vol. 34.
Salant, P. & Dalman, D. A. (1994) How to conduct your own survey, Canada: John
Wiley & Sons, Inc.
Sherbourne, C. D. & Stewart, A. L. (1991) The MOS social support survey, Social
Science Medicine, vol. 32, pp. 705-714.
Shumaker, S. A. & Taylor, R. B. (1983) Toward a clarification of people-place
relationships: A model of attachment to place. in Feimer, N. & Geller, E.
(Eds.) Environmental psychology: Directions and perspectives, New York:
Praeger.
Sim, L. L., Yu, S. M. & Han, S. S. (2003) Public housing and ethnic integration in
Singapore. Habitat International, vol. 27, pp. 293 - 307.
Stone, W. & Hulse, K. (2007) Housing and social cohesion: An empirical
exploration, Melbourne: AHURI
Taylor, M. (1998) Combating the social exclusion of housing estates, Housing
Studies, vol. 13, pp. 819-832.
Central Bureau of Statistics of Medan City (2008) Kecamatan Medan Area Dalam
Angka 2008 (Medan Area District in Figures 2008). Medan: BPS Kota
Medan
Williams, D. R. & Stewart, S. (1998) Sense of place: An elusive concept that is
finding a home in ecosystem management, Journal of Forestry, vol. 96, pp.
18-23.

The Development of Social Cohesion in Public Housing. A Study in A Flat Housing Project in
Sukaramai, Medan
62
Annex 1: List of questionnaire
1. Age : ......................................................................................................................................... 2. Sex : 1 Male 2 Female 3. Ethnic :
1. Tionghoa/ Chinese 2. Bataknese 3. Javanese 4. Malay 5. Sundanese 6. Acehnese 7. Others (________________)
4. Religion : 1. Muslim 2. Christian 3. Catholic 4. Budha 5. Hind 6. Others (________________)
5. Household type 1 Couple with no dependent children in household (omitted category in models) 2 Couple with dependent children in household 3 Sole parent with dependent children in household 4 Lone person household 5 Group households/multiple family households
6. Highest education level achieved:
1 University/ diploma 2 Senior school 3 Junior high school 4 Elementary 5 Not entering school
7. How often do you eat meat? 1 Every day 2 Three times a week 3 Twice a week 4 Once a week 5 On a fortnight basis 6 Once a month 7 Other ……………….. 8 Never
8. Labour force status:
1. Government employee 2. Teachers 3. Private company employee 4. Business owner with regular employee 5. Business owner helped by family members or irregular employee 6. Domestic servant 7. Self employed 8. Others (________________)
9. Are you satisfied with your current job?
1 Strongly dissatisfied
2 Dissatisfied
3 Neither satisfied nor dissatisfied
4 Satisfied
5 Strongly satisfied
10. Do you expect to have same job in the next 12 months? 1 Yes 2 No

The Development of Social Cohesion in Public Housing. A Study in A Flat Housing Project in
Sukaramai, Medan
63
11. How do you consider the distance between your job location and your living place? 1 Very far 2 Far 3 Neither far nor close 4 Close 5 Very close
12. Have you been experiencing financial hardship in last 12 months:
1 Yes 2 No
1 Could not pay electricity, gas or telephone bills on time
2 Couldn’t pay mortgage/rent on time
3 Pawned or sold something
4 No meals
5 Asked for financial help from friends or family
6 Asked for help from welfare/community organizations
Area Attachment
13. How do you agree with these following statements?
1 very agree 2 Agree 3 fair 4 Disagree 5 Very disagree
It is a good place to raise my children
I feel much advantage living in this area
I am willing to invest time or effort to make this an even better place
I sometimes feel like I don’t belong in this place*
What happens to this place is important to me
Moving out from this area will be the best option for my future*
14. Dwelling type :
1 F21 2 F36 3 F54
15. In what floor do you live in? 1 1
st floor
2 2nd
floor 3 3
rd floor
4 4th
floor
16. What is your dwelling tenure? 1 Outright owners 2 Purchaser owners 3 Renting tenants
17. How many years have you lived in this neighbourhood?
1 0 – 5 years 2 6 – 10 years 3 11 – 15 years 4 16 – 20 years 5 > 20 years
18. How many of your neighbours in the area do you know personally, that is, well enough to know
their name or have a conversation with? 1 0 – 10 2 11 – 20 3 21 – 30 4 30 – 40 5 > 40

The Development of Social Cohesion in Public Housing. A Study in A Flat Housing Project in
Sukaramai, Medan
64
19. Do you personally know other tenants?
1 Yes 2 No
The same floor in the same block unit
Different floor in the same block unit
Different block unit
Other people beyond the estate
20. Were the people you met and visited with?
1 Yes 2 No
A. Of different ethnic or linguistic group/race/caste/tribe
B. are poorer or wealthier
C. are older or younger
D. are different religion
E. are community leaders
21. In the last three months, how often is your interaction with people in this area to these following
activities?
1 Never 2 Rarely 3 Sometimes 4 Often 5 Always
The frequency of people visiting your home
The frequency of you visiting someone’s home
To have a conversation together out of your home
22. What is the language used to communicate in the neighbourhood?
1 Bahasa 2 Ethnic language 3 Both bahasa and ethinc language
23. Do you participate in the following social activities in the neigborhood?
1 Never 2 Rarely 3 Sometimes 4 Often 5 Always
Saving group (arisan)
Religious activities
Wedding ceremony
Funeral
Religious festival
Cultural festival (imlek, syukuran)
Sport activities
Art activities
Celebrating for national events
24. Are there any community activities in which you are not allowed to participate?
1 Yes
2 No, I can participate in all activities → skip to question 26
25. Why are you not allowed to participate?
1 Poverty
2 Occupation
3 Lack of education
4 Gender
5 Age
6 Religion
7 Ethnicity or language spoken/race/caste/tribe

The Development of Social Cohesion in Public Housing. A Study in A Flat Housing Project in
Sukaramai, Medan
65
26. In terms of social support, how often is each of the following kinds of support in your neighbourhood available to you if you need it?
1 None of the time
2 A little of the time
3 Some of the time
4 Most of the time
5 All of the time
Someone you can count on to listen to you when you need to talk
Someone to take you to the doctor if you needed it
Someone that can watch my children while they are playing around
Someone to help with daily chores if you were sick
Someone to turn to for suggestions about how to deal with a personal problem
Someone to give you information to help you understand a situation
Someone to do something enjoyable with like play games, sport, or other recreational activities
27. Have you ever been participating in the following activities?
1 Yes 2 No
Participated in an election (beyond compulsory voting, like electing Head of Tenant Association)
Signed a petition or solicited signatures for a petition
Contacted the media regarding local problems
Contacted local authorities regarding local problems
Attended a communal meeting
Cleaning up trash or litter
Neighbourhood Night Watch (Siskamling)
28. What are the major problems affecting this neighbourhood? (Please rank the three most
important problems) 1 Safety/crime 2 Noise 3 Youth delinquency 4 Water scarcity 5 Electricity black out 6 Poor access to health care 7 Poor access to education 8 Poor access to transportation 9 Dull road 10 Litter lying around 11 Bad drainage 12 Lack of employment opportunities 13 Dilapidated building 14 Other (specify)________
29. Are there any of those problems caused by the following differences?
1 Yes
2 No → go to question 28 Which two differences most often cause problems?
1 Differences in education
2 Differences in tenure
3 Differences in wealth/material possessions
4 Differences between men and women
5 Differences between younger and older generations
6 Differences between long-term and recent residents
7 Differences in religious beliefs
8 Differences in ethnic background/race/caste/tribe
1st
2nd
3rd

The Development of Social Cohesion in Public Housing. A Study in A Flat Housing Project in
Sukaramai, Medan
66
30. Thinking about this local area, which of the things below, if any, do you think most need improving? Please tick up to three
Repairing of building and its facilities
Health services
Road and passageway improvement
Area provision for business
Environment cleanness
Street lighting
Meeting and multi function hall
Security guard post
Parking and open space
Positive activities for young generations
Sport facilities
Social activities
Playgroup facility
Low level of crime
Cultural facility
Other (Please write in)
Don’t know
31. To what extent do you agree that having people from many different ethnic and cultural
backgrounds makes the neighbourhood a better place? 1 Agree strongly 2 Agree somewhat 3 Neither agree nor disagree 4 Disagree somewhat 5 Disagree strongly
32. In your opinion, is this neighborhood generally peaceful or marked by violence? 1 Very peaceful 2 Moderately peaceful 3 Neither peaceful nor violent 4 Moderately violent 5 Very violent
33. In five years, has the level of violence in this neighborhood increased, decreased, or stayed the
same? 1 Increased a lot 2 Increased a little 3 Stayed about the same 4 Decreased a little 5 Decreased a lot
34. In general, how safe from crime and violence do you feel when you are alone at home? 1 Very safe 2 Moderately safe 3 Neither safe nor unsafe 4 Moderately unsafe 5 Very unsafe
35. How safe do you feel when walking down your street alone after dark?
1 Very safe 2 Moderately safe 3 Neither safe nor unsafe 4 Moderately unsafe 5 Very unsafe
36. In the past 12 months, have you or anyone in your household been the victim of a violent crime,
such as assault or mugging? 1 Yes 2 No

The Development of Social Cohesion in Public Housing. A Study in A Flat Housing Project in
Sukaramai, Medan
67
37. How do you see the quality of neighbourhood infrastructure?
1 Very poor 2 Poor 3 Fair 4 Good 5 Very good
Clean water supply
Electricity
Telephone line
Sanitation
38. How do you rate the quality of the neighbourhood services?
1 Very poor 2 Poor 3 Fair 4 Good 5 Very good
Garbage carrying
Outdoor lighting
Public safety
Building and communal facility maintenance
Drainage and road maintenance
Fire extinguisher
39. Since the last five years, how would you say the housing conditions have:
1 Much worsened 2 Worsened 3 Remained the same 4 Improved 5 Much improved
40. Are you satisfied with the following components of your home?
1 Strongly dissatisfied 2 Dissatisfied 3 Neutral 4 Satisfied 5 Strongly satisfied
Wall
Floor
Window
Door
Ventilation
Ceiling
41. How is your satisfaction in accordance with the size of each following rooms?
1 Strongly dissatisfied 2 Dissatisfied 3 Neutral 4 Satisfied 5 Strongly satisfied
Living room
Bedroom
Dining room
Kitchen
Toilet
Front terrace

The Development of Social Cohesion in Public Housing. A Study in A Flat Housing Project in
Sukaramai, Medan
68
42. Are you satisfied with the quality of your existing rooms now?
1 Strongly dissatisfied 2 Dissatisfied 3 Neutral 4 Satisfied 5 Strongly satisfied
Living room
Bedroom
Dining room
Kitchen
Toilet
Front terrace
43. Are you satisfied with the number of rooms available in your living unit? 1 Strongly dissatisfied 2 Dissatisfied 3 Neutral 4 Satisfied 5 Strongly satisfied
44. Do you feel you get involved in every decision making related to the housing management?
1 Not strongly involved 2 Not involved 3 Neutral 4 Involved 5 Strongly involved

The Development of Social Cohesion in Public Housing. A Study in A Flat Housing Project in
Sukaramai, Medan
69
Annex 2: Reliability of scale analysis
1. Place attachment
2. Neighbourhood interaction
3. Social activities

The Development of Social Cohesion in Public Housing. A Study in A Flat Housing Project in
Sukaramai, Medan
70
4. Social support
5. Civic activities

The Development of Social Cohesion in Public Housing. A Study in A Flat Housing Project in
Sukaramai, Medan
71
6. Neighbourhood infrastructure
7. Neighbourhood service

The Development of Social Cohesion in Public Housing. A Study in A Flat Housing Project in
Sukaramai, Medan
72
8. Home component
9. Room size
10. Quality of rooms

The Development of Social Cohesion in Public Housing. A Study in A Flat Housing Project in
Sukaramai, Medan
73

The Development of Social Cohesion in Public Housing. A Study in A Flat Housing Project in
Sukaramai, Medan
74
Annex 3: Partial correlation analysis
1. Place attachment
HOUSING CONDITION
Dwelling type .290** .278** .305** .292** .289** .287** .254**
Home ownership .175 .158 .209* .173 .173 .179 .16
Place living on -.002 .004 -.007 -.002 -.002 .003 -.008
Length of stay .178 .162 .218* .175 .174 .183* .134
Advantage of the area -.048 -.052 -.046 -.047 -.048 -.055 -.053
Neighbourhood infrastructure .283** .280** .290** .281** .280** .278** .227*
Neighbourhood service .214* .214* .213* .217* .212* .212* .167
Home component .253** .251** .271** .256** .252** .249** .191*
Room size .237** .227* .247** .236** .235* .238** .148
Quality of rooms .229* .212* .240** .228* .227* .230* .142
General housing condition .207* .205* .205* .204* .203* .198* .166
Number of rooms .291** .290** .293** .292** .290** .286** .248**
Involvement in housing management .033 .032 .035 .029 .031 .024 .057
NEIGBOURHOOD CONDITION
Peacefulness .326** .317** .336** .325** .325** .321** .329**
Trend of violence -.095 -.099 -.098 -.094 -.094 -.095 -.085
Experience of being victimized -.017 -.028 -.014 -.02 -.02 -.001 -.055
Safety .226* .224* .235* .225* .223* .219* .177
INEQUALITY
Job satisfaction .245** .262** .250** .244** .245** .248** .224*
Expecting the same job in 12 months -.197* -.195* -.197* -.196* -.199* -.197* -.201*
Formal/ informal sector .024 -.007 .025 .03 .034 .036 .03
Financial diffculty .259** .260** .271** .259** .257** .263** .267**
**. Correlation is significant at the 0.01 level (2-tailed).
*. Correlation is significant at the 0.05 level (2-tailed).
Religion Education
Zero-order
correlationItems
Control variable
Household
typeSex Age Ethic
2. Social support
Neighbourhood interaction
HOUSING CONDITION
Dwelling type -.102 -.125 -.115 -.064 -.062 -.091 -.077
Home ownership .067 .042 .054 .086 .08 .058 .079
Length of stay .118 -.055 -.056 -.066 -.062 -.079 -.06
Place living on -.062 .096 .112 .145 .143 .106 .153
Advantage of the area -.131 -.137 -.134 -.137 -.135 -.114 -.13
Neighbourhood infrastructure .061 .054 .055 .085 .091 .086 .111
Neighbourhood service .071 .069 .072 .059 .079 .079 .107
Home component .01 .006 0 .064 .063 .026 .059
Room size -.011 -.029 -.019 .024 .034 -.012 .063
Quality of rooms .032 .006 .024 .073 .086 .031 .109
General housing condition -.011 -.016 -.007 .009 .011 .039 .017
Number of rooms .061 .058 .059 .101 .108 .087 .098
Involvement in housing management -.013 -.015 -.017 .007 -.008 .015 -.027
NEIGBOURHOOD CONDITION
Peacefulness .16 .146 .155 .172 .17 .210* .164
Trend of violence .07 .067 .075 .066 .065 .071 .064
Experience of being victimized .02 .008 .016 .034 .034 -.032 .042
Safety -.008 -.013 -.015 .028 .02 .037 .028
INEQUALITY
Job satisfaction .12 .139 .116 .129 .12 .115 .138
Expecting the same job in 12 months .08 .086 .08 .075 .088 .081 .08
Formal/ informal sector -.15 -.197* -.15 -.179 -.193* -.191* -.153
Financial diffculty .103 .102 .097 .147 .136 .097 .104
**. Correlation is significant at the 0.01 level (2-tailed).
*. Correlation is significant at the 0.05 level (2-tailed).
Household
typeEducation
ItemsZero-order
correlation
Control variable
Sex Age Ethic Religion

The Development of Social Cohesion in Public Housing. A Study in A Flat Housing Project in
Sukaramai, Medan
75
HOUSING CONDITION
Dwelling type -.102 -.125 -.115 -.064 -.062 -.091 -.077
Home ownership .067 .042 .054 .086 .08 .058 .079
Length of stay .118 -.055 -.056 -.066 -.062 -.079 -.06
Place living on -.062 .096 .112 .145 .143 .106 .153
Advantage of the area -.131 -.137 -.134 -.137 -.135 -.114 -.13
Neighbourhood infrastructure .061 .054 .055 .085 .091 .086 .111
Neighbourhood service .071 .069 .072 .059 .079 .079 .107
Home component .01 .006 0 .064 .063 .026 .059
Room size -.011 -.029 -.019 .024 .034 -.012 .063
Quality of rooms .032 .006 .024 .073 .086 .031 .109
General housing condition -.011 -.016 -.007 .009 .011 .039 .017
Number of rooms .061 .058 .059 .101 .108 .087 .098
Involvement in housing management -.013 -.015 -.017 .007 -.008 .015 -.027
NEIGBOURHOOD CONDITION
Peacefulness .16 .146 .155 .172 .17 .210* .164
Trend of violence .07 .067 .075 .066 .065 .071 .064
Experience of being victimized .02 .008 .016 .034 .034 -.032 .042
Safety -.008 -.013 -.015 .028 .02 .037 .028
INEQUALITY
Job satisfaction .12 .139 .116 .129 .12 .115 .138
Expecting the same job in 12 months .08 .086 .08 .075 .088 .081 .08
Formal/ informal sector -.15 -.197* -.15 -.179 -.193* -.191* -.153
Financial diffculty .103 .102 .097 .147 .136 .097 .104
**. Correlation is significant at the 0.01 level (2-tailed).
*. Correlation is significant at the 0.05 level (2-tailed).
Household
typeEducation
ItemsZero-order
correlation
Control variable
Sex Age Ethic Religion
Number of neighbours known
HOUSING CONDITION
Dwelling type -.067 -.084 -.13 .004 -.001 -.07 -.04
Home ownership .439** .428** .384** .490** .476** .442** .457**
Length of stay .478** -.083 -.051 -.097 -.091 -.086 -.086
Place living on -.089 .468** .427** .544** .535** .482** .527**
Advantage of the area .139 .137 .127 .136 .141 .137 .143
Neighbourhood infrastructure .067 .062 .034 .111 .116 .064 .12
Neighbourhood service -.245** -.249** -.243** -.278** -.243** -.246** -.220*
Home component -.105 -.11 -.182* -.02 -.031 -.108 -.062
Room size -.072 -.086 -.119 -.012 -.004 -.072 -.004
Quality of rooms -.103 -.126 -.159 -.039 -.03 -.103 -.043
General housing condition -.029 -.033 -.002 .006 .005 -.039 .001
Number of rooms .04 .036 .028 .11 .111 .036 .077
Involvement in housing management .293** .295** .285** .344** .314** .292** .284**
NEIGBOURHOOD CONDITION
Peacefulness .16 .15 .126 .184* .178 .157 .165
Trend of violence .02 .017 .045 .012 .011 .02 .013
Experience of being victimized -.045 -.056 -.073 -.023 -.026 -.038 -.024
Safety -.073 -.078 -.118 -.013 -.032 -.083 -.038
INEQUALITY
Job satisfaction .124 .139 .099 .143 .127 .125 .144
Expecting the same job in 12 months -.036 -.033 -.038 -.048 -.026 -.036 -.037
Formal/ informal sector .068 .039 .069 .025 .012 .075 .066
Financial diffculty .195* .195* .155 .278** .252** .196* .196*
**. Correlation is significant at the 0.01 level (2-tailed).
*. Correlation is significant at the 0.05 level (2-tailed).
Education Items
Zero-order
correlation
Control variable
Sex Age Ethic ReligionHousehold
type
Social activities
HOUSING CONDITION
Dwelling type -.031 -.034 -.075 .034 .008 -.028 -.023
Home ownership .217* .217* .161 .253** .232* .215* .222*
Length of stay .260** -.145 -.12 -.154 -.147 -.151 -.145
Place living on -.145 .260** .207* .309** .287** .257** .277**
Advantage of the area -.095 -.096 -.109 -.106 -.099 -.09 -.095
Neighbourhood infrastructure .182* .181* .161 .225* .213* .191* .207*
Neighbourhood service .102 .102 .11 .085 .11 .104 .116
Home component .155 .155 .115 .253** .212* .161 .181*
Room size .119 .117 .091 .182* .166 .119 .161
Quality of rooms .098 .096 .066 .167 .151 .098 .135
General housing condition 0 0 .02 .032 .02 .015 .009
Number of rooms .117 .117 .11 .184* .163 .126 .132
Involvement in housing management .138 .138 .128 .176 .146 .148 .135
NEIGBOURHOOD CONDITION
Peacefulness .146 .145 .121 .166 .155 .163 .147
Trend of violence .023 .023 .041 .016 .018 .023 .021
Experience of being victimized .029 .027 .011 .051 .041 .014 .036
Safety .145 .144 .119 .210* .174 .163 .162
INEQUALITY
Job satisfaction .146 .148 .128 .162 .146 .144 .152
Expecting the same job in 12 months .122 .123 .123 .117 .13 .122 .122
Formal/ informal sector -.133 -.141 -.135 -.18 -.173 -.146 -.134
Financial diffculty .210* .210* .182* .285** .243** .208* .210*
**. Correlation is significant at the 0.01 level (2-tailed).
*. Correlation is significant at the 0.05 level (2-tailed).
Education Items
Zero-order
correlation
Control variable
Sex Age Ethic ReligionHousehold
type

The Development of Social Cohesion in Public Housing. A Study in A Flat Housing Project in
Sukaramai, Medan
76
HOUSING CONDITION
Dwelling type -.031 -.034 -.075 .034 .008 -.028 -.023
Home ownership .217* .217* .161 .253** .232* .215* .222*
Length of stay .260** -.145 -.12 -.154 -.147 -.151 -.145
Place living on -.145 .260** .207* .309** .287** .257** .277**
Advantage of the area -.095 -.096 -.109 -.106 -.099 -.09 -.095
Neighbourhood infrastructure .182* .181* .161 .225* .213* .191* .207*
Neighbourhood service .102 .102 .11 .085 .11 .104 .116
Home component .155 .155 .115 .253** .212* .161 .181*
Room size .119 .117 .091 .182* .166 .119 .161
Quality of rooms .098 .096 .066 .167 .151 .098 .135
General housing condition 0 0 .02 .032 .02 .015 .009
Number of rooms .117 .117 .11 .184* .163 .126 .132
Involvement in housing management .138 .138 .128 .176 .146 .148 .135
NEIGBOURHOOD CONDITION
Peacefulness .146 .145 .121 .166 .155 .163 .147
Trend of violence .023 .023 .041 .016 .018 .023 .021
Experience of being victimized .029 .027 .011 .051 .041 .014 .036
Safety .145 .144 .119 .210* .174 .163 .162
INEQUALITY
Job satisfaction .146 .148 .128 .162 .146 .144 .152
Expecting the same job in 12 months .122 .123 .123 .117 .13 .122 .122
Formal/ informal sector -.133 -.141 -.135 -.18 -.173 -.146 -.134
Financial diffculty .210* .210* .182* .285** .243** .208* .210*
**. Correlation is significant at the 0.01 level (2-tailed).
*. Correlation is significant at the 0.05 level (2-tailed).
Education Items
Zero-order
correlation
Control variable
Sex Age Ethic ReligionHousehold
type
Functional social support
HOUSING CONDITION
Dwelling type -.298** -.298** -.313** -.245** -.246** -.294** -.285**
Home ownership .155 .16 .16 .194* .183* .151 .166
Length of stay .183* -.093 -.089 -.101 -.095 -.101 -.091
Place living on -.092 .187* .193* .234* .229* .177 .212*
Advantage of the area -.059 -.059 -.062 -.07 -.066 -.05 -.058
Neighbourhood infrastructure .172 .173 .169 .221* .229* .186* .218*
Neighbourhood service .015 .015 .016 -.007 .028 .019 .041
Home component -.034 -.033 -.043 .058 .051 -.026 0
Room size -.024 -.023 -.03 .038 .05 -.025 .029
Quality of rooms -.049 -.047 -.056 .019 .033 -.05 -.002
General housing condition -.02 -.02 -.017 .015 .016 .005 .001
Number of rooms .082 .083 .081 .155 .161 .096 .111
Involvement in housing management .087 .087 .085 .127 .101 .103 .078
NEIGBOURHOOD CONDITION
Peacefulness .1 .102 .097 .121 .117 .126 .103
Trend of violence .091 .092 .094 .086 .085 .092 .087
Experience of being victimized -.119 -.118 -.123 -.1 -.103 -.152 -.105
Safety .026 .027 .022 .092 .075 .051 .055
INEQUALITY
Job satisfaction .260** .260** .259** .284** .269** .258** .276**
Expecting the same job in 12 months -.07 -.071 -.07 -.083 -.062 -.071 -.071
Formal/ informal sector -.123 -.122 -.123 -.175 -.195* -.144 -.126
Financial diffculty .055 .055 .051 .129 .108 .051 .055
**. Correlation is significant at the 0.01 level (2-tailed).
*. Correlation is significant at the 0.05 level (2-tailed).
Control variable
ItemsZero-order
correlation Sex Age Ethic ReligionHousehold
typeEducation

The Development of Social Cohesion in Public Housing. A Study in A Flat Housing Project in
Sukaramai, Medan
77
3. Civic activities
HOUSING CONDITION
Dwelling type -.147 -.175 -.153 -.106 -.085 -.15 -.115
Home ownership .107 .08 .115 .13 .131 .109 .125
Length of stay .115 -.232* -.238** -.243** -.244** -.234* -.236**
Place living on -.236** .089 .127 .145 .157 .117 .161
Advantage of the area -.002 -.008 -.003 -.008 -.006 -.006 0
Neighbourhood infrastructure -.019 -.029 -.021 .006 .026 -.023 .041
Neighbourhood service -.139 -.145 -.139 -.156 -.133 -.14 -.1
Home component -.09 -.098 -.096 -.036 -.013 -.093 -.032
Room size -.097 -.12 -.1 -.061 -.031 -.097 -.012
Quality of rooms -.112 -.147 -.116 -.072 -.038 -.112 -.032
General housing condition -.103 -.11 -.103 -.082 -.072 -.115 -.068
Number of rooms -.04 -.047 -.041 .001 .027 -.044 .004
Involvement in housing management .358** .364** .358** .390** .382** .358** .348**
NEIGBOURHOOD CONDITION
Peacefulness .033 .015 .032 .045 .046 .027 .038
Trend of violence -.067 -.073 -.067 -.074 -.08 -.067 -.078
Experience of being victimized .03 .016 .029 .046 .052 .04 .059
Safety -.075 -.083 -.077 -.037 -.033 -.084 -.029
INEQUALITY
Job satisfaction .119 .142 .119 .13 .122 .12 .144
Expecting the same job in 12 months 0 .006 0 -.006 .011 0 0
Formal/ informal sector -.161 -.217* -.161 -.195* -.232* -.158 -.167
Financial diffculty .069 .068 .069 .117 .121 .07 .069
**. Correlation is significant at the 0.01 level (2-tailed).
Control variable
ItemsZero-order
correlation Sex Age Ethic ReligionHousehold
typeEducation