ms ritger° economic valuation of ecosystem services - skemman
TRANSCRIPT

MS ritgerð Í umhverfis og auðlindafræðum
Economic Valuation of Ecosystem Services: The Case of Lake Elliðavatn and Lake
Vífilsstaðavatn
Halla Margrét Jóhannesdóttir
Hagfræðideild Háskóla Íslands
Leiðbeinendur: Brynhildur Davíðsdóttir og Daði Már Kristófersson
Febrúar 2010

Háskóli Íslands
Hagfræðideild
Umhverfis og Auðlindafræði
Economic Valuation of Ecosystem Services: The Case of Lake Elliðavatn and Lake
Vífilsstaðavatn
Ritgerð til M.S.-prófs
Halla Margrét Jóhannesdóttir
Kt.: 060783-2929
Leiðbeinendur: Brynhildur Davíðsdóttir og Daði Már Kristófersson
Febrúar 2010


Abstract
Managing the environment is a complicated task constantly faced by decision-makers
in all the world´s communities. In Iceland heated debates have been going on over the
recent years concerning whether natural areas should be industrially developed or
protected for recreational purposes. The aim of this paper is to bring another
perspective to the Icelandic debate, an economic valuation of ecosystem services. The
term “ecosystem services” refers to the benefits human population derives from
ecosystems. The ecosystem services provided by two lakes in the capital area of
Iceland, Lake Elliðavatn and Lake Vífilsstaðavatn were assessed according to the
categorization scheme of the Millennium Ecosystem Assessment (MEA) published in
2005. The MEA classifies ecosystem services into four categories; provisioning
services, regulating services, cultural services and supporting services. Services from
each category were identified and valued with economic valuation methods; market
price, defensive behavior, travel cost and factor income. The final result is that the
annual value of ecosystem services provided by Lake Elliðavatn in 2009 is in the
range of ISK 83.263.647 - 101.308.524 (constant ISK 2009). For Lake Vífilsstaðavatn
this value is in the range of ISK 5.713.925 - 5.981.560 (constant ISK 2009). It was
concluded that although an economic valuation of ecosystem services can only serve
as an indicator of a potential value of the ecosystem services provision, it still
provides an important contribution to the debate of environmental manament in
Iceland.
Ágrip
Umræða um nýtingu lands, verndun náttúruverðmæta og efnahagslega framþróun
hefur farið sífellt hærra í samfélögum bæði erlendis og hérlendis síðastliðin ár. Aukinn
áhugi á sjálfbærri þróun og skynsamlegri nýtingu náttúruauðlinda kallar á breytingar
og ný viðmið þegar kemur að því að meta hvenær er í lagi að raska landi fyrir
efnahagslega framþróun og hvenær fórnarkostnaður er of mikill. Markmið þessarar
ritgerðar er að koma fram með nýtt sjónarhorn í umræðuna um nýtingu lands á Íslandi,
hagrænt mat á þjónustu vistkerfa. Hugtakið „vistkerfisþjónusta“ vísar til þess
samfélagslega ábata sem menn njóta af vistkerfum náttúrunnar. Hér eru metnir þeir
þjónustuþættir sem vistkerfi vatnanna Elliðavatns og Vífilsstaðavatns á
Höfuðborgarsvæðinu veita nærliggjandi samfélagi og hagrænt virði þeirra áætlað.

Notast var við flokkun sem sett var fram í Þúsaldarmatinu á þjónustu vistkerfa sem
birt var 2005. Meginflokkarnir eru fjórir, þjónusta sem veitir beinar afurðir eins og
fisk eða rafmagn, þjónusta sem temprar ýmsa náttúrlega eða ónáttúrulega ferla svo
sem vatnsflæði eða mengun, menningarleg þjónusta og svo stuðningsþjónusta svo sem
hringrás næringarefna. Vistkerfisþjónustur úr hverjum flokki voru metnar og virði
valdra þjónustuþátta áætlað með hagrænum aðferðum svo sem markaðsvirði,
varnarkostnaði, ferðakostnaði og þáttatekjum. Lokaniðurstöður hljómuðu upp á
83.263.647 - 101.308.524 krónur (ISK 2009) fyrir árlega þjónustu Elliðavatns árið
2009 og 5.713.925 - 5.981.560 krónur (ISK 2009) fyrir árlega þjónustu
Vífilsstaðavatns árið 2009. Lokaályktanir rannsóknarinnar eru að þrátt fyrir að
hagrænt mat á þjónustu vistkerfa geti eingöngu gefið vísbendingu um virði slíkrar
þjónustu gefur það samt sem áður nýtt sjónarhorn og er þar af leiðandi mikilvægt
innlegg í umræðu um nýtingu lands á Íslandi.

Formáli
Ritgerð þessi er til 60 ECTS eininga og var lokaverkefni höfundar til meistaraprófs í
umhverfis og auðlindafræðum frá hagfræðideild Háskóla Íslands. Verkefnið er hluti af
stærra rannsóknarverkefni um hagrænt virði þjónustu vistkerfa í Heiðmörk. Að
verkefninu standa Háskóli Íslands, Rannsóknastöð Skógræktar ríkisins að Mógilsá,
Skógræktarfélag Íslands, Skógræktarfélag Reykjavíkur, Reykjavíkurborg, Garðabær
og Orkuveita Reykjavíkur. Verkefnið var fjármagnað af Rannsóknarnámssjóði Rannís,
Orkuveitu Reykjavíkur, Garðabæ og Reykjavíkurborg.
Höfundur vill koma á framfæri þökkum til allra þeirra sem komu að verkefninu
að einhverju leyti með gögnum, aðstoð eða ábendingum. Sérstakar þakkir fá
Brynhildur Davíðsdóttir leiðbeinandi fyrir vandaða leiðsögn og yfirlestur á öllum
stigum, Daði Már Kristófersson meðleiðbeinandi fyrir aðstoð við tölfræðiúrvinnslu og
Kristín Eiríksdóttir fyrir góðar ábendingar varðandi öflun og úrvinnslu
rannsóknargagna. Einnig fær Guðni Guðbergsson hjá Veiðimálastofnun sérstakar
þakkir fyrir mikilvægt framlag til rannsóknarinnar. Síðast, en ekki síst, fá kærar þakkir
Anna Margrét Sigurðardóttir fyrir prófarkalestur og Gabriel Pic fyrir ómældan
stuðning.

i
Contents
1. Introduction ......................................................................................................................... 1
2. Literature review ................................................................................................................. 3
2.1 Natural ecosystems, services and classification ............................................................... 3
2.2 Tradeoffs in land-use and ecosystem services ............................................................. 6
2.3 Nature and the concept of value ................................................................................... 7
2.4 The economic valuation of ecosystem services ......................................................... 10
2.5 Valuation methods ..................................................................................................... 11
2.5.1 Revealed preference methods ............................................................................. 12
2.5.2 Stated preference methods .................................................................................. 18
2.6 Issues in valuation ...................................................................................................... 19
3. The study site .................................................................................................................... 23
3.1 Heiðmörk ................................................................................................................... 23
3.2 Elliðavatn ................................................................................................................... 25
3.3 Vífilsstaðavatn ........................................................................................................... 28
3.4 Services provision – an overview .............................................................................. 30
4 Analysis and results .......................................................................................................... 31
4.1 Provisioning services ................................................................................................. 32
4.1.1 Services definition .............................................................................................. 32
4.1.2 Valuation methods .............................................................................................. 33
4.1.3 Data collection .................................................................................................... 34
4.1.4 Results ................................................................................................................. 34
4.2 Regulating services .................................................................................................... 34
4.2.1 Services definition .............................................................................................. 34
4.2.2 Valuation methods .............................................................................................. 36
4.2.3 Data collection .................................................................................................... 37
4.2.4 Results ................................................................................................................. 39
4.3 Cultural services ......................................................................................................... 40

ii
4.3.1 Recreational services .............................................................................................. 41
4.3.1.1 Services definition ........................................................................................... 41
4.3.1.2 Valuation methods .......................................................................................... 42
4.3.1.3 Data collection and model ............................................................................... 46
4.3.1.4 Results – Lake Elliðavatn ............................................................................... 52
4.3.1.5 Results – Lake Vífilsstaðavatn ........................................................................ 56
4.3.2 Educational services ............................................................................................... 60
4.3.2.1 Valuation methods .......................................................................................... 61
4.3.2.2 Data collection ................................................................................................ 61
4.3.2.3 Results ............................................................................................................. 61
4.4 Supporting Services ................................................................................................... 63
4.4.1 Sediment retention and accumulation ................................................................. 64
4.4.2 Nutrient cycling .................................................................................................. 65
4.4.3 Support for pollinators ........................................................................................ 68
4.4.4 Habitat function .................................................................................................. 68
4.4.5 Economic view – Lake Elliðavatn ...................................................................... 71
5. Summation ........................................................................................................................ 78
6. Discussion ......................................................................................................................... 79
7. Conclusion ........................................................................................................................ 85
References ................................................................................................................................. 86
Annex 1 ..................................................................................................................................... 97

iii
List of Figures
Figure 1. An overview of the nature reserve Heiðmörk.. ........................................................ 24
Figure 2. An aerial photo of Lake Elliðavatn from 2002. ........................................................ 26
Figure 3. The landmarks Heimsendi, Elliðahvammur,Vatnsendi and Kjóavellir. ................... 27
Figure 4. Vífilsstaðavatn and the protected surrounding area. ................................................ 29
Figure 5. The pipeline constructed to receive stormwater ....................................................... 38
Figure 6. The site intended for the pending sedimentation pond ............................................. 39
Figure 7. Access value in a Linear Single-site Model ............................................................. 44
Figure 8. Part of the watershed of Laxá í Kjós.. ...................................................................... 72
Figure 9. The river system of the Elliðaár watershed. ............................................................. 73

iv
List of Tables
Table 1. Comparison of classification schemes. ........................................................................ 5
Table 2. The total value of electricity production from Elliðaárstöð in
2007..……………… ................................................................................................................ 32
Table 3. The total defensive cost of the pipeline. .................................................................... 40
Table 4. The total defensive cost of sedimentation pond ......................................................... 40
Table 5. Definition of the variables used in the model ............................................................ 51
Table 6. The results from the final model estimation of the upper bound of travel cost
valuation in Lake Elliðavatn. .................................................................................................... 53
Table 7. The results from the final model estimation of the lower bound of travel cost
valuation in Lake Elliðavatn. .................................................................................................... 54
Table 8. The upper bound of per-trip value for Lake Elliðavatn in the season of 2009. ......... 55
Table 9. The lower bound of per-trip values for Lake Elliðavatn in the season of 2009
. ................................................................................................................................................. 55
Table 10. The results from the final model estimation of the upper bound of travel
cost valuation in Lake Vífilsstaðavatn ...................................................................................... 57
Table 11. The results from the final model estimation of the lower bound of travel
cost valuation in Lake Vífilsstaðavatn ...................................................................................... 57
Table 12. Calculated average visits, from 15 random observations, in Lake
Vífilsstaðavatn from 1st of May to 15th of September 2009. .................................................... 59
Table 13. The upper bound of per-trip value for Lake Vífilsstaðavatn. .................................. 59
Table 14. The lower bound of per-trip value for Lake Vífilsstaðavatn . ................................. 59
Table 15. Results for educational use of Lake Vífilsstaðavatn by elementary and high
schools in the capital area the school year 2007-2008. ............................................................ 63
Table 16. Results for educational use of Lake Elliðavatn by elementary schools in the
capital area the school year 2007-2008 .................................................................................... 63
Table 17. Results from the panel data analysis, random effects model. .................................. 76
Table 18. Total value of the ecosystem services of Lake Elliðavatn (constant ISK
2009). ........................................................................................................................................ 78
Table 19. Total value of the ecosystem services of Lake Vífilsstaðavatn (constant ISK
2009). ........................................................................................................................................ 78

1
1. Introduction
Managing the environment is a complicated task constantly faced by decision-makers
in all the world´s communities. With increasing knowledge and public awakening
concerning environmental matters, tradeoffs in land use are becoming a bigger issue.
In Iceland the question whether natural environments should be protected for
recreational purposes or industrially developed is a big issue and has been the subject
of heated debates over recent years. One of the most apparent of such debates
concerned the hydro power plant at Kárahnjúkar and the subsequent aluminum plant
in Reyðarfjörður. The mindset of the Icelandic population towards the nature has been
changing, not least because of the extensive discussion concerning this big project.
Until today the evaluation of most of such projects has been based on an
environmental impact assessment and estimation of financial profitability. But a
changing mindset calls for new ways to evaluate development projects and future
evaluation methods should aim to account for full social cost of proposed projects.
Over the past few decades the importance of ecosystems with regard to functions
and ecosystem goods and services has been highlighted by the field of ecological
economics. The earliest references regarding ecosystem functions date back to the
1960´s and early 1970´s. More recently a rapid growth has been in the publications on
the benefits of natural ecosystems to human society (de Groot, Wilson, & Boumans,
2002). A certain climax was reached with the publication of the Millennium
Ecosystem Assessment (MEA) published in 2005. Despite this development in both
USA and widely in Europe, Iceland has not followed and is far behind in this field.
Holistically assessing the flow of goods and services from ecosystems and valuing
in terms of economic benefits is a promising method, which can contribute
substantially to decision making in environmental management. In 2007 an ambitious
project was started through a collaborative effort between four research entities (The
University of Iceland, The Icelandic Forest Research at Mógilsá, The Reykjavík
Forest Association and The Icelandic Forest Association) aiming to perform the first
holistic economic evaluation of ecosystem goods and services in Iceland. The main
purpose of this big project was to provide a high profile environmental valuation study
with up to date methods where ecosystem goods and services provided by widely used
recreational area are valued. This study could then serve as a point of reference for

2
future valuations. The subject area chosen was the nature reserve of Heiðmörk
situated in the capital area of Iceland. Heiðmörk is a multi-functional natural area
which simultaneously provides services such as clean water, wild-life habitat, various
recreational opportunities and carbon sequestration. Thus, it was considered a good
example for the first evaluation study in Iceland.
The present study is a sub-study of this Heiðmörk project where two lakes situated
within the area, Lake Elliðavatn and Lake Vífilsstaðavatn are addressed specifically.
The ecosystem goods and services provided by these two lakes are categorized into
four categories according to the classification scheme presented by the MEA. They
are then valued economically by accepted valuation methods. The ultimate aim of the
study is to answer the question:
What is the worth of the ecosystem goods and services provided by Lake
Elliðavatn and Lake Vífilsstaðavatn to the surrounding society?
The thesis is divided into seven main sections. The second section is a review of
literature where the foundation of this study is compiled. There, concepts, methods
and issues that are relevant to the present study are introduced. In the third section the
study site is presented and described, first the Heiðmörk nature reserve in general,
then specifically the two subject lakes and potential services provision. All analysis
and results for each services category are put forth in the fourth section. The fifth
section brings together the results for each category to arrive at a total value. In the
sixth section the results are discussed, weaknesses of approaches are addressed and
future research suggested. The seventh section presents the final conclusion of the
study.

3
2. Literature review
Ecosystems, their functions, services and evaluation in terms of land management
have been the subject of various studies, both theoretical and empirical. Following is
a review of literature on the subject. In the first section the term ecosystem is
explained, what is meant by ecosystem services and some classification schemes are
presented. In the second section trade-offs in ecosystem services and land
management are addressed and how they essentially make the grounds for the
valuation of ecosystem services. In the third section the concept of value is presented
and different perspectives on that concept discussed. The fourth section is focused on
the economic valuation of nature and its ecosystems, the fifth section presents
different valuation methods and the sixth section presents issues related to them.
2.1 Natural ecosystems, services and classification
An ecosystem is a natural unit which consists of a living community and its non-living
physical environment that interact to form a stable state system. The term is a multi-
scale concept and can refer to various situations such as a rotting log, a lake and the
earth (Bingham, et al., 1995). The biosphere and its natural ecosystems, through
transformations of natural resources such as soil, water and living organisms, yield a
flow of ecosystem goods and services, on which humanity is ultimately dependent
(MEA, 2005; Daily, et al., 2000). The benefits people derive directly or indirectly
from ecosystems are what is referred to as ecosystem services. These benefits are e.g.;
basic life support services such as provision of clean air and water; maintenance of
soil fertility; maintenance of livable climates; pollination of crops and other
vegetation; control of potential pests; provision of genetic resources; production of
food and fibre; and provision of cultural, spiritual and intellectual experiences
(Costanza, et al., 1997; MEA, 2005). As humans depend on this flow of ecosystem
goods and services provided by the biosphere and its natural ecosystems, the world´s
ecosystems can in fact be seen as capital assets which yield a flow of valuable services
if properly managed (Daily, et al., 2000). These capital assets are frequently referred
to as natural capital. Natural capital has two major components; non-renewable stocks

4
of natural resources such as fossil fuels and other minerals and renewable stocks
embodied in ecosystems (Jansson, Hammer, Folke, & Costanza, 1994). Costanza and
Daly (1992) define natural capital as “a stock that yields a flow of valuable goods or
services into the future, e.g. a fish stock which provides an annual flow or yield of
fish”. The maintenance of this flow is then based on the ecosystem´s structure and
diversity and on its integral functioning (Costanza & Daly, 1992).
In the past, humans had plentiful of natural resources and ecosystem services
to utilize at will. Manufactured and human capital, were the limiting factors of
economic development while natural resources were abundant. At that time the scale
of operating was too small to interfere substantially with natural processes and the free
provision of goods and services. We have now reached a point in history where the
natural capital has become the limiting factor of economic development while the
human and manufactured capital are highly abundant (Costanza & Daly, 1992).
Humans now extensively dominate the biosphere, with the result of vast transitions in
the composition, structure and function of ecosystems (Vitousek, Mooney,
Lubchenco, & Melillo, 1997). The operating scale has increased so that the capacity
of the natural ecosystems to provide the flow of vital services and goods is being
reduced substantially (Costanza & Daly, 1992). At the same time, demands for
services such as food and clean water are increasing worldwide. Following a global
awakening concerning these matters, a breakthrough in this field was made in the year
2000 when national governments, the private sector, nongovernmental organizations
and scientists all participated in the United Nations project of establishing the
Millennium Ecosystem Assessment (MEA). The MEA is an integrated assessment of
the world´s ecosystems, their services and the consequences of their changes and
degradations for human well-being. More than 1360 experts worldwide contributed to
the work. The assessment also includes possible options for enhancing the
conservation of ecosystems and their contribution to meet human needs. The MEA
submits a classification scheme where all ecosystem services are categorized into four
categories;
1. Provisioning services such as food and water.
2. Regulating services such as regulation of floods, drought, land degradation
and disease.
3. Cultural services such as recreational, spiritual, religious and other non-
material benefits.

5
4. Supporting services such as nutrient cycling.
The services within each category then differ, depending on the type of ecosystem in
question (MEA, 2005). Other classification schemes for ecosystem services have been
put forth by others, such as Goulder and Kennedy (1997) and De Groot et al (2002)
and following in table 1 these three different classification schemes are compared.
Table 1. Comparison of classification schemes from the MEA (2005), Goulder and Kennedy (1997) and De Groot et al (2002), with examples of each category. Goulder and Kennedy 1997 DrGroot et al. 2002 MEA 2005 i. Sustaining plant and animal
life
• Wood • Fresh water • Fuel • Food
i. Production
• food • raw materials • genetic • medicinal • Ornamental
i. Provisioning
• Food • Wood • Fresh water • Fuel • Medicinal • Ornaments
ii. Provision of production
inputs
• Soil formation • Primary production • Climate regulation • Flood prevention • Nutrient cycling
ii. Regulation
• nutrient regulation • soil formation • climate regulation • disturbance
prevention • water regulation • water supply • soil retention • waste treatment • Pollination
ii. Supporting (e.g.)
• Nutrient cycling • Soil formation • Primary production • Water supply • Pollination
iii. Habitat
• Refugium • Nursery
iii. Regulating
• Climate regulation • Flood prevention • Disease prevention • Water purification
iii. Amenity
• Aesthetic • Spiritual • Recreational • Educational
iv. Information
• Aesthetic • Spiritual and
historic • Recreation • Science and
education • Cultural and artistic
iv. Cultural
• Aesthetic • Spiritual • Recreational • Educational
iv. Provision of option value

6
The importance of consistent classification of ecosystem services for valuation is
an issue that has been discussed in the literature (see e.g. Wallace (2007) and Fisher &
Turner (2008)). Although different classification schemes may be valid, it can be
helpful for credibility that classification is consistent between valuation studies. While
there is not one single, accepted method of categorizing all ecosystem services, the
framework provided by the MEA is widely accepted (Ozdemiroglu, Tinch, Johns,
Provins, Powell, & Twigger-Ross, 2006) and commonly used at the present (Martın-
Lopez, Gomez-Baggethun, Lomas, & Montes, 2009; E.S.E.E.conference, 2009). Thus
the MEA framework was used as a starting point in the valuation study of the
ecosystem services of Heiðmörk and in particular for the subject of the present study,
the services provided by the lakes of Heiðmörk, Lake Elliðvatn and Lake
Vífilsstaðavatn.
2.2 Tradeoffs in land-use and ecosystem services
Ecosystem services do not operate in isolation. Different ecosystem services in an
ecosystem variously interact with one another, often in complicated and unpredictable
ways. This is one of the principal challenges in environmental or ecological
management (Rodriguez, et al., 2005; Heal, et al., 2001). When the environment is
managed to increase the use of a certain ecosystem service, the flow of another
ecosystem service may be reduced. This is called a tradeoff, as one service is traded
off for another (Rodriguez, 2006). Tradeoffs in environmental management also take
place when natural capital is traded off for man-made capital, e.g. buildings or golf
courts. Sometimes in land management clear decisions are made to trade a certain
ecosystem service to enhance another one. The results from such tradeoffs may be
little but sometimes they have substantial repercussions. For example, biodiversity has
commonly been traded off for monoculture in agriculture to increase the production of
certain crops, presumably with high market value. However, by keeping biological
diversity in agriculture the probability of the crops becoming infected by diseases can
be minimized and nutrient efficiency increased, which leads to less nutrient runoff
into waters (Tilman, 1999). In other cases, tradeoffs arise without the awareness of
decision-makers. This may happen due to ignorance of the interactions between
ecosystem services, incorrect or incomplete knowledge of such interactions or lack of
markets for the ecosystem services in question (Rodriguez, 2006). For further

7
clarification of how tradeoffs arise in land use, mangroves demonstrate a good
example. There, different types of tradeoffs occur, both between ecosystem services
and between natural capital and man-made capital. Mangrove ecosystems provide
various valuable ecosystem services. Firstly, they are exploited for forestry products
such as fuel-wood, tannins, pulp-wood and timber which is a provisioning service and
obvious as such. Secondly, they provide important supporting services as they provide
complex habitats for juvenile shrimp and fish. This complex habitat decreases the
efficiency of predatory fish in feeding on them, thus providing an important support in
local fisheries. However, this service is less obvious and often ignored by the forestry
sector. Thirdly, mangrove areas are reclaimed for agriculture, aquaculture and
residential development which eventually results in the loss of this resource in coastal
areas (Grasso, 1998).
When it comes to land-use management, human societies generally tend to
focus mainly on the provisioning services from ecosystems, followed by regulating,
cultural and supporting services (Foley, et al., 2005; Rodriguez, et al., 2005). This
order is mostly based on the fundamental short-term needs of humans for food, fiber,
timber and habitat. The intended consequence of land use is to appropriate primary
production for human consumption (Vitousek, Mooney, Lubchenco, & Melillo, 1997)
but the unintended consequences, often adversely affecting other ecosystem services,
may remain hidden or just behind in the order of priorities (DeFries, Foley, & Asner,
2004). Wetlands are another example as they provide water storage, maintenance of
surface and groundwater flows, biochemical cycling, retention of water-suspended
and dissolved materials, accumulation of peat, maintenance of characteristic
biological energy flows, and maintenance of characteristic habitats (Lupi, Kaplowitz,
& Hoehn, 2002).
2.3 Nature and the concept of value
When seeking ways to deal with the tradeoffs described above, ultimately we must
come up with some kind of values. Things are constantly being valued and prioritized
based on their values, including natural ecosystems and resources. Value, however, is
a term that can represent different things. Values can be e.g. sentimental, religious,
cultural or economic. Certainly they are not only represented in monetary terms. Thus,
the concept of value has different meanings both to people in general and also

8
academically, between and within disciplines (Bingham, et al., 1995). Concerning the
valuation of nature, its ecosystems and resources, there are two opposing perspectives
well known in the literature, the nature-centered and the anthropocentric perspective.
The tension between these two concerns has been a key subject of environmental
philosophy for a long time (Vilkka, 1997). The anthropocentric perspective, bases all
values on benefits or satisfaction that humans derive from natural assets, thus only
humans have intrinsic value while everything else has instrumental value for humans.
According to some, the nature-centered perspective can be ascribed from two
viewpoints, the ecocentric and the biocentric. On one hand, from an ecocentric
viewpoint, ecosystem processes have intrinsic value while individual species have
instrumental value. On the other hand, from a biocentric viewpoint, animal and plant
species have intrinsic value while non-living nature has an instrumental value (Meffe
& Carroll, 1997). Others have classified these views of environmental valuation
differently, e.g. Teutsch (1985) who established a system of classification based on
the anthropocentric, pathocentric, biocentric and holistic concepts of environmental
ethics. However, an analysis of different interpretation and classification in
environmental philosophy is not a fundamental issue here. Rather to look shortly into
the key differences between the nature-centered and anthropocentric perspectives.
Man tends to be self-centered in is his view towards nature, considering
himself standing above and beyond all other living creatures. Culture seems to
have abstracted humans away from nature, letting them feel such a unique and
remarkable beings that their interests should have absolute priority over the
interests of other creatures. This attitude makes the rights and interests of other
creatures, or nature, always give way to human interests and rights of
enjoyment of the values of life (Adapted from Skúlason, 2006).
This view is what Páll Skúlason (2006) and some other environmental philosophers
think violates the principles of true morality. A great controversy in environmental
ethics regarding attitude towards nature is whether organisms and natural entities can
be considered moral objects, that is objects of direct moral responsibility (Gorke,
2003). This is one central conflict of the opposing perspectives of the anthropocentric
and nature-centered views. Is nature only of instrumental value to humans or does it
have an intrinsic value which human should respect morally?
Utilitarianism, a perspective within the anthropocentrism, claims that natural
things have value to the extent that they confer satisfactions to humans. Economists

9
rely on the utilitarian viewpoint and the economic approach to ecosystems is one of
anthropocentric instrumentalism where ecosystems and their services are considered
valuable if they satisfy humans. Many environmentalists (and environmental
philosophers as demonstrated above) are against this view asserting that nature has
intrinsic value. However, anthropocentric utilitarianism does not necessarily mean that
ecosystems must be exploited and have no value in their natural states. Substantial
sacrifices may be made to protect and maintain species and ecosystems just as long as
humans take satisfaction from doing so. The term satisfaction should be interpreted
broadly in this context, taking in both mundane enjoyments and lofty pursuits
(Goulder & Kennedy, 1997). Taking more aspects into account surely may give better
odds for the conservation and protection of species and natural ecosystems. Still, as
Gorke (2003) points out, a basic structural weakness of the anthropocentric and
economic approach to protection is that the burden of proof rests upon the species or
the ecosystem in question. The economic approach implies a burden of proof for the
species or ecosystem that they are worth protecting, that is that the services they
provide give enough satisfaction for humans for them to be worth protecting. This
burden of proof is problematic from a practical standpoint because such a proof is
only accepted if the utility of the species or ecosystem is known at least in first
approximation and it must be quantifiable. Also, when subjected to cost benefit
analysis it must be shown to weigh more than potential cost of competing utility
values. The problem is that complete knowledge of this is impossible. We often have
to make do with limited and temporary knowledge, but when it comes to making
value judgements, irreversible decisions may be made on an insufficient and
constantly changing knowledge basis. Only properties of ecosystems and species that
are already known can be quantified. Due to lack of knowledge, all attempts of
quantification are likely to represent a rather arbitrary portion of all the potential
possibilities of utilization that exist. Therefore it is important to view such attempts
from the perspective of this lack of knowledge (Gorke, 2003).
Swart et al. (2001) relates the anthropocentric perspective to consequentialism
where human actions are considered to be good if they lead to more positive
consequences than negative. There, the benefits humans derive from nature can be
various material goods, services and non-material goods such as educating
information and leisure. Conserving and restoring nature can cause disadvantages
such as limitations for human economic progress while development of certain

10
ecosystems can lead to natural disasters such as flooding or diseases (Swart, van der
Windt, & Keulartz, 2001). The anthropocentric, utilitarian approach allows for value
to arise in number of ways, focusing not only on direct use values (Goulder &
Kennedy, 1997). The approach allows for different non-market valuation methods to
take into account other values such as recreational, cultural and existence values.
Gorke (2003) rightfully points out that if assigning a quantitative value to various
kinds of utility is possible at all, it can only occur under extreme simplification of
complex phenomena. It is true that all the non-market valuation methods do involve
simplifications and they do have shortcomings.
Economists generally do not subscribe to the nature-centered perspective and
ultimately the anthropocentric values, which are directly based on utilitarianism,
create what we call economic values (Davidsdottir, 2006). Since services and products
are generally something humans value monetarily, and often pay for, the term itself
“ecosystem service” points out that the ecosystems, with their structures and function
are resources which provide an economic value (Limburg, O’Neil, Costanza, &
Farber, 2002).
The present study aims at valuing ecosystem services in economic terms and
therefore all valuation methods and economic values worked out are based on an
anthropocentric perspective.
2.4 The economic valuation of ecosystem services
When it comes to allocating natural capital, the aim of decision makers must always
be to achieve the best (or most efficient) allocation of resources. Essentially, options
need to be evaluated in terms of economic value to the nation, community or the
individual in the long run (Davidsdottir, 2006). However, many tradeoffs frequently
arise representing practical dilemmas to decision makers because conventional
economic frameworks, on which decisions are based, in most cases rely on the market
to reveal value. However, many of the ecosystem goods and services are so called
non-market goods that are not exchanged in markets and therefore excluded from
formal decision making frameworks. Non-market goods and services are in most
cases received free of charge and are not considered to add to welfare or utility. This
may result in suboptimal allocation of natural capital and its uneconomical
degradation. By attempting to capture the economic value of services provision from

11
natural ecosystems, an important and useful contribution can be made to
environmental management and decision making. Decision makers, both in public and
private sectors, are increasingly realizing this fact. They want and need better
information about the values of ecosystem services in weighing the advantages and
disadvantages of their decisions.
It has been argued above how economic valuation of natural capital has
become an urgent matter and important in order to prevent unwarranted assumptions
of higher profits from economic development projects than the value of the natural
capital traded off instead. As we try to economically value ecosystem services, we do
not aim to put a monetary value on the total value of natural capital itself, as it is
impossible. Nature itself, the stock, is invaluable. What is to be valued is the flow, the
goods and services provided by the stock.
2.5 Valuation methods
How can the flow of ecosystem services be valued economically? The theory of
economic valuation of ecosystem services is based on the consumer demand theory
which again is rooted in the utility theory. According to the utility theory, the
consumer´s main problem is how he allocates his limited income to maximize his own
utility. So, he weighs the utility of consumption bundles and chooses from all the
bundles he can afford, the one that maximizes his utility. This model defines the value
of a good by its contribution to individual utility and is therefore fully
anthropocentric. The general definition of a classic utility model, on which the
valuation is based, is not described in detail here but can be found in any economic
textbook. The classic model can then be extended to include ecosystem services (e.g.
Haab & McConnel (2002), Hanley, Shogren and White (2007)).
The core of general financial valuation is about estimating the costs and
benefits directly associated with a project to assess whether the project is profitable or
not. Thus, in a general valuation process of a project, all discounted private benefits
involved, e.g. sales of products are estimated versus all costs involved, e.g. investment
and material costs. Risk factors related to the project, cost of capital and desired
returns from investors are reflected by the chosen discount rate. Financial gain is
simply the sum of discounted net profits while the project lasts:

12
Equation 1 ∑
Here, NPV denotes net present value, Bt denotes private benefits in year t, Ct denotes
private costs in year t, r denotes the discount date and T denotes the duration of the
project
In a financial evaluation the only costs and benefits accounted for are the ones
that affect the cash flow and the project bottom line. They are then valued by the
market prices at the date they occur. Economic valuation is different as it does not
only take into account everything possibly accountable in a financial valuation, but all
costs and benefits which affect social welfare as a whole. In the present study, direct
benefits, such as recreational fishing and electricity production, from the lakes,
Elliðavatn and Vífilsstaðavatn, are evaluated by using economic valuation methods.
As most of the services provided by the two lakes do not have a market price
and the benefits derived from them are unknown, a simple net value can not be found.
In environmental economics there are several methods used to assess the value of
changes in environmental quality and the availability of ecosystem services. These
methods differ both in terms of what they measure and what data is required. They
can then be categorized according to whether they are based on revealed preferences
or stated preferences by the consumers. Following, some of the main economic
valuation methods are listed and described with special focus on the methods used in
the present study.
2.5.1 Revealed preference methods
Methods using revealed preferences consider the decisions people make following a
change in environmental quality. The value of ecosystem services is estimated
through market goods either used in the consumption of the environmental service or
directly affected by the access of an environmental service. So, in fact these methods
involve a kind of detective work where clues about the values individuals place on
environmental services are pieced together from the evidence that people leave behind
as they respond to prices and other economic signals (Freeman, 2003). As the analyst
has to infer the value on a non-market good from consumer´s behavior in the market,
those methods are sometimes known as indirect methods (Hanley, Shogren, & White,
2007). Revealed preference methods mostly bring forth use values and are therefore

13
only appropriate for certain types of cases. Following, the most commonly used
revealed preference methods are listed and described.
Travel cost method
The travel cost technique was first suggested in the 1930´s by Harold Hotelling to
enable the National Park system to determine admission fees for national parks. This
method has constantly been applied and refined by economists over the last decades to
assess the economic value of various public resources (Sohngen, Lichtkoppler, &
Bielen, 2000). Travel cost models are typically used to estimate use values for
recreation activities and changes in values associated with changes in environmental
quality. The general model is based on consumer´s decisions to visit recreation sites
that differ in travel cost and quality (Boyle, 2003). A main recognition of the model is
that the cost of travelling to a site is an important component of the full cost of a visit
and that, for any given site, there will usually be a wide variation in travel cost across
any sample of visitors to that site (Freeman, 2003). A statistical relationship between
observed visits and the cost of visiting is then used to approximate the demand curve
for visits to the site. In the present study the travel cost model plays a key role in the
estimation of recreational value of Lake Elliðavatn and Lake Vífilsstaðavatn.
Following an example of a basic travel cost model from Freeman (2003) is presented
for theoretical explanation. Assume an individual who derives utility from going to a
recreational site (r). The utility of the individual depends on factors such as the quality
of the site (q), the time spent on site (t1) and the quantity of goods (X). The individual
aims to maximize his utility according to:
Equation 2 u(X,r,q)
The individual has monetary constraints given by:
Equation 3 M + Pw · tw = X + c · r
where M denotes the income of the individual, Pw denotes the wage rate, tw denotes
the hours worked, c denotes the cost of the trip and r denotes the number of trips. The
individual also has time constraints given by:
Equation 4 t* = tw + (t1+t2)
where t* denotes the total time of the individual and t2 denotes the time spent on site.
The time constraints reflect the opportunity cost time spent in the recreational activity.
That is, by spending time traveling to and at the recreational site, time is taken from
other activities. It is assumed that the individual can choose his working hours, thus

14
the opportunity cost is the wage rate. The monetary cost of a trip consists of the
admission fee (f) and the monetary cost of the travel, denoted by pd · d where pd is the
cost per driven kilometer and d is the distance of the round-trip to the site.
Substituting the time constraint (Equation 4) into the monetary constraint (Equation 3)
gives:
Equation 5 M + Pw · t* = X + pr · r
where pr denotes the full price of a visit which again is given by:
Equation 6 pr = c + pw · (t1+t2) = f + pd · d + pw · (t1+t2)
The demand function of the individual for visits to the recreational site can be yielded
by maximizing equation 2 from above subject to the constraints of equation 5:
Equation 7 r = r (pr, M, q)
(Freeman, 2003)
A basic travel cost model can be put forth in different ways but the
fundamental contents are the same. Travel cost models can be distinguished,
depending on whether the aim is to estimate the demand for a single site or the
demand for many sites. Single-site models are appropriate for estimating the total use
or “access value” of a site. There, if the site is eliminated, the lost value is the total
consumer surplus under the single-site demand function. To estimate the demand for
many sites, the most widely used model is the random utility maximization (RUM)
model. It takes into account the individual´s discrete choice of one recreation site over
some other possible sites, on a single choice occasion in a season. The individual´s
choice is assumed to reveal how he trades off one site characteristic for another. Since
trip cost is always included as one of the characteristics, the model implicitly captures
trade-offs between money and other characteristics (Parsons, 2003). In this study the
single site model is applied to estimate the access value of the subject lakes.
The travel cost method inherently comprises certain issues which are described
further in section 2.6 below. However, one of its major advantages is undoubtedly that
it is based on actual behavior and thus less prone to bias than methods that are based
on hypothetical situations.
Hedonic pricing method
The hedonic pricing method is based on the theory of characteristics value, first
proposed by Lancaster (1966) and Rosen (1974). Hedonic pricing models are
generally property value models used to infer the premium that households pay to buy

15
a property near an environmental amenity or away from an environmental disamenity
(Boyle, 2003). A typical example of such property is a real estate. The price of a real
estate depends on factors like size, location, view, garden etc, in addition to other
environmental factors such as noise level, air quality and proximity to green areas.
The choice of a house and its associated price implies therefore an implicit valuation
of the environmental amenities related to the house. The core of the hedonic pricing
method is that it relies on market transactions for some distinguished goods, such as
real estate, to figure out a value of underlying key characteristics, such as the
environment. It is thus an indirect valuation method as the value consumers reveal for
the characteristic per se is not being directly observed but it is derived from
observable market transactions (Taylor, 2003). The hedonic pricing method is outside
the scope of this study and is therefore not described in details here. For further
clarification see e.g. Tyrvainen (1997), Haab & McConnell (2002) or Hanley, Shogren
& White (2007).
Defensive behavior and damage costs
Defensive behavior is when actions are taken to reduce the impact of environmental
damages. For example measures made to reduce exposure to pollution or mitigate
disadvantageous effects (Dickie, 2003). Economists have acknowledged that people,
or decision makers, sometimes change their behavior to decrease negative
environmental impacts in order to avoid loss of welfare or to sustain existing levels of
utility (Ribaudo & Shortle, 2001). Subsequently, a value placed on an environmental
resource is revealed as the services preserved must be worth at least what the people
paid to avoid the damage. The method of valuing defensive behavior is also referred
to as environmental defensive expenditures (Escofet & Bravo-Pena, 2007), preventive
expenditures (Pomeroy, 1992), averting behavior (Freeman, 2003) or averting
expenditures (Ribaudo & Shortle, 2001). Such values have been used in various
empirical studies as estimates of the value of the environment (Laughland, Musser,
Shortle, & Musser, 1996), see e.g. Gerking and Stanley (1986) and Abdalla, Roach
and Epp (1992).
Damage cost is another method in ecosystem valuation. There the focus is on
real resource costs, direct or indirect, that are derived as a consequence from an
environmental damage. Direct costs are the essential expenditures to compensate for
the damage, e.g. illness treatments, reparations or replacements for damaged things.

16
Indirect costs are e.g. when opportunities for profits are lost or productivity decreases
due to environmental pollution. The core of the damage cost method is that the
reduction in real resource costs is used to measure the benefits of reduced pollution
(Dickie, 2003).
The two methods differ mainly in two ways. One is that the defensive
behavior method focuses on how people respond to environmental changes by
observed behavior and the impact of the behavior on the outcomes experienced. In the
damage cost method however, it is assumed that there are no behavioral responses to
environmental changes or that behavioral responses are not effective. Secondly,
defensive behavior is intended to estimate a somewhat theoretically consistent
measure of an economic value like willingness-to-pay (WTP) but the damage cost is
not (Dickie, 2003). In the present study the defensive behavior method is applied to
assess the value of regulating services. Thus, the method and theory behind is
explained in detail here below.
The defensive behavior method is commonly used in the context of human
health, such as in the case of contaminated drinking water or air pollution. Dickie
(2003) uses a model, developed by Harrington & Portney (1987) to illustrate how
defensive behavior, damage cost and welfare are related. Following, the basic model
is demonstrated, modified and simplified so that it is applicable to the present study.
Instead of using individual utility we use social utility. The social utility U is given by
the function:
Equation 8 U = U(X, Q)
Where X denotes for example transportation and Q denotes the water quality of a lake.
A distinguishing factor of the defensive behavior model is that bad water quality of
the lake does not just happen, but is influenced by behavior, which in this case would
be planning and management of the adjacent area. The quality of the lake is again a
function of certain factors:
Equation 9 Q = Q(E, Z)
Here the E denotes the lakes exposure to pollution and Z denotes some exogenous
factors that affect how susceptible and sensitive the lake and its ecosystem is to
pollution. Now, exposure to pollution is affected by polluting substances released in
the adjacent area and the planning and management of the area. This would be
according to the function:
Equation 10 E = E(α, A)

17
The ambient level of pollution is denoted by α and A denotes averting behavior.
Ambient pollution increases pollution while averting behavior reduces exposure.
The aim is to define the “defensive expenditure function” (Bartik, 1988) that gives the
minimum cost of maintaining desired water quality level of the lake Q° when the price
of defensive behavior is pa and ambient pollution is α:
Equation 11 D(pa, Q°, α, Z) = pa · A°
The minimum defensive expenditure is a function of price, water quality level and
ambient pollution because A°, the level of averting behavior is a function of these
variables (Dickie, 2003).
This method is applied in section 4.2 since the municipality of Kópavogur had
a pipeline and a sedimentation pond constructed to prevent pollution from the adjacent
residential area from going unimpeded into Lake Elliðavatn. Thereby, we have an
estimate of certain willingness to pay to maintain desired water quality. Still, even
though defensive behavior can be seen to reveal a certain willingness to pay, it shall
be noted that it is not consistent with willingness to pay as obtained by valuation
methods such as contingent valuation. This has been demonstrated in studies such as
by Bartik (1988), where averting cost was examined as a lower bound on willingness
to pay, and Laughland et al. (1996). In the latter, the relationship between willingness
to pay, obtained with contingent valuation, and averting cost was studied revealing a
low correlation. Nevertheless, defensive behavior does provide a value, using
available data when more thorough methods are too expensive or not practicable.
Factor income
Factor income is based on enhanced income that can be attributable to the provision of
ecosystem services (de Groot, Wilson, & Boumans, 2002; Freeman, 2003). If a factor
q is a factor of production, then changes in q lead to changes in production or
production cost which in turn affect things such as prices, the quantity of output and
returns to other factor inputs. Assume a good x is produced with a production
function:
Equation 12 x = x(k, w, …,q)
where k and w representing production factors such as capital and labor and the
marginal product of q is positive. With given factor prices (px,pk) there is a cost
function:
Equation 13 C = C(pw,pk,x,q)

18
As q affects the production and supply of the good x, effects of changes in q can be
defined and measured through changes in market variables related to x. A change in q
will cause shifts in cost curves and factor demand curves. The consequences of these
shifts then depend on conditions in factor and product markets. There are two ways
through which the changes in q can affect x, it can affect the prices of x to consumers
or it can affect the income and profits received by owners of factor inputs used in the
production of x (Freeman, 2003).
In the present study this method is applied in the attempt to capture the factor
income value of Lake Elliðavatn in terms of salmon production in the Elliðaár River
and the method is described in that context in section 4.4.5.
Avoided cost and replacement cost
Avoided cost is about estimating a possible cost avoided that would be incurred if a
certain ecosystem service ceased to be provided. Examples are e.g. services provided
by wetlands; flood control, which avoids damage costs of properties, and waste
treatment, which avoids pollution and possible health costs. Replacement cost is when
the cost of replacing a function of an ecological system with human-engineered
systems is used as a measure of economic value. An example is natural waste
treatment by marshes which can partly be replaced with costly artificial treatment
systems (de Groot, Wilson, & Boumans, 2002; Freeman, 2003).
2.5.2 Stated preference methods
Stated preference methods elicit values directly through survey methods. The answers,
in the form of monetary amounts, choices, ratings or other indications of preferences,
are scaled according to a suitable model of preference to yield a measure of value.
Stated preference methods are more prone to bias than revealed preference methods,
yet they can provide an important contribution, as surveys are often the most effective
way to understand people´s preferences (Brown, 2003). The revealed preference
methods estimate only the use value of environmental services, and even then the
methods are only applicable if that value affects behavior in a measurable and
interpretable manner. For other cases and to include non-use values, stated preference
methods with hypothetical markets are essential. Following, three major types of

19
stated preference methods are introduced shortly but they are not applied in the
present study.
Contingent valuation methods (CVM)
Contingent valuation methods are based on asking individuals directly for monetary
values for a particular good, service or environmental change (Freeman, 2003). To
implement a CVM a sample of the affected population is selected and asked questions
on well specified scenarios to elicit the preferences of each respondent with respect to
an environmental project. The key part of any CV study is the description of the
scenario, the hypothetically planned change in environmental quality, and the question
that elicits the individual respondent´s willingness to pay (WTP) or willingness to
accept (WTA) for a certain change in the environment. From the results of the survey,
a demand function for the environmental service in question can be obtained
corresponding to consumption theory. Usually the method is used to value a single
good but sometimes also for few closely related goods that have a different level of a
certain key attribute. From that conclusions can be derived about the value of this
certain attribute (Brown, 2003).
The main disadvantages of the CV method are related to the fact that the
market is hypothetical and therefore people may not fully take their budget constraint
into account or be tempted to answer strategically to influence the outcome in some
manner (Mitchell & Carson, 1989). Moreover, people may not take into account all
the other improvements to the environment they might want to support (Kahneman &
Knetsch, 1992) or they may not understand completely what is involved in the
suggested environmental change. Despite the inherent problems, the contingent
valuation method is the most popular method for valuing ecosystem services as it is
the only method that can be used to estimate existence value. It is widely used in the
USA and Europe for various issues such as regarding water quality and wilderness
protection (Lindenmayer & Burgman, 2005).
2.6 Issues in valuation
While a very important contribution to environmental management, economic
valuation of ecosystem services is a complicated matter and subject to various issues.
Compared to other forms of capital, most of the time there is a great lack of

20
information and details about natural capital, ecosystems and their flow of services.
Ecological functions and processes are generally inadequately understood and
monitoring limited. Consequentially, the importance of ecosystem services is often
only appreciated upon their loss (Daily, et al., 2000). Moreover, as ecosystems are
complex and dynamic and often interact in non-linear ways, even though some
knowledge exists, all predictions concerning desired levels of services flow become
difficult.
One issue regarding valuing natural capital and the flow of ecosystem services
concerns the question of what is to be valued and why? In the beginning of any
valuation study, experts are faced with the question of what services to value, why and
how. There are constraints related to money, time etc. and therefore what is to be
valued must be decided carefully, also because the choice of which attributes to value
is itself a valuation decision and a challenging one (Bingham, et al., 1995). Drawing
boundaries is another issue but that is a critical step in any ecosystem services
valuation process because at these boundaries the explicit analysis ends. Some
boundaries can be fairly easy to draw, such as the boundaries of a lake or a watershed.
However, other boundaries can shift greatly over space and time which causes certain
problems (Limburg, O’Neil, Costanza, & Farber, 2002). Yet another issue in
ecosystem services valuation regards double counting. It is important to consider how
different ecosystem services interact early in the process as there can be
complementarities and/or conflicts between different ecosystem services
(Ozdemiroglu, Tinch, Johns, Provins, Powell, & Twigger-Ross, 2006). Such things
can complicate the process of valuation and lead to double counting (Barbier, 1994;
Chee, 2004) and for the credibility of valuation studies it is important that services are
not double counted.
Categorizing the services that ecosystems provide can facilitate selecting what
should be measured or choose from different valuation methods for different services.
Different methods may be based on different categorizations. If more than one
valuation method is determined to be useful in making decisions, then an
understanding of the categories assumed will allow an assessment of whether certain
attributes or services are being double counted (Bingham, et al., 1995).
Certain ecosystem services are almost impossible to evaluate economically
even though they are essential to maintain the flow of all other ecosystem services.
These are services that do not give a direct input to human welfare but are

21
fundamental to sustain the services that do. The supporting services generally fall into
this category. They have a supportive function with indirect or little understood effects
on welfare. The value of these services can be very large, yet poorly appreciated by
decision makers and the public, poorly estimated by scientists and not valued
sufficiently by available valuation methods. However, to value such services, values
may be constructed indirectly by relating the services to things that people value
directly. Thereby, changes in supporting services are translated into effects on directly
valued goods and services. An example is pollination, a supporting service for the
production of food, e.g. almonds or tomatoes. Possibly the part of the pollinators in
the food production can be isolated, thus enabling an economic valuation of their
service. In practice, necessary resources such as time, data and methods may not be
available for such valuation (Farber, Costanza, & Wilson, 2002; Bingham, et al.,
1995). Also, in some cases it may not be pragmatic to attempt a realistic economic
estimation of the value of these services as the true value can be too extensive to
capture. In spite of this, the economic valuation of one supporting service is
addressed in this study.
Another issue concerns ecosystem resilience. In ecosystem management a vital
part is to maintain the ecosystem resilience. Resilience enables ecosystems to recover
from stress or a shock and thus the flow of services is maintained. However, it is not
at all clear how this emergent property of ecosystems could be economically valued
(Vatn, 2000; Chee, 2004).
Regarding valuation methods, they are important in the attempt to
economically value the provision of ecosystem services. Nevertheless there are
drawbacks with most ways of inferring value. Market prices, for example, do not
reflect the full social cost of production. Then, methods of indirect revealed
preference such as travel cost, defensive behavior, damage cost and factor income do
not enable one to place a value on the existence of certain assets. As a result, such
approaches, and the ones based on the avoidance of cost, only provide lower bound
indications of value, particularly if the service in question does not have an adequate
substitute. In ecosystem valuation studies, these limitations of methods may possibly
be partly overcome by applying a range of methods simultaneously. However, when
that is done, one must obviously still be sure not to double count services (Daily, et
al., 2000). The travel cost method has some well known issues. One of which is the
estimation of opportunity cost of time but it can be difficult to put a value on the time

22
of individuals. Another concerns substitute sites as it can be difficult to find
appropriate substitute sites. Multi-destination trips can also cause a problem if people
use the trip to a recreational site for other purposes as well. Then model specifications
and components of travel cost can be complicated as well (Gurluk & Rehber, 2008).

23
3. The study site
The economic valuation of Lake Elliðavatn and Lake Vífilsstaðavatn, is a sub-study of
the extensive study, the economic valuation of the nature reserve of Heiðmörk.
Heiðmörk fulfills the main criteria important for a holistic environmental valuation
study, making it a natural subject for the first economic valuation of ecosystem
services in Iceland. Its system boundaries are clearly defined, it is a multifunctional,
diverse ecosystem providing various ecosystem goods and services and the geology
and ecology of the system are fairly well known. All this provides a solid foundation
for the study. The area is a good example of a multifunctional ecosystem providing a
range of various services. Following, the main characteristics of the study sites are
described. First the overall study site of Heiðmörk in general and then the subjects of
the present study, Lake Elliðavatn and Lake Vífilsstaðavatn.
3.1 Heiðmörk
Heiðmörk is an extensive nature reserve of around 3000 hectares, in the outskirt of
Iceland´s capital area. The ecosystem of Heiðmörk is diverse, consisting of forests,
lava-fields, open areas and two lakes. It is the biggest green recreational area in the
capital area and very popular for various outdoor activities. The area surrounds the
capital area and forms the outer range/background sheltering the capital settlement
areas. Many walking paths and rest areas have been made in Heiðmörk, providing
facilities for various activities (Skógræktarfélag Reykjavíkur, 2009). The use of
Heiðmörk as a source of drinking water for the capital area started as early as 1909 at
the Gvendarbrunnar Wells. The area is a key water supply area for the capital area
today, supplying drinking water to more than half of the Icelandic population.

24
Figure 1. An overview of the nature reserve Heiðmörk. Source: Skógræktarfélag Reykjavíkur.
In 1870 it was first suggested to make Heiðmörk a nature reserve. Still, it was
not until 1936 that this idea was presented to the public, by Hákon Bjarnason the chief
of forestry, as he thought the area should be an official recreational area for the
general public. When the Reykjavík Forest Association was founded in 1946, the area
was given to the association. It was in the spring of 1949, that the first trees were
planted and in June 1950 Heiðmörk was officially opened to the public. In 1957 the
Heiðmörk area was enlarged as a part of the land belonging to the Vífilsstaðir
sanatorium and another piece of land from the municipality of Garðabær were merged
into the area (Marteinsson, 1975). The Reykjavík Forest Association has been mainly
in charge of supervision over Heiðmörk ever since but the current landowners are
Reykjavík Energy, the municipality of Reykjavík and the municipality of Garðabær.
Heiðmörk is relatively densely vegetated with 89% of the area classified as
vegetated land. The vegetation is very diverse but the most widely spread are planted
forests (21 %), wild birch forests and shrubs (20%), mosses (17%), heath (13%),
grassland (8%) and Alaska lupine (7%). 98% of the vegetation is dry land and 2% are

25
wetlands. The areas not vegetated are mainly the lakes (8%) and some gravel areas
(3%) (Egilsson & Guðjónsson, 2006).
Geologically, Heiðmörk is characterized by the wide-spread faulting and
recent lava fields and its landscape is mostly influenced by these two phenomena.
Doleritic basalts, probably originated from craters west of Bláfjöll in the last
Interglacial period, form the bedrock. There are clear signs of glaciations in the area,
particularly glacially polished rocks demonstrating striations, erratic and moraine
deposits. Near Lake Elliðavatn there are remains of eskers which indicate a glacial
lake larger than the present one situated there. Heiðmörk is surrounded by lava-fields,
except on the north-west side. The biggest fault-line (Hjallamisgengi) runs from
Vífilsstaðahlíð to Lake Elliðavatn, a distance of 5 km with a maximum vertical
displacement of 65 m. The fault-line is still active and has a mean annual
displacement of 2.8 mm. The fissuring of the bedrock has affected the groundwater
flow substantially. All the water courses and springs in the area are situated in the
north-east, at Elliðavatn, Myllulækur and Silungapollur and all these are clearly
connected to the fault system (Jónsson J. , 1975).
3.2 Elliðavatn1
Lake Elliðavatn is the biggest lake in the capital area, with an area of 2,02 km2 and it
rises to 73m over sea level (Malmquist & Gíslason, 2007). On a big scale, it is still a
relatively small and shallow lake with the average depth of around 1m (deepest place
2,3m). The volume of the lake is around 2 Gl. Surface influx is mainly through the
river Bugða/Hólmsá and a little through the river Suðurá. Overall, the flow in and out
of the lake is around 4,7 m3/s. The water exchange rate has been estimated around five
days, which is fast compared to other lakes of this size. However, estimations for the
water replacement time should be taken with caution since the lake is divided into two
or three parts in terms of depth and inflow to the water which may affect the overall
water flow and replacement time. The conduction in Elliðavatn is about 80-90μS/cm
which is above average and indicates good viability for organisms. Most of the
dissolved matter in Lake Elliðavatn is similar to what is seen in most Icelandic lakes.
An exception from this is aluminum, which is of unusually high concentration in the
lake and the highest seen in Icelandic lakes. The lake can be divided into three parts, 1 This section is largely based on the report from Malmquist, Ingimarsson & Ingvason, 2004.

26
Vatnsvatn, Vatnsendavatn and Engjar, Engjar being about 40% of the whole lake area
(figure 2).
Figure 2. An aerial photo of Lake Elliðavatn from 2002. When the lake was dammed in 1924-1928 its water level elevated by 1m and the “Engjar” area was flooded. The river Bugða which used to flow outside the lake now flows into it. The yellow line demonstrates approximately the old boundaries of the lake. The red gridlines demonstrate potential residential areas that have been under construction over the recent years. These constructions are now on hold because of the economic situation in Iceland. (Photograph: Loftmyndir ehf, Source:Malmquist et al, 2004)
Over the last century various alterations have taken place on the water
catchment of the lake which affected the ecosystem of the lake. The most extensive
change was when the Reykjavík Power Company (Rafmagnsveita Reykjavíkur)
bought the land of Lake Elliðavatn, and the lake was turned into a reservoir for
hydropower generation (Skógræktarfélag Reykjavíkur, 2009). It was first dammed in
1924 and the dam was improved in 1978. The lake doubled in size as adjacent areas
went under water. Early in the 20th century there was farming at the Elliðavatnsbær
but in 1941 conventional farming ended there. Still there was farming elsewhere on
the water catchment and in 2000 there were still horse stables at Heimsendi, chicken
farm at Elliðahvammur and sheepfarming at Vatnsendi and Kjóavellir (Hjaltason, et

27
al., 2000) (figure 3). The density of first summerhouses and then residential areas on
the water catchment area has increased considerably since last century. In addition,
the heavily travelled road, Suðurlandsvegur is situated on it, water has been extracted
from the Gvendarbrunnar wells since 1909 and forestation has been considerable on
the water catchment.
Figure 3. The landmarks Heimsendi, Elliðahvammur,Vatnsendi and Kjóavellir can be seen here. The colored area represents land owned by the municipality of Kópavogur Source: Útivistarsvæði Kópavogs (Kristjánsdóttir, et al., 1998).
It was in April, 1964 that all land owners around Lake Elliðavatn grouped
together in order to organize fishing and fish cultivation in the lake, forming the
Elliðavatn Fishing Association (Marteinsson, 1975). Since then, this association has
been in charge of all fishing in the lake and the rivers Bugða/Hólmsá and Suðurá.
Regarding research done on the ecology on the water catchment of Lake
Elliðavatn, the focus has mainly been on salmonids, in particular salmon in the
Elliðaár River. However there are also several studies that have been made on the
trout species in Lake Elliðavatn and adjacent rivers. Five of the seven fresh-water fish
species found in Iceland; Salmon (Salmo salar), Brown trout (Salmo trutta), Arctic
Char (Salvelinus alpinus), Stickleback (Gasterosteus aculeatus) and Eel (Anguilla
anguilla) are found in the lake. The most abundant fish species are the two trout
species and the stickleback. The salmon is not abundant and the eel is rare

28
(Malmquist, Ingimarsson, & Ingvason, 2004). Researches conducted by the Institute
of Freshwater Fisheries indicate that the salmon and arctic char have been retreating in
the water system over the last 15 years but the brown trout has maintained its status.
The reasons for this decline in these stocks are not known for sure, but the increase in
water temperature, particularly in the fall, is considered to be a possible explanation.
(Malmquist, Antonsson, Ingvason, Ingimarsson, & Arnason, 2009. (In Press);
Antonsson & Árnason, 2009).
3.3 Vífilsstaðavatn
Lake Vífilsstaðavatn is situated in the north-west end of Heiðmörk. It covers an area
of 0,27km2 and rises to 38m above sea level. Adjacent to the lake are heathland and
slopes, except for the south side where there is moorland, named Dýjakrókar. There
are springs in the moorland from which water runs to the lake in little streams. On the
west side of the lake, there is a little stream, Vífilsstaðalækur, where the water runs
out from the lake (Hilmarsson & Einarsson, 2009). The lake and surrounding area,
which are the properties of the municipality of Garðabær, were officially declared a
protected area in November 2007.

29
Figure 4. Vífilsstaðavatn and the protected surrounding area. Source: Data on the reservation of Lake Vífilsstaðavatn by Þráinn Hauksson.
Lake Vífilsstaðavatn is biologically very rich. The benthic fauna is dense and
the conductivity is high, around 130µS/cm, so there is a high level of dissolved
matters and good viability for the biosphere (Jónsson B. , 1999). The lake is also fairly
undisturbed compared to other lakes in the capital area and has for example not been
threatened by residential areas in the same way as Lake Elliðavatn.
The biosphere of Lake Vífilsstaðavatn has been studied to some extent. Fish
species found there are the arctic char, brown trout, eals and stickleback. European eal
(A.angilla) and a hybrid from the european and the american eal (A. rostrata) migrate
up the Vífilsstaðalækur and can be found in the lake (Antonsson, Guðbergsson,
Jónsson, & Malmquist, 2007). The sticklebacks in Lake Vífilsstaðavatn are unique for
the reason that they lack womb-spikes and this is the only known such case in Iceland.

30
These sticklebacks have been the subject of evolutionary and genetic research both in
Iceland and in the United States (Jónsson B. , 2004).
3.4 Services provision – an overview
There are various ecosystem services that Lake Elliðavatn and Lake Vífilsstaðavatn
provide to the adjacent society. They are popular for recreational angling and both are
encircled by nice footpaths popular for walking and jogging. They also serve as
outdoor labs as schools and educational institutions use them for field work. In
addition, Lake Elliðavatn provides benefits through beautiful view to the adjacent
residential area and it serves as a reservoir for electricity production in Elliðaárstöð.
These are the direct and obvious services that are recognized by the public. Other less
obvious ecosystem services provided by the lakes are e.g. pollution control and
detoxification, particularly in the case of Lake Elliðavatn due to substantial human
structures in the watershed, also micro-climate regulation as water areas in cities are
known to help even out temperature deviations (Bolund & Hunhammar, 1999) and
sediment retention and accumulation due to aquatic vegetation, nutrient cycling,
biodiversity and genetic resources.

31
4 Analysis and results
As described above, the subject lakes both provide various ecosystem services, some
of which are economically valued in the present study, others are not. The MEA
classification of ecosystem services is applied in this study and the focus is on the
service categories of inland water systems. For services derived from inland water
systems, the categorization is as follows:
• Provisioning services; such as food, freshwater, fiber and fuel, biochemicals,
genetic material and biodiversity. In the present study the value of Lake
Elliðavatn as a reservoir for electricity production is assessed.
• Regulating services; such as climate regulation, hydrological flow, pollution
control and detoxification, services related to prevention of erosion and natural
hazards services. In the present study the value of the potential pollution
dilution and eviction capacity of Lake Elliðavatn is assessed.
• Cultural services; such as spiritual and inspirational, recreational, aesthetic and
educational. In the present study the recreational and educational services
provided by both lakes were assessed.
• Supporting services; such as soil formation, sediment retention and
accumulation, nutrient cycling and pollination. In the present study the
supporting services provided by Lake Elliðavatn for the Elliðár River were
assessed.
(Aladin, et al., 2005)
Each of the service categories is addressed in some aspect for Lake Elliðavatn
and Lake Vífilsstaðavatn. The analysis is divided into four main sections according to
the classification categories. In each section an assessment of the ecosystem services
provided and an economic evaluation are carried out. Generally, the sections consist
of four parts; services definition, valuation methods, data collection and results.
However, the structure varies a little, due to the inherent difference of the categories.
The methods applied in the valuation process depend on the nature of the ecosystem
service being valued. For the valuation of provisioning services, market data are used
to derive annual revenue of electricity production from Lake Elliðavatn as a reservoir.
For the regulating services provided by Lake Elliðavatn, market data are also used but

32
the cost invested in infrastructure is converted from a single investment to an annual
value. The cultural services section is divided into two sub-sections; educational
services and recreational services, which are both assessed and economically valued.
To value the educational services official cost data are used to value time spent on site
by students in elementary and high schools. The recreational value is estimated
through a single-site travel cost model. The supporting services part is different from
the other parts because, as was explained in section 2.6, their benefits are generally
indirect. Thus, most of the supporting services are not valued economically but are
instead listed and described. However, in the last part of the supporting services
section, the economic view is presented. Because Lake Elliðavatn provides essential
supporting service for the Elliðaár River, an economic valuation is carried out for the
factor income of the lake on the salmon yield of the river.
Overall, the study is made as a point-in-time measure of the value of goods and
services provided by the lakes, in terms of annual value. The annual average consumer
price index was used to convert all values to constant ISK 2009 values. For the
evaluation of the provisioning services, regulating services data from 2007 are used,
for the educational services data from 2008 are used and for the recreational- and
supporting services data from 2009 are used.
4.1 Provisioning services
4.1.1 Services definition
Provisioning services are the products people obtain from ecosystems, such as food,
fuel, fiber, fresh water, and genetic resources. This services category can be divided
into two parts; the consumptive and the non-consumptive services. The consumptive
services are products directly consumable by people, e.g. food and fresh water. The
non-consumptive services provide benefits that can be enjoyed by people but not
consumed directly, e.g. fuel and genetic resources. In the case of Lake Elliðavatn, the
main provisioning services are two. First there is the non-consumptive service which
is the electricity production supported by the lake as a reservoir. Second, there is the
consumptive service of the lake, the fish production. Three fish species are fished by
recreational fishermen in the lake, the two trout species and the salmon. The main
catch of the lake is the Brown trout and the Arctic char. The abundance of the Arctic

33
char stock in Lake Elliðavatn has been retreating since the latter part of the eighties.
This has come forth in the annual experimental fishing done by the Institute of
Freshwater Fisheries where the share of the Arctic char in total catch per unit effort
has been decreasing over the last two decades. In 2007 a little less than 10% of the
total catch was Arctic char (Antonsson, Árnason, & Guðjónsson, 2008). Salmon is
mostly fished in the rivers that run to and from the lake but a few can be caught in the
lake in autumn as it migrates (Árnason & Antonsson, 2005).
In the case of Lake Vífilsstaðavatn, the provisioning service provided is
mainly the consumptive fish production of Arctic char and Brown Trout.
4.1.2 Valuation methods
The category of provisioning services was solely addressed by valuing the non-
consumptive services of Lake Elliðavatn, based on the monetary value of the
electricity production. The value of these services was obtained based on the revenue
of the electricity production in Elliðaárstöð in 2007. An important provisioning
service, the fish production of the two lakes was not taken into account for the reason
that people fish mainly in the lakes for recreational reasons, rather than directly
seeking food. This came through in the pilot travel cost survey carried out at Lake
Elliðavatn in summer 2008 and from the author´s personal communication with some
of the recreational anglers. This was also observed in the assessment study made by
Jón Kristjánsson (2003) to assess the fishing intensity of Lake Elliðavatn. Therefore,
since people in general go fishing there mainly for recreational reasons, accounting for
both the food value and the recreational value would be double counting. Thus the
consumptive provision of fish in Lake Elliðavatn and Lake Vífilsstaðavatn, although
valuable, was not accounted for. Furthermore, sufficient data of total fish-catch in
both lakes are lacking. Anglers using day-licenses are required to hand in reports after
their fishing days and the ones using summer-licenses should hand in a report after the
fishing season. However, it is an exception when these reports are handed in, as most
people do not do it. This was clear from the assessment study mentioned above
(Kristjánsson, 2003), where it was stated that only 12% of sold licences in Lake
Elliðavatn came back in as fishing reports. According to reports from the institute of
freshwater fisheries this has not changed and therefore the catch from these lakes is an

34
unknown figure, despite attempts to get significant registration (Antonsson &
Guðbergsson, 2000).
4.1.3 Data collection
For the value of Lake Elliðavatn as a reservoir for electricity production, data on
revenue from electricity produced in 2007 were obtained directly from the company
Reykjavík Energy. All values were converted to ISK 2009.
4.1.4 Results
Table 2 . The total value of electricity production from Elliðaárstöð in 2007 (constant ISK 2009).
Total electricity production of the year 2007
(MWh)
Total revenue (ISK)
3.256 30.665.149
4.2 Regulating services
4.2.1 Services definition
The benefits people obtain from the regulation of ecosystem processes are e.g. climate
regulation, maintenance of air quality, erosion control and water purification. These
kinds of benefits fall under the category of regulating services (MEA, 2005). In inland
water systems the main regulating services identified by the MEA are climate
regulation, hydrological flows, pollution control and detoxification, erosion control
and natural hazards control (Aylward, Bandyopadhyay, & Belausteguigotia, 2005).
These services are often not well recognized as their provision is not obvious. Thus,
their benefits are commonly not recognized until after they have been lost
(Ozdemiroglu, Tinch, Johns, Provins, Powell, & Twigger-Ross, 2006). Only one of
the regulating services from the MEA categorization was considered extensive enough
to be counted for in the valuation study of Lake Elliðavatn; the ability for pollution

35
control and detoxification. For Lake Vífilsstaðavatn services of this category were not
considered extensive enough for estimation and economic valuation.
Climate regulation
In terms of climate regulation, inland water systems serve two important yet
contrasting roles. Firstly they regulate greenhouse gases, particularly CO2 and
secondly they buffer the impacts of local climate change. Also, these ecosystems both
store and release carbon as they sequester carbon in sediments and transport carbon to
the sea (Aladin, et al., 2005). There is substantial evidence which indicates the
majority of the world´s lakes as being net sources of CO2 to the atmosphere (Kling,
Kipphut, & Miller, 1992; Algesten, Sobek, Bergström, Aagren, Tranvik, & Jansson,
2003). A study by Algesten et al. (2003) on the role of lakes in organic carbon cycling
in the boreal zone, demonstrated that on average emissions from lakes were eight
times higher than the sediment burial of carbon. The study was performed for all lakes
and rivers in 21 water catchments covering an area of 316 100 km2 in the boreal zone
of Scandinavia. In that context, the role of climate regulation of Lake Elliðavatn and
Lake Vífilsstaðavatn is quite uncertain, could even be a cost rather than a benefit.
However, further data were not available on this subject, thus this service was not
accounted for.
Pollution control and detoxification
Regarding pollution control and detoxification, it is known that natural systems are
able to store and recycle certain amounts of organic and inorganic human waste
through dilution, assimilation and chemical re-composition (de Groot, Wilson, &
Boumans, 2002). That ability then depends on the properties of both the waste and the
ecosystem itself. There are mainly two types of ecosystem processes that enable the
reduction of concentration or impact of waste in an environment over time. There are
a) processes that act to change waste into less toxic forms and b) processes that move
and transport wastes (Hinga, Batchelor, Ahmed, & Osibanjo, 2005). The reduction of
waste concentration in water is a result of two processes: dispersion (dilution by
mixing into larger volumes of water) and advection (water moving downstream). Both
these processes reduce the concentration of the waste at its point of entry in the
ecosystem (Hinga, Batchelor, Ahmed, & Osibanjo, 2005). It has been stated that, due
to rapid water exchange, Lake Elliðavatn is tolerant when it comes to pollution

36
(Þórðarson, 2003). Thus, dispersion and advection is a service readily provided by
Lake Elliðavatn as the lake takes in pollution from the surrounding area and should,
due to relatively rapid water exchange, dilute it and bring to the sea fairly quickly.
However, as the lake is divided into two or even three parts in terms of depth, shape
and locations of in- and out-flux, the water exchange rate is unlikely to be the same
for all parts of the lake (Malmquist, Ingimarsson, & Ingvason, 2004).
In addition to the provision of dispersion and advection services in Lake
Elliðavatn, both Lake Elliðavatn and Lake Vífilsstaðavatn comprise a relative
abundance of aquatic plants. Such plants, aquatic macrophytes, probably play a role in
the waste regulating processes of the lakes. Henrik W. de Nie (1987) stated that the
presence of aquatic macrophytes can strongly affect the physical environment in the
water. It is widely acknowledged that vegetation in some inland water systems is able
to remove high levels of nutrients, especially phosphorus and nitrogen. Furthermore,
there are many wetland plants that can play a critical role of removing different
chemical pollutants derived from some industrial activities (Aladin, et al., 2005).
Also, plant roots and underground stems help to prevent resuspension of sediments
from the lake bottom (Environmental, 2008).
In the first part of the 20th century there used to be farming at Lake Elliðavatn.
The density of summerhouses and later residential areas in the water catchment area
has been increasing exponentially over the last century and until today. In addition,
the heavily travelled road Suðurlandsvegur is in the water catchment area (Malmquist,
Ingimarsson, & Ingvason, 2004). Urban areas are a big source of easily degradable
organic matter, which in high concentration can deplete the oxygen content in water
due to microbial activity. Storm water in urban areas can also transport pollutants
including salt, fine sediments, petrochemicals and various other toxic compounds
including pesticides used in private gardens (Friberg, 2007). Considering these facts,
it is reasonable to conclude that Lake Elliðavatn, with its regulating processes, has
provided considerable benefits to the local society through regulating services.
4.2.2 Valuation methods
For the regulating services the defensive behavior method was applied. The
municipality of Kópavogsbær, which represents most of the residential areas adjacent
to the lake, has already gone into some operations and more are foreseen, to prevent

37
storm water pollution from the residential areas and roads to enter the lake. By
spending money on these operations, the municipality has revealed a defensive
behavior as described in section 2.5. However, it shall be noted that these operations
can also be considered a replacement cost. The constructions replace a regulating
service provided by the lake, thus the value of the regulating service could in fact be
assessed by either of these methods, defensive behavior or replacement cost. This is
merely a matter of definition and the results would be the same. In the present study it
was determined to go by the defensive behavior approach.
As has already been described, the water exchange of the lake is rapid and the
pollution from adjacent areas could readily be received by the lake, diluted and
removed from the area to the sea. However, with increasing population pressure, that
is, if the lake would take in all the pollution unimpeded, it would put the whole
ecosystem of the lake at risk. Consequentially, all the cultural services provided by the
lake would be risked as well. This can be seen as a tradeoff between the provisioning
of two possible ecosystem services. In fact the stand has already been taken.
Authorities and the municipalities have gone into operations to prevent polluting Lake
Elliðavatn thereby, revealing a willingness to pay to preserve the lake´s ecosystem
which again provides other important services. The estimated cost of all the operations
to prevent pollution reaching the lake, both the already done and those expected, was
used as a measure to estimate the value of the regulating services of the lake.
4.2.3 Data collection
The municipality of Kópavogur represents most of the residential areas in the water
catchment area of the lake. The operations made to prevent pollution from these areas
to enter the lake were twofold;
1. The building of a big pipeline which lies beneath the residential area, along
the shore of Lake Elliðavatn (figure 5).
2. A sedimentation pond, on the other side of the river Dimma, where the
water exits the lake. That sedimentation pond is then supposed to receive
the surface water from the pipeline for dilution (figure 6)

38
Figure 5. The pipeline constructed to receive stormwater from the adjacent residential area. The broken line represents the pipeline and the colored area represents residential area. Source: Mannvit.
The pipeline has already been constructed but the sedimentation pond has yet
to be made. So far, the surface water from the pipeline still enters the lake untreated at
the outflow where Dimma begins and is washed away with the rivers. The estimated
costs of the pipeline, the pending sedimentation pond and annual running costs were
obtained from the engineering firm, Mannvit which was responsible for the operations
on behalf of the municipality of Kópavogur. Since the pipeline was constructed over a
long period, accurate numbers were not available (Brynjólfur Björnsson, personal
communication, December 18, 2009) and therefore the values are a rough estimate in
ISK 2009. The values were converted from 2007 values to constant 2009 values.

39
Figure 6. The site intended for the pending sedimentation pond which will receive the stormwater from the pipeline for treatment before letting it into the Elliðaár River. Source:Mannvit
4.2.4 Results
To arrive at an annual cost the investment cost was converted to uniform series
amount for the lifetime of the constructions by using equation 14.
Equation 14 U = P· [ ]
(Rubin & Davidson, 2001)
Here U denotes the annual cost, P denotes the present value of investment cost, i
denotes the discount rate and n denotes the lifetime of the construction. The discount
rate applied was 5%.
For the pipeline the estimated investment cost is ISK 188.204.238 –
250.938.984. The estimated annual running cost is 0,5% of the investment cost as the
pipeline may get clogged, solids may accrue in it which need to be cleaned and spare
parts may need to be renewed. The annual running cost is then ISK 941.021 –
1.254.695 (Brynjólfur Björnsson, personal communication, December 18, 2009). The
results for the pipeline are presented in table 3 below.

40
Table 3. The total defensive cost of the pipeline (constant ISK 2009).
Upper bound Lower bound
Total investment cost 250.938.984 188.204.238
Annual investment cost 12.973.333 9.729.999,7
Running cost 1.254.695 941.021
Total cost 14.228.028 10.671.021
For the sedimentation pond the estimated investment cost is ISK 125.469.492 -
188.204.238. The estimated annual running cost is 2% of investment cost for things
such as mechanical equipment and water exchange. The annual running cost is then
ISK 2.509.390 – 3.764.085 (Brynjólfur Björnsson, personal communication,
December 18, 2009). The results for the sedimentation pond are presented in table 4
here below.
Table 4. The total defensive cost of sedimentation pond (constant ISK 2009).
Upper bound Lower bound
Total investment cost 188.204.238 125.469.492
Annual investment cost 13.353.553 8.902.368,8
Running cost 3.764.085 2.509.390
Total cost 17.117.638 11.411.759
The total annual cost for both the pipeline and the pending sedimentation pond in
2009 are in the range of ISK 22.082.780 – 31.345.666.
4.3 Cultural services
According to the MEA, cultural ecosystem services are defined as “the non-material
benefits people obtain from ecosystems through spiritual enrichment, cognitive
development, reflection, recreation, and aesthetic experiences” (MEA, 2005). Natural
ecosystems provide people with numerous possibilities of spiritual enrichment, mental
development and leisure. In his book, Winifred Gallagher (1993) points out that as the

41
longest period of human evolution happened within the context of undomesticated
habitat, human sense for learning and well-being is robustly linked to the experience
of natural landscapes and species diversity (Gallagher, 1993). Furthermore, it is
evident in art, religion and traditions of diverse cultures how deeply people appreciate
natural ecosystems. Other activities such as gardening, pet-keeping, nature
photography and film-making, bird-feeding and watching, hiking, camping,
mountaineering, river-rafting, boating, fishing and hunting all testify on the
importance of man´s relationship with nature. Nature, with its ecosystems and species,
is for many a unique source of astonishment and inspiration, peace and beauty,
fulfillment and rejuvenation. (Daily, et al., 1997). In this sense, nature is a source of
inspiration for different disciplines and makes various opportunities for education and
research available and is essential as such (de Groot, Wilson, & Boumans, 2002). The
benefits derived from cultural ecosystem services are various and although they may
be less tangible than material services, they are nonetheless highly valued by people in
all societies (Hefny, Pereira, & Palm, 2005). Since their benefits are mostly based on
personal experiences e.g. spiritual, inspirational and aesthetic, they are not easily
valuable in an economic sense. Information about such services and valuation
methods are therefore not easily accessible and were not addressed particularly in this
study. Yet, the economic value of these services should partly come through the
overall existence and recreational value of the ecosystem of Heiðmörk which is
currently being estimated. In this study, however, both recreational and educational
services of the two lakes were valued. Following is a more detailed definition of these
services and a description of the methodology applied.
4.3.1 Recreational services
4.3.1.1 Services definition
Lake Elliðavatn and Lake Vífilsstaðavatn provide recreational services mainly
through recreational angling. In this study, and discussed below, a single-site travel
cost method was applied to assess the values of those services. Access to such natural
ecosystems or relatively unspoiled nature for recreation is an important factor in the
lives of many people. In today´s society a great focus is put on materialism. The
consequence is speed and stress and the majority of people´s time is occupied by

42
work, both at the workplace and at home. Having a natural place, where people can
come for relaxation, refreshment and recreation, in the vicinity of cities and urban
areas is therefore very valuable to many people. Aesthetic qualities and miscellaneous
landscapes, such as those surrounding Lake Elliðavatn and Lake Vífilsstaðavatn,
provide various possibilities of other recreational activities than fishing, such as
walking and picknicking. The benefits people obtain from recreation in a natural
environment contribute to their health and well-being as there is a correlation between
green areas, good air quality and human health (McMichael, Scholes, Hefny, Pereira,
& Palm, 2005). In addition to the personal benefits of users, the conservation of
natural ecosystems for recreational purposes inevitably has some economic benefits
for the society, e.g. through better health of people which consequently are a better
work force and through generated income. However, estimating the social economic
benefits of recreation and natural ecosystem through the health and performance of
employees would require an extensive research which is beyond the scope of this
study.
4.3.1.2 Valuation methods
At Lake Elliðavatn fishing licenses are sold to recreational anglers. In the fishing
season of 2009, anglers had the option to buy a day license for 1200 ISK or a summer
license for 13500 ISK which allows unlimited access to the lake for the whole season.
For the elderly, disabled people and children of the municipalities of Reykjavík and
Kópavogur the municipalities pay for the access. These groups must report to the
fishing guards where they register but do not pay themselves. At the end of the season
the municipalities pay for the fishing license cost of these groups with a 10% quantity
discount. This subsidization by the municipalities affects the demand curve of those
who enjoy the subsidized access fees. If the same people would have to pay access fee
they would maybe come less frequently. When accounting for this group the access
fee is simply excluded, then the amount paid by the municipalities is not added to the
total access value of the lake as it should come in through the modified demand curve
of the subsidized group.
Accounting for discounts such as for the summer license holders is difficult
and usually ignored in travel cost studies (Parsons, 2003). Due to this system the cost
paid by summer license holders can not be included in the actual travel cost study. Yet

43
they pay an amount for the use of the lake and it was not considered to be justifiable
to leave it unaccounted for. Thus, the total cost paid by summer license holders was
added to the access value of Lake Elliðavatn found with the travel cost method,
thereby arriving at a total value of the recreational services of Lake Elliðavatn.
The travel cost model
The fundamentals of the travel cost method were described in chapter 2.5.1. It is a
revealed preference method based on observed behavior and therefore estimates only
use values. Travel cost models can be separated in terms of single-site or multiple site
models, depending on the aim of the study in question. As the aim here was to
estimate the total use, or “access value” of the lakes, a single-site model was applied
to each lake separately. A single-site model reveals a downward sloping demand
function where number of trips to the site equal the “quantity demanded” and the price
is the trip cost of reaching the site. Variation in price is generated by observing people
that live at different distances from the site with low price for people living close to it
but high for those living far away. The demand function slopes downward if trips
decline with distance to the site (Parsons, 2003). The travel cost model has two basic
approaches depending on the definition of the dependent variable. These are the
“individual” and “zonal” models. In its original form the travel cost model was a zonal
model where concentrated circles are formed around the destination site and a given
zone implied a given distance, hence a given travel cost. In the zonal approach the
dependent variable is the number of visits made from a particular zone during a
certain period. It is based on means within each zone assuming that behavior, income
and other factors within the zone are identical (Haab & McConnel, 2002). This
imposes a problem and the zonal model has actually fallen out of favor because the
individual characteristics which affect the demand curve are lost by using zonal
means. However the zonal model can provide a useful approximation when data are
limited (Parsons, 2003). The individual approach uses individual data. It requires a
visiting number of one or more per visitor during a season/year. If everybody visits
the site only once, it creates a problem which is commonly solved by using zonal
method (Gurluk & Rehber, 2008). Provided with sufficient data the individual model
was applied in the present study.
The model applied is a demand model for trips to the lake in question by
individuals during the fishing season. The total cost is the sum of all costs involved in

44
the individual´s trip to the site, including travel expenses and total opportunity cost of
time. A negative relationship between the number of trips and the trip cost is expected
as in any demand function. But other factors than trip costs that can affect the demand
for recreation trips, such as income, age, etc. are also included. The model then looks
like this:
Equation 15 r = f(tc, y, z)
where r is number of trips, tc is trip cost, y is income and z is a vector of demographic
variables believed to influence the number of trips. Substitute sites are something that
can also be incorporated into such a model. If an individual lives near another
recreation site the number of trips to the site of interest are likely to decline as the
individual substitutes trips away from it to the other site instead (Parsons, 2003).
However, in the present study the scope of the study was limited to the subject lakes,
not accounting for substitute lakes. A linear version of the model is:
Equation 16 r = α + βtctc + βyy + βzz
where the α is the constant and the βi´s are the coefficients to be estimated.
In figure 7 here above the area under the demand curve f(tc,y,z) represents the
value of access to the site. When an individual faces a trip cost of tc1 he or she takes r1
trips to the site. The choke price tcchoke is when the price is too high so that the number
of trips falls to zero. The area marked by A represents the individual´s consumer
tcchoke
A
B
tc1
r1
f(tc,y,z)
tc0
Figure 7. Access value in a Linear Single-site Model

45
surplus for the trips to the site during the season. Area B represents the total trip cost.
Mathematically the access value of the site (A+B) can be calculated by:
Equation 17 , ,
The basic count data travel cost model is estimated by a Poisson regression.
The number of trips taken by a person to a site in a given season is assumed to be
generated by a Poisson process. The Poisson distribution approaches the normal
distribution as its parameter increases. The most popular specification also lets the
Poisson parameter equal the conditional mean of the dependent variable. Therefore
the benefits of using a Poisson or Poisson based estimator are likely to be greatest
when the mean of the dependent variable is not large (Creel & Loomis, 1990). The
probability of observing an individual taking r trips in a season is:
Equation 18 Pr !
where the parameter λ represents the expected number of trips and is assumed to be a
function of the variables specified in the recreational demand model. It is both the
mean and variance of r. To prevent negative probabilities λ usually takes a log-linear
form:
Equation 19 ln(λ) = βtctcr + βyy + βzz
which is the Poisson form of the recreation demand specified above. In the Poisson
model the, access value S, or aggregated per-trip value, for each person has an explicit
form:
Equation 20
where n denotes the individual. Thus to arrive at an average per-trip-per-person value
t, the per-person seasonal value is divided by number of trips:
Equation 21
(Parsons, 2003)

46
4.3.1.3 Data collection and model
Sampling strategy
The sites valued are Lake Elliðavatn and Lake Vífilsstaðavatn in terms of recreational
fishing. The season for Lake Elliðavatn is approximately 18 weeks, from 1st of May to
15th of September. For Lake Vífilsstaðavatn the season is approximately 22 weeks,
from 1st of April to 15th of September.
The sampling strategy applied was on-site sampling where anglers were asked
to fill out a written survey. The sampling began in June 2008 and at that time the
season in both of the lakes had already long begun. According to the staff at the sites
both lakes are most visited during the first two months of the season. That is possibly
related to the fact that these are among the first sites to open for fishing in spring and
they are in the vicinity of the capital area. Salmon fisheries in rivers commonly begin
the 15th of June each year and many of the anglers go elsewhere at that time. Thus the
summer of 2008 was used as a pilot survey to develop the sampling strategy. The pilot
sampling at Lake Elliðavatn began the 24th of June 2008. The fish guards and license
sellers were asked to hand the surveys out to all anglers and ask them to bring them
back at the end of the fishing day. The response rate was low, 27 went out and 3 came
back. The next step was to give out envelopes and stamps and ask people to mail the
surveys even though the response rate for mail surveys is known to be lower than for
other modes of administration. (Champ, 2003). The return rate was still very low so a
decision was made to have the anglers filling out the surveys on site, before they went
fishing. This meant that people had to estimate themselves the time spent on site
possibly causing a certain bias. However this gave a much better success with 38
surveys given out and answered so it was determined to be necessary to use this
method for the final survey to get a sufficient sample. The final survey was then
executed during the fishing season of 2009.
On-site sampling has certain advantages and disadvantages which should be
noted. A good advantage is that the target population is hit directly and every
individual interviewed has visited the site. However, when the sampling is on-site the
people who don´t visit the site are excluded. This means that there are no observations
taking zero trips which affect the accuracy of the “choke price” for the demand
function (Parsons, 2003). This is a selection bias which must be corrected for in the
assessment. Since the surveys only intercepted individuals at the lakes, the entire

47
population was not sampled and thus the data was truncated in the statistical analysis
to correct for this bias. Individuals truncated from the sample include those who either
did not visit the subject lake during the season of 2008 or individuals who never visit
the lake (Sohngen, Lichtkoppler, & Bielen, 2000). Another issue concerns a bias of
more frequent users. When a person visits ten times more often than someone else,
that person is ten times more likely to be sampled than someone visiting the site only
once. This is called endogenous stratification and can introduce a bias into the
estimation of demand coefficients that may need to be corrected for (Parsons, 2003).
However, in the present study such an error was not anticipated because each angler
was only surveyed once.
In the sampling process for Lake Elliðavatn an interviewer was placed on-site
for the whole month of May to survey the recreational fishers. Children under 18 were
excluded from the survey as they generally do not incur cost directly. By fully
sampling the month of May, the majority of all users were surveyed as the attendance
is by far the highest in May. For example, most of the summer license holders buy
their licenses during that month. Each angler was only surveyed once. As the fishing
season goes by, paying anglers reduce their attendance but non-paying anglers
become more frequent. The proportion of licenses paid by the municipalities increased
from 21% in the first two months to 54% at the end of the season on 15th of
September. In June the overall attendance starts decreasing. But for further sampling
an interviewer was situated on-site at ten random shifts. Also, the fishing guards
occasionally had people fill out surveys. The total sample of filled out surveys was
269.
At Lake Vífilsstaðavatn there is a different system for angling licenses. There,
recreational anglers can either buy day licenses at the GKG golf club near the lake or
buy a certain fishing license pass that allows access to 31 lakes around Iceland (isl.
veiðikortið). People using this license are yet required to report at the golf club and
register. In the fishing season of 2008 when the sampling strategy was being
developed it became clear that almost nobody buys day licenses and almost none of
the license keepers register at the golf club. As supervision of fishing in the lake is
little people do not feel obliged to register or buy licenses. This made the sampling a
bit more complicated as it was not possible to have people filling out surveys before
they went fishing. This was tried but not a single survey was filled out in 2008. The
season starts 1st of April and it was decided to carry out the final survey in April,

48
2009. An interviewer was placed on-site during 8 random shifts in April at Lake
Vífilsstaðavatn to survey people. 72 surveys were filled out in 8 days. To monitor
further the usage of the lake, 15 random times during the season were observed and
the anglers fishing each time counted. The total sample of filled out surveys was 72. Survey design
The survey was roughly divided into four parts. The first part on the first page was
solely introductory material where the study was introduced, its purposes, the parties
concerned and noted that the survey was anonymous. The second part consisted of trip
count questions regarding the frequency of angler´s visits to the subject lake. Parsons
(2003) pointed out that asking people about the number of trips made last season can
lead to a bias caused by a recall error as people may not remember accurately how
many trips they took a year ago. However, by using this method, it still gave an idea
of the number of trips per person which then could be compared to total visits to the
lake throughout the whole season. The third part of the survey concerned the trip of
the day, that is, time spent on site, mode of transport, equipment cost, the type of
license and the purpose of the trip. In similar studies, people are sometimes asked
about the last trip to get for example the correct time spent on-site (Parsons, 2003).
Since some of the people were coming for the first time and many were coming for
the first time that season, it was decided to ask people instead about the trip of the day
even though time spent on-site had to be estimated and catch numbers were excluded.
The data from this part are used to construct the trip cost and possibly also create
other explanatory variables in the demand model. A question on multi-purpose trips
was in this section where people had the opportunity to weigh proportionally the
importance of the fishing trip if it was not the only purpose. The fourth and last part of
the survey was on the “demand shifters” or demographic/household characteristic
variables such as number of people in household, income, name of street (to measure
distance), age, gender, marital status, participation in labor market and level of
education. A copy of the final survey can be found in annex 1.
Measure of trip cost
After assembling and organizing the data, the trip cost to the site was estimated. As
not everybody pays access fees, the access fee was only taken into the individual total
travel cost for those who paid it, for the rest it was zero. The majority of trips to both

49
of the lakes were made by car. The travel cost was measured by assessing the average
cost of operating a vehicle per kilometer in urban areas from a report made by the
engineering firm Verkís (2009). According to this report the cost per driven kilometer
in an average private vehicle is 24,7 ISK. These costs include fuel, upkeep and
depreciation. The distance driven was found by using the mapping site on the
webpage; www.ja.is. Measuring points were made from the streets of respondent´s
residence to the lakes. Departing points were taken from the end of the street in
question or, if it was open in both ends, from the middle of the street. At Lake
Elliðavatn the destination point was the parking space were licenses are sold but at
Lake Vífilsstaðavatn the destination point was between the two main parking spaces
at the lake. The mapping site then measures the shortest driving distance between
these points. For the roundtrip the distance was multiplied by two. The cost per
kilometer was then multiplied with roundtrip distance to arrive at trip cost.
Equipment cost is sometimes accounted for in travel cost models. However, it
is difficult to estimate and is generally a negligible portion of the trip cost when the
full equipment cost is divided with its lifetime (Parsons, 2003). Fishing gear may have
a very long lifetime and it is highly unlikely that it is used only for Lake Elliðavatn or
Lake Vífilsstaðavatn. Thus, equipment cost was not accounted for when estimating
the individual travel cost in the present study.
Estimating the time cost of the trip probably is the biggest issue in travel cost
modeling. The time lost while travelling to and from the site and time spent on the site
represent time that would otherwise have been devoted to other activities. Thus, the
visitor to a site does not only sacrifice cash costs in travelling to the site but also the
opportunity cost of using the time in an alternative manner. The value of this time is
called the opportunity cost of time and is recognized by economists as an important
determinant of the demand for the recreational site. There are different approaches
available for time valuation. Wage-based applications are well known where it is
common to use some fraction of the imputed wage, anywhere from one-third of the
wage to full wage as the value of time (Bockstael, Strand, & Hanemann, 1987;
Parsons, 2003; Amoako-Tuffour & Martinez-Espineira, 2008). The key question is
which proportion of the wage rate should be used as a proxy for the opportunity cost
of time. One third, or 33%, is a commonly chosen fraction which represents the lower
bound and thereby it is attempted to prevent overestimation of time costs (Amoako-
Tuffour & Martinez-Espineira, 2008; Hellerstein & Mendelsohn, 1993; Englin &

50
Cameron, 1996; Coupal, Bastian, May, & Taylor, 2001; Bin, Landry, Ellis, &
Vogelsong, 2005; Hagerty & Moeltner, 2005; Gurluk & Rehber, 2008). The same
fraction was applied in time cost estimation for the model of this study. To estimate
the time cost people were given five classes of annual disposable income to choose
from. The average expected annual disposable income for each group was then
calculated in terms of a gamma distribution. For the hourly wage the total expected
household income was divided by 1760 hours, a number of annual working hours
accounting for all holidays and sickness days (Sveinbjörn Sveinbjörnsson, certified
public accountant, personal communication, November 10, 2009). This may introduce
an error into the estimate as some individuals work more and some work less in any
given year and some households have more than one wage earner. But by using the
estimate of one third fraction of hourly wage rate the effects of this bias may be
reduced (Sohngen, Lichtkoppler, & Bielen, 2000). Thus, to arrive at the total time cost
of the trip 0.33 was multiplied with hourly wage, number of adults in the car and total
time spent for both driving and recreation.
Model estimation
The number of trips taken in the last season was modeled as the dependent variable of
the regression. In their responses to the question on the number of visits during last
season people would commonly give a range of visits such as “10-15 times”.
Therefore, an analysis was done separately for the upper and lower limit of visits,
represented by TRIPH (upper limit) and TRIPL (lower limit). To the question of
intended time spent fishing it was also common to have answers given in ranges such
as “2-4 hours”. Thus, when calculating the time cost, there were also upper and lower
limits. The total trip cost, including both cost of driving and time cost, was
represented by MAXCOS (the upper limit) and MINCOS (the lower limit). In the
regression the two lower limits and the two upper limits were regressed together in
separate regressions to arrive at an interval of a lower bound and an upper bound
recreational value. The sign on the trip-cost variable was expected to be negative,
according to travel cost theory, as number of trips should decrease when travel cost
increases. Five other independent variables were selected for model specification:
CATCH which denotes the number of fish caught in the last season. It was expected
to have a positive impact on number of trips as anglers who fish more are likely to
take more frequent trips. However this can be a bi-causal variable as it is also likely
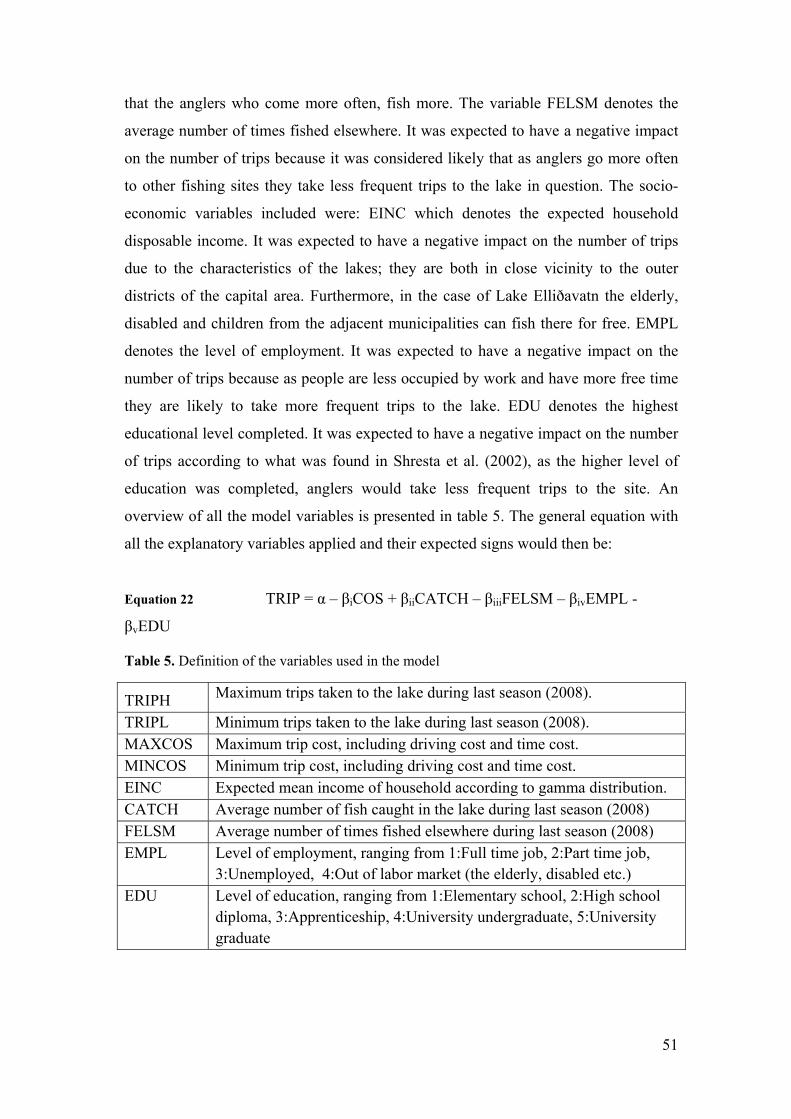
51
that the anglers who come more often, fish more. The variable FELSM denotes the
average number of times fished elsewhere. It was expected to have a negative impact
on the number of trips because it was considered likely that as anglers go more often
to other fishing sites they take less frequent trips to the lake in question. The socio-
economic variables included were: EINC which denotes the expected household
disposable income. It was expected to have a negative impact on the number of trips
due to the characteristics of the lakes; they are both in close vicinity to the outer
districts of the capital area. Furthermore, in the case of Lake Elliðavatn the elderly,
disabled and children from the adjacent municipalities can fish there for free. EMPL
denotes the level of employment. It was expected to have a negative impact on the
number of trips because as people are less occupied by work and have more free time
they are likely to take more frequent trips to the lake. EDU denotes the highest
educational level completed. It was expected to have a negative impact on the number
of trips according to what was found in Shresta et al. (2002), as the higher level of
education was completed, anglers would take less frequent trips to the site. An
overview of all the model variables is presented in table 5. The general equation with
all the explanatory variables applied and their expected signs would then be:
Equation 22 TRIP = α – βiCOS + βiiCATCH – βiiiFELSM – βivEMPL -
βvEDU
Table 5. Definition of the variables used in the model
TRIPH Maximum trips taken to the lake during last season (2008).
TRIPL Minimum trips taken to the lake during last season (2008). MAXCOS Maximum trip cost, including driving cost and time cost. MINCOS Minimum trip cost, including driving cost and time cost. EINC Expected mean income of household according to gamma distribution. CATCH Average number of fish caught in the lake during last season (2008) FELSM Average number of times fished elsewhere during last season (2008) EMPL Level of employment, ranging from 1:Full time job, 2:Part time job,
3:Unemployed, 4:Out of labor market (the elderly, disabled etc.) EDU Level of education, ranging from 1:Elementary school, 2:High school
diploma, 3:Apprenticeship, 4:University undergraduate, 5:University graduate

52
4.3.1.4 Results – Lake Elliðavatn
Descriptive statistics
Out of anglers surveyed, 95% were men and 5% women. The average age of
respondents was 43,4 years. Most of the time, or in 50% of the cases observed, anglers
came alone. In 40% of the cases they came two together and in 10 %, three or more.
Children were only present in 22% of the total cases, which indicates that fishing in
Lake Elliðavatn is not primarily a family sport. Regarding multipurpose trips, 99% of
respondents stated that the trip had not been a multipurpose trip, thus the surveys with
multipurpose trips were excluded from the model. The educational level varied
considerably between respondents. 21% had completed elementary school, 8% had
completed a highschool diploma, 26% had completed an apprenticeship, 15 % had
completed some undergraduate studies from university and 30% had completed
graduate studies from university. The average expected disposable income of
respondents was 5.327.153 ISK. 67% of respondents fished on a regular day-license,
21% on a day-license paid by the municipality and 12% had summer-licenses. When
asked about what they do with the fish they catch, 60% answered that they keep all the
catch, 34% release a part of the catch and 6% release all the catch. One question in the
survey dealt with environmental quality where anglers were asked about the effect of
increasing proximity of residential areas to Lake Elliðavatn. 47% answered that
increasing proximity of residential areas would not affect their fishing frequency. 39%
answered that it was rather or very likely that their visits would dwindle. 14%
answered rather or very likely that they would increase their visits. 99% of anglers
came to Lake Elliðavatn by car.
Economic value
The recreational fishing trip demand models were estimated using truncated Poisson
model in the econometric software LIMDEP. The values for overdispersion in the
Poisson model were 2,725 and 3,084 which is under the critical value of 3,84 thus it
was not necessary to use a less restrictive model such as the Negative binomial
(Greene, 2007)
The preliminary results from the first run of the model gave a significant
constant at the 5% level for both upper and lower limit. The sign on travel cost,
MAXCOS and MINCOS was negative, as expected, and significant in both cases

53
which is consistent with Creel and Loomis (1990), Sohngen et al. (2000) and Shresta
et al. (2002). This is the main result of the recreation demand model, that anglers take
fewer trips as travel cost increases. The coefficient on income, EINC, was positive
and significant in both cases, indicating that anglers with higher income take more
frequent trips to the lake. The coefficient on CATCH was positive and significant as
expected for both upper and lower limit. This may indicate that anglers able to harvest
more fish take more frequent trips, although as already pointed out it may be the other
way around. The coefficient on FELSM, the frequency of anglers fishing elsewhere
during the last season was negative as expected. However it was only significant for
the lower limit, not the upper limit. The coefficient on EMPL was positive as expected
and significant. This indicates that anglers who have less than a full time job take
more frequent trips to Lake Elliðavatn than the ones with a full time job. This is not in
accordance to the income variable as it must be considered likely that people with full
time jobs have higher income than others. However, the employment coefficient was
of low significance thus it is possible that the employment and income are too
collinear for the independent estimation of the effect of employment. The sign on
EDU was positive and significant for both upper and lower limit. This indicates that
anglers with higher education are likely to take more frequent trips to the lake. This is
not as was expected and seen in Shresta et al (2002) but goes along with the income
variable as it would be expected that income is likely to increase with higher
education. In total 269 anglers were surveyed. Out of the total responses 164 or 61%,
were usable for this travel cost demand estimation. Incomplete essential information
or zero trips during last season were the main reasons for the exclusion of part of the
observations.
The model was run again to get the final equation for recreational demand
where insignificant FELSM variable was eliminated. The results are presented in
tables 6 and 7 below.
Table 6. The results from the final model estimation of the upper bound of travel cost valuation in Lake Elliðavatn.
+---------------------------------------------+| Poisson Regression | | Maximum Likelihood Estimates || | Dependent variable TRIPH | | Weighting variable None | | Number of observations 164 | | Iterations completed 7 | | Log likelihood function -1120.186 | | Number of parameters 6 | | Info. Criterion: AIC = 13.73397 |

54
| Finite Sample: AIC = 13.73724 || Info. Criterion: BIC = 13.84738 | | Info. Criterion:HQIC = 13.78001 | | Restricted log likelihood -1262.094 | | McFadden Pseudo R-squared .1124388 | | Chi squared 283.8167 | | Degrees of freedom 5 | | Prob[ChiSqd > value] = .0000000 | +---------------------------------------------+ +---------------------------------------------+ | Poisson Regression | | LEFT Truncated data, at Y = 0. | | Chi- squared = 2850.41677 RsqP= .0682 | | G - squared = 1667.17540 RsqD= .1410 | | Overdispersion tests: g=mu(i) : 2.752 | | Overdispersion tests: g=mu(i)^2: 2.109 | +---------------------------------------------+ +--------+--------------+----------------+--------+--------+----------+ |Variable| Coefficient | Standard Error |b/St.Er.|P[|Z|>z]| Mean of X| +--------+--------------+----------------+--------+--------+----------+ Constant| 2.45983738 .04683339 52.523 .0000 MAXCOS | -.811849D-04 .831598D-05 -9.763 .0000 5232.74681 EINC | .331458D-07 .960561D-08 3.451 .0006 .513581D+07 CATCH | .00208976 .00021708 9.627 .0000 -4.18292683 EMPL | .00250721 .00119831 2.092 .0364 -4.35975610 EDU | .00102706 .00033159 3.097 .0020 -8.90853659
Table 7. The results from the final model estimation of the lower bound of travel cost valuation in Lake Elliðavatn.
+---------------------------------------------+| Poisson Regression | | Maximum Likelihood Estimates | | Dependent variable TRIPL | | Weighting variable None | | Number of observations 164 | | Iterations completed 7 | | Log likelihood function -1291.548 | | Number of parameters 6 | | Info. Criterion: AIC = 15.82375 | | Finite Sample: AIC = 15.82701 | | Info. Criterion: BIC = 15.93716 | | Info. Criterion:HQIC = 15.86979 | | Restricted log likelihood -1520.257 | | McFadden Pseudo R-squared .1504415 | | Chi squared 457.4195 | | Degrees of freedom 5 | | Prob[ChiSqd > value] = .0000000 | +---------------------------------------------+ +---------------------------------------------+ | Poisson Regression | | LEFT Truncated data, at Y = 0. | | Chi- squared = 3419.56730 RsqP= .1453 | | G - squared = 1999.76983 RsqD= .1829 | | Overdispersion tests: g=mu(i) : 3.131 | | Overdispersion tests: g=mu(i)^2: 2.386 | +---------------------------------------------+ +--------+--------------+----------------+--------+--------+----------+ |Variable| Coefficient | Standard Error |b/St.Er.|P[|Z|>z]| Mean of X| +--------+--------------+----------------+--------+--------+----------+ Constant| 2.58327370 .04373585 59.065 .0000 MINCOS | -.00011632 .860099D-05 -13.524 .0000 4640.08701 EINC | .499097D-07 .883548D-08 5.649 .0000 .513581D+07 CATCH | .00226416 .00019751 11.463 .0000 -4.18292683 EMPL | .00271774 .00123640 2.198 .0279 -4.35975610 EDU | .00108817 .00031127 3.496 .0005 -8.90853659

55
From the results here above, the equations for upper and lower limits of recreation
demand are derived: Equation 23
TRIPH = 2,46 - 0,811·10-4MAXCOS + 0,33·10-7EINC + 0,0021CATCH +
0,0025EMPL + 0,0010EDU Equation 24
TRIPL= 2,58 - 0,00012MINCOS + 0,5·10-7EINC + 0,0022CATCH + 0,0027EMPL+
0,0011EDU
To estimate the average per-trip-per-person surplus value of Lake Elliðavatn, equation
21 from before is applied:
Equation 21
(Parsons, 2003)
The average per-trip value is then multiplied with the number of trips taken to the site
during the season of 2008, a total of 2.133 trips, to arrive at an aggregate value for the
Lake Elliðavatn (tables 8 and 9).
Table 8. The upper bound of per-trip value for Lake Elliðavatn in the season of 2009 (ISK 2009).
Average per trip value t = , = 12.315
Aggregated value 12.315 · 2.133 = 26.267.895
Table 9. The lower bound of per-trip values for Lake Elliðavatn in the season of 2009 (ISK 2009).
Average per trip value t = , = 8.620
Aggregated value 8.620 ·2.133 = 18.386.460
66 summer-licenses were sold at the price of ISK 13500 which gives a total value of
66·13.500 = 891.000
The total access value 2008 then becomes;
lower limit: 18.386.460 + 891.000 = ISK 19.277.460

56
upper limit: 26.267.895 + 891.000 = ISK 27.158.895
As a result, based on the single site individual travel cost method applied here and the
assumptions involved the total recreational access value of Lake Elliðavatn for the
season of 2009 is in the range of ISK 19.277.460 – 27.158.895.
4.3.1.5 Results – Lake Vífilsstaðavatn
Descriptive Statistics
Out of anglers surveyed, 97% were men and 3% women. The average age was 41,6
years. The anglers came alone in 66% of the cases, in 21% of the cases they came two
together and in 9% of the cases they came three or more. Children were present in
20% of the cases. Regarding multipurpose trips, 96 % of respondents stated that the
trip had not been a multipurpose trip, thus the surveys with multipurpose trips were
excluded from the model. The educational level varied considerably, 14% had
completed elementary school, 10% had completed a high school diploma, 37% had
completed an apprenticeship, 21% had completed undergraduate studies from
university and 18% had completed graduate studies from university. The average
expected disposable income of respondents was 6.531.965 ISK. When asked about the
type of fishing license anglers had, 97% percent claimed to have the fishing license
pass that allows access to 31 lakes around Iceland. Only two people claimed to have a
day-license. Regarding what anglers do with their catch, 51% answered that they keep
all the catch, 36% release a part of the catch and 13% release all the catch.
Economic value
The model for Lake Vífilsstaðavatn was estimated the exact same way as for Lake
Elliðavatn. The values for overdispersion in the Poisson model were 2,35 and 2,68. At
Lake Vífilsstaðavatn 72 anglers in total were surveyed and only 46 or 63% of the
responses were useable for the travel cost demand estimation. This is indeed a very
small sample and therefore the calculations are less reliable than for Lake Elliðavatn.
However the results in terms of travel cost are quite similar to those of Lake
Elliðavatn.
The preliminary results from the first run of the model gave both constants for
upper and lower limit significant at the 5% level. The sign on travel cost, MAXCOSV
and MINCOSV were negative as expected and significant in both cases. The

57
coefficients for the rest of the independent variables were not significant which is not
of much surprise concerning the size of the sample. The model was run again to get
the final equation for recreational demand where all the insignificant variables were
eliminated. The results are presented in table 10 and 11 here below.
Table 10. The results from the final model estimation of the upper bound of travel cost valuation in Lake Vífilsstaðavatn
+---------------------------------------------+| Poisson Regression | | Maximum Likelihood Estimates | | Dependent variable TRIPHV | | Weighting variable None | | Number of observations 46 | | Iterations completed 6 | | Log likelihood function -298.1618 | | Number of parameters 2 | | Info. Criterion: AIC = 13.05051 | | Finite Sample: AIC = 13.05658 | | Info. Criterion: BIC = 13.13002 | | Info. Criterion:HQIC = 13.08030 | | Restricted log likelihood -312.3744 | | McFadden Pseudo R-squared .0454986 | | Chi squared 28.42520 | | Degrees of freedom 1 | | Prob[ChiSqd > value] = .0000000 | +---------------------------------------------+ +---------------------------------------------+ | Poisson Regression | | LEFT Truncated data, at Y = 0. | | Chi- squared = 585.61475 RsqP= .1130 | | G - squared = 428.69164 RsqD= .0616 | | Overdispersion tests: g=mu(i) : 2.097 | | Overdispersion tests: g=mu(i)^2: 2.238 | +---------------------------------------------+ +--------+--------------+----------------+--------+--------+----------+ |Variable| Coefficient | Standard Error |b/St.Er.|P[|Z|>z]| Mean of X| +--------+--------------+----------------+--------+--------+----------+ Constant| 2.58850475 .07649296 33.840 .0000 MAXCOSV | -.894155D-04 .191331D-04 -4.673 .0000 3997.83637
Table 11. The results from the final model estimation of the lower bound of travel cost valuation in Lake Vífilsstaðavatn
+---------------------------------------------+| Poisson Regression | | Maximum Likelihood Estimates | | Dependent variable TRIPLV | | Weighting variable None | | Number of observations 46 | | Iterations completed 6 | | Log likelihood function -237.8752 | | Number of parameters 2 | | Info. Criterion: AIC = 10.42935 | | Finite Sample: AIC = 10.43542 | | Info. Criterion: BIC = 10.50886 | | Info. Criterion:HQIC = 10.45914 | | Restricted log likelihood -247.7805 | | McFadden Pseudo R-squared .0399762 | | Chi squared 19.81066 | | Degrees of freedom 1 | | Prob[ChiSqd > value] = .8549752E-05 |

58
+---------------------------------------------++---------------------------------------------+ | Poisson Regression | | LEFT Truncated data, at Y = 0. | | Chi- squared = 387.92704 RsqP= .1031 | | G - squared = 311.92243 RsqD= .0589 | | Overdispersion tests: g=mu(i) : 2.716 | | Overdispersion tests: g=mu(i)^2: 2.883 | +---------------------------------------------+ +--------+--------------+----------------+--------+--------+----------+ |Variable| Coefficient | Standard Error |b/St.Er.|P[|Z|>z]| Mean of X| +--------+--------------+----------------+--------+--------+----------+ Constant| 2.40107617 .08259153 29.072 .0000 MINCOSV | -.844088D-04 .217951D-04 -3.873 .0001 3735.09080
From the results here above, the equations for upper and lower limits of recreation
demand are derived:
Equation 25 TRIPHV = 2,58 - 0,894·10-4MAXCOSV
Equation 26 TRIPLV= 2,4 - 0,844·10-4MINCOSV
The access value of Lake Vífilsstaðavatn is estimated in the same way as for Lake
Elliðavatn. The same equation is used to find an average per-trip-per-person value
which is then multiplied with the total visits to the lake over the season. Since the total
number of visits is not registered for Lake Vífilsstaðavatn, like it is for Lake
Elliðavatn, the total number of visits had to be approximated from observed data. As
already described an interviewer was situated at Lake Vífilsstaðavatn on 8 random
shifts during the month of April where 72 anglers were surveyed, which provides an
observation of 72 visits. . Then, for the rest of the season, 15 random checks were
made where the number of anglers was counted at each time. To approximate a
number of visits, the average visits observed per week-day were multiplied with 18
weeks, the angling season in Lake Vífilsstaðavatn excluding the month of April when
visits were observed. These approximations are presented in table 12.

59
Table 12. Calculated average visits, from 15 random observations, in Lake Vífilsstaðavatn from 1st of May to 15th of September 2009.
Week day Average
visits Average visits/week
day
Friday 1.7 30Saturday 2.5 45Sunday 1 18Monday 1 18Tuesday 1 18
Wednesday 2.5 45
Thursday 5 90
Total visits 264
Total approximated visits to Lake Vífilsstaðavatn during the season of 2009:
264 + 72 = 336
The results for estimated consumer surplus, access value, of Lake Vífilsstaðavatn are
represented in tables 13 and 14.
Table 13. The upper bound of per-trip value for Lake Vífilsstaðavatn in the season of 2009 (ISK 2009).
Average per trip value t = , = 11.186
Aggregated value 11.186 · 336 = 3.758.496
Table 14. The lower bound of per-trip value for Lake Vífilsstaðavatn in the season of 2009 (ISK 2009).
Average per trip value t = , = 11.848
Aggregated value 11.848 · 336 = 3.980.928
It is interesting to see that according to the model, the upper bound of the trip value
gets a lower value than the lower bound. As mentioned in the model estimation
section, the maximum number of trips was regressed against the maximum travel cost
and the minimum number of trips was regressed against the minimum travel cost. The
regression was run this way in the attempt to capture the complete upper and lower
bound of potential recreational value. The reason for the observed result can be
explained by the fact that it is expected that those that visit the lake more frequently

60
have most likely lower overall travel cost, according to travel cost theory. Therefore
the demand curves for the upper and lower bound as assessed in this analysis cross. In
the case of Lake Elliðavatn, the demand curves also cross as the constant for the upper
bound was lower than the constant for the lower bound.
Based on the single site individual travel cost method applied here, the
assumptions involved and the reservation of a very small sample the total recreational
access value of Lake Vífilsstaðavatn for the season of 2009 is on the range of ISK
3.758.496 – 3.980.928.
4.3.2 Educational services
Natural resources such as ecosystems are fundamental for progress in knowledge in
the fields of biology and nature studies. They provide almost unlimited opportunities
for nature studies, environmental education and function as field laboratories for
scientific research (de Groot, Wilson, & Boumans, 2002). Opportunities for on-site,
scientific assignments and projects are important as a part of natural sciences
education at all levels. It is particularly important for children to let them come into
contact with nature and draw a link between what takes place inside the classroom and
nature itself. Nature, the health of its ecosystems and provision of ecosystem services,
is after all the fundamental precondition for the functioning of human societies. In our
modern society we have removed ourselves from nature and therefore do not
experience directly the consequences of many of our actions. The natural environment
is most of the time not involved in our every day life. For that reason it is even more
important to introduce the natural environment to children through their education and
teach them about nature, its ecosystems and their functions and importance for
society. But it is not only important for children to be able to work in the natural
environment, it is also important for higher education. Natural sciences departments in
universities, e.g. biology, benefit from having access to natural ecosystems in their
vicinity. As field trips are an essential part of their educational programs it can save a
considerable amount of money to be able to practice field work in the surroundings of
the universities. Both of the subject lakes, Lake Elliðavatn and Lake Vífilsstaðavatn
play a role for education at different levels in the education system, and that role was
used to obtain an economic value of the educational ecosystem services of the lakes.

61
4.3.2.1 Valuation methods
To estimate the value of the educational services of the two lakes, the use of the lakes
for education by schools in the capital area was observed. The time spent by students
at the site was valued relative to total time spent at the school over the school-year and
to the total cost per student. Official cost data from the annual school report
(Skólaskýrsla, 2008) were used in the estimation for elementary schools. Official cost
data for high schools came from the ministry of educational affairs. All numbers were
obtained at price levels of 2007 but in the final results, they were converted to price
levels of 2009, using the annual average consumer price index.
4.3.2.2 Data collection
To obtain data about the usage of the lake in educational purposes, all elementary
schools in the three municipalities adjacent to Heiðmörk were contacted, that is
Reykjavík, Kópavogur and Garðabær. First, an attempt was made to reach the
principals by phone and then by e-mail. Surveys were then sent by e-mails to the
schools and out of 60 primary-schools that received a survey, 43 answered. Out of 43,
8 had used either of the two lakes during the school year 2007-2008. The schools in
Reykjavík (3) made use of Lake Elliðavatn while the schools in Garðabær (4) and
Kópavogur (1) made use of Lake Vífilsstaðavatn. Surveys were also sent to the high-
schools (isl. framhaldsskólar) in the capital area. Out of the seven asked, 1 had used
the lake, 5 had not used the lake and 1 did not answer. The department of biology at
the University of Iceland has used both of these lakes for fieldwork. However the
magnitude of this usage is not registered and thus unknown. Therefore it was not
possible to account for this value in this estimation even though there certainly is one.
4.3.2.3 Results
The annual cost per student in elementary schools varies between municipalities. In
the municipality of Reykjavík it was 990.000 ISK in 2007. For the other
municipalities in the capital area it was 938.000 ISK in 2007. The amount of lessons
per day varies between classes as younger children have fewer lessons per day than

62
older children. The range is from 6 lessons/day for the youngest to 7,4 lessons/day for
the oldest. The number of schooldays is however the same for all children, 180 per
year. When responding to the survey, Vatnsendaskóli gave a range of students in
class, 18-27 students per class. This is not an exact number of students which again
makes the cost estimation less accurate. Another issue concerns the school Barnaskóli
Hjallastefnunnar as answers about number of trips were unclear. This school uses the
Lake Vífilsstaðavatn on a regular basis as all students go at least once a week to the
lake and then there are 2 to 4 organized trips. In the assessment only the organized
trips were accounted for, minimum 2 and maximum 4 full day trips per year. Thus,
upper and bounds of total cost of time for the students of these two schools are given.
While the elementary schools usually took half day or full day trips to the lakes, the
one high school that used the lake only used it for one lesson over the school year. To
estimate the time cost per student in elementary schools the value of each lesson was
calculated by dividing the annual cost per students with annual amount of lessons.
Thereby the value per lesson is found and that then multiplied with the time spent on
site and number of students.
For the high school the annual cost per student was 750.000 ISK in 2007. This
cost was divided by average annual amount of school-units completed (isl. þreyttar
einingar) which are 35, thereby finding the value per unit. The amount of lessons
behind each completed unit is 72 lessons per year. Thus the value per lesson
calculated, 298 ISK/lesson. Finally to find the value of time spent on site the value of
lesson was multiplied with the number of lessons and number of students. The results
are presented in the tables 15 and 16 below.

63
Table 15. Results for educational use of Lake Vífilsstaðavatn by elementary and high schools in the capital area the school year 2007-2008 (constant ISK 2009).
School Lake Number of
classes Number of students Value of time on site (constant ISK 2009)
Upper bound Lower bound Upper bound Lower boundBarnaskóli Hjallastefnu Vífilsstaðavatn 4 175 175 93.054 46.527
Salaskóli Vífilsstaðavatn 6 211 211 573.190 573.190
Sjálandsskóli Vífilsstaðavatn 1 40 40 232.635 232.635
Hofsstaðaskóli Vífilsstaðavatn 2 115 115 505.981 505.981
Flataskóli Vífilsstaðavatn 1 52 52 604.851 604.851
Fjölbr.Garðabæ Vífilsstaðavatn 2 44 44 14.614 14.614
Total value of time on site in Lake Vífilsstaðavatn 2.024.328 1.977.801
Table 16. Results for educational use of Lake Elliðavatn by elementary schools in the capital area the school year 2007-2008 (constant ISK 2009)
School Lake Number of classes Number of students
Value of time on site (constant ISK 2009)
Upper bound Lower bound Upper bound Lower bound Ísaksskóli Elliðavatn 5 237 237 1.048.924 1.048.924
Norðlingaskóli Elliðavatn 7 170 170 966.115 966.115
Vatnsendaskóli Elliðavatn 9 243 162 2.701.671 1.801.115
Total value of time on site at Lake Elliðavatn 4.716.711 3.816.155
4.4 Supporting Services
Supporting services, sometimes called life-support services are services that are
necessary for the production of all other ecosystem services. They differ from
provisioning, regulating and cultural services in that their impacts on people are
indirect (Ozdemiroglu, Tinch, Johns, Provins, Powell, & Twigger-Ross, 2006). This
goes along with the ideology of Fisher and Turner (2008) which conceptualized that
benefits from ecosystem services are derived through intermediate or final ecosystem
services. In their response letter to Wallace (2007) they give an illustrative example of
relationships between some intermediate services, final services and benefits. There,
services such as nutrient cycling, pollination and soil formation, which according to
the MEA are categorized as supporting services fall into the category of intermediate
services. According to the MEA, soil formation service of inland water systems is
sediment retention and accumulation of organic matter. The nutrient cycling service

64
includes the storage, recycling, processing and acquisition of nutrients and the
pollination service includes support for pollinators (MEA, 2005).
The following sections list and describe the main supporting services provided
by Lake Elliðavatn, and Lake Vífilsstaðavatn in terms of the MEA categorization. The
ecosystem service of habitat function brought forth in deGroot et al. (2002) is also
mentioned shortly, although it is not categorized specifically in the MEA. In addition
to the description of various supporting services provided by the lake ecosystems, an
attempt was made to estimate the economic value of the supporting service Lake
Elliðavatn provides to the popular salmon-river, Elliðaár River. Services definition,
data collection process and results are presented below in section 4.4.5 of economic
view.
4.4.1 Sediment retention and accumulation
Lake Elliðavatn can be divided into three parts, Vatnsvatn, Vatnsendavatn and Engjar.
Engjar, representing about 40% of the lake area, is the part which was flooded when
the lake was turned into a reservoir for hydropower generation in 1924. The lake bed
in Engjar is different from the other two parts, with less organic sediments and smaller
aquatic vegetation. In Vatnsvatn and Vatnsendavatn the lake beds are mostly made of
thick permeable organic sediments with batches of tall aquatic plants (macrophytes),
namely Myriophyllum alterniflorum and Potamogeton spp (Malmquist, Ingimarsson,
& Ingvason, 2004). Lake Vífilsstaðavatn is also densely covered (over 75%) with tall
aquatic plants, mainly Myriophylllum alterniflorum (Malmquist & Gíslason, 2007). In
such benthic ecosystems, ecosystem services such as sediment retention and
accumulation take place as the aquatic macrophytes affect water movements by reducing
water turbulence and thus increasing sedimentation of particulate mineral and organic
matter (de Nie, 1987). Macrophytes play a big role when it comes to long-term sediment
accumulation and retention. An example of that was revealed dramatically in Lake
Constance, a big lake in South-Germany when an increase in algal turbidity caused the
disappearance of macrophyte beds which then led to the loss of extensive amount of
sediments, deposited over centuries (Rooney, Kalff, & Habel, 2003). Although these lakes
are not of the same caliber, it still demonstrates the importance macrophytic vegetation
can have for the sediment retention and accumulation, and thus the health of the lake
ecosystem. Diatoms are another important factor in sediment retention and accumulation.

65
In Lake Elliðavatn they sequester around 255 tons of SiO2 according to a research done in
1997-1998. This corresponds to an annual 402 tons of sediment production and
biosynthesis of 35g/m2 of carbon (Gíslason S. R., 2007).
4.4.2 Nutrient cycling
Although its presence may not always be noted by man, nutrient cycling is a very
important ecosystem service, one of the fundamental factors enabling life on earth.
The constant cycling of certain basic chemical elements is essential to sustain
ecosystems, their processes and functions and thus life. These chemical elements are
about 30-40 of the 90 chemical elements occurring in nature, and out of the nutrients
the most important ones are nitrogen (N), sulfur (S) and phosphorus (P) (de Groot,
Wilson, & Boumans, 2002).
Benthic ecosystems of rivers, lakes and wetlands are widely considered to be
of significant importance in terms of their role in maintaining biodiversity and storing
and cycling materials, nutrients and energy (Covich, et al., 2004). Particulate minerals
and organic matter, including the main nutrients, accrue in the sediments in lakes,
consequently the distribution, transport and destinations of the sediments can greatly
affect the nutrient cycling in lakes (Rooney, Kalff, & Habel, 2003). The input from
surrounding terrestrial areas, its vegetation, and the overlying water affect the
sediment composition of sediments in shallow lakes (Covich, et al., 2004). In most
lakes, there is a net deposit of phosphorus in the sediments. Therefore, the phosphorus
metabolism of lakes can be highly dependent on the sediments, which then serve both
as a sink and a source of phosphorus (Boström, Andersen, Fleischer, & Jansson,
1988). In the parts of Elliðavatn, Vatnsvatn and Vatnsendavatn, where in most places
the sediment layer is about 1m, the aquatic vegetation, namely the macrophytes, is tall
and dense and the benthic fauna is dense and diverse, particularly in terms of benthic
crustaceans (Malmquist, Ingimarsson, & Ingvason, 2004).
The macrophytes play a big role in the nutrient cycling of the lake. They
sequester nutrients from the lake, during periods of active growth, but they also serve
as a source of nutrition in different ways for various organisms (de Nie, 1987; Linhart,
1999). They generally become covered with a layer of periphyton, a collection of
organisms such as attached algae, bacteria and microinvertebrates together with
detritus and plant secretions (Jones, Moss, Eaton, & Young, 2000). The epiphytic

66
algae use the macrophytes as a habitat and they also benefit from inorganic nutrients
and dissolved organic compounds released by the macrophytes, particularly if the lake
is oligotrophic (Allen, 1971; Bronmark & Vermaat, 1998). The epiphytic algae are
grazed by various herbivorous invertebrates such as small crustaceans and snails
(Bronmark & Vermaat, 1998). Thus the macrophytes sustain various organisms,
herbivores, detritovores, epiphyte grazers or other animals feeding on fine particulate
organic matter which becomes trapped on the plant surfaces. They also provide
nutrition for the benthic organisms down in the sediment when nutrients are released
due to damage, autolysis or microbial breakdown on living parts of the plants (de Nie,
1987). The invertebrates, living both in the sediments and on plant surfaces, such as
the crustaceans, water snails and chironomid larvae are an important food source for
many fish species. In Lake Elliðavatn the Stickleback and the Arctic char feed mainly
on such invertebrates. The Stickleback feeds mostly on crustaceans such as Cladocera
and Ostracoda and small chironomids in the earlier life stage. After reaching a size of
20-30mm they start eating Copepoda such as Cyclops spp. and bigger chironomid
larvae (Snorrason, Kristjánsson, Ólafsdóttir, Malmquist, & Skúlason, 2002). The diet
of the Arctic char in Elliðavatn, changes seasonally but according to the research of
Björnsson (2001), where the trophic ecology of Arctic char and the Brown trout in
Lake Elliðavatn were studied, the annual diet of the Arctic char consisted of
chironomid larvae, cladocerans, bivalves, water snails, chironomid pupae and char
eggs. The diet of the Brown trout however primarily consisted of sticklebacks but also
salmonids and water snails. The trophic ecology of Arctic char and Brown trout in
Lake Vífilsstaðavatn is slightly different. There the food selection between the species
is more overlapping and it is noteworthy that the Brown trout does not feed much on
sticklebacks (Jónsson B. , 1999).
The food chain in the lakes recycles nutrients, each link is important and the
equilibrium is sensitive. For example, excessive growth of epiphytic algae can be
harmful to macrophytes because it prevents the macrophyte from getting sufficient
amount of light and inorganic carbon, thus hindering the macrophytes photosynthesis
(de Nie, 1987). Therefore, the role of the epiphyte grazers for example is very
important, as they both contribute to the maintenance of the macrophytes and are an
important food source for the fish. The same goes for each link of the food chain, the
epiphytic algae are an important food source for the epiphyte grazers, which are a

67
food source for the fish, which is a food source for birds and humans and an important
part of people´s attraction for recreational and educational activities.
The nutrient cycling service of the lake is however not only a local function
within the lakes as it provides services to other ecosystems, for example through
migration of birds and fish and through the rivers/streams that run down from the
lakes. In the case of Elliðaár River which runs down from Lake Elliðavatn, its
biosphere profits considerably from the organic production that takes place in the lake.
The reflux from Elliðavatn contains organic drifting particles that benefit the benthic
fauna of the Elliðaár River. There the black fly larvae have an important role as they
filter these particles from the stream and subsequently become one of the most
important food source for salmon. The salmon migrates up the Elliðaár River and
spawns in the rivers. Approximately half of its nurturing areas are below Lake
Elliðavatn, other nurturing areas are in the rivers that flow into the lake, Hólmsá and
Suðurá. The benefit of the organic production of Lake Elliðavatn leads to faster
growth of the salmon below the lake compared to the salmon in the rivers above the
lake where there is both less organic production and lower temperature (Árnason &
Antonsson, 2005). The nurturing areas below the lake are therefore very important for
the propagation of salmon in Elliðaár River (Antonsson & Guðjónsson, 1998). In
section 4.4.5 below, the economic value of supporting services is based on these
benefits provided to the Elliðaár River by Lake Elliðavatn.
Salmon is an anadromous fish species which means that it migrates between
sea and freshwaters. Consequently, they transport nutrients and energy between lake
and marine ecosystems through reproductive products, excretion and death (Polis,
Anderson, & Holt, 1997). After hatching, the salmon grows up on the nurturing areas
in the rivers around the lake until they reach smolting maturity that is the stage of
development when it assumes the silvery color of the adult and is ready to migrate to
the ocean. The smolting age in Elliðaár ranges from 1 to 5 years, but the smolting of
salmon is dependent on size, not age (Antonsson, Heiðarsson, & Snorrason, 2007) and
due to the organic production of Lake Elliðavatn the salmon below the lake reach
smolting maturity one year, on average, before the salmon above the lake (Antonsson
& Guðjónsson, 1998). After staying in the ocean, feeding and growing, the salmon
returns back to the rivers for spawning.
The migration of birds has an identical role in nutrient cycling as the salmon
has, through the distribution of nutrients between ecosystems (de Groot, Wilson, &

68
Boumans, 2002). At Lake Elliðavatn and its watershed there are at least thirteen
water-bird species that spend some part of the year there, plus other species that have
been seen a few times. In addition there are also other bird species than water birds
(isl. mófuglar and máffuglar) which also benefit from the lake and its adjacent rivers
and ponds (Hilmarsson, 2006). At Lake Vífilsstaðavatn eleven water-bird species
come regularly to the watershed, plus the less frequent ones. Fourteen other species
(isl. mófuglar, máffuglar) are also frequent visitors to the watershed (Hilmarsson &
Einarsson, 2006). Migrating birds that feed for example from fish and invertebrates in
lakes transport considerable amounts of nutrients with their droppings, their fecal
excretions, between ecosystems. In a corresponding manner, birds that feed on land
bring nutrients to the water (Polis, Anderson, & Holt, 1997). Thus it is clear that the
nutrient cycling services of both Lake Elliðavatn and Lake Vífilsstaðavatn are not
only local but there are interactions with other ecosystems which is an important
factor as well.
4.4.3 Support for pollinators
The service value of this category is probably insignificant. Larvae from both
midges and Caddis flies are a part of the benthic fauna of Lake Elliðavatn and most
likely Lake Vífilsstaðavatn as well. Adult caddis flies feed on flower nectar and can
thereby carry pollen between flowers. Midges also sometimes alight on flowers,
probably for flower nectar. However they only live for a few days and do not feed
substantially in their adult stage (Gíslason G. M., personal communication, March 31,
2009). Although these flies may carry pollen between plants it is unlikely that any
plant species rely on them for reproduction. The extent of the service of support for
pollinators in both lakes is therefore considered to be negligible.
4.4.4 Habitat function
The MEA does not categorize specifically the provision of habitat as an ecosystem
service provided or derived from inland water systems as it may overlap with other
functional groups. However, deGroot et al. (2002) emphasize the importance of
habitat functions and how maintaining healthy habitats is directly or indirectly
essential for the provision of all ecosystem goods and services. In their article they
divide the habitat functions in two parts, first the refugium function which includes

69
sustaining biological and genetic diversity, and second the nursery function which
concerns the provision of breeding and nursery areas to species. The MEA (2005)
places the “refugium function” into the category of provisioning services. However,
the habitat functions provided will be described in this section, in a similar sense as in
deGroot et al (2002).
The lake bottom is a heterogeneous ecosystem where various physical,
chemical and biological processes take place and generate possibilities for different
niches. Deposit particles, organic, inorganic and of different sizes, settle in various
compositions and are affected by different rates and direction of flows. Plant roots
grow and die, subsequently taking in and leaving behind sediment substances. Benthic
organisms modify sediments through burrowing, digestion and fecal production
(Covich, Palmer, & Crowl, 1999). The benthic ecosystem inhabits various kinds of
organisms; microbes, algae, invertebrates and macrophytes. Their habitats are
generated through these processes, and these processes are brought forth through
interactions between the organisms and the organic and inorganic substances in the
water. The importance of these organisms, in terms of food chains and nutrient
cycling, has already been described in section 4.4.2. However, the benthic ecosystem,
particularly when well vegetated, provides a heterogeneous habitat which plays a
fundamental role for microinvertebrates, fish species and their interactions in a lake
ecosystem. The macrophytes provide a structurally complex, functional habitat both in
a nutritional and spatial sense as invertebrates use it as a substrate, shelter and a
feeding habitat and young/small fish use it as a shelter and a feeding habitat (Linhart,
1999; de Nie, 1987). Evidence has shown that if habitats are moderately complex,
they contribute to a more stable predator-prey relationship between the
macroinvertebrates and the fish and the young/small fish and adult fish by supplying
young fish food and a hideaway (Savino & Stein, 1982; Diehl, 1992). Benthic
invertebrates commonly serve a major role as a main food source for many fish
species. Lake Elliðavatn and Lake Vífilsstaðavatn are no exceptions and as was
brought forth above they are an important nutrition for the Arctic char and the
Stickleback in Lake Elliðavatn and also the Brown trout in Lake Vífilsstaðavatn. The
magnitude and diversity of microinvertebrate communities is related to the extent of
aquatic vegetation, density, size and shape. Abundance and species richness of benthic
invertebrates in densely vegetated aquatic habitats is generally higher than in less
vegetated habitats (de Nie, 1987; Diehl, 1992). This can be seen in Lake Elliðavatn

70
where the benthic ecosystem varies between lake parts. The results from a
comprehensive research done by Smári Haraldsson (2004) on the benthic fauna of
Lake Elliðavatn in 1975-76, revealed a great difference in microinvertebrate biomass
between lake parts. In Vatnsendavatn and Vatnsvatn, where the bottom is
characterized by sediment and macrophytes, the average annual biomass of all
microinvertebrates was 12,3g/m2. In Engjar, where the bottom is mainly dense turf
and rocks, the annual biomass of all microinvertebrates was 5,7 g/m2. In addition a
clear difference was seen in species composition and diversity between the sediment
and the turf bottom, with more diversity on the sediment bottom (Haraldsson, 2004).
Thus, the benthic ecosystem of Lake Elliðavatn, its vegetation and sediments,
provides important habitat services that sustain biological diversity and are
fundamental for a balanced relationship between different links of the food chain. The
littoral zone in the lake also provides important habitat services, especially for species
that inhabit on stones and rocks such as caddis flies larvae (Trichoptera) and water
snails (Lymnaea) (Haraldsson, 2004). The water snails are a food source for fish
species and the caddis flies are a link to the terrestrial system.
The habitat provision of the lakes is not only for species that live within the
lakes but also for species that live around them, such as birds, where the lake plays a
fundamental role in their processes of feeding and breeding. According to the
conservation plan for birds at Lake Elliðavatn (2006), thirteen water-bird species
come regularly to the watershed for feeding, eleven out of these thirteen also breed in
the surrounding of the lake. Some of the species stay during the winter but others
migrate. Four of these species are listed on watch lists, three as vulnerable (VU) and
one at low risk (LR). Twelve other species than water-birds are also regular guests or
breeders and benefit from Lake Elliðavatn through feeding and breeding (Hilmarsson,
2006). At Lake Vífilsstaðavatn eleven water-bird species come regularly to the
watershed, six of them come each year and three of them breed there each year.
Fourteen other species are frequent visitors on the watershed and eight breed annually
in the lake´s surrounding (Hilmarsson & Einarsson, 2006).
From this discussion it is clear that the ecosystems of Lake Elliðavatn and
Lake Vífilsstaðavatn provide important ecosystem services in terms of habitat
provision.

71
4.4.5 Economic view – Lake Elliðavatn
4.4.5.1 Services definition
The Elliðaár River is a popular salmon river in the heart of Reykjavík city with one of
the longest angling histories in Iceland. The angling season is from 21st of June until
1st of September and are 4-6 fishing rods allowed at a time. The average catch for the
period of 1974-2003 was 1200 salmons (Guðbergsson, 2009). In this section we
attempt to capture an economic value of the nutrient cycling service and provision of
nursery habitat already described in section 4.4.2 provided by Lake Elliðavatn for the
Elliðaár River.
When rivers are compared in terms of salmon production, rivers originated in
lakes or overgrown watersheds generate a lot more of salmon, proportionally to
watershed size, compared to rivers originated in poorly vegetated watersheds. The
former carry a lot of organic drifting particles which affect the composition of the
benthic invertebrate community. In rivers that originate in lakes, the benthic
communities are generally characterized by the filter feeding black fly larvae, an
important food source for salmon. Further down the rivers, the concentration of
organic particles decreases and the benthic community changes where the chironomid
larvae, which feed of epiphytic algae become predominant. Between rivers in well
vegetated watersheds the rivers that are also lake-fed generally have higher salmon
catches than rivers that are not (Aðalsteinsson & Gíslason, 1998; Gíslason, Ólafsson,
& Aðalsteinsson, 1998). Lakes also seem to have positive effects on fry and parr
production and it has been demonstrated that lake outlets in Iceland are generally very
productive compared with other stream areas. This is considered to be due to the high
density of blackfly larvae (Jóhannsson, 1988; Einarsson, Mills, & Jóhannsson, 1990).
On the watershed of the Laxá í Kjós River the Bugða River has very high densities of
fry and parr just below the lake outfall. Bugða is originated in Lake Meðalfellsvatn
and joins the Laxá í Kjós River before it enters the sea (figure 8). In the report from
Sigurður Már Einarsson (2001) the Bugða River had the most fry and parr density per
unit of the watershed.

72
Figure 8. Part of the watershed of Laxá í Kjós. It is demonstrated how the Bugða River runs down from Lake Meðalfellsvatn joining first the Dælisá River and then the Laxá í Kjós River before enterind the sea. (The numbers denote electro fishing stations which are not directly related to the present study.) Source: (Antonsson Þ. , 2009).
In the Elliðaár River watershed, where fry and parr densities have been measured
separately for the Hólmsá River and Suðurá River on one hand and for the Elliðaár
River below Lake Elliðavatn on the other hand (figure 9). Those measurements have
demonstrated that growth is more below the lake and there is also higher density of all
fry and parr year classes (Antonsson & Árnason, 2009)

73
Figure 9. The river system of the Elliðaár watershed. (The numbers denote electro fishing stations which are not directly related to the present study.) Source: Antonsson & Árnason, 2009.
4.4.5.2 Valuation methods
The factor income method described in section 2.5 was applied here to value the
benefits of nutrient cycling and provision of nursery habitat by Lake Elliðavatn for the
Elliðaár River. Thus the salmon fishing licenses in Elliðaár River denote the
production good x as described in section 2.5 and the production factor of interest, q,
is Lake Elliðavatn. Its quality and production of organic material affect the salmon
yield of the Elliðaár River and thus the demand for salmon fishing licenses since
prices and angling licenses in salmon rivers are generally dependent on the yield from
the rivers (Agnarsson & Helgadóttir, 2004). Other possible production factors
included were rods, production units, river type and time. To capture the extent of the
service provided by lakes as a production factor, a comparison study was made
between fifteen rivers, ten with lakes and five without lakes. A multiple regression
was run with salmon yield per wetted area as the dependent variable and the presence
of lake and four other possible production factors as independent variables. The model
and its variables are described in further details below.

74
4.4.5.3 Data collection and model
The fifteen rivers used for the comparison were the following; Elliðaár, Úlfarsá
(Korpa), Laxá í Kjós, Laxá í Leirársveit, Langá, Straumfjarðará, Krossá á
Skarðsströnd, Víðidalsá, Vatnsdalsá, Laxá á Ásum, Laxá í Aðaldal, Hafralónsá, Selá í
Vopnafirði, Vesturdalsá and Hofsá. These rivers were chosen because they have had
relatively consistent research done on them and thus comparable data were available.
Data on yield were available for the period from 1974 to 2008 at the Institute of
Freshwater Fisheries (Guðbergsson, 2009). Data on the other variables were provided
by Guðni Guðbergsson at the Institute of freshwater Fisheries through personal
communication.
The task of the valuation process is twofold, first to estimate the extent of the
service traceable to the lake and then assign an economic value to this service. To
specify the model, the dependent variable used was YWA, salmon yield (number of
fish) per wetted area (m2). As mentioned above, five independent explanation
variables were included. The first one, LAKE denotes whether the river originates in a
lake or not. This was the main variable of interest as the goal was to see whether the
presence of a lake had significant effect on salmon yield per wetted area. The other
explanation variables were included as they may also affect salmon yield per wetted
area. The variable RODS denotes the number of rods allowed for angling in the river
per day. Significant effects were not expected as it has been demonstrated that
correlation is between catch and the total number of salmons that come up rivers so
that there is always a similar proportion caught independent of how many rods are
used (Guðbergsson & Antonsson, 2008). However the variable was included for
comparison purposes. PU denotes production units, an indicator of quality of salmon
habitats in rivers. Production units are measurements of the salmon production
potential of Icelandic rivers based on substrate quality on riverbeds. These units are
based on production area and the coarseness of the bottom substrate (Antonsson,
Einarsson, & Guðjónsson, 2001). The production units were expected to have
negative impacts because they are calculated by:
Equation 27 PU = QV * A

75
where QV denotes the quality value of substrate and A denotes the substrate unit (m2).
Thus, when the QV*A increases the area (of the production unit) becomes larger and
the yield per wetted area, Y/WA, thus decreases. RTYPE2 denotes the type of the
river. The nature of the different river types is different which may affect the salmon
yield of the river. Most of the rivers are run-off rivers, twelve out of fifteen, and to
include a river type variable a dummy variable was used on whether the river is a run-
off river or not. TIME denotes the years, from 1974-2008. Thereby a distinction is
made between the years as weather condition etc. can vary between years which may
also affect the yield. There are various other factors that may affect the salmon yield
of rivers, such as size and vegetation of the watershed, resistance, flux, parr release
etc. However, as consistent data were not available on all possible explanation factors
for the fifteen rivers the scope was drawn at the five variables already described.
4.4.5.4 Results
A multiple regression was conducted with panel analysis in the LIMDEP economic
software and a random effects model applied. Panel analysis was applied to allow for
variation in constants as well as slope. Each panel group represents one river and
within each group there are 35 observations, one per year from 1974 to 2008. Fixed
effects model could not have been applied due to lack of variety within groups for all
the variables except the yield. This is normal because the presence of lake, production
unites, river type etc are always the same for the same river. The model used for the
regression was:
Equation 28 YWA = α + βiLAKE + βiiRODS – βiiiPU + βivTIME +
βvRTYPE2
The results are presented in table 17 on a natural logarithm form. Since the LAKE and
RTYPE2 variables are 0 or 1 variables it was not necessary to transform them to
natural logarithm.

76
Table 17. Results from the panel data analysis, random effects model.
+--------------------------------------------------+| Random Effects Model: v(i,t) = e(i,t) + u(i) | | Estimates: Var[e] = .324529D+00 | | Var[u] = .300879D+00 | | Corr[v(i,t),v(i,s)] = .481093 | | Lagrange Multiplier Test vs. Model (3) = 1920.66 | | ( 1 df, prob value = .000000) | | (High values of LM favor FEM/REM over CR model.) | | Baltagi-Li form of LM Statistic = 1920.66 | | Sum of Squares .104190D+08 | | R-squared -.165592D+05 | +--------------------------------------------------+ +--------+--------------+----------------+--------+--------+----------+ |Variable| Coefficient | Standard Error |b/St.Er.|P[|Z|>z]| Mean of X| +--------+--------------+----------------+--------+--------+----------+ LAKE | 1.05244989 .34464913 3.054 .0023 .64285714 LRODS | .01241446 .35560353 .035 .9722 1.74662116 LPU | -.54001622 .29818825 -1.811 .0701 9.50310132 LTIME | -.10470869 .03025199 -3.461 .0005 2.63246216 RTYPE2 | .11510457 .51803050 .222 .8242 .78571429 Constant| -2.26064828 2.17878711 -1.038 .2995
According to the results from the random effects model, two out of the six explanatory
variables are significant at the 5% level, the LAKE and LTIME. The sign on LAKE is
positive with a coefficient of 1,052. This suggests that 65% of the river yield per
wetted area can be explained by the presence of a lake2. The significance of LTIME
indicates that external factors which vary between years, such as weather,
significantly affect the salmon yield per wetted area. The sign on LRODS was
positive, but insignificant. The sign on LPU was negative but insignificant. The
RTYPE2 variable on river type was highly insignificant but that may also be due to
the size and characteristic of the sample where out of fifteen rivers twelve were of the
same type.
To derive an economic value, the aim was to apply the proportion of salmon
yield attributable to the lake, according to our model, to the income of sold fishing
license in the Elliðaár River. However there is one issue of concern. The Elliðaár
River is not comparable to other salmon rivers in license-prices because the fishing
licenses are in fact subsidized and the demand by far exceeds the supply. Reykjavík
Energy is in charge of operating the river and the angling club of Reykjavík is in
charge of daily management, partly by volunteers from the association. The cost of
managing the river is much higher than the income, thus a calculated average price of
2 The difference in yield per wetted area between rivers who have a lake (YWAL) and rivers who do not have a lake (YWA0) is given by the ratio = where β denotes the coefficient on the lake
variable Thus, = → 1- = 1- →1- , = 0,651

77
the salmon hardly represents a real market price (Haraldur Eiríksson, personal
communication, December 5, 2009). Because of this special status of the Elliðaár
River, a possible economic value of the river is generated by using the average price
of fishing licenses, during the period of 2005-2008, from 38 angling zones in Iceland
all operated by the same fishing association, the Angling Club of Reykjavík. Thereby
all heteroskedasticity due to different markup on license prices is prevented. The
numbers are based on a M.Sc. thesis in economics on the economic value of Icelandic
angling zones by Brynjar Örn Ólafsson (2009). All prices from the paper were
converted from the price levels of 2006 to price levels of 2009 by using annual
average consumer price index. According to Ólafsson (2009) the annual sold salmon
fishing licenses over the period 2005-2008 were 30.831. The annual average price of
salmon fishing license during this period is ISK 30.049 at constant ISK 2009. In the
Elliðaár River 380 “rod-days” (days of angling with one rod) are sold.3 According to
the assumptions made and the model results above, the monetary value of angling in
Elliðaár River which can be attributed to Lake Elliðavatn comes down to ISK
7.422.1034 (constant ISK 2009) for the year 2009.
3 Licenses are sold both for half and whole days. Two half days count as one whole “rod-day”. 4 380 * 30.049 = 11.418.620 → 0,65* 11.418.620 = 7.422.103

78
5. Summation
In tables 18 and 19 all results have been gathered for each lake and the total value for
ecosystem goods and services provided by the lakes presented on an annual basis.
Table 18. Total value of the ecosystem services of Lake Elliðavatn (constant ISK 2009).
Provisioning services 30.665.149
Regulating services Upper bound 31.345.666
Lower bound 22.082.780
Cultural services Recreational services Upper bound 27.158.895
Lower bound 19.277.460
Cultural services Educational services Upper bound 4.716.711
Lower bound 3.816.155
Supporting services 7.422.103
Total Upper bound 101.308.524
Lower bound 83.263.647
Table 19. Total value of the ecosystem services of Lake Vífilsstaðavatn (constant ISK 2009).
Cultural services Recreational services Upper bound 3.957.232
Lower bound 3.736.124
Cultural services Educational services Upper bound 2.024.328
Lower bound 1.977.801
Total Upper bound 5.981.560
Lower bound 5.713.925

79
6. Discussion
Ecosystem services have been defined as the “instrumental values of ecosystems, as
means to end of human well-being” (Costanza, 2008). Throughout history it has been
the rule rather than an exception to implicitly assess the value of nature in collective
decision making, treating the provision of ecosystem services as free (Daily, et al.,
2000). If humans ultimately aim to achieve sustainability, a fundamental prerequisite
is to view the economy in its proper perspective, as a subsystem of the larger
ecological system (Costanza & Daly, 1992). Evaluating ecosystem services in the
disciplinary field of ecological economics provides an important contribution to
decision making when it comes to the protection or development of natural
ecosystems.
On the grounds of international development in the field of ecological
economics and transforming views towards nature and natural ecosystems in Iceland,
the aim of the present preliminary study was to give a demonstration of an economic
valuation of ecosystem services in Iceland. In accordance with the MEA framework,
different valuation methods were applied for different services, in an attempt to
capture a potential economic value of the ecosystem goods and services provided by
Lake Elliðavatn and Lake Vífilsstaðavatn. Although the methods are debatable, and
each of them has some defects, when applied simultaneously they address the subject
in more depth than any method previously used in Iceland. The results should provide
a new perspective and will hopefully serve as a reference for further such studies in
the near future.
Following is a discussion of the results in each category, some future studies
possibilities mentioned. Finally, in section 7, an overall conclusion from the study is
made.
Provisioning services
The final result from the valuation of the provisioning services category of Lake
Elliðavatn was ISK 30.665.149 (constant ISK 2009). This number comprises the
worth of electricity produced from Elliðaárvirkjun in the year of 2007. The other
provisioning service considered extensive enough for possible economic valuation
would be the fish production. In Lake Vífilsstaðavatn that would be the sole
provisioning service accountable as the lake does not provide any other provisions

80
directly benefitting the human society. However, to prevent double counting, as the
fish production is the main attraction for the recreational anglers, this service was not
valued separately but through the recreational services category. Double counting
benefits in environmental valuation studies can lead to overestimation of the benefits
value and undermine the credibility of the study. The methodology applied in this
category is fairly simple as it is based on compiling available market data on the
electricity production from Elliðaárstöð. However it must be noted that market price
only provides an indicator of the minimum value of the service. To obtain a true value
the demand curve and consumer surplus of electricity would have to be estimated.
This was however beyond the scope of the present study.
Other potential issues regarding this category concern whether important
services are being left out of the valuation for some reason. For example services such
as gene pool or biodiversity service but these are categorized as provisioning services
in inland water systems according to the MEA (Aladin, et al., 2005). In section 2.3 the
anthropocentric perspective is described and the origin of economic value which is
based on an instrumental perspective. This means that the value of biodiversity must
be derived from an interaction between it and human subjects. Moreover, biodiversity
can be classified in terms of genetic diversity, species diversity, ecosystem diversity
and functional diversity. Different values of biodiversity can also be identified and
characterized in different categories (Nunes & van den Bergh, 2001). Thus, valuing
the economic value of biodiversity is both a very controversial and complicated
matter. In both of the subject lakes various species of flora and fauna exist but at
present they do not have a role as a provisioning service because they do not give
benefit directly to the human society. Such a role may yet to be discovered or it may
be non-existent. Therefore, the importance and potential services of gene pool and
biodiversity shall not be ignored although it was not addressed here.
Regulating services
The result from the valuation of regulating services provided by Lake Elliðavatn was
in the range of ISK 22.082.780 - 31.345.666 (constant ISK 2009) in 2009. Evidently
this is not the true cost since construction has not been completed, but this is the
intended defensive expenditures. An issue concerning this part is the driver behind
these constructions and then there is a question of whether the categorization is
correct. The ultimate reason for these constructions is to maintain the water quality

81
and thereby to protect the biota, the fish and the pristine water which are also a great
attraction for outdoor recreation. Thus there is a question of whether the constructions
could possibly illustrate the value put on recreational use and the inclusion of this
value may represent a possible issue of double counting. However, the lake can and
has served to dilute and evict pollution. If there would not be a lake, this service
would possibly have to be replaced by a sedimentation pond in any case. These
constructions have been made in order to provide this service instead of the lake.
When a certain service is replaced so it can be maintained, without risking another
ecosystem and its goods and services, it must reveal a value of that service. This is
also why these constructions can be a replacement cost, as well as a defensive
behavior, since a service is being replaced. Therefore, it was considered completely
justifiable to use this categorization and method for valuating this service. Yet the
possible tradeoff is acknowledged and the double counting issue considered.
Cultural services – Recreational services
The final result for the valuation of recreational services provided by Lake Elliðavatn
in the year 2009 was in the range of ISK 19.277.460- 27.158.895. In the case of Lake
Vífilsstaðavatn this value was in the range of ISK 3.736.124 - 3.957.232. These
results are based on certain assumptions, such as the opportunity cost of time,
mentioned in section 2.6. Some of the assumptions may be seen questionable. For
example in the assessment of opportunity cost of time, the individual time value is
based on a wage rate. This poses a question about fairness and equity. Is it justifiable
that the leisure time of a bank director with a high salary is valued much more than the
leisure time of a general worker? Shaw (1992) stressed that the value and cost of time
are different concepts, and that someone with a low wage can value time very highly.
This is a valid perspective and should not be ignored. Valuing people´s time will
always be difficult and debatable but using the wage rate is a valid approximation.
Another factor that can affect the results is that substitution sites were
excluded. In the survey anglers were asked about the frequency of visits to other
angling sites, i.e. lakes in the vicinity of the capital area. In the end however, these
questions were commonly left out by respondents of the survey, time was limited for
estimating the price of substitution sites and there was a question of whether the
selected substitute sites were the appropriate ones. Thus, they were left beyond the
scope of this study.

82
In the case of Lake Vífilsstaðavatn, the upper bound of the per-trip value came
out with a lower total value than the lower bound5. This is most likely due to that
more frequent visits are expected if the cost is lower as was mentioned in section
4.3.1.4. However, the travel cost results are less reliable than in Lake Elliðavatn. This
is due to the very small sample of only 46 usable surveys where only the travel cost
variable reached significance in the model. While in Lake Elliðavatn 164 surveys
were usable. The total visits to Lake Vífilsstaðavatn are also very roughly estimated as
it is very time consuming to attempt to get a better idea of the overall usage. This is
not very accurate compared to Lake Elliðavatn where all anglers are registered each
time, except the summer license holders, thus the number of total visits is relatively
accurate.
Cultural services – Educational services
The final result for the valuation of educational services provided by the lakes in the
school year 2007-2008 was in the range of ISK 3.816.155 - 4.716.711 in Lake
Elliðavatn. In Lake Vífilsstaðvatn it was in the range of ISK 1.977.801 - 2.024.328.
The total usage of both lakes for educational services seen here is an absolute
minimum. For example it is certain that the University of Iceland has used both lakes
for field work in biology courses. But as this use is not registered it is impossible to
estimate in a fairly reliable manner. Moreover, according to the lake managers,
kindergartens and various courses use both of the lakes for educational purposes.
Thus, although this usage was beyond the scope of this study it is clear that the value
of educational services may be somewhat higher.
Supporting services
This category is the one most difficult to value in economic terms. Yet the ecosystem
services within this category are possibly the most important ones to sustain all other
goods and service provision. However, through factor income method it was
attempted here to assess a potential economic value of a supporting ecosystem service
provided by Lake Elliðavatn to the Elliðaár River. The result was ISK 7.422.103
based on the assumption of an average price of rod days from 38 angling sites. This
result is a very rough estimate and as the demand curve for angling licenses in the
5 The upper bound included more visits and longer while the lower bound included fewer visits and shorter.

83
Elliðaár River is unknown, the real value stays unknown. Furhermore, it must be
noted that the explanatory variables used in the multiple correlation are possibly not
the variables that mostly affect salmon production in rivers. As mentioned in section
4.4.5.3 variables were left out, due to a lack of available data, which can also affect
salmon production per wetted area, such as vegetation on watershed. The result here
was that 65% of salmon production per wetted area can be attributable to the presence
of a lake. Although this is what the statistical analysis demonstrates, due to the fact
that other potential key variables were left out, the value might be overestimated.
When compared to the recreational value of Lake Elliðavatn it is interesting to see that
the estimated total income of angling license in Elliðaár River (~ISK 11,5 million) is
only in the range of half to one third of the value of the lake (~ ISK 19 – 27 million).
Certainly the study only includes the price of angling licenses in the river, excluding
travel and opportunity cost of time. Yet, this value is strikingly low.
It shall also be noted that applying the proportion of salmon yield attributed to
the lake to the estimated income of license is questionable. As the demand curve for
angling license is unknown, it is also unknown whether a relationship between salmon
yield and price of angling license exists. However as the prices of angling licenses in
salmon rivers are generally dependent on the yield from the rivers (Agnarsson &
Helgadóttir, 2004) an assumption can be made of an existing relationship.
Further research
There are few things concerning the present study that suggest further research in
terms of economic valuation. A hedonic pricing study for the residential area
surrounding Lake Elliðavatn is one of them. As mentioned in section 2.5 the price of a
real estate depends on various factors and the adjacent environment is one of them.
The proximity to Lake Elliðavatn which offers both a nice view and various
recreational opportunities is undoubtedly a factor that can increase the value of a real
estate. It could provide an additional value to the services from Lake Elliðavatn. Also,
to repeat the travel cost study including substitute sites could affect the outcome of
services value for both the subject lakes. Thus these are two potential subjects for
further research on the value of Lake Elliðavatn.
An interesting topic for other valuation studies is the comparison of the
recreational value of angling in Lake Elliðavatn vs. angling in the Elliðaár River. The
results from this study indicate that the recreational value of the lake is higher than the

84
one of the river. In this context, a travel cost study on the Elliðaár River provides a
significant subject for further research. Thereby the demand curve and consumer
surplus of angling in Elliðaár River could be estimated and compared to this study.
More in depth assessment on the relationships between lakes and rivers is also an
interesting research topic. The result of 65% of the Elliðaár River salmon yield per
wetted area attributed to Lake Elliðavatn is fairly high. The question is whether some
important factors that affect salmon yield were left out, or if lakes in general really
have such vast impacts on salmon yield in rivers. This is a potential research material,
which could serve an important role for further evaluation studies in Iceland. In
general, regarding future economic valuations of other sites in Iceland, it is important
to keep doing basic ecological research and identify linkages in ecosystem dynamics.
That facilitates further ecosystem valuation research and enables different
perspectives when it comes to environmental development management.

85
7. Conclusion
The economic valuation of the ecosystem goods and services provided by Lake
Elliðavatn and Lake Vífilsstaðavatn provides the first sub-results from the project;
The economic valuation of ecosystem services, the case of Heiðmörk, Iceland. This is
the first valuation study of ecosystem services executed in Iceland and will hopefully
serve as a reference for further such studies in Iceland.
The final results from the present study are that the overall value of ecosystem
services provided by Lake Elliðavatn in 2009 is in the range of ISK 83.263.647 -
101.308.524 (constant ISK 2009). For Lake Vífilsstaðavatn this value is in the range
of ISK 5.713.925 - 5.981.560 (constant ISK 2009). Overall the study is based on
many assumptions and rough estimations of numbers. Yet the final result can serve as
an indicator of a potential value of the goods and services provided by these
ecosystems. Evaluating ecosystem goods and services can never fall solely in the
domain of the economist and money is not the only appropriate metric (Limburg &
Folke, 1999). Some important ecosystem services will never be valued in economic
terms. However, by applying various valuation methods at the same time and trying to
understand the ecosystem functions we can get some idea of the economic value, such
as has been done here.

86
References
Abdalla, C. W., Roach, B. A., & Epp, D. J. (1992). Valuing Environmental Quality
Changes Using Averting Expenditures: An Application to Groundwater
Contamination. Land Economics , 68:163-69.
Aðalsteinsson, H., & Gíslason, G. M. (1998). Áhrif landrænna þátta á líf í
straumvötnum. Náttúrufræðingurinn , 68: 97-112.
Agnarsson, S., & Helgadóttir, Þ. (2004). Skýrsla nr. C04:04: Lax- og silungsveiði á
Íslandi. Efnahagsleg áhrif og líffræðileg staða auðlindarinnar á Íslandi. Reykjavík:
Hagfræðistofnun Háskóla Íslands.
Aladin, N., Barker, D., Beltram, G., Brouwer, J., Davidson, N., Duker, L., et al.
(2005). Chapter 20: Inland Water Systems. Milllenium Ecosystem Assessment.
Algesten, G., Sobek, S., Bergström, A.-K., Aagren, A., Tranvik, L. J., & Jansson, M.
(2003). Role of Lakes for Organic Carbon Cycling in the Boreal Zone. Global Change
Biology , 10; 141-147.
Allen, H. L. (1971). Primary Productivity, Chemo-organotrophy, and Nutritional
Interactions of Epiphytic Algae and Bacteria on Macrophytes in the Littoral of a Lake.
Ecological Monographs: Vol. 41 , 97-127.
Amoako-Tuffour, J., & Martinez-Espineira, R. (2008). Leisure and the Opportunity
Cost of Travel Time in Recreation Demand Analysis: A Re-Examination. Nova Scotia:
Department of Economics, St. Francis Xavier University.
Antonsson, Þ. (2009). Seiðabúskapur og veiði í Laxá í Kjós 2008. Reykjavík:
Veiðimálastofnun, VMST/09017.
Antonsson, Þ., & Árnason, F. (2009). Rannsóknir á fiskistofnum Elliðaánna 2008.
Reykjavík: Veiðimálastofnun.
Antonsson, Þ., & Guðbergsson, G. (2000). Silungur í Elliðavatni. Reykjavík:
Veiðimálastofnun, VMST-R/0018.
Antonsson, Þ., & Guðjónsson, S. (1998). Búsvæði laxfiska í Elliðaám.
Framvinduskýrsla í lífríkisrannsóknum. Reykjavík: Veiðimálastofnun, VMST-
R/98001.
Antonsson, Þ., Árnason, F., & Guðjónsson, S. (2008). Rannsóknir á fiskistofnum
vatnasviðs Elliðaánna 2007. Reykjavík: Veiðimálastofnun.

87
Antonsson, Þ., Einarsson, S. M., & Guðjónsson, S. (2001). Evaluation of salmon
habitat in Icelandic rivers. Freshwater Fish Migration and Fish Passage - Evaluation
and Development, 117-121. Reykjavík.
Antonsson, Þ., Guðbergsson, G., Jónsson, B., & Malmquist, H. (2007). Fiskur í
stöðuvötnum á höfuðborgarsvæðinu. Vötn og vatnasvið á höfuðborgarsvæðinu -
ástand og horfur, 71-76. Reykjavík.
Antonsson, Þ., Heiðarsson, Þ., & Snorrason, S. S. (2007). Eiginleikar gönguseiða laxa
og endurheimtur þeirra úr sjó. Fræðaþing landbúnaðarins , 210-214.
Árnason, F., & Antonsson, Þ. (2005). Far, afföll og hrygningarstaðir útvarpsmerktra
laxa í efri hluta vatnakerfis Elliðaáa. Reykjavík: Veiðimálastofnun, VMST-R/0514
Árni Hjartarson. (1998). Elliðaárdalur, land og saga. Reykjavík: Árbæjarsafn og
Borgarskipulag Reykjavíkur.
Aylward, B., Bandyopadhyay, J., & Belausteguigotia, J.-C. (2005). Freshwater
Ecosystem Services. Millenium Ecosystem Assessment; Current states and trends.
Barbier, E. (1994). Valuing environmental functions: tropical wetlands. Land
Economics , 70, 155–173.
Bartik, T. (1988). Evaluating the Benefits of Non-marginal Reductions in Pollution
Using Information on Defensive Expenditures. Journal of Environmental Economics
and Management , 15 (2):111-27.
Bin, O., Landry, C. E., Ellis, C., & Vogelsong, H. (2005). Some consumer surplus
estimates for North Carolina beaches. Marine Resource Economics , 20 (2): 145–161.
Bingham, G., Bishop, R., Brody, M., Bromley, D., Clark, E., Cooper, W., et al.
(1995). Issues in ecosystem valuation; improving information for decision making.
Ecological Economics , 14: 73-90.
Björnsson, B. (2001). The Trophic Ecology of Arctic Char (Salvelinus alpinus) and
Brown Trout (Salmo trutta) in Ellidavatn, a Small Lake in Southwest Iceland.
Limnologica , 31: 199-207.
Bockstael, N. E., Strand, I. E., & Hanemann, W. M. (1987). Time and the
Recreational Demand Model. Agricultural & Applied Economics Association , 293-
302.
Bolund, P., & Hunhammar, S. (1999). Ecosystem services in urban areas. Ecological
Economics , 29; 293–301.
Boström, B., Andersen, M., Fleischer, S., & Jansson, M. (1988). Exchange of
phosphorus across the sediment-water interface. Hydrobiologia , 170; 229-244

88
Boyle, K. J. (2003). Introduction to revealed preference methods. Í P. A. Champ, K. J.
Boyle, & T. C. Brown, A Primer on Nonmarket Valuation, bls 259-267. Dordrecht:
Kluwer Academic Publishers.
Bronmark, C., & Vermaat, J. (1998). Complex fish-snail-epiphyton interactions and
their effects on submerged freshwater macrophytes. Í E. Jeppesen, M. Sondergaard, &
K. Christoffersen, The Structuring Role of Submerged Macrophytes in Lakes, bls. 47-
68. New York: Springer.
Brown, T. C. (2003). Chapter 4: Introduction to stated preference methods. Í P. A.
Champ, K. J. Boyle, & T. C. Brown, A Primer on Nonmarket Valuation, bls. 99-110
Dordrecht, Netherlands: Kluwer Academic Publishers.
Champ, P. A. (2003). Chapter 3: Collecting Survey Data for Nonmarket Valuation. Í
P. A. Champ, K. J. Boyle, & T. C. Brown, A Primer on Nonmarket Valuation, bls. 59-
97. Dordrecht, netherlands: Kluwer Academic Publishers.
Chee, Y. E. (2004). An ecological perspective on the valuation of ecosystem services.
Biological Conservation , 120, 549–565.
Costanza, R. (2008). Ecosystem services: Multiple classification systems are needed.
Biological Conservation , 141: 350 –352.
Costanza, R., & Daly, H. E. (1992). Natural capital and sustainable development.
Conservation Biology , 6; 37-46.
Costanza, R., d’Arge, R., de Groot, R., Farberk, S., Grasso, M., Hannon, B., et al.
(1997). The value of the world’s ecosystem services and natural capital. Nature , 387:
253-260.
Coupal, R., Bastian, C., May, J., & Taylor, D. (2001). The economic benefits of
snowmobiling to Wyoming residents: A travel cost approach with market
segmentation. Journal of Leisure Research , 33: 492–510.
Covich, A. P., Austen, M. C., Barlocher, F., Chauvet, E., Cardinale, B. J., Biles, C. L.,
et al. (2004). The Role of Biodiversity in the Functioning of Freshwater and Marine
Benthic Ecosystems. BioScience, 54: 767-775.
Covich, A. P., Palmer, M. A., & Crowl, T. A. (1999). The Role of Benthic
Invertebrate Species in Freshwater Ecosystems - Zoobenthic species influence energy
flows and nutrient cycling. BioScience , 49: 119-127.
Creel, M., & Loomis, J. (1990). Theoretical and empirical advantages of truncated
count estimators for analysis of deer hunting in California. American Journal of
Agricultural Economics , 72: 434–441.

89
Daily, G. C., Alexander, S., Ehrlich, P. R., Goulder, L., Lubchenco, J., Matson, P. A.,
et al. (1997). Ecosystem Services: Benefits Supplied to Human Societies by Natural
Ecosystems. Issues in Ecology, 2: 1-16 .
Daily, G. C., Söderquist, T., Aniyar, S., Arrow, K., Dasgupta, P. E., Folke, C., et al.
(2000). The Value of Nature and the Nature of Value. Science , 289; 395-396.
Davidsdottir, B. (2006). chapter 11. In Æ. Sigurjónsdóttir, & Ó. P. Jónsson, Art,
Ethics and Environment: A free inquiry into the vulgarly received notion of nature, pp
125 - 141. Newcastle: Cambridge Scholars Press.
de Groot, R. S., Wilson, M. A., & Boumans, R. M. (2002). A typology for the
classification, description and valuation of ecosystem functions, goods and services.
Ecological Economics , 41: 393–408.
de Nie, H. W. (1987). The decrease in aquatic vegetation in Europe and its
consequences for fish populations. Rome: Food and Agriculture organization of the
United Nations.
DeFries, R. S., Foley, J. A., & Asner, G. P. (2004). Land-use choices: balancing
human needs and ecosystem function. Frontiers in Ecology and the Environment , 2:
249–257.
Dickie, M. (2003). Defensive behavior and damage cost methods. Í P. A. Champ, K. J.
Boyle, & T. C. Brown, A Primer on Nonmarket Valuation, bls. 395-444. Dordrecht,
The Netherlands: Kluwer Academic Publishers.
Diehl, S. (1992). Fish Predation and Benthic community structure; The Role of
Omnivory and Habitat Complexity. Ecology , 73: 1646-1661.
E.S.E.E.conference. (2009). Economics, European Society for Ecological Economics.
Transformation, innovation and adaption for sustainability. Ljubljana, Slovenia.
Egilsson, K., & Guðjónsson, G. (2006). Gróður í Heiðmörk. Reykjavík:
Náttúrufræðistofnun Íslands.
Einarsson, S. M. (2001). Rannsóknir á seiðabúskap Laxár í Kjós 2000. Borgarnes:
Veiðimálastofnun, VMST-V/01008.
Einarsson, S. M., Mills, D., & Jóhannsson, V. (1990). Utilisation of fluvial and
lacustrine habitat by anadromous Atlantic salmon, Salmo salar L. in an Icelandic
watershed. Fisheries Research , 10: 53-71.
Englin, J., & Cameron, T. (1996). Augmenting travel cost models with contingent
behaviour data: Poisson regression analyses with individua lpanel data. Environmental
and Resource Economics , 7: 133–147.

90
Environmental, H. (2008). Aquatic Plant Management Plan Round Lake and Little
Round Lake. Sawyer County, Wisconsin: Wisconsin Department of Natural
Resources.
Escofet, A., & Bravo-Pena, L. (2007). Overcoming environmental deterioration
through defensive expenditures: Field evidence from Bahia del Tobari (Sonora,
Mexico) and implications for coastal impact assessment. Journal of Environmental
Management , 84: 266–273.
Farber, S. C., Costanza, R., & Wilson, M. A. (2002). Economic and ecological
concepts for valuing ecosystem services. Ecological Economics , 41: 375–392.
Fisher, B., & Turner, R. K. (2008). Ecosystem services: Classification for Valuation.
Biological Conservation , 141: 1167-1169.
Foley, J. A., DeFries, R., Asner, G. P., Barford, C., Bonan, G., Carpenter, S. R., et al.
(2005). Global Consequences of Land Use. Science , 309: 570-573.
Freeman, A. M. (2003). The Measurements of Environmental and Resource Values:
Theory and Methods. Washington: Resources for the Future.
Friberg, N. (2007). Freshwater ecosystem health, conservation and egology - The
effect of urban development on catchments. Vötn og vatnasvið á höfuðborgarsvæðinu
- ástand og horfur, bls. 1-6. Reykjavík.
Gallagher, W. (1993). The Power of Place: How Our Surroundings Shape Our
Thoughts, Emotions, and Actions . New York: Poseidon Press.
Gerking, S., & Stanley, L. (1986). An Economic Analysis of Air Pollution and Health:
The Case of St Louis. Review of Economics and Statistics , 68: 115-21.
Gíslason, G. M., Ólafsson, J. S., & Aðalsteinsson, H. (1998). Animal Communities in
Icelandic Rivers in Relation to Catchment Characteristics and Water Chemistry.
Nordic Hydrology , 29: 129-148.
Gíslason, S. R. (2007). Áhrif byggðar á efnabúskap Elliðaánna. Vötn og Vatnasvið á
Höfuðborgarsvæðinu: Ástand og Horfur, bls. 27-29. Reykjavík.
Gorke, M. (2003). The death of our planets species - A challenge to ecology and
ethics. Washington: Island Press.
Goulder, L. H., & Kennedy, D. (1997). Chapter 3: Philosophical Basis and Empirical
Methods. Í G. C. Daily, Natures services- Societal dependence on natural ecosystems,
pp. 23-47. Washington D.C.: Island Press.

91
Grasso, M. (1998). Ecological–economic model for optimal mangrove trade off
between forestry and fishery production: comparing a dynamic optimization and a
simulation model. Ecological Modelling , 112: 131–150.
Greene, W. H. (2007). LIMDEP Economic Modeling Guide. New York: Economic
Coftware Inc.
Guðbergsson, G. (2009). Lax- og silungsveiðin 2008. Reykjavík: Veiðimálastofnun.
Guðbergsson, G., & Antonsson, Þ. (2008). Tengsl stofnstærðar, sóknar og
veiðihlutfalls hjá laxi í Elliðaánum. Fræðaþing Landbúnaðarins, bls. 242-249.
Reykjavík.
Gurluk, S., & Rehber, E. (2008). A travel cost study to estimate recreational value for
a bird refuge at Lake Manyas, Turkey. Journal of Environmental Management , 88:
1350–1360.
Gurluk, S., & Rehber, E. (2008). A travel cost study to estimate recreational value for
a bird refuge at Lake Manyas, Turkey. Journal of Environmental Management , 88;
1350–1360.
Haab, T. C., & McConnel, K. E. (2002). Valuing Environmental and Natural
Resources: The Econometrics of Non-market Valuation. Massachusetts: Edward Elgar
Publishing Limited.
Hagerty, D., & Moeltner, K. (2005). Specification of driving costs in models of
recreation demand. Land Economics , 81: 127–143.
Hanley, N., Shogren, J., & White, B. (2007). Environmental Economics. New York:
Palgrave Macmillan.
Haraldsson, S. (2004). Könnun á smádýralífi í Elliðavatni 1975-1976. Reykjavík:
Líffræðistofnun Háskólans.
Harrington, W., & Portney, P. (1987). Valuing the Benefits of Health and Safety
Regulation. Journal of Urban Economics , 22: 101-112.
Heal, G., Daily, G. C., Ehrlich, P. R., Salzman, J., Boggs, C., Hellman, J., et al.
(2001). Protecting natural capital through ecosystem service districts. Stanford
Environmental Law Journal , 20: 333–364.
Hefny, M., Pereira, E., & Palm, C. (2005). Linking Ecosystem Services and Human
Well-being. Millenium Ecosystem Assessment.
Hellerstein, D., & Mendelsohn, R. (1993). A theoretical foundation for count data
models. American Journal of Agricultural Economics , 75; 604–611.

92
Hilmarsson, J. Ó. (2006). Verndaráætlun fyrir fugla við Elliðavatn. Reykjavíkurborg
& Kópavogsbær.
Hilmarsson, J. Ó., & Einarsson, Ó. (2006). Fuglar á vötnum og votlendi í Garðabæ
2000, 2004 og 2005. Garðabær: Umhverfisnefnd Garðabæjar.
Hilmarsson, J. Ó., & Einarsson, Ó. (2009). Fuglar á vövtnum og votlendi í Garðabæ
árið 2006 - Með viðbótum frá 2007 og 2008. Garðabær: Umhverfisnefnd Garðabæjar.
Hinga, K. R., Batchelor, A., Ahmed, M. T., & Osibanjo, O. (2005). Chapter 15:
Waste Processing and Detoxification. Millenium Ecosystem Assessment.
Hjaltason, Þ., Briem, Ó., Stefánsson, S. L., Sigfússon, A., Þorsteinsson, B.,
Kristjánsson, K., et al. (2000). Staðardagskrá 21: Stöðumat. Kópavogur:
Kópavogsbær.
Jansson, A. M., Hammer, M., Folke, C., & Costanza, R. (1994). Investing in Natural
Capital: The Ecological Economics Approach To Sustainability. Island Press.
Jóhannsson, V. (1988). The life cycles of Simulium vittatum Zell. in Icelandic outlets.
Limnology , 23: 270-278.
Jones, J. I., Moss, B., Eaton, J. W., & Young, J. O. (2000). Do submerged aquatic
plants influence periphyton community composition for the benefit of invertebrate
mutualists? Freshwater biology , 43: 591-604.
Jónsson, B. (2004). Kviðgaddalaus hornsíli í Vífilsstaðavatni. Þróun og sérstaða.
Afmælisráðstefna Líffræðifélags Íslands. Veggspjald. Reykjavík.
Jónsson, B. (1999). Rannsóknir á lífríki Vífilsstaðavatns sumarið 1998. Reykjavík:
Veiðimálastofnun.
Jónsson, J. (1975). Heiðmörk, jarðfræðilegt yfirlit. Ársrit Skógræktarfélags Íslands,
29-35.
Kahneman, D., & Knetsch, J. L. (1992). Valuing public goods: the purchase of moral
satisfaction. Journal of Environmental Economics and Management, 22: 57–70.
Kling, G., Kipphut, G., & Miller, M. (1992). The flux of CO2 and CH4 from lakes
and rivers in arctic Alaska. Hydrobiologia, 240, 23–36.
Kristjánsdóttir, A. E., Jóhannsson, B., Sigurðsson, B. H., Baldursson, F., Malmquist,
H., Hinriksdóttir, I., et al. (1998). Útivistarsvæði Kópavogs. Kópavogur:
Bæjarskipulag Kópavogsbæjar.
Kristjánsson, J. (2003). Mat á veiðiálagi í Elliðavatni 2002. Reykjavík: fiski -
Rannsóknir og ráðgjöf -.

93
Lancaster, K. (1966). A new approach to consumer theory. Journal of Political
Economy, 74; 132-156.
Laughland, A. S., Musser, W. N., Shortle, J. S., & Musser, L. M. (1996). Construct
Validity of Averting Cost Measures of Environmental Benefits. Land Economics ,
Vol. 72, No. 1: pp. 100-112.
Limburg, K. E., & Folke, C. (1999). The ecology of ecosystem services: introduction
to the special issue. Ecological Economics , 29: 179-182.
Limburg, K. E., O’Neil, R. V., Costanza, R., & Farber, S. (2002). Complex systems
and valuation. Ecological Economics , 41: 409–420.
Lindenmayer, D., & Burgman, M. A. (2005). Practical Conservation Biology. Csiro
Publishing.
Linhart, J. (1999). Phytophilous Macrofauna in the Stratiotes Aloides. Biologica , 37:
67-76.
Lupi, F., Kaplowitz, M. D., & Hoehn, J. P. (2002). The Economic Equivalency of
Drained and Restored Wetlands in Michigan. American Journal of Agricultural
Economics, 84: 1355-1361.
Malmquist, H. J., & Gíslason, G. M. (2007). Lífríki stöðuvatna á höfuðborgarsvæðinu;
gróður og smádýr. Vötn og vatnasvið á höfuðborgarsvæðinu - ástand og horfur, bls.
59-66. Reykjavík.
Malmquist, H. J., Antonsson, T., Ingvason, H. R., Ingimarsson, F., & Arnason, F.
(2009. (In Press)). Salmonid fish and warming of shallow Lake Ellidavatn in SW-
Iceland. Verh.Internat.Verein.Limnol.
Malmquist, H. J., Ingimarsson, F., & Ingvason, H. R. (2004). Vöktun á lífríki
Elliðavatns: Forkönnun og rannsóknartillögur. Kópavogur: Náttúrufræðistofa
Kópavogs.
Marteinsson, G. (1975). Skógrækt og skyld störf á Heiðmörk. Ársrit Skógræktarfélag
Íslands , 3-28.
Martın-Lopez, B., Gomez-Baggethun, E., Lomas, P. L., & Montes, C. (2009). Effects
of spatial and temporal scales on cultural services valuation. Journal of Environmental
Management , 90; 1050–1059.
McMichael, A., Scholes, R., Hefny, M., Pereira, E., & Palm, C. (2005). Chapter 3:
Linking Ecosystem Services and Human Well-being. Millenium Ecosystem
Assessment.
MEA. (2005). Chapter 1: MA Conceptual framework.

94
Meffe, G. K., & Carroll, C. R. (1997). Principles of Conservation Biology.
Sunderland, Massachusetts: Sinauer Associates, Inc.
Mitchell, R., & Carson, R. (1989). Using surveys to value public goods: the
contingent valuation method. Washington D.C.: Resources for the Future.
Nunes, P. A., & van den Bergh, J. C. (2001). Economic valuation of biodiversity:
sense or nonsense? Ecological Economics , 39: 203-222.
Ólafsson, Brynjólfur Örn (2009). Verðmæti íslenskra stangaveiðisvæða. Reykjavík:
Háskóli Íslands.
Ozdemiroglu, E., Tinch, R., Johns, H., Provins, A., Powell, J. C., & Twigger-Ross, C.
(2006). Valuing Our Natural Environment. London: Department for Environment,
Food and Rural Affairs.
Parsons, G. R. (2003). Chapter 9: The Travel Cost Model. Í P. Champ, K. J. Boyle, &
T. C. Brown, A Primer on Nonmarket Valuation, bls. 269-329. Dordrecht,
Netherlands: Kluwer Academic Publishers.
Polis, G. A., Anderson, W. B., & Holt, R. D. (1997). Toward an integration of
landscape and food ecology: The Dynamics of Spatially Subsidized Food Webs.
Annual Reviews Ecological Systems , 28: 289–316.
Pomeroy, R. (1992). Economic valuation: available methods. Í T. Chuan, & L. Scura,
Integrative Framework and Methods for Coastal Area Management, bls. 149–162.
ICLARM Conference Proceedings.
Ribaudo, M., & Shortle, J. (2001). Estimating Benefits and Costs of Pollution Control
Policies. Í J. Shortle, & D. Abler, Environmental Policies for Agricultural Pollution
Control, bls. 85–122. UK: CABI Publishing.
Rodriguez, J. P. (2006). Trade-offs across Space, Time, and Ecosystem Services.
Ecology and Society , 11: 28.
Rodriguez, J. P., Beard, T. D., Agard, J., Bennett, E., Cork, S., Cumming, G., et al.
(2005). Interactions among Ecosystem Services. . In P. P. S. Carpenter, Ecosystems
and Human Well-being: Scenarios of the Millenium Ecosystem Assessment , Ch. 12 .
Oxford, UK: Island Press.
Rooney, N., Kalff, J., & Habel, C. (2003). The Role of Submerged Macrophyte Beds
in Phosphorus and Sediment Accumulation in Lake Memphremagog, Quebec,
Canada. Limnology and Oceanography, 48: 1927–1937.
Rosen, S. (1974). Hedonic Prices and Implicit Markets: Product Differentiation in
Pure Competition. Journal of Political Economy , 82; 34-55.

95
Rubin, E. S., & Davidson, C. I. (2001). Introduction to engineering & the
environment. New York: McGraw-Hill.
Savino, J., & Stein, R. (1982). Predator-prey interaction between largemouth bass and
bluegills as influenced by simulated submersed vegetation. Transactions of the
American Fisheries Society , 111: 255-266.
Shaw, W. (1992). Searching for the opportunity cost of an individual´s time. Land
Economics , 68: 107-115.
Shrestha, R. K., Seidl, A. F., & Moraes, A. S. (2002). Value of recreational fishing in
the Brazilian Pantanal: a travel cost analysis using count data models. Ecological
Economics , 42: 289–299.
Skógræktarfélag Reykjavíkur. (2009). Sótt 15. August 2009 frá Heiðmörk:
www.heidmork.is
Skúlason, P. (2006). The Ethics of Nature: Nature, Values and Our Duties Towards
Animals. Í Æ. Sigurjónsdóttir, & Ó. P. Jónsson, Art, Ethics and Environment: A free
inquiry to the vulgarly received notion of nature, bls. 12-20. Newcastle, UK:
Cambridge Scholars Press.
Snorrason, S. S., Kristjánsson, B. K., Ólafsdóttir, G. D., Malmquist, H. J., &
Skúlason, S. (2002). Hornsílið. Lífið í Vatninu .
Sohngen, B., Lichtkoppler, F., & Bielen, M. (2000). The value of day trips to Lake
Erie Beaches. Ohio: Department of Agricultural, Environmental and Development
Economics.
Skólaskýrsla (2008). Reykjavík: Samband íslenskra sveitafélaga, hag- og upplýsinga
svið.
Swart, J. A., van der Windt, H. J., & Keulartz, J. (2001). Valuation of Nature in
Conservation and Restoration. Restoration Ecology , 9: 230-238.
Taylor, L. O. (2003). The Hedonic Method. Í P. A. Champ, K. J. Boyle, & T. C.
Brown, A Primer on Nonmarket Valuation, bls. 331-393. Dordrecht: Kluwer
Academic Publishers.
Teutsch, G. (1985). Lexikon der Umweltethik (Encyclopedia of Environmental Ethics).
Göttingen: Vandenhoeck & Ruprecht.
Þórðarson, T. (2003). Mengunarstaða Elliðavatns 2001-2002. Reykjavík:
Háskólasetrið í Hveragerði.
Tilman, D. (1999). Global environmental impactsof agricultural expansion: The need
for sustainable and efficient practices. National Academy of Sciences colloquium:

96
Plants and Population, Is There Time?, pp. 5995-6000. Irvine, CA: Proc. Natl. Acad.
Sci. USA.
Tyrvainen, L. (1997). The amenity value of the urban forest: an application of the
hedonic pricing method. Landscape and Urban Planning , 37: 211-222.
Verkís. (2009). Sundabraut. Arðsemismat. Reykjavík: Reykjavíkurborg og
Vegagerðin.
Vilkka, L. (1997). The intrinsic value of nature. Amsterdam - Atlanta: Editions
Rodopi B.V.
Vitousek, P., Mooney, H., Lubchenco, J., & Melillo, J. (1997). Human domination of
Earth’s ecosystems. Science , 277: 494–499.
Wallace, K. J. (2007). Classifictaion of Ecosystem services: Problems and Solutions.
Biological Conservation , 139: 235-246.

97
Annex 1
Hagrænt mat á fjölþættri þjónustu vistkerfa
~ Virði Heiðmerkur ~
Kæri þátttakandi,
Um þessar mundir stendur yfir heildstætt verðmætamat á náttúru- og
útivistarsvæði Heiðmerkur. Heildstætt verðmætamat er
grundvallarforsenda þess að hægt sé að nýta og vernda svæðið og náttúru
þess af skynsemi og fyrirhyggju. Slíkt verðmætamat er ekki hægt að
framkvæma nema með þátttöku þeirra sem nota Heiðmörk. Könnun þessi
er einn liður í verðmætamatinu og verður hún notuð til þess að meta
verðmæti frístundaveiða í Elliðavatni. Að framkvæmd verðmætamatsins
standa Háskóli Íslands, Rannsóknarstöð Skógræktar ríkisins að Mógilsá,
Skógræktarfélag Íslands, Skógræktarfélag Reykjavíkur, Reykjavíkurborg,
Garðabær og Orkuveita Reykjavíkur. Dr. Brynhildur Davíðsdóttir er
ábyrgðamaður rannsóknarinnar fyrir hönd Háskóla Íslands.
Allar persónuupplýsingar sem upp eru gefnar í könnun þessari verða
órekjanlegar til einstakra þátttakenda. Mjög mikilvægt er að öllum
spurningum sé svarað eftir bestu getu.
- Kærar þakkir fyrir þátttökuna

98
1. Ritaðu dagsetningu veiðidags.
2a. Veiðitímabilið í Elliðavatni er frá 1 maí til 15 september, ár hvert.
Hversu oft að meðaltali á viku veiðir þú í Elliðavatni yfir veiðitímabilið.
1 sinni
2-3 sinnum
4-5 sinnum
6-7 sinnum
Annað, þá hvað __________________________________________
2b. Hversu oft á síðasta veiðitímabili, árið 2008, veiddir þú í Elliðavatni?
_________________________________________________
2c. Hversu marga fiska veiddir þú á síðasta veiðitímabili í Elliðavatni?
_________________________________________________
2d. Hversu oft á veiðitímabilinu árið 2007, veiddir þú í Elliðavatni?
_________________________________________________
2e. Hversu marga fiska veiddir þú á veiðitímabili ársins 2007 í
Elliðavatni?
_________________________________________________

99
3. Hvað gerir þú vanalega við aflann sem þú veiðir?
Hirði hann
Sleppi hluta hans
Sleppi öllum
4. Af hverju veiðir þú í Elliðavatni? Vinsamlegast raðið eftirfarandi
ástæðum í röð frá 1 upp í 5 eftir mikilvægi þeirra þar sem
mikilvægasta ástæðan fær númerið 1 o.s.frv.
Nálægð við höfuðborgarsvæði
Verð veiðileyfa
Njóta náttúru
Veiðivon
Annað, þá hvað __________________________________________
5. Á undanförnum árum hefur byggð verið að færast nær Elliðavatni.
Hvaða áhrif telur þú að það hafi á veiðivenjur þínar í Elliðavatni?
Mjög líklegt er að ég muni auka komur mínar
Frekar líklegt er að ég muni auka komur mínar

100
Engin áhrif tíðni ferða
Frekar líklegt er að ég muni minnka komur mínar
Mjög líklegt er að ég muni minnka komur mínar
6. Hversu oft á síðasta veiðitímabili, árið 2008, veiddir þú annarstaðar
en í Elliðavatni?
_____________________________________________________
7. Hversu oft á síðasta veiðitímabili veiddir þú í eftirfarandi vötnum:
Hafravatn _____
Reynisvatn _____
Vífilsstaðavatn _____
Hvaleyrarvatn _____
8. Hversu löngum tíma býst þú við að eyða við vatnið í dag?
_________________________________________________
9. Hvert er áætlað verðmæti (í krónum) þess búnaðar sem þú notar
við veiðar að Elliðavatni?
________________________________________________
10. Hvers konar veiðileyfi veiðir þú á?
Dagsleyfi, greitt af sveitarfélagi
Dagsleyfi

101
Sumarleyfi
11. Með hvaða hætti komst þú að Elliðavatni í dag?
Á einkabifreið
Gangandi
Annað ___________________________________________
12. Ef þú ferðaðist með einkabifreið merktu þá annað hvort í reitinn
„Fólksbifreið“, eða „Jeppi“ eftir því sem við á.
Fólksbifreið
Jeppi
13. Ef þú ferðaðist með einkabifreið, hversu margir voru í bifreiðinni?
_____________________________________________
Hversu margir voru undir 18 ára?
_____________________________________________
14. Var koma þín að Elliðavatni eini tilgangur ferðar þinnar?
Já
Nei

102
Ef þú hefur merkt í „Nei“ reitinn, að hversu stórum hluta var koma þín í
Heiðmörk í dag, ástæða ferðarinnar?
15. Við hvaða götu býrð þú og hvert er póstnúmerið? Alls ekki skrifa
húsnúmer!
16. Merktu við kyn þitt.
KK
KVK
17. Hvaða ár fæddist þú?
18. Hver er hjúskaparstaða þín?
Í hjónabandi
Í sambúð
Einhleyp/einhleypur
Ekkja/ekkill
19. Hversu margir búa á heimili þínu?

103
Hversu margir eru undir 18 ára?
______________________________________________
20. Hvert er hæsta menntunarstig sem þú hefur lokið?
Grunnskólapróf
Stúdentspróf
Iðnnám
Grunnám á háskólastigi
Framhaldsnám á háskólastigi
21. Hver er atvinnuþátttaka þín?
Í fullu starfi
Í hluta starfi
Atvinnulaus
Utan vinnumarkaðar (t.d. heimavinnandi húsmæður, eldri
borgarar, öryrkjar og námsmenn)

104
22. Hverjar eru ráðstöfunartekjur heimilisins á ársgrundvelli?
Ráðstöfunartekjur eru allar tekjur heimilisins eftir skatta. Merktu í
þann reit sem endurspeglar svar þitt sem best.
0 – 2.500.000,- kr.
2.500.001 – 5.000.000,- kr.
5.000.001 - 7.500.000,- kr.
7.500.001 - 10.000.000,- kr.
10.000.001,- kr eða hærri
Kærar þakkir fyrir þáttökuna
