mozambique: a climate analysis
TRANSCRIPT

ForewordThis document presents a climate analysis for Mozambique,based on analyses of medium term records (36 years, 1981to 2016) of precipitation, vegetation and temperature.
The analysis has three main themes – averages, variabilityand trends. Averages describes the broad climate features.Inter-annual variability describes high frequency, year-on-year changes. Trends evaluate the degree and direction oflonger term variations.
Specific analysis for the start, end and length of rainfallseason are included, so as to provide a detailed account ofthe patterns and tendencies of change in growing seasontimings.
The effects of ENSO phases is also analysed through themapping of the variations in rainfall between El Niño-La Niñadominated seasons versus neutral seasons.
MOZAMBIQUE:A Climate Analysis
1
Produced in the framework of the IFAD-WFP Joint Climate Analysis Partnership
Mozambique Climate Analysis
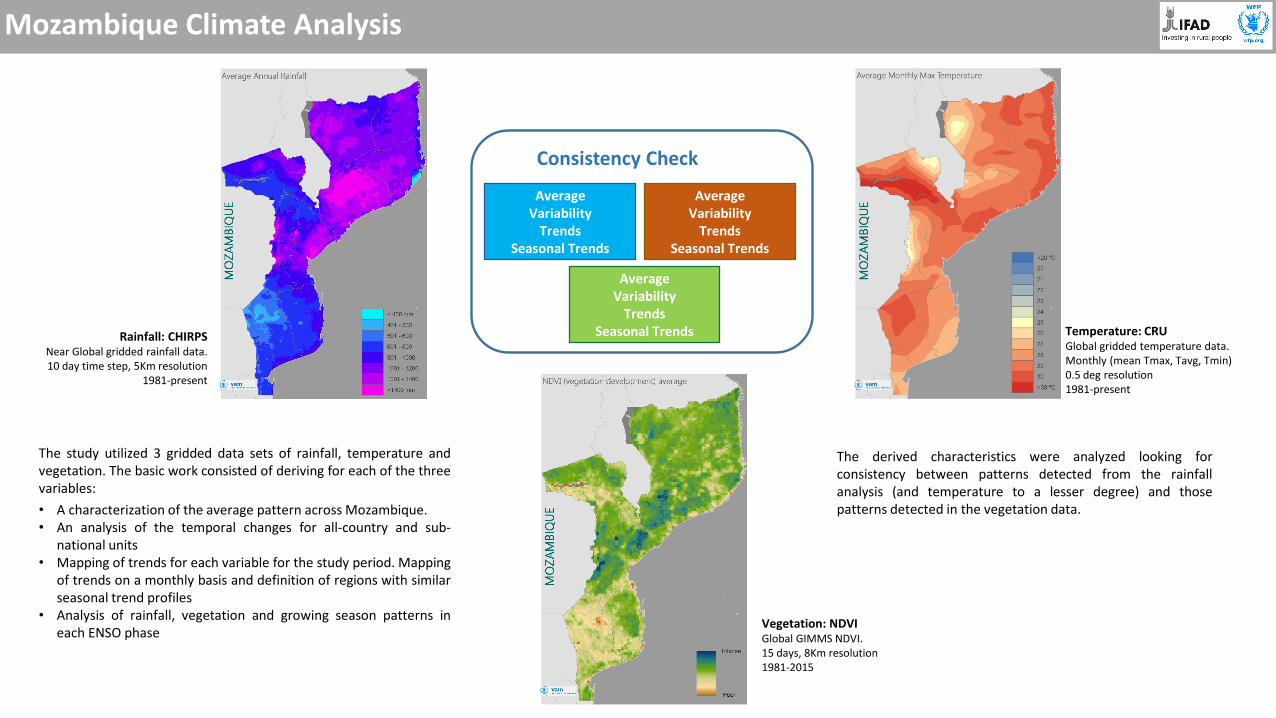
The study utilized 3 gridded data sets of rainfall, temperature andvegetation. The basic work consisted of deriving for each of the threevariables:
• A characterization of the average pattern across Mozambique.• An analysis of the temporal changes for all-country and sub-
national units• Mapping of trends for each variable for the study period. Mapping
of trends on a monthly basis and definition of regions with similarseasonal trend profiles
• Analysis of rainfall, vegetation and growing season patterns ineach ENSO phase
Rainfall: CHIRPSNear Global gridded rainfall data.10 day time step, 5Km resolution
1981-present
Vegetation: NDVIGlobal GIMMS NDVI.15 days, 8Km resolution1981-2015
The derived characteristics were analyzed looking forconsistency between patterns detected from the rainfallanalysis (and temperature to a lesser degree) and thosepatterns detected in the vegetation data.
AverageVariability
TrendsSeasonal Trends
AverageVariability
TrendsSeasonal Trends
AverageVariability
TrendsSeasonal Trends
Consistency Check
Temperature: CRUGlobal gridded temperature data.Monthly (mean Tmax, Tavg, Tmin) 0.5 deg resolution 1981-present

SUMMARYThe analysis used a 36 year long gridded rainfall record (CHIRPS)from 1981 to 2017, a gridded temperature record covering thesame time span and a satellite vegetation index data set alsocovering the same period. The rainfall data enabled the analysisof 36 seasons in Mozambique, and an identical number fortemperature. The vegetation data set was somewhat shorter,ending in 2015 and enabling analysis of 34 growing seasons.
The rainfall season in Mozambique lasts from October to Maywith small amounts also possible outside this bracket. Most ofthe rainfall comes between November and April. The wettestperiod within the season is December-January with January beingthe wettest month across the whole country. There is a clearsouth to north increase in average rainfall amounts and a lesswell marked increase from interior to coastal areas. Driestprovinces are Maputo, Gaza and Tete. SLIDES 13-14.
An initial analysis of the temporal variations of rainfall for thestudy period 1981-82 to 2016-17, revealed the absence of adefined long term trend for the country average rainfall; thecountry has experienced broad periods with distinct rainfallbehaviour; in particular, the driest period in the recent past from1990/91 to 1995/96, that was followed by the wettest period inthe same record lasting from 1996/97 to 2000/01. Since thenrainfall has fluctuated around the long term mean. A provincelevel analysis shows highlights different flavours of this overallbehaviour with the northern provinces displaying considerabledeparture from the country wide picture. SLIDES 15-16
Overlaid on these multi-year changes, the country experiencesvery considerable inter-annual variability particularly in the drierareas of the south. SLIDE 17
3

While there is no overall rainfall trend considering thecountry as a whole, a full mapping of rainfall trends showssignificant variations across the country: trends in seasonalrainfall appear positive (increasing) in the southernmostthird and western areas of the country and moderatelydecreasing in the northern provinces. An analysis of thevariation of rainfall trends along the season indicates thatthe increase in seasonal rainfall in the south and west of thecountry mostly arises from increases in December andJanuary, already the wettest period of the season. On theother hand, the decrease in seasonal rainfall in the centreand north of the country are mostly due to decreases inearly season rainfall (October-December). SLIDES 18-20
Similar patterns are seen in the longer term variations in thenumber of rain days. Here there is a noticeable decreasingtrend in the number of rain days at country wide level. Thisdecrease again shows considerable geographical variationsbeing much more pronounced in the four northernprovinces. Elsewhere, trends in seasonal rain days aremoderately positive. Again the tendency is also for thereduction in the number of rain days to be concentrated inthe earlier stages of the season (October-December). SLIDES21-24
Analysis of the occurrence of heavy rainfall days, shows these to bemore prevalent in Zambezia province, as expected since it is thewettest area of the country. These heavy rainfall events have amoderate tendency to decrease in the northern third of the country,mirroring the trends in seasonal rainfall and number of raindays. Onthe other hand, dry spells are longer but also more variable in thedrier areas of the country – no significant trend is noticeable in thelength of dry spells across the country. SLIDES 25-30
Timings of growing season derived from modelled moistureindicators shows areas of shortest growing season length in Gazaand Tete provinces, mostly arising from a combination of later startand earlier end of suitable moisture conditions. Again Gaza is theregion with a very marked inter-annual variability in growing seasonlength. No tendency in growing season length is noticeable acrossmost of the country, except for large areas of the Nampula province.SLIDES 31-33.
The impact of the long term rainfall trends is reflected in theresponse of vegetation cover, which shows a moderate decreasingtendency at the national scale. However, this decrease is much moremarked in the northern provinces – here vegetation cover showsmarked decreasing trends in the early stages of the season,matching corresponding patterns of decreasing rainfall and numberof rain days. SLIDES 34-37
4

A major driver of inter-annual variability is ENSO, in its twophases, warm (El Niño) and cold (La Niña). The impact ofthese two phases was examined by comparing patterns inseasons under each phase with neutral seasons. El Niñoseasons are provinces on balance enjoy wetter early seasoncondition during El Niño. Rainfall reductions are mostpronounced in the January to March period. In contrast, LaNiña seasons have a positive influence on rainfall, againmore pronounced in the south and centre and duringJanuary to February. The El Niño rainfall patterns are wellreflected in the vegetation patterns for the same phase andperiods. The maps provide a ready identification of the areasmost affected by ENSO impacts, their timing and intensity.Slides 38-46
Temperature patterns show weak trends in Tmax and Tmin.Tmax increases are mostly concentrated within the rainfallseason and are more marked in southern and centralregions; Tmin shows decreases in the south of the countrymostly in the second half of the rainfall season. Slides 47-51.
5

TABLE of CONTENTS
6
BASIC MAPS 7
PROVINCE LEVEL MAIN FEATURES 9
RAINFALL 12
RAIN DAYS 21
HEAVY RAINFALL 25
DRY SPELLS 27
GROWING SEASON TIMING 30
NDVI (Vegetation) 33
ENSO PATTERNS 37
TEMPERATURE 46

BASIC MAPS
7

8

Province Level Main FeaturesMaputo
Southernmost province and one of the driest as well. Characterized by arelatively long season of low irregular rainfall. No noticeable trend inseasonal rainfall or rain days at provincial level. Fairly early start of thegrowing season leading to long growing seasons (up to 7 months insouthern areas). Moderate increasing trend in seasonal vegetation cover.
ENSO impacts are relatively modest, with El Niño leading to lower thanaverage rainfall and vegetation cover and shorter growing seasons.Rainfall is enhanced in La Nina seasons but mostly only during January toMarch.
Gaza
In general, the driest province of Mozambique and the one with fewer raindays. The coastal strip is wetter and with more frequent rainfall, in contrastwith a drier interior. Inter-annual variability in seasonal rainfall and rain daysis very high (highest in the country). The average dry spell length is thelongest in the country, together with Inhambane.
Weakly positive trend in seasonal rainfall at province level, mostly fromincreased rainfall in December and January. Moderate increase in vegetationcover around the peak of the season. Away from coastal areas, growingseason length can be very short (down to less than 2 months).
ENSO impacts are very pronounced with El Niño leading to stronglydecreased rainfall throughout the season but especially in January to March.La Niña events usually lead to enhanced rainfall in January to March.
Inhambane
A wetter province with high inter-annual variability and a tendency forincreasing seasonal rainfall. No trend on number of rain days or intenserainfall days. In contrast with Gaza, seasonal vegetation has a moderatedecreasing tendency. Wetter coastal areas have much longer growingseasons (7 months) in contrast with drier interior where growing seasoncan be as short as 2 months.
Like Gaza, El Niño events strongly decrease rainfall throughout theseason while La Niña events lead to enhanced rainfall in January toMarch.
Sofala
Rainfall shows transition values to those of northern provinces. Central coastalareas are wetter and have a long growing season in contrast with interiornorth which looks more like southern Tete. No significant trend in seasonalrainfall or rain days, but vegetation cover has a decreasing tendency.
El Niño reduces January to March rainfall, while La Niña modestly improvesrainfall throughout the season with earlier starts of the growing season.
9

Zambezia
The wettest province in the country, registering the highest averageseasonal rainfall (above 2000mm) in the districts of Lugela, Namarroi andAlto Molocue. Very high (highest) number of rain days and also the highestfrequency of heavy rain fall days.
However, there is an overall decreasing trend in seasonal rainfall, mainlyfrom reduced rainfall in October and November. Tendency for fewerseasonal rain days comes mainly from February-April and is stronger incoastal and northern areas. Vegetation cover as a result has a decreasinglong term tendency more pronounced in the early stages of the season.
El Niño leads to reduced rainfall in January to March, particularly in thesouthern areas, while La Niña has little impact. Overall ENSO impacts aremodest.
Nampula
Part of the wetter regions of the country with rainfall around the 1500mmmark, and high number of rain days. Overall decreasing trend in seasonalrainfall, arising from reduced rainfall in November-December and fewerrain days particularly in December. Vegetation cover as a result has adecreasing tendency particularly evident in the early stages of the season.
Both El Niño and La Niña have little impact on rainfall patterns in thisprovince but overall El Nino seasons tend to be shorter.
Tete
A province with marked contrasting rainfall varying from fairly dry areas inthe southern half to fairly wet in the areas bordering Malawi. Moderateincreasing trend in seasonal rainfall due to enhanced rainfall in January.Growing period is fairly short for this latitude, mostly within 2 to 3 months,mostly due to very early end of season conditions more similar to Gazathan to wetter regions of this latitude.
El Niño enhances early season rainfall and vegetation cover, but leads alsoto shorter seasons, while La Niña strongly increases rainfall in January toMarch, leading to longer growing seasons.
Manica
Similar to Sofala in terms of the broad features of the climate indicators.Central areas much wetter than northern areas of province. Being an interiorprovince, there are no areas of enhanced rainfall, longer growing periodstypical of coastal climates. Northern areas with shorter growing season(3mths) than southern areas (6mths). Overall tendency for increasingseasonal rainfall resulting from increases in December-January notcompensated by decreases in October-November. El Niño reduces peakseason (January to March) rainfall, while La Niña modestly improves rainfallthroughout the season leading to earlier starts of the growing season. LaNina seasons have increased vegetation cover in Feb-Apr.
10

Cabo Delgado
High rainfall province like Nampula with high number of rain days. Weaklydecreasing trend in seasonal rainfall, with reduced rainfall in November-December and fewer rain days. Vegetation cover as a result has adecreasing tendency coming mostly in the early stages of the season.
El Niño leads to much enhanced rainfall during October to December, andlittle to no impact during January to March. Some tendency for shorter ElNino seasons in the south of the province. La Niña has little effect.
Niassa
High rainfall province like Nampula with very high number of rain days andshortest average dry spell length. No noticeable trend in overall seasonalrainfall, but reduced rainfall in November-December and fewer rain days.Vegetation cover as a result has a decreasing tendency in the early stagesof the season.
Like Cabo Delgado, El Niño leads to much enhanced rainfall during Octoberto December, and little to no impact during January to March. La Niña hasalso little effect.
11

RAINFALL
12

Average Seasonal Rainfall
The rainfall season lasts from October to May, though most rainfall is concentrated within November to April (see chart below). Fig 1 shows the mean seasonal precipitation in the 1982-2017 period.
Areas of lower rainfall include the southern provinces of Maputo, Gaza and Inhambane as well as the southern half of Tete. In western Gaza rainfall is lowest, with seasonal amounts of around 500mm.
High rainfall areas include the four northern provinces of Cabo Delgado, Niassa, Nampula and Zambezia. In the latter, seasonal amounts may reach just over 2000mm
Fig.1 – Average annual rainfall
13

Rainfall: Province-level long term average seasonal profiles
The charts show the long term (1982-2016) seasonal rainfall profile for each of the provinces of Mozambique. Apart fromsizeable variations in amount, the rainfall regime across the country is clearly unimodal. In northern and interior provincesrainfall is limited to the October-May period, but in coastal provinces, significant rainfall can still occur until August.
Charts: Blue bars representlong term average of 10 daymean provincial rainfall.
14

Rainfall: a broad long term view
Fig 2 shows a plot of the all-Mozambique seasonal rainfall from1982-83 to 2016-17. It ignores within country variation in order toprovide a rapid overview of the changes in rainfall along theavailable temporal record.
The plot illustrates how rainfall variability occurs at several scales:there are medium term variations such as the dry period of theearly 90s followed by a very wet period from the late 90s up to2000, after which seasonal rainfall has been aligned with the longterm average. These patterns are better perceived by the 10 yearmoving average shown as a red line in the plot.
Super-imposed on these medium term changes, there aresubstantial year on year variations with sometimes drastic changesin rainfall from one year to the next.
Overall, at this scale there is no noticeable trend in the seasonalrainfall. Trends are very slow long term variations and forMozambique at country scale, any slow change is swamped by themagnitude of both medium term changes and the year on yearvariations.
However, there is a need to examine whether there may be sub-national trends within this country sized window (next).
Fig.2 – All-Mozambique seasonal rainfall amounts
Chart: In blue (TS) the seasonal rainfall amounts. In red (MA) a 5 year movingaverage. In black (Trend) is a fitted OLS trend line. The moving average linesmooths sharp variations and highlights broader patterns of variation.
15
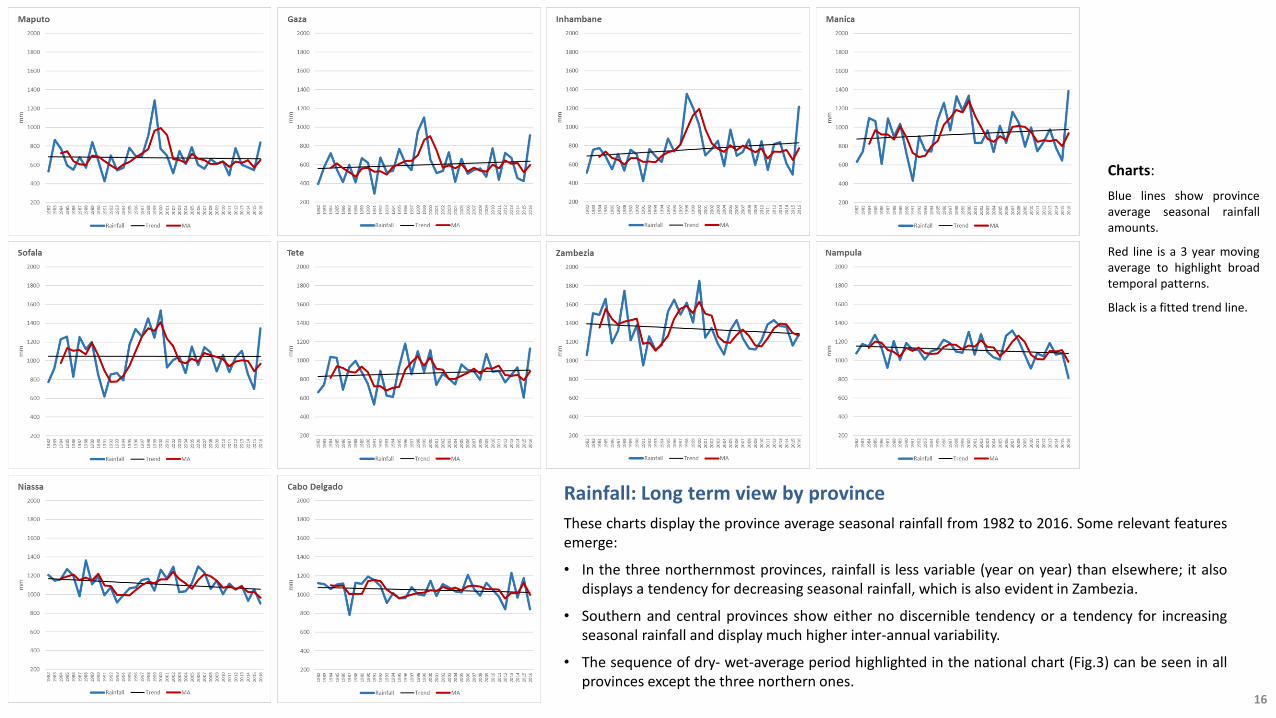
Rainfall: Long term view by province
These charts display the province average seasonal rainfall from 1982 to 2016. Some relevant featuresemerge:
• In the three northernmost provinces, rainfall is less variable (year on year) than elsewhere; it alsodisplays a tendency for decreasing seasonal rainfall, which is also evident in Zambezia.
• Southern and central provinces show either no discernible tendency or a tendency for increasingseasonal rainfall and display much higher inter-annual variability.
• The sequence of dry- wet-average period highlighted in the national chart (Fig.3) can be seen in allprovinces except the three northern ones.
Charts:
Blue lines show provinceaverage seasonal rainfallamounts.
Red line is a 3 year movingaverage to highlight broadtemporal patterns.
Black is a fitted trend line.
16
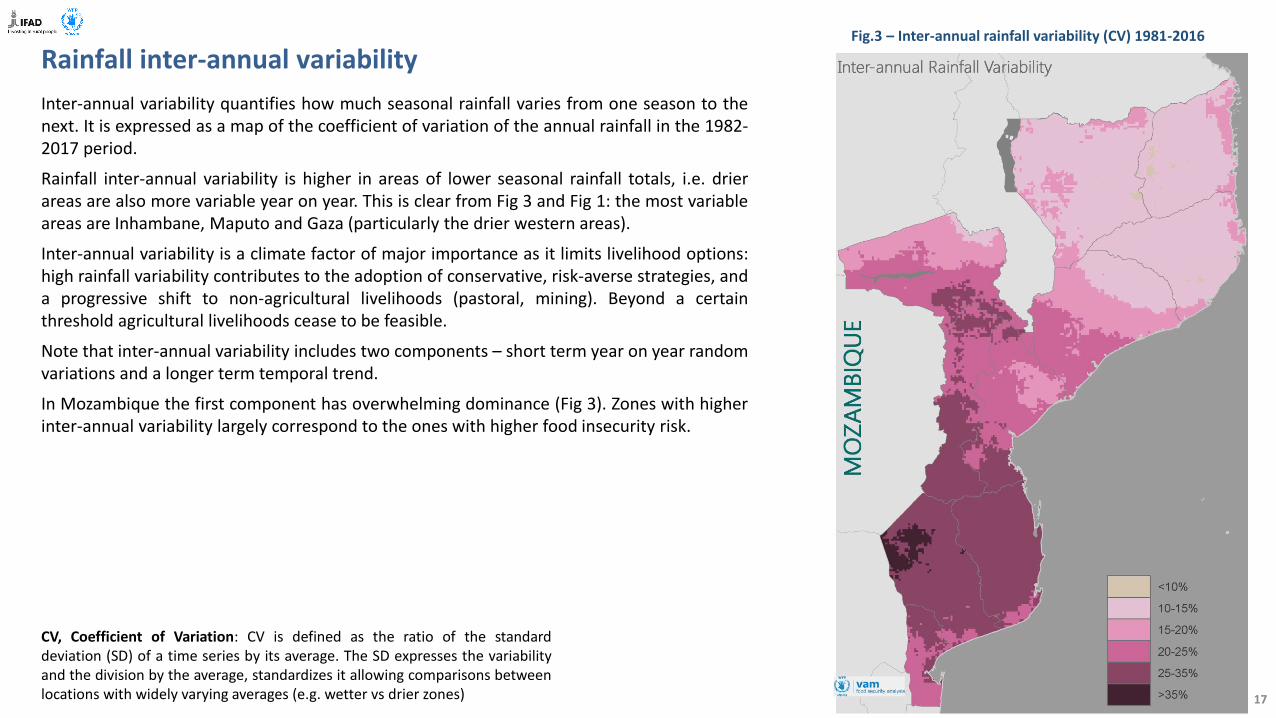
Rainfall inter-annual variability
Inter-annual variability quantifies how much seasonal rainfall varies from one season to thenext. It is expressed as a map of the coefficient of variation of the annual rainfall in the 1982-2017 period.
Rainfall inter-annual variability is higher in areas of lower seasonal rainfall totals, i.e. drierareas are also more variable year on year. This is clear from Fig 3 and Fig 1: the most variableareas are Inhambane, Maputo and Gaza (particularly the drier western areas).
Inter-annual variability is a climate factor of major importance as it limits livelihood options:high rainfall variability contributes to the adoption of conservative, risk-averse strategies, anda progressive shift to non-agricultural livelihoods (pastoral, mining). Beyond a certainthreshold agricultural livelihoods cease to be feasible.
Note that inter-annual variability includes two components – short term year on year randomvariations and a longer term temporal trend.
In Mozambique the first component has overwhelming dominance (Fig 3). Zones with higherinter-annual variability largely correspond to the ones with higher food insecurity risk.
Fig.3 – Inter-annual rainfall variability (CV) 1981-2016
CV, Coefficient of Variation: CV is defined as the ratio of the standarddeviation (SD) of a time series by its average. The SD expresses the variabilityand the division by the average, standardizes it allowing comparisons betweenlocations with widely varying averages (e.g. wetter vs drier zones) 17

Fig.4 – Annual rainfall trend (%/10yrs)
Annual rainfall trendsAs shown in Fig.3, there is little to no long term trend in seasonal rainfall at the wholecountry level.
Fig 4 shows the long term trend in seasonal rainfall calculated on a pixel by pixel basis. Somepatterns emerge – the southern and western zones show a positive trend while the centraland northern have mostly negative trends. Most of these long term trends are moderate,except for some areas of Niassa province bordering Tanzania and some coastal areas ofNampula province.
This analysis can be broken down further by mapping rainfall trends for each monthseparately. This allows us to understand how long term rainfall changes are distributedalong the season: e.g. you could have a long term decrease in the first half of the seasonand an increase in the second half, balancing out into no apparent trend over the wholeseason.
This is presented in the next section.
Trends: Trends quantify long term tendencies in a given variablesuch as rainfall. Negative trends indicate that the variable(seasonal rainfall in this case) tends to decrease over the lengthof the analysed record. For positive trends the reverse happens.
For rainfall, trends are expressed in mm/year (mm of rainfallincreased or decreased per year). However, we chose toexpress the trend in terms of variation every 10 years (which wethink is easier to grasp); we have further normalized the rainfallvariation by the long term average, so that the magnitude ofthe variation can be better understood.
Example: A trend of -2.4mm/year for a location with anaverage seasonal rainfall of 1200mm (Nampula), is hereexpressed as -2%/10years. The same trend for alocation with 600mm average seasonal rainfall (Gaza) isexpressed here as -4%/10years, highlighting the factthat in Gaza the same trend leads to proportionallyhigher reduction in rainfall.
18

Monthly rainfall trendsThe monthly trend analysis is presented in Figure 5: each panelshows the trend in monthly rainfall for each month in thecalendar year.
The maps reveal a negative trend in rainfall in central andnorthern Mozambique during October and November (andpartly December). This may be reflected in a tendency for lateronset of the growing season due to more frequent low rainfallin the very early stages of the season.
In December and January trends are generally positive,particularly in the southern half of the country. January isalready the wettest period in the country and seems to begetting increasingly wetter.
The second half of the season (February and March) are lesswell defined – some drying tendency in southern Mozambiquefor February may be relevant. From April onwards, rainfallamounts are fairly small and trends becomes less relevant.
Fig.5 – Rainfall monthly trends
19

Tren
d
Positive Monthly Trends
Negative Monthly Trends
Monthly rainfall trends
This section summarizes the monthly trend analysis into ajoint map and plot (Fig 6a and 6b). The analysis identifiesregions where the monthly trends behave in a similar way.
Three main regions were identified and shown in the map.The aggregated monthly trends for each zone are plotted inthe chart.
Zone 2 (in orange) shows strong negative rainfall trends inOctober and November with slightly positive trends inDecember and January and moderately negative in the restof the season. Zone 3 (blue, north of the country) has similarbehaviour but the strong negative trends are in Novemberand December, with no significant trends in the rest of theseason. Zone 4 (green, south and west) shows early seasondecreasing trends but mainly increasing rainfall trends inDecember and January.
The monthly trends confirm the overall trends shown in Fig 4,but add useful sub-seasonal detail. The decreasing seasonalrainfall in the north of the country (zones 2 and 3) mainlyresults from significant decreases in rainfall during the earlystages in the season. This will be confirmed later whenlooking at trends in the timings of the season.
The increasing seasonal rainfall in the south and westernregions arise mostly from increases in the wetter period ofthe season, with moderate tendencies for increasingly drierearly season stages.
Fig.6b – Rainfall zonal monthly trend temporal evolution
Fig.6a – Rainfall monthly trend zoning
20

RAIN DAYS
21
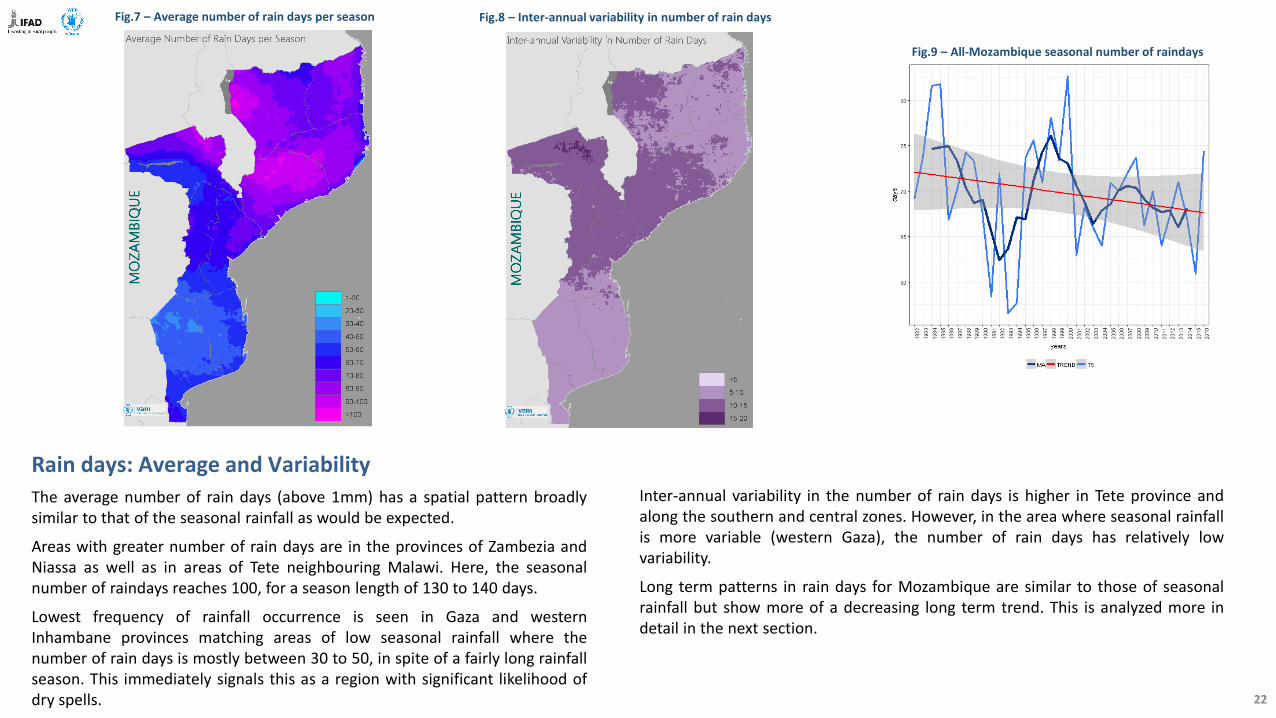
Rain days: Average and Variability
The average number of rain days (above 1mm) has a spatial pattern broadlysimilar to that of the seasonal rainfall as would be expected.
Areas with greater number of rain days are in the provinces of Zambezia andNiassa as well as in areas of Tete neighbouring Malawi. Here, the seasonalnumber of raindays reaches 100, for a season length of 130 to 140 days.
Lowest frequency of rainfall occurrence is seen in Gaza and westernInhambane provinces matching areas of low seasonal rainfall where thenumber of rain days is mostly between 30 to 50, in spite of a fairly long rainfallseason. This immediately signals this as a region with significant likelihood ofdry spells.
Inter-annual variability in the number of rain days is higher in Tete province andalong the southern and central zones. However, in the area where seasonal rainfallis more variable (western Gaza), the number of rain days has relatively lowvariability.
Long term patterns in rain days for Mozambique are similar to those of seasonalrainfall but show more of a decreasing long term trend. This is analyzed more indetail in the next section.
Fig.7 – Average number of rain days per season Fig.8 – Inter-annual variability in number of rain days
Fig.9 – All-Mozambique seasonal number of raindays
22

Fig.10 – Trend in seasonal rain days (days/10yrs)
Rain days: TrendsThe trend in seasonal number of rain days showsnegative values in the four northern provinceswith up to 6 fewer rain days every 10 years.
The southern and western provinces show amoderate positive tendency of no more than 2rain days per 10 years.
Fig.11 – Monthly rainy days trend (days/10yrs)
Rain days: Monthly TrendsAnalysing the trend on a monthly basis (Fig 11),shows that in the northern provinces the tendencyfor fewer rain days is present in most months,except January.
In the southern provinces (Maputo, Gaza,Inhambane) except for an increase in Januarythere is no defined tendency in the number of raindays.
In December and particularly January there is amore marked tendency for an increase in raindays. This is reversed in February with a markedtendency for a decrease in the number of raindays particularly in Zambezia, with somecontinuation in March.
There is good agreement with the rainfall trendsas expected, but negative tendencies in thenumber of rain days will also lead to an increase inthe length or frequency of dry spells.
23

Monthly Rain days trendsThe rain days monthly trend analysis can besummarized into a joint map and plot (Fig 12a and12b). The analysis identifies regions where themonthly trends behave in a similar way.
Four main regions were identified and shown inthe map. The aggregated monthly trends for eachzone are plotted in the chart.
Zone 5 (light green) is an area with decreasingnumber of rain days throughout the season but inparticular in December. Zone 2 (orange) alsoshows a decrease through the season but morepronounced in November and March. Zone 4(green) shows moderate increase in Decemberand January but strong decreases in February andMarch. Zone 1 (dark blue) apart from a moderateincrease in January shows only small fluctuationsthrough the season.
Fig.12b – Rain days zonal monthly trend seasonal evolution
Fig.12a – Rain days monthly trend zoning
24

HEAVY RAINFALL
Very heavy rains are defined as days with more than 20mm of rainfall
[Ref. ETCCDI Climate Extremes Indices].
For each season on record, the total number of these events are produced and analysed.The analysis does not look into continuous sequences of these types of events
25

Very Heavy Rain Days: AverageThe pattern of frequency of very heavy rainfall days (Fig 13) is fairlysimilar to the patterns in the average seasonal rainfall (more/fewerheavy rain days are expected where seasonal rainfall ishigher/lower):
Zambezia province is where heavy rain days are more predominant(between 30-40 per season) with pockets in Sofala province.
Lowest frequency is in western Gaza province where on averagefewer than 10 are registered per season.
Fig.13 – Annual very heavy rain days mean
Very Heavy Rain Days: TrendsThe trend in heavy rainfall days (Fig 14) is similar to that of seasonal rainfallas well. In the south and west of the country an increase in the number ofvery heavy rainfall days is noticeable matching the tendency for increasedseasonal rainfall.
In the north the tendency is for a decrease along the border with Tanzaniaand Malawi and very moderate increases elsewhere. Note that (Fig 15) theincrease in heavy rain days is mostly concentrated in January (and somefrom March and April in the north), with December making a smallercontribution.
Fig.14 – Annual very heavy rain days trend (%days/10yrs) Fig.15 –Heavy rain days monthly trend (days/10yrs)
26

DRY SPELLS
Dry Spells are defined as continuous periods with rainfall less than 2mm. Amountssmaller than 2mm are considered not to impart benefit to vegetation or crops.
[Ref. De Groen and Savenije (2006)]
For the analysis we looked into the longest dry spell within the core seasonalperiod of December to March. Hence one value is obtained per season, which isthen analyzed in the usual way.
27

Dry spells: Average / Variability
Seasonal rainfall amounts are not sufficient toevaluate the quality of the growing season;distribution of rainfall is equally important, inparticular the presence of dry periods thatmaybe long enough to overcome crop’s naturalresistance.
This section looks at dry spell occurrence withinthe core seasonal period of December toFebruary (DJF). Dry spell is defined as thenumber of days with rainfall below 2mm(amount judged too low to be of agriculturalsignificance).
For each season the longest dry spell within theDJF period is derived and the average over allseasons on record is produced. The result isshown in Fig 16: the area with the longest dryspells (20-25 days) is in Gaza and Inhambaneprovinces. The shortest average dry spells occurin the northern provinces away from the coast,with lengths of 5-10 days.
Regions with fairly long average dry spells alsoshow very large inter-annual variability (Fig 17)in dry spell length (6 to 8 days).
Fig.16 – Average longest dry spell in DJF Fig.17 – Inter-annual variability in dry spell length
28

Dry spells: Monthly Averages and Trends
The calculations were also done on a monthly basis since the DJF longest dry spell could beinfluenced by events of early end or late onset of season (Fig 18).
For the two core months of the season (December and January) in the southern half of thecountry, the average longest dry spell is of 10-15 days, in contrast with 5-10 days in the northernhalf, down to shorter than 5 days in the northernmost areas of the country. In February, averagelongest dry spell length increases in Gaza province to 15-20 days.
Dry spell lengths show a moderate tendency to decrease in the southern and central provinces,except in parts of western Gaza, where the reverse tendency is observed. In the north of thecountry the tendency is very week, except for a trend of increasing dry spells along the coast.
Fig.19 – Trend in maximum dry spell in DJF
Fig.18 – Average maximum dry spell in December, January and February
DECEMBER JANUARY FEBRUARY
29

GROWING SEASON TIMING
Growing Season timings represent the dates of onset and end of suitable and sufficient moisture conditions to enable the growthof crops and natural vegetation; the length of the growing season is defined from the difference between these two dates.
Moisture conditions are derived through the use of a simplified water balance model, that accounts for the rainfall available atevery time step and estimates how much is evapotranspired and how much is stored in the soil. At each time step the availablewater for crops and vegetation is derived as the current precipitation plus the water left in the soil in the previous time step.
The growing season is assumed to start (end) when the available water exceeds (drops below) 35% of the potentialevapotranspiration according to the classic procedures used by FAO in analysis of crop water requirements (e.g. WRSI model)
30

Fig.20c – Average length growing seasonFig.20b – Average end date growing seasonFig.20a – Average start date growing season
Growing Season: Start, End, Length
The start of the rainfall season (Fig.20a) has a clear south to north gradient, with earlier starts(mid October) in the southernmost areas of the country and occurring progressively latertowards the north of the country (late November).
The end of the season (Fig.20b) is somewhat less variable – in northern areas the end ismostly in early April with some areas near Tanzania ending in late April. In southern andwestern areas the seasons ends in late March or even in early march in some spots in Tete,Sofala and Manica.
The resulting length of season map shows Gaza and Tete provinces tohave the shortest lengths of growing season, mostly below 3 months andas short as 2 months. Note that the rainfall season is longer than this –growing season here refers to a period of consistent and significantmoisture levels.
In most of the rest of the country, growing season lengths vary between 5to 7 months. 31

Growing Season Length: Variability, Trend
As expected for fairly dry areas, the length of the growingseason (LGS) is far more variable in Gaza and parts ofInhambane than elsewhere (Fig 21). Although Tete provincealso has short LGS, it is much less variable from year to year,as the rainfall season is less spread out – more intense andregular rainfall leads to more regular growing seasons. InGaza, a longer season of irregular rainfall, leads to growingseason length being dependent on the occurrence ofsequences of significant rainfall.
The northern regions of the country have the most regulargrowing seasons given the more abundant and less variablerainfall elsewhere.
In terms of trend (Fig 22), there seem to be localized areasof (mostly) decreasing trends in duration of the growingseason. One large areas occurs in Nampula province, wherewe will notice a tendency for decreasing vegetation cover aswell.
Fig.21 – Variability (CV) in length of growing season Fig.22 – Trends in length of growing season
32

NDVI (Vegetation)
33
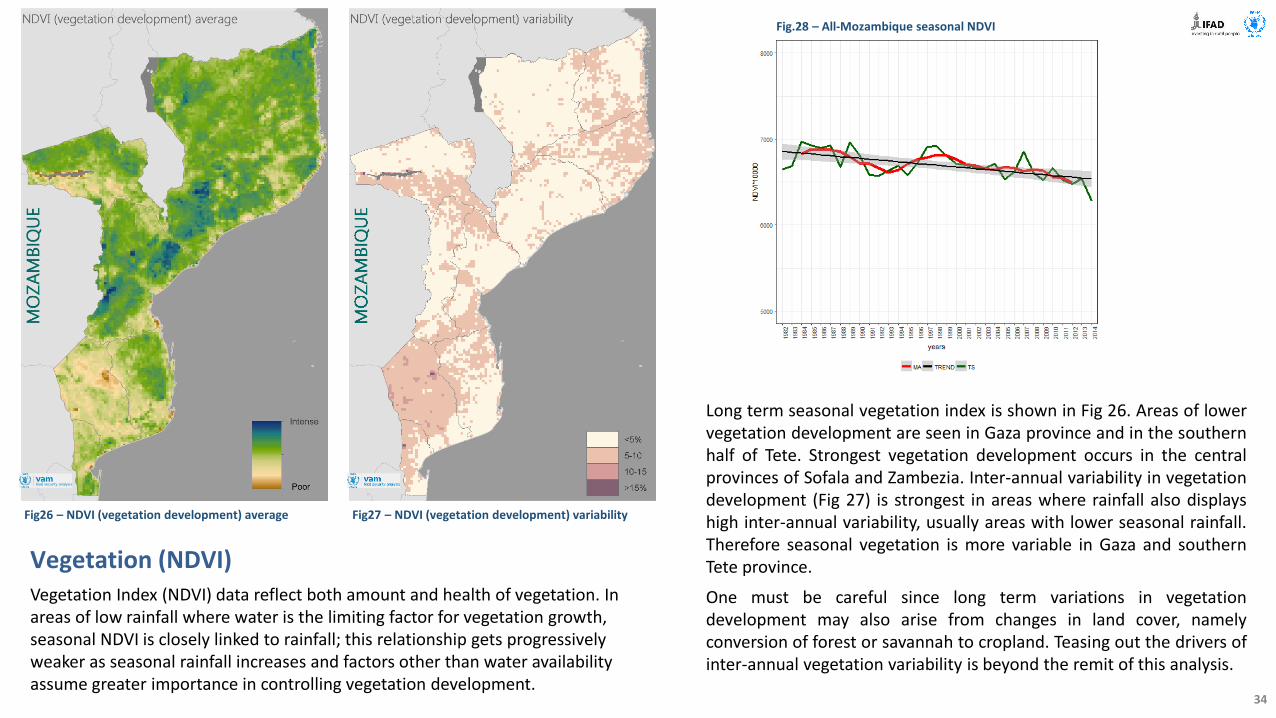
Vegetation (NDVI) Vegetation Index (NDVI) data reflect both amount and health of vegetation. In areas of low rainfall where water is the limiting factor for vegetation growth, seasonal NDVI is closely linked to rainfall; this relationship gets progressively weaker as seasonal rainfall increases and factors other than water availability assume greater importance in controlling vegetation development.
Long term seasonal vegetation index is shown in Fig 26. Areas of lowervegetation development are seen in Gaza province and in the southernhalf of Tete. Strongest vegetation development occurs in the centralprovinces of Sofala and Zambezia. Inter-annual variability in vegetationdevelopment (Fig 27) is strongest in areas where rainfall also displayshigh inter-annual variability, usually areas with lower seasonal rainfall.Therefore seasonal vegetation is more variable in Gaza and southernTete province.
One must be careful since long term variations in vegetationdevelopment may also arise from changes in land cover, namelyconversion of forest or savannah to cropland. Teasing out the drivers ofinter-annual vegetation variability is beyond the remit of this analysis.
Fig27 – NDVI (vegetation development) variabilityFig26 – NDVI (vegetation development) average
Fig.28 – All-Mozambique seasonal NDVI
34

Vegetation: TrendsThe trend in seasonal vegetation (Fig 29) showsa decreasing tendency across much of thecountry, particularly in Nampula and Zambezia.In other provinces decreasing vegetationtrends are more scattered and less uniform.
Gaza, Maputo and southern Tete are theexception, showing moderate increases inseasonal vegetation.
Vegetation: Monthly TrendsAnalysing the trend in seasonal vegetation on amonthly basis (Fig 30), shows that across mostprovinces, except Maputo, Gaza andInhambane, there are well marked tendenciesfor decreasing vegetation in the early stages ofthe season (November and December).
These tendencies get progressively weaker asthe season develops. In Tete, Niassa and CaboDelgado they reverse into moderatelyincreasing vegetation from January onwards.
Gaza and neighbouring provinces to a lesserdegree mostly maintain a positive trend invegetation development throughout theseason.
Fig.30 – NDVI monthly trend (%/10yrs)
Fig 29 – Seasonal NDVI trend (10yrs %)
The negative tendencies in the northern areas ofthe country will translate in progressively laterstarts of the seasonal vegetation (or “greenseason”). This is on agreement with thetendencies of seasonal rainfall and seasonal raindays which also show a decreasing tendency inroughly the same areas.
35

Vegetation: Monthly trendsThe monthly trends were combined into areas ofrelatively homogeneous behaviour (Fig 32a and 32b).
Zone 2 (orange) includes areas with a decrease invegetation across the whole season, with the rate ofdecrease progressively weaker as the seasondevelops.
Zone 3 (blue) has a similar behaviour with a generaldecrease in vegetation across most of the season, butless pronounced than for Zone 2.
Zone 4 (green) shows a generalized increase invegetation throughout the season from Januaryonwards.
This agrees with the tendencies for lower rainfall andfewer number of rain days in the more northernareas, which should result in lower vegetationdevelopment, in particular during the early stage ofvegetation growth.
The two plots in Fig 31 show average NDVI time seriesfor 1985-1995 and for 2005-2015 (first and last 10year in the available record) to illustrate how themonthly trends translate into changes in the seasonalvegetation profile.
Fig.32b – NDVI zonal monthly trend seasonal evolution
Fig 31 – NDVI profile, early and late record
Fig 32a – NDVI monthly trends zoning
36

ENSO PATTERNS
37

ENSO impacts: ApproachMozambique, in common with many of Southern Africa’s countries isparticularly sensitive to ENSO induced fluctuations in rainfall and hence invegetation cover.
To map the ENSO impacts for Mozambique, we use an ENSO anomalyapproach. Essentially, this compares the averages of a given parameter(seasonal rainfall, temperature in a given month, …) during El Niño and LaNiña seasons with the same during neutral seasons:
• Classify each season into El Niño affected, La Niña affected or Neutral.
• Derive averages of a given parameter (e.g. seasonal rainfall) for each ofthe three groups.
• Compute an anomaly with respect to the average of the neutral seasons.
A negative (positive) anomaly for the El Niño (or La Niña) group would meanthat the parameters take on average lower (higher) values in El Niño (or LaNiña) affected seasons than in neutral seasons.
This approach was used to analyse ENSO impacts on rainfall amounts,growing season timings and vegetation indices.
38

El Niño impacts: Rainfall
We first look into changes in rainfall patterns. Thefigures 33a and 33b show the El Niño anomaliesfor the three month rainfall OND and JFM,respectively early and peak season rainfall.
The OND rainfall has two distinct patterns: inCabo Delgado and Niassa, OND rainfall increasesin El Niño years, as they are more aligned withEast African weather patterns. El Niño enhancesrainfall in East Africa down to Tanzania andNorthern Mozambique. In contrast, in thesouthern provinces of Maputo, Gaza andInhambane, OND rainfall is decreased to less than70% of the normal in some places. during El Niñoyears according to the more classic SouthernAfrica ENSO patterns,
In central regions, OND rainfall remainssubstantially close to normal during El Niño years.
In JFM, the El Niño effect leads to drier conditionsacross most of the country. The decrease inrainfall in the south of the country is verypronounced and reaches below 70% of theneutral season amounts. The strongest impactsare in Gaza and Inhambane as well as Manicaprovinces. In the north (Cabo Delgado, Niassa andNampula) rainfall during El Niño seasons is onaverage not significantly different from neutralseasons.
Fig.33a – El Niño Anomaly for OND rainfall Fig.33b – El Niño Anomaly for JFM rainfall
39

La Niña impacts: Rainfall
In the case of La Niña, the picture is reversedas rainfall in this ENSO phase tends to behigher than in neutral seasons.
In OND (Fig 34a), there is little discernibleimpact of La Niña on rainfall, except for thecentral provinces of Manica, Sofala andnorthern Inhambane, where early seasonrainfall is about 10-20% above that of neutralseasons.
In JFM (Fig 34b) La Niña influence is moremarked than in OND, but weaker than that ofEl Niño. The northern provinces see littleeffect, except for neighbouring areas ofMalawi. In the south and centre of thecountry there is a moderate tendency forincreased rainfall. This is more pronounced inInhambane and western Gaza and Maputowhere rainfall is higher by up to 20-30%relative to Neutral seasons.
Fig.34a – La Niña Anomaly for OND rainfall Fig.34b – La Niña Anomaly for JFM rainfall
40

The maps below show the ENSO anomalies for El Niño (Fig 35a) and La Niña (Fig 35b), for each calendar month. Note that anomalies for the months ofJune to September are of no significance as this period is outside the main growing season in Mozambique
Fig.35a – El Niño monthly rainfall anomalies Fig.35b – La Niña monthly rainfall anomalies
41

El Niño impacts: NDVI
Figures 36a and 36b show the El Niño anomalies forthe three month average NDVI Nov-Jan (NDJ) andFeb-Apr (FMA), respectively the early and peakstages of the seasonal vegetation.
NDVI El Niño anomalies show clearly the vegetationresponse to the El Niño rainfall patterns:
The NDJ mean NDVI shows two main types ofvariation – In northern provinces and Tete, NDJmean NDVI is higher in El Niño seasons. In contrast,in Gaza and Inhambane provinces, NDJ NDVI ispronouncedly lower during El Niño seasons than inneutral seasons by as much as 15%, matching thesubstantial reduction in rainfall.
The FMA mean NDVI during El Niño seasons showsonly areas of lower than average values, still morepronounced in southern provinces, but here alsoextending to Tete. This matches more widespreaddrier conditions seen in the rainfall anomaly maps.
The use of the mean NDVI in Nov-Jan and Feb-Apraccounts for the fact that vegetation has a slightlydelayed response to rainfall.
Fig.36a – El Niño anomaly for mean November-January NDVI Fig.36b – El Niño anomaly for mean February-April NDVI
42

La Niña impacts: NDVI
Figures 37a and 37b show the La Niña anomalies forthe three month average NDVI Nov-Jan (NDJ) andFeb-Apr (FMA), respectively the early and peakstages of the seasonal vegetation.
NDVI La Niña anomalies are not so clearly linked tothe rainfall La Niña patterns:
The NDJ mean NDVI shows lower than usual valuesin Gaza and Inhambane and also in the two northerncoastal provinces (Nampula and Cabo Delgado), withsome areas in the Manica-Sofala-Tete showingenhanced vegetation.
The FMA mean NDVI is about similar to that ofneutral seasons across the country, though with anoticeable enhancement in Gaza and Maputoprovinces in response to the increased rainfall.
The use of the mean NDVI in Nov-Jan and Feb-Apraccounts for the fact that vegetation has a slightlydelayed response to rainfall.
Fig.37a – La Niña anomaly for mean November-January NDVI Fig.37b – La Niña anomaly for mean February-April NDVI
43

El Niño impacts: Growing Season Timings
El Niño seasons have a marked impact on the timings of the growing season. In Gaza and Inhambane provinces delays can reach one month (Fig 38a). Elsewhere there is either no noticeable impact and a fairly moderate tendency for the season to start earlier due to El Niño enhanced rainfall in the northern areas of the country in the last quarter of the year.
Fig.38a – El Niño anomaly for start of season
The end of season during El Niño seasons (Fig 38b) tends to occur a bit earlier across most of the country (Zambezia occurred). Altogether, the season is much shorter during El Niño season in the southernmost areas (Gaza, Maputo) and has little variation elsewhere (Fig 38c) .
Fig. 38b – El Niño anomaly for end of season Fig. 38c – El Niño anomaly for length of season
44

La Niña impacts: Growing Season Timings
La Niña events result in normal or moderately earlier than usual starts of the season(Fig 39a). The exception is Inhambane and some areas of Gaza where the start of theseason is delayed in La Niña seasons. The end of the growing season (Fig 39b)occursmoderately later than usual over an area from Tete to Inhambane, while in Gaza andnorthern provinces the growing seasons end a bit earlier than usual.
Fig.39a – La Niña Anomaly for start of season Fig. 39b – La Niña Anomaly for end of season
As a result, the length of the growing season in La Niña seasons (Fig 39c) isshorter than usual in Gaza and parts of Inhambane. This is also the case inNiassa and Cabo Delgado. Longer seasons predominate in Tete and in thecentral provinces of the country.
Fig. 39c – La Niña Anomaly for length of season
45

TEMPERATURE
46
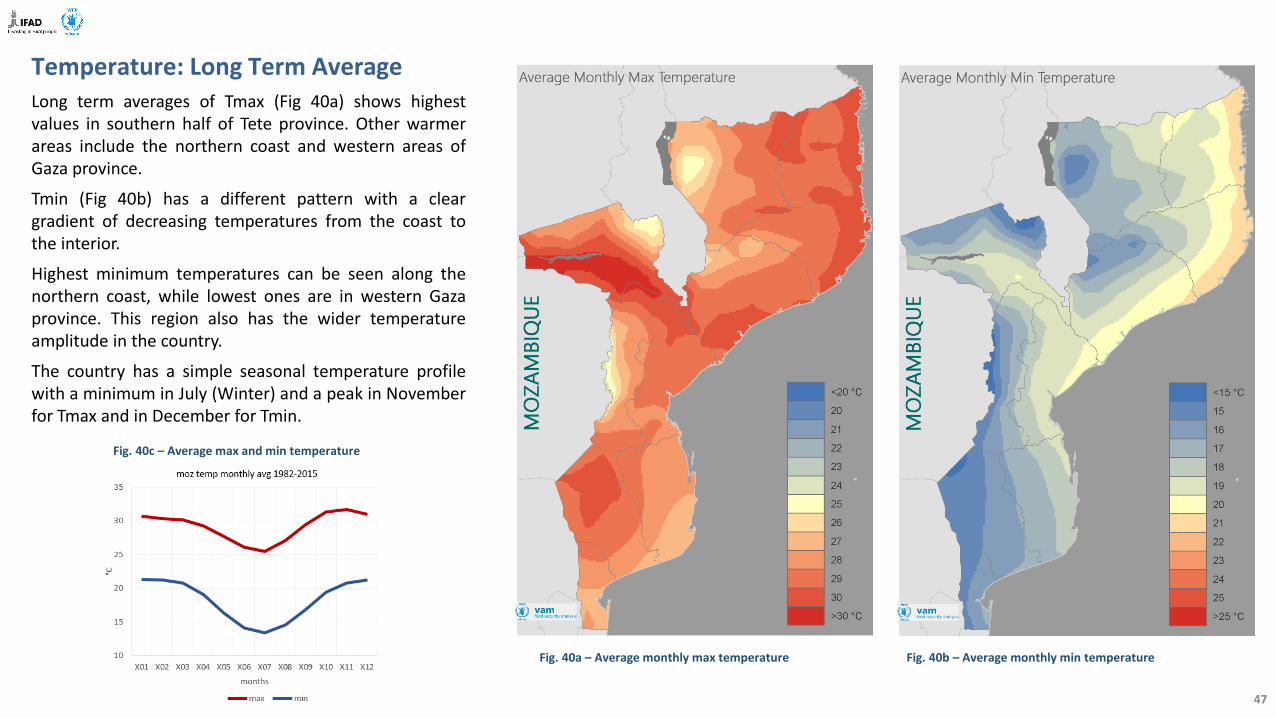
Temperature: Long Term AverageLong term averages of Tmax (Fig 40a) shows highestvalues in southern half of Tete province. Other warmerareas include the northern coast and western areas ofGaza province.
Tmin (Fig 40b) has a different pattern with a cleargradient of decreasing temperatures from the coast tothe interior.
Highest minimum temperatures can be seen along thenorthern coast, while lowest ones are in western Gazaprovince. This region also has the wider temperatureamplitude in the country.
The country has a simple seasonal temperature profilewith a minimum in July (Winter) and a peak in Novemberfor Tmax and in December for Tmin.
Fig. 40b – Average monthly min temperatureFig. 40a – Average monthly max temperature
Fig. 40c – Average max and min temperature
47

Fig. 41b – Annual min temp. trend Fig.41a – Annual max temp. trend
Temperature: TrendsIncreases in temperature can impact crops directly in case theyreach extremes such that crop physiology suffers. Additionally,higher temperatures raise the water demand imposed oncrops by the environment, one of the mechanisms of droughtimpact.
In Mozambique, an increasing trend in maximum temperatureis noticeable (Fig 41a). The trend is higher in the south andwest of the country. The minimum temperature in contrast,shows little tendency across the country (Fig 41b).
In any case, these are very moderate trends in particular forminimum temperature. Inter-annual variations are moresizeable and temperature increases coupled with rainfalldeficits can have serious impacts on crop development (Fig42a and 42b)
Fig.42a – All-Mozambique seasonal Tmax Fig.42b – All-Mozambique seasonal Tmin
48

Max Temperature: Monthly trendsLooking at maximum temperature trends on a monthly basis highlights a behaviourcommon to the whole country – maximum temperature increases are mostlyconcentrated in October-November and in February-March. Strongest increasesoccur in Zone 1 (dark blue), i.e. Maputo, Gaza and Inhambane during October andNovember. The trend is modest (at most 0.4C in 10 years) but may signal atendency for increased water demand during early stages of crop development.
The northernmost four provinces are those with more modest trends.
Fig.43b – Tmax monthly trend zoning
Fig.43c – Tmax zonal monthly trend seasonal evolution
Fig.43a – Tmax monthly trends
49

Min Temperature: Monthly trendsLooking at minimum temperature trends on a monthly basis, shows increases inminimum temperature in October-November general to most of the country.This is followed by a decreasing tendency in January in particular in southernMozambique.
Zone 1 (dark blue) shows mostly a decreasing minimum temperature trendsthroughout the year, except for moderate increasing tendency in September toNovember. The other two zones show mostly increasing minimum temperaturetendencies, zone 3 (light blue) with very moderate tendencies and Zone 2 (Tete)with increasing minimum temperatures along most of the year.
Fig.44b – Tmax monthly trend zoning
Fig.44c – Tmin zonal monthly trend seasonal evolution
Fig.44a – Tmin monthly trends
50

THE END
51
May 2018
Disclaimer: The boundaries and names shown in this document do not imply official endorsement or acceptance by United Nations
Produced in the framework of the IFAD-WFP Joint Climate Analysis Partnership