analysis to guide usaid/mozambique programmatic
TRANSCRIPT

ANALYSIS TO GUIDE USAID/MOZAMBIQUE
PROGRAMMATIC INVESTMENTS IN AGRICULTURE
AND FOOD NUTRITION SECURITY MARCH 2021
AUTHORS: David Tschirley1, Cynthia Donovan1, Tatiana Mata2, Antony Chapoto3, David Mather1
1Michigan State University; 2 Consultant /ELIM; 3 IAPRI, Zambia
i
This Report was prepared for the USAID Mission in Mozambique by the Feed the
Future Innovation Lab for Food Security Policy, Research, Capacity and Influence
(PRCI) with funding from the United States Agency for International Development
(USAID) under Grant No. 7200AA19LE00001. The contents are the responsibility
of the authors of this report (i.e., PRCI team) and do not necessarily reflect the views
of USAID, the United States Government, Michigan State University, IFPRI,
Cornell University, ReNAPRI, University of Ghana, Kasetsart University, and
Research and Information System for Developing Countries (RIS).
Copyright © 2021, Michigan State University, ELIM Serviços Ltda, IAPRI, IFPRI,
Cornell University, ReNAPRI, University of Ghana, Kasetsart University and RIS.
All rights reserved. This material may be reproduced for personal and not-for-profit
use without permission from but with acknowledgment to Cornell University,
ReNAPRI, University of Ghana, Kasetsart University and RIS.
Published by the Department of Agricultural, Food, and Resource Economics,
Michigan State University, Justin S. Morrill Hall of Agriculture, 446 West Circle Dr.,
Room 202, East Lansing, Michigan 48824, USA

ii
Contents Acknowledgments ......................................................................................................................................... i
Contents ........................................................................................................................................................ ii
List of Figures .............................................................................................................................................. iv
List of Tables ................................................................................................................................................ v
List of Boxes ................................................................................................................................................ vi
List of Acronyms ........................................................................................................................................ vii
Executive Summary..................................................................................................................................... ix
Introduction .......................................................................................................................................... 1
Data, methods, and literature used ................................................................................................. 1
A. Online survey of key informants ..................................................................................................... 1
B. Key informant interviews in Mozambique ..................................................................................... 2
C. Regional review of programs ........................................................................................................... 2
D. Literature consulted.......................................................................................................................... 2
E. Household data................................................................................................................................. 3
F. Definition of zones and rural household types.............................................................................. 3
G. Household types ........................................................................................................................... 4
Background and context: Challenges and opportunities for growth and transformation .......... 8
A. Major global, continental, and national challenges ........................................................................ 8
B. Opportunities for agricultural growth and transformation ......................................................... 13
C. USAID’s challenge: Designing investments to promote rural structural transformation ........ 19
Mozambique’s rural areas: Very slow progress on the farm but some promising opportunities
21
Emerging success stories not evident in the IAI data ..................................................................... 25
Programmatic approach ................................................................................................................. 28
A. Insights from program reviews in Mozambique and the region ................................................ 28
B. Theory of change: Program design for rural transformation...................................................... 31
C. Targeting of support to farming ................................................................................................... 35
Investment Options ....................................................................................................................... 38
A. Broad categories ............................................................................................................................. 38
B. Governance and the supply side of seed and other input markets ............................................ 38
C. Direct support to rural households ............................................................................................... 42
D. Support to agricultural processing ............................................................................................ 44

iii
E. Support for women and youth ...................................................................................................... 51
References ................................................................................................................................... 53
Annexes ........................................................................................................................................... 60
A. Google Survey Instrument for Key Informants 2020 and Google Survey Results .................. 60
B. Persons Consulted .......................................................................................................................... 60
C. Thematic References ...................................................................................................................... 60
D. Maps of Mozambique ................................................................................................................ 60
E. Road Projects in Zambézia and Nampula Over the Past Five Years, and Perspectives on
Adequacy of Roads Infrastructure ........................................................................................................ 60
F. TIA Results ..................................................................................................................................... 60
G. Mozambique projects listing...................................................................................................... 60

iv
List of Figures Figure 1. Map of zones used in this report ................................................................................................ 4 Figure 2. Rural household “transformation space” with relative sizes of each household type from
our typology (includes all “pequeno” and “medio” farmers in the 2012 IAI; does not include
“emerging” and “large-scale” farmers from Table 3 as we have no survey data .................................... 6 Figure 3. Per capita final consumer expenditure in constant 2010 USD, Sub-Saharan Africa, 1981-
2018 (Source: Elaboration by author using World Bank Indicators, Final consumption expenditure
estimated from national accounts data (excel file
API_NE.CON.TOTL.KD_DS2_en_excel_v2_1129220). .................................................................... 10 Figure 4. World Bank measures of governance quality in Mozambique, 2000-2019 ........................... 12 Figure 5. Minimum relative size of urban food market relative to rural population, by share of urban
population in total population ................................................................................................................... 16 Figure 6. Projected contribution of various commodities to total growth in domestic demand for
food over five years (adapted from Tschirley, et. al., 2016) .................................................................... 18 Figure 7.Theory of change for USAID investments in rural Zambézia and Nampula ........................ 32 Figure 8. Structure and logic of proposed approach to spur rural structural transformation ............ 34

v
List of Tables Table 1. Zones of Nampula and Zambézia province to guide programming ........................................ 4
Table 2. Mapping of rural household typology into common terminology used in Mozambique ....... 5
Table 3. Percentage of smallholder and “medio” households by zone and type ................................... 6
Table 4. Livelihoods, incomes, and food security by household type, 2012Table 5. Livelihoods,
incomes, and food security by household type, 2012 ................................................................................ 7
Table 5. Estimated domestic market growth prospects for key food commodities in Mozambique 17
Table 6. Land cultivated, % of farmers classified as medios, and gross farm income, by zone (2012,
2017, and % change) .................................................................................................................................. 22
Table 7. Percent of rural households growing selected cash crops, by zone (2012, 2017, % change)
..................................................................................................................................................................... 23
Table 8. Percent of rural households using variable inputs and tractorization, by zone (2012, 2017,
and % change) ............................................................................................................................................ 24
Table 9. Adult involvement in farming and nonfarm activities, by zone (2012, 2017, and % change)
..................................................................................................................................................................... 25
Table 10. Percent of households experiencing hunger over the past 12 months, by zone (2012,
2017, and % change) .................................................................................................................................. 25

vi
List of Boxes Box 1: Why is Mozambiques agricultural productivity so much lower than its neighbors .................. 14 Box 2: What about “moving in”? The rise of medium-scale farms in Africa …………………………... 20

vii
List of Acronyms ADSP Agriculture Development Support Programme (Zambia)
ADVZ Agencia de Desenvolvimento de Vale do Zambeze
AFAP African Fertilizer and Agribusiness Partnership
AMDSP Agricultural Marketing System Development Project (Tanzania)
AMOFERT Associação Moçambicano de Promoção de Fertilizantes
APROSE Associação para a Promoção do Sector de Sementes
ASCAs Accumulated Savings and Credit Associations
ASSP Agricultural Sector Support Programme (Zambia)
ASWAp SP Agriculture Sector Wide Approach Support Project (ASWAp SP)
BAGC Beira Agricultural Growth Corridor
BDA Business Development Advisor
BDS Business Development Services
BNI Banco Nacional de Investimento
CAT Commodity Aggregator Traders
CDM Cervejas de Moçambique
CIDA Canadian International Development Agency
CIP International Potato Center
CLUSA Cooperative League of the USA
COMACO Community Markets for Conservation (Zambia)
COPAZA Cooperativa dos Produtores da Alta Zambezia
ETG Export Trading Group
FCSP Food Crop and Seed Project (Zambia)
FIDP Farm Income Diversification Programme
FINAGRO FinAgro Agribusiness Fund
FSD Moç Financial Sector Deepening Moçambique
FSRP Food Security and Research Project (Zambia)
FTF Feed the Future
GDP Gross Domestic Product
IAI Inquérito Agrário Integrado
IAOM Instituto de Algodão e Oleaginosas de Mocambique
IAPRI Indaba Agricultural Policy Research Institute
IDRC International Development Research Centre, Canada
IESE Instituto de Estudos Sociais e Económicos
IFAD International Fund for Agricultural Development
IFDC International Fertilizer Development Center
IIAM Instituto de Investigação Agraria de Moçambique
INCAJU Instituto de Cajú (Cashew Institute) (now Instituto de Amêndoas)
IRLAD Irrigation, Rural Livelihoods and Agricultural Development (Tanzania)
MACO Ministry of Agriculture, Food and Fisheries (Zambia, now MoA)
MADER Ministério de Agricultura e Desenvolvimento Rural
MMS Mobile money services
MoA Ministry of Agriculture (Zambia)
MSME Micro, Small, and Medium Enterprises

viii
MSU Michigan State University
NCBA National Cooperative Business Association
NGO Non-Governmental Organization
OFSP Orange-fleshed Sweet Potato
OMR Observatório do Meio Rural
PEDSA Plano Estrategico para o Desenvolvimento do Sector Agrario
PROFIT+ Production, Finance, and Improved Technology Plus (Zambia)
PROMER Programma de Promoçao de Mercados Rurais
QDS Quality Declared Seeds (SGM in Portuguese)
RAIN Realigning Agriculture to Improve Nutrition (Zambia)
RAMA-NC Resilient Agricultural Markets Activity - Nacala Corridor
RAMA-BC Resilient Agricultural Markets Activity - Beira Corridor
REFP Rural Enterprise Finance Project
SAARNET SADC animal agriculture network
SADC Southern African Development Community
SBS Sociedade de Beneficiamento de Sementes
SCCI Seed Control and Certification Institute (Zambia)
SCF Small Commercial Farmer
SECF Small Emerging Commercial Farmer (also used as SCF)
SEMEAR Feed the Future Improved Seeds For Better Agriculture
SGM Semente de Qualidade Garantida
SHF Smallholder farmer
SIDA Swedish International Development Cooperation
SMART Strengthening the Missing Middle in Agribusiness for Rapid Transformation
SME Small and Medium Scale Enterprise
TIA Trabalho de Inquerito Agricola
TNS Technoserve
TSNI Towards Sustainable Nutrition Improvement
VBAA Village Based Agricultural Advisors
VC Value Chain
VSLA Village Savings and Loans Association
ZARI Zambia Agricultural Research Institute
ix
Executive Summary Introduction: This report was produced by Michigan State University for USAID/Mozambique as
an input into the mission’s decision making regarding agricultural programming in Nampula and
Zambézia provinces. We collaborated closely with ELIM Serviços Ltda (Tatiana Mata) and Dr.
Antony Chapoto of the Indaba Agricultural Policy Research Institute in Zambia.
Our approach is rooted in the concept of the structural and rural transformation of economies, in
which rising specialization and productivity in farming is paired with the movement of labor off the
farm into better-paying activities in self-employment or wage labor. Because such a transformation
is a sine qua non for broad poverty reduction, our empirical analysis focuses on evidence of this
happening in Mozambique, and the program options we lay out are designed to foster it.
Data, methods, and literature used: In Mozambique, we used an online survey of key informants
(58 solicited, 18 responses) and follow-up interviews. Dr. Chapoto generated a review of projects in
Zambia, Malawi, and Tanzania, and we drew from that together with our survey and interviews to
synthesize lessons from previous programs. We consulted a wide array of project documents and
applied academic research. Beyond citations in the references, we include all consulted documents
in an annex. Data came primarily from the 2012 and 2017 Inquérito Agrícola Integrado (IAI), though
selected data from the World Bank and others (all cited in the document) were also used.
We used existing agroecological zones and livelihood zones and our own knowledge to develop a
four-zone classification for the two provinces. The zones differ primarily in agroecology and thus in
the crops that USAID might support. One zone (Lowland Southern Zambézia) stands out for
better access to improved roads, relatively uncommercialized farming and higher engagement in the
nonfarm economy. The other three zones differ little in these three aspects and all zones differ
remarkably little in their agricultural practices. Mean and median incomes are also very similar. Food
security is a persistent problem across all zones.
Using data from the 2012 IAI (2017 data did not quantify nonfarm income), we developed a
typology of rural households based on the concept of the rural transformation and following Hazell
(2017). Households are arrayed in a “transformation space” defined by 1) the share of their farm
production that they sell, and (2) the share of their total household income (farm plus nonfarm) that
comes from nonfarm activities: higher farm sales out of total farm production and higher nonfarm
income out of total income reflect greater transformation, along different axes.
Findings from IAI analysis: Empirical application of the typology shows that the smallholder
farming sector, commonly seen in Mozambique as an undifferentiated set of “subsistence farmers”,
instead shows quite a lot of diversity, ranging from true subsistence farmers who engage little if at all
with farm- or nonfarm markets through households that sell most of their farm production even as
they earn most of their income off the farm and with much variation in between.
Three additional points are important. First, households generating the highest incomes are doing
so through nonfarm income, not through farming. Second, and despite this, farming is still claimed
as the most important economic activity for most adults across every farm type. In other words,
nearly all households consider farming a central part of what they do. Third, food insecurity is
common across all household types, implying need for broad attention to this issue.

x
Challenges and opportunities for growth and transformation: We review challenges at global,
continental, national, and sub-regional levels. Globally, the key challenge is narrowing options for
transformation growth due to the decline of export-oriented labor-intensive manufacturing. This
puts countries such as Mozambique, which to date have seen little industrialization, in an extremely
difficult situation as they struggle to ensure sustained, broad-based growth for their populations.
Continentally, Africa’s economic situation is much more precarious now than even five years ago,
based on a general bust in African GDP growth since 2013 or 2014 and the economic fallout from
the COVID-19 pandemic. The faltering of African growth has a major effect on Africa’s rural and
agricultural sectors because a large share of increased income is spent on food, making domestic
demand for food linked to rising incomes and urbanization a major motor of growth in rural areas.
When that growth falters, rural areas suffer. Projections by the IMF in the midst of the pandemic
per capita incomes on the continent would be back to where they were 10 years ago by the end of
2021, “assuming that the pandemic abates, and lockdowns ease further in the second half of 2020”. If the
pandemic instead worsens (as it appears now to be doing) and economic life is further disrupted, the
regression will be even greater.
Nationally, Mozambique faces an array of challenges including entrenched poverty, faltering
economic growth, poor governance that has worsened over the past 10 years, and a high share of
population in rural areas, which makes the rural development challenge more difficult. Of particular
concern for rural development are indications of a return to state-led approaches that may
undermine the development of sustainable, broad-based markets for agricultural inputs and output.
Zambézia and Nampula face two additional challenges. First, they feature extensive lowlands that
are subject to destructive cyclones that appear to be increasing in frequency and intensity. These
have generated large loss of life and sometimes catastrophic destruction of physical infrastructure
and are a major reason that conditions of road access have improved little in Mozambique over the
past decade despite substantial investment. Second, the conflict in Cabo Delgado raises the cost of
supplying markets related to the gas field development in and around Pemba and threatens major
direct effects on Nampula if it expands. Very recent events in Cabo Delgado are deeply concerning.
Despite profound challenges, Mozambique has many strengths that if harnessed could facilitate
sustained rural grown and inclusive transformation. Zambézia and Nampula provinces have a
varied agroecology that supports the growing of a wide variety of crops. Yet this same agroecology,
given Mozambique’s geography, road infrastructure, and rudimentary organizational capacity within
value chains, has resulted in quite low average yields for many crops important to the country.
Mozambique’s long coastline and major ports in the south (Maputo), center (Beira), and north
(Nacala and Pemba) could once again make it an important player in maritime transport, but major
managerial reforms (in addition to investment) would be needed to do this.
Rapid urban population growth especially in Nampula is feeding even more rapid growth of
domestic food markets, making these a strong basis for transformative growth in rural areas. The
rapid urban growth in Nampula emphasizes the importance of road links from the hinterland of
northern Zambézia and all of Nampula to the Nacala corridor road, to take advantage of the
robustly growing markets for maize, soya, vegetables, and other crops.

xi
We draw on previous research to assess prospects for the speed and size of growth in domestic
demand for key value chains. It suggests that growth will be the most rapid for perishable goods of
animal origin: dairy, poultry and eggs, other meat, and fish; that the contribution of maize to total
growth will be by far the largest of any other food item, at 36%, even without considering derived
demand for maize used in animal feed; and that import substitution opportunities exist for most of
the products considered due to Mozambique’s heavy reliance on imports.
USAID’s challenge: USAID/Mozambique’s challenge is to promote a structural rural
transformation in its intervention area. Doing so requires simultaneously increasing productivity in
farming and facilitating progressively more engagement in nonfarm activity. As it does this, it needs
to address the food insecurity that pervades all zones and types of rural households. USAID must
promote this transformation while dealing with the constraints, and taking advantage of the
opportunities, outlined above. Most fundamental among the constraints is the decline of export-
oriented labor-intensive manufacturing, driven by automation and globalization.
Four areas of broad agreement exist on how to proceed. First, Mozambique must invest
aggressively in its “fundamental capabilities” - human and institutional capacity (including
transparent policies and effective regulations) and the hard infrastructure of a modern economy
including roads, electricity, and internet connectivity. Micro-grids and mini-grids should be a key
part of at least the medium-term energy strategy.
Second, government and private sector need to emphasize a pragmatic, development-oriented
relationship between the two and avoid some of the policy mistakes that are mentioned above.
Third, growth in domestic demand for food provides a huge and relatively stable opportunity for
growth in rural economies in these countries. Policies, programs, and public investments must be
oriented to facilitating private sector investment in these kinds of activities, especially among small-
and medium enterprise.
Fourth, these countries need to expand their “domestic” markets through more efficient regional
trade. Food manufacturing needs to be central to this strategy but must be based on fostering competitive
food processing, not hindering trade in raw products. This means a commitment to the new African
Continental Free Trade Agreement (AfCFTA) that goes well beyond the tepid support and routine
violation of previous regional agreements that has characterized policy in so many African countries.
Mozambique’s rural areas: Analysis of IAI 2012 and 2017 data shows very slow progress on the
farm but some promising opportunities. Area planted and total value of agricultural production per
AE increased substantially and across all zones, though the reasons for this change are not yet clear.
Soybean production in Alta Zambézia increased sharply yet the share of farmers growing sesame,
pigeon pea, and cotton dropped. Overall, we see no increase in farmers’ cash crop orientation.
Use of variable inputs and tractorization increased broadly but remains extremely low. The only
large changes were a large decrease in the share of households using pesticides driven by a decrease in
cotton planting, and a meaningful increase in the percent using improved seed, potentially due to the
emerging expansion of the rural agrodealer network.

xii
Nonfarm activities became more important in all zones over the five years, primarily through own
business activities, which increased by nearly 10 percentage points.
Finally, food security remains an important problem throughout the provinces and likely across
every type of household. Notably, no single zone appears persistently to be the most food insecure,
as the zonal patterns changed between the two periods.
Emerging success stories: The changes identified in the IAI data do not approach the depth and
speed needed to drive transformation that rapidly reduces poverty. Yet various pieces of
information suggest that real and potentially sustainable change has been happening “under the
radar” and that, with good policy and well-designed programmatic support, it could soon begin to
make a much broader positive impact among rural households. Here we review two broad areas of
positive change.
First, emerging dynamism in input markets due in part to investment by USAID, the EU, and FAO
in seed and other input companies and a rural agrodealer network. Concern about donor
dependence is reasonable, sustainability cannot be taken for granted. The key imperative is that
government programs to promote input access contribute to the further development of this system
rather than bypassing and thus undermining it.
Second, Mozambique has seen the emergence, despite periodic busts, of several important cash
crops. Chief among these – and potentially the most sustainable – is soya. However, productivity
needs to be increased on the farm and in the post-farm to compete with imported soy meal. Maize
also provides a strong basis for sustained growth in demand from direct human for beer production,
and for animal feed. With the advent of mobile processing units, cassava offers opportunities for
value added in starch, animal feeds, and flours, including the potential to substitute fortified high
quality cassava flour (HQCF) for a portion of imported wheat in bread.
Vegetable production for the market grew rapidly in western Nampula with the improvement in the
Nacala corridor road. Road investments connecting areas of Alta Zambézia to the Nacala Corridor
road should greatly expand the production areas that have access to this market, including urban
populations in Namialo in Nampula. The conflict in Cabo Delgado, however, will increase the cost
and risk of supplying Pemba and the oilfields.
Export crops are often more difficult due to quality and other requirements, and they are also
potentially more unstable, but do provide opportunities, including for sesame and pigeon pea.
Policy must improve and become less dominated by public sector provision if cashew is to prosper.
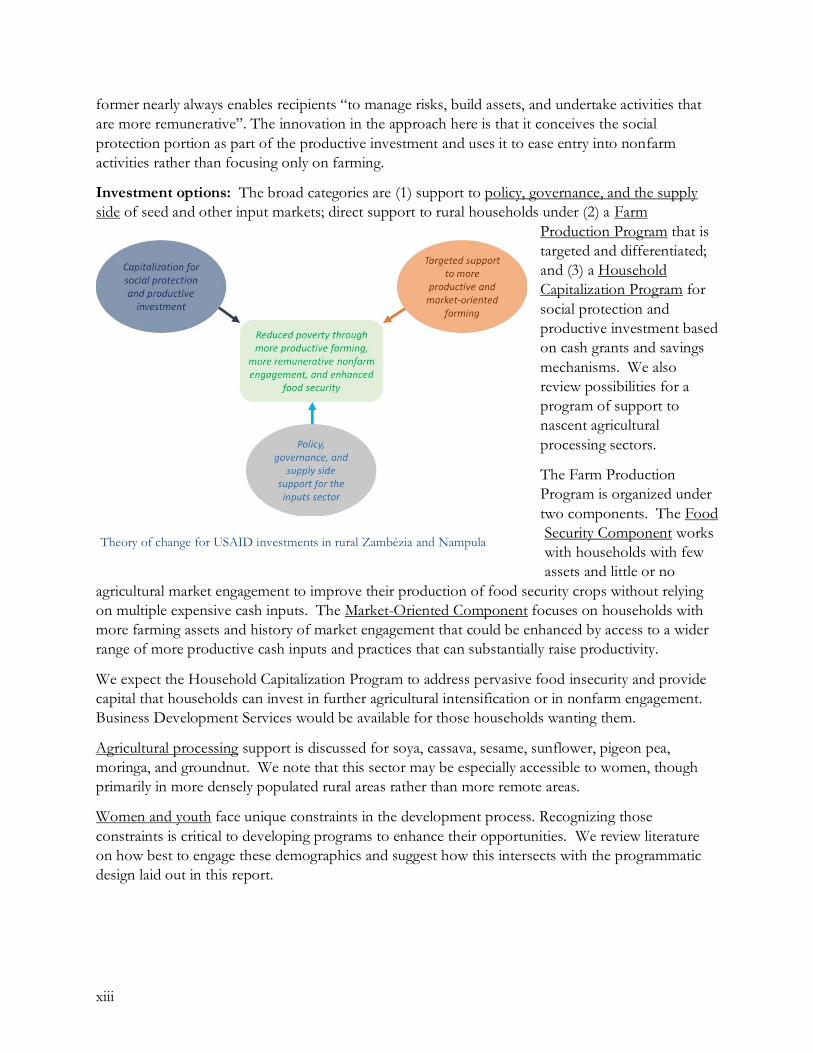
Programmatic approach: Our theory of change (see figure) contends that (1) support to farming
that is targeted geographically and by household and informed by output market possibilities will
efficiently improve productivity among those households able to engage with markets; (2) savings
mobilization and cash transfers across all households (combined with business development
services) will foster expansion by some households into nonfarm activities and allow increased farm
investment; and (3) improved policy and governance in the inputs sector, together with supply side
support building on past investments will foster increased supply of more affordable and better
quality inputs that facilitates more productive farming. This approach falls within the emerging
tendency to combine social assistance with agricultural programs, based in part on evidence that the
xiii
former nearly always enables recipients “to manage risks, build assets, and undertake activities that
are more remunerative”. The innovation in the approach here is that it conceives the social
protection portion as part of the productive investment and uses it to ease entry into nonfarm
activities rather than focusing only on farming.
Investment options: The broad categories are (1) support to policy, governance, and the supply
side of seed and other input markets; direct support to rural households under (2) a Farm
Production Program that is
targeted and differentiated;
and (3) a Household
Capitalization Program for
social protection and
productive investment based
on cash grants and savings
mechanisms. We also
review possibilities for a
program of support to
nascent agricultural
processing sectors.
The Farm Production
Program is organized under
two components. The Food
Security Component works
with households with few
assets and little or no
agricultural market engagement to improve their production of food security crops without relying
on multiple expensive cash inputs. The Market-Oriented Component focuses on households with
more farming assets and history of market engagement that could be enhanced by access to a wider
range of more productive cash inputs and practices that can substantially raise productivity.
We expect the Household Capitalization Program to address pervasive food insecurity and provide
capital that households can invest in further agricultural intensification or in nonfarm engagement.
Business Development Services would be available for those households wanting them.
Agricultural processing support is discussed for soya, cassava, sesame, sunflower, pigeon pea,
moringa, and groundnut. We note that this sector may be especially accessible to women, though
primarily in more densely populated rural areas rather than more remote areas.
Women and youth face unique constraints in the development process. Recognizing those
constraints is critical to developing programs to enhance their opportunities. We review literature
on how best to engage these demographics and suggest how this intersects with the programmatic
design laid out in this report.
Theory of change for USAID investments in rural Zambézia and Nampula

1
Introduction
This report was produced by Michigan State University for USAID/Mozambique as an input into
the mission’s decision making regarding agricultural programming in Nampula and Zambézia
provinces over the coming years. We collaborated closely with Elim Consultoria (Tatiana Mata) and
Dr. Antony Chapoto of the Indaba Agricultural Policy Research Institute in Zambia.
The report is organized as follows. Section II lays out data, methods, and literature used. Section
III provides extensive background on Mozambique’s current status, reviews challenges and
opportunities for transformational growth, and summarizes USAID’s challenge in today’s
environment. Section IV uses Mozambican household survey data to examine that status of rural
households in the two provinces during 2012 and 2017 and draw conclusions regarding the extent of
transformation. Section V lays out the overall programmatic approach and presents the theory of
change behind it. Section VI presents more detailed investment options consistent with the
programmatic approach and theory of change.
Our approach in this paper is rooted in the concept of the structural and rural transformation of
economies, in which rising specialization and productivity in farming is paired with the movement of
labor off the farm into better-paying activities, whether own business or wage labor. The process
also involves a decline in informal self-employment, replacing it with better-paying wage jobs.
Because such a transformation is a sine qua non for broad poverty reduction - other than a small
number of island- and city-states, every wealthy country in the world has gone through this process
– our empirical analysis focuses on evidence of this happening in Mozambique, and the program
options we lay out are designed to foster it. We will return to this idea frequently in the report.
Data, methods, and literature used
A. Online survey of key informants
In December 2020, using a Google survey document, we solicited input from 58 key informants in
Mozambique and achieved a response rate of 31%. The key informants came from the public sector,
from NGOs, from private enterprise and from the donor community. The survey listed 19 major
projects in Mozambique in recent years (some of which are still active) and asked questions
regarding their programs and the efficiency in achieving results in a range of areas. In addition to
ranking questions about how well a given project did in addressing topics such as productivity and
farmer access, open ended questions were asked to include perceptions and judgments of the key
informants. This type of survey can be biased as respondents may be involved directly with projects,
but it gives a chance to get insights and understand how people are thinking about key issues. See
Annex A for copy of the survey instrument and basic results.

2
B. Key informant interviews in Mozambique
We followed the survey with key informant interviews conducted on Zoom or other platform, with
two or more of the team on the line, during December through February. These conversations were
generally 30 minutes to 1 hour long. A team from USAID had previously conducted interviews in
mid-2020 with key informants and the responses to that survey were used to identify key areas of
focus for these new interviews. The team asked key informants to address specific questions
concerning their challenges and prospects, as well as addressing individual thoughts concerning
aspects of success and new opportunities. See Annex B for a list of interviewed people.
C. Regional review of programs
We contracted Dr. Antony Chapoto of the Indaba Agricultural Policy Research Institute in Zambia
to conduct a review of programs in the region. Dr. Chapoto has over 20 years of experience in the
region, and drew on his own knowledge of Zambia and the region while consulting also with MSU
country programs in Malawi and Tanzania to identify the key programs for review. We integrate his
findings with our own findings from the survey and interviews in Mozambique in this document.
His full report is found in Chapoto and Kabisa (2021).
D. Literature consulted All of the projects, programs and initiatives in Mozambique provide a wealth of studies and other
documents useful in diagnosis and planning. We cite key documents in the Reference List. In
addition, a List of Thematic References is in Annex C with URL links to ease access for many of the
documents. These are documents that we have accessed, that may be of interest, but are additional
to those cited in the report. Among those resources are many value-chain assessment documents,
designed to help identify the best opportunities for private sector investments. Those include
ACDI/VOCA (2016), FTF Inova (2017), and Cambridge Economic Policy Associates (2016)
Agribusiness Country Diagnostic. Each document provides an assessment of the potential value
chains, weaknesses, opportunities using SWOT analysis and other types of analysis.
Project design, final reports, and evaluation reports: Another key source of information for this
report were the project design documents as well as final reports, and in some cases evaluations,
conducted for key projects in Mozambique, focusing on projects since 2010. While many of the
documents are public access, the availability of this grey literature was often compromised by
projects ending and websites no longer being maintained, lack of public release of documents, and
other issues. Within-project or program reports are also known for bias, especially in reporting
weaknesses or failures of activities or strategies. We took all these issues into account as we reviewed
these documents.
Research Literature: Finally, there are various policy documents and other research that provide
insight into the dynamics of rural development in Mozambique and elsewhere in the region or in
sub-Saharan Africa. International institutions, including IFPRI, World Bank, FAO, and AGRA,
have produced strategic documents on Mozambique and throughout sub-Saharan Africa that can
help guide programming. Those too are found in the Thematic References in Annex C.

3
E. Household data
We used 2012 and 2017 IAI (MASA/DPCI 2012 and 2017) rural household surveys to examine
changes in livelihoods, farming practices, farming income, and food security in Nampula and
Zambézia provinces. All results were weighted by the sample weights included in those survey
databases. These surveys are very comparable on the farm side, allowing a thorough examination of
changes in farming behavior between these two periods. However, IAI 2017 did not use the
detailed nonfarm employment module that was used in 2012, instead collecting only a few indicators
of nonfarm engagement of each household member. As a result, we were unable to generate the
same rural household typology (see next section for a brief discussion of this typology) in 2017 that
we did in 2012 and were therefore limited in our ability to directly quantify broader aspects of rural
transformation during that period. Nonetheless, based on the detailed picture of change we were
able to develop at the farm level between the two periods, and the member level indicators of
nonfarm engagement, we believe we can speak with some broad confidence regarding the very
limited transformation that has taken place over this time.
F. Definition of zones and rural household types
Designing programs to spur rural transformation requires targeting of different interventions to the
areas and types of households where they can have greatest impact. To aid this targeting we drew
on existing livelihood zones and agroecological zones (see Annex D for maps), used our own
judgment to define four zones in Nampula and Zambézia provinces, and then assigned whole
districts to these new zones. We also used IAI-2012 to develop a rural household typology rooted in
the concept of the rural transformation and building off the approach of Hazell (2017).
Zones: Figure 1 maps each zone. Table 1 shows the districts they contain and provides a summary
characterization. These four zones differ primarily in agroecology and thus in the crops that USAID
might support. But one zone (Lowland Southern Zambézia) stands out for better access to
improved roads, relatively uncommercialized farming and higher engagement in the nonfarm
economy: in both 2012 and 2017 this zone sold only about 10% of its farm production, compared to
a range of 17% to 26% in other zones; and in 2012 it earned nearly 50% of its total income from
nonfarm sources, compared to no more than 25% in any other zone. The other three zones differ
little in these three aspects and all zones differ remarkably little in their agricultural practices. Mean
and median incomes are also very similar, varying in 2012 (no data for 2017) by less than 40% and
15%, respectively, between the poorest and least poor zones. Food security indicators are quite
comparable and suggest a need in every zone for food security and nutrition programing beyond
programs to promote inclusive growth.

4
Table 1. Zones of Nampula and Zambézia province to guide programming
Zone Districts Characterization
Lowland Southern
Zambézia (LSZ)
Chinde, Inhassunge, Mopeia, Namacurra,
Nicoadala, rural areas of Cidade de Quelimane
Mostly subsistence rice farming with strong
integration into non-farm economy
Eastern / Coastal
Northern Zambézia and
Nampula (COASTAL)
Angoche, Erati-Namapa, Maganjha da Costa,
Meconta, Memba, Mogincual, Moma, Monapo,
Mossuril, Nacala Velha, Nacaroa, Pebane, C.
de Nacala
Isolated with manioc, groundnuts, coconut, cashew,
and some other cash crops, moderate nonfarm
engagement
Mid-elevation Nampula
and Zambézia (MID-
ELEVATION)
Gile, Ile, Lalaua, Lugela, Mecuburi, Mocuba,
Mogovolas, Morrumbala, Morrupula, Muecate,
Nampula, C. de Nampula
Somewhat isolated with manioc, beans, maize and
some cash crops, and moderate non-farm
engagement
Western Nampula and
Alta Zambézia (WNAZ)
Alto Molocue, Gurue, Malema, Milange,
Namarroi, Ribaue
Isolated with heavy dependence on maize and
moderate nonfarm engagement
Source: Authors’ elaboration from AEZ and livelihoods maps plus IAI 2012 results
G. Household types It is widely understood that cropping patterns and livelihoods vary quite a bit over rural areas in
Mozambique. There is much less understanding of diversity among smallholder farmers. The
persistent tendency in Mozambique to refer to nearly the entire set of smallholder (sector familiar)
farmers as “produtores de subsistência” (subsistence producers) hides substantial variability within
this sector that needs to be taken into account in program design. This reality is widely appreciated
Figure 1. Map of zones used in this report

5
among empirical researchers and is summarized in accessible form by Harris, Chamberlin, and
Mausch (2019).
We aim to capture this diversity in our rural household typology. We base the typology on one
developed by Hazell (2017) for AGRA’s 2017 African Agricultural Status Report (AGRA, 2017).
Using data from the 2012 IAI (later IAIs have no data on nonfarm income so could not be used for
this purpose), we compute two variables for every surveyed household: (1) the share of their farm
production that they sell, and (2) the share of total household income (farm plus nonfarm) that
comes from nonfarm activities. Together, these two variables define a “transformation space” in
which we can locate rural households; higher farm sales out of total farm production and higher
nonfarm income out of total income both reflect greater transformation, though along different
axes.
Table 2 maps our typology and its terminology into terminology commonly used today in
Mozambique and shows the percent of all households from the 2012 IAI in each category. Figure 2
shows the size of each group and where they lie in the “transformation space” captured by our two
variables, and Table 3 shows the distribution of household types across our four zones.
Table 2. Mapping of rural household typology into common terminology used in Mozambique
Current/common terminology
Our terminology (%
of all farmers in 2012
IAI)
Short
name Short description
Precise definition (from
IAI 2012)
Subsistence – all smallholder
farmers (“sector familiar”)
Subsistence and semi-
subsistence
smallholder farmers
(27%)
Type 1,
Type 2
Sell little or none of their
farm production and earn
little or no nonfarm income
Sell < 5% of their farm
production;
Nonfarm income < 33% of
total income
Semi-commercial
smallholder farmers
(32%)
Type 3 Sell little of their farm
production; little or no
nonfarm income
Sell 5-50% of farm
production;
Nonfarm income < 33% of
total income
Commercialized
smallholder farmers
(8%)
Type 4 Sell most of their farm
production; little or no
nonfarm income
Sell 50-100% of farm
production;
Nonfarm income < 33% of
total income
Nonfarm oriented
rural smallholder
households (31%)
“Transitioning Out”
Type 5 Sell little of their farm
production; most income is
from nonfarm
Sell < 50% of farm
production;
Nonfarm income > 33% of
total income
Diversified rural
smallholder
households (3%)
Type 6 Sell most of their farm
production, but most
income comes from
nonfarm
Sell > 50% of farm
production;
Nonfarm income > 33% of
total income
Emerging – Mostly medium-scale
market-oriented farmers, often
targeted as service providers by
programs such as SUSTENTA
Commercially oriented
medium-scale farmers
(~1%)
Emerging Mostly medium scale farms
but not all of them – some
are not successful farmers
Not adequately represented
in IAI
Commercial – Large-scale farming
operations
Large-scale farming
businesses (<1%)
Large-scale Large-scale farming
businesses
Not adequately represented
in IAI

6
Table 3. Percentage of smallholder and “medio” households by zone and type
HH characteristic (mean or %)
Type of rural household
Total
Type 1 Type 2 Type 3 Type 4 Type 5 Type 6
Subsis
-tence
Semi
Subsis-
tence
Semi-
Commer-
cialized
Commer
-cialized
Non-
farm
oriented
Diver-
sified
Lowland S. Zambézia 16 13 9 0 57 6 100
East/Coastal N. Zambézia & Nampula 12 14 36 6 28 3 100
Mid-elevation Zambézia & Nampula 8 17 36 11 25 3 100
Alta Zambézia & W. Nampula 12 15 39 10 22 1 100
Total 12 15 32 8 31 3 100
Source: Authors’ calculation from IAI2012; small- and medium sample
Figure 2. Rural household “transformation space” with relative sizes of each household type from our typology (includes all “pequeno” and “medio” farmers in the 2012 IAI; does not include “emerging” and “large-scale” farmers from Table 3 as we have no survey data
This simple categorization shows clearly that the smallholder farming sector, commonly seen in
Mozambique as an undifferentiated set of “subsistence farmers”, instead shows quite a lot of
diversity, ranging from true subsistence farmers who engage little if at all with farm- or nonfarm
markets (Types 1 and 2 in the bottom-left of the figure, about one-quarter of all households),
through households that sell most of their farm production even as they earn most of their income
off the farm (Type 6 in the top-right, just 3% of households), and with much variation in between.

7
Table 4 examines this variability across household types in more detail. Four points stand out.
First, types 5 and 6 earned much higher total incomes and showed much higher nonfarm incomes
shares than other types.
Second, farm incomes vary much less across household types than do total incomes. In fact,
household types 5 and 6, with the highest total incomes, have either the lowest (type 5) or third-
lowest (type 6) incomes from farming. Subsistence farmers (type 1) have higher farm incomes per ha
than do commercialized farmers (type 4), though the latter’s higher land holdings mean that their
total incomes from farming are nearly double those of subsistence farmers. Semi-subsistence
farmers (type 2) far exceed other types in mean farming income per ha. This pattern shows
shockingly little payoff to agricultural commercialization in Mozambique as of 2012.
Third, these patterns mean that households generating the highest incomes are doing so through
nonfarm income, not through farming. Yet the fourth point is that, despite this, farming is still
claimed as the most important economic activity for most adults across every farm type. In other
words, nearly all households consider farming a central part of what they do, even those who earn a
great majority of their income off the farm.
Finally, food insecurity is pervasive across all household types, with at least 30% having experienced
hunger over the past 12 months in every group. Thirty-nine percent and 34%, respectively, of types
5 and 6 (the highest income groups) experienced hunger over this period.
Table 4. Livelihoods, incomes, and food security by household type, 2012Table 5. Livelihoods, incomes, and food security by household type, 2012
Source: Authors’ calculation from IAI2012
HH characteristic (mean or %)
Type of rural household
Total
Type 1 Type 2 Type 3 Type 4 Type 5 Type 6
Subsis
-tence
Semi
Subsis-
tence
Semi-
Commer-
cialized
Commer
-cialized
Non-
farm
oriented
Diver-
sified
% of all households 12 15 32 8 31 3 100
Incomes
Mean total income/AE (real contos) 3,099 7,055 5,795 5,889 11,374 17,490 7,776
Mean gross farm income/ae 3,108 6,479 5,393 5,608 2,787 3,278 4,442
Mean gross farm income/ae per ha 3,051 4,610 3,349 2,761 2,474 I,917 3,168
Farm sales share in total farm income 0.0 1.1 21.7 68.7 9.9 71.2 17.7
Non-farm/total income 0.0 10.1 7.7 7.6 68.5 63.3 27.5
HH received remittances (%) 0.0 23.8 16.4 17.1 32.6 28.2 21.0
Remittance income/total income 0.0 1.4 1.4 1.0 8.3 11.5 3.7
Economic activity
Adults with farming as principal activity (%) 77.6 82.5 86.9 95.5 66.8 59.5 78.8
Adults with wage employment (%) 5.8 19.6 14.1 14.6 25.1 21.4 17.6
Adults with own business activity (%) 3.0 25.1 21.8 30.6 37.5 36.8 26.2
Food security
Experienced hunger past 12 mths (%) 39.3 56.5 46.5 29.8 38.7 34.0 43.1

8
Together, these patterns highlight in stark form the importance of promoting both farm and
nonfarm income among rural households in Mozambique: farming must transform enough to be
begin to provide a way out of poverty for motivated farmers with enough land and other assets to
make farming a business, it must also continue to provide the food security backstop that even the
most nonfarm oriented households clearly still use it for, but many rural households must also be
helped to move into more remunerative nonfarm income if they are to escape from poverty.
Background and context: Challenges and opportunities
for growth and transformation
A. Major global, continental, and national challenges
Mozambique faces a daunting array of overlapping challenges to achieving the inclusive agricultural
and rural transformation that it needs to sustainably and rapidly reduce poverty, inequality, and food
insecurity. Understanding these challenges – and the options they likely close-off and those they
may leave open - is key to designing and deploying workable development strategies. We briefly
review these challenges at the global, continental, national, and sub-national levels before turning in
the next section to the growth opportunities the country does have.
The global setting: Narrowing options for transformative growth: The development challenge
facing Mozambique – and every other low-income country – is to achieve a structural and rural
transformation of its economy. These transformations involve increasing productivity and
specialization on the farm and progressive movement of labor off the farm into more remunerative
rural nonfarm activities and urban-based wage and business activities. In parallel, it involves
movement out of informal self-employment into better-paying wage jobs that may also offer social
protections. Without such a transformation, broad poverty reduction is impossible. In fact, every
wealthy country in the world today, aside from a small number of island- and city-states, has gone
through this process, moving from a primarily rural and agricultural economy to one dominated by
non-agricultural employment based primarily in urban areas.
Such a transformation cannot happen without large and sustained increases in agricultural
productivity, since this productivity is central to raising rural incomes both on and off the farm, and
to affordably feeding the population. Making the transformation inclusive means that the
profound changes the country goes through provide opportunity to a wide range of rural residents,
including women, youth, and the very poor. In practice, this typically involves combining targeted
safety net assistance with growth-oriented strategies focused on increasing productivity among those
households that are able to profitably adopt needed technology. In fact, designing these two
elements in tandem can lead to far greater positive impact on rural households than either one alone;
this idea becomes a central pillar in the design of investment options we lay out later in the report.
Historically, today’s high- and upper middle-income economies have achieved this transformation
through export-oriented, labor-intensive manufacturing that “pulled” labor out of farming and out
of rural areas into more remunerative and stable jobs mostly in urban areas. The US and European
countries saw industrial employment rise well beyond 20% and even near 40% of total employment
during their most intensive industrialization phases (Rodrik, 2015). More recently, China, Brazil, and

9
some other Asian countries saw industrial employment rise as high as 15% – lower than the previous
generation of western industrializers due to technology change, but still a very substantial share of
employment. Notably, the US and European countries reached peak industrial employment at
income levels averaging around $14,000 per capita (in 1990 USD), while the later industrializers
appear to have reached their peaks at incomes of around US$5,000 or less: peak industrial
employment is now clearly lower than in the past and is being reached at lower incomes than in the
past.
For countries that have not yet industrialized – much of Africa including Mozambique, and some
South Asian countries - this avenue to transformation is now much less available, for two
overlapping reasons. First, as countries progress into upper-middle and high-income status,
consumer expenditure progressively moves towards services instead of manufactured goods. In a
relative sense, this means that global demand for manufactured goods declines as incomes in the
global economy rise. Though some suggest otherwise (Kenfemichael and Morshed, 2019), most
experts agree that the service sector does not offer the same “escalator” out of poverty that
manufacturing does, due to lower technological intensity of production and skill demands
(McMillan, Rodrik, and Sepulveda, 2017). If true, this means that the decline of manufacturing
employment will limit growth in wages and incomes in countries that have not yet industrialized.
Second, automation, which is increasingly driven by artificial intelligence and thus has vastly broader
scope than in the past, is dramatically reducing the amount of labor needed for manufacturing
output, and global trade is spreading this impact across the world. Countries thus face the combined
negative effect of falling relative demand for manufactured goods and falling demand for labor per
unit of those goods. There has been strong debate and wide disagreement over whether these forces
will lead to a net reduction in employment. Many note that similar fears over the past three
centuries were never borne out, as technological change led to the emergence of previously
unimaginable jobs, and overall employment increased (World Bank, 2019b). Others note the rise of
artificial intelligence (including much more rapid advances just in the past year than many experts
thought possible) and fear that “this time might be different": that the confluence of robotics,
exponentially expanding “Big Data”, and ever-increasing computing power may push automation so
far into jobs previously doable only by people that increasing shares of the world’s population will
be unable to find remunerative employment. (Brynjolfsson and McAfee 2011; Brynjolfsson and
McAfee 2014; Autor 2014; Ford 2015).1
Regardless of where analysts stand on the issue of the level of employment, there is wide agreement
that “the bar has been (substantially) raised” for entry into export-oriented manufacturing. Today,
sustained entry into most of these markets is not possible without adopting new, knowledge-
intensive technologies and collaboration processes that underpin an ability to ensure high- and
continuously improving quality (Hallward-Driemeier and Nayyar (2018). Among other things, this
requires a skilled workforce and an “entrepreneurship ecosystem” favoring pragmatic collaboration
between government and private sector to spur continuous innovation. Such requirements put
countries such as Mozambique – with low incomes, poor governance (see below), a largely unskilled
1 We also note that recent research (Acemoglu and Restrepo, 2020) for the first time has documented net declines in employment and wages linked to robotization – one type of smart automation.

10
workforce, and minimal industrialization - in an extremely difficult situation as they struggle to
ensure sustained, broad-based growth for their populations. In section II.C, we consider the
implications of these patterns for Mozambique and for USAID’s investments in the rural sector.
The continental setting: A much more precarious environment than five years ago: Africa’s
economic situation is much more precarious now than it was even five years ago, based on two
facts. First, there has been a general bust in African GDP growth since 2013 or 2014 (Figure 1; see
Tschirley, et. al., 2020). From 2000 to 2013, the continent achieved steady and rapid growth, with
mean per capita consumer expenditure in constant dollars rising from under USD900 to USD1300,
implying an annual per capita growth rate of about 3% per capita. Since 2013, growth has clearly
faltered through 2018. The downturn in growth did not affect every country on the continent but
was very broad: of the 29 countries with data for the entire 2000-2018 period, nine bucked the
continental trend and achieved higher growth after 2013 compared to before; yet 20 countries had
lower growth during this second period. Furthermore, while only one of the 29 had negative growth
during the boom period prior to 2013, 10 had negative growth since 2013. Mozambique followed
the continental pattern, with growth faltering around the same time (see next section for more
detail).
Figure 3. Per capita final consumer expenditure in constant 2010 USD, Sub-Saharan Africa, 1981-2018 (Source: Elaboration by author using World Bank Indicators, Final consumption expenditure estimated from national accounts data (excel file API_NE.CON.TOTL.KD_DS2_en_excel_v2_1129220).
This growth faltering has a major effect on Africa’s rural and agricultural sectors, for a simple
reason: broad poverty means that large shares of increased income is spent on food in Africa,
making domestic demand for food linked to rising incomes and urbanization a major motor of
growth in rural areas. When that growth falters, rural areas suffer.
The second factor contributing to Africa’s precarious position today is the impact of the COVID-19
pandemic, which continues to worsen on the continent. Prior to the pandemic, the IMF forecast
3.5% growth in GDP on the continent 2019 and 3.6% in 2020, barely positive in per capita terms,
given the continent’s very high population growth. Now, with the COVID-19 pandemic, the severe

11
locust outbreak in East Africa, the Fall Armyworm infestation since 2016, and growing security
problems in the Sahel, the IMF forecasts GDP growth of negative 3.2% in 2020 (negative 5.4% per
capita!) and a recovery to 1.1% overall (still negative in per capita terms) in 2021 “assuming that the
pandemic abates, and lockdowns ease further in the second half of 2020” (IMF, 2020, p. 5). By the end of 2021
under these projections, per capita incomes on the continent would be back to where they were 10
years ago. If the pandemic instead worsens (as it appears now to be doing) and economic life is
further disrupted, the regression will be even greater.
The national setting: major challenges accentuated by governance and the difficulty of effectively
managing the natural resource boom: Mozambique faces an array of challenges including
entrenched poverty, faltering economic growth, poor governance that has worsened over the past 10
years, and a high share of population in rural areas compared to SSA and the region, which makes
the rural development challenge more difficult. We briefly address each of these issues in this
section.
First, among countries with data since 2010, Mozambique has had the seventh highest headcount
poverty rate in the world, at 64% (based on $1.90 per capita per day, World Bank data). While
growth in per capita consumption (as reported by World Bank) averaged 5.5% per year from 2000
to 2013, it averaged only 2.0% from 2013 to 2016 and was negative in 2017 and 2018.
Second, addressing growth and poverty is made more difficult by low and declining institutional
effectiveness and governance quality combined with the difficulty any country faces managing a
natural resource boom.2 The discovery of major natural gas reserves in Mozambique in 2011
heightened the need for strong governance to effectively manage the country’s exchange rate and
avoid rapid appreciation that would hurt local productive sectors compared to imports. To do this,
natural resource proceeds need to be aggressively invested in productive and labor-absorbing sectors
of the economy to counteract the strong tendency in resource-rich countries for productive sectors
to lag. Yet trends since this time are not encouraging (Figure 4): across six governance indicators
monitored by the World Bank, Mozambique in 2019 ranked in the bottom 25% globally in five,
ranked lower in 2019 than in any year since 2000 in all six, and ranked lower than neighboring
Malawi and Zambia in all six.
Of particular concern for rural development are indications of a return to state-led approaches that
may undermine the development of sustainable, broad-based markets for agricultural inputs and
output. The approach to input and service provision under the country’s flagship agricultural
development program – SUSTENTA –may be a prime example of this, with some knowledgeable
observers concerned that its approach of distributing heavily subsidized seeds and other inputs to a
limited number of farmers may “destroy many of the nascent commercial market systems that have
been developed” (quote from online survey respondent). Part of this impact is due to the size of
SUSTENTA purchases, which observers say lead to scarcity of certified or other quality seed and
2 Though revenues from the LNG fields have not yet begun to flow and will be further delayed due to COVID-19 and concerns about security in the north, Mozambique’s dependence on natural resource (extractives) exports has risen dramatically over the past 20 years, from 10% of all exports in 1996 to 70% in 2014. FDI in Mozambique, driven largely by LNG, was the third highest in Africa in 2017. See Roe (2018).

12
thereby starve the emerging agrodealer network of the supplies that it needs. This network is key to
broad and sustained input access by smallholder farmers.
A second example relates to the role conceived for the new Instituto de Algodão e Oleaginosas de
Mocambique (IAOM), which replaced the old Instituto de Algodão. Among other things, the
proposed regulations released in February 2021 (IAOM 2021) do the following:
• Seek to “regulate the production, marketing, industrialization, exportation and importation”
of all oilseeds;
• Register all private sector actors, including a requirement that they file annual workplans for
crop production and processing each year;
• Propose a reference price established by the Council of Ministers by March 30th each year;
• Permit sales by farmers only to an identified commercial operator or development group
that is expressly authorized.
Figure 4. World Bank measures of governance quality in Mozambique, 2000-2019 (Source: World Bank Worldwide Governance Indicators
It is unlikely that the government of Mozambique will be able to implement these regulations, and to
the extent that it does, they could dramatically undermine incentives for farmers, processors, and
traders to invest in the system.
Third, though urban populations are rising rapidly, the country still has a high share of its population
living in rural areas. Using Africapolis data (OECD/SWAC, 2020), Mozambique’s population in
2015 was 33% urban, compared to averages of 50% in Southern Africa, 47% in West Africa, 43% in
Central Africa, 37% in East Africa, and 44% in SSA overall. This low level of urbanization makes
Mozambique’s rural development problem more challenging for a simple reason: given the difficulty
of breaking into global markets and the instability that the country has experienced in these markets,
domestic consumption needs to be a central driver of growth, and a low urban population share
means that the domestic market is small for local farmers.
13
On the other hand, this very fact means that, as urbanization proceeds and especially if it is paired
with income growth, the size of the market for food per rural resident rises extremely rapidly. This
makes growth in domestic food markets – and, ideally, nearby regional markets – a foundation for
rural development.
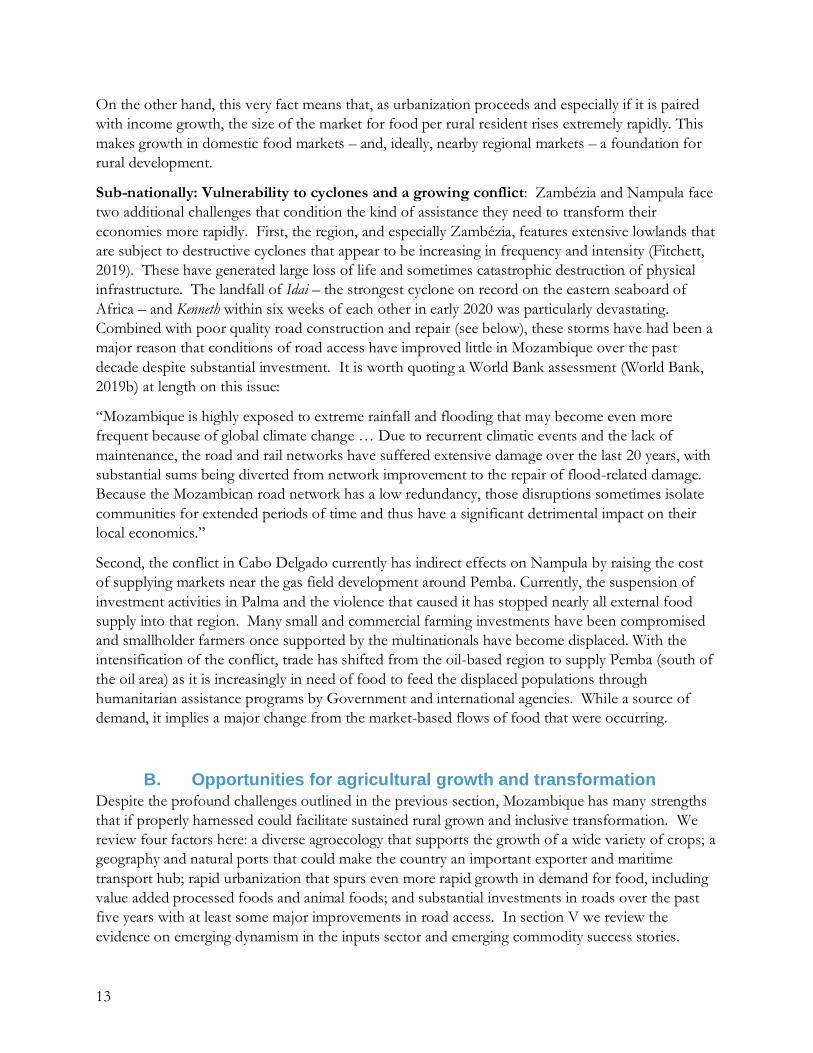
Sub-nationally: Vulnerability to cyclones and a growing conflict: Zambézia and Nampula face
two additional challenges that condition the kind of assistance they need to transform their
economies more rapidly. First, the region, and especially Zambézia, features extensive lowlands that
are subject to destructive cyclones that appear to be increasing in frequency and intensity (Fitchett,
2019). These have generated large loss of life and sometimes catastrophic destruction of physical
infrastructure. The landfall of Idai – the strongest cyclone on record on the eastern seaboard of
Africa – and Kenneth within six weeks of each other in early 2020 was particularly devastating.
Combined with poor quality road construction and repair (see below), these storms have had been a
major reason that conditions of road access have improved little in Mozambique over the past
decade despite substantial investment. It is worth quoting a World Bank assessment (World Bank,
2019b) at length on this issue:
“Mozambique is highly exposed to extreme rainfall and flooding that may become even more
frequent because of global climate change … Due to recurrent climatic events and the lack of
maintenance, the road and rail networks have suffered extensive damage over the last 20 years, with
substantial sums being diverted from network improvement to the repair of flood-related damage.
Because the Mozambican road network has a low redundancy, those disruptions sometimes isolate
communities for extended periods of time and thus have a significant detrimental impact on their
local economics.”
Second, the conflict in Cabo Delgado currently has indirect effects on Nampula by raising the cost
of supplying markets near the gas field development around Pemba. Currently, the suspension of
investment activities in Palma and the violence that caused it has stopped nearly all external food
supply into that region. Many small and commercial farming investments have been compromised
and smallholder farmers once supported by the multinationals have become displaced. With the
intensification of the conflict, trade has shifted from the oil-based region to supply Pemba (south of
the oil area) as it is increasingly in need of food to feed the displaced populations through
humanitarian assistance programs by Government and international agencies. While a source of
demand, it implies a major change from the market-based flows of food that were occurring.
B. Opportunities for agricultural growth and transformation
Despite the profound challenges outlined in the previous section, Mozambique has many strengths
that if properly harnessed could facilitate sustained rural grown and inclusive transformation. We
review four factors here: a diverse agroecology that supports the growth of a wide variety of crops; a
geography and natural ports that could make the country an important exporter and maritime
transport hub; rapid urbanization that spurs even more rapid growth in demand for food, including
value added processed foods and animal foods; and substantial investments in roads over the past
five years with at least some major improvements in road access. In section V we review the
evidence on emerging dynamism in the inputs sector and emerging commodity success stories.

14
Varied agroecology: Zambézia and Nampula provinces have a varied agroecology that supports
the growing of a wide variety of crops. Its vast coastal plains allow for production of many tropical
fruits and tree crops, and broadly support production of cassava, rice where irrigation is available,
and maize, though the latter has substantially lower yield potential than it does in other areas (Box
1). Mid-elevation zones provide good soils and climate for production of a range of food crops
(maize, cassava, many pulses, and groundnuts), cash crops such as sesame, cotton, and pigeon pea,
and small- and large livestock. Higher elevation areas (western Nampula and Alta Zambézia) are
ideal for maize, soybeans, pigeon pea, and year-round vegetable production. Small ruminant and
poultry production is supported throughout the region.
Box 1: Why is Mozambique’s agricultural productivity so much lower than its neighbors?
Mozambique’s yields are substantially below those of its neighbors across a wide array of crops. We illustrate this below using
FAOSTAT data for maize, which likely reflects the situation for most other grains. Maize yields from 2014-2019 in Mozambique
are slightly below those in Zimbabwe and half or less those in Malawi, Tanzania, and Zambia. The pattern is similar for cotton,
where yields in Mozambique averaged 490 kg/ha over the period compared to 580 in Tanzania and 860 in Zambia. Groundnut
yields are also very low, ranging from 30% of those in Malawi to 64% of those in Zimbabwe. We note also that Dunavant, which
operated a successful contract farming scheme for cotton in Eastern province of Zambia, consistently failed to meet yield
expectations after expanding its operations into
agroecologically similar Tete province and eventually
southwestern Zambézia and left the country after several
years of effort. Though data quality make comparison
problematical, yields for staple vegetables such as tomato,
onion, cabbage, and potato are also likely substantially
lower in Mozambique than in its neighbors.
We attribute this persistent yield gap between Mozambique
and its neighbors to several factors. The first is
agroecology. Mozambique’s extensive hot and humid
lowlands meant that its average elevation is far lower than
its neighbors: 345 meters compared to a range of 779 in
Malawi to 1,138 in Zambia. Lowland areas have lower
potential yields for most grains, oilseeds, and temperate
season vegetables. At the same time, they may drive higher
yield potential for some tropical fruits but exploiting these
fruits even for the domestic market requires a much higher level of organization in production and marketing.
Second, Mozambique is far more vulnerable to flooding and other damage from cyclones, which destroys infrastructure in addition
to crops and over time drives the cost of market access up and reduces incentives to use purchased inputs.
Third, historical and institutional factors contribute to Mozambique’s low yields. The country was among the very poorest in the
world at independence, with much lower levels of education and civil service employment among the local population than its
neighbors. The brutal 17-year civil war following independence decimated what existed of a rural trading network and made
sustained development of developmental institutions exceptionally difficult. Since the ending of the civil war in 1992, Mozambique
enjoyed over 20 years of political stability and sustained (if not highly equitable) economic growth, but since 2010 the political
situation has worsened even as cyclones have inflicted more frequent and more severe damage in key production areas.
Fourth, the most productive mid- and high elevation areas of the country - western Nampula, Alta Zambézia, far western Manica,
and much of Niassa - are far from large urban markets and in most cases have poor road connections to trunk roads that could
provide access to those markets. In contrast, Malawi, Zambia, and Zimbabwe (less so Tanzania) have much more productive areas
close to their main urban markets. Increasing distance to markets combined with poor road infrastructure dramatically reduces
production incentives for farmers in Mozambique’s most productive zones to intensify their production for the market.
Finally, all these factors combine to make agricultural input use in Mozambique among the lowest in the world. As one example,
Mozambique ranked 26th out of 33 African countries in 2016 in fertilizer use per hectare of arable land, with an average of 3.7
kg/ha vs an SSA average of 16 kg/ha. Use of other inputs is comparably low (see Annex F for data from the 2017 IAI).
Figure B1. Maize yields in Mozambique and neighbors
2014-2019

15
The challenge is that this same agroecology, given Mozambique’s geography, road infrastructure,
and rudimentary organizational capacity within value chains, has resulted in quite low average yields
for many crops important to the country (see Box 1). Reversing this pattern and taking advantage of
its agroecological endowments to efficiently produce the wide range of crops that its agroecology
allows requires targeted investments that we discuss later in this report.
Geography and natural ports: Mozambique’s long coastline and major ports in the south
(Maputo), center (Beira), and north (Nacala and Pemba) has historically made the country a major
provider of overland and maritime transport. Historically and to this day, Malawi, Eswatini, South
Africa, Zambia, and Zimbabwe have all relied on Mozambican ports for part of their exports and
imports. Yet Mozambican ports have been plagued by poor management over time, and World
Bank (2018) lists Beira and Nacala, along with East London in South Africa, as the least efficient
among 110 global ports matched for size and scope. Coastal shipping has also remained extremely
inefficient. As World Bank (2018) states, not every port will have the opportunity to become a
regional hub, and they expect that Durban and Djibouti will take on those roles, not any of the
Mozambican ports.
Rapid urban population growth feeding even more rapid growth of domestic food markets:
The relationship between urban population growth and growth in the size of the food market per
rural resident is illustrated in Figure 5, which shows the ratio of the urban-to-rural population as a
function of the share of the urban population in total. This relationship establishes a lower bound
on the rate of growth of the food market per rural resident, since as urbanization proceeds, rural
residents also begin to purchase more food and thus actual marketing possibilities grow even faster.
The key point is that the size of the urban population per rural resident increases exponentially as the urban
population share rises. For Mozambique, a rise in the urban population share from its current 33% to
just 40% would increase the size of the urban market by more than 35% for an average rural
resident (note small callout graph to see this more clearly).
The good news for Mozambique is twofold. First, because urban populations are growing rapidly,
the size of the domestic market for an average farmer is growing even more rapidly. This is true
even if most of those moving to or born in urban areas are poor, as they rely on markets to a much
greater degree than do rural residents (though they, too, are increasingly relying on markets for
food). Evidence also shows clearly that urban incomes are far higher than rural – by about 80% in
Mozambique in 2010. Though scant, available evidence also suggests that urban incomes have risen
more rapidly than rural in most areas of Africa; this is almost surely the case in Mozambique, given
the structure of growth in the country (Tschirley et. al., 2020, table 3 and discussion).
Second, the growth in this urban food market is far more predictably accessible than it is for export
markets. While export markets might grow steadily, quality and other requirements and changing
policies in importing countries (witness India and pigeonpea) can make access to those markets very
unstable. This rapid growth of, and predictable access to, the domestic food market makes it an
obvious focus for investment seeking to improve rural welfare by enhancing access to reliable and
profitable markets for farmers.

16
Looking at Nampula and
Zambézia, the second-largest
city in the country –
Nampula City with an official
population of over 660,000
in 2017 – lies in this zone.
Both it and urban
populations in general in
Nampula province grew at
least as rapidly as they did
nationally between 2007 and
2017: Nampula City grew by
41% (3.3% annually) and
total urban populations in the
province grew by 50% (4.1%
annually) during this time,
compared to overall urban
population growth of 41%.
Urban populations of
Zambézia and its main city, Quelimane, grew slower, at 21% and 28% total growth, respectively,
during the period.
This spatial pattern of urbanization emphasizes the importance of road links from the hinterland
areas of northern Zambézia and all of Nampula to the Nacala corridor road, to take advantage of
the robustly growing markets for all the food crops mentioned above. This includes maize, which
can grow on the back of direct demand for human consumption and derived demand through
animal feeds for the rapidly growing poultry, beef, and even aquaculture industries. Soya faces strong
demand through animal feed and the possibility of growing human consumption demand if
investments are made to promote such consumption as now occurs in Malawi. Yet in both cases,
investments and policy must drive productivity in domestic value chains if the local product is to
compete with imports. Also, feed markets for beef and aquaculture are currently very small, and
their growth depends on continued income growth especially in urban areas.
Vegetables also see a rapidly growing urban market and, in Nampula and Zambézia, much less
import competition than in the south of the country.
Table 1 and Figure 6 draw on Tschirley et. al. (2016) and Tschirley et. al. (2017) to assess growth
prospects at national level in domestic demand for various food commodities over a five-year
period. The original analysis was based on demand elasticities and size of consumption estimated
from the 2009 Inquérito aos Agregados Familiares (IAF) (INE 2009), together with assumptions about
per capita income growth and rates of urbanization. Because prospects for broad based economic
growth in Mozambique are much less certain than they appeared five years ago, we focus instead on
a qualitative assessment of the expected rate of growth in demand assuming continued urbanization
and some growth in per capita incomes. We then add, in Figure 4, the projected contribution of that
growth to total growth in demand for food. The latter depends on the proportion that the food
Figure 5. Minimum relative size of urban food market relative to rural population, by share of urban population in total population (Source: Author’s calulations)

17
item occupies in total food expenditure at the start of the period: rapid growth starting from a small
base, for example, gives the food item a moderate contribution to total growth, while moderate
growth starting from a large base can result in a large contribution to total growth. By identifying
foods based on their anticipated rate of demand growth together with the total size of that
anticipated growth, we can distinguish between items that offer strong growth prospects for a
relatively small number of households and items that offer smaller but strong growth opportunities
for a larger number of households.
Table 5. Estimated domestic market growth prospects for key food commodities in Mozambique
Commod-
ity group
Summary characterization of
growth prospects
Favorable
agroecology? Where?
Accessible for
smallholders?
Scope for import
substitution?
Dairy Very rapid growth from a very small base:
Very low current production. Pasteurization
presents opportunities for agribusiness links with
farmers. Very strong opportunities for a small
number of farmers.
Only in higher altitude
areas of Alta Zambézia
and western Nampula
Only a very small
number
Yes, but major
investments needed
(animal health,
pasteurization, cold
chain)
Beef Rapid growth from a very small base;
veterinary services must be competitive; large
operations may compete with small producers
but some currently source from them
Only if tsetse fly
controlled
Only a very small
number
Not clear. Transport
costs and exchange rate
critical to compete
Poultry and
eggs
Rapid growth from a moderate base; large
opportunities but a lot of competition from big
producers and imports; small producers could be
competitive close to urban areas.
Yes, much broader
than dairy
Some, mostly near
urban areas
Yes
Wheat and
Rice
Rapid growth from a large base; water control
an important issue for rice.
Wheat no; rice yes, in
lowland areas with
proper water control
Yes, for rice, but
water mgmt. a major
constraint
Yes, but has been
persistently
uncompetitive
Oilseeds Strong growth from a small base; rapid import
substitution could spur very strong growth
Yes, in mid- altitude
and higher elevation
areas
Yes, sunflower
especially
Yes, but need to
compete with imported
crude oils
All other
cereals
(mainly
maize)
Strong growth from a large base; forecast to
account for nearly 40% of all demand growth;
will be complemented by additional growth in
demand for animal feed; strong opportunities for
many producers in vast areas.
Yes, primarily in mid-
altitude and higher
elevation areas
Yes Minor (few imports
currently)
Fish
(capture and
aquaculture)
Strong growth from a moderate base; coastal
production depends on road links; aquaculture
could open opportunities in vast geographical
areas, but requires investment
Yes. Fish breeding
would greatly extend
the potential
geographic area
Only a very small
number
Probably, but data
limited
Fruit Strong growth from a very small base;
specific fruits may see very rapid growth;
industrialization for juice production presents
opportunities for agribusiness links with farmers
Yes, for tropical fruit,
especially in lowland
areas
Only a very small
number
Yes, for fruit juice and
fresh market in Maputo
Vegetables Strong growth from a moderate base;
production is risky and requires purchase of
inputs; winter water control opens up seasonal
possibilities in hot lowland areas
Yes, primarily in mid-
altitude and higher
elevation areas to
avoid disease
Only top tier, but
larger than diary &
fish
Yes, especially in south
(but transport is a
constraint)
Pulses Strong growth from a moderate base;
groundnuts, nuts, common beans, and pigeon
peas have the best possibilities
Yes, very broad Yes No

18
Commod-
ity group
Summary characterization of
growth prospects
Favorable
agroecology? Where?
Accessible for
smallholders?
Scope for import
substitution?
Roots and
tubers
Slow growth for direct consumption;
however, industrialization of cassava for beer
and other industrial uses could create greater
possibilities for growth.
Yes, very broad Yes Yes – fortified cassava
flour to replace wheat in
bread
Source: Drawn from Tschirley et. al. (2016) and Tschirley et. al. (2017).
The four key points mentioned in the 2017 report still stand. First, growth will be the most rapid for
perishable goods of animal origin: dairy, poultry and eggs, other meat, and fish. A related point, not
included in the 2017 report, is that this table does not include “derived demand”, which refers to
demand for something as an input to another product. In this case, the key examples are demand
for maize as an input to animal feed (which is itself an input for poultry, other meat, and fish) and
for soya also as an input to animal feed. Though this kind of derived demand is relatively small now,
it will grow rapidly as meat and dairy consumption rise.
Second, growth in demand for cereals - wheat, rice, and maize - will also be strong. In this respect,
Mozambique distinguishes itself from other countries in East and Southern Africa, especially with
the anticipated continued rapid growth in demand for maize. In most other countries, growth in
demand for maize for human consumption is expected to be substantially lower.
The third point is that the
contribution of maize to total
growth will be by far the largest
of any other food item, at 36%.
Note also that the demand for
yellow maize - in contrast to
traditional white maize - is
growing rapidly for animal feed.
Yellow maize is especially
preferred for poultry production
because its vitamin A content
results in more yellowish egg
yolks, which are attractive to
consumers. This raises the
possibility of contract
production, since the side selling
that typically plagues contract
farming may be less with yellow
maize than with white maize due
to limited demand for yellow
maize for human consumption.
If this is the case – if
Mozambican consumers continue
to strongly prefer white over yellow maize - then feed mills supporting yellow maize production with
input credit will face less risk of producers selling it to other traders to avoid repaying their input
credit. Maize production, whether white or yellow, thus looks to be a major growth opportunity for
Dairy1%
Beef5%
Poultry and eggs7%
Rice14%
Oilseeds3%
All other cereals (mainly maize)
39%
Fish10%
Fruit1%
Vegetables10%
Legumes10%
Figure 6. Projected contribution of various commodities to total growth in domestic demand for food over five years (adapted from Tschirley, et. al., 2016)

19
farmers in Mozambique. Perishable animal products and oilseeds will be very attractive
opportunities but for a small number of producers.
Fourth, given Mozambique’s heavy reliance on imports, import substitution opportunities exist for
most of the products considered in Table 1. This means that, if appropriate investment are made,
production could grow faster than growth in local demand.
Investments in road infrastructure: Despite the problems with roads noted above, these two
provinces have seen significant investments in road infrastructure over the past five years, which key
informant interviews indicate have improved road- and market access for many poor farmers. This
has led to some emerging commodity success stories (see below). Yet overall, it must be noted that
Mozambique ranks very low even in Africa on all assessments of rural road adequacy; improvements
are clear in some areas and response by farmers has often been robust, but much more needs to be
done to improve the quality of road construction and maintenance in the face of intensifying
cyclone pressure. See Annex E for information on current and recently completed road projects in
the two provinces, and general information on the adequacy of rural roads in the country. Road
investments in turn lead to investments in electricity, as well as education and health facilities,
contributing further to rural growth.
C. USAID’s challenge: Designing investments to promote rural
structural transformation
USAID/Mozambique’s challenge is to promote a structural rural transformation in its intervention
area. Doing so requires doing two things simultaneously: increasing productivity in farming and
facilitating progressively more engagement in nonfarm activity. As it does this, it needs to address
the food insecurity that pervades all zones and types of rural households in Nampula and Zambézia.
The necessity of promoting profitable exit from farming is based on the argument – amply
supported with empirical evidence across Africa (see Harris, et. al., 2019 for a multi-country
perspective, Nuhu et. al. (2021) for very recent evidence on soya from Zambia, and Carter et. al.
(2019) for evidence from Nicaragua) – that increased productivity in smallholder farming is
necessary for rural economic growth and food security but is not sufficient to pull most of these
households out of poverty: the majority of smallholder farmers will not be able to “farm themselves
out of poverty” (Harris, et. al., 2019). Instead, many if not most of those escaping poverty in Africa
and in Mozambique are doing so by entering the rural nonfarm economy or migrating to urban
areas, even as many of these keep one foot firmly in farming. Fan and Rue (2020) and Hazell (2020)
further develop the argument for why it is necessary to target technical assistance to smallholder
farmers to help some “move up” in farming and others over time to “move out” of farming into
increased nonfarm engagement. See Box 2 for the contribution that “moving in” might provide to
Mozambique’s agricultural sector.
USAID must promote this transformation while dealing with the constraints, and taking advantage
of the opportunities, outlined above. Most fundamental among the constraints is the decline of
export-oriented labor-intensive manufacturing, driven by automation and globalization. Because
technological change is so rapid and increasing in pace, there is yet little agreement on the precise
implications of these forces for development strategy.

20
Four areas of broad agreement do exist, however. First, these countries must invest aggressively in
their “fundamental capabilities” - human and institutional capacity (including transparent policies
and effective regulations) and the hard infrastructure of a modern economy including roads,
electricity, and internet connectivity. Micro-grids and mini-grids, based on renewable solar or wind
energy or hydropower, need to be a central part of at least the medium-term strategy to rapidly
extend energy access for residential and productive uses to rural areas.
Second, government and private sector need to emphasize a pragmatic, development-oriented
relationship between the two – neither adversarial nor laissez-faire, nor the clientelism, elite capture,
and embedded corruption that continues to permeate so much governance in Africa (Van de Walle,
2001).
Box 2: What about “moving in”? The rise of medium-scale farms in Africa Jayne and colleagues (Jayne, et. al., 2019) document the rise of medium-scale farmers (farming between 5 and 100 ha of land) in several countries of SSA over the past 15 years. In Ghana, Tanzania, and Zambia – all relatively land-abundant countries similar to areas of Mozambique – they estimate that at least 45% of all increase in agricultural production between 2008/09 and 2014/15 came from medium-scale farms. During this same period, the share of all marketed farm production accounted for by medium-scale farmers rose from a range of 7%-23% to a range of 18%-42%. In the early phases of growth of this sector, when global agricultural commodity prices rose to historically high levels, they suggest that most medium-scale farmers had “moved-in”, using revenues from successful rural or urban businesses or from wage employment in rural and urban areas to move into commercial farming. The rise of the term “telephone farmers” in some countries further suggests the importance of urban-based entrepreneurs in the sector, buying or renting land and managing the agricultural production while maintaining their urban residence. Overall, they suggest that about half of these medium-scale farmers moved into farming from other occupations while another half “moved up” from smallholder farming. Note that this latter group is high as a proportion of medium-scale farmers but small in absolute number, representing at most 3-4% of all smallholder farmers. Two characteristics of this phenomenon may be relevant for Mozambique. First, the rise of this sector occurred “under the radar”, with little or no overt support by government. Broad economic transformation, the global commodity boom of 2008/09, rapid rises in demand for food driven by urbanization and income growth, policy reform, and the associated rise of land markets (for sales and rental, including long-term lease) and markets for mechanization services were key contributors to the rise of these farmers. Second, the presence of such farms tends to generate positive spillover effects for smallholder farmers. These effects come through greater investment by large-scale grain buyers that also help surplus-producing smallholder farmers (Burke, Jayne, and Sitko, 2019), better access to mechanization services, some provided by medium-scale farms but most by dedicated mechanization service providers (Van der Westhuisen et al., 2018), and better access to inputs as input companies target these farmers but then sell also to market-oriented smallholder farmers (Wineman, et al., 2018). Negative factors in the rise of this sector include reduction in the stock of allocable traditional lands available to smallholder farming households and an associated rise in rural landlessness in some countries (Mueller and Chan, 2015). Jayne et al. (2019) also note that positive effects on local communities tend to be stronger in areas where the smaller end of the medium-scale segment (5-20 ha) predominates. These farms appear to have stronger historic and social ties to local communities than do larger farmers, who may have come more from outside the area. We see two implications for Mozambique. First, steps to overtly encourage the growth of such a sector will be much less important than maintaining a policy environment friendly to private investment and ensuring adequate public investment in roads, energy and communications that are the backbone of a modern economy. Second, while these farmers could potentially be targeted as service providers in their own right, their biggest impact on market-oriented smallholder farmers may be through spillover effects as entrepreneurs in output, input, and mechanization markets invest to serve this sector and in so doing create better access also for smallholder farmers.

21
Third, growth in domestic demand for food provides a huge and relatively stable opportunity for
growth in rural economies in these countries. This is because agriculture remains a major sector of
their economies and because low incomes mean that a large portion of any rise in incomes is spent
on food. Increasingly, this growth will include food manufacturing, as the processed food
revolution is rapidly making itself felt in Africa (Reardon, et. al., 2021; Tschirley et. al., 2015a).
Policies, programs, and public investments must be oriented to facilitating private sector investment
in these kinds of activities, especially among small- and medium enterprise.
Fourth, these countries need to expand their “domestic” markets through much more efficient
regional trade with economies at similar levels of development but with different comparative
advantages. This would go against long-term trends of low and stagnant intra-African trade (Malabo
Montpellier Panel, 2020; see same for policy priorities to spur such trade). By vastly expanding the
size of the market and allowing economies of scale in manufacturing, such a policy could allow
growth in manufacturing GDP and employment for some time, though employment levels will
certainly not rise to those seen among earlier industrializers. Food manufacturing needs to be
central to this strategy but must be based on fostering competitive food processing, not hindering trade in raw
products. Without question, the country should avoid potential “white elephant” investments in
highly demanding manufacturing processes. As the most recent World Bank jobs report for
Mozambique says, “target food manufacturing not aircraft” (Lachler and Ricaldi, 2021). In the case
of Mozambique, this means a commitment to the new African Continental Free Trade Agreement
(AfCFTA) that goes well beyond the tepid support and routine violation of previous regional
agreements that has characterized policy in so many African countries.
In Section 6, we bring together these four broad areas of agreement on requirements and
opportunities for promoting transformation in low-income countries, and knowledge of what
programmatic approaches tend to work for promoting farm productivity and access to nonfarm
incomes while enhancing food security, to lay out options for USAID investment. The approach we
lay out fits within the growing interest and emerging practice of combining social assistance with
investments explicitly focused on productive activities, to take advantage of synergies between the
two (Croppenstedt, Knowles, and Lowder, 2018).
Mozambique’s rural areas: Very slow progress on the
farm but some promising opportunities We used 2012 and 2017 IAI rural household surveys to examine changes in livelihoods, farming
practices, farming income, and food security in Nampula and Zambézia provinces over this five-year
period. Results showed some progress on the farm, but from very low levels and too small to
suggest the kind of transformation needed to rapidly and broadly pull rural households out of
poverty. Here we summarize the main outcomes of this analysis - more details are available in
Annex F. Tables 6-9 show values of selected variables in 2012, 2017, and the percent change
between the two years.

22
We highlight five points. First, as shown in Table 6, area planted and total value of agricultural
production per AE increased substantially and across all zones. The reasons for this very robust
change are not yet clear.
Second, soybean production in Alta Zambézia increased sharply, with 12% of farmers producing it
in 2017 compared to 1% in 2012 (Table 7). Yet the share of farmers growing three other important
cash crops – sesame, pigeon pea, and cotton – dropped. Overall, we see no broad increase in the
orientation of farmers to key cash crops.
Table 6. Land cultivated, % of farmers classified as medios, and gross farm income, by zone (2012, 2017, and % change)
HH characteristic (mean or %)
Zone 1
Lowland
Zambézia
Zone
2E/Coast
N.Zamb &
Namp
Zone 3
Mid
Elevation
Zone 4
Alta
Zambézia
&
W.Namp Total
2012
Size measures
Total cultivated area (ha) 0.80 1.44 1.55 1.58 1.40
Total cultivated area (ha) median 0.64 1.26 1.32 1.36 1.16
Total cultivated area per AE (ha/AE) 0.24 0.43 0.51 0.50 0.44
% of HHs that are "medios" 0.15 0.19 0.20 0.10 0.17
Agricultural production & incomes
Gross farm income per AE (real contos) 3,692 4,042 5,093 4,524 4,442
Gross farm income per AE (r. contos) median 2,030 2,235 2,916 2,617 2,510
2017
Size measures
Total cultivated area (ha) 1.53 1.62 1.91 2.20 1.83
Total cultivated area (ha) median 1.07 1.40 1.47 1.69 1.46
Total cultivated area per AE (ha/AE) 0.47 0.51 0.61 0.75 0.59
% of HHs that are "medios" 0.28 0.44 0.39 0.23 0.36
Agricultural production & incomes
Gross farm income per AE (real contos) 6,406 4,125 4,750 5,463 4,892
Gross farm income per AE (r. contos) median 2,714 2,783 2,479 2,900 2,668
% change, 2012 - 2017
Size measures
Total cultivated area (ha) 90% 12% 23% 39% 31%
Total cultivated area (ha) median 66% 11% 11% 24% 26%
Total cultivated area per AE (ha/AE) 95% 16% 21% 48% 33%
% of HHs that are "medios" 87% 133% 101% 122% 113%
Agricultural production & incomes
Gross farm income per AE (real contos) 74% 2% -7% 21% 10%
Gross farm income per AE (r. contos) median 34% 25% -15% 11% 6%
Source: Authors’ calculation from IAI2012 and 2017
Third, use of variable inputs and tractorization increased broadly but remains extremely low, as
shown in Table 8. The only large changes were a large decrease in the share of households using
pesticides (from 5.2% to 1.3%), driven by a decrease in cotton planting; and a meaningful increase in
the percent using improved seed, from 4.5% to 8%. The small increases in tractorization were
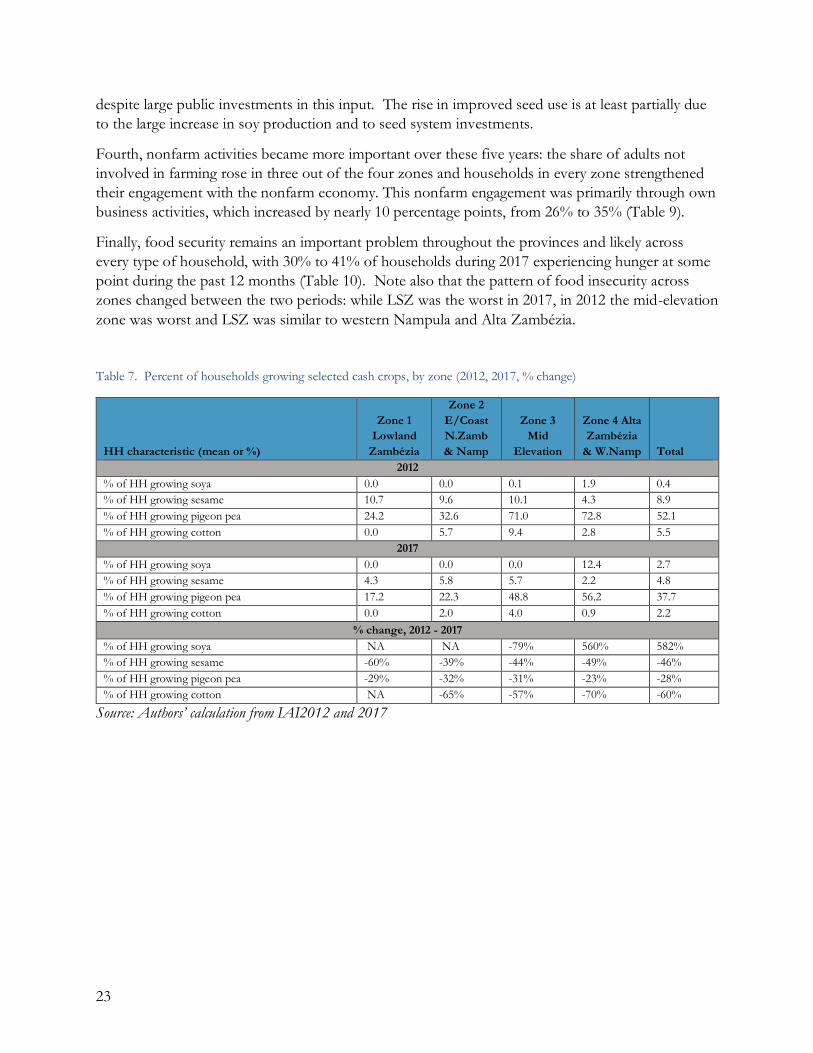
23
despite large public investments in this input. The rise in improved seed use is at least partially due
to the large increase in soy production and to seed system investments.
Fourth, nonfarm activities became more important over these five years: the share of adults not
involved in farming rose in three out of the four zones and households in every zone strengthened
their engagement with the nonfarm economy. This nonfarm engagement was primarily through own
business activities, which increased by nearly 10 percentage points, from 26% to 35% (Table 9).
Finally, food security remains an important problem throughout the provinces and likely across
every type of household, with 30% to 41% of households during 2017 experiencing hunger at some
point during the past 12 months (Table 10). Note also that the pattern of food insecurity across
zones changed between the two periods: while LSZ was the worst in 2017, in 2012 the mid-elevation
zone was worst and LSZ was similar to western Nampula and Alta Zambézia.
Table 7. Percent of households growing selected cash crops, by zone (2012, 2017, % change)
HH characteristic (mean or %)
Zone 1
Lowland
Zambézia
Zone 2
E/Coast
N.Zamb
& Namp
Zone 3
Mid
Elevation
Zone 4 Alta
Zambézia
& W.Namp Total
2012 % of HH growing soya 0.0 0.0 0.1 1.9 0.4
% of HH growing sesame 10.7 9.6 10.1 4.3 8.9
% of HH growing pigeon pea 24.2 32.6 71.0 72.8 52.1
% of HH growing cotton 0.0 5.7 9.4 2.8 5.5
2017
% of HH growing soya 0.0 0.0 0.0 12.4 2.7
% of HH growing sesame 4.3 5.8 5.7 2.2 4.8
% of HH growing pigeon pea 17.2 22.3 48.8 56.2 37.7
% of HH growing cotton 0.0 2.0 4.0 0.9 2.2
% change, 2012 - 2017
% of HH growing soya NA NA -79% 560% 582%
% of HH growing sesame -60% -39% -44% -49% -46%
% of HH growing pigeon pea -29% -32% -31% -23% -28%
% of HH growing cotton NA -65% -57% -70% -60%
Source: Authors’ calculation from IAI2012 and 2017

24
Table 8. Percent of rural households using variable inputs and tractorization, by zone (2012, 2017, and % change)
HH characteristic (mean or %)
Zone 1
Lowland
Zambézia
Zone 2
E/Coast
N.Zamb &
Namp
Zone 3 Mid
Elevation
Zone 4 Alta
Zambézia &
W.Namp Total
2012
Variable inputs
HH used inorganic fertilizer (%) 0.00 0.08 1.20 2.22 0.86
HH used pesticide (%) 0.00 5.22 7.26 5.72 5.17
HH used improved seed variety (%) 4.21 2.60 2.69 11.43 4.53
Mechanization
HH used machinery, land prep (%) 0.25 0.00 0.50 0.03 0.22
HH used own mach, land prep (%) 0.00 0.00 0.00 0.00 0.00
HH rent/borrow mach, land prep (%) 0.25 0.00 0.50 0.03 0.22
2017
Variable inputs
HH used inorganic fertilizer (%) 0.09 1.19 1.61 3.57 1.71
HH used pesticide (%) 0.33 1.60 1.03 1.84 1.31
HH used improved seed variety (%) 5.38 6.53 6.04 14.36 7.92
Mechanization
HH used machinery, land prep (%) 3.51 1.16 0.35 1.48 1.24
HH used own mach, land prep (%) 0.00 0.00 0.00 0.00 0.00
HH rent/borrow mach, land prep (%) 3.51 1.16 0.35 1.48 1.24
% change, 2012 - 2017
Variable inputs
HH used inorganic fertilizer (%) NA 1330% 34% 61% 99%
HH used pesticide (%) NA -69% -86% -68% -75%
HH used improved seed variety (%) 28% 151% 125% 26% 75%
Mechanization
HH used machinery, land prep (%) 1288% NA -30% 5634% 464%
HH used own mach, land prep (%) NA NA NA NA NA
HH rent/borrow mach, land prep (%) 1288% NA -30% 5634% 464%
Source: Authors’ calculation from IAI2012 and 2017

25
Table 9. Adult involvement in farm and nonfarm activities, by zone (2012, 2017, and % change)
HH characteristic (mean or %)
Zone 1
Lowland
Zambézia
Zone 2
E/Coast
N.Zamb
& Namp
Zone 3 Mid
Elevation
Zone 4 Alta
Zambézia
& W.Namp Total
2012
% of adults not involved in farming 11 4 5 2 5
% of adults with wage income 20 14 19 19 18
% of adults with business activity 32 25 26 22 26
2017
% of adults not involved in farming 9 9 9 6 8
% of adults with wage income 22 16 21 16 19
% of adults with business activity 38 31 33 40 35
% change, 2012 - 2017
% of adults not involved in farming -24% 109% 89% 181% 59%
% of adults with wage income 11% 12% 15% -16% 5%
% of adults with business activity 19% 23% 26% 82% 32%
Source: Authors’ calculation from IAI2012 and 2017
Table 10. Percent of households experiencing hunger over the past 12 months, by zone (2012, 2017, and % change)
HH characteristic (mean or %)
Zone 1
Lowland
Zambézia
Zone 2
E/Coast
N.Zamb
& Namp
Zone 3 Mid
Elevation
Zone 4 Alta
Zambézia
& W.Namp Total
2012
Experienced hunger past 12 mths (%) 43 37 48 43 43
2017
Experienced hunger past 12 mths (%) 46 30 31 35 33
% change, 2012 - 2017
Experienced hunger past 12 mths (%) 6% -19% -35% -20% -23%
Source: Authors’ calculation from IAI2012 and 2017
Emerging success stories not evident in the IAI data
The results we just reviewed from the IAI surveys suggest some, but very small, positive change in
Mozambique’s rural economy through 2017. By our own judgement, these changes do not
approach the depth and speed of change that is needed to drive transformation that rapidly reduces
poverty. Yet fieldwork by MSU in 2017 and by Elim since that time, and interviews with
knowledgeable stakeholders as part of this study, all suggest that real and potentially sustainable
change has been happening and that, with good policy and well-designed programmatic support, it
could soon begin to make a much broader positive impact among rural households. Here we review

26
two broad areas of positive change: emerging dynamism in input markets, and emerging commodity
success stories.
Emerging dynamism in input markets: We saw in 2017 through key informant interviews and
see now in new interviews and in the 2017 IAI, hints of emerging dynamism in the inputs sector
based in part on donor investments. Investment by USAID, the EU, and FAO in start-up seed
companies such as Oruwera and Ndzara Yapera, and the entrance of established regional firms such
as Klein Karoo and Phoenix, have improved access for many farmers to quality seed of improved
varieties.
The EU and FAO have also made sustained investment in input voucher programs channeled
through agrodealers, as a strategy to build private sector capacity. In doing this, they have helped
coordinate supply and demand by linking new input and seed companies with agrodealers, and
agrodealers with farmers. Farmer field schools have been a key mechanism to increase farmer
understanding of input use and of how the voucher system works, and to then link farmers to those
agrodealers through, for example, input fairs.
These efforts have shown some positive effect (Tschirley et. al., 2017) and have continued to the
present time. De Vletter (2019) documents the expansion of the agrodealer network and argues
based on his own interviews that most agrodealers believe their business would be sustainable even
in the absence of the voucher program. Carter, Lajaaj, and Yang (2021) show lasting impacts of the
program on farmer adoption of improved seeds and fertilizer, which we see as a strong argument for
its continuation and strengthening.
Concern about donor dependence of the seed company start-ups is reasonable, and their
sustainability and that of the agrodealer network cannot be taken for granted. Ill-conceived policy
and programmatic approaches by government, as in some aspects of the SUSTENTA program,
could undermine the progress that has been made. But at the same time, most observers on the
ground indicate that there has been real progress over the past five years, that an organic growth
process has become apparent, and that, with proper policy and continued investment under
programs informed by evidence, further important progress can be made. The key imperative is that
government programs to promote input access contribute to the further development of this system
rather than bypassing and thus undermining it.
Emerging commodity successes: Mozambique has had difficulty maintaining commodity booms
but has nevertheless seen the emergence and persistence, despite periodic busts, of several important
cash crops. Chief among these – and potentially the most sustainable – is soya. This is the most
recent commodity boom and should provide a solid basis for continued growth based on steady
growth in domestic demand from the poultry sector, the beginnings of demand growth for beef,
and, potentially, a growing human consumption market. Aquaculture should also present strong
growth prospects, though from a very low base, and the sector currently imports all or most of its
feed from Zimbabwe and South Africa.
2012-2017 saw a huge increase in the share of households growing this crop in Alta Zambézia, from
1.9% to 12.4%. However, productivity needs to be increased on the farm and in the post-farm
marketing and processing system, to compete with imported soy meal; currently poultry feed
producers in the south import all their soya cake from South Africa and aquaculture firms import all

27
or most of their feed from Zimbabwe and South Africa. Improvements in the processing of soy
could take advantage of oil and other products to generate income and lower the domestic cost per
unit of feed.
As noted above, maize also provides a very solid basis for sustained growth in demand. This growth
will come from direct human consumption by rapidly growing urban populations and increasingly
market-dependent rural populations, for beer production, and for animal feed. Note that all these
products require post-farm processing, fueling growth in agribusiness employment.
Cassava is a main source of calories in human consumption in the north. Across our four zones,
58% to 89% farmers grew it in 2017 and an average of 56% reported that it was their main food
staple (IAI data). As documented in Donovan et al. (2011), in northern Mozambique, most
household consume cassava flour in a porridge, with home processing common. However, in the
past decade, cassava has begun to be processed in mobile processing units and is now used
successfully in commercial beer making, for example in Impala Cassava beer brewed in Nampula by
Cervejas de Mocambique. These mobile processing units enable larger scale processing and open the
door to more industrialization of cassava for other uses, including starch, animal feeds, and flours.
Researchers and bakers in Mozambique and elsewhere have assessed the potential to substitute
fortified high quality cassava flour (HQCF) for a portion of the imported wheat in bread and other
baked goods (Aristizábal, Garcia, and Ospina, 2017). As has been found in Nigeria and Ghana,
HQCF can reduce imports, but to achieve this, there must be reliable supply, competitive price,
consumer acceptance, access to processing machinery, and policy incentives. Similarly for animal
feeds, the CAVA study for Ghana (Kleih et al. 2013) suggests how to partially substitute cassava for
maize in rations for broilers and livestock. Starch has an international market, but the need for high
volume processing and exports makes it less likely to succeed in the near term. Starting in the local
market and expanding that production while improving quality would be the best way to eventually
reach the larger and potentially more lucrative – but very competitive - global market.
Vegetable production for the market grew rapidly in western Nampula since the improvement in the
Nacala corridor road over five years ago. Farmers around Ribaue and as far west as Malema began
supplying Nampula city and Pemba. Road investments connecting areas of Alta Zambézia to the
Nacala Corridor road (Annex E) should greatly expand the production areas that have access to this
market. Urban population in Namialo in Nampula has grown very rapidly (as has Ribaue) over the
past decade and will also provide growing demand for this production. The conflict in Cabo
Delgado, however, will increase the cost and risk of supplying Pemba and the oilfields.
Export crops are often more difficult due to quality and other requirements, and they are also
potentially more unstable, but do provide opportunities. Sesame production grew tremendously
through 2015, dropped in 2017 as a result of both floods and droughts, but continues to present
great export potential if varietal, pest, and disease problems can be dealt with. Among pests,
Podagrica puncticollis3 , also known as the flea beetle, poses a risk to productivity, often driving
losses of at least 70%. Farmers have to sow the crop twice in the season especially in regions that are
cotton producing, which is another host crop for the pest. The use of agrochemicals has risen
3 3 Agegnehu E. et al. (2019) http://dx.doi.org/10.4314/ujas.v19i1.3

28
among more market- oriented farmers. These farmers also tend to purchase improved white sesame
seed, which has higher yields, and to spray pesticides in the 5 days after seedlings emerge as a way of
avoiding the devastating loss caused by the flea beetle.
The most prominent diseases of sesame are angular leaf spot and fusarium blight. There are
treatments available for these diseases, but many farmers are unaware or don’t have access to the
pesticides needed. The low yields of sesame in Mozambique also relate to lack of crop rotation with
soils quickly losing fertility. Jasse (2013) has a good summary of sesame production issues for
Mozambique.
Pigeon pea saw explosive growth through 2016 before India temporarily closed its market, leading
to much unharvested production in 2017. The proportion of farmers growing the crop declined
from nearly 50% in 2012 to 35% in 2017, but it remains an important cash crop for hundreds of
thousands of households and the recent negotiation of a relatively assured quota for the India
market may provide a solid basis for continued growth. Opportunities to supply regional markets
could be an alternative to traders unable to reach the quota-system for the Indian market.
Mozambique remains one of the potentially top producers of cashew in the world but needs policy
change regarding the role of INCAJU (now Instituto de Amendoas) in the sector: the institute needs
to move out of direct provision of seedlings and spraying services and instead support the continued
growth of the nascent private sector operating in each of these areas. Unfortunately, there has been
little if any progress in this direction over recent years. Macadamia nuts are emerging as a new crop,
but the ability of smallholder farmers to enter and profitably remain in this sector remains to be
seen. We note that one outgrower project in Niassa now being rolled-out, and should be followed
for lessons.
Programmatic approach
In this section we first summarize key lessons from the review of programs and projects in
Mozambique and the region. Following this, we lay out the essential logic behind the approach
suggested in this report, as preparation for the more detailed treatment of investment options in
section VI. Finally, we return to the zones and farmer types that we have developed and discuss
how this information, complemented with additional information especially on the local status of
road access, can be used to target appropriate assistance to farmers based on their own
characteristics and behavior and the situation in which they find themselves.
A. Insights from program reviews in Mozambique and the region
Annex G contains a list of Mozambique project and Annex H provides more detail on many of
them. Here we summarize 10 key lessons. First, several points emerged regarding developing
sustainable seed systems. One is that this requires policy reforms and often re-evaluation of the roles
of private and public sector to go along with assistance to emerging companies and rural input
retailing networks. Demand for quality seeds, especially costly certified seeds, is diminished by
widespread certified seed falsification, and inspection systems do not currently have the capacity to
address this threat to seed system sustainability. This is a key issue to address through governance
programs that promote collective action by stakeholders. Another is that key crops for food

29
security, including many pulses, are open pollinated and present lower profit margins and uncertain
markets for the private sector, suggesting that continued public sector engagement is important.
Finally, treating seed production as a business – and ensuring that legal and regulatory structures
permit and promote this - has proven to be important for new seed producers.
A second set of points revolves around support to SMEs. Projects supporting SMEs in agricultural
production and agro-processing through technical assistance combined with financing were
generally rated favorably. However a key point is that training was not considered sufficient by
itself. Successful projects provided technical training (seed production, use of inputs, crop
management in conservation agriculture) while linking farmers to finance and to market
opportunities (OFSP, FTF INOVA, InovAgro, etc.). A second point is that those that focused on
creating farmer associations or groups had difficulties and needed sustained effort over program
cycles. Sustainability of efforts based on farmer associations is questionable, though incorporating
private sector know-how may be helpful (lessons from Tanzania IFAD AMSDP project).
Associations formed based on a valuable value chain, such as soy, tend to last longer. Finally,
support to SMEs in input provision can be undermined by large public programs that may tend both
to increase subsidy levels and to bypass emerging decentralized input retailer networks (agrodealers)
in their desire to quickly distribute seeds and other inputs. Persistent policy engagement is required
to anticipate and head-off such heavy-handed government approaches. Overall, investments need
to strengthen market systems and ensure enterprise resilience.
A third set of points relates to soil fertility and sustainable land management programs. Donors have
invested to some extent in this, for example in the Farm Income Diversification Programme in
Malawi. Linking these training and other activities that promote adoption of healthy soil practices to
market opportunities is essential if they are to be fully successful. This includes mechanization
programs with conservation agriculture technologies, using implements such as rippers instead of
standard plows. Production diversity contributes to a range of outcomes, although the link to
consumption diversity is not strong, so these programs will need to link to whole-household
nutritional education along with agricultural training to impact both soil and human health.
Our fourth set of points relates to large publicly supported programs. Programs such as the Farm
Input Subsidy Program (FISP) in Zambia and SUSTENTA in Mozambique are shown to have
potential negative consequences for long-term sustainability related to the size of the subsidy they
offer and the way in which they deliver the subsidized products. Some subsidy, if delivered through
private sector channels to help feed its development, can be highly beneficial through direct learning
effects (farmers learn about an input they haven’t used before) and spillover effects as neighbors
observe (Carter et. al., 2019). Yet in Zambia, the level of resources devoted to FISP crowded out
resources for research and other investments, and in the early years of the program, delivery
mechanisms undermined the private sector. SUSTENTA in Mozambique has been heavily criticized
by many practitioners for undermining emergent market systems both with its heavy subsidies and
because it does not work through the emerging but still fragile network of rural agrodealers.

30
Fifth, several points can be made about the many programs in the region that are targeting Small
Commercial Farmers (SCF) or Small Emerging Commercial farmers (SECF)4 to be the conduit for
inputs, training, and mechanization services of other smaller and less commercialized smallholder
farmers in their area. These include NAFAKA in Tanzania, SUSTENTA in Mozambique, and other
programs under TechnoServe leadership in Mozambique. One concern with this approach is that
the SECF may prioritize tending to their own production before anyone else’s production. If the
SECF is also a buyer of the produced commodity, then they may have more incentives to provide
timely services to the farmers they support and buy from. Training SECF farmers who have been
provided with mechanization equipment on how to develop business services is part of the
challenge.
In Mozambique, this approach is constrained by small numbers of SECF and, as a result, over-
targeting of the same producers by multiple programs. Identifying lead farmers or future
entrepreneurs will continue to be a challenge. SUSTENTA and others have developed a special
program for young people, to train them and then enable special financing options for them to set
up agro-dealerships, poultry production, or as Village Based Agricultural Advisors or Business
Development Advisors. The combination of training and funding is generally needed to sustain
interest.
Sixth, we took several points regarding financial innovations. These can be valuable, as formal
financial institutions have shown very little interest in agriculture. Innovative financing strategies
have been found such as input company credit with SECFs to help finance SHFs, use of e-vouchers
and MMS, and adding insurance products to financing for seeds and other inputs. Inovagro works
with Village Savings and Loans Associations (VSLAs) connected to mobile wallets and agrodealers
as agent bankers. Having clear “up and out” criteria with e-vouchers to make sure they are
temporary, and limiting the size of the subsidy, are important to avoid destroying organic demand
and creating dependence on donations. Experience indicates that training on financial literacy and
mobile banking are important to overcome women’s constraints to accumulating financial capital
Seventh, the agroprocessing sector has been a focus of development programs in all three countries
of the region. A fundamental point here is that processing requires regular and sufficient provision
of raw material, so linkage to production must be a key part of such programs. Projects including
NAFAKA in Tanzania, COMACO in Zambia and AGRIFUTURO in Mozambique also
demonstrate the need for training linked to resource access and development of market linkages as
key components of success. Building skills in a market-based approach with an entrepreneurial spirit
in marketing can lead to success over time, based on project leadership with an exit strategy to avoid
dependency.
Eighth, nutrition-smart agriculture ties in well with sustainable agriculture. Many of the priority
crops identified by the World Bank (2020b) for Nutrition Smart Agriculture for Mozambique are
4 While the exact definitions may vary between SCF and SECF, we will use SECF here to represent these farmers considered to have the potential to grow into larger scale farmers, working with their neighbors and with market input and output systems.

31
pulses, including pigeon peas and common beans. These same crops are also fundamental in
enhancing soil fertility and adapting to climate change under sustainable agriculture.
A ninth key lesson is that training programs, while critically important for developing business
management skills, technical skills in such as areas as mechanization as a business, maintenance of
machinery, and agroprocessing technologies, are insufficient to spur MSME growth. Such programs
are more effective when combined with financial resources, mentors, and business/marketing
internships. Rural economic growth in food-related non-farm enterprises can be a major source of
employment and income growth.
Finally, we see that development projects benefit from attention to two issues: 1) length of time; and
2) geographic area. Longer term projects, or projects that build on the work of existing and previous
projects, are more likely to achieve sustainable changes, as with PROMER in Mozambique and the
food security policy research projects (FSRP) in Zambia and Mozambique. Building capacity for
sustainable change takes time, whether it is done among farmers to improve yields and engage in
markets, among MSMEs in food processing or other sectors, among ministry personnel to collect,
organize, and maintain good data, or research analysts to inform policy decisions. Geographically,
projects that spread human and financial resources across too wide an area are less likely to be
successful, as with the Agricultural Marketing Systems Development Programme (AMSDP)in
Tanzania.
B. Theory of change: Program design for rural transformation
This paper has stressed the centrality of the rural structural transformation to poverty reduction in
Mozambique and noted that this requires simultaneous improvement of productivity at the farm
level for those households who can adopt the needed technology, and assistance to households to
move or strengthen their existing engagement beyond farming in remunerative nonfarm activities.
Our household typology was built around this idea and shows the extent to which this
transformation has been happening (though only through 2012, due to lack of data since that time).
Specifically, the typology showed lots of heterogeneity across rural households – these households
are definitely not all subsistence farmers. It also shows that variability across households is driven
largely by nonfarm incomes: farm income and agronomic practices vary much less, even among
households heavily focused on farming and selling a large portion of their production. This
highlights the fact that farming per se has seen very little transformation, according to the IAI data.
But at the same time we have noted the widespread perception of real progress – even if still very
fragile - in development of a private sector rural input distribution system. We have also noted
strong response by farmers in some areas to market opportunities (e.g., vegetables in western
Nampula and soya in Alta Zambêzia) and the related emergence of commodity success stories,
especially in value chains oriented toward domestic demand. This progress on private input systems
and emerging commodity success stories for domestic consumption can be built on by USAID as it
rolls out investments to raise farm productivity and simultaneously facilitate greater engagement by
many households in nonfarm activities. In doing so, USAID needs to remain cognizant of another
key finding in our analysis – that food insecurity is pervasive across zones and farmer types and will
not be quickly resolved by increased productivity in farming.

32
Figure 7 shows a broad view of the proposed approach and the theory of change its built on. Our
contentions are: (1) support to farming that is targeted geographically and by household and
informed by output market possibilities will efficiently improve productivity among those
households able to engage strongly with markets; (2) savings mobilization and cash transfers across
all households (combined with business development services for those who want them; see below)
will foster entry or expansion by some households into nonfarm activities and for others (with some
likely overlap) will allow increased farm investment; and (3) improved policy and governance in the
inputs sector, together with supply side support that builds on past investments that have generated
emerging successes, will foster increased supply of more affordable and better quality inputs that
facilitates more productive farming among those households who choose to invest in the farm.
This approach falls within the emerging tendency to purposefully combine social assistance with
agricultural programs, based in part on evidence that the former nearly always has productive
impacts by enabling recipients “to manage risks, build assets, and undertake activities that are more
remunerative” (Croppenstedt, Knowles, and Lowder, 2018). The proposed approach here has,
however, an important twist: it explicitly conceives the social protection portion as part of the
productive investment and uses it to ease entry into nonfarm activities among those households who
choose to do so. The literature encapsulated by Croppenstedt and colleagues is conceived as “social
protection and agriculture”, with little attention to nonfarm activities. The approach outlined here is
based on the contention that such attention is crucial in light both of the requirements for economic
transformation and the reality in Mozambique (and generally across African countries) that rural
Figure 7.Theory of change for USAID investments in rural Zambézia and Nampula

33
nonfarm engagement plays a large and necessary role increasing incomes and allowing escape from
poverty.
Figure 8 delves further into the logic and evidence for combining these approaches, for the
program’s inclusion of nonfarm objectives, and for the emphasis on access to capital for this
purpose. Dark blue bubbles show logic and evidence related to capitalization of households; orange
bubbles relate to logic and evidence regarding the need for actions in support of farm productivity
to consider how farmer characteristics and geographic location drive what is sustainable in this
regard; and green bubbles show actions that need to be taken to implement the approach. We
discuss each of these in turn.
Household capitalization: We laid out earlier the conceptual and empirical basis for asserting that
productive farming is necessary but not sufficient to pull the majority of smallholder farmers and
rural residents out of poverty (C1, top left of the figure): the empirical regularity of the structural
transformation in currently high- and middle-income countries; micro empirical evidence in Harris
et. al. (2019) Nuhu et. al. (2021) and Carter et. al. (2021); and synthesis of these ideas by Fan and
Rue (2020) and Hazell (2020). The evidence behind this proposition is overwhelming.
The weak evidence base on what is effective in promotion of RNFE, and concerns about the cost-
effectiveness of such interventions (C2 in the figure), was reviewed by Haggblade, Hazell, and
Reardon (2007). Despite the popularity of such programs, little is known about their effectiveness
(Cravo & Piza, 2016). As Danida (2009, p. 5) states, “recommendations are often based on
speculation about what would work rather than on evidence of what works”, noting also that the
few evaluations that are done some years after the end of a project “seem to show very different
[less positive] results” (brackets added). We note this also in our synthesis of lessons from local and
regional programs. Haggblade and colleagues also notes that it is hardest for these programmes to
reach those who most need it, meaning that benefits are typically concentrated among the top-tier of
poor people (not the poorest) or those already above the poverty line (Haggblade, Hazell, and
Reardon, 2007).
The fact that capital is a constraining factor in enabling rural households to get into remunerative
nonfarm enterprises (C3) is a direct outcome of poverty, the very weak state of financial systems,
and the general wariness of lending in rural areas. Households need to generate their own capital to
get into such businesses and this is hard to do.
The rapidly evolving evidence base on conditional and unconditional cash transfers suggests that
they may have lower costs of implementation and spur asset accumulation and increased income
(Robertson, et. al., 2013; Haushofer et. al., 2016 and 2018; Handa et. al., 2018a and 2018b; Baird et.
al., 2019; Blattman et. al., 2020; Bahru et. al., 2020; see also https://www.givedirectly.org/research-
on-cash-transfers/ for a summary of evidence, and https://www.givedirectly.org/cash-research-
explorer/ for a searchable database of research on cash transfers). Note that, in responding to the
economic fallout from COVID-19, World Bank (2020a) recommends assistance to “family
businesses” through social assistance such as cash transfers rather than through business
development programs.

34
Figure 8. Structure and logic of proposed approach to spur rural structural transformation
Combine approaches to spur capitalization with … … targeted and differentiated support to farming

35
Experimentation in this area, with rigorous studies built into programmatic design, has exploded in
recent years and is increasingly gaining the attention of policy makers in developed and developing
countries. The evidence of long-term impacts is mixed, but evidence is strong that cash transfers
(including unconditional transfers) are seldom spent on discretionary expenditures such as alcohol
and that impacts on incomes and assets are generally strong in the short- and medium-terms.
Support to farming: Our reasoning regarding support to farming starts with the widely
demonstrated fact – including in this report – of meaningful heterogeneity across farmers in Africa
and the obvious fact that some geographical areas are better connected to markets than other areas
(F1, right side of figure). It follows that, to ensure an economic and social return on donor or
government investment at the farm level, that investment must be targeted and differentiated based
on a combination of household and spatial factors (F2 and F3). At household level (F4), these could
relate to assets including land, history of engagement in markets, and demonstrated interest in
farming as a busines. At geographic level, the two important factors are agroecology (for choice of
crop) and the cost of market access. At its simplest, one would build two different packages of
support to farming based on how farmers score on this combination of factors, one for households
judged to have strong prospects for engaging profitably in markets and being able to grow their
production, and another for those judged unlikely to be able to do so and who instead need
assistance primarily to ensure food security (F5).
Combining approaches and building the evidence base: As these two elements are combined -
household capitalization that includes cash transfers and savings mobilization together with
differentiated and targeted support to farming – two other things must be done. First, because
policy always matters and governance is crucial to performance especially in the inputs sector (P1,
bottom-left of the figure), this aspect has to be addressed to improve sustainability of the
investments over time. Second, because this kind of combination is relatively rare, the program has
an opportunity to make important contributions to knowledge about effective programming
approaches if a learning agenda is built into it from the beginning. Ideally, this learning agenda will
include re-visits 2-3 years after project completion to examine evidence of sustained impact.
C. Targeting of support to farming
Program design requires targeting. Typically, this involves two broad steps: selecting a geographic
space in which to carry out the program; and selecting the households or firms to work with. Here
we lay out a framework for these steps, drawing on the zones and farmer typology we developed but
interpreting them in the practical context of a project leader needing to make better targeting
decisions.
Spatial dimension: Because the four zones are so similar in their farming practices and outcomes,
the key issue here is variation within them. As we said in section III.E, these zones differ primarily in
two regards: agroecology and thus the crops that USAID might support and, in Lowland Southern
Zambézia compared to the other three zones, better access to improved roads and higher
engagement in the nonfarm economy. The other three zones differ very little in these two aspects
and all four zones are remarkably similar in their agricultural practices and the incomes they generate
from farming. Food security is also prevalent across all zones and household types. All of this is a
natural outcome of the fact that agriculture in this area of Mozambique remains highly traditional
with little use of external inputs, except in particular areas and for particular crops.

36
Identifying areas within zones that have better or worse market access is the main task at this stage
of targeting. We expect that areas of better market access will have more of farmer types 5 and 6,
and perhaps farmer type 4, than areas with worse access, but this would have to be empirically
confirmed.
Physical market access is a function of three things. The first is distance to the nearest market of
reasonable size. This could be an urban area or, for particular crops, a large assembly point or a
processing plant. Distance to input dealers should also be considered. The second is the quality of
roads linking to those markets. Third is the typical distance a farmer needs to travel, and by what
means, to get to an all-weather road. The best way to summarize this information is in measures of
the time and financial cost of getting to these markets, done separately for the dry and wet seasons.
Simple questionnaires and rapid appraisal techniques with selected farmers and key informants can
be used to collect such information and, within an intervention area, define areas of greater and
lesser market access.
The time dimension is also important: designers should consider road projects that are underway
that will improve access, and the area’s vulnerability to storm damage which, as we have said, is a
major issue in large portions of Nampula and Zambézia.
Targeting farmers: Our rural household typology helps clarify understanding about diversity in
Mozambique’s rural areas and thus highlights the need for targeting at this level. However, the
typology itself is not likely to be replicated by a project implementor, nor is household level (as
opposed to community level) targeting always feasible. We therefore summarize here the broad
implications of the typology and suggest how this understanding might be used in targeting on the
ground:
• About one-quarter of households can be considered subsistence or near subsistence farmers
in that they sell none or very little of their farm production and earn little or no income from
nonfarm activities. These Type 1 and 2 farmers crop the least area (a little over 1 ha in total,
and less than half a hectare per capita), hire labor at the lowest rates (only about 5% do so),
earn the lowest total (farm + nonfarm) incomes, but earn farm incomes that are slightly
higher than some other groups;
• Slightly more than 10% are heavily engaged in agricultural markets. Of these, about three-
quarters (7-8% overall) focus almost exclusively on farming. These Type 4 farmers
(commercialized) crop the most area (about 2 ha total and 0.7 ha per capita), are among the
most likely to hire labor, earn average total incomes only slight above subsistence farmers,
and earn the highest farm incomes, though not much higher than subsistence households;
• The other quarter of farmers strongly engaged in agricultural markets– about 3% overall –
are also heavily engaged off the farm. These Type 6 households (diversified) crop a little less
land than those in type 4 but more than other groups, are the most likely to hire labor, earn
the highest total incomes (at least triple those of types 1 and 3), but earn among the lowest
farm incomes, not meaningfully different from the farm incomes of subsistence farmers;
• About 30% of farmers sell little farm output but earn substantial income off the farm. These
Type 5 households (nonfarm oriented) crop small areas of land - roughly the same amount

37
as subsistence farmers – but hire a lot of labor to work the land, earn the second-highest
total incomes (about double Types 1 and 2), but earn the lowest farm incomes;
• Finally, about 30% earn little off the farm and also don’t sell much of their farm production
(5-50% in our definition, but an average of only 22%). These Type 3 farmers (semi-
commercialized) crop similar areas to Type 4, are less likely to hire labor than types 3, 4, and
5; and look very much like Type 3 in total incomes and farm incomes.
From a programming standpoint, the question to ask is: which of these farmers are in a position, in
terms of the assets they have and their farm-oriented motivation, to “move up” in farming, and
which will be unable to do this, either because they lack resources or prefer to devote them to
nonfarm activities, and should instead be assisted to “move out”? In other words, in which
households does it make sense to invest scarce program resources to try to sustainably increase their
productivity in farming?
We suggest that about 15-20% of households fall in this “move up” category, including most
household in Type 4 and Type 6 (a bit over 10% in total), those Type 5 who want to put more effort
into farming (probably few of them), and some of Type 3 that have more land and are motivated to
excel in farming. The other 80-85% need two things: assistance to produce enough staple food for
their own food security, and a way to progressively “move out” of farming into nonfarm activities
that could give them a higher return and a hope of getting out of poverty.
We emphasize that “moving out” will take place over a long period of time and that nearly all
households during a regular project cycle, even if they are able to gain wage employment or enter
into a remunerative nonfarm activity or expand one they were already running, will choose to keep
one foot firmly in farming. We see this already in the data, where even type 5 and 6 households
show a majority of adults with farming as their primary economic activity.
In designing a program, we suggest that USAID and its partners do the followings:
• Assume that not more than 20% of households, and probably less, will sustainably benefit
from efforts to help them treat farming as a business, meaning adopting input packages that
imply some risk and strongly focusing on market sales. This percentage could be higher in
more market-connected areas and lower in more remote areas;
• Develop simple field and programmatic procedures to identify who these households might
be. This could include baseline surveys if funds are available, necessarily combined with
screening procedures for individual farmers to qualify for particular forms of assistance; and
• Deploy a differentiated approach that provides those farmers with the tools they need to
make it in farming, while providing the rest with the means to protect their food security
through more productive own production and potentially improve their engagement off the
farm. The next section outlines the particular investment options that could be considered
under such a program.

38
Investment Options
A. Broad categories
We discuss here the three broad categories of investments outlined in the theory of change (Figure
7). Together, they emphasize the need to achieve broader and more rapid increases in farming
productivity while at the same time (a) doing so in a differentiated way across households depending
on their capacities and interest in farming, (b) actively providing avenues for households to increase
their engagement with the nonfarm economy, and (c) addressing pervasive food insecurity.
The broad categories are (1) support to policy, governance, and the supply side of seed and other
input markets; (2) direct support to rural households under a Farm Production Program that is
targeted and differentiated as explained below (and initially explained above in the discussion of
Figure 8); and (3) direct support to rural households under a Household Capitalization Program for
social protection and productive investment based on cash grants and savings mechanisms. We also
review possibilities for a program of support to nascent agricultural processing sectors that would
complement the Farm Production Program and the nonfarm orientation of the Household
Capitalization Program.
The Farm Production Program is organized under two components with very different objectives.
The Food Security Component works with households with few assets and little or no agricultural
market engagement (or little interest in commercial agriculture) to improve their production of food
security crops through better seed but without relying on multiple expensive cash inputs. The
Market-Oriented Component focuses on households with more farming assets and with a history of
market engagement and a desire for more, that could be enhanced by access to a wider range of
more productive cash inputs and practices that can substantially raise productivity. Seeds and
technical advice under this component could include food security crops but would also include –
unlike the Food Security Component – seed for cash crops such as soya, sesame, pigeon pea,
sunflower, and vegetables (depending on agroecology and access to market outlets) and maize
hybrids.
Based on cash transfers and savings mobilization, we expect the Household Capitalization Program
to play a dual role of addressing the pervasive food insecurity we identified and providing capital
that households can invest either in further agricultural intensification or in nonfarm engagement.
We anticipate that many, perhaps most, will use the funds to enhance their nonfarm engagement.
As part of the productive orientation of this program, Business Development Services would be
available for those households wanting them.
B. Governance and the supply side of seed and other input
markets Background: Donor investments and government and stakeholder commitment has generated
some progress in governance structures for agricultural inputs over the past several years, especially
with APROSE in the seed sector. MOSTA (Associação Moçambicana de Empresas de Comércio de
Sementes) is a seed sector advocacy group formed in 2013. It has been relatively inactive but there is

39
interest among seed traders in APROSE in reviving it. AMOFERT appears to have been less active
in the fertilizer sector but does play some role connecting public and private sector stakeholders.
The most serious threat to the seed and broader input system now involves the approach that
SUSTENTA is using in seed and other input distribution, which largely bypasses most commercial
houses and local agrodealer networks, to concentrate seed and other inputs into a limited number of
commercial houses for supplying the SUSTENTA network of commercial farmers (for onward
distribution to smallholder outgrowers). As SUSTENTA is quite large and the seed market and
agrodealer network is still small, many observers are concerned that this approach will undermine
six- to seven years of work building up this private sector system.
The sector faces at least four other governance-related challenges. First, seed falsification is rampant
and an open secret among institutional buyers of seed, chief among them relief agencies. This
falsification is a direct result of greater demand (due primarily to institutional demand) for certified
seed than the system is able to produce (including limited supply of basic seed), combined with weak
regulatory capacity. Stakeholders need to organize to get control of this problem, as it can
undermine the emergence of a robust certified seed market.
Second, current seed policy and regulations do not guarantee protection of intellectual property. As
a result, international and regional commercial seed companies and others may refuse to allow the
importation of their seeds into Mozambique. We discuss below how this might be dealt.
Third, Mozambique’s seed law and its 2013 Fertilizer Regulation have not been harmonized with
regional policy frameworks for these inputs. Given the importance of trade and the presence in
Mozambique of foreign companies in both these sectors, this policy harmonization deserves some
priority in governance efforts.
Fourth, though seed legislation in 2013 legalized the production and marketing of Quality Declared
Seed (Semente Garantida Melhorada – SGM – in Portuguese) and allowed private seed inspectors,
regulations need greater clarity and implementation of both measures needs to be improved.
Without this, local seed production of SGM and private inspection of its quality will not be able to
become well-regulated but profitable enterprises in rural Mozambique.
Seed sector governance: USAID should consider continuing to support APROSE with a focus
on5:
• Working with government and SUSTENTA to ensure that SUSTENTA activities do not
undermine the continued growth of local seed companies and agrodealers. Issues to be
addressed are the size of the subsidy in SUSTENTA distributions and the use of the
network of agrodealers for channeling seed to farmers. More detailed assessments need to
be made of exactly how SUSTENTA is operating in order to identify the problematic and
positive aspects of its activities and properly orient any APROSE agenda;
5 We have sought to identify areas of new or current need that are not being addressed or where additional resources could be helpful. More work will have to be done, however, to ensure that there is not duplication between these activities and other current or new activities.

40
• Conducting a general assessment of seed policy and identifying where legislation needs to be
changed and where emphasis should be on better implementation within existing legislative
structures and regulations;
• Developing a financial sustainability plan for APROSE drawing on sector stakeholders;
• Working also with USEBA (Unidade de Sementes Básicas) and the National Seed Authority
(ANS) of MADER to define workable controls and incentives for public and private seed
inspectors to ensure the quality of their work while not undermining the profitability of the
business;
• Encourage Mozambican entry into the International Union for the Protection of New
Varieties of Plants (UPOV). This is important to improve the private sector’s access to new
seeds and varieties, as it provides the property rights on varieties that are increasingly
required by the private sector and even with the public sector.
Broader input sector governance and services: Soil health is a key issue that fertilizer practices
can either improve or worsen, depending on formulations used, how they are chosen, and related
practices around fertilizer use and soil fertility. Though fertilizer use by smallholder farmers is very
low at present, it will only grow over time, and increasing numbers of medium- and large-scale farms
certainly are using the input. Key concerns revolve around the lack of soil testing capacity and
uncertain quality of imported and locally blended fertilizers. Also, as fertilizer use grows,
Mozambique needs to be sure that it encourages the broader approach that is finally emerging in
Africa that recognizes fertilizer as only one part of a balanced approach to improving soil fertility.
The Abuja II “fertilizer” summit will be reflecting this thinking, taking a soil health approach not
based simply on promoting fertilizer. Programming in Mozambique around this issue needs to
reflect this.
De Vletter (2019) reports the emergence of new technologies including portable, low-cost soil
testing for farm fields and industrial sector “ribbon blenders” that cost approximately $50,000 for a
full set-up. Together, these two technologies could revolutionize fertilizer use by allowing the
tailoring of fertilizer blends to a farmer’s particular soil. Whether this technology can be adapted to
help smallholder farmers remains to be seen. Also, even without the ribbon blending, tailoring
fertilizers to farmers’ soils can be improved. Achieving precise site-specific fertilizer
recommendations with access to those blends would require a regulatory framework that encourages
uptake of the technology by commercial farmers and entrepreneurs, who could potentially serve as
service providers for groups of farmers involved, for example, in farmer learning groups such as
Farmer Field Schools (see below for discussion of FFS). Emerging commercial producers of
vegetables could be a good place to start, given their intensive use of inputs in general including
fertilizers. In the meantime, greater use of diagnostic tools such as leaf-color diagnostics and simple
soil testing kits will make a difference for farmers assessing which and how much fertilizer to
purchase.
USAID should consider the following either in collaboration with or through direct support to
AMOFERT:
• Review the status of existing soil labs in Maputo (IIAM), Mocuba (Instituto Agrario de
Mocuba), and Nampula (under PROSAVANA), estimate the cost of rehabilitation and

41
operation, identify a specific, feasible plan of action for each, and decide whether the
investment and ongoing costs justify the potential payoff. Currently, lack of ability to do soil
testing results in one-size-fits all fertilizer recommendations that dramatically reduce the
productivity of this input;
• Assess the economics of ribbon blending and portable soil testing, including models of
service provision that might give at least the most advanced smallholder farmers access to
this technology;
• Review systems for monitoring the quality of imported fertilizer, and of the fertilizers that
are now being blended in Mozambique, and work with AMOFERT to propose and
implement a better control system.
Credit: Formal credit is exceedingly scarce in the agricultural sectors of developing countries across
the globe. For large-scale and emerging farmers, however, this input can be crucial to responding to
opportunities. While we rate this a lower priority at the present time, USAID could consider the
following:
• Assess innovations in collateralization, including mobile collateral registries. Tanzania is
currently considering such legislation and Mozambique could learn from that experience;
• Support systems for issuing use permits for land (DUAT), especially in Nampula where the
cadastral system is not yet fully digitized;
• Assess existing loan guarantee programs with banks to understand reasons for lack of uptake
and how that might be modified to facilitate formal sector credit to agriculture; and
• Support analysis of mobile banking options, ensuring that privacy concerns, safety of funds,
and other aspects within those systems are adequately addressed.
Direct supply side initiatives: In addition to improving the operating environment for seed and
other input companies, donors and government over the past decade have promoted the emergence
of new seed companies, have simultaneously worked to build-up a network of agrodealers who can
retail inputs to farmers, and have fostered coordination between these (and other more established)
companies and this network, and of the network with farmers. Though the payoff to these efforts
was not evident in survey data by 2017 (in the form of large increases in input use, though use did
appear to have risen broadly though modestly), the widespread view is that real progress has been
made and could lead to much more substantial change in coming years.
Yet gains remain fragile. USAID should therefore continue to support this system while working to
ensure increasing self-reliance by new companies and agrodealers over time. Key issues to be
addressed with direct supply side activities are the availability of basic seed (on which both certified
and SGM depend), and the need to continue strengthening the system for certified and SGM
production, marketing, and inspection. USAID should consider:
• Working with MADER (IIAM, USEBA, ANS) and CG centers (e.g. IITA) to ensure that
sufficient pre-basic and basic seed is produced to feed both the SGM and certified seed
systems. USAID should consider partial privatization of pre-basic and basic seed
production, but this should be in the study phase only at this point. A key issue is the need

42
to maintain public provision of pulse seed and OPVs of other less demanded crops, since
the private sector is likely to under-provide these types of seed.
• Support to associations that meet capacity criteria and demonstrate an active interest in
developing community seed producers for food security crops and limited cash crops
producing certified seeds, or SGM seeds where costs of full certification cannot be covered;
• Ensuring that the seed production educational modules for "Seeds as a business" (IITA,
2018) are available in formal institutes of learning (such as technical schools) in Nampula
and Zambézia, based on past experiences, with financial planning and business plans;
• Support to Business Development Services (BDS) entrepreneurs with a special grant/loan
program to increase availability of BDS for sustainable business development in rural areas
• Focusing on programs with seeds sold at market rates (with any subsidy coming through an
e-voucher- see below), rather than supporting any programs with free seed distributions,
especially with public sector funds, with the possible exception of seeds for demonstration
plots. This would include avoiding large public sector and donor seed purchases from the
private sector that take seeds off the market and crowd out agrodealers from seed supply.
• Ensuring seed access for participating farmers always through agrodealers (including using e-
vouchers redeemed with agrodealers – see below) and actively promoting coordination
between agrodealers, seed companies, and farmers through seed and other input fairs and
other mechanisms.
C. Direct support to rural households Our proposed approach to directly supporting rural households is based on the need to spur
household capitalization that also addresses food insecurity, and to combine this with targeted and
differentiated support to farming. We outline the key elements of each program here, building off
the logic and evidence presented in Figure 8.
Program design: Farm Production Program: The Farm Production Program has two
components: a Market Oriented Component and a Food Security Component. We suggest that each
be built around (1) primary use of e-vouchers tied into the network of agrodealers to promote
technology uptake, and (2) Farmer Field Schools or other learning fora, taking advantage of any
existing farmer groups, for learning on technical farm production and food security/nutrition.
The two components differ in their farmer focus, objectives, and locations. The Market Oriented
Component works with farming households with good prospects for adopting the technology and
practices needed to meaningfully increase productivity and become increasingly commercialized. As
we state above, we expect this group to be not more than 15-20% of farmers: most of types 4 and 6
(only 10% of all farmer per IAI2012), a few of type 5, and the better off and more motivated among
type 3. Type 1 and 2 farmers and the rest of types 3, 4, 5, and 6 would participate in the Food
Security Component.
The Food Security component works with households with too few assets or too little orientation
towards farming to make farming a business. We anticipate this will be 80-85% of farmers in any
area: most if not all Type 1, the less well-off or less farm-oriented in type 2, and probably most of
type 5, who may have the resources but not the orientation to treat farming as a business.
43
Geographically, the Market Oriented Component should be limited to areas with road access that
allows profitable access to markets. Measures of cash- and time cost of reaching markets in the dry-
and wet seasons should be developed to guide this decision. The Food Security Component could
be implemented in these areas (for farmers not qualifying for the market component) and in areas
less well connected to markets.
The seeds, other inputs, and technical advice included in each component would also differ. Seeds
in the Market Oriented Component will emphasize certified seeds (including hybrids for maize),
with SGM probably limited to pulses. Crops would include food security crops (recall that nearly all
household types suffer from food insecurity) and cash crops with strong marketing potential in the
area the program is being implemented. Other inputs would include fertilizer and, potentially,
herbicides. Consideration should be given to including mechanization services where these are
available and a provider is willing to accept a voucher. The program would need to work with
potential providers to make this possible.
Piloting the participation of private industry with FFS and other farmer learning groups to test
whether highly specific fertilizers will be profitable for both fertilizer companies and farmers would
be valuable, either in the voucher or through other means with partial and temporary subsidies.
Farmer extension for this component would include training for food security and nutrition but will
also emphasize higher productivity through topics such as buying the right fertilizer for your type of
soil, pest management with chemical and IPM control, planting in rows, soil conservation and soil
restoration measures, and farming as a business. Many radio programs have been developed during
the COVID pandemic due to restrictions on in-person meetings. These should continue to have
investments and be used even after the pandemic, especially but not solely for women. Video-
mediated extension approaches have been found to have positive effects on knowledge and
technology uptake and should be integrated into the approach (Abate, 2019; Nakasone and Torero,
2018; Van Campenhout et. al., 2018). These approaches may be especially effective with women
and youth.
Input promotion in the Food Security Component would be limited to seed and, where practicable,
mechanization services (many Type 5 farmers may be interested in this, as they have relatively high
incomes and may want to save the time – not necessarily expand area, given their nonfarm focus -
through mechanization). Seed will be quality seed (SGM, certified OPV) of improved varieties at
accessible prices. E-vouchers should also be used here. FFS in this component will emphasize food
security and nutrition messages and not farming as a business. Crop choice within this component
will thus be more limited (for example, soya, sesame, and sunflower would not be included).
Program Design: Household Capitalization Program: Nonfarm engagement is key to escaping
poverty in rural Africa, but poor households face many hurdles to entering remunerative nonfarm
employment. Chief among these is start-up capital: even the starting stock of the tiniest of micro-
entrepreneurs engaging in petty trade of food items may be beyond what some can generate. A
second hurdle is technical knowledge, especially in basic areas such as keeping accounts.
Capitalization can be spurred through a combination of cash grants (with or without conditions),
savings mobilization through Village Savings and Loans Associations (VSLAs) or Accumulating
Savings and Credit Associations (ASCAs), and use of mobile money services and mobile banking to

44
get around the lack of formal banking institutions in rural areas. Having a safe, easily accessible, low-
cost way to save small amounts at a time is one of the goals, so that households can accumulate
capital over time to use as they think best – on new or more farm technology, start-up capital for a
micro-enterprise, or other needs. Lessons from INOVAGRO’S Fundo Agricola could be useful in
the design of these VSLAs and ASCAs.
Having a mix of approaches is especially important to ensure inclusivity of women and youth.
Evidence from Kenya (GSMA Connected Women, 2015) suggests that women prefer savings
groups over VSLAs and mobile money. For the latter, women tend to engage in more, smaller
transactions and so are put off by transactions fees and are less likely to use MMS. FinScope (2019)
confirms women’s lesser use of MMS in Mozambique and emphasizes that “consumers generally use
a combination of financial products and services to meet their needs.” Youth, on the other hand,
may prefer mobile-based approaches, though transactions fees may also be a problem for them.
FinScope (2019) confirms that youth under 35 are nearly 50% more likely to use mobile money than
those older than 35, at 32% compared to 23%.
We suggest minimal targeting of the cash grants, for three reasons: (1) poverty and food insecurity
are pervasive, so even many better-off households could see major changes in their circumstances
from such grants, (2) targeting on something like this is expensive and highly imperfect, and (3)
most slightly better-off households who may be most able to enter remunerative nonfarm
employment are likely still to be capital constrained in doing so.
We also suggest minimal conditionality on the grants, since enforcing conditionality is costly and
knowing the proper conditionality to impose is not straightforward. Instead, we suggest that USAID
build a rigorous learning agenda regarding the most innovative aspect of this program, which is the
pairing of social protection with farm production assistance to simultaneously promote food
security, on-farm productivity growth, and increased nonfarm engagement within one program and
with many of the same farmers. This is a major opportunity to learn not just what works but what
farmers choose when they are provided with livelihood options. Rigorous learning would require
some randomization of access to the household capitalization program. Details would have to be
worked out at a later date. The best design would involve a 3-4 year timeline so that one can look at
medium-term outcomes, not just short-term.
D. Support to agricultural processing
The post-farm portion of Africa’s agrifood system – in particular processed foods and the transport,
logistics, processing, packaging, and distribution they entail – is growing rapidly and absorbing large
amounts of labor (Tschirley, et.al., 2015a; Tschirley et. al., 2015b; Dolislager et. al., 2020; Reardon et.
al., 2021). This portion of the economy especially provides opportunities for women, as shown by
Tschirley, Kondo, and Snyder (2016) and Dolislager, et. al. (2020). Food processing is thus likely to
be an attractive area for support, both for domestic consumption and the regional markets that we
emphasized earlier were important to expand markets, develop economies of scale, and learn.
Successful agroprocessing requires five things. The first is a reliable market for outputs. We
identified what look like promising markets for domestic consumption in Table 1, and to that add
soya and potentially sunflower for their derived demand as part of animal feed.

45
The second requirement is sufficient regular production of adequate quality of agricultural
commodities that can make it to the factory door, whether through delivery or pick-up by the
processor. This is a challenge in a country like Mozambique with low farming productivity and
precarious road infrastructure.
The third requirement is technical and managerial capacity to run and maintain equipment, manage
people, coordinate supply of raw material, and identify and exploit sales opportunities. This is the
essence of entrepreneurialism.
The fourth requirement is an enabling environment featuring enough communications and transport
infrastructure to keep logistical costs manageable and a policy and regulatory framework that
minimizes uncertainty and undue bureaucratic procedure that imposes high costs of doing business.
Here Mozambique is also quite challenged in light of the governance record we reviewed in section
2. The World Bank’s “Doing Business” report (World Bank, 2019a) notes that starting a new
business in Nampula takes more than twice as long as starting one in Maputo City (40 days
compared to 17 days, respectively). Taxation issues are a policy aspect, related to duty free or
reduced duty imports for competing products, and taxation on needed inputs to processing.
The oilseeds industry faces key challenges regarding imported crude oils competing with domestic
oils, and whether reasonable protection of limited duration can be effective in jump-starting an
efficient local industry. It is unclear if the new Instituto de Algodao e Oleaginosas will be evaluating
these policy issues. Lessons might be learned from Tanzania, which has seen tremendous growth in
local processing of sunflower for oil in the last decade.
A fifth requirement is the ability to mobilize capital, ideally through credit at reasonable cost.
Commercial banks in Mozambique have limited interest in taking risks in agriculturally related
businesses and so have relied on donor and government guarantees and grants, as well as high
interest rates, yet they still commit few funds. Non-bank financial institutions are the most likely
agents to fund SMEs in agroprocessing, including GAPI, Banco Oportunidade (now MyBucks) and
AMODER as they are more familiar with rural conditions and agriculture. They are familiar with
credit and collateral systems more adapted to the smaller scale and limited resources available.
One of the key lessons of the past is that financing should be tied to training on agribusiness and the
relevant processing industry to ensure investments are made in viable businesses. Training on
business plans, cash flow and stock management, food safety, legal requirements for labor and
taxation, marketing, and more are necessary for entrepreneurs to survive. Are the technical schools
linked sufficiently to agribusinesses to train workers for them and prepare a new generation?
One of the clear gaps for agroprocessing is the weak infrastructure throughout most of Nampula
and Zambézia. Road, port, and rail investments have made a dent in high time and costs of transport
for agricultural goods. Access to all-weather roads is still limited and continued investments in
construction and maintenance are needed. Cyclones and flooding will continue to undermine access,
so construction specifications and maintenance must address those threats. With the major
consumption market in Maputo, transportation cost reductions for commodities using the ports will
be valuable, especially for competing with South African and World imports. Lack of storage
facilities and port handling facilities are costly for Mozambique. Support to the transport sector with
analysis and geospatial tools to identify key bottlenecks could reduce costs.

46
Agroprocessors need not just roads, but electricity, water and communications. Efforts at creating
minigrids using solar, hydro, wind, or biomass offer excellent opportunities with capacity greater
than the household-level solar investments, responding to processing needs. Fundo de Energia
(FUNAE) and Electricidade de Mocambique (EDM) are working with a World Bank program and
sponsoring pilots on minigrids in Nampula based on solar. Wind depends on sustainable high winds
and so must be sited carefully, but is an option to the solar and hydro. The electrical facilities can be
modular and scalable, designed to meet needs including access to water and to communications.
Additional direct investments will be needed in clean water systems to ensure food safety and for
many processing activities. Communications advances offer some excellent new ways to connect
processors to technology, to markets for inputs, markets for output and coordinating the value chain
to get the products to the markets. As was seen earlier, linking financial institutions to mobile
financial options can facilitate development outside the main cities.
All of the infrastructure investments make it more likely for agroprocessors to attract skilled
workers. Even the small and medium enterprises can provide employment and training for growth.
The youth will be more attracted to SMEs in zones with these electrical, transport, and
communications facilities.
There are other aspects related to technology acquisition, including machinery and packaging for
value added products. Poor quality local packaging and high cost imported packaging is a major
limitation for the local processing industry (GAIN 2020). USAID has released a competition on
innovations in packaging, and following up with the winning candidates will be valuable, as all
agroprocessing enterprises need less expensive, environmentally friendly, and locally produced
solutions for dry and wet products. Bags, pouches, jars and more are in demand. Otherwise, the
import cost of attractive and environmentally sound packaging from South Africa, China and
elsewhere needs to be reduced.
On food safety, aflatoxin is a key issue and should be addressed carefully so as to avoid scaring the
public about an invisible menace. Engaging food processors with nutrition and higher quality food,
with systems to avoid aflatoxin and other factors affecting food safety, would enable expansion of
markets for locally produced peanut butters, jams, juices, honey and other commodities. In general,
human behavior change for nutrition is an area for development, as shown by the experience with
OFSP in Mozambique.
We have identified several value chains that have potential for agroprocessing growth and
employment generation in Zambézia and Nampula. These include soybeans, cassava, sunflowers,
sesame, pigeon peas, groundnuts, moringa, and tree nuts (macadamia). Agroprocessing is more
economically feasible for multi-functional crops such as sunflower, soybean, maize and cassava,
which can be used to produce multiple products and thus are less reliant on any single market. For
example, maize has a huge market for direct consumption as maize meal, as well as a small but
rapidly growing market for animal feed; cassava is consumed directly and can be an input to beer or
used to produce starch among other products; soybeans and sunflower can be processed for meal as
an input to animal feed, oil for human consumption, and (mostly for soybeans) other products for
human consumption. Investments to increase their production and improve quality would enhance
the capacity of the local industry to meet its raw material demand and serve human consumption
demand at the household level. This is especially so for soybean and sunflower.

47
Soybean: This is a relatively new crop to Mozambique and as mentioned earlier, has a key role in
poultry feeds in northern and central Mozambique. With strong demand growth from a stable
domestic base, soybean presents excellent processing opportunities. Oilseeds in Mozambique are
primarily used (80% or more) to supply the animal feed industry. However, using soybean solely for
animal feed loses a lot of value. Soybean can be used for human consumption (soy milk, soy yogurt,
soy flour, soy bean oil) with animal feed demand still satisfied by the soy cake. Alif Quimica in
Quelimane already uses its processing facility to generate edible soy oil and soy cake for animal feed.
Imported soy products for human consumption, such as Tasty Soy chunks, are now found in urban
and rural markets, indicating potential local demand that could be exploited, and there are SMEs
with soy processing developing in Manica and Nossara Cooperativa in Alta Zambézia, with TNS
assistance. In the case of Nossara, project assistance enabled the cooperative to access electricity,
install a flour mill, and expand oven capacity. For soy milk, with electricity, stoves are needed to
prepare the milk efficiently, rather than the time-consuming preparation over a fire.
Options to consider for soybean are: 1) Include soy in the input package and extension (FFS)
portion of the market oriented component of the Farm Production Program in Alta Zambézia and
potentially other areas, ensuring extension and support through agrodealers; 2) Work with industry
to identify options for soy processing using existing facilities that integrate animal feed and human
food needs, and support SME processors with grants to expand capacity and acquire equipment,
packaging and R&D; 3) Co-financing of the training needed for local firms to use the investments
profitably and sustainably, including packaging and marketing of soy products, safe food handling,
and operation and maintenance of flour mills; 4) Develop a communication strategy to promote soy
milk and other soy products for human consumption, including home processing options, as part of
nutrition communications.
Cassava: This is an especially multifunctional crop with many potential uses. It is well known by
Mozambican farmers and would benefit from innovations to be used more often in animal feed
(both leaves and pulp), as well as for processed consumer goods. It is constrained by the need to
process or eat fresh cassava within 48 hours of harvest and it has issues with cytotoxins and
aflatoxins that need to be addressed. In northern Mozambique, CDM contracted with DADTCO
for mobile processing units to ensure cassava cake supplies to the brewery (Costa and Delgado
2019). IFAD’s ProSUL program also worked with DADTCO to establish mobile processing units in
the south. Various NGOS have also worked on small scale washing and peeling machines as well as
chippers and solar dryers that can be used at household or MSME level for dried cassava chips
which can be milled into flour.
Cassava may also have potential as a biofuel for the domestic market and possible starch production,
mainly for export. Both would require larger scale investments.
Cassava flour markets appear as the greatest opportunity, for use in breads, biscuits and other baked
goods. Scaling Up Nutrition Business Network (SUN-BN) is interested in this. Maize flour
fortification systems for large, medium and small-scale mills are available and can be adapted for
cassava flour. Dadtco has developed new mobile units with cassava starch flour as the output, as
needed by bakeries (Monitor Deloitte and FSDMoçambique. 2016). Cassava flour substitution for a
portion of the imported wheat in bread and other baked goods is an option, although wheat is

48
imported with only 2.5% tariff and no VAT taxes to keep the price of bread low for consumers.
This policy may need to be re-visited if import substitution is desired.
Options to consider for cassava are: 1) Examine the costs, benefits, and recipes for use of fortified
cassava flour in breadmaking; 2) Examine policy support for imported wheat with an eye for cassava
flour substitution; 3) Work with millers to adapt processes for fortification to include fortified
cassava processing in flour, as would be needed with bakeries; 4) Support the acquisition by industry
of mobile processing units for cassava cake production for beer industry and newer mobile
processing capacity for cassava starch flour for bakery use to scale through training and import
policy review; 5) Support production, development (technical side), and acquisition (funding
resources) of small-scale peelers, chippers and solar dryers and other implements to lower labor in
SME processing.
Sesame: Increased production and greater adoption of productive varieties of white seed could be
used in developing consumer products for local and export markets. Sesame seed can be processed
into roasted seed for the bakery industry. They key to exploiting this market is to increase
production volumes of high quality white sesame and ensure good cleaning of the product.
ACDI/VOCA and Galli (2019) point to the possibility of sesame seeds for confectionary uses. It
would be valuable to examine the work in Ethiopia and elsewhere of SNV on the development of
sesame production and markets.
Sesame oil can also be produced, though it is important to distinguish between edible oil and
cosmetic oil, since production of edible oil requires more infrastructure and higher investments.
Competing in edible oil markets will be difficult for Mozambique due to the low production
quantities and the lack of quality seeds for varieties with high oil content. Cosmetic oil can be
produced at small scale and then expanded into medium or larger, as production quantities grow. It
could initially target the nascent local cosmetic industry.
All analyses of sesame in Mozambique point to the lack of price differentiation in the markets and
thus the lack of incentives for farmers to grow quality sesame (white/cream colored, high oil
content), in addition to the lack of quality seeds in the markets. Traders have experienced problems
with side-selling when working to develop quality markets, so there may be a role for the new
Institute in setting up standards, advertising them and encouraging market segmentation for sesame.
If value chains can be organized sufficiently to pay a price premium for quality production, then
outgrowing arrangements for this high quality production may be possible to maintain .
Options for sesame include: 1) Support enhanced seed system capacity for high quality seeds of
white sesame varieties (eg. Lindi) which are in demand but available in only limited quantities; 2)
Provide BDS to medium-scale firms to develop business plans, and provide co-financing or credit
guarantees for the acquisition of processing units that cost $40,000 to $45,000; (3) Support linkages
to producer associations and large aggregators to ensure volumes and quality of product received;
and (4) work with policy research to conduct a study to assess local and regional demand for sesame
products.
Sunflower: Sunflowers have been produced in Mozambique through the years and several new focal
production points are arising, including among soybeans farmers in Gurué. There are about 10,000
small emerging and medium-size farmers that supply Alif Química with sunflower which is

49
processed into edible oil and exported as Non-GMO sunflower oil to Switzerland. In the case of
Tanzania, additional growth in sunflower edible oil production was accomplished with UNIDO
helping to identify the technology for SME production and the facilitation of processing parks with
Dodoma Sunflower Oil cluster to lower per unit costs (UNIDO 2021). The government of
Tanzania also put four fiscal measures in place to assist investment, including large-scale industrial
investment, in the sector: (1) a moderate (and in principle temporary) tariff on imported oil
(primarily palm oil), (2) efforts to ensure that refined palm oil was not presented as raw oil in
attempts to evade import duties on the refined product, (3) a VAT exemption on agricultural
processing equipment that includes equipment for solvent extraction used in medium- and large-
scale sunflower oil processing, and (4) a VAT exemption on sunflower seed cake, which is a by-
product of oil production and can be used in animal feed manufacturing6. See United Republic of
Tanzania, 2016, for further detail on the sector.
A broad and balanced approach like this may enable greater production of edible sunflower oil for
Mozambique’s domestic market. Increasing production is critical and the sunflower producers in
Gurue and elsewhere have had the support of ex-TNS staff members and have equipment and
experience acquired from previous TNS and AGRA programs. They could be critical to increasing
sunflower production and similar models could be used in Angonia and Manica. The two largest
edible oil processing industries in southern Mozambique have expressed interest in purchasing more
local product to replace oil-cake imports, and SUSTENTA is supporting some sunflower investment
to feed the industry.
Options to be considered for sunflower include: 1) Increase production of sunflower by including
sunflower seed in farmer voucher programs in the same areas where soybeans are included, though
this will require coordination with agrodealers to ensure availability and with aggregators to ensure
markets; 2) Identify and train on the equipment, packaging, and handling needs for SMEs in
processing edible oils; 3) Facilitate a value chain study on edible oils for Mozambique and for export
to the region and internationally, including the relevant policy, and (4) promote sunflower outgrower
programs as a crop rotation with pulses and long-term fruits trees.
Pigeon peas: While the export market for pigeon peas to India has had difficulties, there are local
processing units in Gurué and Nacala that are underutilized. These units can be used to supply the
local market and to export to countries with no quota system, such as Zimbabwe, UK and US, all
based on existing trade agreements.
Options to be considered for pigeon pea include: 1) Continued investments in varietal development
and seed systems are needed; 2) Consumer studies on domestic demand would be valuable to
motivate private investments. Pigeon pea has numerous uses in animal feed. Leaves and pods can
make palatable and protein-rich fodder. Leaves are sometimes used to replace alfalfa in ruminant
diets in areas where alfalfa cannot be grown. Seed processing by-products, and sometimes the whole
seeds, are used as livestock feed (Phatak et al., 1993). The seeds can be fed to poultry, and mixtures
of pigeon pea with maize grain were successfully used in Hawaii (Orwa et al., 2009). Plant breeders
have created varieties adapted to drier conditions, more resistant to diseases and suited to different
6 See https://dalberg.com/our-ideas/tanzanias-sunflower-sector-is-paving-the-way-for-future-industrialization-and-sustainable-growth/ for more detail.

50
production systems and cropping cycles (Valenzuela, 2011). Varieties available have increased since
the 1990s, allowing selection of cultivars with higher forage yields and crude protein content, in
addition to higher agronomic yields (Phatak et al., 1993).
Moringa: Moringa and other tree crops have potential for growth within the processing sector.
There are new investments in moringa plantations in Nampula and Zambézia, with smallholders as
outgrowers. The leaves are used in the production of teas, capsules and transformed into cosmetic
creams and gels for regional and other export markets. The farms have been certified GAP and for
organic production. With proper investments and value chain coordination, this could provide good
opportunities for a small number of market-oriented smallholder farmers. Option: 1) Trade policy
efforts are needed to enter the EU/AGOA and Chinese markets; 2) Possible training or internships
related to success with processing and marketing of niche commodities such as with COMACO in
Zambia may be valuable. An example of this relates to the integrated of honey production with with
moringa production. Slowly in southern Mozambique bee pollination services are emerging among
the commercial fruit farms to increase productivity. As a result, scented honey, a specialty product, is
rising for a niche market.
Groundnuts: Over 50% of farmers are growing groundnuts in regions of Zambézia and Nampula,
but aflatoxin contamination is a known problem. Along with cassava and maize, groundnuts are
identified as contributing to liver cancer and other health problems and new research by the FTF
Nutrition Innovation Lab in Mozambique is looking at exposure issues (Nutrition Innovation Lab
2018). Reducing aflatoxin and developing options for value added products could improve
marketing and prices, while providing an incentive to grow healthier nuts. Processing into peanut
butter or salty snacks could be a local SME activity, if aflatoxin and packaging concerns are
addressed. The rigorous aflatoxin standards for Europe are difficult to meet for export and are
stricter than the Codex Alimentaris standards in Mozambique. However, reducing aflatoxin levels
would both enhance processing options as well improve health in production regions of
Mozambique. There are technologies known for aflatoxin reduction (Njoroge 2018). For example,
Aflasafe has been tested and is now authorized in maize and groundnut production in Mozambique,
having been shown to be effective in reducing aflatoxin during the production period. Research for
Helvetas found “ … with the use of aflasafe in the production phase and Biospray or salt in the
post-harvest phase with proper application of the drying and storage methods, Aflatoxin levels can
be controlled avoiding public health problems” (Helvetas 2019). Other methods for harvesting and
storage are available, with a recommended practice to aggregate unshelled groundnuts as quickly as
possible after harvest, and only shell under adequate controlled low humidity storage conditions.
Additional sorting out of moldy appearing nuts also helps. Agrifuturo invested in the Lurio
Laboratories for Aflatoxin and supporting ICRISAT initiatives on training technicians, farmers,
aggregators, and processors would contribute to lowering aflatoxin. Options: 1) Invest in aflatoxin
mitigation systems, taking advantage of previous work and new technologies (Aflasafe, Biospray and
others) especially at the farm and storage levels with both training and inputs access; 2) Identify
options for SMEs to test and meet quality standards for aflatoxin for domestic markets with
strengthened laboratories in Nampula; and 3) include groundnuts in nutritional and ag extension
education, emphasizing handling for safe and nutritious foods.

51
E. Support for women and youth
Women and youth face unique constraints in the development process. Recognizing those
constraints is critical to developing programs to enhance their opportunities. The ProEjuma project
design by ELIM Servicos, Ltda for MADER (Mata, et. al., 2020) provides excellent diagnostics on
constraints and opportunities. They elaborate a program that includes the skills building, the
enterprise development, and the national policies to encourage employment in the agricultural sector
that informs our thinking. Key is the recognition of societal and cultural norms that can limit access
and there can be unintentional negative effects if not recognized (see Land O’Lakes/Venture 37
2020 and aspects related to violence against women). Working with women and youth to build
relationships with service providers, financial operators, traders and potential employers is part of
the overall goal. There are a myriad of programs for women and youth in Mozambique and the
region, but a key will be returning in several years’ time to see what has worked and why, a plea from
Sumberg et al (2014).
Women: A key feature of the intervention options proposed here is the support for farmers for
capitalization, whether with VSLAs, ASCAs, mobile money, or other means to enable savings that
can be attributed to the women. Much research, cited earlier, focuses on women’s participation in
different financial mechanisms, and these lessons need to be incorporated into program design. For
women with some marketed product, this form of savings is valuable for accumulation. By
including the links with mobile wallets and assisting women with financial literacy, rural women can
have more control over financial resources. Cash grants can be arranged and under control of
women. Seed production and SME development programs should have targeted options for
women, with additional training programs on business management. iDE SMART is one such
program, identifying good candidate with the background and entrepreneurial spirit to be engaged in
training and skills building for seed production, agroprocessing, and other activities (iDE 2018).
Since women are more invested in legume and vegetable crops, involving them in value chain
activities with those crops is logical. Training on crop management, post-harvest, value addition and
financial management (with numeracy) can be organized around the women’s schedules, adapting to
childcare and other responsibilities. The World Bank Women Entrepreneurs Finance Initiative (We-
Fi) (World Bank 2020d) focuses financial resources for women entrepreneurs, with the additional
training, mentoring, and market analysis, while working with policy makers to remove legal and
regulatory constraints for women entrepreneurs. The program adapted in the era of COVID to
conduct all training online (World Bank 2020c).
Small scale agro-processing machinery is available that specifically reduces women’s labor time, such
as peelers and chippers for cassava, and threshers for cowpea and pigeon pea. Programs should
include creative financing options with collateral based on cash flow, using partial grant strategies,
given that women are less likely to have DUATs and less likely to have bank accounts (Finscope
2020). This is where financial literacy and business skills development are critical.
Despite rising literacy and improved education levels, literacy among rural women remains low.
Thus, educational and training materials need to be designed for low literacy people. PROMER is
one of the projects that has evolved over time given its experience with rural women (IFAD 2020).
Things such as the animated of SAWBO and live videos on YouTube (Land O’Lakes/Venture 37,
2020) and radio programs are valuable and should continue to have investments. Due to the

52
COVID pandemic and rules against meeting in person for agricultural and health extension, many
radio programs have been developed and those should continue to have investments and be used
even after the pandemic, especially but not solely for women.
Youth: Research shows that youth are attracted to business opportunities (Dadzie et al. 2020; see
also IFAD 2019, whose entire Rural Development Report focused on rural youth). So youth,
particularly rural youth, can be targeted for scholarships to technical institutes to learn about
agricultural production, business development, planning, and management, but also be engaged with
private sector initiatives such as internships to ensure hands on experience. The SNV OYE Youth
Employment program for rural youths in Mozambique, Tanzania and Rwanda learned lessons along
the way that demonstrate there is a push factor (youths with low employability wanting options), a
pull factor (internships with private sector or support to establish start-ups) and a match factor
(matching youth to markets and access to start-up funding and financial institutions (SNV 2018).
Mechanization, agricultural information systems, Business Development Services are all possible
directions for youth employment, as well as the poultry sector experiences of earlier programs. The
Gapi ProJovem Programme is an example of an initiative to identify youth coming out of
educational institutions with potential funding for business development (Mata 2020). Engaging
UniZambeze students in agriculture has proven successful for the Rama BC team (Land
O’Lakes/Venture 37 2020).
The literature suggests that youth of today are more likely to participate in activities that use modern
information and communications technologies (ICT), and the SEMEAR results for their last year of
the program confirm that more youths were engaged when there was greater use of ICT (IITA
2020). IFAD (2019) notes “a renewed interest among entrepreneurial youth in farming that is closely
linked to the possibility of serving growing markets with technology-enabled farming and marketing
practices” (p. 218).
BDS may be one area for use of ICT. Mechanization services can also use more ICT in the business
management and be more attractive. As indicated in Mata 2020 and found in Finscope 2020, youth
are more engaged with cell phones and mobile money services than their elders, and taking
advantage of this for training, linkage to markets, and financial tools will be important. Sumberg et al
(2014) stress the need to identify transformative employment activities, ones that youth will see as
developing their potential into the future, that may not be directly in farming, but rather in
agroprocessing or farm services. Dolislager et. al. (2021) show that 21% of employed rural youth (in
wage or self-employment) are engaged in the post-farm segment of the agrifood system, but this is
much more common in relatively densely populated rural areas than in hinterland areas.

53
References
Abate, G., Bernard, T., Makhija, S. and Spielman, D. (2019). “A Cluster Randomized Trial of Video-
Mediated Agricultural Extension Services in Ethiopia”. AEA RCT Registry.
ACDI/VOCA (2016). Mozambique Agricultural Value Chain Analysis. LEO Report # 31. Report
prepared for USAID. Maputo. (ACDI VOCA 2016 Report-No31-Mozambique-VCA-Report.pdf).
http://www.acdivoca.org/wp-content/uploads/2016/09/Report-No31-Mozambique-VCA-
Report.pdf
Acemoglu, D. and P. Restrepo (2020). “Robots and Jobs: Evidence from US Labor Markets.”
Journal of Political Economy, 128(6).
AGRA (2017). Africa Agriculture Status Report 2017: The Business of Smallholder Agriculture in
Sub-Saharan Africa (Issue 5). Nairobi, Kenya: Alliance for a Green Revolution in Africa (AGRA).
Accessed at https://agra.org/wp-content/uploads/2018/05/Final-AASR-2017-Aug-282.pdf
allAfrica.com (2015). “Ethiopia: New Shoe and Leather Factory Invests U.S. $35 Million in Debre
Birhan.” 27 April.
Aristizábal, J., García, A., Ospina, B. (2017). “Refined cassava flour in bread making: a review”.
Ingeniería e Investigación, 37(1), 25-33. DOI: 10.15446/ing.investig.v37n1.57306. Accesed at
http://www.scielo.org.co/scielo.php?script=sci_arttext&pid=S0120-56092017000100004
Autor, D. (2014). “Polanyi’s Paradox and the Shape of Employment Growth.” Working Paper
20485. National Bureau of Economic Research.
Brynjolfsson, E. and A. McAfee (2014). “The Dawn of the Age of Artificial Intelligence: Reasons to
cheer the rise of the machines.” The Atlantic, October, 2014.
Brynjolfsson, E. and A. McAfee (2011). “Where Human Workers Can Still Beat Robots (at Least for
Now).” The Atlantic, October, 2011.
Burke, W., Jayne, T., & Sitko, N. (2019). Do medium-scale farms improve market access conditions
for Zambian smallholders? Journal of Agricultural Economics. https://doi.org/10.1111/1477-
9552.12360.
Byiers, B., L. R. Takeuchi, and A. Rosengren (2015). “Productive employment and transformation in
Uganda.” Case Study Report. Developmentprogress.org.
Cambridge Economic Policy Associates (2016). Agribusiness Country Diagnostic – Mozambique.
Report for IFC, Global Agriculture And Food Security Program (GAFSP) Private Sector Window.
https://www.ifc.org/wps/wcm/connect/02f45366-4654-46a7-85b4-
c95aefcacc71/GAFSP_CountryDiagnostic_MOSAMBIQUE_Full_rev.pdf?MOD=AJPERES&CVI
D=ldj7OeN
Carter, M., E. Tjernstrom, and P. Toledo (2019). “Heterogeneous impact dynamics of a rural
business development program in Nicaragua.” Journal of Development Economics, 138:77-98.

54
Carter, M., R. Laajaj, and D. Yang (2021). “Subsidies and the African green revolution: direct effects
and social network spillovers of randomized input subsidies in Mozambique”. American Economic
Journal – Applied Economics, 13(2):1-24.
Chapoto, A. and M. Kabisa. (2021). Regional Perspectives on Implementing Agricultural
Projects/Programmes: Lessons Learned in Zambia, Malawi and Tanzania for Future Programming.
Report prepared for Michigan State University. Lusaka, Zambia: Indaba Agricultural Policy Institute
(IAPRI).
Costa, Carlos and Chris Delgado (2019). The Cassava Value Chain in Mozambique. World Bank,
Washington, DC. License: Creative Commons Attribution CC BY 3.0 IGO. Accessed at
http://documents1.worldbank.org/curated/en/340481559135255608/pdf/The-Cassava-Value-
Chain-in-Mozambique.pdf .
Cravo, T., & Piza, C. (2016). The impact of business support services for small and medium enterprises on firm
performance in low- and middle-income countries: A meta-analysis (IDB Working Paper Series 709).
Washington, DC: Inter-American Development Bank. Retrieved from
http://documents.worldbank.org/curated/en/521211467989461591/The-impact-of-business-
support-services-for-small-and-medium-enterprises-on-firm-performance-in-low-and-middle-
ncome-countries-a-meta-analysis.
Croppenstedt, A., M. Knowles and S.K Lowder (2018). “Social protection and agriculture:
Introduction to the special issue”. Global Food Security, 16:65-68.
Dadzie, Christabel, Mawuko Fumey, and Suleiman Namara (2020). “Youth Employment Programs
in Ghana: Options for Effective Policy Making and Implementation”. International Development
in Ficus. Washington DC: World Bank Group. Accessed at
https://openknowledge.worldbank.org/handle/10986/34349?locale-attribute=es
Danida. (2009). Synthesis of evaluations on support to business development (Evaluation Study 2009/5).
Copenhagen: Danida.
Crespi, G., E. Fernández-Arias, and E. Stein, eds. (2015). “Rethinking Productive Development
Sound Policies and Institutions for Economic Transformation.” Inter-American Development
Bank.
Daily Maverick (2013). “Does H&M’s investment in Ethiopia finally signal the African
manufacturing boom?” 26 August.
De Vletter, F. (2019). “The fertilizer sector in the Zambia, Malawi, Mozambique growth triangle
(ZMM-GT): Challenges for creating a more competitive regional industry and for promoting greater
smallholder access.” Consultants report.
Dolislager, M., T. Reardon, A. Arslan, L. Fox, S. Liverpool-Tasie, C. Sauer, D. Tschirley (2020).
“Youth and Adult Agrifood System Employment in Developing Regions: Rural (Peri-urban to
Hinterland) vs. Urban.” Journal of Development Studies, Vol. 57 No. 4 p 571-593.
Donovan, Cynthia, Steven Haggblade, Venâncio Alexandre Salegua, Constantino Cuambe, João
Mudema, and Alda Tomo (2011). Cassava Commercialization in Mozambique. IDWP 120. Lansing,

55
Michigan State University. Available at https://www.canr.msu.edu/fsg/publications/idwp-
documents/idwp120.pdf
Fan S., and C. Rue (2020). “The Role of Smallholder Farms in a Changing World”. In: Gomez y
Paloma S., Riesgo L., Louhichi K. (eds) The Role of Smallholder Farms in Food and Nutrition
Security. Springer, Cham. https://doi.org/10.1007/978-3-030-42148-9_2.
Feed the Future Mozambique Agricultural Innovations Activity (FTF Inova) (2017). Value Chain
Analysis. August 2017. Report prepared by DAI Global for USAID. Available for download at
https://beamexchange.org/resources/1082/
Financial Sector Deepening Mozambique (FSDMoç) (2020). Finscope 2019 Analise dos dados do
genero. Maputo: FSDMoç . http://fsdmoc.com/wp-content/uploads/2020/12/FinScope-Gender-
Lens-09.12.20.pdf
FinScope (2019). Analise dos dados do genero”. Maputo, 09 Dezembro de 2020. Accessed 28
March 2021 at http://fsdmoc.com/wp-content/uploads/2020/12/FinScope-Gender-Lens-
09.12.20.pdf.
Fitchett, Jennifer (2019). “Why the Indian Ocean is spawning strong and deadly tropical cyclones”.
The Conversation, May 8, 2019 (https://theconversation.com/why-the-indian-ocean-is-spawning-
strong-and-deadly-tropical-cyclones-116559).
Ford, M. (2015). “The Rise of the Robots: Technology and the Threat of a Jobless Future.” Basic
Books. New York.
Galli, Michelle (2019). “Sesame value chain analysis and opportunity for development in
Mozambique: Final Report”. Environomica Consulting. Produce for the European Committee for
Training and Agriculture (CEFA).
Global Alliance for Improved Nutrition (GAIN). 2020. Food Packaging in Mozambique: Value
chain analysis and market assessment. Report prepared by KPMG. Maputo: GAIN.
GMSA Connected Women (2015). “Women and mobile money: Insights from Kenya.” Accessed 28
March 2021 at https://www.gsma.com/mobilefordevelopment/wp-
content/uploads/2016/02/Connected-Women-Women-and-Mobile-Money-Insights-from-Kenya-
Nov15.pdf.
Haggblade, S., P.B.R. Hazell, and T. Reardon, eds. (2007). “Transforming the Rural Nonfarm
Economy: Opportunities and Threats in the Developing World.” Johns Hopkins University Press.
Baltimore.
Hallward-Driemeier, M. and G. Nayyar (2018). “Trouble in the making? The future of
manufacturing-led development.” Washington, D.C.: World Bank. Doi: 10/1596/978-1-4648-1174-
6.
Harris, D., J. Chamberlin, and K. Mausch (2019). “Can African smallholders farm themselves out of
poverty?” The Conversation. Dec 11, 2019. https://theconversation.com/can-african-smallholders-
farm-themselves-out-of-poverty-126692.

56
Hazell, Peter (2017). “Why an inclusive agricultural transformation is Africa’s way forward”, chapter
1 in AGRA, AFRICA AGRICULTURE STATUS REPORT 2017: The Business of Smallholder
Agriculture in Sub-Saharan Africa.
Hazell, P. (2020). “Importance of Smallholder Farms as a Relevant Strategy to Increase Food
Security”. In: Gomez y Paloma S., Riesgo L., Louhichi K. (eds) The Role of Smallholder Farms in
Food and Nutrition Security. Springer, Cham. https://doi.org/10.1007/978-3-030-42148-9_2.
Helvetas (2019). “Sharing Report on the Aflatoxin Study”. Accessed at
https://www.helvetas.org/en/mozambique/who-we-are/follow-us/press-releases/Sharing-report-
on-the-Aflatoxin-Study_pressrelease_5798
International Development Enterprises (iDE) (2018). “Strengthening the Missing Middle in
Agribusiness for Rapid Transformation.” SMART 2017 Progress report. Chimoio, Mozambique:
IDE Mozambique
IFAD (2020). “Living up to the challenge of creating market linkages in Mozambique”. PROMER
project news brief. Available at https://www.ifad.org/en/web/latest/story/asset/39129424.
IFAD (2019). “Creating opportunities for rural youth.” 2019 Rural Development Report. IFAD.
Rome.
IITA (2020). “SEMEAR Annual Report for FY20: October 2019 – September 2020 and Final
Project Report October 2015 – September 2020”. Mozambique: IITA.
IMF (2020). “Regional Economic Outlook June 2020 Update: Sub-Saharan Africa”. Retrieved from
https://data.imf.org/?sk=5778F645-51FB-4F37-A775-B8FECD6BC69B.
Instituto de Algodão e Oleaginosas de Moçambique (IAOM) (2021). Documento de recolha de
informação para elaboração da proposta do Regulamento de Oleaginosas.. Maputo: IAOM.
Instituto Internacional de Agricultura Tropical (IITA). 2018. “Manual de Producao e
Comercializacao de Semente”. Maputo: IITA. https://aprose.org/wp-
content/uploads/2020/02/Manual-de-produção-e-comercialização-de-sementes.pdf.
Instituto Nacional de Estatisticas (INE) (2009). Inquérito aos Agregados Familiares (IAF) 2009.
Maputo: INE.
Jasse, Aladino (2013). “Cadeias de valor de cereais e oleaginosas: Relatório de consultoria do estudo
de cadeias de valor de cereais e oleaginosas, província de Sofala, distrito de Nhamatanda”. Perene
Consultoria. Maputo.
Jayne, T.S., M.Muyanga, A. Wineman, H. Ghebru, C. Stevens, M. Stickler, A. Chapoto, W. Anseeuw,
D. van der Westhuizen, and D. Nyange (2019). Are medium-scale farms driving agricultural
transformation in sub-Saharan Africa? Agricultural Economics. 50: 75-95.
Kinfemichael, B. and A.K.M. Morshed (2019). “Unconditional Convergence of Labor Productivity
in the Service Sector”. Journal of Macroeconomics, 59. 217-229.

57
Kleih, Ulrich, David Phillips, Marian Tandoh Wordey, Gregory Komlaga (2013). Cassava Market
and Value Chain Analysis Ghana Case Study. Final Report (Anonymised version) Report prepared
for CAVA. Greenwich, U.K.: Natural Resources Institute.
https://cavaa.nri.org/images/documents/publications/ GhanaCassavaMarketStudy-
FinalFebruary2013_anonymised-version.pdf
Lachler, U. and F. Ricaldi (2021). “Jobs Diagnostic Mozambique: Volume 2 - Jobs Strategy Policy
Note”. World Bank, Washington, DC. License: Creative Commons Attribution CC BY 3.0 IGO.
Land O’Lakes/Venture 37 (2020). Mozambique / RAMA-BC Resilient Agricultural Market
Activities Beira Corridor Annual report 2019. Minnesota: Land O’Lakes/Venture 37. Accessed at
https://beamexchange.org/resources/1305/
Malabo Montpellier Panel (2020). “Trading Up: Policy innovations to expand food and agricultural
trade in Africa”. Dakar, Senegal: AKADEMIYA2063.
Mata, Ruth, W. Grant, Vletter F. Howard S. (2020). Flagship Programme for Youth and Women
Empowerment in Agriculture in Northern and Central Mozambique. Prepared for the Ministry of
Agriculture and Rural Development by ELIM Serviços, Lda. Financed by AGRA. Maputo: ELIM
Serviços, Lda.
McMillan, M., D. Rodrik, and C. Sepulveda (2017). “Structural Change, Fundamentals and Growth:
A Framework and Case Studies”. Working paper 23378. National Bureau of Economic Research.
Doi: 10.3386/w23378.
Ministério de Agricultura e Segurança Alimentar/Departamento de Planeamento e Cooperação
Internacional (MASA/DPCI) (2012). Inquérito Agrário Integrado 2012. Maputo: MASA/DPCI.
Ministério de Agricultura e Segurança Alimentar/Departamento de Planeamento e Cooperação
Internacional (MASA/DPCI) (2017). Inquérito Agrário Integrado 2017. Maputo: MASA/DPCI.
Monitor Deloitte and FSDMoçambique (2016). Investment opportunities in Mozambique:
Agribusiness edition. October. Report for the Maputo: Monitor Deloitte and Financial Sector
Deepening (FSD) Moçambique. Available at
https://www2.deloitte.com/content/dam/Deloitte/za/Documents/finance/MZ_Monitor-
Deloitte_021116.pdf
Nakasone, E. and Torero, M. 2016. “A Text Message Away: ICTs as a tool to improve food
security”. Agricultural Economics, 47 (S1): 49-59.
Nuhu, Ahmed, S. Liverpool-Tasie, T. Awokuse, S. Kabwe (2021). “Do benefits of expanded
midstream activities in crop value chains accrue to smallholder farmers? Evidence from Zambia.”
World Development. 143.
OECD/SWAC (2020). “Africa's Urbanisation Dynamics 2020: Africapolis, Mapping a New Urban
Geography”. West African Studies, OECD Publishing, Paris, https://doi.org/10.1787/b6bccb81-
en.

58
Reardon, T., D. Tschirley, L.S. Liverpool-Tasie, T. Awokuse, J. FAnzo, B. Minten, R. Vos, M.
Dolislager, C. Sauer, R. Dhar, C. Vargas, A. Lartey, A. Raza, B. Popkin (2021). “The processed food
revolution in African food systems and the double burden of malnutrition”. Global Food Security, 28.
Rodrik, D. (2015). “Premature Deindustrialization.” Working Paper 20935. National Bureau of
Economic Research.
Roe, Alan (2018). “Mining, Oil & Gas: Issues for African Economies.” Presentation in Maputo,
November 28, 2018. Accessed at
https://igmozambique.wider.unu.edu/sites/default/files/Event/Roe_Alan.pdf.
SNV (2018). Final evaluation of the SNV: Opportunities for Youth Employment (OYE) project in
Tanzania, Rwanda and Mozambique.
Sumberg, James, Nana Akua Anyidoho, Michael Chasukwa, Blessings Chinsinga, Jennifer Leavy,
Getnet Tadele, Stephen Whitfield, and Joseph Yaro (2014). Young people, agriculture, and
employment in rural Africa. Wider Report 2014-080. United Nations: World Institute for
Development Economics Research.
Tschirley, D., T. Reardon, M. Dolislager, and J. Snyder (2015a). “The Rise of a Middle Class in East
and Southern Africa: Implications for Food System Transformation.” Journal of International
Development, 27(5) July: 628-646.
Tschirley, D., J. Snyder, J. Goeb, M. Dolislager, T. Reardon, S. Haggblade, L. Traub, F. Ejobi, F.
Meyer (2015b). “Africa’s Unfolding Diet Transformation: Implications for Agrifood System
Employment.” Journal of Agribusiness in Developing and Emerging Economies, 5(2).
Tschirley, D., Kondo, M., and Snyder, J. (2016). “Policy and Foresighting Analysis: Downstream
Report”. Chapter 3 in Allen et al., Eds., Agrifood Youth Employment and Engagement Study.
Prepared for The MasterCard Foundation.
Tschirley, D., R. Uaiene, B. Cunguara, and E. Cavane (2017). “Estudo para a identificacao e desenho
de intervenções de desenvolvimento no âmbito do 110 Fundo Europeu para o Desenvolvimento:
Componente: Producao Agrícola e Produtividade”. Report produced for the European Union
mission, Mozambique
Tschirley, D., N. Bricas, C. Sauer, and T. Tschirley (2020). “Opportunities in Africa’s Growing
Urban Food Market”. Chapter 2 in “Africa Agriculture Status Report. Feeding Africa’s Cities:
Opportunities, Challenges, and Policies for Linking African Farmers with Growing Urban Food
Markets (Issue 8)”. Nairobi, Kenya: Alliance for a Green Revolution in Africa (AGRA)
UNIDO (2021). Tanzania’s sunflower oil producers come into bloom. Webpage news article.
Accessed at https://www.unido.org/news/tanzanias-sunflower-oil-producers-come-bloom .
United Republic of Tanzania (2015). “Sunflower sector development strategy, 2016-2020.”
International Trade Center. Downloaded on May 12, 2021 at
http://unossc1.undp.org/sscexpo/content/ssc/library/solutions/partners/expo/2016/GSSD%20
Expo%20Dubai%202016%20PPT/Day%202_November%201/SF%204_Room%20D_ITC/Value

59
%20chain%20roadmaps/Tanzania/Tanzania%20Sunflower%20Sector%20Development%20Strateg
y.pdf.
Van Campenhout, B., Spielman, D. and Lecoutere, E. (2018). “The Role of Gender in ICT-mediated
Agricultural Information Campaigns”. 2018 Conference of the International Association of
Agricultural Economists. Vancouver, BC, Canada (available at : RePEc :ag s:ia ae18:277438).
Van de Walle, N. (2001). “African economies and the politics of permanent crisis, 1979-1999.”
Cambridge University Press.
van der Westhuizen, D., Jayne, T., Meyer, F., & van Niekerk, J. (2018). Causes and Consequences of
Rising Tractor Use in Sub-Saharan Africa: Evidence from Tanzania. Paper presented at the
International Conference of Agricultural Economists, Vancouver, Canada, July 30, 2018.
Wineman, A., Jayne, T., Isinika-Modamba, E., & Kray, H. (2018). The changing face of Tanzanian
agriculture. Selected presentation at the Sustainability and Development Conference, November 9-
11, 2018, Ann Arbor, Michigan.
World Bank (2021). Final Consumption Expenditure Data. Accessed at data.worldbank.org
World Bank (2020a). “Mocambique: Efeitos da COVID-19 no sector privado e avaliacão das
medidas”. World Bank Group. October, 2020.
World Bank (2020b). Nutrition Smart Agriculture in Mozambique. Washington, DC: World Bank.
Available at https://documents.worldbank.org/en/publication/documents-
reports/documentdetail/392721597038541068/Nutrition-Smart-Agriculture-in-Mozambique
World Bank (2020c). Training paired with masks: resilience building for women entrepreneurs in
Mozambique. Washington, DC: Women Entrepreneurs Finance Initiative Secretariat. Accessed at
https://we-fi.org/building-resilience-in-mozambique-gender-centered-design-training/
World Bank (2020d). Women Entrepreneurs Finance Initiative (We-Fi) Fact Sheet. Washington,
DC: Women Entrepreneurs Finance Initiative Secretariat. Accessed at https://we-fi.org/fact-sheet/
World Bank (2019a). Doing Business in Mozambique. Washington, D.C.: World Bank. License:
Creative Commons Attribution CC BY 3.0 IGO . Accessed at
https://www.doingbusiness.org/content/dam/doingBusiness/media/Miscellaneous/SubNational/
Doing-Business-in-Mozambique-2019_Eng.pdf
World Bank (2019b). “World Development Report 2019: The Changing Nature of Work”.
Washington, DC: World Bank. doi:10.1596/978-1-4648-1328-3.
World Bank (2018). “Port development and competition in East and Southern Africa: Prospects and
challenges.” World Bank, Washington, DC.

60
Annexes
A. Google Survey Instrument for Key Informants 2020 and Google
Survey Results
B. Persons Consulted
C. Thematic References
D. Maps of Mozambique
E. Road Projects in Zambézia and Nampula Over the Past Five
Years, and Perspectives on Adequacy of Roads Infrastructure
F. TIA Results
G. Mozambique projects listing

ANNEX A: Google Survey of Key Informants
The Google survey was prepared by ELIM Lda in collaboration with MSU researchers. The online survey was selected for its speed in delivery and ease of analysis. The survey was sent out by email to 58 people in December 2020 with a request to complete the Google Survey online and 18 people responded (Table 1). The response rate was less than 50% and we should take any quantitative results with a grain salt due to potential bias and limited information. However, the insights provided by the responders are valuable, and a few are extracted here. The survey instrument can be found in this Annex, and Table 2 reports the results on ranking criteria and overall ranking.
As shown in the instrument, 19 projects past and present were identified as important agricultural and rural development projects in recent history, and a few have been extended into the present time. The researchers selected projects not based on their perceived performance, but rather on projects that covered a range of approaches and objectives, with a variety of funding sources and locations. Informants were first asked if they were familiar with each one. For those projects that they were familiar with, we asked key informants to assess the project on a 1-3 scale of high, medium, low impact based on the following question: “How would you rank the impact of the project you are familiar with in terms of {aspect}?” The aspects covered were agricultural productivity, farmer access to markets, farmer incomes, household food security and nutrition, job creation, inclusion of women, and inclusion of youth. Respondents could indicate lack of familiarity with project as well. The final ranking question asked about the overall impact of the project/program and there were four possible responses: Very positive, impactful; Somehow impactful; Left no benefits/impact; and Negative benefits/impact. Then they were asked to indicate what project they would rank as the first most successful and why. Second and third most successful were then identified as well. The results table appears below in Table 2.
PARTI, iDE Smart, and Rural Finance were the lesser known projects on the list. SUSTENTA, Agrifuturo, SEMEAR, Beira Corridor, INOVA, and Inovagro known by almost all. The list of respondents included project implementers with good knowledge/insiders of programs as well as consultants. It is also important to note that the ability of a program to communicate its activities will make it more known and potentially perceived as effective. Sustenta, World Bank Growth Poles, Agrifuturo, and several other USAID projects had communication campaigns with greater profile than those funded by donors such as SDC, SIDA, CIDA, and the Netherlands.
The projects highlighted in yellow in Table 2 have an average rank that is above the average for all projects for a given aspect. Many projects did well in productivity and access, but for other aspects, the numbers are generally lower. The orange fleshed sweet potato (OFSP) project received good scores across the board. Parti had good scores, but few people knew it. World Bank Growth Poles, Rural Finance and PROMER did fairly well especially for job creation. INOVA, InovAgro, RAMA NC and PROSUL were not always as highly rated, although some people selected them as one of their top 3 projects.
Based on the overall impact question. the most impactful projects were the following: InovAgro, OFSP, SEMEAR, PROMER, SUSTENTA, FINAGRO, INOVA, SPEED+, iDE Smart and Seed Trade. SPEED+ did not rank highly on any specific aspects in this survey, but that can be expected with a policy project that does not have household level direct impacts as key objectives.

Looking at the projects that received rankings of 1, 2 or 3, there are various ways to evaluate this. The following project received above average total rank: InovAgro, OFSP, SEMEAR, PROMER, GrowthPoles, SUSTENTA, FINAGRO, INOVA.
OFSP received the greatest number of No1 rankings, with experts indicating its success for taking a value chain approach and working from production to marketing to consumption, developing all to create sustainable value chain development. FINAGRO received a No1 ranking or No.2 ranking 8 times (a few times jointly ranked counted as 0.5 time). “FinAgro was a well managed project providing large number of targeted grants to broad range of well selected medium scale agri entrepreneurs,” as one respondent indicated.
In the questions on which project no.1, no. 2 and no.3, there were some interesting responses. A few selected ones: 1) Rank 2: “World Bank Growth Poles supported some real stinkers (poorly selected) but also got substantial resources into some very successful companies that were leaders in new growth industries.” The same person mentioned: Rank 3: “ADVZ tractor services were on the right track, but the Dutch IPWEU tractor project was better managed and more successful. “ IPWEU was not on our list. 2) PROMER got good marks because Rank 1: “PROMER. The program is holistic and tries to support pro-poor interventions supporting private sector and infrastructure development “ and Rank 2: “PROMER - 1. Support to rural markets is crucial for most agricultural value chains to succeed. The market needs both policy incentives and a government favourable intervention to make sure smallholder producers do get priced out by foreign dealers who influence prices. 3. Contract farming promoted by PROMER is a good approach to ensure price stability.” Rank 2: “PROMER Tried to cater for the value chain. Financing was too much constrained to rules that are not commercially attractive” 3) As expected there were comments supporting SUSTENTA. Examples: Rank 1 “SUSTENTA- Because of the integration of smalholders into the investiments [sic] through medium scale farmer”. Rank 1: “Sustenta because is the main program of the MITADER where the concept to develop sustainable local rural entrepreneurs is the key for rural development of remote communities but also it is a program for integrating family farming into productive value chains, which aims to improve the quality of life of rural households by promoting sustainable agriculture (social, economic and environmental).” Rank 1: “SUSTENTA It has great coverage across the country. It covers not only agriculture production itself but the value chain. It can finance the local players” The following comment has both positive and negative of SUSTENTA: Rank 3: “The government’s SUSTENTA project has been impactful. Whether positive or negative is yet to be decided. As the lead in the overall government initiative to distribute heavily subsidized seeds and inputs to a limited number of farmers, it is in the process of destroying many of the nascent commercial market systems that have been developed In so doing, it is buying up all available certified (and not certified) seed in bulk orders which will remove them from the commercial channels to reach smallholders, thereby excluding the Smallholders to commercially access critical seeds. They are buying more “certified” seed than is available in the region, so they will certainly be buying and distributing lots of crop, as seed. This massive subsidized distribution will have a short term positive impact on many farmers, but it will do more in the long term to undermine the development of sound market systems in the rural areas.”

4) One respondent indicated (Rank 1) that “FinAgro/Agrifututo which constituted the basis for SUSTENTA. The way it was tailored allowed farmers to be linked with financial/technical services as well as markets for produce/inputs. (Value chain approach)”. “FINAGRO, Transparent management of all project cycle lead to good results” “Agrifuture - was a good attempt to promote commercial farmers of some value chains, by linking them with national and international farmers. Indeed agriculture development should be result of development of every single value chain, taking the advantage of land potential, market opportunities.” “FINAGRO- Investment into local entrepreneurs’ interest to grow locally” 5) A longer comment: Rank 1: “I cannot comment on the different dimensions of the project, because I don’t have enough data on them. It would be unprofessional to comment on such specific questions without access to program data. I think the projects that tried to support MSMEs through a combination of technical assistance and access to capital have been the most successful. I would therefore rank FinAgro, Sustenta, the WB Growth Poles Project and also Agrifuturo as the more successful ones.”

Table 1 Respondents to Google Survey 2020 # Respondents Institution/Role
1 Marco Machado Independent
2 William Grant DAI/Inovagro
3 Sueia Hermes Independent consultant
4
Ivan Donduro
Mozambique Monitoring and
Evaluation Mechanism and
Services (MMEMS)
5 Alexandre dos Santos Matharia Emp
6 Julius Mapanga (Seedmarketing) Klein Karoo (K2)
7 Ventura Mufume World Bank
8 Stefano Gasparini iDE Global
9 Jake Walters Independent consultant
10 Jane Grob Technoserve (TNS)
11 Farai Muchiguel Adra Mozambique
12 Tatenda Mutenga ConsultUs Mozambique
13 Paulo Mole AGRA
14
Antonion Zaqueu
Foundation for Community
Development (FDC)
15 Ismenio Armando Sustenta
16 Sergio Macuacua Moz Target Service Ltda
17 Moamba Carlos Seed Trade
18 Tim Born Independent Consultant
Although the number of respondents to the survey were low, some key informant interviews were also conducted after the questionnaire to get in-depth information for each of the selected value chains.

Table 2 Key informant Project Scoring
Ranking of projects
Project
KNOW
PROJECT
Farm
productivity
Farmer
access to
markets
Farmer
Incomes
Household
food security
and nutrition
Rural job
creation
Inclusivity of
women
Inclusivity of
youth
Overall
Impact
score
Number of
times
selected as
number 1
Number of
times
selected as
number 2
Number of
times
selected as 3
Sum of
rank/Number
of votes
InovAgro 16 2.9 3.3 2.5 2.4 2.4 2.5 2.9 3.8 2.0 1.0 2.67
OFSP 14 3.6 2.7 3.3 4.0 2.8 4.1 3.0 3.8 4.0 1.0 1.0 2.50
SEMEAR 16 3.3 2.2 2.4 2.4 1.8 2.5 2.4 3.9 2.0 1.0 2.33
PROMER 14 3.1 3.8 3.0 2.4 3.2 2.7 3.0 3.7 1.0 2.0 2.33
GrowthPoles 11 3.4 3.3 2.8 2.8 3.3 2.5 2.6 3.5 1.5 2.0 2.13
SUSTENTA 17 2.8 2.6 2.6 2.2 2.9 2.6 3.5 3.8 3.5 1.5 2.00
FINAGRO 14 3.8 3.4 2.5 2.8 3.0 2.8 2.7 3.7 3.0 2.5 2.00
INOVA 16 3.0 2.7 2.3 2.0 2.5 2.7 2.6 3.8 2.0 1.0 1.67
AGRIFUTURO 16 2.7 3.3 2.5 2.7 2.9 2.7 2.5 3.1 1.0 2.5 1.60
PROSUL 13 2.9 2.8 3.0 2.8 3.0 2.8 3.0 3.5 2.0 0.5 1.50
IDESMART 7 3.3 3.6 3.0 2.4 2.7 2.7 2.4 4.0 1.0 1.5 1.17
PARTI 4 3.0 3.8 3.4 3.5 2.5 2.5 2.5 3.0 1.0 1.00
BEIRACORREDOR 16 2.3 2.7 2.4 2.3 2.5 2.4 2.5 3.3 1.0 1.00
RuralFinance 8 3.3 3.3 3.0 3.0 3.2 3.0 3.0 3.3 1.0 1.00
AZAMB 12 3.0 3.0 2.8 2.8 2.7 2.5 3.2 3.3 4.0 1.00
SPEED 14 2.0 2.0 1.8 1.7 1.6 1.8 2.0 3.8 0.5 0.50
RAMANC 12 2.6 2.4 1.8 2.3 1.9 2.8 2.8 3.3
PROIRRI 13 2.6 1.8 2.1 2.3 2.1 2.2 2.5 3.5
SeedTrade 10 2.3 2.3 2.0 2.5 1.5 2.0 2.5 3.7
Overall Max 3.8 3.8 3.4 4.0 3.3 4.1 3.5 4.0 2.7
Overall average 2.9 2.9 2.6 2.6 2.5 2.6 2.7 3.6 1.6
4
Yellow highlighting indicates score is above Avg Orange highlighting indicates score fewer than 10 people knew of the project
Sum of impact scores determined by valuing responses: High=3; Medium=2; Low=1
For the overall impact, Very impactful-=5, Impactful/Good=4; Poor/low impact=3; No impact=2; Negative impact=1.
For the sum of rank/number of votes: for each No.1 vote= 3; for each No.2 vote= 2; each No.3 vote=1. The sum is then divided by the number of votes to determine average rank.
When the vote on rank waas split between projects, each porject got a 0.5 vote for that rank. For example, one respondent ranked FinAgro and Agrifuturo as No.1, so each got 0.5 count for No.1.
Source: ELIM/MSU Google Survey, Dec 2020.
Impact scores on selected aspects/objectives

INTRODUCTIONELIM Serviços in collaboration with Michigan State University is carrying out a quick assignment to assist in developing case studies of recent agricultural programmes/projects by key donors or public sector in Mozambique.
USAID is in the process of identifying investment priorities in the agriculture sector to inform its support for the sector in the next 5 years for the region. A review of the projects implemented in the last 20 years, the identiKcation oflessons learned and possible areas of interventions for the future is underway.Your are being asked to participate in this brief online study, based on your contributions as a development practitioner in Mozambique. You will be asked to answer a series of 15 questions. Your participation is voluntary. You can skip any question you do not wish to answer or you can withdraw before you submit your survey. would be highly appreciated to ensure investments in Mozambique are made where needed in the agriculture sector. Your responses will be analysed anonymously. You must be 18 or older to participate. You indicate that you voluntarily agree to participate in this research study by submitting the survey. Please complete the questionnaire by the 13th of December and submit it online. Any request for information can be sent to [email protected] Thank you in advance.
USAID Agriculture Investment PrioritiesAssessment* Required
Are you familiar with any of the projects listed below? *
Yes No
InovAgro
SUSTENTA
RAMA-NC Winrock
MERCADO: MozambiqueExpansion of Rural Cattle andDairy Opportunities
ProIrri Sustainable IrrigationDevelopment
Agrifuturo
SPEED and SPEED+
Southern Africa Seed TradeProject
Semear
PARTI: Plataforma
FTF Inova
FinAgro
World Bank IntegratedGrowth Poles Project
PROSUL
PROMER
Agricultural developmentproject in Beira corridor
Rural Finance Support
Market-led Smallholder Dev.in Zambeze V.
Orange aesh Potato project
How would you rank the impact of the project you are familiar with in terms ofagricultural productivity? *
High Medium LowI am not familiarwith the project
InovAgro
SUSTENTA
RAMA-NCWinrock
ProIrriSustainableIrrigationDevelopment
Agrifuturo
SPEED andSPEED+
Southern AfricaSeed TradeProject
Semear
PARTI:Plataforma
FTF Inova
FinAgro
World BankIntegratedGrowth PolesProject
PROSUL
PROMER
Agriculturaldevelopmentproject in Beiracorridor
Rural Knancesupport
Market-ledsmallholder Dev.in Zambezi V.
Orange aeshpotato project
How would you rank the impact of the project you are familiar with in terms offarmer access to markets? *
High Medium LowIam not familiarwith the project
InovAgro
SUSTENTA
RAMA-NCWinrock
ProIrriSustainableIrrigationDevelopment
Agrifuturo
SPEED andSPEED+
Southern AfricaSeed TradeProject
Semear
PARTI:Plataforma
FTF Inova
FinAgro
World BankIntegratedGrowth PolesProject
PROSUL
PROMER
Agriculturaldevelopmentproject in Beiracorridor
Rural FinanceSupport
Market-ledSmallholder Dev.in Zambeze V.
orange aeshpotato project
How would you rank the impact of the project you are familiar with in terms offarmer incomes? *
High Medium LowI am not familiarwith the project
InovAgro
SUSTENTA
RAMA-NCWinrock
ProIrriSustainableIrrigationDevelopment
Agrifuturo
SPEED andSPEED+
Southern AfricaSeed TradeProject
Semear
PARTI:Plataforma
FTF Inova
FinAgro
World BankIntegratedGrowth PolesProject
PROSUL
PROMER
Agriculturaldevelopmentproject in Beiracorridor
Rural FinanceSupport
Market-ledSmallholder Dev.in Zambeze V.
orange aeshpotato project
How would you rank the impact of the project you are familiar with in terms ofhousehold food security and nutrition? *
High Medium LowI am not familiarwith the project
InovAgro
SUSTENTA
RAMA-NCWinrock
ProIrriSustainableIrrigationDevelopment
Agrifuturo
SPEED andSPEED+
Southern AfricaSeed TradeProject
Semear
PARTI:Plataforma
FTF Inova
FinAgro
World BankIntegratedGrowth PolesProject
PROSUL
PROMER
Agriculturaldevelopmentproject in Beiracorridor
Rural FinanceSupport
Market-ledSmallholder Dev.in Zambeze V.
orange aeshpotato project
InovAgro
SUSTENTA
RAMA-NCWinrock
ProIrriSustainableIrrigationDevelopment
Agrifuturo
SPEED andSPEED+
Southern AfricaSeed TradeProject
Semear
PARTI:Plataforma
FTF Inova
FinAgro
World BankIntegratedGrowth PolesProject
PROSUL
PROMER
Agriculturaldevelopmentproject in Beiracorridor
Rural FinanceSupport
Market-ledSmallholder Dev.in Zambeze V.
orange aeshpotato project
How would you rank the impact of the project you are familiar with in terms ofrural job creation? *
High Medium LowI am not familiarwith the project
InovAgro
SUSTENTA
RAMA-NCWinrock
ProIrriSustainableIrrigationDevelopment
Agrifuturo
SPEED andSPEED+
Southern AfricaSeed TradeProject
Semear
PARTI:Plataforma
FTF Inova
FinAgro
World BankIntegratedGrowth PolesProject
PROSUL
PROMER
Agriculturaldevelopmentproject in Beiracorridor
Rural FinanceSupport
Market-ledSmallholder Dev.in Zambeze V.
orange aeshpotato project
InovAgro
SUSTENTA
RAMA-NCWinrock
ProIrriSustainableIrrigationDevelopment
Agrifuturo
SPEED andSPEED+
Southern AfricaSeed TradeProject
Semear
PARTI:Plataforma
FTF Inova
FinAgro
World BankIntegratedGrowth PolesProject
PROSUL
PROMER
Agriculturaldevelopmentproject in Beiracorridor
Rural FinanceSupport
Market-ledSmallholder Dev.in Zambeze V.
orange aeshpotato project
How would you rank the impact of the project you are familiar with in terms ofinclusivity of women? *
High Medium LowI am not familiarwith the project
InovAgro
SUSTENTA
RAMA-NCWinrock
ProIrriSustainableIrrigationDevelopment
Agrifuturo
SPEED andSPEED+
Southern AfricaSeed TradeProject
Semear
PARTI:Plataforma
FTF Inova
FinAgro
World BankIntegratedGrowth PolesProject
PROSUL
PROMER
Agriculturaldevelopmentproject in Beiracorridor
Rural Knancesupport
Market-ledsmallholder devin Zambeze V.
orange aeshpotato project
How would you rank the impact of the project you are familiar with in terms ofinclusivity of youth? *
High Medium LowI am not familiarwith the project
InovAgro
SUSTENTA
RAMA-NCWinrock
ProIrriSustainableIrrigationDevelopment
Agrifuturo
SPEED andSPEED+
Southern AfricaSeed TradeProject
Semear
PARTI:Plataforma
FTF Inova
FinAgro
World BankIntegratedGrowth PolesProject
PROSUL
PROMER
Agriculturaldevelopmentproject in Beiracorridor
Rural Knancesupport
Market-ledsmallholder dev.in Zambeze V.
orange aeshpotato project
Are you able to see the impact of this projects? Please rank this project *
Very positive,Impactful
SomehowImpactful
Left nobeneKts/Impact
NegativebeneKts/Impact
InovAgro
SUSTENTA
RAMA-NCWinrock
ProIrriSustainableIrrigationDevelopment
Agrifuturo
SPEED andSPEED+
Southern AfricaSeed TradeProject
Semear
PARTI:Plataforma
FTF Inova
FinAgro
World BankIntegratedGrowth PolesProject
PROSUL
PROMER
Agriculturaldevelopmentproject in Beiracorridor
Rural Knancesupport
Markets-ledsmallholder dev.in Zambeze V.
orange aeshpotato project
Of the projects you ranked, which would you put 1st in being the most successfuland why? *
Your answer
Of the projects you ranked, which would you put 2nd in being the mostsuccessful and why? *
Your answer
Of the projects you ranked, which would you put 3rd in being the mostsuccessful and why? *
Your answer
Please provide any contact information (email/phone number) for any individualswho were part of the projects you ranked 1st to 3rd and are likely to haveprogram documentation. *
Your answer
What characteristics should be part of an upcoming agriculture developmentprogramme to contribute towards food production, income generation, jobcreation and agribusiness growth? *
Your answer
Which value chains and services should be prioritized? *
Your answer
Any additional contributions you may have towards the improvement of thecurrent agriculture sector?

Never submit passwords through Google Forms.
This form was created inside of ELIM Servicos Lda. Report Abuse
current agriculture sector?
Your answer
Submit
Forms

Annex B: Persons Consulted*
Name Affiliation
Pedro Arlindo World BankSteve Boahen IITATim Born IndependentBenedito Cunguara UEMOlga Faftine IIAMStefano Gasparini iDE SMARTKaj Gass MCC MozambiquePeter Goldsmith FTF Soybean Innovation LabBill Grant DAIHipolito Hamela IndependentDavid Hoisington FTF Peanut Innovation Lab Carla Honwana PROMERMike Jahme Westfalia FruitRicardo Maria IIAM
Florenica Massango
Direcção de Sanidade Agropecuária e Biossegurança do Ministério da Agricultura
Kenneth Miller MCC/MozambiquePaulo Mole AGRAFrancisco Nhanale SolidaridadJan Nijhoff World BankJamie Rhoads FTF Peanut Innovation Lab Rui Santana Afonso AgriterraRafael Uaiene SPEED+Stu Valintine Rainforest Alliance consultant, forestryHeinrich Van de Merwe African. Or is it Agricom?Jake Walter Independent
* This is in addition to those who responded to the Google Survey

Annex C Thematic References
Themes
1. General Moz info ................................................................................................................................. 2
2. Finance: ................................................................................................................................................. 2
3. VC prioritization................................................................................................................................... 2
4. Inputs/fertilizers................................................................................................................................... 3
5. Seeds ...................................................................................................................................................... 4
6. Extension/Advisory Services .............................................................................................................. 4
7. Statistics: ................................................................................................................................................ 5
8. Poverty .................................................................................................................................................. 5
9. Moz growth and development ............................................................................................................ 5
10. Digital Agric: ..................................................................................................................................... 6
11. Projects/evaluations ......................................................................................................................... 6
12. Linkages SHF, SMEs and large scale .............................................................................................. 7
13. Farmer organizations ....................................................................................................................... 7
14. Mechanization................................................................................................................................... 7
15. Macadamia nuts: ............................................................................................................................... 7
16. Maize ................................................................................................................................................. 8
17. Soybean ............................................................................................................................................. 8
18. Forest and forest based products (nontimber products) (also agroforestry)............................... 8
19. Poultry ............................................................................................................................................... 8
20. Small animals and other livestock ................................................................................................... 9
21. Horticulture ...................................................................................................................................... 9
22. Cashews: ............................................................................................................................................ 9
23. Bananas ............................................................................................................................................. 9
24. Pigeon peas ..................................................................................................................................... 10
25. Legumes .......................................................................................................................................... 10
26. Groundnuts..................................................................................................................................... 10
27. Women and Youth ......................................................................................................................... 11
28. Nutrition/Diets .............................................................................................................................. 11
29. COVID ........................................................................................................................................... 12
30. Food systems/Food processing .................................................................................................... 12

31. Emergency responses ..................................................................................................................... 12
32. Market/Business Analyses ............................................................................................................. 12
33. Cassava ............................................................................................................................................ 13
1. General Moz info
EDG. (2004). Evaluation of the Mozambique Community Land Use Fund Final Report. EDG Group.
FEWS NET. (2018). Mozambique Staple Food Market Fundamentals Washington DC: Famine Early Warning Systems Network. FEWS NET.
ReSAKSS. (2021). Mozambique e-atlas.
Vilissa D., Wilson D., Nhlengethwa S., Matchaya G.,& Cadoso, S. (2020). CAAP Biennial Review Briefing Note: Performance, Key Lessons, Best Practices and Recommendations for Improving Progress Towards Agricultural Transformation in Mozambique.
2. Finance:
Batista, C., & Vicente, P. C. (2013). Introducing mobile money in rural Mozambique: Evidence from a field experiment. NOVAFRICA Working Paper Series WP 1301, Universidade Nova de Lisboa, Faculdade de Economia, NOVAFRICA.
Bear, M., & William, G. (2020). Facilitating Inclusive Growth in Ethiopia. Think Systemically, Act Strategically, Adjust Frequently for Best Results Enterprise Partners Programme, 2013-2020. Enterprise Partners.
Benami, E., & Carter, M. R. (2021). Can digital technologies reshape rural microfinance? Implications for savings, credit, & insurance. Applied Economic Perspectives and Policy .
Finmark Trust. (2019). 2019 Finscope Consumer Survey Report. Report in collaboration with FSD Moc. Maputo: Finmark Trust.
FSDMoç. (2018). Evaluation of Mobile Money Uptake – FSDMoç. Maputo: Maraxis Mobile Solutions with Financial Sector Deepening Mozambique (FSD Moç) program .
Mutondo, J., Villisa, D., Matchaya, G., Wilson, D., Nhlengethwa, S., & Nhemachena, C. (2019). The Challenges of Access to Financial Services in the Agricultural Sector in Mozambique.
Velthausz, D., and Donco, R. (2018). Evaluation of Mobile Money Uptake – FSDMoç. Executive Summary. Maputo: Maraxis Mobile Solutions .
3. VC prioritization
ACDI/VOCA. (2016). Mozambique Agricultural Value Chain Analysis. LEO Report # 31. Report prepared for USAID. Maputo.

Bah, E. H., & Gajigo, O. (2019). Improving the poultry value chain in Mozambique. African Development Bank .
Cambridge Economic Policy Associates 2016. Agribusiness Country Diagnostic – Mozambique. Report for IFC, Global Agriculture and Food Security Program (GAFSP) Private Sector Window.
Feed the Future Mozambique Agricultural Innovations Activity (FTF Inova). (2017). Value Chain Analysis. August 2017. Report prepared by DAI Global for USAID.
GOM. 2012. Stimulating Private-Sector Agribusiness Investment in Mozambique: Multi-Stakeholder Action Plan. Powerpoint presentation. September. Maputo.
IFAD. (2019). Procava. Inclusive Agri-food Value-Chain Development Programme Project Design Report. Rome: IFAD.
McNamer, B. 2011. Fighting Poverty with Poultry in Mozambique. Solutions 2(3):18-20.
Monitor Deloitte & FSDMoçambique. (2016). Investment opportunities in Mozambique: Agribusiness edition. Report for the Maputo: Monitor Deloitte and Financial Sector Deepening (FSD) Mozambique.
Theriault V., Haggblade, S,. et al. 2014. Matrice de performance des chaînes de valeur agro-alimentaires au Mali. Report prepared for the Malian Delegation of the European Union. Michigan State University .
Walker, T. S., Pitoro, R., Tomo, A., Sitoe, I., Salencia, C., Mahanzule, R., & Mazuze, F. M. (2006). Priority setting for public-sector agricultural research in Mozambique with the National Agricultural Survey Data (No. 1093-2016-88001) .
4. Inputs/fertilizers
African Fertilizer & Agribusiness Partnership (AFAP). (2021). Mozambique: Working to End Hunger.
African Fertilizer & Agribusiness Partnership (AFAP). (2018). Mozambique Country Report.
AGRA. (2020). Evidence Based Policy Reform and Advocacy. Webinar held on December 16, 2020, hosted by AGRA.
Haggblade, H., Diarra, A., Jiang, W., Assima, A., Keita, A., Traore, A., & Traore, M. (2021) Fraudulent pesticides in West Africa: a quality assessment of glyphosate products in Mali, International Journal of Pest Management, 67:1, 32-45.
Kaizzi, C. K., Wondimu, B., Rware, H., Macharia, M., & CS, W. (2015). Optimizing fertilizer recommendations in Africa. In The 28th bi-annual conference of the soil science society of east Africa (SSSEA) & African celebration meeting of the international year of soil.
Maria, R., Americano, J., Matusso, J., & Gundana, C. (2017). 10. Optimizing fertilizer use within the context of integrated soil fertility management in Mozambique. Fertilizer use optimization in sub-saharan Africa, 9-19.
WFP, IFAD, & EU. (2020). Programme MDG1c Reducing Hunger in Mozambique: Case Study E-vouchers.

Wortmann, C. S., & Sones, K. R. (Eds.). (2017). Fertilizer use optimization in sub-Saharan Africa. CABI.
Zandamela, C. (2018). Experience in Setting a Fertilizer Platform in Mozambique.
Zavale, H., Matchaya, G., Vilissa, D., Nhemachena, C., Nhlengethwa, S., & Wilson, D. (2020). Dynamics of the Fertilizer Value Chain in Mozambique. Sustainability, 12(11), 4691.
5. Seeds
Adam, R. I., Sipalla, F., Muindi, P., & Kandiwa, V. (2019). Women in the maize seed business in East and Southern Africa.
AGRA. (2017). Seeding an African Green Revolution: The PASS Journey.
Akpo, E., Ojiewo, C. O., Kapran, I., Omoigui, L. O., Diama, A., & Varshney, R. K. (2020). Enhancing Smallholder Farmers' Access to Seed of Improved Legume Varieties Through Multi-stakeholder Platforms: Learning from the TLIII project Experiences in sub-Saharan Africa and South Asia.
Brearley, E. & Kramer, B. (2020). Gender and promoting quality seeds in Africa: A literature review.
Cunguara, B., & Cavane, E. (2019). Final Impact Evaluation of the Seed Multiplication project to Empower Small Commercial Farmers: Dutch Phase II.
Cunguara, B,. Machava, A., Villisa, D., Matchaya, G., Nhlengethwa, s., Wilson, D., & Nhemachena, C. (2019). Challenges underpinning the seed value chain in Mozambique.
Gardner, P. (2017). Breaking into the Smallholder Seed Market: Lessons From the Mozambique Smallholder Effective Extension Drive Success (Seeds) Project. Report for NCBA/CLUSA. Washington DC: NCBA/CLUSA.
IITA. (2020). SEMIMAR Annual Report for FY20: October 2019 – September 2020 and Final Project Report October 2015 – September 2020.
Ojiewo, C. O., Rubyogo, J. C., Wesonga, J. M., Bishaw, Z., Abang, M. M., & Gelalcha, S. W. (2018). Mainstreaming efficient legume seed systems in Eastern Africa: challenges, opportunities and contributions towards improved livelihoods.
Ribeiro, R. (2020). Case Study: InovAgro’s experiences in strengthening the enabling environment of the seed subsector in Mozambique. Report for USAID. Maputo: COWI.
Rohrbach, D. D., Low, J. W., Pitoro, R., Cucu, A., Massingue, J., Boughton, D., Guilhermina Rafael, G., Paulo, P., Jocene, D. (2001). Investment priorities for the development of Mozambique's seed system (No. 1093-2016-87879).
Mabaya, E., Alberto, M. E., Tomo, A. A., & Mugoya, M. (2017). The African Seed Access Index. Report prepared for The African Seed Access INDEX (TASAI). Nairobi: TASAI.
SIDA. (2004). Integration of biodiversity aspects in development cooperation – a case study. Food Crop and Seed Project in Zambia.
6. Extension/Advisory Services

Chapota, R. (2020). Rapid assessment on the use of radio in extension and advisory services in Mozambique. A Report of the USAID MEAS project.
Chilemba, J., & Ragasa, C. (2019). The Impact on Farmer Incomes of a Nationwide Scaling Up of the Farmer Business School Program: Lessons and Insights from Central Malawi. The European Journal of Development Research, 1-33.
Cunguara, B., & Thompson, T., with Davis, K. (2018). Mozambique: Desk Study of Extension and Advisory Services. Developing Local Extension Capacity (DLEC) Project. January 2018. Washington DC: Digital Green/ IFPRI.
Elim Servicos. (2020). Mozambique Country Private Sector Diagnostics Agribusiness Deep-Dive Deliverables 2.1 – 2.3: Field Notes – Contract Farming, Mechanization, Warehousing. Report for IFC. Maputo: Elim Servicos .
iDE. (2020). Rolling with the changes. Farmer Resilience and Rebuilding Initiative in Mozambique.
iDE. (2020). COVID-19 Modified Operating and Implementation Norms Supplemental Manual.
Sseguya, H., Robinson, D. S., Mwango, H. R., Flock, J. A., Manda, J., Abed, R., & Mruma, S. O. (2021). The impact of demonstration plots on improved agricultural input purchase in Tanzania: Implications for policy and practice. PloS one, 16(1), e0243896.
Waddington, S. (2017). Farmer field schools improve agricultural practices, yields and incomes in small pilot programmes, but not in large-scale programmes
7. Statistics:
Feed the Future FEEDBACK. (2016). Feed the Future Mozambique 2015 Zone of Influence Interim Assessment Report. Rockville, MD: Westat.
Mouzinho, B. (2017). 2014 RELATÓRIO PANORAMA II MOÇAMBIQUE. Maputo: FAO.
8. Poverty
World Bank Group. (2016). Accelerating poverty reduction in Mozambique: challenges and opportunities.
World Bank presentation: Mozambique Poverty Assessment. 2018. “STRONG BUT NOT BROADLY SHARED GROWTH”—MOZAMBIQUE POVERTY ASSESSMENT-(OVERVIEW – VERSION IN PORTUGUESE) World Bank.
9. Moz growth and development
Arias, O., Evans, D. K., & Santos, I. (2019). The skills balancing act in Sub-Saharan Africa: Investing in skills for productivity, inclusivity, and adaptability. World Bank Publications.
Brethenoux, J., Costa, C., Giddings, S., Olafsen, E., Rebello, M., & Thaller, J. (2013). The agribusiness innovation center of Mozambique: developing value adding market-led post-harvest processing enterprises in Mozambique.

Deininger, K., & Xia, F. (2016). Quantifying Spillover Effects from Large Land-based Investment.
Franco, A.S., & Katiyo, L.. (2017). Business Environment Reform Facility: BER Scoping Assessment for DFID Mozambique Economic Governance Programme. Maputo: DFID Mozambique.
Mahdi, S., Massingue, A. C. A., Massarongo Chivulele, F. A. P., Baez Ramirez, J. E., Walker, I. D., Mucavele Macule, A. N., ... & Casal, J. (2018). Mozambique Economic Update: Shifting to More Inclusive Growth (No. 131212, pp. 1-46). The World Bank.
World Bank. (2020). Cultivando Oportunidades para um Crescimento Mais Rápido do Rendimento e Redução da Pobreza nas Áreas Rurais: Diagnóstico dos Rendimentos Rurais em Moçambique. Washington, DC: World Bank Group.
World Bank. (2020). Doing Business 2020 Region Profile: Sub Saharan Africa. Washington, D.C.: World Bank.
World Bank. (2020). Mozambique - Improvement of Skills Development Project. Washington, D.C. World Bank Group.
World Bank. (2020). Mozambique - National Urban Development and Decentralization Project. Washington, D.C. World Bank Group.
World Bank. (2019). Doing Business in Mozambique. Washington, D.C.: World Bank. License: Creative Commons Attribution CC BY 3.0 IGO.
World Bank. (2019). Mozambique - Integrated Feeder Road Development Project : Additional Financing. Washington, D.C. World Bank Group.
10. Digital Agric:
Cardoso, C., & Spielberg, J. (2020). Assessment of Potential Opportunities for Use of Digital Payments for Smallholder Farmers in Northern and Central Senegal.
11. Projects/evaluations
China and Brazil in African Agriculture Working Paper Series
Chirwa, C. W., Makoka, D., & Maonga, B. B. (2017). Impact of Malawi’s Farm Income Diversification Programme on household welfare: Empirical evidence from eleven districts (No. 20). International Food Policy Research Institute (IFPRI).
Currier, A. (2020). The Failure of Input Subsidies and a New Path Forward to Fight Hunger in Malawi. Web article by Oakland Institute.
IFAD. (2020). Living up to the challenge of creating market linkages in Mozambique. PROMER project news brief.
IFAD. (2019). Mozambique Inclusive Agri-food Value-Chain Development Programme Project Design Report.
Pauw, K., & Thurlow, J. (2014). Malawi's farm input subsidy program: Where do we go from here? (Vol. 18). Intl Food Policy Res Inst.

Winrock. (2019). Feed the Future Mozambique, Resilient Agricultural Markets Activity - Nacala Corridor RAMA-NC): Final Report January 1, 2017 – March 31, 2019.
12. Linkages SHF, SMEs and large scale
Liverpool-Tasie, L. S. O., Wineman, A., Young, S., Tambo, J., Vargas, C., Reardon, T., Adjognon, G. S., Porciello, J., Gathoni, N., Bizikova, L., Galiè, A., & Celestin, A. (2020). A scoping review of market links between value chain actors and small-scale producers in developing regions. Nature Sustainability, 3(10), 799-808.
13. Farmer organizations
Kaarhus, R., & Woodhouse, P. (2012). Development of national producer organizations and specialized business units in Mozambique: a study for the Royal Norwegian Society for Development to prepare a new phase of programme collaboration.
Overseas Cooperative Development Council (OCDC) with Euricse. (2016). Identifying Processes and Policies Conducive to Cooperative Development in Africa. Mozambique Country Report. Eurisce: European Research Institute on Cooperative and Social Enterprises.
14. Mechanization
Amanor, K. (2019). Mechanised Agriculture and Medium-Scale Farmers in Northern Ghana: a Success of Market Liberalism or a Product of a Longer History?
APRA. (2018). Tractores, corredores e desenvolvimento dirigido no Moçambique rural. Presentation.
Cabral, L. (2019). Na Senda Dos Tratores: Três Crónicas Para Um Retrato Da Cooperação Brasil-Moçambique. Desafios Para Moçambique 2019, 393-407.
Cabral, L. (20219). Tractors in Africa: Looking Behind the Technical Fix.. APRA Working Paper 22.
Monjane, M. Q. C., da Graça, A. J. P., & Hasegawa, H. (2018). The Current Situation and Perspectives Regarding Agricultural Mechanization in the Republic of Mozambique. AGRICULTURAL MECHANIZATION IN ASIA, AFRICA AND LATIN AMERICA, 49(4), 34.
SIMLESA. (2019). From Muscle to Machines: How to modernize smallholder farming in Mozambique. CIMMYT/SIMLESA Policy Brief.
Winrock. (Undated). Mechanized land preparation. Technology Brief, Feed the Future Resilient Agricultural Markets Activity – Nacala Corridor. Nampula: Winrock.
15. Macadamia nuts:
Parshotam, A. (2018). Cultivating smallholder inclusion in Southern Africa's macadamia nut value chains
Zuza, E. J., Maseyk, K., Bhagwat, S., Emmott, A., Rawes, W., & Araya, Y. N. (2021). Review of Macadamia Production in Malawi: Focusing on What, Where, How Much Is Produced and Major Constraints. Agriculture, 11(2), 152.

16. Maize
Amaral, C., Mouzinho, B., Villisa, D., Matchaya, G., Nhlengethwa, S., Wilson, D., & Nhemachena, C. 2020. Analysis of maize production and yield in Mozambique (2000-2018): trends, challenges and opportunities for improvement. Maputo: MADER.
Dias, P. (2013). Analysis of incentives and disincentives for maize in Mozambique. Technical notes series, MAFAP, FAO, Rome.
17. Soybean
Di Matteo, F., Otsuki, K., & Schoneveld, G. (2016). Soya bean expansion in Mozambique: Exploring the inclusiveness and viability of soya business models as an alternative to the land grab. The Public Sphere Journal, 60-86.
Franke, A. C., Van Den Brand, G. J., & Giller, K. E. (2014). Which farmers benefit most from sustainable intensification? An ex-ante impact assessment of expanding grain legume production in Malawi. European Journal of Agronomy, 58, 28-38.
Goldsmith, P. Personal communication, Jan 11, 2021.
Hanlon, J., & Smart, T. (2012). Soya boom in Gúruè has produced few bigger farmers–so far. Small farmers or big investors: the choice for Mozambique. Londres: Open University. Report n. 1.
Keane, R., Tamimie, C., & Goldsmith, P. (2017). These Soybean Experts and Farmers Say Their ‘Success Kits’ Live Up to the Name. USAID Frontlines Online Edition September/ October 2017.
Khojely, D. M., Ibrahim, S. E., Sapey, E., & Han, T. (2018). History, current status, and prospects of soybean production and research in sub-Saharan Africa. The Crop Journal, 6(3), 226-235.
Mubichi, F. M. (2017). A comparative study between Mozambique and Malawi soybean adoption among smallholder farmers. Journal of Rural Social Sciences, 32(1), 3 .
Shannon, D. A., & Kalala, M. M. (1994). Adoption of soybean in sub-Saharan Africa: A comparative analysis of production and utilization in Zaire and Nigeria. Agricultural Systems, 46(4), 369-384 .
Tubene, S., Miguel, M., Joaquim, E., da Luz Quinhentos, M., & Findeis, J. L. (2018). MAPPING SOYBEAN VALUE CHAIN IN MOZAMBIQUE.
Vanlauwe, B., Coyne, D. L., Gockowski, J., Hauser, S., & Huising, J. (2014). Sustainable intensification and the African smallholder farmer. Current Opinion in Environmental Sustainability.
Walker, T., & Cunguara, B. (2016). Taking Stock of Soybean R&D and USAID’s Feed the Future Program in Mozambique. Modernizing Extension and Advisory Services (MEAS) Project Report. March, 17.
18. Forest and forest based products (nontimber products) (also agroforestry)
Valintine, S. (2020). Forest Stewardship Council. Personal communication.
19. Poultry

FAO. (2013). Poultry Sector Mozambique. FAO Animal Production and Health Livestock Country Reviews. No. 5. Rome.
Oppewal, J., Cruz, A., & Nhabinde, V. (2016). Estudo sectorial: cadeia de valor do frango em Moçambique. colaboração com International Growth Centre (IGC). Ministério da Economia e Finanças. Moçambique.
Shaw, M., Nielson, H., & Rose, M. (2019). Poultry Sector Study. Report for DFID/Malawi. United Kingdom.
Vernooij, A., Van, M. J., & dos Anjos, M. (2016). Livestock Development in the Zambezi Valley, Mozambique: Poultry, Dairy and Beef Production. Wegeningen University and Research. Wageningen: Centre for Development Innovation.
Vernooij, A. G., & Wilschut, S. (2015). The poultry sector of Mozambique: A brief introduction to the current state of affairs and emerging opportunities
20. Small animals and other livestock
African Development Bank (AFDB)/African Development Fund (ADF). (2004). Mozambique PCR Family Farming Livestock Rehabilitation Project. Project Completion Report. Tunis, Tunisia: African Development Fund.
21. Horticulture
Cruz, A. S., & Mafambissa, F. J. (2018).. Industries without Smokestacks: Mozambique Country Case Study. Chapter 12 in Newfarmer et al. Industries without Smokestacks. Pp. 232-253. Oxford, UK: Oxford University Press .
Fukase, E., & Martin, W. (2018). Agro-processing and horticultural exports from Africa. Industries without Smokestacks: Industrialization in Africa Reconsidered, 90-112.
Mango, N., Mapemba, L., Tchale, H., Makate, C., Dunjana, N., & Lundy, M. (2015). Comparative analysis of tomato value chain competitiveness in selected areas of Malawi and Mozambique. Cogent Economics & Finance, 3(1), 1088429.
Newfarmer, R., Page, J., & Tarp, F. (2019). Industries without smokestacks: Industrialization in Africa reconsidered (p. 480). Oxford University Press
22. Cashews:
SPEED+. The Economics of Cashew in Mozambique. (2018). Maputo, MZ: SPEED+. (no authorship attribution).
SPEED+ Cashew Economic Analysis Model
Technoserve (TNS). (2017). MozaCajú Impact Report. Maputo: Technoserve.
Technoserve (TNS). (2016). Mozambique Cashew Industry Analysis. Maputo: Technoserve.
23. Bananas

Hanlon, J. (2018). Mozambique: Another Norfund fiasco as Matanuska goes bust. Published on FarmlandGrab.org.
24. Pigeon peas
Me-Nsope, N. M., & Nankhuni, F. J. (2018). An Analysis of Malawi’s Pigeon Pea Value Chain (No. 1879-2018-5037)
Walker, T., Silim, S., Cunguara, B., Donovan, C., Rao, P. P., & Amane, M. (2015). Pigeonpea in Mozambique: An emerging success story of crop expansion in smallholder agriculture (No. 1098-2016-88859).
25. Legumes
Akpo, E., Ojiewo, C. O., Kapran, I., Omoigui, L. O., Diama, A., & Varshney, R. K. (2020). Enhancing Smallholder Farmers' Access to Seed of Improved Legume Varieties through Multi-stakeholder Platforms: Learning from the TLIII project Experiences in sub-Saharan Africa and South Asia.
26. Groundnuts
Aflasafe & IITA. (2021). Website:
Akpo, E., Ojiewo, C. O., Kapran, I., Omoigui, L. O., Diama, A., & Varshney, R. K. (2020). Enhancing Smallholder Farmers' Access to Seed of Improved Legume Varieties Through Multi-stakeholder Platforms: Learning from the TLIII project Experiences in sub-Saharan Africa and South Asia.
Cambaza, E., Koseki, S., & Kawamura, S. (2018). A glance at aflatoxin research in Mozambique. International journal of environmental research and public health, 15(8), 1673.
Cambaza, E., Koseki, S., & Kawamura, S. (2018). Aflatoxins in Mozambique: Impact and potential for intervention. Agriculture, 8(7), 100.
Engels, J. (2011). Groundnut Grower’s Guide for Mozambique: Production, Harvesting and Post-harvest Handling.
Gichohi-Wainaina, W. N., Kumwenda, N., Zulu, R., Munthali, J., & Okori, P. (2021). Aflatoxin contamination: Knowledge disparities among agriculture extension officers, frontline health workers and small holder farming households in Malawi. Food Control, 121, 107672.
Jnr, E. Z., Muitia, A., Amane, M. I., Brandenburg, R. L., Emmott, A., & Mondjana, A. M. (2018). Effect of harvesting time and drying methods on aflatoxin contamination in groundnut in Mozambique. In Mycotoxins-Impact and Management Strategies. IntechOpen.
Siambi, M., Estrada, J., & Jones, R. (2008). Overcoming Market challenges for smallholder farmers: the case of groundnuts in Malawi. Africa Can Feed Itself, 124.
SIDA. (2004). Integration of biodiversity aspects in development cooperation – a case study. Food Crop and Seed project in Zambia.

27. Women and Youth
Mata, R. T. 2020. PROEJUMA: Flagship Programme for Youth and Women Empowerment in Agriculture: Northern and Central Mozambique, Maputo: MADER.
28. Nutrition/Diets
Aflasafe & IITA. (2021). Website
Chegere, M. J., & Stage, J. (2020). Agricultural production diversity, dietary diversity and nutritional status: Panel data evidence from Tanzania. World Development, 129, 104856.
Concern Worldwide Zambia. (2017). Final Evaluation Report RAIN+ Project.
Harris, J., Kennedy, A., Rawat, R., & Roopnaraine, T. (2013). Realigning agriculture to improve nutrition (RAIN) project, Zambia, process evaluation report. Concern Worldwide and IFPRI.
Kumar, N., Harris, J., & Rawat, R. (2015). If they grow it, will they eat and grow? Evidence from Zambia on agricultural diversity and child undernutrition. The journal of development studies, 51(8), 1060-1077.
Lenaerts, B., & Demont, M. (2021). The global burden of chronic and hidden hunger revisited: New panel data evidence spanning 1990–2017. Global Food Security, 28, 100480.
Mucha, N., Bloomberg, J. H., & Stockdale, K. (2016). Summary Report:14-Country Nutrition Landscape Analyses. Global Alliance for Improved Nutrition (GAIN).
Nærstad, A. (2007). Africa can feed itself. The Development Fund.
Nutrition Innovation Lab. 2020. Assessing the Relationship of Aflatoxin Exposure and Stunting in Children 6-59 Months of Age in 10 Districts of Nampula Province, Mozambique.
Pellegrini, L., & Tasciotti, L. (2014). Crop diversification, dietary diversity and agricultural income: empirical evidence from eight developing countries. Canadian Journal of Development Studies/Revue canadienne d'études du développement, 35(2), 211-227 .
Project Concern. (2021). RAIN project: empowering communities to tackle malnutrition. Website.
Rosenberg, A. M., Maluccio, J. A., Harris, J., Mwanamwenge, M., Nguyen, P. H., Tembo, G., & Rawat, R. (2018). Nutrition-sensitive agricultural interventions, agricultural diversity, food access and child dietary diversity: Evidence from rural Zambia. Food Policy, 80, 10-23 .
Ruel, M. T., Quisumbing, A. R., & Balagamwala, M. (2017). Nutrition-sensitive agriculture: What have we learned and where do we go from here?
Sahel-Consult. (2021). Critical Trends in Agriculture and Food in Africa for the Next Decade. Sahel-Consult Quarterly Update January: 26
World Bank. (2020). Agricultura Nutricionalmente Inteligente em Mocambique
World Bank. (2020). Nutrition Smart Agriculture, Volume 2. Supplementary Material.

29. COVID
Liverpool‐Tasie, L. S. O., Reardon, T., & Belton, B. (2021). “Essential non‐essentials”: COVID‐19 policy missteps in Nigeria rooted in persistent myths about African food supply chains. Applied Economic Perspectives and Policy, 43(1), 205-224.
30. Food systems/Food processing
Balineau, G., Bauer, A., Kessler, M., & Madariaga, N. (2021). Food Systems in Africa: Rethinking the Role of Markets. World Bank Publications .
Technoserve. (2018). Food Processing in Sub-Saharan Africa: Solutions for African Food Enterprises (SAFE) Final Report. Collaborations between Technoserve, Partners in Food Solutions, and USAID.
31. Emergency responses
Magen, B., Donovan, C., & Kelly, V. (2019). Can cash transfers promote food security in the context of volatile commodity price? A Review of Empirical Evidence .
Miller, J. (2002). Mozambique 1999–2000 Floods, Impact Evaluation: Resettlement Grant Activity. Maputo: United States Agency for International Development.
Southern African Regional Technical Cash Working Group (SARTCWG). (2019). Humanitarian Cash Coordination in the Cyclone Idai Response: After-Action Review by the Southern African Technical Cash Working Group.
WFP. (2019). Cash transfers and vouchers in response to drought in Mozambique: Lessons on social protection linkages and separation of functions. World Food Programme.
Wiles, P., Selvester, K., & Fidalgo, L. (2005). Learning lessons from disaster recovery: The case of Mozambique .
32. Market/Business Analyses
Technoserve (TNS). (2017). TechnoServe Initiative for Inclusive Agricultural Business Models Enhancing the commercial and social value of local sourcing in Africa. for SABMiller / AB InBev.
USAID Feed the Future Enabling Environment for Food Security Project (EEFSP). (2021). Limitations of Quantitative Scoring of the Enabling Environment: Is Doing Business Worth Saving? Washington, DC: USAID EEFSP.
USAID Feed the Future Enabling Environment for Food Security Project (EEFSP). (2020). Practical Analytical Framework for Inclusive Entrepreneurial Market Systems: Assessing the Underlying Factors Enabling Inclusive Economic Growth. Washington, DC: USAID EEFSP.
USAID Feed the Future Enabling Environment for Food Security Project (EEFSP). (2021). The Enabling Environment for Food Traceability System Success. Washington, DC: USAID EEFSP.

33. Cassava
Donovan, C., Haggblade, S., Salegua, V. A., Cuambe, C., Mudema, J., & Tomo, A. (2011). Cassava commercialization in Mozambique (No. 1096-2016-88441).

Annex D: Maps of Mozambique
Figure A1. Elevation map of Mozambique

Figure A2. Elevation map of Mozambique

Figure A3. Road map of Mozambique

Figure A4. Livelihood zone map of Mozambique

Figure A5. Agroecological zone map of Mozambique

Figure A6. Zonal map of Zambezi and Nampula provinces for this study

Figure A7. Blow-up of agroecological zone map for Zambezi and Nampula provinces

Annex E: Road projects in Zambezia and Nampula over the
past five years, and perspectives on adequacy of roads
infrastructure
Recent and Current Projects
1. World Bank Mozambique Growth Poles Project:
http://documents1.worldbank.org/curated/en/ 591001538620435335/pdf/Disclosable-
Version-of-the-ISR-Mozambique-Integrated-Growth-Poles-Project-P127303-Sequence-No-
12.pdf
This project is now done, with the primary road improvements being in Tete province (not
considered here) and the rehabilitation of 42 bridges and water passages on the R702 between
Nacala a Velha and Nacala Porto.
2. World Bank Integrated Feeder Roads Project: https://projects.worldbank.org/en/projects-
operations/project-detail/P158231
This project is currently active, with a planned finish date of 12/31/25. In addition to feeder road
construction and improvement in 11 districts of central Zambezia and Nampula, this project will
rehabilitate sections of the N1 and N10 from Quelimane to Namacurra
(https://www.worldbank.org/en/news/press-release/2018/05/08/mozambique-gets-150-million-
for-rural-roads-in-support-of-agricultural-productivity). Combined with the EU-financed
rehabilitation of the Mocuba-Namacurra road under PROMOVE, this investment will result in
greatly improved access to the Quelimane market for millions of farmers in central and northern
3. European Union’s PROMOVE Transporte project:
https://ec.europa.eu/transparency/regdoc/ rep/3/2018/EN/C-2018-8961-F1-EN-
ANNEX-1-PART-1.PDF
This project is expected to begin soon with completion in 2022 or 2023 (verbal communication with
Steven Glover of World bank). It has three components aiming to upgrade main roads and
maintain feeder roads in southeast Nampula and in Alta Zambezia linking to the Nacala corridor
road in Nampula. The components are rural road works, investment in “accompanying measures”,
and improved road asset management. Here we briefly summarize what is planned by geographical
area, not by formal component of the project.
If the scheduled completion of these works by 2022 or 2023 is met, then they could substantially
expand market access during the time of USAID’s investment and meaningfully increase the return

(in terms of household incomes and food security) to any agricultural investments that the mission
were to make in the area.
Southeastern Nampula: Work here will include area-based maintenance (ABM) of secondary and
perhaps tertiary roads and upgrading of the Nametil-Angoche road. As Angoche has been among
the most isolated areas of Nampula for at least three decades, and in light of the very rapid growth
of Nametil’s population over the past decade, this investment should have a major impact on farmer
access to markets in this area of the province.
“Accompanying measures” are specified in a general way at this point and will be implemented in all
areas. They will include provision or rehabilitation of small community infrastructure that
complements EU agricultural investments in the region (under the 11th EDF), measures to promote
rural transport services, and various awareness campaigns related to roads, road safety, and
HIV/AIDS.
Alta Zambezia linking to Nacala Corridor: Upgrading (paving) will be done on three stretches of
road:
● From Lioma to Mutuali, which connects Alta Zambezia to the Nacala Corridor road, giving
access to Nampula City, Nacala, and Pemba;
● From Magige to Mogomo, which nearly links to the Lioma-Mutuali road and will greatly
extend access to the Nacala Corridor; and
● Milange to Coromane, to the southwest of these other investments. This investment will
leverage other investments completed by the EU completed within the past two years under
the Mocuba Road Upgrading Project
(https://eeas.europa.eu/delegations/mozambique/57004/ integrated-development-milange-
mocuba-corridor-mozambique_en). This project upgraded roads in the “Milange-Mocuba
corridor”, including connections from Mocuba northwest to Milange, southeast to
Namacurra, and north to Lugela and on beyond Alto Molocue. Together, this amounts to a
very substantial improvement of road access in central and nortwhwestern Zambezia with
connections into Nampula since the last households data was collected in 2017.
Assessment of road adequacy in Mozambique
Road adequacy in Mozambique is poor even by African standards, based on several indicators:
1. Mozambique ranks 33rd out of 38 African countries in the World Economic Forum’s Roads
quality index (https://www.theglobaleconomy.com/rankings/roads_quality/Africa/)
2. In the African Development Bank’s Transport Composite Index, Mozambique ranks 48th
out of 54 countries
3. In the World Bank’s Rural Access Index (share of population within 2 km of an all-season
road, download at https://datacatalog.worldbank.org/dataset/rural-access-index-rai),

Mozambique ranks below all but three of 16 African countries with data. Note that this data
is spotty, not available every year
World Bank assessments (World Bank, 2019) also suggest major problems, indicating that
“Mozambique is highly exposed to extreme rainfall and flooding that may become even
more frequent because of global climate change” and further stating “Due to recurrent climatic
events and the lack of maintenance, the road and rail networks have suffered extensive damage
over the last 20 years, with substantial sums being diverted from network improvement to
the repair of flood-related damage. Because the Mozambican road network has a low redundancy,
those disruptions sometimes isolate communities for extended periods of time and thus have a
significant detrimental impact on their local economics.”

Annex F: Household characteristics in 2012 and 2017 by
zone and household type
Results from 2012
1. Distribution of household types across zones
1.1. Table 2 shows the distribution of household types across zones. Key patterns are:
1.1.1. Every zone has large shares of subsistence or semi-subsistence households: The
combined share of these two groups ranges between 25% and 29% across zones
⮚ This is much higher than what Hazell (2017) found in Ghana (8%), Ethiopia (17%),
ad Tanzania (5%)
1.1.2. Semi-commercialized farmers are the largest single group in all zones except Lowland
Southern Zambezia, accounting for 36% to 39% in other zones but only 9% in
Lowland Southern Zambezia
⮚ Hazell (2017) found shares of 14% in Ghana, 32% in Ethiopia, and 16% in
Tanzania
1.1.3. Lowland Southern Zambezia has by far the highest share of transitioning households –
those who sell less than half their agricultural production and earn at least 33% of their
total incomes off the farm
⮚ Hazell (2017) also found that this group was very large, with shares of 39% to 50%
across the three countries
Table 2. Percentage of households by zone and type, 2012
Subsis-tence
farmers
Semi- Subsistence
farmers
Semi-Commer-cialized farmers
Transition-ing HHs
Commer-cialized farmers
Diversified
HHs Total Zone
Lowland S. Zambezia 16 13 9 57 0 6 100
East/Coastal N. Zambezia & Nampula 12 14 36 28 6 3 100
Mid-elevation Zambezia & Nampula 8 17 36 25 11 3 100
Alta Zambezia & W. Nampula 12 15 39 22 10 1 100
Total 12 15 32 31 8 3 100
1.1.4. The most agriculturally commercialized households – the Commercialized farming and
Diversified types that sell at least half their agricultural output – are the smallest groups,
accounting for only 11% of households overall
⮚ This figure is nearly identical to Ethiopia in Hazell (2017) but much lower than
Tanzania (29%) and Ghana (39%)
1.1.5. Commercialized households – those that most depend on farming and sales from
farming for their livelihoods – are concentrated in the mid-elevation zone and the Alta
Zambezia/Western Nampula zone. None of these types are found in Lowland
Southern Zambezia.

1.1.6. These patterns hint at the very low level of agricultural transformation in these two
provinces, which will be viewed more directly below.
Household characteristics by zone and type: Demographics
1. Table 3 shows demographic characteristics by zone. Three patterns stand out:
1.1. Household size and number of working adults varies very little across the zones
1.2. Lowland Southern Zambezia less intact families: it has lower shares of households with
both a head and spouse present, and higher shares of households that are female-headed
1.3. This zone also has the highest education, with adults having on average completed 31% of
primary through secondary school (CONFIRM THIS DEFINITION)
Table 3. Demographic characteristics by zone, 2012
---------------- Zone ------------------
HH characteristic (mean or %) Lowland
Zambezia
E/Coast N. Zamb & Namp
Mid Elevation
Alta Zambezia
& W. Nampula Total
Demographics
% of all households 16 30 35 18 100
Hh size 4.8 4.7 4.9 4.8 4.8
# working-age adults (15-59) 2.3 2.1 2.2 2.2 2.2
% HH w/ head & spouse present 73.7 81.2 77.8 77.6 78.1
Age of HH head 42.0 42.3 39.2 40.2 40.8
% female-headed 31.4 20.3 22.9 23.0 23.6
Adult education years ratio (%) 30.7 21.5 24.5 23.4 24.4
Source: Authors’ calculation from IAI2012
2. Table 4 shows demographic characteristic by household type. Here too we see three patterns
that stand out:
2.1. Subsistence households are the smallest and Diversified households are the largest (4.5 and
5.1, respectively). All other types have very similar household sizes and numbers of working
adults
2.2. Subsistence households have the least intact and oldest families
⮚ Only 67% have both a head and spouse present. The share of female headed
households in this group is also the highest
⮚ Average age of the household head is 44, compared to a range of 38-42 for other
household types
2.3. Households with the highest nonfarm income shares – the Transitioning and
Commercialized groups – have by far the highest education, with 32% and 37%,
respectively, of a full secondary education, compared to only 20% for all other household
types. This strong association between nonfarm income and education is a long-standing
pattern found throughout Africa

Table 4. Demographic characteristics by household type, 2012
---------------- Type of rural household ------------------
HH characteristic (mean or %)
Subsis-tence
Semi Subsis-tence
Semi-Commer-cialized
Transi-tioning
Commer-cialized Diversified
Total
Demographics
% of all households 12 15 32 31 8 3 100
Hh size 4.5 4.9 4.7 4.9 4.9 5.1 4.8
# working-age adults (15-59) 2.0 2.2 2.1 2.3 2.0 2.4 2.2
% HH has head & spouse 67.0 74.6 78.4 83.8 76.7 81.5 78.1
Age of HH head 44.3 41.5 41.5 38.2 41.8 39.8 40.8
% female-headed 38.7 24.2 21.9 20.0 21.1 22.7 23.6
Adult education years ratio (%) 20.1 19.7 21.0 31.7 19.5 36.9
24.4
Source: Authors’ calculation from IAI2012
Household characteristics by zone and type: Livelihoods
1. Table 5 shows variables related to market access and livelihoods (farm- vs nonfarm orientation)
by zone. Two patterns stand out:
1.1. Lowland Southern Zambezia is much more strongly linked to markets and less linked to
agriculture for cash income than other zones, in multiple ways:
⮚ Residents are far closer than any other zone to an all season tarmac road
⮚ Nonfarm income is nearly half of all income, at least double the share of every other
zone. Households in this zone are also the most likely to receive remittances and
income shares from this source are the highest
⮚ Only 64% of working age adults report farming as their principal activity, compared to
about 80% for all other zones
⮚ Finally, 32% of all adults report running a small business, compared to 22% to 26% in
the other zones
1.2. The other key pattern is that Alta Zambezia/Western Nampula looks to be somewhat
more isolated than the other zones, with the longest average distances to the main road and
a tarmac road and substantially fewer households receiving remittances – 15% compared to
at least 21% in all other zones
2. Table 6 shows variables related to market access and livelihoods (farm- vs nonfarm orientation)
by household type. Note that, by construction, these types show high variation in the share of
nonfarm income in total income and the share of their agricultural production that they sell.
Five patterns stand out:

2.1. Households with the strongest nonfarm orientation maintain a firm foot in farming: 60%
and 67%, respectively, of adults in Transitioning and Diversified households cite farming as
their principal activity
2.2. Yet these households earn on average abut two-thirds of all their income off the farm,
compared to 10% or less for every other household type. Counting income from
remittances, about 75% of income for each group comes from other than their farming
activities
Table 5. Livelihoods and market access by zone, 2012
---------------- Zone ------------------
HH characteristic (mean or %)
Lowland Southern Zambezia
E/Coast N.
Zambezia &
Nampula Mid
Elevation
Alta Zambezia
& W. Nampula Total
Market access and livelihood
Distance to main road (km) 9.6 11.5 8.4 13.7 10.5
Distance to nearest tarmac road (km) 7.8 78.6 62.6 82.9 62.0
Share farm sales in total farm income 10.2 17.0 20.6 20.2 17.7
Share of non-farm inc in total income 48.5 25.4 23.3 20.3 27.5
HH received remittances (%) 26.5 21.7 20.9 15.1 21.0
Share of remittances in tot HH income (%) 6.8 3.0 2.6 4.0 3.7
Adults with farming as principal activity (%) 64.2 79.9 82.9 81.6 78.8
Adults with wage employment (%) 19.7 14.2 18.6 19.5 17.6
Adults with own business activity (%) 32.2 25.5 26.2 22.3 26.2
2.3. All other household types earn almost nothing from remittances. Thus, engagement in
nonfarm activities within the household is associated with having family members outside
the household who are able to send cash back to the household
2.4. Commercialized Farmers are the most isolated, lying over 100km on average from the
nearest tarmac road
2.5. Transitioning and Diversified households are the least isolated, which we expect is one of
the reasons – in addition to their higher levels of education that we saw in the previous
section – that they are able to earn substantial incomes off the farm
Table 6. Livelihoods and market access by household type, 2012
---------------- Type of rural household ------------------
HH characteristic (mean or %)
Subsis-tence
Semi Subsis-tence
Semi-Commer-cialized
Transi-tioning
Commer-cialized
Diversified Total
Market access and livelihoods
% of all households 12 15 32 31 8 3 100
Km to main road 13.4 8.5 11.4 9.6 12.6 4.1 10.5
Km to nearest tarmac road 70.6 62.7 65.7 44.4 106.9 53.7 62.0
Farm sales/total farm income 0.0 1.1 21.7 9.9 68.7 71.2 17.7

---------------- Type of rural household ------------------
HH characteristic (mean or %)
Subsis-tence
Semi Subsis-tence
Semi-Commer-cialized
Transi-tioning
Commer-cialized
Diversified Total
Non-farm/total income 0.0 10.1 7.7 68.5 7.6 63.3 27.5
HH received remittances (%) 0.0 23.8 16.4 32.6 17.1 28.2 21.0
Remittance income/total income 0.0 1.4 1.4 8.3 1.0 11.5 3.7
Adults with farming as principal activity (%) 77.6 82.5 86.9 66.8 95.5 59.5 78.8
Adults with wage employment (%) 5.8 19.6 14.1 25.1 14.6 21.4 17.6
Adults with own business activity (%) 3.0 25.1 21.8 37.5 30.6 36.8 26.2
Source: Authors’ calculation from IAI2012
3. Household characteristics by zone and type: Agricultural practices
3.1. Tables 7-10 show agricultural practices of households by zone and type. By zone (Tables 7 and 8)
we see several potentially important patterns:
3.1.1. The overwhelming conclusion from examining the tables by zones is that, as of 2012, none of
these zones had seen meaningful agricultural transformation. With the exception of the use of
improved seed in Alta Zambêzia/Western Nampula, all use of agricultural inputs and services
is in the single digits, and typically below 5%.
3.1.1.1. See section “Changes from 2012 to 2017” for an assessment of how these patterns
changed during that period.
3.1.2. Within this broadly discouraging panorama, Lowland Southern Zambezia – which has the
strongest nonfarm orientation – shows the least agricultural transformation while Alta
Zambezia/Western Nampula shows the highest. Yet even in the latter, use of variable inputs
and services is extremely low
Table 7. Agricultural practices by zone, 2012
---------------- Zone ------------------
HH characteristic (mean or %)
Lowland Southern Zambezia
E/Coast N. Zambezia
& Nampula
Mid Elevation
Alta Zambezia
& W. Nampula Total
Farming practices & use of services
Total cultivated area (ha) 0.80 1.44 1.55 1.58 1.40
Total cultivated area per AE (ha/AE) 0.24 0.43 0.51 0.50 0.44
Used inorganic fertilizer (%) 0.0 0.1 1.2 2.2 0.9
Used manure (%) 0.0 1.0 1.6 0.4 0.9
Used pesticide (%) 0.0 5.2 7.3 5.7 5.2
Used improved seed (%) 4.2 2.6 2.7 11.4 4.5
Used irrigation (%) 0.3 2.1 4.2 7.4 3.5
Used animal traction (%) 0.0 0.0 0.0 0.0 0.0
Used own animal traction (%) 0.0 0.0 0.0 0.0 0.0

---------------- Zone ------------------
HH characteristic (mean or %)
Lowland Southern Zambezia
E/Coast N. Zambezia
& Nampula
Mid Elevation
Alta Zambezia
& W. Nampula Total
Rent/borrow anim traction (%) 0.0 0.0 0.0 0.0 0.0
Used mechanical land prep (%) 0.3 0.0 0.5 0.0 0.2
Used own machinery (%) 0.0 0.0 0.0 0.0 0.0
Rent/borrow machinery (%) 0.3 0.0 0.5 0.0 0.2
Hired labor (%) 23.8 14.0 17.7 18.8 17.8
Accessed credit (%) 1.0 1.5 4.7 1.3 2.5
Received extension visit (%) 3.1 6.2 8.3 2.5 5.8
Received market price info (%) 26.3 49.6 61.5 53.7 50.7
Source: Authors’ calculation from IAI2012
Table 8. Cropping patterns by zone, 2012
---------------- Zone ------------------
HH characteristic (mean or %)
Lowland Southern Zambezia
E/Coast N.
Zambezia &
Nampula 3-Mid
Elevation
4-Alta Zambezia
& W. Nampula Total
Cropping
# of food crops grown (mean) 4.1 5.1 5.0 4.8 4.8
# of cash crops grown (mean) 0.1 0.2 0.3 0.2 0.2
% growing:
Maize 46.0 61.8 78.5 90.7 70.4
Paddy 79.5 23.9 24.5 27.2 34.0
Cassava 59.7 91.3 90.1 75.2 82.8
Feijão manteiga 0.3 1.1 2.0 17.4 4.3
F. nhemba 37.5 64.0 59.4 35.7 52.8
Pigeon pea 24.2 32.6 71.0 72.8 52.1
Other beans & pulses 11.8 46.5 18.3 6.9 23.6
Groundnuts 2.7 62.2 49.2 17.5 39.6
Cotton 0.0 5.7 9.4 2.8 5.5
Sesame 10.7 9.6 10.1 4.3 8.9
Soya 0.0 0.0 0.1 1.9 0.4
Other cash crops 2.0 4.1 7.8 13.8 6.8
Vegetables 23.9 22.5 31.2 35.6 28.2
Other food crops 62.6 37.7 30.0 55.4 42.4
% cultivated area in:
Maize 8.8 12.2 21.2 33.8 18.8
Paddy 58.4 9.9 6.7 6.7 16.1
Cassava 12.6 31.9 26.2 17.9 24.1

---------------- Zone ------------------
HH characteristic (mean or %)
Lowland Southern Zambezia
E/Coast N.
Zambezia &
Nampula 3-Mid
Elevation
4-Alta Zambezia
& W. Nampula Total
Feijão manteiga 0.0 0.1 0.2 2.2 0.5
F. nhemba 2.2 8.5 8.2 4.0 6.5
Pigeon pea 4.2 3.8 13.1 14.6 9.1
Other beans & pulses 0.5 6.7 2.3 0.5 3.0
Groundnuts 0.1 14.6 10.5 2.6 8.5
Cotton 0.0 2.6 3.4 1.2 2.2
Sesame 2.1 1.7 1.7 0.6 1.6
Soya 0.0 0.0 0.0 0.3 0.1
Other cash crops 0.3 0.4 0.9 1.8 0.8
Vegetables 0.9 2.0 1.8 1.8 1.7
Other food crops 9.9 5.6 3.9 12.3 6.9
Source: Authors’ calculation from IAI2012
3.2. Examining patterns by household type (Tables 9 and 10) reinforces the negligible
agricultural transformation that has taken place:
3.2.1. Even the most commercialized farmers – Commercialized and Diversified – see input
use in the low single digits in nearly all cases.
3.2.2. The major exception is use of pesticides by 30% of Commercialized farmers, and this is
driven almost entirely by cotton cultivation with chemicals supplied (on credit) by
cotton companies (note that 30% of these farmers used pesticides and 29% grew
cotton)
3.2.3. Diversified Households and Commercialized Farmers, along with Transitioning
Households are far more likely to hire labor (26% to 35%) than other households
3.2.4. Commercialized Farmers are much more likely than any other type to access credit
(16%), though it is likely that the vast majority of this is related to cotton production
and input provision by cotton companies.
3.2.5. In terms of cropping patterns (Table 10), the most notable pattern is that
Commercialized Farmers and Diversified Households are far more likely to grow
sesame (29% and 40%, respectively, compared to no more than 10% for other
household types) and cotton (29% and 11%, respectively, compared to a maximum of
7% among other household types).

Table 9. Agricultural practices by household type, 2012
---------------- Type of rural household ------------------
HH characteristic (mean or %)
Subsis-tence
farmers
Semi Subsis-tence
farmers
Semi-Commer-cialized farmers
Transi-tioning HHs
Commer-cialized farmers
Diversified HHs Total
Farming practices & use of services
Total cultivated area (ha) 1.02 1.41 1.61 1.13 2.03 1.71 1.40
Total cultivated area per AE (ha/AE) 0.36 0.42 0.52 0.34 0.69 0.47 0.44
Used inorganic fertilizer (%) 1.0 0.4 0.5 0.8 2.8 1.6 0.9
Used manure (%) 0.4 0.3 0.9 0.7 1.9 4.8 0.9
Used pesticide (%) 1.6 1.2 6.1 1.4 29.8 4.6 5.2
Used improved seed (%) 2.1 1.7 5.7 6.3 1.5 5.0 4.5
Used irrigation (%) 2.0 1.7 5.1 2.8 6.1 1.6 3.5
Used animal traction (%) 0.0 0.0 0.0 0.0 0.0 0.0 0.0
Used own animal traction (%) 0.0 0.0 0.0 0.0 0.0 0.0 0.0
Rent/borrow anim traction (%) 0.0 0.0 0.0 0.0 0.0 0.0 0.0
Used mechanical land prep (%) 0.0 0.0 0.2 0.5 0.4 0.0 0.2
Used own machinery (%) 0.0 0.0 0.0 0.0 0.0 0.0 0.0
Rent/borrow machinery (%) 0.0 0.0 0.2 0.5 0.4 0.0 0.2
Hired labor (%) 4.2 9.3 14.3 26.9 25.7 35.0 17.8
Accessed credit (%) 0.0 0.0 2.4 0.9 16.4 6.2 2.5
Received extension visit (%) 3.0 3.7 6.3 5.2 12.3 8.6 5.8
Received market price info (%) 39.3 49.7 58.4 45.5 62.0 40.6 50.7
Source: Authors’ calculation from IAI2012
Table 10. Cropping patterns by household type, 2012
---------------- Type of rural household ------------------
HH characteristic (mean or %)
Subsis-tence
farmers
Semi Subsis-tence
farmers
Semi-Commer-cialized farmers
Transi-tioning HHs
Commer-cialized farmers
Diversified HHs Total
Cropping
# of food crops grown (mean) 4.0 4.5 5.6 4.5 5.1 4.3 4.8
# of cash crops grown (mean) 0.0 0.1 0.3 0.1 0.7 0.7 0.2
% growing:
Maize 52.4 71.2 81.2 60.8 85.5 76.2 70.4
Paddy 30.8 34.8 33.8 39.7 20.6 21.6 34.0
Cassava 78.2 89.4 91.2 75.2 75.4 72.2 82.8
Feijão manteiga 2.3 1.9 6.4 2.8 9.5 3.7 4.3
F. nhemba 45.8 49.7 55.3 53.2 64.7 35.5 52.8
Pigeon pea 37.9 46.3 64.1 46.3 53.9 58.1 52.1
Other beans & pulses 24.3 21.6 25.2 23.1 27.2 11.7 23.6

---------------- Type of rural household ------------------
HH characteristic (mean or %)
Subsis-tence
farmers
Semi Subsis-tence
farmers
Semi-Commer-cialized farmers
Transi-tioning HHs
Commer-cialized farmers
Diversified HHs Total
Groundnuts 31.4 38.1 48.4 35.4 41.6 24.4 39.6
Cotton 0.0 0.9 7.1 1.7 28.9 10.8 5.5
Sesame 0.0 2.4 10.0 5.8 29.1 40.0 8.9
Soya 0.0 0.2 0.7 0.0 1.0 2.0 0.4
Other cash crops 3.4 6.0 8.8 4.0 14.0 12.7 6.8
Vegetables 19.3 21.3 35.2 24.9 38.6 28.1 28.2
Other food crops 39.5 39.7 43.8 42.8 49.0 32.2 42.4
% cultivated area in:
Maize 14.6 20.1 21.5 15.8 22.0 20.3 18.8
Paddy 21.2 15.2 11.2 23.4 6.3 8.4 16.1
Cassava 29.2 29.7 23.6 23.1 13.6 21.0 24.1
Feijão manteiga 0.1 0.1 0.8 0.3 1.5 0.3 0.5
F. nhemba 6.0 6.1 6.3 7.2 7.3 5.3 6.5
Pigeon pea 7.1 7.4 10.6 8.4 10.2 12.5 9.1
Other beans & pulses 3.2 2.9 3.0 3.1 3.3 0.9 3.0
Groundnuts 7.5 7.8 9.6 8.5 7.6 7.9 8.5
Cotton 0.0 0.3 2.6 0.7 11.9 5.0 2.2
Sesame 0.0 0.6 1.3 1.1 5.8 8.0 1.6
Soya 0.0 0.0 0.1 0.0 0.1 0.6 0.1
Other cash crops 0.6 0.8 1.0 0.5 1.5 0.9 0.8
Vegetables 1.2 1.3 2.1 1.4 2.0 3.1 1.7
Other food crops 9.4 7.7 6.2 6.6 6.9 5.8 6.9
Source: Authors’ calculation from IAI2012
4. Household characteristics by zone and type: Incomes and food security
4.1. Tables 11 and 12 summarize income and food security outcomes by zone and household type,
respectively. By zone, we find the following meaningful patterns:
4.1.1. Average incomes vary only by 32% from the lowest zone (Alta Zambezia/Western Nampula)
to the highest (Lowland Southern Zambezia). Note that the highest income zone is the one
most oriented towards nonfarm incomes
4.1.2. Lowland Southern Zambezia is the only zone where rice is an important staple, with 44% of
households listing it as most important compared to 1% or less in every other zone.
4.1.3. Yet this zone also shows a high reliance on maize (43%) that is higher than the share of
households that produce it (37%). In every other zone, the share producing the most important
staple (manioc in Eastern/Coastal northern Zambezia and Nampula and Mid-elevation zones,
and maize in Alta Zambezia/Western Nampula) is higher than the share claiming it as the most
important staple.
4.1.3.1. Consistent with the orientation of the zones towards farm- vs nonfarm (cash) income,
this pattern suggests that households in Lowland Southern Zambezia zone (the most
oriented towards non-farm (cash) income) rely more on food purchases for their food
security than do households in other zones

4.1.4. Food security indicators suggest that this strategy did not pay off for all households. Despite
having the highest mean and median income of all zones, households in this zone experienced
hunger more frequently than those in East/Coastal Northern Zambezia and Nampula (43% vs
37%) and just as frequently as those in Alta Zambezia/Western Nampula (43% each). Only
the mid elevation zone experienced hunger more frequently, at 48%
Table 11. Incomes and food security indicators by zone, 2012
---------------- Zone ------------------
HH characteristic (mean or %)
Lowland Southern Zambezia
E/Coast N.
Zambezia &
Nampula Mid
Elevation
Alta Zambezia
& W. Nampula Total
Income and food security
Total net HH income per AE
Mean 8,668 7,586 8,154 6,566 7,776
Median 4,157 3,671 4,012 3,639 3,822
Gross farm income/AE
Mean/AE 3,692 4,042 5,093 4,524 4,442
Median/AE 2,030 2,235 2,916 2,617 2,510
Mean/AE per ha 4,588 2,800 3,285 2,859 3,168
Median/AE per ha 3,158 1,775 2,201 1,923 2,156
Main food staple in consumption (%)
Maize 42.7 16.1 33.1 56.1 33.8
Manioc 13.2 81.8 64.3 35.9 55.9
Rice 44.1 1.3 0.7 0.9 8.1
Sorghum/millet 0.0 0.7 1.8 7.1 2.2
Batata doce (only other crop) 0.0 0.0 0.1 0.0 0.0
HH had reserve of their main staple (%) 49.7 78.5 77.4 68.9 71.6
Experienced hunger past 12 mths (%) 43.3 37.1 47.9 43.5 43.1
Source: Authors’ calculation from IAI2012
4.2. Differences are much more apparent across household types (Table 12):
4.2.1. At the top end of the income distribution, Transitioning and Diversified households have real
median incomes per AE roughly four times higher than subsistence households, at around
6,000 vs 1,500. The other three types range only from about 3,300 to 3,800
4.2.2. A stunning result is that agricultural income shows very little relationship to our farm typology:
⮚ Subsistence households have the lowest median agricultural income per AE, but this is due
largely to their low area cultivated; when expressed on a per ha basis, these households
have median incomes higher than transitioning and Commercialized households and nearly
equal to Semi-commercialized and Diversified
⮚ Semi-subsistence farms far exceed other household types in mean and median income per
ha. This shows shockingly little payoff to agricultural commercialization in Mozambique
as of 2012
4.2.3. As we saw across zones, the relationship between food security indicators and incomes across
household types is also not straightforward:

⮚ Though by far the poorest, subsistence households experienced less hunger than semi-
subsistence and semi-commercialized farms
⮚ Commercialized households had incomes well below Transitioning and Diversified
households but experience the least hunger of any group
⮚ Holding a reserve of the main staple does not appear to be heavily associated with food
security, as about 85% of Commercialized and Semi-Commercialized households reported
holding such a reserve, but the latter experienced much more hunger, at 46% compared to
30%
Table 12. Incomes and food security indicators by household type, 2012
---------------- Type of rural household ------------------
HH characteristic (mean or %)
Subsis-
tence farme
rs
Semi Subsis-tence
farmers
Semi-Commer-cialized farmers
Transi-tioning HHs
Commer-cialized farmers
Diversified HHs Total
Income and food security
Total net HH income/AE
Mean 3,099 7,055 5,795 11,374 5,889 17,490 7,776
Median 1,525 3,833 3,342 6,431 3,575 5,839 3,822
Gross farm income/AE
Mean/AE 3,108 6,479 5,393 2,787 5,608 3,278 4,442
Median/AE 1,525 3,425 3,083 1,653 3,440 2,913 2,510
Mean/AE per ha 3,051 4,610 3,349 2,474 2,761 1,917 3,168
Median/AE per ha 1,996 3,407 2,133 1,837 1,924 2,082 2,156
Main food staple in consumption (%)
Maize 20.7 28.4 31.6 38.5 51.7 40.9 33.8
Manioc 63.3 65.3 63.0 45.0 39.0 57.2 55.9
Rice 13.5 5.6 3.4 14.8 0.4 1.8 8.1
Sorghum/millet 2.4 0.7 2.0 1.6 8.9 0.0 2.2
Had reserve of main staple (%) 57.6 59.6 84.5 65.9 85.5 70.7 71.6
Experienced hunger past 12 mths (%) 39.3 56.5 46.5 38.7 29.8 34.0 43.1
Source: Authors’ calculation from IAI2012
Conclusions
Two main conclusions come out of this analysis:
1. First, at least as of 2012, agriculture in these two provinces was remarkably untransformed and
except in very few instances was not providing a robust pathway for growth out of poverty for
rural households
1.1. Even the most market-oriented farming households – Commercialized Farmers and
Diversified Households, who together make-up only 11% of all households - showed
extremely low use of variable inputs and agricultural services, with the exception of
pesticides provided on credit by cotton companies.

⮚ As shown above, agricultural income shows very little relationship to our farm
typology, with Subsistence Farmers having median incomes higher than several others
and Semi-subsistence Farmers exceeding all other household types on both a per AE
and per AE/ha basis.
1.2. Households generating the highest incomes are doing so through nonfarm income, not
through farming
⮚ These are the Transitioning Households and Diversified Households groups, whose
mean and median incomes per AE are at least 60% higher than any other group,
despite their generally lower ag incomes per AE
1.3. Yet these households all maintain a firm footing in farming, suggesting a strong preference
to self-supply their food needs rather than depending on markets for food purchases. This
behavior reinforces the need to find some way to broadly improve the productivity of
smallholder farming in the region, even as many households look to strengthen their
engagement with the nonfarm economy and some migrate to urban areas or otherwise leave
farming.
2. Second, food security and hunger remain major issues across all zones and all household types.
It is striking that the highest income household types suffered hunger nearly as frequently as
subsistence households. The reach of any safety nets thus needs to be broad.
2.1 In the section (“Changes in livelihoods and farming practices, 2012-2017”), we review
whether the latest available household data (IAI2017) provides evidence that this
transformation has advanced. Because the 2017 survey did not quantify nonfarm
income, we cannot replicate our analysis by household type, but we can replicate most
of the zonal analysis and draw preliminary hypotheses about the level of transformation
that may have occurred over this five-year period.

Incipient Transformation? Changes in farming and rural livelihoods
from 2012 to 2017 Here we walk through the same set of tables that we reviewed with 2012 data, now looking at
changes from 2012 to 2017. Because IAI 2017 did not collect full income data (and some other
data), we cannot replicate the rural household typology that we just presented, so look at these
changes only by the zones defined in the previous section.
All tables show change between the two years. Indicators measured in value or units show percent
change (for example, an increase in hectares from 1 to 1.8 would be reported here as an 80% rise),
while indicators measured in percent (or share) show percentage point change (e.g. an increase from
1% to 1.8% in the share of households using a given input is reported as a 0.8 percentage point rise.
Demographics: Three changes are worth noting (Table 1):
1. The most meaningful change was in education, where the adult education years ratio rose
substantially in every zone and by 42% overall, from a mean of 23.4 in 2012 to 34.7 in 2017
1.1. Though we know nothing of the quality of education (and there is strong evidence
that educational quality has declined substantially in Africa as rates of school
enrollment have risen rapidly (CITATIONS), this change bodes well for rural
residents’ wellbeing
2. The share of households that had both a head and spouse present fell by 5.6 percentage
points from 78% in 2012. Meanwhile the share of female-headed households rose sharply in
two zones and fell somewhat in the other two.
3. Finally, declines in household size and number of adults and increases in the age of the
household head suggest a continuing movement of young people out of farming and
perhaps into more urban areas – a trend that has been unfolding across Africa for several
decades
Table 1. Change in demographic characteristics by zone, 2012-2017
---------------- Zone ------------------
HH characteristic (mean or %) Lowland
Zambezia
E/Coast N. Zamb & Namp
Mid Elevation
Alta Zambezia
& W. Nampula Total
Demographics
% of all households
Hh size -7% -3% -5% -7% -5%
# working-age adults (15-59) -4% 6% 0% 5% 2%
% HH has head & spouse -5.8 -8.2 -1.1 -9.8 -5.6
Age of HH head 1% 2% 4% 3% 3%
% female-headed -12% 25% -5% 27% 7%
Adult education years ratio (%) 24% 39% 46% 66% 42%
Note: all indicators measured in value or units show percent change (for example, an increase in hectares from 1 to 1.8 is
reported here as an 80% rise); indicators measured in percent or share show percentage point change (e.g. an increase from 1%
to 1.8% is reported as a 0.8 percentage point rise)

Livelihoods: Farm vs non-farm orientation
With no quantification of nonfarm income in 2017 (and apparently no community survey, which is
the source of distance to infrastructure variables), we report here only on agricultural sales in total
agricultural production, and indicators of orientation towards farming or off-farm
A mixed picture emerges (Table 2):
1. The importance of farm sales went up slightly in two zones and down slightly in two,
all of which could have been due to the quality of the production year;
2. The share of adults reporting farming as their principal activity fell in three of the four
zones (Lowland Southern Zambezia was the exception) overall with a two percentage
point decline;
3. The share reporting farming as a secondary activity also fell in three of the four zones
(the Mid-elevation zone was the exception) and dropped by 1.1 points overall; The
result is that the share of adults not involved in farming rose by over 3 percentage
points.
4. The share reporting earning salaried income rose in three of four zones and the share
reporting business income both rose in every zone. The latter rose by 18 percentage
points in Alta Zmbezia/W. Nampula and by over 8 percentage points overall,
representing a 32% increase (from 26.2% to 34.6%);
5. Overall this suggests a fairly strong trend towards more non-farm engagement through
two mechanisms: some young people leaving the farm and rural areas to work outside
the sector, and continued rises in nonfarm engagement (and declines in farm
engagement) by those that remain on the farm.
Table 2. Change in livelihoods and market access by zone, 2012 – 2017
---------------- Zone ------------------
HH characteristic (mean or %)
Lowland Southern Zambezia
E/Coast N.
Zambezia &
Nampula 3-Mid
Elevation
4-Alta Zambezia
& W. Nampula Total
Market access and livelihoods
Distance to main road (km) -------- NA, not collected 2017 --------
Distance to nearest tarmac road (km) -------- NA, not collected 2017 --------
Share farm sales in total farm income -0.8 2.4 -2.2 5.8 1.6
Share of non-farm inc in total income -------- NA, not collected 2017 --------
HH received remittances (%) -------- NA, not collected 2017 --------
Share of remittances in tot HH income (%) -------- NA, not collected 2017 --------
Adults with farming as principal activity (%) 8.4 -3.4 -6.5 -1.3 -2.0
Adults with farming as secondary activity (%) -5.6 -1.1 2.1 -2.5 -1.1
Adults not involved in farming (%) -2.8 4.5 4.4 3.8 3.1
Adults with wage employment (%) 2.1 1.7 2.7 -3.1 0.9
Adults with own business activity (%) 6.2 5.8 6.8 18.2 8.4

Note: all indicators measured in value or units show percent change (for example, an increase in hectares from 1 to 1.8 is reported here as an
80% rise); indicators measured in percent or share show percentage point change (e.g. an increase from 1% to 1.8% is reported as a 0.8
percentage point rise)
Agricultural practices: a mixed picture that suggests some positive change but nothing
approaching meaningful transformation
1. First, land areas cultivated show a very broad and meaningful increase: by 31% overall (33%
when expressed per AE) and in every zone, with a range of 12% (Eastern/Coastal N. Zambezia
and Nampula) to 90% (Lowland Southern Zambezia). See Table 3.
1.1. This increase is very broad-based as shown by the rise in the median also in every zone and
by a cumulative density function for 2017 (not shown) that lies everywhere to the right of
the 2012 version – this indicates that land holdings increased at every level of the
distribution (it does NOT mean that all households increased their land holdings)
1.2. This preliminary finding needs further investigation, including into the factors that would
have made it possible. Until further analysis, we prefer not to speculate on these issues
Table 3. Change in agricultural practices by zone, 2012-2017
---------------- Zone ------------------
HH characteristic (mean or %)
Lowland Southern Zambezia
E/Coast N.
Zambezia &
Nampula Mid
Elevation
Alta Zambezia
& W. Nampula Total
Farming practices & use of services
Total cultivated area (ha, mean) 90% 12% 23% 39% 31%
Total cultivated area (ha, median) 66% 11% 11% 24% 26%
Total cultivated area per AE (ha/AE) 95% 16% 21% 48% 33%
% of HHs that are "medios" 0.1 0.2 0.2 0.1 0.2
Used inorganic fertilizer (%) 0.1 1.1 0.4 1.4 0.9
Used manure (%) 0.6 0.6 -0.4 0.3 0.3
Used pesticide (%) 0.3 -3.6 -6.2 -3.9 -3.9
Used improved seed (%) 1.2 3.9 3.4 2.9 3.4
Used irrigation (%) 0.7 -0.6 -1.0 -4.6 -1.3
Used animal traction (%) 0.0 0.0 0.1 0.0 0.0
Used own animal traction (%) 0.0 0.0 0.0 0.0 0.0
Rent/borrow anim traction (%) 0.0 0.0 0.1 0.0 0.0
Used mechanical land prep (%) 3.3 1.2 -0.2 1.5 1.0
Used own machinery (%) 0.0 0.0 0.0 0.0 0.0
Rent/borrow machinery (%) 3.3 1.2 -0.2 1.5 1.0
Hired labor (%) -8.2 -1.2 -6.9 -4.8 -5.1
Accessed credit (%) -0.9 -1.3 -4.0 1.8 -1.5
Received extension visit (%) 3.2 3.5 4.1 8.3 4.7
Received market price info (%) -20.2 -30.5 -42.9 -39.5 -34.4

Note: all indicators measured in value or units show percent change (for example, an increase in hectares from 1 to 1.8 is
reported here as an 80% rise); indicators measured in percent or share show percentage point change (e.g. an increase from 1%
to 1.8% is reported as a 0.8 percentage point rise)
2. Use of most other variable inputs also rose, but by very small but amounts:
2.2. Inorganic fertilizer use rose in very zone and by 0.9 percentage points overall, from 0.8% of
households to 1.7%. The rise was most pronounced – but still quite modest - in
Eastern/Coastal Northern Zambezia and Nampula – from 2.2% to 3.6% - with smaller
rises in every zone.
1. Improved seed use showed the largest improvement, rising in every zone and by 3.4
percentage points overall (from 4.5 to 7.9%)
2. Despite government investment in tractorization, use of mechanical land preparation
barely moved
⮚ It did rise in every zone but by very low amounts
⮚ Nearly all the rise was from renting or borrowing tractors, rather than using one’s
own, suggesting the possibility that some kind of land preparation services market
has begun to emerge, but at very incipient levels. This will be a key aspect to watch
between 2017 and 2020.
3. Hiring of agricultural fell in every zone and by 5.1 percentage points overall, from
17.8% to 12.7%.
2.3. The much-discussed soybean story in Alta Zambezia finally appeared in the data in 2017
(Table 4): from 2% of households in that zone that reported growing the crop in 2012, 12%
reported growing it in 2017
2.4. Less encouraging changes include a decline (from already very low levels) in access to credit,
which we suspect is related to the decline in growing of cotton (see below); and large drops
in the share of households accessing market information.
2.5. Overall, and subject to more careful review of the data and of secondary information, this
evidence suggests some positive incremental change between 2012 and 2017 but nothing
approaching the rate and breadth of change needed to conclude that a meaningful process
of agricultural transformation has begun.
Cropping patterns: possible emerging specialization among some households 1. First, we already noted the substantial and very broad apparent rise in area cultivated
1.1. Despite this rise, the average number of food crops grown dropped by 25% (from 4.8 to
only 3.6) and the average number of cash crops dropped by 36%
1.2. Every crop except groundnuts, soya, and (barely) maize saw a decrease in the percentage of
farmers growing it. Groundnuts saw a very large rise in Lowland Southern Zambezia, from
only 2.7% in 2012 to 13.5% in 2017, and soya saw the large rise already discussed in Alta
Zambezia.
1.3. Pigeon pea and sesame, two important cash crops, also saw declines, quite pronounced in
the case of pigeon pea, where the share of households growing it fell from 52% to 38%.
1. This is related to a sharp drop in prices during the 2015 marketing season
2. Sesame saw a lesser absolute decline but quite large in proportional terms, from 8.9%
to 4.3%.

2.6. We are now examining the planting data more carefully to better understand patterns of
change between 2012 and 2017 and potential reasons for and implications of them
Table 4. Change in cropping patterns by zone, 2012-2017
---------------- Zone ------------------
HH characteristic (mean or %)
Lowland Southern Zambezia
E/Coast N.
Zambezia &
Nampula 3-Mid
Elevation
4-Alta Zambezia
& W. Nampula Total
Cropping
# of food crops grown (mean) -24% -30% -23% -23% -25%
# of cash crops grown (mean) -62% -47% -55% 17% -36%
% growing:
Maize -5.2 -0.9 1.5 1.5 1.1
Paddy -4.6 -5.9 -16.3 -15.5 -13.8
Cassava -1.4 -2.8 -16.8 -17.4 -9.4
Feijão manteiga 2.5 -0.9 1.2 -4.9 -0.2
F. nhemba -21.8 -29.9 -16.9 -9.2 -19.7
Pigeon pea -6.9 -10.4 -22.3 -16.6 -14.5
Other beans & pulses -5.7 -9.2 -1.3 2.5 -2.7
Groundnuts 10.8 0.9 7.0 2.8 6.2
Cotton 0.0 -3.7 -5.4 -2.0 -3.3
Sesame -6.4 -3.8 -4.4 -2.1 -4.1
Soya 0.0 0.0 -0.1 10.5 2.3
Other cash crops -1.4 -2.0 -5.1 -2.3 -2.7
Vegetables 0.5 -10.5 -12.4 -14.2 -10.5
Other food crops -27.5 -27.6 -10.0 -22.0 -21.1
% cultivated area in:
Maize 3.3 4.2 9.2 9.8 7.5
Paddy -13.3 -2.1 -4.3 -3.6 -6.8
Manioc 11.0 5.5 -2.9 -1.8 2.4
Feijão manteiga 0.3 -0.1 0.0 -0.1 0.1
F. nhemba 0.5 -2.6 -1.8 0.0 -1.2
Pigeon pea -1.3 -0.8 -3.9 -2.2 -2.1
Other beans & pulses 0.6 0.4 -0.1 0.3 0.4
Groundnuts 2.2 2.8 6.3 0.6 3.8
Cotton 0.0 -1.9 -1.8 -1.0 -1.4
Sesame -1.0 -0.6 -0.5 -0.4 -0.6
Soya 0.0 0.0 0.0 3.6 0.8
Other cash crops -0.1 0.0 -0.2 0.4 0.0
Vegetables -0.1 -1.1 -0.4 -1.0 -0.7
Other food crops -2.2 -3.7 0.3 -4.7 -2.4

Note: all indicators measured in value or units show percent change (for example, an increase in hectares from 1 to 1.8 is reported here as an
80% rise); indicators measured in percent or share show percentage point change (e.g. an increase from 1% to 1.8% is reported as a 0.8
percentage point rise)
Outcomes: Incomes and food security
1. Here we can only look at agricultural income (not total) and two food security indicators, as
incomes were not collected in 2017
1.1. Mean and median agricultural incomes per AE rose in three of the four zones (they fell in
the mid-elevation zone) and overall. However, this was driven by increased land holdings,
and agricultural incomes per ha fell in every zone
1.1.1. Thus, this gross measure of agricultural productivity actually fell, though higher land
holdings allowed overall incomes from agriculture mostly to rise
1.2. We see substantial declines in the shares of households that said they had sufficient reserves
of their main staple in three of the four zones, but also consistent and meaningful declines,
in every zone except Lowland Southern Zambezia, in the share of households that said they
had experienced hunger over the past 12 months. Overall this indicator declined by nearly
10 percentage points, or more than 20% over the five years.
1.2.1. How much this relates to better weather conditions compared to rising productivity or
better access to markets for food purchases requires more investigation.
Table 5. Change in Incomes and food security indicators by zone, 2012-2017
---------------- Zone ------------------
HH characteristic (mean or %)
Lowland Southern Zambezia
E/Coast N.
Zambezia &
Nampula Mid
Elevation
Alta Zambezia
& W. Nampula Total
Income and food security
Total net HH income/AE
Mean NA, not collected 2017
Median NA, not collected 2017
Gross farm income/AE
Mean/AE 74% 2% -7% 21% 10%
Median/AE 34% 25% -15% 11% 6%
Mean/AE per ha -9% -9% -24% -13% -16%
Median/AE per ha -30% 11% -31% -20% -19%
Main food staple in consumption (%)
Maize
NA, not collected 2017
Manioc
Rice
Sorghum/millet
Batata doce (only other crop)
HH had reserve of their main staple (%) -1.3 -13.8 -17.8 -10.7 -11.9
Experienced hunger past 12 mths (%) 2.8 -7.1 -16.8 -8.7 -9.8

Note: all indicators measured in value or units show percent change (for example, an increase in hectares from 1 to 1.8 is reported here as an
80% rise); indicators measured in percent or share show percentage point change (e.g. an increase from 1% to 1.8% is reported as a 0.8
percentage point rise)
Conclusions
1. This review of changes in livelihoods, farming practices, and income and food security between
2012 and 2017 shows some progress but not enough to suggest that the spotty and incipient
process of agricultural transformation is beginning to pick up speed
2. Area planted and total value of agricultural production per AE increased substantially and very
broadly. Speculatively, this may reflect more optimistic farmer judgements about the possibility
of marketing their output possibilities
⮚ The fact that sales as a share of production also rose slightly (though only in two
zones) supports this possibility, but more careful investigation is needed
3. Farmers appear to have specialized more in their agricultural production in 2017, though the
reasons for and implications of this change need to be better understood (we will investigate this
further in the next draft of the report)
3.1. Soybean production in Alta Zambezia saw a major increase in production, with a rise of
nearly 11 percentage points in the share of farmers growing it
⮚ Yet the share of farmers growing three other important cash crops – sesame,
pigeon pea, and cotton - dropped
3.2. Use of variable inputs and hired labor remains low and, though it increased broadly, these
increases were very small. The exception to this broad trend is the use of pesticides, which
dropped in response to the decrease in cotton planting
3.3. Despite investment in tractorization, we see only very small, albeit positive and broad,
increases in the use of this service
⮚ We need to clarify the role that publicly financed CSAs played in this access
4. At the same time that some small positive change took place in farming, the share of adults not
involved in farming rose in every zone and households strengthened their engagement with the
nonfarm economy, primarily through own business activities
4.1. Such changes are fully consistent with the process of agricultural and rural transformation
and in fact feed off each other in this process.
5. Food security remains an important problem throughout the provinces and likely across every
type of household (as we’ve classified them here). At least 30% of households in every zone
during 2017 reported that they experienced hunger at some point during the past 12 months.
5.1. Recall also from the previous section that hunger was common across all household types
with little predictable pattern.

Projects/Programs Start date
End date Donor Implementing Organization
Value chains, topics
Locations
Current projects
Agri-Smart supporting resilience and inclusive development 2018 2021 Italy COSV, Pime and DPTADERZ
various Zambezia https://www.cosv.org/agri-smart-supporting-resilience-and-inclusive-development/?lang=en
AVACYEP Ag Value Chain and Youth Empowerment program 2018 2023 AFDB MADER hort, animal health (beef)
Gaza and Maputo https://www.afdb.org/en/documents/document/mozambique-agricultural-value-chain-and-youth-empowerment-project-avacyep-appraisal-report-108370
BAGC Beira Agricultural Growth Corridor (Partnership: Association)
2010 2020 AGRA and others Ministry of Agriculture, private sector partners
corn, wheat, vegetables, fruit, soybeans, rice, irrigation, inputs
Sofala, Manica and Tete
https://macauhub.com.mo/pt/2011/08/15/portugues-agra-contribuiu-com-32-milhoes-de-dolares-para-projecto-agricola-em-mocambique/.
Banana Industry Grants Facility 2017 2020 USDA TNS, Jacaranda bananas, disease prot. Nampula https://www.bananamoz.org/banana-industry-grants-facility
CATALISA 2017 2022 TOTAL Technoserve commercial horticulture and poultry production
Cabo Delgado https://www.catalisa.org/sobre
Food security through climate Adaptation and Resilience (FAR) 2017 2020 SIDA Swisscontact Mozambique, AFAP,Associação Kwaedza Simukai Manica (AKSM),Concern Universal,IFDC,ADEL
sustainable climate-smart agricultural solutions
Sofala and Manica https://www.swisscontact.org/en/projects/far
FTF Inova 2017 2022 USAID DAI enterprise dev; Nampula, Zambezia, Tet, Manica
https://www.usaid.gov/mozambique/fact-sheets/feed-the-future-mozambique-innovations-ftf-inova
Green Innovation centres for the agriculture and food sector 2016 2020 German (BMZ) GIZ supports the value-added chain of pigeon pea, rice and baobab,
Sofala (Beira Corridor) https://www.giz.de/en/worldwide/32209.html
iDE SMART: Strengthening the missing middle in Agribusiness for Rapid Transformation
2016 2022 Sweden iDE various; gender, youth,
Manica and Sofala https://www.ideglobal.org/country/mozambique
InovAgro 2010 2020 Swiss DAI not VC specific but includes maize and sesame
Nampula, Cabo Delgado and Zambezia
https://www.shareweb.ch/site/EI/Documents/HowTo/M4P-MSD/PSD%20INOVAGRO%20Case%20Study_%20Seed%20Environment%20FV.pdf
IRRIGA1 2019 2025 WB GOM, FNDS? irrigation, rice, veggies Nampula, Zambezia, Manica Sofala
https://projects.worldbank.org/en/projects-operations/project-detail/P164431?lang=en
PASS (Program for African seed systems) 2017 2022 AGRA SNV (partially) beans, cowpeas, rice sorghum, pigeon peas, maize
https://agra.org/news/agra-commits-26-million-to-increase-use-of-fertilizer-and-improved-seeds-in-mozambique/
ProCava: Inclusive Agri-food Value-Chain Development Programme
2019 2024 IFAD IIAM, MINAG, hort, cassava, legumes (incl soybeans, common beans, cowpeas and sesame)
South and parts of center and north;
https://www.ifad.org/documents/38711644/40049138/Mozambique%202000001981%20PROCAVA%20Project%20Design%20Report%20October%202019/a6661c10-d3bc-e206-de4a-2be3ad4e03e6
Program to increase resilience to farmers affected by climate changes
2016 2020 Austria (CAD) FAO local seed production systems, conservation agriculture technics
Manica and Sofala http://www.fao.org/mozambique/news/detail/pt/c/1062303/
PROMAC II: Promotion of Climate Smart Agriculture Project 2017 2022 Norway NCBA/CLUSA various; mechanization for conservation ag; market access; litearcy
Manica and Zambezia https://ncbaclusa.coop/project/mozambique-conservation-agriculture-promotion-promac-ii/
Promer: Rural Markets Promotion Programme 2009 2021 IFAD GOM/DNDR markets, literacy, finance
Nampula, Cabo Delgado, Niassa and Zambezia
https://www.ifad.org/documents/38711644/40046455/Mozambique%201100001423%20PROMER%20Supervision%20Mission%20November%202019/5b778e5c-3b7a-8ab0-7636-c1e8d347ed70
PROMOVE Agribiz 2014 2020 EU, FAO, Germans, WB
UNIDA, FNDS (GOM) SMEs, agribusiness, finance
Nampula, Zambezia https://ec.europa.eu/transparency/regdoc/rep/3/2018/EN/C-2018-8153-F1-EN-ANNEX-3-PART-1.PDF
PROMOVE Comercio 2020 2024 EU GOM Commerce facilitation, sustainable agriculture, improvement of rural roads and agriusiness
Zambezia and Nampula
http://www.sigame-cplp.com/noticias/ue-financia-desenvolvimento-de-duas-provincias-de-mocambique.html
PROMOVE Transporte 2017 2020 EU GOM/ANE roads Nampula, Zambezia https://ec.europa.eu/transparency/regdoc/rep/3/2018/EN/C-2018-8961-F1-EN-ANNEX-1-PART-1.PDF
RAMA-BC 2016 2021 USAID Land O'Lakes, partnership Phoenix Seeds
pigeon peas, legumes for intercropping, soils, seeds
Beira Corridor (tete, Manica)
https://www.landolakesventure37.org/Where-We-Work/47
Rural Finance Support Project 2019 2024 IFAD, GOM GOM finance, MSMEs country wide https://www.ifad.org/en/web/latest/news-detail/asset/41225496
Semear 2015 2020 USAID CGIAR (IITA,CIAT, ICRISAT), IIAM
seed systems, seed production, policy
Zambezia, Nampula, Manica, tete
https://www.usaid.gov/mozambique/news/feed-future-semear-agricultural-future-mozam
Southern Africa Seed Trade Project 2016 2021 USAID SADC/DAI Mozambique, Zambia Malawi
Mozambique, Zambia Malawi
https://www.dai.com/our-work/projects/southern-africa-feed-future-southern-africa-seed-trade-project
SPEED and SPEED+ 2010 2020 USAID DAI; NATHAN for Speed+ various; policy; private sector
Nationwide https://www.nathaninc.com/supporting-the-policy-environment-for-economic-development/
Information and Evaluation sources

Projects/Programs Start date
End date Donor Implementing Organization
Value chains, topics
Locations Information and Evaluation sources
SUSTENTA 2016 2019 WB, GOM GOM, FNDS? Mechanization, ag productivity, soy, maize, seeds
Nationwide https://documents.worldbank.org/en/publication/documents-reports/documentdetail/885801560788889757/mozambique-agriculture-and-natural-resources-landscape-management-project-additional-financing
World Bank Integrated Growth Poles Project 2013 2020 WB GOM rural enterpises, infrastructure
Nacala Corridor, Zambezi Valley
http://documents1.worldbank.org/curated/en/601401468058727044/pdf/PAD2680P127303010Box374366B00OUO090.pdf
Older Projects <2015
AgCLIR 2011 2012 USAID Abt, with AGRIFuture enabling environment across the country https://www.abtassociates.com/sites/default/files/2018-06/AgCLIR_Report_aug10.pdf
Agrifuturo 2009 2015 USAID Abt farmer owned swervice centers
Beira Corridor and Nacala Corridor
https://pdf.usaid.gov/pdf_docs/pa00kpvj.pdf
Beira Agricultural Growth Corridor (BAGC) 2011 2015 DFID GOM, private partners inputs, farmer associations, horticulture, marketing
Sofala, Manica https://beiracorridor.org
Cassava Platforms and PPPs 2007 2019 IITA DADTCO,SAB (beer), IIAM mobile processing units, value chain Beer
Nampula, Zambezia, Cabo Delgado
http://documents1.worldbank.org/curated/en/340481559135255608/pdf/The-Cassava-Value-Chain-in-Mozambique.pdf
Competitive Cashew Initiative (ComCashew) 2009 2019 German Federal Ministry for Economic Cooperation and
GIZ Agro processing, extension activities and advisory support to promote increase in
Across the country https://www.giz.de/en/worldwide/19011.html
COPAZA (Cooperative de Produtores de Alta Zambezia) 2012 2019 Emb Holland (TNS originally) IPWEU seeds for soy Zambezia https://www.technoserve.org/blog/a-new-model-for-producing-seed/
RAMA-NC 2016 2019 (interrupted)
USAID Winrock Intl promotion of land preparation services
Nacala Corridorhttps://www.agrilinks.org/post/how-lean-production-principles-help-farmers-get-information-they-need
Farmer Income Support Project (FISP) 2008 2017 MCC (USA) GOM, MSU, World Vison and others
coconuts and more Zambezia and more https://www.mcc.gov/resources/doc/summary-measuring-results-of-the-mozambique-farmer-income-support-project
Farmer Resilience & Rebuilding Initiative (FRRI) 2019 2020 Sweden, Dutch, Swiss
IDE Agricultural inputs, relief program
Sofala and Manica https://www.humanitarianresponse.info/sites/www.humanitarianresponse.info/files/2019/10/iDE-FRRI-Proposal---Full-version.pdf
FinAgro 2013 2017 USAID TNS finance Beira Corridor and Nacala Corridor
https://www.technoserve.org/our-work/projects/promoting-investment-and-competitiveness-for-agribusinesses/
Food for Assets program with Farmer Field School (FFS) 2016 2017 Irish Aid Care Capacity building in intercropping system, conservation agriculture techniques
Inhambane https://www.irishaid.ie/news-publications/news/newsarchive/2015/december/climate-action-irish-aid-mozambique/
Market-Led Smallholder Development in the Zambezi Valley (GEF)
2006 2013 World Bank GOM Climate change, land degradation
Tete, Sofala, Zambezia https://www.thegef.org/project/zambezi-valley-market-led-smallholder-development
MDDP: Mozambique Dairy Development Program USAID FFP Land O'Lakes Cattle and milk Manica province https://www.landolakesventure37.org/Where-We-Work/47
MERCADO: Mozambique Expansion of Rural Cattle and Dairy Opportunities
USDA Tillers, Land O'lakes Cattle and milk Manica province https://www.landolakesventure37.org/Where-We-Work/47
MozaCaju 2014 2018 USAID TNS, AgaKhan, INCAJU cashew Nampula, Cabo Delgado and Zambezia
www.mozacaju.com
PARTI: Plataforma 2007 2011 USAID, GOB GOB, IIAM (GOM), CGIAR breeding, conservation agriculture, Extension
Country wide
PITTA ( Integrated Program for the Transfer of Technology) 2011 2013 GOM GoM Extension various, extension, demonstration plots
Country wide https://www.digitalgreen.org/wp-content/uploads/2017/09/DLEC-Mozambique_Desk-Study_final.pdf
ProIrri Sustainable Irrigation Development 2011 2019 WB GOM irrigation investments Zambezia, Manica, Sofala
http://documents1.worldbank.org/curated/en/198091558718942398/pdf/Mozambique-MZ-PROIRRI-Sustainable-Irrigation-Devt.pdf
PRONEA Support Project 2007 2017 IFAD (EU,USA) MADER extension Country wide https://www.ifad.org/en/web/operations/project/id/1100001326/country/mozambique
ProSavana 2009 2019 JICA, GOM, GOB GOM soy, maize, productivity, laboratories, soil science
Nampula, Niassa, Zambezia
https://assets.publishing.service.gov.uk/media/57a08990ed915d622c0002a1/WP113_FAC.pdf
PROSUL: Pro-Poor Value Chain Development Project in the Maputo and Limpopo Corridors
2012 2019 Government of Mozambique via IFAD; Spanish fund ( STF)
MASA/CEPAGRI Horticulture, Cassava, red meat
South of Mozambique http://www.prosul.gov.mz/index.php/o-prosul
RAMA-NC 2016 2019 (interrupted)
USAID Winrock Intl promotion of land preparation servicesNacala Corridorhttps://www.agrilinks.org/post/how-lean-production-principles-help-farmers-get-information-they-need
WESDP: Women’s Entrepreneurship and Skills Development For Food Security
2008 2013 ADF Ministry of Women and Social Action (MMAS); GAPI
MSMEs, women entrepreneurship
Manica, Sofala https://www.afdb.org/en/documents/mozambique-womens-empowerment-and-skills-development-project-consolidation-phase-wesdp-ii-ipr-june-2020
World Bank AgDPO I and II 2013 2016 WB MINAG seed systems, policy, productivity, statistics
National http://documents1.worldbank.org/curated/en/586481522699244790/pdf/ICR-MZ-P129489-Final-ICR-03282018.pdf
Ikuru (producer owned marketing company) 2003 ongoing Norway, USAID AMPCM, CLUSA, Phoenix seeds
output marketing, associations, soy and other value chains
Primarily Nampula, Zambezia
https://www.youtube.com/watch?v=WKiAX6as11w
Smaller examples (private sector, off shoots of larger projects, etc.)

Projects/Programs Start date
End date Donor Implementing Organization
Value chains, topics
Locations Information and Evaluation sources
Jacaranda Agricultural Supply Company (see abopve Banana…) ongoing private sector Has taken over Matanuska in Nampula. Commercial banana export. Deals
Operates in Nampula, CD
http://www.jacaranda-agricultura.com/index.php/jacaranda-agricultura-group/jacaranda-agricultura-lda
GAPI (development finance institution) 1990? ongoing World Bank, USAID and others
private sector financial instruments, training, business management
Country wide http://www.gapi.co.mz
WOMEN IN BUSINESS 2019 2023 Sweden TNS, Banco Letshego trade, processing, SME, business development
Maputo https://www.businesswomenconnect.org/mozambique/#impact-moz-section
Novos Horizontes ongoing USAID, Norway private sector poultry Nampula, https://novoshorizontes.net/en/
Macs-in-Moz ongoing private sector macadamia nuts , litchis, citrus
Manica, http://www.mbb.co.za/2020/10/07/macadamia-curing-room-upgrade-for-macs-in-moz/
Dreamers ongoing private sector mechanization services
Gurue https://winrock.org/wp-content/uploads/2017/05/Mozambique-RAMA-Info-Sheet.pdf
Clean Star/NDZilo 2013 2014 private sector cassava, biofuels, cooking stoves
Maputo, Sofala (processing plant)
http://documents1.worldbank.org/curated/en/340481559135255608/pdf/The-Cassava-Value-Chain-in-Mozambique.pdf

Regional Perspectives on Implementing Agricultural Projects/Programmes: Lessons Learned in Zambia, Malawi and Tanzania for Future Programming Report prepared for Michigan State University with support from USAID Antony Chapoto1 Mulako Kabisa2
March 2021
Logos/branding
1 Research Director, Indaba Agricultural Policy Research Institute 2 Research Associate, Indaba Agricultural Policy Research Institute

2

3
Table of Contents
INTRODUCTION .......................................................................................................................................................................... 5
ZAMBIA............................................................................................................................................................................................ 8
A. BACKGROUND .................................................................................................................................................................... 8
B. ZAMBIA COMMUNITY MARKETS FOR CONSERVATION (COMACO) LANDSCAPE MANAGEMENT PROJECT ........ 9
C. PRODUCTION, FINANCE, AND IMPROVED TECHNOLOGY PLUS (PROFIT+) .......................................................... 13
D. AGRICULTURAL SECTOR SUPPORT PROGRAMME (ASSP) - FOOD CROP AND SEED PROJECT ............................... 17
E. FOOD SECURITY AND RESEARCH PROJECT (FSRP) ..................................................................................................... 21
F. REALIGNING AGRICULTURE TO IMPROVE NUTRITION (RAIN/RAIN+) PROJECT................................................ 26
MALAWI ......................................................................................................................................................................................... 31
A. BACKGROUND .................................................................................................................................................................. 31
B. IRRIGATION, RURAL LIVELIHOODS AND AGRICULTURAL DEVELOPMENT (IRLAD) PROJECT............................. 33
C. AGRICULTURAL SECTOR WIDE APPROACH SUPPORT PROJECT (ASWAPSP) ........................................................... 39
D. FARM INCOME DIVERSIFICATION PROGRAMME (FIDP) ............................................................................................ 44
TANZANIA ................................................................................................................................................................................... 50
A. BACKGROUND .................................................................................................................................................................. 50
B. FEED THE FUTURE NAFAKA I MAIN STAPLES VALUE CHAIN ACTIVITY............................................................... 51
C. SERA POLICY PROJECT ................................................................................................................................................... 56
D. AGRICULTURAL MARKETING SYSTEMS DEVELOPMENT PROGRAMME (AMDSP) .................................................. 63
LESSONS LEARNED FOR FUTURE PROGRAMMING................................................................................................... 70
FACTORS THAT MAY HINDER SUCCESS .................................................................................................................................... 70
ENVIRONMENT REQUIRED TO AID SUCCESS........................................................................................................................... 71
FUTURE PROGRAMMING ........................................................................................................................................................... 72

4
ACRONYMS
AMDSP Agricultural Marketing System Development Project (Tanzania) ASDP Agricultural Sector Development Program (Tanzania) ASSP Agricultural Sector Support Programme (Zambia) ASWAp SP Agriculture Sector Wide Approach Support Project
CAD Community Agro-dealers CHV Community Health Volunteers COMACO Community Markets for Conservation (Zambia) FCSP Food Crop and Seed Project (Zambia) FIDP Farm Income Diversification Programme
FSRP Food Security and Research Project (Zambia) FtF Feed the Future GDP Gross Domestic Product GOT Government of Tanzania ha Hectare IAPRI Indaba Agricultural Policy Research Institute IFAD International Fund for Agricultural Development IRLAD Irrigation, Rural Livelihoods and Agricultural Development MAFC Ministry of Agriculture, Food Security and Cooperatives (Tanzania) MoAFS Ministry of Agriculture and Food Security (Malawi) MSU Michigan State University MT/ha Metric tonnes per hectare NAFAKA Tanzania Staples Value Chain NCBA National Cooperative Business Association NGO Non-Governmental Organization PAG Policy Analysis Group PROFIT+ Production, Finance, and Improved Technology Plus (Zambia) RAIN Realigning Agriculture to Improve Nutrition (Zambia) RFSP Rural Financial Services Program (Tanzania) SADC Southern African Development Community SAGCOT Southern Agricultural Growth Corridor of Tanzania SCCI Seed Control and Certification Institute (Zambia) SCF Small Commercial Farmer SHF Smallholder farmer SIDA Swedish International Development Cooperation SME Small and Medium Scale Enterprise TASTA Tanzania Seed Traders Association USAID United States Agency for International Development WUAs Water User Associations ZAMSEED Zambia Seed Company

5
Introduction
Agricultural production in Sub-Saharan Africa has had a history of underperforming in
comparison to other regions in the world (Bjornlund, 2020).3 This undesirable outcome in the
region, though varying spatially and temporally, has been attributed to the persistent climate
shocks due to the rain-fed nature of production by the majority smallholder farmers, low input
use, under-developed agricultural infrastructure, and insufficient investment in the sector
(Ngoma et al. 2020; Libanda et al. 2016; GRZ 2016)4. Despite these challenges, the agricultural
sector in Sub-Saharan Africa has long been identified as one of the keys in enhancing economic
growth, as it provides employment for 53 percent of the population (World Bank, 2020).5 The
potential for investment in the agricultural sector on the continent has the added advantage of
having the largest and fastest growing market opportunity; with room to produce increased
quantities of safe and nutritious food for increasing populations (AGRA, 2020).6 This evidence
and market projections improve the case for why projects/programmes targeted towards
agricultural development across various nodes of the value chain make sense. Sustained
agricultural growth will require concerted efforts from various partners targeted at investments
into public goods that support the known key drivers of agricultural growth i.e. Research and
development, rural infrastructure, irrigation development, and extension, and aligning the
policy environment to support growth targets in collaboration with the private sector to ensure
sustainability (Mulenga et al., 2020; Jayne et al., 2010).7
In this document, we present case studies of recent (last 10 years) agricultural programs within
the region that had a lasting impact on: improving agricultural productivity, access to markets,
3 Bjornlund, V., Bjornlund, H., & Van Rooyen, A. F. 2020. Why agricultural production in sub-Saharan Africa remains low compared to the rest of the world–a historical perspective. International Journal of Water Resources Development, 36(sup1), S20-S53. 4 Ngoma, H., Lupiya, P., Kabisa, M., and Hartley, F., 2020. Impacts of climate change on agriculture and household welfare in Zambia: An economy wide analysis. Working Paper No. 132. Southern Africa – Towards Inclusive Economic Development (SA-TIED). UNU-WIDER; Libanda, J., Nkolola, B. and Nyasa, L. 2016. Economic significance of agriculture for poverty reduction: The case of Zambia. Archives of Current Research International, pp.1-9; Government of the Republic of Zambia (GRZ). 2016. National Policy on Climate Change. Ministry of National Development and Planning. 5 World Bank. 2020. Data indicators, accessible at https://data.worldbank.org/indicator/SL.AGR.EMPL.ZS?locations=ZG 6 AGRA. 2020. Africa Agriculture Status Report. Feeding Africa’s Cities: Opportunities, Challenges, and Policies for Linking African Farmers with Growing Urban Food Markets (Issue 8). Nairobi, Kenya: Alliance for a Green Revolution in Africa (AGRA). 7 Mulenga, P. B., Kabisa, M., Chapoto, A., & Muyobela, T., 2020. Status of Agriculture in Zambia 2020, Technical Paper. December 2020, Indaba Agricultural Policy Research Institute, Lusaka, Zambia; Jayne, T. S., Mather, D., & Mghenyi, E. (2010). Principal challenges confronting smallholder agriculture in sub-Saharan Africa. World development, 38(10), 1384-1398.

6
farmer incomes, and rural job creation. Ideally, these case studies provide information on
factors that contributed to success, and replicability. The final section summarizes the lessons learned and recommendations. For these case studies, the Indaba Agricultural Policy Research
Institute (IAPRI) researcher and research director Dr. Antony Chapoto identified key collaborators
in Zambia, Malawi and Tanzania to develop the case studies for the respective countries, as are
found below.

7
METHODS
The review of the programmes/projects were done through a two phased approach. Desk review
and key informant interviews were held in this assessment.
Data collection
Key informant interviews were held to get insights into some known agricultural projects that have
had a long lasting impact in the agricultural sector (Annex 1). A long list of ten projects/programs
from the last two decades were compiled from these interviews. The criteria for the key informants
contacted were:
• At least 15 to 20 years’ experience in the agricultural sector in Zambia, Malawi and Tanzania
• Conversant with a variety of agricultural value chains in the country to give a more balanced view on successful projects/programs
The projects in the long list were further refined by using Key Informants that had sector specific
knowledge. A Google form was developed to rank the success of the programmes/projects. The
Google form used had the following components to aid in the assessment (Annex 2)
• Familiarity with long listed projects
• Impact ranking for projects informant is familiar with by indicator (agricultural productivity, farmer access to markets, farmer income, household food security and nutrition, rural jobs, women inclusivity and youth inclusivity).
• Shortlisting 3 top projects perceived to have had the highest success and perceived reasons for this
• Contacts of individuals that were part of projects 1 to 3 and any other comments
The data were collated and content analysis was done to determine the top three projects as determined by the identified key informants. Their rankings on impact based on the seven indicators were also considered during the determination of the shortlisted projects.
Data analysis
The analysis of the qualitative information collected through the Google form and Key Informant
Interviews were collated into themes in Microsoft Excel. The frequency of the number of times a
project was ranked in the top three and the frequency of the project being identified as having had a
high impact in any of the seven indicators was also recorded. Document review was done to identify
successes, challenges and lessons from the identified projects. Comments from the Key Informants
were also integrated into the analysis in determining the reasons for success

8
Zambia
A. Background
Agriculture is the mainstay of Zambia’s economy and provides 22.3 percent of employment
opportunities in the country (ZamStats, 2019).8 In the past decade, it has contributed an average of 6
percent annually towards the country’s Gross Domestic Product. Similar to many countries in the Sub-
Saharan African region, growth in the sector is largely driven by area expansion as opposed to
productivity growth, an unsustainable means of sector development. Production is largely rainfed,
maize-centric, and dominated by smallholder farmers with inadequate access to, inputs, technology,
finance and markets to maintain resilient and sustainable growth.
Production in the sector is taking place in a changing agricultural landscape, in which there are more
frequent extreme climatic events and incidence of pests and diseases (Ngoma et al., 2020; Kabisa and
Samboko, 2020).9 This presents new challenges that conventional public sector support is not able to
keep up with. This is evident from historic records showing the insufficient funds that have been
consistently allocated and disbursed to sector activities that are the known key drivers of agricultural
development.10
In meeting some of the fiscal and technical requirements to ensure sector growth, non-state actors have
stepped in to close this gap. These actors include donor projects that have had a high impact on various
aspects in the agricultural sector. This work does a systematic review of four such programs/projects in
Zambia that have been identified to have had a long-lasting impact in Zambia’s agricultural sector. The
review has three main objectives:
1. Assess the approaches used for the identified programmes/projects
2. Document the successes and failures of the identified programmes/activities
3. Discuss the replicability and potential constraints to it
This review is aimed to document some lessons learned that can inform future design and
implementation of agricultural programs that have long lasting impact in the agricultural sector.
8 Zambia Statistics Agency (2019). The Statistician, Central Statistical Office, June 2019, Volume Eight, Lusaka. 9 Ngoma, H., Lupiya, P., Kabisa, M., and Hartley, F., 2020. Impacts of climate change on agriculture and household welfare in Zambia: An economy wide analysis. Working Paper No. 132. Southern Africa – Towards Inclusive Economic Development (SA-TIED). UNU-WIDER; 5. Kabisa, M. and Samboko, P.C., 2020. Use of Science and Technology in Agriculture – Public Perceptions of Biotechnology, Indaba Agricultural Policy Research Institute, Lusaka, Zambia 10 Research and development, rural infrastructure, irrigation development, and extension

9
The next sections discuss the five projects that were shortlisted by key informants. The short listing was
based on a three point ranking system of success. Their impact was also ranked based on seven
indicators – agricultural productivity, farmer access to markets, farmer incomes, household food
security and nutrition, rural jobs, women’s inclusivity and youth inclusivity. Based on these criteria, the
projects that were ranked as most successful and impactful were the Food Security and Research Project
(FSRP), the Zambia Community Markets for Conservation (COMACO) Landscape Management Project,
the Production, Finance, and Improved Technology Plus (PROFIT+) project, the Agricultural Sector
Support Programme (ASSP) - Food Crop and Seed Project, and the Realigning Agriculture to Improve
Nutrition (RAIN/RAIN+) project respectively.
B. Zambia Community Markets for Conservation (COMACO) Landscape
Management Project
Country: Zambia
Donor: World Bank
Implementing agency/organization: COMACO
Period (dates): April 2015 to October 2019
Amount of funds: US$ 1.33 million
Value chains addressed: Natural Resources
Geographic zone(s): Eastern Province Luangwa valley - Magodi, Zumwanda, Chikomeni,
Masemphangwa, Jumbe, Chikuwe, Nyampande, Mwape, and Luembe chiefdoms
Expected beneficiaries: 19,399 smallholder farmers
About COMACO
COMACO is a social enterprise that supports wildlife conservation and small-scale farmers in Eastern
Zambia. The enterprise works to provide alternative livelihood skills and train small-scale farmers in the
leading practices of climate-smart, sustainable agriculture. They then buy crops from the farmers at
premium market prices and turn them into high-value food products that are sold across Zambia under
the brand It’s Wild!
Overall Objectives
To reduce emissions of Green House Gases through the sustainable management of 197,246 cubic ha of
land traditionally devoted to community activities, through both agricultural and nonagricultural
interventions.
Expected results

10
To address the poor farming practices such as residue burning that led to rapid soil nutrient depletion, destruction and fragmentation of forests resulting from a general lack of participatory and coordinated land use planning and forest management in the eastern province of Zambia.
Program component #1: Sustainable Agricultural Land Management
Objectives: Promoting widespread adoption of climate-smart agricultural practices targeted at achieving
sustainable, agricultural production, increasing farmers’ income, and sequestering carbon.
Principal activities:
Training in climate smart agricultural practices
Implementing institutions/organizations (if different from overall):
Impacts:
Agricultural productivity: Over 19,399 farmers adopted climate-smart agriculture and sustainable land
management practices on 17,130 ha of agricultural land across nine chiefdoms. Adoption of these
practices resulted in improved productivity on selected crops particularly during normal agriculture
seasons and maintaining average productivity in seasons characterized by shocks like droughts as was
the case in the 2018/2019 agricultural season when the project had already come to an end.
Farmer access to market: COMACO trained the smallholder farmers in sustainable agriculture and forest management, bought their crops and honey at premium prices, added value to these products (e.g. dry mushrooms, sundried mango etc.) and sold them countrywide under the brand name ‘It’s Wild!’. There was high farmer compliance because the benefits were gotten before the revenue from carbon finance was received.
Program component #2: Reducing emissions from deforestation and forest degradation, and the role of
conservation, sustainable management of forests and enhancement of carbon stocks
Objectives: Protecting and expanding areas under natural forest and biodiversity conservation.
Principal activities:
Establishment of 14 ‘green zones’ to protect the forests from deforestation and/or degradation through
participatory demarcation of community conservation areas
Preparation of nine community conservation plans
Promotion of non-extractive use of the forest e.g. beekeeping for honey production
Training of farmers in improved agriculture land management practices to improve crop yields on farm
plots without opening up new ones in forest areas
Impacts:

11
Farmer incomes: a total of US$531,845.47 in carbon payments was paid to all participating chiefdoms
and farmer cooperatives for the first and second verifications
Program component #3: Project Management
Objectives: Providing project development and implementation technical assistance during the project
period.
Principle activities:
Feasibility assessment for Emissions Reductions
Baseline preparation and verification
Discussion:
The project was the first of its kind in the country linking sustainable agriculture and reducing
deforestation, forest degradation and enhancement of carbon stocks through conservation through
results-based payments. This set it apart from other projects in the use of this holistic approach.
Some of the attributes as identified by the key informants in the functioning of this project were that
the project was deliberately designed to improve household food security, was gender sensitive and
private sector-led for sustainability and participation by a cross section of the rural society. It was also
noted that its approach was unique in that there was a high private sector approach which has made it
successful and sustainable beyond the project end. An observation was made also that as a business
enterprise, it offered alternative livelihoods to small producers as well as a market for those that
conform to good environmental stewardship, an area that had been difficult to implement. The clear
success of the “It’s Wild” brand that can be seen in the retail chain stores in the country speaks to the
success of the activities of this project to date.
Conclusions:
Necessary conditions that drove success: The key conditions that brought success to the project can be outlined as follows:
o Cross-sectoral planning, co-ordination and integration among the various sectors dealing with climate change, forestry, agricultural development and food security is critical
o Climate mitigation efforts were complemented with farm productivity and market linkage activities to work towards addressing the drivers of deforestation
o The project developed a clear benefit sharing mechanism with the local communities, a typical thorny issue with projects focused on natural resources management.
o It detailed the roles and responsibilities of all parties. o Due diligence was done with all the key stakeholders before receiving the emissions reductions
payments and this aided in the success. o Transparency, openness and management of expectations were key factors that helped in their
success.

12
o The payment for carbon credits was a clear incentive for behaviour change and in addressing some of the barriers in the adoption of sustainable land management practices
Other key factors contributing to success: Development of a benefit sharing mechanism that outlined
that the local community would benefit more than the project implementer seemed to have worked in
the favour of project implementation and success
Key factors limiting success: There were some aspects of the project that limited the success of the
project and these are outlined as follows:
o There was inadequate support towards environmental management technical support for certain aspects of agricultural production like poultry to ensure that environmental measures were fully considered
o Budgetary constraints to engage government at national and provincial level for policy and strategic guidance was initially the issue though other governance structures were used
Replicability and constraints to replicability in other contexts: It was established that this sort of project
can be replicated in different contexts as long as the following measures are taken into cognizance:
o Blended public and private financing is required to cover upfront capital costs. This can be a
challenge in a resource constrained setting in which the implementer does not have access to a
pool of funds before implementation
o Development of a clear market incentive strategy that ensures that smallholder farmers are
disincentivised from engaging in deforestation. Specifically, addressing the key drivers of
deforestation in the areas and laying out clearly the monetary and non-monetary benefits that
the communities will have access to.
o The use of innovative tools that are co-produced with the communities to ensure by-in
o Building strong partnerships between the implementing partners and local stakeholders to
ensure sustainability
Reference documents: World Bank COMACO Implementation Completion and Results Report

13
C. Production, Finance, and Improved Technology Plus (PROFIT+)
Country: Zambia
Donor: United States Agency for International Development (USAID)
Implementing agency/organization: ACDI/VOCA – Catholic Relief Services, Crown Agents, DANYA,
International Fertilizer Development Center
Period (dates): 2012 - 2017
Amount of funds: US$24 million
Geographic Zones: Eastern Province (Petauke, Katete, Chipata, and Lundazi) and peri-urban Lusaka
(Chibombo, Chongwe, Rufunsa, Chilanga, and Kafue)
Value chains addressed: Maize, groundnuts, soybean, sunflower, onion, and tomato, and honey in year
four
Expected beneficiaries: 200,000 smallholder farmers
About PROFIT+
PROFIT+ was a USAID funded project that developed rural market systems that enabled farmers to
achieve economic empowerment, increase food security, and decrease poverty by boosting smallholder
productivity and access to markets and trade. An integral approach of the project was the use of
Agribusiness Savings and Credit Groups and CADs that served as agents for commercial companies. Their
linkages with Agribusiness Savings and Credit Groups created vibrant rural market infrastructure,
facilitated credit, and enhanced trade within the maize, sunflower, onion, and tomato value chains.
Overall Objectives:
To increase food security and decrease hunger through agriculture led growth and inclusive market
access by smallholders
Expected results:
Provide market-system solutions to create opportunities for farmers and agribusinesses to increase
agricultural productivity and access high-value markets, while facilitating private-sector investment in
target value chains. One critical element of the project was the formation and training of 200 CADs who
established the initial links between service providers and smallholder farmers in rural communities.
Also, to achieve a 30 percent increase in agricultural productivity and a $125 million increase in value of
agricultural sales, resulting in an increase of incomes for 200,000 smallholder farmers, processors, and
other value chain actors in four of the nine districts of the Eastern Province by 2017
Program component #1: Smallholder Productivity

14
Objectives: To increase food security and increase income, PROFIT+ called for increased agricultural
productivity
Principal activities: Technology testing (soil sampling, minimum tillage, liming, integrated pest
management, demonstration site setup etc.), technology transfers, Farmer Business Advisor models,
and increasing availability of certified seed. Technology testing included demonstrations to teach new
technologies, such as among others. Furthermore, demonstration sites
Impacts:
Agricultural productivity: Agricultural productivity was reported to have increased as follows: Maize –1.6
to 3.1 metric tonnes per hectare (MT/ha); Soya beans –0.8 to 1.2 MT/ha; Sunflower – 0.6 to 0.8 MT/ha;
Groundnuts –0.6 to 1.1 MT/ha; Tomato 8.2 to 9.8 MT/ha. Veterinary products were also available
through community agro-dealers hence improving livestock production. Promoted the use of new
technology, aflasafe, and submitted to Zambian Bureau of Standards for approval.
Farmer access to markets: Developed rural market networks and partnerships through promotion of
new technologies.
Household food security and nutrition: Some unexpected successes of the project were that meal
frequency increased because of the promotion of diversified production even though nutrition was not
explicitly the goal of the project.
Rural job creation: 620 (298 Female) permanent jobs, and over 32,700 short term basis jobs were
created
Inclusivity of women: Of the 164,523 direct beneficiaries, 87,798 of the respondents were female and
298 women (out of 620 beneficiaries) held permanent jobs by the end of the project
Program component #2: Markets and Trade
Objectives: To increase the value of agricultural sales through expanded markets and trade.
Principal activities: Facilitating commodity marketing, empowering producers to become better
negotiators for prices, and linking producers to traders
Impacts
Farmer access to markets: The project worked on linking producers and aggregators with some large
buyers such as Cargill and the World Food Program. There was a 43percent increase in trade output
from the project and it supported traditional community groups. Reduced levels of aflatoxin in
groundnuts to acceptable export standards.
Farmer incomes: More than ZMW 12,924,603 (more than US$1.8 million) worth of trade of commodities
was facilitated mainly through forward contracts. Linked “Delicious Milling Limited of Lusaka” to five
cooperatives in Chipata district to purchase maize. Increased household incomes of smallholder farmers

15
through aggregation efforts to reduce transaction costs and increase profit margins. Facilitated linkages
with Zambia Cooperative Federation for 11 primary cooperatives to access solar powered mills on credit
Program component #3: Private sector investment in agriculture
Objective: To increase competitiveness of smallholder Zambia farmers
Principle activities: Collaboration with private sector entities and the establishment of collaborative
agreements with value chain stakeholders to provide training of seed inspectors, training in production
technologies, and advising in trade.
Impacts
Farmer market access: Established memoranda of understandings (MOUs) with 45 entities, notable
partnerships include the World Food Programme, Adventist Development and Relief Agency, and Afgri
Corporation among others. Linked ten CADs to four established horticulture inputs suppliers.
Farmer incomes: Invested in processors to diversify product lines
Discussion
The PROFIT+ project was recognized for the important role it placed on using markets as a pull factor in economic development, specifically in promoting agriculture as a business. Their main activities involved building rural small businesses like community agro-dealers and this improved rural livelihood opportunities. Specific strengths of the project was the promotion of aggregators for input and output markets. Another strong point of the project noted was that it encompassed productivity and market access through private sector entrepreneurship. The ultimate reason for its rating as highly successful was that it culminated into the formation of Musika Development Initiatives Ltd is a successful Zambian non-profit company with a mandate to stimulate and support private investment in the Zambian agricultural market with a specific focus on the lower end of these markets.
Conclusions:
Necessary conditions that drove success: There were several conditions in place that drove the success
of the project.
o The high emphasis by the project on agriculture and business trainings helped transform how
farmers produced their crops and helped shape their view of farming as a business.
o The linkages the project made with input suppliers and the CADs was critical in supporting the
setup of these business and for those still active after the project, these relationships have
continued
o The strong emphasis on gender inclusion helped foster the female agency, voice, and leadership
amongst households participating in the project
o The project overcame some of the constraints to access to finance by working with other
partners (Catholic Relief Services) to start Saving and Internal Lending Communities (SILCs) that
were sustainable outside the life of the project and provided low interest capital. Though not

16
agricultural related, membership to these groups also helped build trust between CADs and
members in the communities and opened up channels to build a wider customer base
Key factors limiting success: Some factors that limited success of the project were identified as follows:
o The emphasised roles of many local small and medium enterprises were seen as a missed
opportunity in the facilitation of markets, but the project ended before more could be done in
this regard.
o Project activities that were started or scaled up towards the end of the project e.g. Producer
Companies, received limited support and hence had limited impacts with some failing altogether
because the Community Agro-dealers were still too inexperienced when the project came to an
end
o Continuous changes and issues in internal management interfered with the implementation of
the work and had these been rooted out early on in the project, the impacts on the various
activities being promoted would have been more robust
o Weaknesses in the definition of selection criteria for CADs and insufficient grants or seed money
to help them grow their businesses ultimately made it difficult for the rural employment
objective to be met in this regard
o Inadequate on farm and processing equipment made it a challenge for farmers to access
improved technologies; and this challenge was compounded by high input costs and low
commodity prices, hence reducing the space for technology adoption to enhance productivity.
Replicability and constraints to replicability in other contexts: Some key considerations in the
replicability and constraints that may be experienced in other contexts can be summarised as follows:
o Provision of funds for any activity must be clear and targeted with a clearly laid out selection
criteria. Specifically, any grants given within the project must focus on project objectives to have
measurable impact.
o A transition and phase out plan for activities needs to be clearly laid out and communicated too
project recipients. This plan should also be in line with project activities to ensure that activity
implementation is not started too close to the close out date to ensure that measurable impact
is made by the end of the project.
o Any project that has a strong gender component in its activities needs to be cognizant of the
gender dynamics rooted in the place of operation
Reference documents: EX-POST Evaluation of USAID/Zambia’s Production, Finance, And Improved
Technology Plus (PROFIT+) and Feed the Future Zambia Nutrition Sensitive Agriculture Project Review

17
D. Agricultural Sector Support Programme (ASSP) - Food Crop and Seed
Project
Country: Zambia
Donor: Sida (Swedish International Development Cooperation Agency)
Implementing agency/organization: Soils and Crops Research Branch, Zambia Seed Company
(ZAMSEED)
Period (dates): 1981 to 1997
Amount of funds: US$30.1 million
Value chains addressed: Maize, Sorghum, Finger millet, Pearl millet, Forage and Pastures, vegetables
Geographic zone(s): Zambia
About Food Crop and Seed Project:
The Food and Crop Seed Project was a Sida funded project aimed at developing and making available
appropriate on-farm production and post-harvest technologies in important crops grown by all farmers,
particularly small scale and women farmers. The project focused on crops that were expected to have
maximum impact on smallholder production, nutrition, crop diversification, food security and income
generation.
Overall Objectives:
To develop and make available appropriate on-farm production and post-harvest technologies in
important crops grown by all farmers especially small scale and women farmers
Expected results:
To support the production of crops are expected to have maximum impact on smallholder production,
nutrition, crop diversification, food security and income generation and private entities;
Program component #1: Plant breeding
Objectives: improvement of agricultural research being carried out by the Ministry of Agriculture, Food
and Fisheries, formation of a commercial seed company organized as a joint venture between the
government and establishment of the Seed Control and Certification Institute (SCCI).
Principal activities: Seed quality (inspection, seed testing, variety testing and registration) and training
of government officers and staff of Non-Governmental Organizations involved in seed multiplication and
distribution in seed quality aspects
Impacts:

18
Agricultural productivity: the programme contributed to agricultural productivity in four ways:
o It contributed to increased genetic diversity (between and within crops, between and with
varieties) mostly through the importation of exotic material, and subsequently productivity was
enhanced as benefits from new varieties included high yields, disease and insect pest resistance
and early maturity
o Project led to the finalization of the National Seed Policy
o The commissioned seed varieties led to enhanced research and development in the private
sector, a situation still prevailing to date
Farmer incomes: Higher yields were reported to have resulted in more harvest to sell and therefore
increased farmers’ income
Household food security and nutrition: Improved crop varieties were reported to have increased food
security at household level and thus possibly poverty alleviation. On the average, the improved varieties
produced 20-60 percent higher yields under smallholder conditions as compared to the traditional
varieties, and contributed to higher food security at both the household and national level. The project
also contributed to crop diversification which increased food security at household level through the
increased availability of a number of crops and varieties at farm level.
Program component #2: Capacity strengthening
Objectives: Provision of training for research, extension in the seed industry
Impacts
Agricultural productivity: farmers’ capacity in seed production techniques were greatly enhanced
through training provided in conjunction with the SCCI and the Sida funded project on Economic
Expansion in Outlying Areas for the ZAMSEED Programme. The programme ultimately led to the
formation of ZAMSEED that still exists to date, a seed company that organizes the multiplication of seed
varieties developed by the Research Branch and to carry out their processing, storage and distribution to
farmers.
Discussion:
The program was lauded specifically for designing and achieving the usage of certified seed that raised productivity and incomes of rural poor farmers. It also promoted effective extension work by government agricultural staff. Another critical element of its success was that it facilitated adequate funding for the research department (Zambia Agricultural Research Institute) of the Ministry of Agriculture. The program was holistic covering the whole value chain of food systems. It specifically recognized agriculture as a business and resulted in significant improvement of livelihoods of farmers in the rural areas.
Conclusions:
Necessary conditions that drove success: Several conditions aided in the success of the programme.

19
o The strong participation of the private seed sector and NGOs in seed multiplication, distribution
and crop commercialization was critical in sustainability and continuation even after the
programme came to an end
o There was an appetite for hybrid seed development nationally and this allowed for
development of a variety of crops for commercialization
o The capacity building of state agencies in plant breeding helped in getting new varieties to
smallholder farmers
Key factors limiting success: Some factors that were identified that could have limited the success of the
project, or at least the evaluation of its impact, are summarised below.
o It was noted that there is need for clearer dialogue platforms for key line ministries and
collaborators in agriculture and those responsible for the environment and natural resources.
o The continued high demand for maize even when farmers diversify their cropping pattern
hampered market development for these other crops. This was seen as a challenge especially
because farmers had no control over market demand.
o The lack of description of specified breeding objectives in relation to farmers’ requirements for
the different agro-ecological regions was seen as a weakness in enhancing uptake of improved
varieties.
o Integration of agro-biodiversity was identified as a missed opportunity in the implementation of
the programme
Replicability and constraints to replicability in other contexts: Some points identified by the
programme in ensuring replicability of the program and potential pitfalls are:
o Financial sustainability of research, public or private, in crops with a low marketing potential is a
risk. Concerted efforts need to be made between the public and private sector in collaboration
with farming communities to work out a programme of crops to focus on that can bring
sufficient funding from the commercial market players.
o A key component in replicability of the project is a comprehensive coordinated approach in
biodiversity promotion that does not cause disharmony among the different stakeholders
o Public national and international research towards the development of open pollinated varieties
allows farmers to multiply seed themselves. Therefore, successful commercialization of the
research and seed sector may not be viable
o Topical issues such as intellectual property rights (for both breeders and farmers), biosafety and
biotechnology in agriculture have to be taken into account currently
o An explicit gender perspective is required in programming because of the known role women
play in agriculture and biodiversity conservation
Other observations: A gender impact assessment was not done for this programme, this would have
been helpful in evaluating women’s participation in the activities.

20
Reference documents: Integration of biodiversity aspects in development cooperation – a case study
Food Crop and Seed Project in Zambia

21
E. Food Security and Research Project (FSRP)
Country: Zambia
Donor: USAID, Sida
Implementing agency/organization: Michigan State University in collaboration with Agricultural
Consultative Forum, the Ministry of Agriculture, Food and Fisheries now Ministry of Agriculture
Period (dates): 1999 to 2015
Amount of funds:
Overall Objectives:
To improve the capacity for agricultural policy analysis in Zambia through in-service capacity building,
applied research and analysis, and policy outreach
Expected results:
To generate and integrate research findings into national, regional, and international policy strategies to
promote sustainable agricultural growth as a means to cut hunger and poverty in Zambia
Contribution to agricultural policy in Zambia
The FSRP project was a unique project in the country as it ventured into the area of agricultural policy
influence through evidence generation and dissemination. Some of the key achievements of the project
are summarised below.
• FSRP studies on fertilizer marketing and farm-level profitability helped inform the debate on the
respective roles of government and private fertilizer marketing firms
• The project provided technical assistance and in-service training for private and public sector
partners including the Central Statistical Office (now Zambia Statistics Agency), Ministry of
Agriculture, Golden Valley Agriculture Research Trust etc.
• Data was made more accessible encouraging overall use of the data, while improving quality
and gradually increasing end-users' confidence in the data and subsequent analysis. This was
particularly due to the technical support provided in carrying out large scale national survey and
later implementing surveys of this nature itself
• Project spearheaded the collection of evidence on the need for an electronic voucher system for
input distribution. The resultant organization IAPRI was later responsible for the monitoring of
the implementation of the rolled out electronic voucher system
• High level policy engagement was also a key activity that helped in disseminating key research
outputs relevant to policy making to parliamentarians and other relevant authorities.
All these activities led to an increased appetite for evidence to guide policy formulation and
implementation. The project ultimately led to the establishment of IAPRI, the leading indigenous

22
agricultural think tank in Zambia that continues to perform high quality agricultural policy research not
only in Zambia, but the region.
Perspectives from key informants
Key informants with institutional memory gave some perspectives of changes that resulted from the FSRP in the sector.
Policy influence
FSRP focused on the policy issues, which helped in creating the enabling environment for economic development realization through the agricultural sector. The project guided government and other stakeholders on positive agricultural policies that led to increased agricultural productivity, marketing and processing. Further, it helped in the pushing for reduced government expenditure by advocating for policies that were inclusive for the private sector.
Evidence use
The project created appetite for government and stakeholders to start using evidence – specifically for policy decision making to enhance sustainable agriculture growth in the country.
Capacity building
The project helped build capacity in data collection and analysis in the Early Warning Unit in the Ministry of Agriculture to collect crop production statistics each year and the development of an Agriculture Market Information System. The project also built capacity in terms of data collection and analysis for a variety of institutions, all of which helped in the availability of quality agricultural data in the country.
Sustainability beyond the project
The project successfully transitioned into a permanent Institute. IAPRI, a local agricultural think tank that is a center of excellence for agricultural policy research, was established when the project came to an end. It has continued providing evidence and support to the Zambian government. A key achievement of this institute has been bringing evidence on key drivers of agricultural productivity to the fore of agricultural policy debates in Zambia. Although policy changes take time to show results, the evidence generated using robust science based information gathering systems through the Institute has been invaluable to stakeholders especially decision makers.
Lessons Learned from Africa Think Tanks with link IAPRI
Agricultural policymakers in Africa are increasingly facing the need for policy options backed by evidence
due to rising public expenditure, the dynamic nature of issues in agricultural sector, and emerging
needs. However, the long term performance of policy analysis units within the Ministries responsible for
Agriculture in Africa has not been effective mainly due to poor remuneration and limited Ministry
budget towards policy research to recruit and retain staff with highly specialised skills for policy analysis.
In addition, the independence and objectivity for outputs generated by public sector related think tanks
has often been questioned particularly that their findings are thought to mostly be in line with the

23
prevailing political economy. As a result, local independent agricultural policy analysis think tanks were
established to generate policy evidence and proffer recommendations to policymakers accordingly,
rather than relying on external experts.
In the 1980s and 1990s, these think tanks were established in affiliation with universities in countries
with strong existing agricultural institutions such as the Tegemeo Institute of Agricultural Policy and
Development at Egerton University in Kenya and the Bureau of Food and Agriculture Policy at University
of Pretoria and University of Cape Town to name but a few.
During this same period, donors including World Bank, also supported establishment of policy think
tanks to provide technical assistance to Government Ministries such as Ministry of Finance on macro-
economic matters in many countries in Africa. Further, in these recent years, a number of indigenous
independent policy think tanks are surfacing in different countries to provide evidence for policy
formulation. The Livelihoods and Food Security Programme policy technical partner, IAPRI, falls into this
last category
Given such cases on which policy think tanks supported policy formulation in different African countries
for the past four decades, there is therefore various lessons that can be learned for the formation of an
agricultural policy analysis, development and implementation focused Think Tank in Zimbabwe as
follows:
• Policymakers must be confident that they can make their needs known, and that policy analysts will
address these needs professionally and on time. This means that ownership by national decision
makers and their trust matter a lot. Hence, it is very critical for the success of think tanks to work
closely with the Ministry responsible for agriculture and other related ministries such as Ministry of
Finance.
• Being an agricultural policy think tank that supports evidence generation for policy formulation and
implementation requires working with a number of stakeholders apart from the Ministry
responsible for agriculture alone. Thus, strong links and partnerships with different ministries,
parliamentary portfolio committees, media, farmers and trade associations is critical. However, if
not thought out clearly, the collaboration may result in increasing costs. Hence, think tanks should
create demand for their expertise and skills so that it can provide a service to different stakeholders
including the private sector.
• Independent think tanks are usually good for rigorous policy research and analysis, but usually face
challenges in moving research findings into use in the policy process. Hence, it is very important for
think tanks to embark on action-oriented policy research, analysis and policy implementation
support that endeavors to solve the current agricultural challenges and sector priorities. Think tanks
also need to actively participate in existing multi-stakeholder platforms and collaborate with other
regional think tanks to articulate lessons learned from the region when making policy
recommendations.
• The success of think tanks in Africa has often been based on policy outcomes rather than being
measured by their contribution and influence. The key motivation for providing research evidence

24
should be to inform the key stakeholders in the policy process, rather than to guarantee a particular
outcome. As such, the metric of success should be the contribution of the research to informed
debate, rather than attribution of an outcome to research products. Hence to ensure positive policy
influence, think tank activities should be aligned to agricultural sector priorities and embedded into
the policy processes. This means think tanks should endeavor to work jointly with technical staff
from agriculture ministries and also ensure that their outputs significantly contribute to policy
development. In addition, think tanks should help build the analytical capacity of key public sector
technical staff in areas of data collection, analysis, policy development and policy implementation,
monitoring and evaluation.
• The activities of policy think tanks to strengthen the whole agricultural policy value chain should
involve many discrete activities including: building human capital; assembling better data; building
research systems to use the data; fostering skills to interpret research findings; adding capacity for
evaluation and impact assessment; enhancing communication and outreach; connecting with
decision-makers in a timely manner; and monitoring of outcomes. Informed policy debates require
improved institutional capacity of public agencies and civil society organizations to curate, interpret,
consolidate, refine, and use evidence. Hence, the need for credible policy think tanks cannot be
over-emphasised.
• Last but not least, most think tanks in Africa face funding challenges a few years after their
formation. This is mainly because their primary source of funding is from short-term development
programmes/projects supported mainly by cooperating partners. The lack of long-term diversified
funding sources often result in many think tanks failing to sustain the production of key pubic goods.
Generally, the participation of local agricultural stakeholders in funding local think-tanks is limited
due to lack of appreciation of the role of policy in agriculture sector development as well as the
inability of think tanks to innovatively co-create products that directly benefit the various categories
of stakeholders including government. One way for mobilising resources domestically is through
providing professional services to various stakeholders in the agricultural sector including
government. A good example, is the Bureau for Food and Agricultural Policy in South Africa which
has successfully embedded business development in its operations to generate resources to fund
some of their public good activities. The Bureau for Food and Agricultural Policy, responds to specific
requests by key agents in the policy process, often working under contract to deliver agreed
outputs.
Therefore, the success of think tanks hinges on their ability to build in the innovative financial
sustainability aspect into all their activities from the onset. To achieve this, think tanks should have a
diversified funding portfolio that includes providing professional services to private sector, farmers
unions and their associated commodity associations, government and cooperating partners.
Nevertheless, at inception, new think tanks require financial, human and material resources from
various sources including cooperating partners who have resources for long-term local institutional core
capacity strengthening.

25
Reference documents: See the Fact Sheet and the webpage listing through 2008 with listing of the
research outputs through time.

26
F. Realigning Agriculture to Improve Nutrition (RAIN/RAIN+) Project
Country: Zambia
Donor: Irish Aid, Kerry Group/Ireland, Department for International Development (DFID)
Implementing agency/organization: Concern Worldwide and the International Food Policy Research
Institute
Period (dates): RAIN - 2011 to 2015; RAIN+ extended activity to 2018
Amount of funds: €3 million Irish Aid, Kerry Group/Ireland; £1.56 million by DFID for RAIN+
Value chains addressed: 19 different varieties of garden vegetables, goats and chicken
Geographic zone(s): Central Province - Mumbwa district
Expected beneficiaries: 4400 households that have pregnant/lactating women and children under 2
years
About RAIN/RAIN+
The RAIN/RAIN+ project was a research project that ran from 2011 to 2018 in Mumbwa district to
determine the root causes of malnutrition and to address them directly through better agriculture. The
project used a multi-sectoral approach to improving nutrition by combining interventions on nutrition
behavior change, women’s empowerment, and the promotion of diverse food production. The project
showed positive impacts on agricultural production and household food security (in terms of food
availability, access, and utilization) working through women’s groups and group leaders who received
training from agricultural extension officers and activity staff who then passed on the information and
skills to their group members. This led to an extension of project activities to RAIN+ that addressed
some market access shortfalls that were identified in the first phase (RAIN). This phase worked on
developing markets for nutritious foods and women’s empowerment as pathways to improve nutrition.
Overall Objectives
To develop a sustainable model that integrates and realigns agriculture and nutrition/health interventions to effectively prevent child and maternal undernutrition among poor rural communities that can be replicated and brought to scale to contribute to the achievement of Millennium Development Goal number one.
Expected results

27
To develop and disseminate a model capable of reducing maternal and child undernutrition through a
multi-stakeholder, multi-sectoral approach integrating agricultural, nutrition and maternal and child
health interventions with women’s empowerment and the systematic promotion of gender equality.
Program component #1: Food Systems
Objectives: To increase household consumption of foods produced Principal activities:
o Promotion of growing orange fleshed sweet potatoes, legumes, vegetables and fruits with high
nutritional value
o Training of women’s groups11 on agricultural practices boosting yields
o Development of a ‘pass-on’ livestock distribution system
o improving food preparation and preservation and exploring appropriate time- and labor-saving
technologies
Impacts:
Food consumption and dietary diversity: Production of diverse micronutrient-rich food increased and
child and maternal dietary diversity improved. The project was successful in diversifying and increasing
the production of nutritious crops, improving infant and young child feeding practices, and increasing
women’s autonomy.
Wasting: There was significantly less wasting observed in the agriculture-only and agriculture-nutrition
arms than the control groups by project end.
Program component #2: Social and behavior change
Objectives: To change both infant and young child feeding behaviors as well as gender-related behaviors. Principal activities:
o Providing messages on the importance of diversifying diets, nutrition during pregnancy, early
and exclusive breastfeeding, the appropriate quantity and quality of complementary foods, and
preventive healthcare services, such as immunizations, and ante-natal care.
o Providing gender-focused social and behavior change materials
o Provision of inputs to women with the intent of increasing female control over their use in
accordance with women’s own preferences
11 Pregnant women and those with children under the age of two

28
Impacts
Decision-making: The percentage of women participating in decisions on what to grow and spending
money from the sale of field crops doubled.
Program component #3: Public health interventions
Objectives: To work through and build the capacity of existing structures, while increasing overall demand for health services
Program component #4: Supplementation
Objectives: To promote iron/folic acid supplementation among pregnant women, deworming both children and pregnant women, and giving vitamin A supplements to children twice a year.
Impacts:
Components 3 and 4 impacts were that the RAIN women’s groups were successfully assigned to local
community health volunteers (CHVs).12 The RAIN-connected CHVs received additional training from the
Zambian Ministry of Health on maternal, infant and young child feeding practices in accordance with existing government guidelines. In addition, RAIN-connected CHVs provided health and nutrition counseling at the RAIN women’s group meetings and carried out follow-up visits to individual households.
Discussion:
The biggest success of the project is that the Mumbwa District Nutrition Coordinating Committee (DNCC) was established to realign and coordinate the activities of different actors in the district. It built on the strengths of existing actors, systems and capacities to facilitate a shift in how stunting is understood and addressed. This resulted in not only having coordinated strategies and joint interventions for stunting prevention, but real and persistent changes in how malnutrition is viewed and how ministries interact on the issue. The establishment of the DNCCs was key in the success of the project at community level. The project was such a success it led to the establishment of DNCCs in 13 other districts in the country that are still operational to date.
The weaknesses seen in the component of marketing was added to the RAIN+ project when the original
RAIN project came to an end. Project implementers noted that the use of randomized trials for the
12 CHVs constitute a formal body of volunteers across Zambia trained and deployed by the Zambian Ministry of Health to extend health and nutrition services to rural areas

29
evaluation of agriculture/nutrition projects may not be the best methods. Existing water problems made
it difficult to maintain year round gardens, and water access was addressed in the second phase.
Conclusions:
Necessary conditions that drove success: The key conditions that brought success to the project can be outlined as follows:
o Individual leaders with convening power in the agricultural sector showed personal commitment in the implementation of this project and it raised the profile of the activities and contributed to the success
o Linking of nutrition to agriculture was not common place and this project showed that this could be successfully done.
o Strengths of existing actors, systems and capacities were leveraged leading to a shift in how stunting is understood and addressed. The result was real continuous change in how malnutrition is viewed and how ministries interact on the issue coordinated strategies and joint interventions for stunting prevention.
Key factors limiting success: There were some aspects of the project that limited the success of the project and these are outlined as follows:
o The issue of nutrition was viewed as a non-emergency despite the staggering statistics of malnutrition in the country at the time. This continues to be an issue to date, though better than at the time of project implementation.
o The project didn’t make an even bigger impact because the implementation period was too short and because it didn’t address all the underlying causes of chronic malnutrition.
Replicability and constraints to replicability in other contexts: It was established that this sort of project can be replicated in different contexts as long as the following measures are taken into cognizance:
• Nutritional security requires coordinated cross-sectoral action. Typically, nutrition related work
across public actors are often competitive rather than complementary and coordinated; and the
administrative and funding frameworks are sectoral even though nutrition promotion is
multisectoral n nature. This requires a project of this nature to take this into account and find
innovative ways of harmonizing the activities.
• A supportive national policy framework that mandates coordination with a clear understanding of
sectoral priorities by all stakeholders is critical in the success of a project of this nature. This also
requires the development of a clear strategy to guide the coordination process. There has to be a
key coordination function/entity to ensure the provision and proper distribution of resources made
available to address nutrition.
• There must be genuine commitment to fostering coordination at all levels i.e. from national –
district and extension/community to ensure the activities are a success.
• The coordination of activities must be undertaken by a neutral body with authority (not sewed
towards a particular sector).

30
• Project evaluation should that for nutrition-sensitive agricultural programs, the focus should be on
improving diets, rather than stunting, as their primary goal. This is because of the long term nature
of activities that are required to deal with stunting and this is not compatible with typical project
timeframes. It should hence be more government focus in dealing with stunting.
Reference documents: RAIN+ project summary.
Annex 1: Key Informants
Name Position
Chance Kabaghe Executive Director - Indaba Agricultural Policy Research Institute
(IAPRI)
Damaseke Mlota Agriculture and Natural Resources Specialist - USAID
Marjolein Mwanamwenge Program Officer - World Food Programme (WFP) -
Allan Mulando Program Manager - WFP-
Emma Malawo Former Deputy Director Policy and Planning Division, Ministry of
Agriculture
Dingiswayo Banda Deputy Director, Economics Division - Ministry of Finance formerly
Chief Economist, Ministry of Agriculture
Jacob Mwale Executive Director - Zambia Commodity Exchange
Julius Shawa Former Permanent Secretary – Ministry of Agriculture (now retired)
Dennis Wood Independent Development Specialist
Ballard Zulu Outreach Director - IAPRI
Stephen Kabwe Grassroots Coordinator - IAPRI
Harry Ngoma Food Security Specialist - USAID
Bright Mulonga Chairperson - Zambia Cassava Association
Lewis Bangwe African Development Bank
Antony Chapoto Research Director, IAPRI
Dr. Mick Mwala University of Zambia Department of Plant Science, Senior Lecture
and Board Chairperson IAPRI
Dr. Rhoda Mofya Mukuka Senior Research Fellow, IAPRI
Dr. Moses Mwale Director, Zambia Agricultural Research Institute

31
Malawi
A. Background
Agricultural sector remains a strategic pillar for growth of the Malawi economy. The sector contributes about 27 percent Malawi Gross Domestic Product (GDP) (Government of Malawi, 2019). However, according to the World Bank, World Development Indicators show that the agricultural GDP has progressively declined over the past seven decades. Figure 1.1 shows the percentage contribution of agriculture to Malawi’s GDP from 1960 to 2016. The figure shows that agricultural GDP progressively fell from 50.0 percent (in 1960) to 28.3 percent (in 2016).
Figure 1.1: Percentage of agriculture contribution to GDP (1961 to 2016) Source: World Bank, World Development Indicators (1961-2020); author’s compilation Recognizing the vital role of agriculture to national food security and economic growth, Malawi government focuses on agricultural commercialization through the value chain approach. This is being achieved mainly with agricultural investments by both the Malawi government and the Donor Committee in Agricultural Food Security. The agricultural investment projects aim at:
1) Increasing agricultural production and productivity; 2) Building resilience of the agricultural systems to climate change risk; 3) Increasing adoption of agricultural technologies; and 4) Increasing access to agricultural finance and high value markets.
The next section discusses the three Malawian programmes and projects that were identified as the
most impactful and the most successful based on qualitative data from the Google form respondents.
The selection was based on the respondents’ perceived impact on the seven indicators of agricultural
50.0
28.3
y = -0.3321x + 50.077
0
10
20
30
40
50
60
1960
1962
1964
1966
1968
1970
1972
1974
1976
1978
1980
1982
1984
1986
1988
1990
1992
1994
1996
1998
2000
2002
2004
2006
2008
2010
2012
2014
2016
Agri
cult
ura
l G
DP
(%
)
Agriculture, value added (% of GDP) Linear (Agriculture, value added (% of GDP))

32
sector performance: Agricultural productivity; Farmer access to markets; Farmer incomes; Household
food security and nutrition; Rural job creation, Women’s inclusivity; and youth inclusivity. The selection
was also based on a three point ranking system of a most successful programme or project.
Based on those criteria, the programmes and projects which were ranked as most successful and
impactful (in order of highest impact and most successful) were:
1) Irrigation, Rural Livelihoods and Agricultural Development (IRLAD) Project;
2) Agriculture Sector Wide Approach Support Project (ASWAp SP); and
3) Farm Income Diversification Programme (FIDP).

33
B. Irrigation, Rural Livelihoods and Agricultural Development (IRLAD) Project
Country: Malawi
Donor: World Bank, International Fund for Agricultural Development (IFAD), Malawian Government
Implementing agency/organization: Ministry of Agriculture and Food Security (MoAFS)
Period (dates): 29th November, 2005 to 30th June, 2015
Amount of funds: US$ 115.2 million
Value chains addressed: Maize; Rice and Horticulture
Geographic zone(s): All Districts in Malawi Northern region, Malawi: Chitipa, Karonga, Likoma, Mzimba North, Mzimba South, Nkhata Bay and Rumphi. Central region, Malawi: Dedza, Dowa, Kasungu, Lilongwe, Nkhotakota, Ntcheu, Ntchisi and Salima Southern region, Malawi: Balaka, Blantyre, Chiradzulu, Machinga, Mangochi, Phalombe, Zomba, Mulanje, Thyolo, Chikhwawa, Mwanza, Neno and Nsanje.
Expected beneficiaries: 500,000 direct beneficiaries (irrigation water users and farmers in upper
catchments)
About IRLAD project
The project sought to increase the incomes and agricultural productivity of poor small-scale farmers.
The project provided farmers with seeds and fertilizer to restore agricultural production, and hence
achieve food security and nutrition in the Country. The project also supported rehabilitation and
development of irrigation systems, reservoirs and rainwater harvesting structures in order to reduce the
climate change risk associated with rain-fed agriculture. Through IRLAD project, small-scale farmers
gained access to support services that enable them to improve marketing of their commodities as well
as strengthened local government institutions and supported capacity building for farmers and their
organizations.
Overall Objectives
The main objectives were:
• To increase agricultural productivity of poor rural households in all Districts; and
• To strengthen institutional capacity for long-term irrigation development
Expected results

34
The project expected improvements in household incomes and assets ownership among poor rural households through increased irrigated areas for maize and rice in order to obtain significant sustainable yields above consumption demands. In addition, the project expected improvements in irrigation capacities both at national and field levels in target project districts to ensure sustainability of irrigation agriculture in the Country.
Program component #1: Irrigation Rehabilitation and Development
Objectives: The component aimed at improving performance of existing performing schemes that were
not functioning well through rehabilitation and upgrading works. In addition, the component sought to
promote small and mini scale irrigation schemes in areas where articulated demand and viable options
were available.
Principal activities:
• Selective rehabilitation;
• Development of small scale irrigation schemes; and
• Catchment conservation and rainwater harvesting for communal livestock watering and group
backyard gardening.
Impacts:
Selective rehabilitation of irrigation schemes: Completion of selective rehabilitation of four original government schemes: Limphasa (in Nkhata Bay District), Likangala Complex (in Zomba District), Mkhate (in Chikwawa District) and Muona (in Nsanje District) were completed and cultivated area during the dry season increased from 1,074 ha to 1,813 ha. A total of 2,590 ha (142 percent of target) were rehabilitated.
Development of small scale irrigation schemes: Beneficiaries organized themselves into either Water Users Associations (WUAs) or Water Users Group for small and mini scale schemes. A total of 1, 457 ha of land representing 132 percent was provided with new irrigation and drainage facilities (including 547 ha of original SSIs, 610 ha of mini schemes including upgrading, 299 ha of new SSIs. A total of 32 out of 83 fish ponds were constructed (40 percent of target). A total of 90 tanks (86 underground and 4 above ground) out of the 100 targeted were constructed in 11 targeted districts. In addition, 812 staff, 14,510 farmers and 25 artisans were trained in rainwater harvesting technologies.
Catchment conservation and rainwater harvesting: Using soil conservation techniques to reduce overland flow and runoff and improve water retention and soil fertility, a total of 60,635 ha were protected with vertiver hedgerows. That achievement was against a target of 3,000 ha including all land in the catchment (hotspots) under soil and water conservation and the vertiver hedgerows protecting scheme degraded areas and canals. 203 hotspots across all districts were identified and activities were implemented in them involving 71,700 farmers (40,000 male farmers and 31,000 female farmers) surpassing the target of 58 hotspots that were identified. In addition, a total of 510 km of stream banks were protected.
Program component #2: Farmer Services and Livelihoods Funds (FSLF)

35
Objectives: The FSLF component aimed at providing complementary services and goods to the beneficiary communities under the rehabilitated irrigation schemes which enabled them to optimize returns from irrigated crops, to add value through micro-processing, to improve the marketing of their produce, and to build their technical and business capacities. Principal Activities • Support for extension; • Support for Inputs for Assets (IFA) Program; • Support for marketing and postharvest assets; and • Farmer capacity building and community sensitization and mobilization. Impacts:
Support for extension: IRLAD project supported the operationalization of a new Agricultural Extension
Policy. A total of 9 District Agricultural Extension Coordination Committee, 7 District Stakeholder Panel,
89 Area Stakeholder Panel and 2,813 Village Agriculture Committees were established or rejuvenated.
The Project reached out to 346,940 farmers (43 percent women) with extension advice and were
practicing crop, livestock, and irrigation agriculture. The project also implemented the following
interventions: Lead farmer approach; Farmer Business Schools; Household approach for mainstreaming
Gender and HIV and AIDS; and Food and nutrition. Activities supported under support for extension
were: Food and Nutrition, System of Rice Intensification, Rice Variety Trials, Farm Machinery, Certified
Rice Seed Multiplication, Support for Livestock, Support for Inputs for Assets Program,
Farmer capacity building and community sensitization and mobilization: The project trained a total of
30,113 farmers (15,950 males and 14,163 females) in group formation, development and management,
basic business skills, post-harvest handling and value addition techniques, financial literacy and savings
and investment. In addition, a total of 100 farmer based organization were trained in advanced business
management skills. Community sensitization and mobilization was successfully accomplished and the
communities were able to demand projects as wells as fully participate in implementing the project
activities under project components 1, 2 and 3.
Program component #3: Institutional Development and Community Mobilization
Objectives: The component aimed at restructuring, strengthening and formation of smallholder farmer organizations for irrigation transfer, management and related activities. The component also aimed at establishing WUAs among rain fed small holders around irrigations schemes for operation and maintenance of water harvesting structures and soil conservation. Principle activities:
• Support and formation of water user groups and associations;
• Capacity building for farmers and community mobilization and sensitization;

36
• Support for the Market Development Unit and the Agricultural Marketing Information Service;
and
• Training for Lilongwe University of Agriculture and Natural Resources, Natural Resources College
and other MoAFS training.
Impacts:
Support for department of irrigation and field institutions: A total 119 WUAs and Water User Groups
were formed and revamped by the project. In addition, Irrigation Management Transfer (which involved
empowering farmer groups to own and manage the irrigation schemes) was facilitated for 8 Large Scale
(originally government owned) irrigation schemes, 25 new Small Scale Irrigation schemes and 10 WUAs
in former Smallholder Flood Plains Development Project schemes. In terms of land and water
management, the project supported farmer groups to acquire land leases in all 8 large scale schemes
and the 23 new small scale irrigation schemes. In addition, water abstraction rights were processed for
all 8 large scale, 25 small scale, 10 former Smallholder Flood Plains Development Project and 17 mini
scale irrigation schemes.
Capacity building for farmers and community mobilization and sensitization: 39, 748 farmers in all 32
WUA models were trained on leadership skills, finance management skills, operation and maintenance,
roles and responsibilities, irrigation water management, WUA legal framework including constitution
drafting and revisions and development of by-laws, application and renewal of water rights and land
leases, participatory monitoring of WUA performance, contract management, business planning and
processes, water sources and abstraction methods, and communication skills.
Support for the Market Development Unit and the Agricultural Marketing Information Service (AMIS):
The project supported the development of Comprehensive Agricultural Market Systems Development
Strategy (CAMSDS) which facilitated the implementation of product research, market research and
policy analysis. In addition, a contract farming strategy was developed to guide the contract farming
arrangements.
Support for Lilongwe University of Agriculture and Natural Resources, Natural Resources College and
other MoAFS training: Support to institutions concerned curricula review and capacity development of
teaching staff and equipment. Further, short term courses were offered for fresh graduates from
LUANAR and University of Malawi on principles of irrigation design, contract management and water
management.
Program component #4: Project Coordination, and Monitoring and Evaluation
Objectives: The component aimed at strengthening the capacity of effective and efficient project
implementation and coordination
Principal activities:

37
• Establishing and building capacity of a Project Coordination Unit in MoAFS
Impact:
Project Implementation Unit and Project Steering Committee were established to implement the
project. Government prepared and adopted a satisfactory project implementation manual and also
enter into a satisfactory memorandum of understanding with the Malawi Third Social Action Fund.
Program component #5: Contingency Financing for Disaster Risk Response
Objectives: To support preparedness and rapid response to disasters
Principle activities:
o Development of processes and steps necessary to activate the contingency financing for
different levels of disasters.
Impacts
The project requested a reallocation of US$600,000 for repair and maintenance of access roads to
facilitate movement of relief items to affected communities when a major flooding event occurred. Two
roads were maintained after being completely washed away by floods. In addition, 446 ha of irrigated
land that covered 18 irrigation schemes were maintained after being washed away by flash floods.
Discussion:
The IRLAD project satisfactorily achieved its two development objectives. The project was strategically
linked to highly relevant key policies such as the National Irrigation Policy and Development Strategy
and the Malawi Country Assistance Strategy 2013-2017. From a strategic perspective of irrigation
development in Malawi, the project demonstrated that small-scale irrigation was very beneficial and
within the management capacity of smallholder farmers, especially when gravity-fed. Also, the project
developed a set of operational guidelines and procedures on WUA support, irrigation contract
management, monitoring and evaluation which are useful for follow up projects.
Conclusions:
Necessary conditions that drove success: The key conditions that brought success to the project can be outlined as follows:
• The Project was also aligned to the National Irrigation Policy and Development Strategy and this enhanced stakeholder participation
• The project encouraged private sector participation in the design and construction of irrigation schemes and thus ensuring strengthened institutional capacity for long-term irrigation development.
• The project design ensured that small farmers optimized their returns from irrigation agriculture through obtaining complementary goods and services in the form of demand driven support in

38
three areas: (i) support for extension, (ii) support for input for asset, and (iii) support for marketing and post-harvest assets
• The project developed a set of operational guidelines and procedures on WUA support, irrigation contract management, Monitoring and Evaluation which are useful for follow up projects.
Key factors limiting success: There were some aspects of the project that limited the success of the
project and these are outlined as follows:
• First, the project delayed to start the irrigation rehabilitation component due to technical design
issues, and hence implementation costs escalated.
• Second, there were serious capacity constraints at the Central (national), district and community
levels of implementation and hence the project was operated in a high risk environment. Lack of
adequate human resources in district councils, absence of comprehensive accounting systems in
the Ministry, district councils and communities, as well as also lack of technical capacity
adversely affected the project implementation.
Replicability and constraints to replicability in other contexts: The IRLAD Project is replicable,
particularly the use of an integrated approach in promoting irrigation agriculture and also supporting
farmers’ livelihoods through the development of infrastructural assets and institutional capacities to
achieve significant impacts. Most notably, the project built its design and implementation strategies on
the existing government structures and farmer initiatives, and only intensified effort into building
capacities at all levels (farmers, extension workers, government staff and higher education) in the
implementation.
Reference documents: IRLAD Implementation Completion and Results Report

39
C. Agricultural Sector Wide Approach Support Project (ASWApSP)
Country: Malawi
Donor: USAID, European Union, Norway, Flanders, DFID, Irish Aid and Government of
Malawi/Beneficiaries (in kind)
Implementing agency/organization: MoAFS; Ministry of Industry, Trade and Tourism; Ministry of Lands,
Housing and Urban Development; and National Roads Authority
Period (dates): 24th June, 2008 to 30th December, 2016
Amount of funds: US$215.7 million
Geographic Zones: All 28 Districts in Malawi
Northern region, Malawi: Chitipa, Karonga, Likoma, Mzimba North, Mzimba South, Nkhata Bay,
Nkhotakota and Rumphi.
Central region, Malawi: Dedza, Dowa, Kasungu, Lilongwe, Nkhotakota, Ntcheu, Ntchisi and Salima
Southern region, Malawi: Balaka, Blantyre, Chiradzulu, Machinga, Mangochi, Zomba, Phalombe,
Mulanje, Thyolo, Chikhwawa, Mwanza, Neno and Nsanje
Value chains addressed: Maize; legumes and pulses, sorghum, millet, bananas, rice, cassava and sweet
potatoes
Expected beneficiaries: 3 million smallholder farmers
About ASWAp SP
The ASWAp SP was a result oriented prioritized plan to guide investments in the agricultural sector. It
was formulated to address recurrent severe food shortages due to climate change risk such as floods
and drought; deteriorating environment conditions for agricultural development; and weakening
institutional capacity to implement agricultural development interventions.
Overall Objectives:
The development objective of the project was to improve the effectiveness of investments which
supported both the national food security and the sustainable agricultural growth agendas. The global
environmental objective was to strengthen the natural resource base in agricultural lands through
enhanced sustainable land management as a basis for securing ecosystem services and sustainable
agricultural productivity.
Expected results:
The project sought to improve livelihoods of three (3) million smallholder farmers as a result of
increased sustainable agriculture related production and incomes. The benefits from some interventions
such as support to roads benefited beyond smallholder farmers, and hence contributing to market
access and rural development.

40
Program component #1: Institutional Development and Capacity Building
Objectives: To build capabilities for the implementation of ASWAp SP.
Principal Activities
• Strengthening Ministry of Agriculture’s leadership and management needed for a Sector Wide
Approach (SWAp);
• Planning, monitoring and evaluation support to strengthen department of planning, agricultural
development divisions and district agricultural development offices;
• Technical, systems and skills development;
• Administrative systems development (fiduciary management, human resource management and
administration); and
• Development of land information system to help Ministry of Lands, Housing and Urban
Development ensure secure recording of deeds.
Impacts:
Secretariat establishment: The project established a secretariat based at MoAFS to coordinate
implementation and dialogue mechanisms which included: (i) Executive Management Committee; (ii)
Joint Sector Review; (iii) Agriculture Sector Working Group; and (iv) 7 Technical Working Groups.
Policies and systems: Some key policies that were supported were: National Agricultural Policy, Revised
Strategic Grain Reserves Guidelines, Contract Farming Strategy, Core Function Analysis, Agriculture Risk
Management Strategy, 10 New Land Bills (enacted), Agricultural Statistics Strategic Masterplan, Review
of Agricultural Extension Policy, Agricultural Sector Wide Approach and National Seed Policy and
National Agriculture Investment Programme.
Program component #2: Sustainable Food Security, Agricultural Growth and Diversification
Objectives: This component aimed at improving national and household food security through
enhanced productivity and stability of maize based systems.
Principal activities:
• Support to sustainable productivity growth initiative-which included research (e.g. choosing right
varieties, efficient fertilizer use), sustainable land and water management, extension service delivery
and reducing post-harvest losses;
• Strengthening market based agricultural risk management strategies - which included rainfall index
based early warning models, macro and micro weather insurance, maize supply and price hedging
strategies, warehouse receipt system and capacity building for integrated commodity risk
management;
• Support to Farm Input Subsidy Program (FISP) and Seed Monitoring/Certification;
• Sub component on legume crop production and marketing; and
• Sub component on improving agribusiness environment and promote agribusiness partnership

41
Impacts
Productivity growth: The project directly contributed to the increase in average maize yields, percent of
food secure rural households and levels of soil organic matter in conservation farming areas. National
maize yields increased from 1.4 tonnes per hectare (ha) to 1.9 tonnes per ha, with actual maize
production increasing from 2.78 million tonnes to 3.22 million tonnes per ha respectively. The project
promoted crop diversification and increased production of legumes, pulses, sorghum, millet, bananas,
rice, cassava and sweet potatoes.
Improved productivity, diversification and natural resource management: Through promotion of
sustainable land management practices, the project directly contributed to increased soil organic matter
in conservation farming areas in order to improve crop productivity. Soil organic matter status achieved
was at 3.2 percent against a target of 1.5 percent in sandy soils in conservation farming areas. Further, a
total of 210,806 ha was put under the conservation agriculture practices, exceeding project target of
200,000 ha. Additional 129,156 ha was put under complimentary soil and conservation practices across
the country. The project supported in developing the National Conservation Agriculture Guidelines as
well as supporting a training of trainers’ team to deliver capacity building targeting staff and farmers.
Food security and climate change risk management: The project made significant contribution toward
security status was substantially achieved at 77 percent against the project target of 95 percent. The
component made key contribution to the Farm Input Subsidy Program (FISP seed component) in
response to drought and floods in 2015 and 2016. The component also supported private sector winter
production of 3,973 tonnes of maize which was distributed for humanitarian response to food insecure
households. As part of risk management capacity building, the project supported the customization of
Africa Risk Capacity initiative for macro weather insurance. Further pay out of US$8 million was made
which supported humanitarian response interventions.
Program component #3: Improvement and maintenance of unpaved rural roads
Objective: The inclusion of a rural roads was aimed at improving market access of inputs and outputs of
agricultural produce
Principle activities:
• Financing improvement works on unpaved rural roads;
• Implementation support.
Impacts
A total of 527 kilometers roads were rehabilitated against a target of 549 km. Studies showed that the
times to transport commodities to the markets declined to more than 70 percent. Consequently, an
average increase in motorized traffic of 219 percent was achieved against the target of 10 percent. The
completed roads opened up areas of agricultural potential and facilitated input and output markets.

42
Discussion
The project substantially reached 3.1 million smallholder farmers. The project was a success due to the
wide reach of beneficiaries through lead farmers, extension workers and NGOs as well as support
through the FISP. In addition, a robust monitoring and evaluation system further assisted to
disaggregate the beneficiaries by gender, and ensuring increased beneficiary reporting by gender. The
project supported the development of gender and HIV/AIDS strategy, which was implemented and
operationalized through the project.
Conclusions:
Necessary conditions that drove success: The project substantially achieved its development and
environmental objectives and some of the drivers of success can be attributed to:
o Improving institutionalization of ASWAp among implementing stakeholders as well as aligning
donor funding to the ASWAp as the overarching guide to agricultural investment in the country;
o Improving intra and multi-sectoral coordination, for instance, transport, trade, roads and lands;
o Supporting policies, systems and reforms to improve the functionality of the agricultural sector
o Supporting the development of the prioritized agricultural investments (ASWAp) and ensuring
implementation take off.
Key factors limiting success:
Although the project registered significant progress towards meeting its outcomes, the project design
was very complex and this caused weak attribution to high level impacts. However, putting in place the
ASWAp and its structures created a solid foundation for MoAFS to manage similar sector wide support
projects and other complex investments in the agriculture sector. Notably, drought and floods in 2015
and 2016 increased households’ vulnerability to food insecurity, and hence causing the deviation from
the target.
Replicability and constraints to replicability in other contexts: The project can be replicated elsewhere.
Here are a few insightful lessons it drew:
• Involvement of multiple implementing partners in agricultural investment programmes or
projects improved multi sectoral collaboration and ownership, given the strong leadership of
the implementing partners;
• Basket funding mechanisms such as Multiple Donor Trust Funds promoted coherence among
donors in advancing reforms, policy positions as well as flexibility and timeliness in decision-
making. This funding mechanism significantly reduced transaction costs towards decision
making, and also increased joint ownership and accountability for all decisions made;
• Utilization of Government systems and structures is essential in supporting institutional capacity
building to manage such complex projects as well as enhancing donor confidence in government
stewardship.
• Capacity and institutional development support towards agricultural investments was perquisite
for implementation of future bigger and complex investments such as Agriculture

43
Commercialization Project (P158434), Shire Valley Irrigation Transformation Project (P158805),
and Agriculture Management and Fiscal Management Development Policy Financing (P153753).
Reference documents: ASWAp SP Implementation and Results Completion Report

44
D. Farm Income Diversification Programme (FIDP)
Country: Malawi
Donor: European Union
Implementing agency/organization: MoAFS, Ministry of Finance Economic Planning and Development-
National and Authorizing Officer’s Support Unit
Period (dates): August 2005 and March 2014
Amount of funds: €36.5 million (Phase 1: €16.5 million; Phase II: €20.3 million)
Value chains addressed: Cassava, coffee, macadamia, paprika, winter maize, winter wheat, groundnuts,
sunflower, vegetables (e.g. tomato, cabbage and onion), pineapple, mangoes, apple, piggery, poultry
(layers and broiler), goats, non-forest products-bee keeping/honey, and dairy
Geographic zone(s): Northern region, Malawi: Chitipa, Karonga, Rumphi, Nkhata Bay, and Mzimba;
Central region, Malawi: Salima, Nkhotakota, Dowa and Lilongwe.
Southern region, Malawi: Balaka, Chiradzulu, and Thyolo
Expected beneficiaries: 91,267 smallholder farming households
About FIDP (Phases I and II):
The Farm Income Diversification Programme (FIDP) phases I and II were funded under the 9th and 10th
European Development Fund. Phase I activities were implemented from April 2007 to August 2009.
Phase II ran from April 2010 to March 2014. The main objectives were to improve the livelihoods of rural
households through conservation of natural resources, diversification of agricultural production and
increased agribusiness, and contribute to the reduction of poverty in Malawi.
Overall Objectives:
The project aimed at making impact on household welfare through diversification of income sources
which could lead to food security and poverty reduction in rural communities. It also sought to stop and
reverse the decline of the natural resource base, as well as to reduce post-harvest losses and increase
agro-processing.
Expected results:
Expected results for FIDP were sustainable management of natural resources, improved post-harvest
storage and processing of agricultural commodities, increased and diversified smallholder agriculture
productivity and promotion of income generation agribusinesses. FIDP specially focused on agribusiness
and market-oriented activities with the objective of pushing more farmers into non-farm enterprises.
This was intended to protect farmers against the food insecurity and worsening poverty.
Program component #1: Soil fertility, soil and water conservation

45
Objectives: This component aimed at achieving sustainable use of the natural resource base through
dissemination of conservation agriculture in order to increase agricultural productivity and food security
of rural communities.
Principal activities:
• Dissemination of soil conservation technologies such as contour ridge alignment, vertiver hedge
rows and use of compost or manure;
• Training of staff and farmers in soil conservation and fertility improvement technologies; and
• Establishment of agro-forestry nurseries and tree planting
Impacts:
FIDP achieved substantial positive impacts on the sustainable management of natural resources through
increased and widespread adoption of land and water conservation structures. Agricultural area under
conservation agriculture increased from to 3,582 ha (against target of 1,745 ha). In addition, a total of
1,077 agro-forestry nursery trees were established and 4.3million trees were planted across the country.
Program component #2: Development of the agribusinesses
Objectives: The component aimed at up-scaling agro-based cooperatives and Small and Medium
Enterprises to produce competitive products for domestic and export markets.
Principal activities:
• Diversifying and increasing smallholder agricultural productivity;
• Improving post-harvest storage and processing; and
• Promoting agri-business through formation and strengthening of farmer groups and clubs.
Impacts
Smallholder agricultural productivity and livestock ownership improved: FIDP focused on increased
diversification from intensive production of maize and tobacco as the main food and cash crop
respectively. The component sought to encourage households to diversify agricultural production to
other crops as well as livestock including fish farming. The percentage of farming households which
owned livestock from 72 percent (in 2005) to 91 percent (in 2015).
Reduced output losses: In Malawi, post-harvest losses account for 30 percent of agricultural production
each year. The component aimed at interventions that would reduce Output losses, and hence increase
food security and household incomes through creation of new markets for value-added commodities.
FIDP beneficiaries had a 32 percent proportion of households storing produce with prospects for better
market prices compared to 25 percent for the non-beneficiaries. 11 percent of FIDP beneficiaries carried
out value addition activities (that is, grading, processing and packaging) compared to 1 percent of non-
participants.

46
Cultivation of fruit trees improved: FIDP directly contributed to increased cultivation of fruit trees as the
proportion of farming households increased from 34 percent (in 2005) to 52 percent (in 2015). In
addition, the proportion of female headed households engaged in fruit tree cultivation increased from
28 percent (in 2005) to 47 percent (in 2015).
Extension and farming practices improved: FIDP directly contributed to increase in farmers’ application
of agricultural extension messages received from 79 percent (in 2009) to 90 percent (in 2015) compared
to 87 percent for the non-beneficiaries.
Adoption of Labour saving technologies: FIDP directly contributed to increased use of herbicides for
weeding and farm mechanization such as oxen-pulled ploughs, motorized pumps and money-marker
treadle pumps. Percentage of farming households that adopted labor-saving technologies increased
from 25 percent (in 2009) to 39 percent (in 2015). Increased adoption of Labour saving technologies was
mainly attributed to conservation agriculture which uses herbicides intensively.
Agri-business management improved: Farm incomes increased from 53 percent (in 2009) to 65 percent
(in 2015). Farm incomes from field crops generated 65 percent of total household incomes, livestock,
and horticultural products generated 20 percent and 13 percent respectively. In comparison, FIDP
beneficiaries realized twice as much farm incomes compared to non-participating households. However,
male headed households had higher incomes than female headed households.
Program component #3: Social Development of FIDP communities
Objectives: Increasing capacity of farmers and district level staff, through participation of the civil
society to promote understanding nutrition and other nutritional issues related to agriculture.
Principal activities:
o Training of staff and farmers on nutrition matters
o Providing grants to awardees that were engaged to implement nutrition and agri-business
activities.
Impacts
Poverty levels declined: Through FIDP, proxy poverty index (which is based on ownership of physical
assets such as houses and farm implements) increased from 27 percent (in 2005) to 41 percent (in
2015). By a margin of 7 percent, male headed households were wealthier than female headed
households. In addition, beneficiaries were wealthier than non-participating households with 6 percent
difference between the two groups.
Food and nutrition security improved: The percentage of farming households that were able to meet
food and nutritional requirements without food aid increased from 57 percent (in 2009) to 75 percent
(in 2015). Food security status between beneficiaries and non-beneficiaries differed by 10 percent.

47
Discussion:
The project had high impact on the sector as its outputs such as physical infrastructure and farmer groups are still in use to date. Also, the project implementation was a success as its development and environmental objectives were substantially achieved, despite there being other programmes such as ASWAp SP and FISP which carried out similar interventions in FIDP communities. FIDP demonstrated that increased food security and real household incomes was achievable when farming households adopt sound land and water conservation practices and locally adopt conservation agricultural technologies. The project showed that sustainable intensification of agricultural production involves the practice of devising, adapting and promoting farming practices and technologies that are both local and relevant to commercialization process of smallholder agriculture. A notable shortfall of the programme was its failure to focus on capacity building and equitable distribution of FIDP benefits to both male and female headed households.
Conclusions:
Necessary conditions that drove success:
o Smallholder farmers internalized the soil and water conservation message as FIDP supported
land and water conservation component for ten (10) years;
o The programme adopted the Making markets work for the Poor approach which provided a
strategic guide for developing agricultural production enterprises and agribusiness activities;
o The programme supported stallholder farmers with seed capital in form of physical
infrastructure (such as granaries and processing plants-fish, meat and rice) and soft skills on
critical husbandry, crop and livestock management as well as agribusiness management;
o As part of agribusiness strategy, the programme prioritized different but area-specific
agricultural enterprises in light of their food security potential, income generating potential and
the constraints experienced;
o The programme turned FIDP beneficiary groups into market-oriented cooperatives, as farmer
based organizations to ensure the sustainability and resilience; and
o The programme linked its beneficiaries farmer based organizations to with micro-finance, other
business support services (Business development services) and market information systems.
Key factors limiting success:
o The programme had very limited participation by the private sector despite its strong
agribusiness orientation of promoting and developing successful agro-based businesses;
o The programme did not have an agribusiness strategy to guide the process of developing
agricultural production enterprises and agribusinesses which would include buying, processing
(value addition) and marketing; and
o Despite adoption of Making markets work for the Poor approach, a significant number of both
agricultural production enterprises and agribusiness initiatives still faced the “market access”
challenge.

48
Replicability and constraints to replicability in other contexts:
For such a programme to achieve the same level or greater of success, that following needs to in place:
o The programme should be built on the principles of sustainable intensification of agricultural
production that emphasizes on sustainable agricultural production as well as sustainable
management of the natural resource base;
o Soil and water conservation messages should be considered as a cross cutting issue, and hence
be mainstreamed into the overall extension messages;
o Development of a programme specific agribusiness strategy which guides the agribusiness
development process across programme areas is essential. In addition, the agribusiness strategy
should be aligned to a national agribusiness strategy as well as agribusiness components in
other programmes or projects;
o Where a programme does not address ‘market access’ challenges such as reducing barriers to
entry, access to agricultural finance, provision of market information and the development of
market infrastructure, the programme’s agribusiness strategy or planning framework should
provide guidance on how the targeted beneficiaries will gain access to input and output
markets;
o For the agricultural production projects, frontline staff such as the Agriculture Extension and
Development Coordinators and the Agriculture Extension Development Officers and
agribusiness staff should receive further training in market access (Making markets work for the
Poor approach). Thus the frontline staff will not only assess the production potential, but will
also illustrate how the agricultural produce will reach high value markets and what the likely
cost will be; and
o The programme should promote effective private sector participation. For example, the
programme may consider the development of a public private partnership which can
increasingly strengthen farmers’ linkages to core markets, business support functions and
market information systems.
Reference documents: FIDP factsheet, Impact of FIDP on household welfare, Success story

49
Annex 1: Key Informants
## Informant Organization Position
1 Dr. Fenton B. Sands
Malawi Confederation of
Chambers of Commerce and
Industry
Deputy Mission Director
2 Professor Richard
Mkandawire
Michigan State University
(MSU)/ Centre for Agricultural
Research and Development
Africa Director of the Alliance for
African Partnership (AAP) &
Chairperson of National Planning
Commission
3 Mr. Readwell Musopole Ministry of Agriculture and Food
Security
Deputy Director of Planning at
Ministry of Agriculture
4 Mr. Jacob Nyirongo Farmers Union of Malawi Chief Executive Officer
5 Mr. Time Fachi World Bank (Malawi Country
Office)
World Bank Senior Agriculture
Economist
6 Mr. Vinda Kisyombe African Development Bank Senior Agriculture Officer
7 Mr. Vinda Kisyombe African Development Bank Senior Agriculture Officer
8 Professor Alfred
Masanjala
Ministry of Economic Planning
and Development Principal Secretary
9 Dr. Thomas Munthali National Planning Commission
of Malawi Director General
10 Mr. Clement Kumbemba Ministry of Industry, Trade and
Tourism Director of Trade
11 Mr. Sandram Maweru
Shire Valley Irrigation
Transformation Project funded
by WB
SVTP Project Coordinator
12 Mrs. Pamela Kuwali Civil Society Agriculture Network Chief Executive Officer
13 Mr. Blessings Botha World Bank (Malawi Country
Office)
World Bank Senior Agriculture
Economist

50
Tanzania
A. Background
Agriculture is the mainstay of Tanzania’s economy, contributing about 31 percent to the Gross Domestic Product. The production system, like many sub-Saharan African countries is largely rain-fed and the country is largely self-sufficient in its main staple crop Maize. Between 2007 and 2011, the Tanzanian agriculture sector investment grew by 53 percent in nominal terms, but in relative terms agricultural budget allocations declined from almost 13 percent of total government spending to about 9 percent13. Actual spending grew more slowly. Some of the key constraints to the agricultural sector in the country is the rain-fed production system that leaves the farmers susceptible to highly variable climate, the limited access to agricultural inputs such as inorganic fertilizers, low market access and insufficient rural roads to open up production areas to markets. Several programmes/projects across the country are investing in the sector to tackle these bottlenecks to enhanced agricultural productivity.
There are three main sources of agricultural investments in Tanzania. The first is the basked funded investment through government budgets, disbursements and implementation. It typically includes the Government of Tanzania funding either from domestic revenues or borrowing from multilateral and bilateral agencies and partners. Second, the development partners through government funding mechanisms. Third, the development partners and international Non-Government Organizations direct project funding, which does not go through government funding mechanisms. The private sector too invests in Tanzania’s agriculture from agricultural inputs production (e.g. seed multiplication), to primary production and value addition creating forward and backward linkages. The current agricultural sector investment in Tanzania is elaborated in the country’s Tanzania Agriculture and Food Security Investment Plan 2011/2012-2020/202114. The implementation of the Tanzania Agriculture and Food Security Investment Plan is in a 10-year Agricultural Sector Development Program 2017/2018-2027/2028 Phase Two (ASDP II)15.
The review has three main objectives: 4. Assess the approaches used for the identified programmes/projects
5. Document the successes and failures of the identified programmes/activities
6. Discuss the replicability and potential constraints to it
This review is aimed to document some lessons learned that can inform future design and
implementation of agricultural programs that have long lasting impact in the agricultural sector.
13 See FAO. 2013. Monitoring African Food and Agricultural Policies. Review of Food and Agricultural Policies in the United Republic of Tanzania 2005-2011 – Country Report. 14 See URT. 2011. Tanzania Agriculture and Food Security Investment Plan (TAFSIP) 2011/12-2020/2021. 15 See URT. 2017. Agricultural Sector Development Program Phase Two 2017/2018-2027/2028.

51
The following sections of the case study discuss the four projects that were shortlisted by key
informants. The short listing was based on a three point ranking system of success. Their impact was
also ranked based on seven indicators – agricultural productivity, farmer access to markets, farmer
incomes, household food security and nutrition, rural jobs, women’s inclusivity and youth inclusivity.
Based on these criteria, the projects that were ranked as most successful in attaining target objectives
and outputs versus same targeted matrices and likely to be impactful were the Feed the Future NAFAKA
I Main Staples Value Chain Activity, the Feed the Future SERA Policy Project and Agricultural Marketing
Systems Development Project (AMSDP).
B. Feed the Future NAFAKA I Main Staples Value Chain Activity
Country: Tanzania
Donor: USAID
Implementing agency/organization: ACDI/VOCA
Period (dates): 2011-2015
Amount of funds: US$34.80 million
Value chains addressed: rice and maize
Geographic zone (s): Manyara (Kiteto District), Dodoma (Kongwa District), and Morogoro (Mvomero and
Kilombero Districts), and Mbeya (Mbozi and Mbarali Districts) and Iringa (Kilolo and Iringa Rural
Districts) and Zanzibar (Pemba and Unguja).
Expected beneficiaries: Smallholder based value chain actors
About NAFAKA
NAFAKA Staples Value Chain Activity is a five-year project that is part of the USAID Tanzania Feed the
Future initiative and has the aim to reduce poverty and hunger sustainably through a growth and
reduction of poverty strategy in five districts in Tanzania. The key features of project focused on actors
up and down the value chain, from field to fork, to improve market relationships, efficiencies and
develop win-win strategies for market players. Key features of the implementation approach included:
facilitating changes in firm or farmer behavior, transforming relationships between value chain actors,
targeting leverage points and empowering the private sector.
Overall Objective:
To sustainably reduce poverty and hunger by improving the productivity and competitiveness of
smallholder-based rice and maize value chains that offer job and income opportunities for rural
households.
Expected results:

52
Improved and increased yields and gross margins, commodity trade, technology adoption, and farmer
access to credit.
Program component #1: Improved value chain productivity
Objectives: To increase yields and gross margins
Principal Activities:
• Strengthening of producer associations and groups
• Engaging agricultural research and training institutes
• Training on Good Agricultural Practices
• Developing extension service providers
• Agro-dealers investing in the value chain
• Demonstration plots for improved technologies and management practices
• Quality Declared Seeds and certified seed production
• Introduction of Urea Deep Placement
• Ripping technology
• Water management, irrigation, and Climate Smart Agriculture
Impacts
Yields: Rice yields increased by 127 percent to 3,293 kg/ha (meeting projected target), and maize yields
increased by 189 percent to 1,540 kg/ha (23 percent above projected target).
Gross margins: Gross margins for maize farmers improved by 37 percent over the past five years to
US$145/ha, which is 18 percent above the projected target. Rice farmers’ gross margins rose by 53
percent despite a significant price drop of 40 percent, which can be attributed to illegally imported rice
combined with irregular export bans.
Program component #2: Expanding markets and trade
Objectives: To expand commodity markets and increase in trade value or volume over time.
Principal activities:
• Strengthening producer marketing associations
• Improving storage and warehouse management
• Strengthening the Rice Council of Tanzania
• Increasing access to agricultural loans
• Increasing access to business development services for Micro, Small and Medium Entreprises Impacts
Commodity markets: Combined commodity sales increased 26 fold in the final two years from 1,825 MT
in 2014 to 47,667 MT in 2016, with cumulative sales reaching almost 72,000 MT valued at over US$17.6
million

53
Marketing associations: The 167 associations forms marketed maize and rice valued at Tanzanian
Shilling (TZS) 23.7 billion (US$10 million). Rice made up most of that value at TZS 20 billion
(US$9,191,600).
Access to finance: Total value of loans, including informal credit, was $6.3 million over the life of the
program.
Program component #3: Increased private investment in agriculture
Objectives: To build partnerships, leverage investment, and create lasting outcomes.
Activities:
• Developing out-grower programs that promoted private sector involvement in the provision of agricultural inputs and crop marketing within the rice value chain.
• Promotion of improved practices and technologies, organizing farmer groups into associations, aggregation, service provision, development of linkages with market actors and financial institutions, and training farmers on the warehouse receipt system.
• Developing strategic partnerships with lead private sector firms/NGOs
• NAFAKA Enterprise Development Co-Investment and Association Strengthening
Impact:
Private sector involvement: The value of private sector investment in the agriculture sector or food chain leveraged by NAFAKA was US$3,845,614— two percent over the projected target. Grants: Signed grant agreements with a number of new private sector partners, leveraging private investment to strengthen the maize and rice value chains. A total of 126 grants were administered, many of which fostered private sector investment in the maize and rice value chains. Program component #4: Increased resilience for vulnerable smallholders
Objectives: Increased resilience for groups of people who are often excluded, disadvantaged, or
marginalized based on their economic, environmental, social, or cultural characteristics.
Principal activities:
• SILC Groups • Vegetable Gardening for Food Security
• Promotion of Nutrition and Diet Diversification
Impact:
Networks: Four PSP networks formed and functioning with 101 community field agents/Private Service Providers SILC groups: 13,641 community members (9,140 women) formed 614 SILC groups. These resulted in US$1,062,161 in total member savings. Food Security: 20,416 NAFAKA beneficiaries accessed 8,507 home gardens

54
Discussion:
Given the good performance of NAFAKA I project, credit is given to the involvement of a broad spectrum
of stakeholders and actors. The private sector engagement had, in most interventions, been left out
although it is an instrumental actor in value chain financing and market off-taking of agricultural
produce sustainably. Since 2017, there has been an on-going following phase II of the Feed the Future
NAFAKA deepening and consolidating gains in the Southern Agricultural Growth Corridor of Tanzania
(SAGCOT) regions as well as expanding the value chains and stakeholders’ base.
Conclusions:
Necessary conditions that drove success: Three key factors that were attributed to project success were
that it had a well thought through implementation approach, the prevailing weather conditions in the
project area were conducive for yield and gross margin objectives, and the use of a multi stakeholder
approach. More detailed conditions include:
• The project ensured that the two crops identified required individually designed value chain programs. The set up of two commodity specific teams with specific approaches in every annual work plan maximized results for each commodity.
• Close collaboration with local government authorities helped motivate group productivity. District authorities encouraged the registration of existing groups for possible future development opportunities that could be realized through both public and other development initiatives.
• The project launched an initiative to develop entrepreneurial farmers into service providers, in addition to the Village Based Agriculture Advisors network. This was a key sustainable approach that encouraged agricultural innovation at the village level.
• Large scale processors were included in the activities at downstream level, something that was unheard of. This resulted in credence to all actors that such investment with smallholder producers has dividends.
• Inter-activity collaboration worked well and this included integrating nutrition training. Nutrition promoters trained members of SILC groups, small produce vendors in local markets, church groups, and individual households. This resulted in some constructing “Tippy Taps” in the compound for hand washing, and some engaged in home food processing, especially vegetable drying, due to the training.
Key factors limiting success: Some of the factors identified to have limited the success of the project were:
• The NAFAKA warehouse refurbishment program and the farmer association development program assisted with long-term storage to offset price instability; but the negative effects of export ban policies that locked surplus produce within borders, and the cost of domestic movement of commodities from district to district, negatively affected all farmers.
• The challenge remained in how to protect both the farmer and the business from the volatility of price fluctuations and the inherent instability of commodity markets influenced by global market factors, as well as domestic policy.

55
• Transactions in the input marketing system are mostly cash based, and this limited the expansion of input supply networks in the rural areas.
Replicability and constraints to replicability in other contexts: Project replicability is possible with some considerations on implementation. Rainfed production for projects such as this remains an inherent risk in replicability of success. Well-designed and implemented private sector led agricultural insurance programs are critical to agricultural growth, especially for staple crops. In terms of market access, full discipline and adherence to contract conditions by all parties as the process moves through times of drought, export bans, temptation of side-selling, and the never-ending search for the “better price” requires consideration.
There is need to provide an environment to accelerate and expand rural financial services without the usual concerns of risk related to smallholder credit, and this lies in the development of long-lasting private and public sector collaboration and cooperation. SILC group growth and potential are time dependent. Mature SILC groups are more willing to access additional financial services (from SACCOS and MFIs) when available. SILC development design should take into account the benefits of scale with older groups.
Reference document: ACDI/VOCA. 2016. USAID Feed the Future NAFAKA Staples Value Chain Activity End of Activity Report, NAFAKA value chain annual outcome survey final report, NAFAKA fact sheet

56
C. SERA Policy Project
Country: Tanzania
Donor: USAID
Implementing agency/organization: Booz Allen Hamilton
Period (dates): April 7, 2011 – August 30, 2016
Amount of funds: US$8.5 million
Geographic zones: Dar Es Salaam, Morogoro, Iringa, Njombe and Mbeya regions, Unguja and Pemba
Islands.
Value Chains addressed: Maize, rice and horticulture
Expected beneficiaries: Government of Tanzania (National Food Security Division, Ministry of
Agriculture, Livestock and Fisheries, Ministry of Agriculture and Natural Resources of Zanzibar, Bank of
Tanzania, and the Ministry of Lands, Housing and Human Settlement; Private Sector (Agriculture Council
of Tanzania, Tanzania Seed Traders Association (TASTA) and Rice Council of Tanzania); and other
organizations (SAGCOT Centre, the Presidential Delivery Bureau (PDB) for Big Results Now, and the
Tanzania Investment Centre )
About SERA Policy Project
The SERA Policy Project was established to conduct evidence-based research and work closely with
government on policy reform, the SERA Project had to develop new strategies for developing
partnerships and trust with public and private sector counterparts. As one of eight projects in the
Tanzania Feed the Future (FtF) initiative, SERA’s objectives focused on improving agricultural policies
and developing the capacity of local institutions and individuals to undertake policy research and
advocate for policy reform. The mandate for SERA was to devote 80 percent of their resources to
supporting SAGCOT, which was focused on promoting investments in the high agricultural-potential
corridor that extended from the Indian Ocean near Dar es Salaam to the Southern Highlands, and on
commercializing agriculture by attracting foreign investors into the sector. SAGCOT targeted food crops
including maize, rice, and horticulture, and SERA focused its activities on those crops. The project design
established five objective areas intended to strengthen the capacity of the Government of the United
Republic of Tanzania (GOT) institutions, the private sector, and other stakeholders to undertake policy
research and implement policy changes.
Overall Objectives:
The purpose of the SERA Project was to develop a policy partnership among all stakeholders to achieve key policy reforms in the agricultural sector and business environment that would ensure the successful implementation of Tanzania’s Agricultural Investment Plan.
Expected results:

57
To provide evidence-based research to fill knowledge gaps, inform policy dialogue, facilitate engagement, and support reforms through capacity building, and outreach and communications.
Objective 1 and 3: Partnership development and Capacity building
Principal activities:
• Capacity building for research institutions including the Economic and Social Research
Foundation, Research on Poverty Alleviation, and the Institute of Financial Management
• Policy analysis technical support for TASTA and Policy Analysis Group (PAG). 16
Impacts
• Policy analysis, research and outreach: The project helped TASTA analyze seed industry policies
that influenced policy within the Ministry of Agriculture, Food Security and Cooperatives
(MAFC) and identify specific policy changes that would improve the enabling environment for
the seed industry.
• Collaboration: The project successfully collaborated with fellow FtF projects on two long-term
activities: the FtF NAFAKA Staples Value Chain Project and the FtF Tanzania Innovative
Agricultural Research Initiative USAID Research and Education Project. The project also worked
closely with the USAID Food Security Policy Activity. This collaboration evolved to include the
PAG, the Annual Policy Conferences, trainings, the Market Intelligence Unit activity, and the
Staples Study
• Lead role to establish the PAG/Partnership Accountability Committee: The Partnership
Accountability Committee was established and it is a group of stakeholders that provide
oversight on the implementation of New Alliance commitments.
• The project provided training to support the adoption of a transparent rules based emergency
import system using analysis of commodity markets.
Objective 2: Policy analysis and research
Principal activities:
• To identify policy and research priorities, monitoring and evaluation, special studies,
collaboration, review of grain stocks, and stakeholder engagement.
Impacts
16 The partnership is an informal group of non-state actors working on agricultural policy issues in Tanzania

58
• Long-term policy priority identification: Emerging issues in the Agricultural Commercial, Legal,
and Institutional Reform assessment and emerging issues in the New Alliance for Food Security
and Agricultural Framework for Tanzania were kept track of. International experts were paired
with SERA staff and GOT personnel, when available, to provide access to key data and
knowledge of local conditions.
• Special studies: The project was engaged in specific research and analysis at the request of the
government. For example, two special studies on a land compensation and benefit-sharing study
for the Ministry of Land, Housing and Human Settlements Development, and an analysis of a
rice irrigation scheme on behalf of USAID Tanzania FtF for the Revolutionary Government of
Zanzibar. Both studies were part of larger USAID FtF activities and contributed to the direction
and development of non-SERA Project activities.
• Inventory of grain stocks: The project addressed questions regarding grain stocks and the
inventory capacity of the public and private sector through:
o Analysis of the National Food Reserve Agency operations and capacity
o Rapid assessment of the rice market in 2015 with the Rice Council of Tanzania
o The adoption of the Cereals and Other Produce Act and subsequent establishment of
the board of directors led to new government efforts to invest in inventory capacity.
o Provision of government information and recommendations in the Food Security,
Agricultural and Poverty Alleviations Policy papers.
• Export increase due to policy work: The SERA project estimated that the 2011 export ban
reduced the value of maize marketed by US$ 200 million and the impact would probably have
been similar in 2013 when prices rose and there was no export ban. Increase attributed to SERA
Policy research and USG assistance on maize exports was an increase from US$ 20.82 million in
2010 to US$ 130.58 million in 2015, and the value of rice exports increased from US$ 51.96
million to US$ 107.69 million over the same period. The increase in the value of exports was due
to (1) increased price incentives to farmers, which led to increased production, and (2) the
government’s lifting of the export ban in 2012, which allowed exports to move more freely to
markets in neighboring countries.
Objective 4: Policy reforms
Principal activities:
• Engage the government in research and analysis on issues of mutual importance and interest Impact:
• The SERA Project actively engaged director- level staff at the MAFC in the development of concept notes and scopes of work and requested the participation of institutional staff.
• All research and analysis was reviewed and discussed with government stakeholders before final
release.

59
• The SERA Project supported public-private sector dialogue on key policy issues. Specifically the
SERA Project supported a series of workshops with the seed sector and MAFC to address critical
issues facing the sector.
• The SERA Project led, as well as participated in, the Policy Working Group organized by the Food
and Agriculture Organization of the United Nations and the Policy Group organized by the Policy
Advisor of the Ministry of Agriculture.
• SERA took the lead on policy research on the export ban, seed taxes, and the Cereals Board and
presented research for group discussion at both forums
Objective 5: Communications and outreach
Principal activities:
• Disseminate research and policy analysis through workshops, conference presentations, reports, policy briefs, the SERA website, and local media.
Impact:
Closed door meetings: The project was able so successfully conduct closed-door meetings with high-level
policy makers designed to allow open discussion without media coverage or private-sector presence.
Information access: SERA prepared a series of policy and research briefs that distilled complex issues into main messages and policy guides for policymakers and non-state actors. The project was also able to launch a website which made research and other information available to a wide audience.
Discussion:
SERA Policy project brought together many stakeholders and collaborators. It cross fertilized the
successes of other interventions that were not focused on policy. The project benefited the Tanzanian
people with realizable additional incomes as a result of good policies addressing issues related to export
ban, increased private sector role in the seed industry, reforms on food reserves and grain stock
inventories resulted into government invested in additional storage capacity. The Cereal and other crops
board was enacted and operational. Methodology on adopting rule-based decisions with triggers on
imports permits for rice, sugar and palm oil was delineated. Capacities in better policy analyses on food
markets and food security were done at both individual staffs and institutional level to personnel who
made policy decisions.
SERA Policy project focused mainly on maize and rice value chains. Policy issues in agricultural
commodities and product could be very sub sector and value chain specific. A follow-on project on other
higher outreach and higher impacting sub sectors and value chains such as livestock and poultry would
be interesting for formulate and implement. Potential impact includes their contribution to farm
revenues and food security and nutrition.

60
Conclusions:
Necessary conditions that drove success:
• The Tanzanian Government was receptive to changing policies when presented with compelling evidence and working with government had been an effective way to change policies. Directing major policy change efforts towards the government rather than individual ministries helped with the success.
• It was also useful focusing on policy change efforts should focus on the pointing out opportunities rather than weaknesses
• SERA Project maintained a flexible work plan and enabled the team to respond to emerging
policy issues and requests from the GOT and other project partners. The flexibility to meet new
demands required the SERA Project to develop a rapid approach to emerging policy issues
• The Project greatly benefitted from having experienced international and local policy experts as staff from institutions such as the Internal Food Policy Research Institute and the World Bank
• Persistence was key in achieving and sustaining policy reforms as policy influence work is long term and unpredictable.
Key factors limiting success:
Strengthening the capacity for policy research in government ministries such as Ministry of Agriculture, Livestock and Fisheries, was a high priority, but not one that could easily be achieved through short-term capacity-building activities. The level of training and skills of staff at the Ministry was poor, and it was difficult to raise staff skills to the level required for policy analysis and research. This requires a long term solution of training staff for an extended period of time and bringing in new staff to update the skillset in the institutions. The future capacity-building activities should include training of Ministry officials in management and leadership positions
Replicability and constraints to replicability in other contexts:
• The SERA Project directed its efforts to changing policies at the government rather than at the
civil society or producer groups for several reasons. Many of the policy issues SERA project
worked on were administrative and regulatory issues, and could be changed by Ministries.
Ministries make most policy decisions as part of their mandate to implement policies through
administrative action instead of legislation and that provides an entry point to influence policies.
• SERA Project used two approaches to provide research and information to the government. The
first, was to design a research program to address various aspects of the policy and present that
research to the government in a workshop. The research was coordinated by SERA but
undertaken and presented by international experts. That was effective and convinced the
government. This is an approach that can be used to address complex policy issues with many
dimensions. The second approach was for SERA staff to quickly address hot topic policy issues
and provide analysis and policy guidance, and this was done effectively on the issue of rice
imports in 2013. Both approaches were effective and the reason that SERA could do both is they

61
have had significant in-house capacity to design as well as perform research. This has been
achieved by pairing an international agricultural policy expert with a local Tanzanian agricultural
policy expert. This pairing brings together the cross-country experience, best practices, and
research approaches from international work and the knowledge of the local situation, historical
context, and political realities in Tanzania. A benefit of SERA having this in- house expertise is
that it can engage in high-level policy discussions on an ongoing basis and support the research
done by international researchers. It allowed SERA to respond to policy issues quickly before
more detailed research can be done.
• The SERA Policy Project focused primarily on national policies affecting major food crops. This effort was of two types: (a) research to understand the impacts of policies and the performance of the subsectors, and (b) rapid response analysis on important policy issues as they emerged. There is an ongoing need for policy analysis of emerging issues as they arise, and it is important to have the capability in place so issues can be analyzed quickly and correctly. This need cannot be met effectively by teams of short-term consultants organized for that purpose because such consultants rarely have the experience or analytical capability to respond quickly with quality analysis.
• Research is needed on all aspects of the determinants of productivity in agricultural sub-sectors and value chains. Initial research should begin by identifying the important problems of the sub-sectors e.g. livestock and then examining the policy framework. For example, what are the policies regarding the importing of vaccines to control disease, the importing of improved breeds from neighboring countries or developed countries, the export of animal products such as meat or hides, or the policies for importing or manufacturing of feed additives and supplements? Research on these issues will lead to other policy questions and a project like SERA is needed to build a solid foundation of understanding of policy impacts for such an important sector.
• The needs of each value chain are very different, and policies appropriate for one may not be suitable for the other. Research is needed to identify the problems of each and examine policies to see if they are providing the right market incentives.
• An important lesson learned from SERA is that the willingness to consider policy reforms and listen to evidence-based research varies within the government, and there will be champions and detractors. For example, the Director of Food Security told SERA staff in the first meeting that he would be their worst critic. That proved true and SERA never received his support for any policy reform. However, others in the Ministry of Agriculture and in other branches of government had been more willing to consider policy reforms, and relationships with such officials need to be cultivated because they can be the agents of change. Major policy reform should not be directed at a single Ministry, but instead at whole-of-government to allow officials from other Ministries to contribute to the discussion and policy decision. For example, the lifting of the maize export ban would not have occurred if the policy reform effort had been directed at the Ministry of Agriculture, because it opposed lifting the export ban.
Reference document: SERA Policy Project Final Report

62

63
D. Agricultural Marketing Systems Development Programme (AMDSP)
Country: Tanzania
Donor: African Development Bank, IFAD, Ireland Aid and GOT
Implementing agency/organization: Prime Minister's Office; Prime Minister's Office-Regional
Administration and Local Government; Project Management Unit (PCU) District Councils; Road Fund;
and Consulting Engineers. Supervisors: UNOPS (2002-2008) and IFAD (2009-2010).
Period (dates): 4 October 2002 to 30 June 2010.
Amount of funds: US$52.18 million (Excludes GOT and beneficiaries contribution of US$5.92 million).
Geographic zone(s): The Northern Marketing Zone (Kilimanjaro, Arusha, Manyara, and Tanga Regions)
and the Southern Highlands Marketing Zone (Iringa, Mbeya, Rukwa, and Ruvuma Regions).
Value chains addressed: Non-specific but addressed systemic agricultural marketing issues in the
geographic zones. However, maize and paddy featured in evaluation report.
Expected beneficiaries: 25,000 rural households
About Agricultural Marketing Systems Development Programme
The AMDSP was conceived and implemented to address constraints that affected efficient functioning of
the marketing system. The Programme addressed the key challenges through reduction of post-harvest
losses due to inadequate marketing infrastructure coupled with high transfer costs. Smallholder
producers did not have the organizational skills and information especially on prices to participate
effectively in the agricultural markets. AMSDP complemented efforts of the Government of Tanzania
that had an ongoing ASDP financed by the Africa Development Bank and other donors including World
Bank, IFAD and European Union) that aimed at achieving the overall agricultural sector vision of
commercialising smallholder agriculture, which hinges on among others, an efficient and responsive
marketing system for inputs and outputs.
Overall Objectives:
To increase the incomes and food security of at least 25,000 rural poor households living in the northern
and southern marketing zones
Expected Results
The structure, conduct and performance of agricultural marketing system improved in the northern and
southern marketing zones
Program component #1: Policy development support
Objectives: To improve the efficiency of the marketing system as a whole, benefiting all participants,
including producers, intermediaries and consumers and improvement of relevant marketing policies

64
Principal Activities:
• Awareness creation for national and local government policy-makers to reduce the adverse
economic impacts of marketing policies on smallholders and traders
• Training on efficient agricultural taxation policies at district level.
Impacts
Policy influence: Capacity for policy development and analysis was improved. Some key successes included: finalization of National agricultural policy with grass-roots stakeholder contribution; helping the functioning of the National Agricultural Marketing Policy Coordination Committee and contributing to having the Agricultural Marketing Policy approved by the Government of Tanzania on 29th of July 2008.
Agricultural taxation policies: District Councils were trained and equipped to implement economically efficient agricultural taxation policies. The number of steps and time for obtaining business license was reduced from 24 to 15 in the project districts. Crop cess charged to farmers dropped from 5 percent to 3 percent, but only in 16 selected districts.
Program component #2: Producer Empowerment and Market Participation
Objectives: Empowerment of the target groups by strengthening them financially and organizationally
To assist producer groups, grass roots institutions, small and medium-scale traders and processors to:
• Strengthen their social, organizational and financial structure to enable them to participate
effectively in marketing activities,
• Empower them technically through improved market information, extension and research
services to enhance their leverage and bargaining power vis-a-vis more organized agro-
processors, wholesalers and exporters; and
Principal activities:
• Strengthen old and newly formed producer and trader groups to use improved production, processing and marketing techniques.
• Establish computerized market information system established
• Establish regional and district capacity to collect price information
• Establish appropriate vertical and horizontal linkages with formal market players
Impacts
Groups formed: The number of producer, process and trader groups formed or strengthened is 1,202
against the targeted 1,000 groups. The number of producer, processer and trader groups’ memberships
(representing households) increased to 46,507 members (27,126 males and 19,381 females) against the
targeted 25,000 households. Producers had improved the quality of selected marketed product by 80

65
percent. About 812 groups have been formally registered as cooperatives, NGOs or companies limited
by guarantee.
Market information: The number of districts from which data on market prices is received increased from 20 to 80 districts. The quarterly bulletins on market data are still being disseminated on time.
Program component #3: Financial Market Services
Objectives: To enable the target groups to own and operate the system and become active partners in
all decision-making processes.
Principal Activities:
Using a guarantee fund of US$1.5 million disbursed through a participating commercial bank (PCB) to minimize the risks of lending in rural areas to test, on a limited scale, a variety of lending instruments. The following were some of the main activities under this component:
• Facilitate interaction between producers and traders/processors
• Provide business advisory services to producer, trader and processor groups
• Operationalize inventory lending scheme
• Establish loan guarantee fund
• Develop an inventory scheme (warehouse receipt system (WRS)) to promote proper storage and provide farmers with access to credit
• Technical assistance for feasibility and market studies to support lending Impacts:
Contractual agreements: About 150 farmers’ groups were linked to buyers under contractual
arrangements. The volume of output sold through contractual arrangements trebled from 50 to 150
deals. The numbers of contractual arrangements entered and maintained between producers and
traders have increased from 50 to 150. The volume of output sold through contractual arrangements
has increased five-fold from 500 to 2,450 tonnes. The value of unit outputs sold through contractual
arrangements has doubled and/or trebled from TSH 150 to 357 per a kg of maize and from TSH 257 to
850 per a kg of paddy rice.
Access to finance: The rural inventory lending scheme was effective and operational. About 4,066 crop
depositors accessed loans from banks worth TSH 4.1 billion. Maize, paddy and garlic weighing 5,459
tonnes of were deposited in the designated warehouses. About 12 MFIs accessed loans for on-lending
under the WRS. Cumulatively, TSH 4.1 billion worth loans have been extended by participating banks to
crop depositors.
Program component #4: Rural Marketing Infrastructure Support

66
Objectives: To address the high marketing transaction costs associated with inadequate road
infrastructure, market centers and storage facilities in rural areas.
Principal activities:
• Improve and maintain network of rural roads in focal areas
• Maintain and improve other market infrastructure
• Train district council staff and councilors, and village communities in planning and maintenance
of infrastructure.
Impact:
Infrastructure maintenance and rehabilitation: A total of 24 marketplaces in selected focal areas were
upgraded to completion level and are in use. Also, 12 Storage facilities were rehabilitated to completion
level and are in use. 4 new farm produce storage facilities in Magugu (Babati District), Bashay (Mbulu
district), Engutoto (Monduli district) and Kamsamba (Mbozi district) were constructed.
Rural road access: A total of 957.3 kilometres of rural access roads, which is 91.2 percent of target, 50
bridges and 1549 culverts were constructed. All the 71-kilometre road stretch and one bridge were
rehabilitated to completion level and passable throughout the year. The number of households located
more than 10kms from passable roads has been reduced from 20 percent to 10 percent.
Capacity building: District and regional authorities as well as local communities were trained. These include: 8 Regional Secretariat Engineers; 40 District Engineers; 40 technicians; 575 community beneficiaries and 81 districts councilors.
Discussion:
AMSDP was designed and implemented with full government involvement. The designed program at appraisal stage had to accommodate government adjustments to match its standards in terms of marketplace and storage facilities. Also, it agreed to the use of locally contracted engineers instead of international engineers in the interest of cost efficiency. The program was coordinated within the Prime Minister’s office because it was cross-ministerial involving all the Agricultural Sector Lead Ministries, the Prime Minister’s Office-Regional Administration and Local Government, MAFC, Ministry of Industry, Trade and Marketing and Ministry of Works and its Agencies.
The program’s alignment to the then ASDP I brought in additional resources although it was a direct project funding and not a basket funding or general budget support; but being a soft loan to GOT, it was not only synergetic but also embedded the institutional strengthening part by training the engineers at regional and district levels, building capacities of direct beneficiaries and demonstrated replicable inventory credit via warehouse receipt system coupled with strengthening and capitalizing Agriculture Microfinance Institutions. AMSDP was designed to complement, deepen and consolidate the gains made under a sister program, Rural Financial Services Program (RFSP) in the same geographic zones and the two programs ran concurrently but with distinct synergetic interventions.
Owing to the successes recorded by AMSDP and its sister program RFSP, the GOT had already launched a follow-on phase under the name of Marketing Infrastructure, Value Addition and Rural Finance Support Programme. However, IFAD procedures required that an interim evaluation is undertaken by

67
the Independent Office of Evaluation of IFAD before final consideration of another phase of a programme17.
Conclusions:
Necessary conditions that drove success:
• AMSDP had a satisfactory performance in terms of effectiveness and impact. Improving farmers’
access to rural financial services and agricultural marketing services was high (and remains high) on
the agenda of the Government of Tanzania when IFAD in 2001 approved its loans for the AMSDP.
This support also addressed the immediate needs of poor rural farming households who had
experienced a significant reduction in their access to marketing and financial services after the
collapse of the cooperative system and the state-owned financial sector in the late 1980s. Aligning
project activities to this key priority aided in its success.
• The emphasis on partnerships and linkages at all levels
• Scaling up the positive experiences of AMSDP and avoiding support to organizations and activities with little potential for success
• In the design, focus was maintained on improving access to financial and marketing services of the rural economically active poor and also emphasized financial and commercial viability and sustainability in the support to the beneficiaries.
Key factors limiting success:
• Generally, the programme was more effective at the micro/field level than at national level. The
programme had only modest influence on the national policy and institutional frameworks for rural
finance and agricultural marketing. And at meso level, AMSDP support to farmer groups
empowerment did not result in strong apex organizations for producer/marketing groups to pool
other agenda including subnational lobbying and advocacy on marketing issues.
• Vast coverage area and outreach: As with most rural outreach programmes, the design of AMSDP sequenced the outreach in batches or phases as it was not feasible to work with all target groups from day one. This implied a limited duration of support for new groups that were to be included by the end of the implementation. At the design stage, it was not properly appreciated if this would be sufficient to achieve sustainable impact with the beneficiary groups.
• Delivery cost and efficiency: Many different factors contributed to the high costs. A major factor was the combination of operating largely in project mode and the ambitious area coverage, distributing relatively limited budgets over vast geographical areas and many districts. The shares of total budget allocated for programme management and monitoring and evaluation were high but
17 See IFAD. 2011. Project Evaluation. United Republic of Tanzania: Rural Financial Services Programme and Agricultural Marketing Systems Development Programme Interim Evaluation. Independent Office of Evaluation. Report No. 2256-TZ.

68
insufficient; by programme completion these items accounted for 17 per cent of total expenditure for AMSDP (against 10 per cent in design). The lower percentage for AMSDP was due to a large infrastructure investment financed by the African Development Bank.
• Formal commercial bank intermediation still is not attainable to rural smallholder farmers with assets that cannot be collateralized, and this was a major challenge in improve access to agricultural credit.
Replicability and constraints to replicability in other contexts:
• Create synergy: Although not a strong feature of the RFSP and AMSDP programme designs, when both programmes provided support in the same geographic area they leveraged resources and complemented each other during implementation by offering synergies to improve the performance of each individual programme. The most evident linkage between AMSDP supported producer/marketing groups and the RFSP SACCOS was in the promotion of the Warehouse Receipt System.
• Create partnerships and sourcing out: The Warehouse Receipt System, AMSDP’s use of Partner Agencies for capacity development, the success of some producer groups engaged in certain value chains, the investments in marketing infrastructure etc. are all positive contributions that warrant replication in other contexts. Caution needed to be taken when support for some MFIs and producer groups as it showed that uptake varied, and time investment also varied to gain success.
• Design to align to host country strategic frameworks: The design applied a holistic programmatic approach, well aligned to IFAD’s and Government’s strategies for the two areas. The programmes combined support for improvement of national frameworks as well as for farmers and rural households through support for developing their informal groups or more formal associations and cooperatives. This lesson is replicable.
• Provide support to the deserving to debottleneck barriers to their advancement. In supporting private enterprise development, there is a difficult choice between the approach of “picking the winners”, those with high probability of succeeding, or the approach of addressing the needs, even though the likelihood for success is limited or is a significant challenge. The AMSDP had generally applied the latter approach, which is consistent with IFAD targeting goals, and reached out to groups in difficult and remote locations. This has social justifications but may also explain why at the end of the programme there are several producers groups which have bleak performance.
• Anticipate the challenges that go with promoting enterprise development. The AMSDP underestimated the challenge of establishing or promoting viable private enterprises, which, in fact, was an important element of the programme. AMSDP was to establish/promote 1,000 viable producer/trader groups and achieved 1,202 of which only 16 per cent are self-sustainable. International experience shows that there are limits to what governments can do in terms of facilitating the establishment/development of viable private enterprises and that these skills are often found outside the public sector. Finally, when supporting new enterprises, a significant percentage will fail and should be allowed to fail.
• Consider sustainability of grassroot organizations critically. At the end of both programmes, there are serious challenges related to the sustainability of the supported beneficiary groups. Among the AMSDP-supported producer groups, only 16 percent have reached what the programme terms the performing stage, implying that they are self-sustainable and do not need further external support.

69
It may be argued that this situation can be solved if the district administrations continue supporting the producer groups until they no longer require support. The general finding is that most districts are committed to continuing some support, however the support would be far from the level provided by the programme. This finding, combined with the likelihood that several producer groups cannot be saved whatever the amount of support, makes it highly likely that a considerable number of supported producer groups will collapse or become dormant in the years to come
Reference document: Agricultural Marketing Systems Development Programme completion report
Annex 1: Key Informants
Name Position and Institution
1. Walter Swai Former Programme Coordinator, Agricultural Marketing Systems
Development Programme
2. Hamisi Mwango Program Director, USAID Feed the Future NAFAKA I & II
3. Geoffrey Kirenga Chief Executive Officer, SAGCOT Center, a beneficiary Organization of
USAID funded Feed the Future Sera Policy Project
4. Casmir Makoye Independent Consultant, Former National Policy Advisor at SAGCOT
Center, a beneficiary Organization of USAID funded Feed the Future
Sera Policy Project

70
Lessons Learned for Future Programming
This section provides a summarized follow up on work that has been done on agricultural projects and
programmes that have had a long lasting impact on the agricultural sector in Malawi, Tanzania and
Zambia. The brief aims to give perspectives on what works and what does not in the implementation of
agricultural projects/programmes in the region. Specifically, the brief aims to synthesize some lessons
learned in light of future programming in the region.
Factors that may hinder success
1. Capacity constraints
Agricultural programmes/projects that use government structures for implementation typically
experience delays in implementation due to bureaucratic red tape, and insufficient specialized
technical human resource at sub-national level. This may lead to escalation of costs due to
delays in implementation and having to invest in human resource beyond initial project design.
2. Complexity of project design
Project/programme designs that are very complex in nature and require setting up of
implementation structures from scratch require heavy investment. But often this investment is
not put in place hence leads to failure of the project/programme.
3. Limited private sector participation
Limiting the participation of private sector and not having a clear strategy of engagement
implementing an agribusiness or markets oriented agricultural project/programme may limit
market opportunities and impacts for the interventions and reduce the likelihood of
sustainability beyond the project life. Specific areas of markets that can be negatively impacted
include buying, value addition and marketing. Often when the projects ends all the linkages
with the market ends hence farmers stock producing commodities that were being promoted by
the project.
4. Inconsistent domestic agricultural policies
National level policy decisions can have a detrimental effect on intervention goals. For instance,
export bans can impede productivity efforts, offset price instability and this can ultimately reduce
positive impacts. The political economy surrounding aspects of programme/project interventions
must be considered. For example, the Tanzania NAFAKA warehouse refurbishment program and
the farmer association development program assisted with long-term storage to offset price
instability; but the negative effects of export ban policies that locked surplus produce within
borders, and the cost of domestic movement of commodities from district to district, negatively

71
affected all farmers. Hence, consideration of the political economy issues during the project
design phase is very key.
5. Geographic coverage area and outreach
A large geographic distribution of intervention activities means that there will be limited scope of
support unless heavy investment is made in having more support on the ground. This can be
costly and inefficient if interventions are being piloted. This can also have significant budgetary
implications for monitoring and evaluation activities. However, the selection of the geographic
area should not be political motivated or influenced because any change in government would
mean the project may have to be discontinued even if successful.
Environment required to aid success
• Alignment with appropriate national policy. Programme/Project design aligned to appropriate
national policies/agendas that can foster government buy-in which can help in the
implementation process and enhance broader stakeholder participation.
• Public sector collaboration: Generally, planned interventions should facilitate public sector buy-
in and have close collaboration with local government authorities. The project/programme must
be aligned to various protocols that Government has signed which could be bilateral or
multilateral (e.g. Southern Africa Development Community, Common Market for Eastern and
Southern Africa, and African Continental Free Trade Area etc.). This gives the project the
opportunity to be deepened and broad based for effective success
• Private sector involvement: The involvement of the private sector as integral to the design of
programme/project activities can enhance access to institutional and technical capacity (e.g. the
IRLAD irrigation project in Malawi saw this, and collaborations with the International Food Policy
Research Institute and the World Bank in the SERA Policy Project Tanzania). Their involvement
can include provision of complementary goods and services such as business support
programmes/market information systems etc. to project/programme activities. Large scale
enterprises can be included in these collaborations.
It is important not to give the private sector too much free support to make them want to
participate in the project /programme. This should be avoided at all cost because the
companies being given support may fail to sustain their activities beyond the project without the
incentives. The opportunities created by the project should be the motivation for participation
rather than the expectation for support from the project.
• Multisectoral coordination: Improving intra and multi-sectoral coordination e.g. commerce,
transport, rural infrastructure such as roads and land is an important priority in ensuring
sustainable and high impact. The agricultural sector does not exist in isolation and the impact of
interventions in the sector can be enhanced to addressing non-agricultural constraints that

72
directly impact activities. This includes supporting policies, systems and reforms to improve the
functionality of the agricultural sector. This also requires the development of a clear strategy to
guide the coordination process with a key coordination function/entity.
• Corporate governance systems: To enhance coordination, strong corporate governance system
should be imbedded in the project design right from the beginning. Oversight roles by various
bodies (for example Steering Board Committees, Sub Committees consisting of representatives
from relevant ministries, private sector and civil society and community representatives) should
be clearly defined and implemented to the letter. This helps with oversight as well as enhance
multisectoral coordination for the success of the project/program.
• Extension and advocacy: The inclusion of agricultural extension and advocacy in the activities is
critical for beneficiaries to internalize intervention goals and get sufficient buy-in to have long
lasting impact. Soil and water conservation messages should be considered as a cross cutting
issue, and hence be mainstreamed into the overall extension messages for enhanced
productivity. This should also include inter-activity collaborations such as nutrition, water
sanitation and health, and agricultural productivity among others.
• Area-specific enterprise development: Prioritizing agricultural enterprises that are area specific
can be helpful in taking advantage of food security potential, and income generating potential. If
there are other programmes doing similar work in the same geographic area, resources should
be leveraged and complemented with each other during implementation by offering synergies
to improve the performance of each individual programme.
• Policy influence: Policy change efforts should be persistent and focus on pointing out
opportunities rather than weaknesses. Programme/project planning should take advantage of
known areas where the government is receptive to making changes to capitalize on their
willingness. If receptiveness is still an issue, provision of compelling evidence can go a long way
in bringing change to the sector. The planning of activities must also be flexible enough to
respond to emerging policy issues. This has shown success with the SERA policy project in
Tanzania and FSRP that is now IAPRI in Zambia.
• Monitoring, Learning and Evaluation and Audit: Monitoring, Learning and Evaluation of the
project should be high on the agenda. Very strong MLE systems should be part of the project
design and regular audits are essential in order to continuously guide the project and make
corrective measures.
• Exit Strategy: There is need for a clear and implementable exit strategy especially when donor
funding is involved. The exit strategy should be conceptualized at the inception of the project,
thus it should be part of the project design. This should be monitored closely as structures are
being built for continuity and sustainability of the project.
Future Programming

73
Agricultural productivity considerations
• Agricultural productivity programmes/projects should be built on the principles of sustainable
intensification of agricultural production that emphasizes on sustainable agricultural production as
well as sustainable management of the natural resource base.
• Where a programme does not address ‘market access’ challenges such as reducing barriers to entry,
access to agricultural finance, provision of market information and the development of market
infrastructure, the program’s agribusiness strategy or planning framework should provide guidance
on how the targeted beneficiaries will gain access to input and output markets;
• Rain-fed production based projects focused on enhancing productivity remains an inherent risk in
achieving success. The need to think about risk mitigation strategies associated with such inherent
risk is key at project design phase. For example, well-designed and implemented private sector led
agricultural insurance programs to mitigate weather risks are critical to agricultural growth,
especially for staple crops. In terms of market access, full discipline and adherence to contract
conditions by all parties as the process moves through times of drought, export bans, temptation of
side-selling, and the never-ending search for the “better price” requires serious consideration.
• Development of a programme specific agribusiness strategy which guides the agribusiness
development process across programme areas is essential. In addition, the agribusiness strategy
should be aligned to a national agribusiness strategy as well as agribusiness components in other
programmes or projects;
Multisectoral collaboration
• Involvement of multiple implementing partners in agricultural investment programmes or
projects can improve multi sectoral collaboration and ownership
• Basket funding mechanisms such as Multiple Donor Trust Funds can promote coherence among
donors in advancing reforms, policy positions as well as flexibility and timeliness in decision-
making. This funding mechanism can significantly reduce transaction costs towards decision
making, and also increased joint ownership and accountability for all decisions made
• The project/program should promote effective private sector participation. For example, the
project may consider the development of a public-private-partnership which can increasingly
strengthen farmers’ linkages to core markets, business support functions and market
information systems.
• Oversight by a multi-sector team should be put in place at project inception to enhance
multisectoral coordination.
Policy influence work
• Policy influence based interventions should work with Ministries as they make most policy
decisions as part of their mandate to implement policies through administrative action instead
of legislation. This provides an entry point to influence policies. Major policy reform should not
be directed at a single Ministry, but to all relevant Ministries to allow officials from other

74
Ministries to contribute to the discussion and policy decisions. Multisectoral collaboration is
required to enhance cohesion, traction and cross fertilization of ideas.
Gender
• Any project that has a strong gender component in its activities needs to be cognizant of the
gender dynamics rooted in the place of operation
Grassroots activities
• Sustainability of grassroot organizations should be considered critically. In supporting private
enterprise development, there is a difficult choice between the approach of “picking the
winners”, those with high probability of succeeding, or the approach of addressing the needs,
even though the likelihood for success is limited or is a significant challenge. The AMSDP had
generally applied the latter approach, which is consistent with IFAD targeting goals, and reached
out to groups in difficult and remote locations. This has social justifications but may also explain
why at the end of the programme there are several producers groups which have bleak
performance. It may be argued that this situation can be solved if the district administrations
continue supporting the producer groups until they no longer require support. The general
finding is that most districts are committed to continuing some support, however the support
would be far from the level provided by the programme. This finding, combined with the
likelihood that several producer groups cannot be saved whatever the amount of support,
makes it highly likely that a considerable number of supported producer groups will collapse or
become dormant a few years after the project/program ends.