moving towards mission fulfillment: … · moving towards mission fulfillment: measuring key...
TRANSCRIPT

MOVING TOWARDS MISSION FULFILLMENT: MEASURING KEY PERFORMANCE INDICATORS FOR SUCCESS Operational Plan Year-End Monitoring Report 2015-16

Operational Plan Year-End Monitoring Report 2015-16
______________________________________________________________________________________
TABLE OF CONTENTS Executive Summary………………………………………………………………………………………………………………………………3 Key Performance Indicator Scorecard…………………………………………………………………………………………………..5 Core Theme 1: Student Success…………………………………………………………………………………………………………….8 Core Theme 2: Workforce Education…………………………………………………………………………………………………..17 Core Theme 3: Basic Skills Education…………………………………………………………………………………………………..23 Core Theme 4: Institutional Sustainability…………………………………………………………………………………………..28 Conclusion and Recommendations……………………………………………………………………………………………………..34
2 | P a g e

Operational Plan Year-End Monitoring Report 2015-16
______________________________________________________________________________________
EXECUTIVE SUMMARY
The Operational Plan Year-End Monitoring Report is an annual report that is distributed campus-wide and shared with Executive Cabinet and the Board of Trustees. This report provides readers with an overview of RTC’s progress toward mission fulfillment. This report includes final and preliminary data through 2015-16, where available. Due to the timing of the State Board for Community and Technical College’s (SBCTC) release of data files, in some instances, preliminary data is not provided if it will have a dramatic impact on accurately assessing progress for an indicator. Each year, Renton Technical College (RTC) will publish two monitoring reports – a mid-year report in March (spring) and a year-end report in September (fall). In fulfillment of the Standards of Accreditation set forth by the Northwest Commission on Colleges and Universities (NWCCU), RTC has four core themes that support and align with the mission of the College. The mission of Renton Technical College is to prepare a diverse student population for work, fulfilling the employment needs of individuals, business, and industry. The core themes that support and align with our mission are as follows:
• Core Theme 1: Student Success • Core Theme 2: Workforce Education • Core Theme 3: Basic Skills Education • Core Theme 4: Institutional Sustainability
The impetus for which this report was created is to provide the campus community with an overview of the College’s outcomes and key indicators for measuring success. Each core theme includes objectives and key performance indicators (KPIs) for monitoring the operational activities that ultimately support each core theme. Twenty KPIs serve as overarching measures for which the College measures success. These indicators are meant to evolve as the College evolves, and can be revised when and where applicable. Each KPI is assigned a point outcome value of 0, 1 or 2 (with 0 being the lowest level of performance and 2 being the highest level of performance) based on an analysis of results as compared to appropriate benchmarks or standards. Although the College has identified 20 KPIs, there are several other indicators for which faculty, staff, administrators and the Institutional Research (IR) Office use to measure and monitor progress. The main findings of this report include:
• The overall mission fulfillment score of 61% represents a 2% increase over the previous 2015-16 Mid-Year Monitoring Report.
• The score for Core Theme 1: Student Success increased by 4%, the score for Core Theme 4: Institutional Sustainability increased by 8%, the score for Core Theme 3: Basic Skills Education decreased by 16%, and the scores for Core Theme 2: Workforce Education stayed the same.
• We do not yet have preliminary 2015-16 retention data for all cohorts, although preliminary data for the fall cohort suggests a continued decline. We will continue to closely monitor these KPI’s and will provide an update for the 2015-16 cohorts in the next monitoring report.
3 | P a g e

Operational Plan Year-End Monitoring Report 2015-16
______________________________________________________________________________________
• The new program review pilot commenced in spring 2016, increasing the score on the program review implementation KPI to a 1 (this indicates some progress has been made). However, now that the program review process has been implemented and an assessment committee formed, it may be important to create another indicator (or several indicators) of achievement for the systematic learning outcomes assessment process.
• Based on preliminary data, overall completion rates increased by 2% and the achievement gap between minority and White students closed substantially. However, the degree completion rate decreased for all students and the achievement gap for degree completions widened slightly.
• The number of evening courses offered has continued to decrease, although the decrease has been small. It may be important to consider whether or not this KPI continues to be meaningful and/or whether or not there is student demand for this kind of programming.
• The Basic Skills Education Core Theme experienced the most dramatic changes in KPI scoring. Retention and significant gains have continued a downward trend over the past four years.
• Preliminary data suggests that the basic studies students’ transition rate increased slightly in 2015-16. However, we did not meet our goal of increasing the transition rate by 5%.
• Donations and partnerships increased substantially in 2015-16.
4 | P a g e

Operational Plan Year-End Monitoring Report 2015-16
______________________________________________________________________________________
KEY PERFORMANCE INDICATOR SCORECARD This scorecard represents RTC’s progress towards mission fulfillment. Each Core Theme has associated objectives and Key Performance Indicators (KPIs) that are measured each year. The data is reviewed by the IR Office and College Council. Each KPI receives a score based on objective, quantifiable measures.
Measure Core Theme Objective KPI Mid-Year Score
End-of-Year Score
1st to 2nd Quarter Retention Overall+ Student Success 1.1 1
1st to 2nd Quarter Retention by Race+ Student Success 1.1 1
1st to 3rd Quarter Retention Overall+ Student Success 1.1 2
1st to 3rd Quarter Retention by Race+ Student Success 1.1 2
One-Year Persistence Overall* Student Success 1.1 3
One-Year Persistence by Race* Student Success 1.1 3
Course Success Rates Overall* Student Success 1.2 4
Course Success Rates by Race* Student Success 1.2 4
Student Satisfaction with Programs and Services (CCSSE) Student Success 1.3 5
Student Satisfaction with Programs and Services (SENSE) Student Success 1.3 5
Student Learning Outcomes Assessment Student Success 1.4 6
Program Review Implemented in All Programs Student Success 1.4 6
TOTAL SCORE – CORE THEME 1: STUDENT SUCCESS SCORE 13/24 (54%)
14/24 (58%)
Completion Rates Overall* Workforce Education 2.1 7
Completion Rates by Race* Workforce Education 2.1 7
Licensure and Certification Pass Rates* Workforce Education 2.2 8
Advisory Committee Satisfaction with Programs Workforce Education 2.2 9 Not
available*
5 | P a g e

Operational Plan Year-End Monitoring Report 2015-16
______________________________________________________________________________________
Placement Rates ¥ Workforce Education 2.3 10
Course and Program Learning Formats (# of distance education courses)
Workforce Education 2.4 11
Course and Program Learning Formats (# of evening courses) Workforce Education 2.4 11
TOTAL SCORE – CORE THEME 2: WORKFORCE EDUCATION 9/14 (64%)
9/14 (64%)
Gains Made Basic Skills Education 3.1 12
Retention Rates – Basic Studies Basic Skills Education 3.2 13
Transition Rates* Basic Skills Education 3.3 14
TOTAL SCORE – CORE THEME 3: BASIC SKILLS EDUCATION 2/6 (33%)
1/6 (17%)
Employee Demographics Institutional Sustainability 4.1 15
Budget to Actual Variance Institutional Sustainability 4.2 16
Technology Replacement Cycle/Enhance Technology Services
Institutional Sustainability 4.2 17
FTE Enrollment Institutional Sustainability 4.3 18
Donations and Partnerships Institutional Sustainability 4.4 19
Grants and Contracts Funding* Institutional Sustainability 4.5 20
TOTAL SCORE – CORE THEME 4: INSTITUTIONAL SUSTAINABILITY 9/12 (75%)
10/12 (83%)
TOTAL MISSION FULFILLMENT SCORE (56 POINTS POSSIBLE) 33/56 (59%)
34/56 (61%)
NOTE: *Preliminary data; will be finalized in the 2016-17 Mid-Year Report. +Preliminary data for 2015-16 is not yet available for the winter and/or spring cohorts; therefore, this KPI will not be updated until the 2016-17 Mid-Year Report. ¥ 2014-2015 data will not be available until December, 2016.
6 | P a g e

Operational Plan Year-End Monitoring Report 2015-16
______________________________________________________________________________________ SCORING KEY
KPI Progress Toward Goal Average Rating Action
Goal Met 2 Use model, best practice; continue to support practice
Progress Towards Goal 1 Meets benchmark; look to continue improvement
Goal Not Met 0 Develop action plan; take action and commit additional resources
Mission Fulfillment Threshold: 75% SCORECARD SUMMARY The overall mission fulfillment score of 61% represents an increase of 2% over the previous 2015-16 Mid-Year Monitoring Report. The score for Core Theme 1: Student Success increased by 4%, the score for Core Them 4: Institutional Sustainability increased by 8%, and the score for Core Theme 3: Basic Skills Education decreased by 16%. Out of the 28 measures outlined in the scorecard, four experienced increases in scores, two experienced decreases in scores, and 22 experienced no change from the mid-year report. KPI #6, “PEP Implemented in All Programs” increased from a score of “0” to a score of “1”, as the pilot program review process commenced in spring/summer 2016. A timeline for all programs to start the program review process has been created, with all programs completing the first three-year cycle by spring 2020. For KPI #9, “Advisory Committee Satisfaction with Programs,” although we did pilot the new survey in spring 2016, this data represents our baseline data and therefore we have no subsequent data from which to draw comparisons. The response rate on the survey was only 19%, which also contributed to its score of “0”. Core Theme 3: Basic Skills Education experienced the most dramatic changes in KPI scores. Initially, in 2014-15 we started to see increases in significant gains and retention rates, but these rates decreased again in 2015-16, resulting in a change from a score of “1” to a score of “0” for both measures (KPI # 12 and #13). The basic studies transition rate (KPI #14) has increased slightly from 12.3% to 13.6%, therefore the score moved from a “0” to a “1”. Due to changes in funding and decreased tuition revenue, the IT replacement cycle did not meet its target of 75%, resulting in a decrease in score for KPI #17, “Technology Replacement Cycle/Enhance Technology Services”, from a “2” to a “1”. Projections for 2016-17 suggest that the replacement cycle should reach its target moving forward. Lastly, the number of donor gifts in 2015-16 increased by 3%, however, the dollar value of gifts increased by 142%. Therefore, the score for KPI #19, “Donations and Partnerships” increased from a “0” to a “2”.
7 | P a g e

Operational Plan Year-End Monitoring Report 2015-16
______________________________________________________________________________________
CORE THEME 1: STUDENT SUCCESS Renton Technical College provides student access that reflects the diverse demographic makeup of its community. Equity is achieved by high success and completion rates of all students, data-informed decision making, and student-centered policies and practices throughout the institution. Key Performance Indicators #1: 1st to 2nd Quarter Retention Rates (disaggregated by race/ethnicity) #2: 1st to 3rd Quarter Retention Rates (disaggregated by race/ethnicity) #3: One-Year Persistence Rates (disaggregated by race/ethnicity) #4: Course Success Rates #5: Student Satisfaction with Programs and Services #6: Student Learning Outcomes Assessment
8 | P a g e

Operational Plan Year-End Monitoring Report 2015-16
______________________________________________________________________________________ CORE THEME 1: STUDENT SUCCESS Objective 1.1: Attract and retain a student population reflective of the diverse community we serve. Key Performance Indicator #1: 1st to 2nd Quarter Retention Rates (disaggregated by race/ethnicity).
Benchmark(s): 1) This indicator is benchmarked against previous academic years’ outcomes with an indicator of
achievement if rates are at least 2% higher than the previous year. RTC has exceptionally high retention rates, making substantial increases over time difficult to attain.
2) The retention rates for minority students will be equal to or within +/-5% of the retention rates for students identifying as White. A 5% difference is the minimum achievement gap that is considered acceptable and accounts for natural fluctuations over time.
Measure: 1st to 2nd Quarter Retention Rate, Overall 2011-2012 2012-2013 2013-2014 2014-2015
1st to 2nd Quarter Retention 65.9% 67.6% 76.5% 63.6%
Benchmark Met -- No Yes No
KPI Score and Rationale
Score = 0. Despite initial increases in the overall rates from 2011-12 to the 2013-14 year, the overall retention rate decreased by over 12% in 2014-15, bringing the rate lower than our 2011-12 rate.
Measure: 1st to 2nd Quarter Retention Rate, Disaggregated by Race/Ethnicity Group 2011-2012 2012-2013 2013-2014 2014-2015 Minority 58.4% 60.6% 71.9% 60.5% White 70.9% 74.3% 78.9% 65.8% Benchmark Met No No No No
KPI Score and Rationale
Score = 1. Although the achievement gap is still greater than 5%, we have seen a decrease in this gap over the past 4 years. The 2014-15 rate was 5.3% lower for minorities; a marked improvement over previous years.
Data Source: SBCTC Data Warehouse Student Achievement Database, PEP Cohorts. - Minority = Asian/African-American/Hispanic/Native American. **Data is not yet available for the spring 2016 cohort. As this cohort tends to have lower retention rates, including preliminary data without this information would skew the data. This indicator will not be updated until the mid-year report in March 2017.
9 | P a g e

Operational Plan Year-End Monitoring Report 2015-16
______________________________________________________________________________________
CORE THEME 1: STUDENT SUCCESS Objective 1.1: Attract and retain a student population reflective of the diverse community we serve. Key Performance Indicator #2: 1st to 3rd Quarter Retention Rates (disaggregated by race/ethnicity).
Benchmark(s): 1) This indicator is benchmarked against previous academic years’ outcomes with an indicator of
achievement if rates are at least 2% higher than the previous year. RTC has exceptionally high retention rates, making substantial increases over time difficult to attain.
2) The retention rates for minority students will be equal to or within +/-5% of the retention rates for students identifying as White. A 5% difference is the minimum achievement gap that is considered acceptable and accounts for natural fluctuations over time.
Measure: 1st to 3rd Quarter Retention Rate, Overall 2011-2012 2012-2013 2013-2014 2014-2015
1st to 3rd Quarter Retention 54.8% 56% 59.4% 53.4%
Benchmark Met -- No Yes No
KPI Score and Rationale
Score = 0. Despite initial increases in the overall rates from 2011-12 to the 2013-14 year, the overall retention rate decreased in 2014-15, bringing the rate lower than our 2011-12 rate.
Measure: 1st to 3rd Quarter Retention Rate, Disaggregated by Race/Ethnicity Group 2011-2012 2012-2013 2013-2014 2014-2015 Minority 46.2% 49% 54.6% 49% White 61.2% 62.6% 61.4% 56.6% Benchmark Met No No No No
KPI Score and Rationale
Score = 1. Although the achievement gap is still greater than 5%, we have seen a decrease in this gap over the past 4 years. The 2014-15 rate was 7.6% lower for minorities; a marked improvement over previous years.
Data Source: SBCTC Data Warehouse Student Achievement Database, PEP Cohorts. - Minority = Asian/African-American/Hispanic/Native American.
55%
60%
65%
70%
75%
80%
2011-2012 2012-2013 2013-2014 2014-2015
1st to 2nd Quarter Retention Rates
All Students Minority Students White Students
10 | P a g e

Operational Plan Year-End Monitoring Report 2015-16
______________________________________________________________________________________ **Data is not yet available for the winter and spring 2016 cohorts. As these cohorts tend to have lower retention rates, including preliminary data without this information would skew the data. This indicator will not be updated until the mid-year report in March 2017.
CORE THEME 1: STUDENT SUCCESS Objective 1.1: Attract and retain a student population reflective of the diverse community we serve. Key Performance Indicator #3: One-Year Persistence Rates (disaggregated by race/ethnicity).
Benchmark(s): 1) This indicator is benchmarked against previous academic years’ outcomes with an indicator of
achievement if rates are at least 2% higher than the previous year. RTC has exceptionally high persistence rates, making substantial increases over time difficult to attain.
2) The persistence rates for minority students will be equal to or within +/-5% of the retention rates for students identifying as White. A 5% difference is the minimum achievement gap that is considered acceptable and accounts for natural fluctuations over time.
Measure: One-Year Persistence Rate, Overall 2011-2012 2012-2013 2013-2014 2014-2015*
One-Year Persistence 70.1% 71.1% 69.2% 68.5%* Benchmark Met No No No No*
KPI Score and Rationale
Score = 1. Persistence decreased again in 2014-15, although the decrease was only 0.7%. The persistence rate for the spring cohort is almost 20% lower than that for the fall cohort.
40%
45%
50%
55%
60%
65%
2011-2012 2012-2013 2013-2014 2014-2015
1st to 3rd Quarter Retention Rates
All Students Minority Students White Students
11 | P a g e

Operational Plan Year-End Monitoring Report 2015-16
______________________________________________________________________________________ Measure: One-Year Persistence Rate, Disaggregated by Race/Ethnicity
Group 2011-2012 2012-2013 2013-2014 2014-2015* Minority 64.8% 69.7% 68.4% 67.2%* White 74.4% 73.2% 68.5% 68.7%* Benchmark Met No Yes Yes Yes*
KPI Score and Rationale
Score = 2. Although the achievement gap increased slightly from 0.1% to 1.5% in 2014-15, it is still smaller than in previous years and below the +/-5% threshold. African-American students have the lowest persistence rate of 54.4%, compared to 73.4% for the other ethnic minority groups.
Data Source: SBCTC Data Warehouse Student Achievement Database, PEP Cohorts. - Minority = Asian/African-American/Hispanic/Native American
*Preliminary data, final completion data will be released around November 2016.
CORE THEME 1: STUDENT SUCCESS Objective 1.2: Achieve equitable success rates of all students. Key Performance Indicator #4: Course Success Rates.
Benchmark(s): 1) This indicator is benchmarked against previous academic years’ outcomes with an indicator of
achievement when rates are 80% or higher. 2) The course success rates for minority students will be equal to or within +/-5% of the course success
rates for students identifying as White. A 5% difference is the minimum achievement gap that is considered acceptable and accounts for natural fluctuations over time.
Measure: Course Success Rates (Pass or 2.0 or higher) 2012-2013 2013-2014 2014-2015 2015-2016*
Course Success Rate 86.2% 85.2% 85.0% 85.3%*
Benchmark Met Yes Yes Yes Yes* KPI Score and Rationale
Score = 2. For the 4-year period represented here, course pass rates have consistently been above 80%.
*Preliminary data, final transcript data will be released around November 2016.
60%
65%
70%
75%
80%
2011-2012 2012-2013 2013-2014 2014-2015*
One-Year Persistence Rates
All Students Minority Students White Students
12 | P a g e

Operational Plan Year-End Monitoring Report 2015-16
______________________________________________________________________________________ Measure: Course Success Rates (Pass or 2.0 or higher), Disaggregated by Race/Ethnicity
Group 2012-2013 2013-2014 2014-2015 2015-2016* Minority 83.1% 82.7% 83.8% 83.3%* White 87.7% 86.5% 86.6% 87.9%* Benchmark Met Yes Yes Yes Yes*
KPI Score and Rationale
Score = 2. From 2011-12 to 2014-15, we narrowed the achievement gap to 2.8%. Although the gap widened slightly in 2015-16, the gap was still below the threshold of +/- 5%.
Data Source: SBCTC Data Warehouse Transcript Database as of March 2016. - Minority = Asian/African-American/Hispanic/Native American
*Preliminary data, final transcript data will be released around November, 2016. CORE THEME 1: STUDENT SUCCESS Objective 1.3: Provide effective support services from enrollment to completion. Key Performance Indicator #5: Student Satisfaction with Programs and Services. Benchmark: CCSSE and SENSE results are benchmarked against data from previous years, with an indicator of achievement if benchmark scores have increased.
Measure: CCSSE Scores, 2012 vs. 2015 Benchmark 2012 Scores 2015 Scores Active & Collaborative Learning 45 45.2
Student Effort 50.1 51.2
Academic Challenge 62.9 64.3 Student-Faculty Interaction 44.7 46.3
Support for Learners 46.6 47.5
Benchmark Met -- Yes
80%
82%
84%
86%
88%
90%
2012-2013 2013-2014 2014-2015 2015-2016*
Course Success Rates
All Students Minority Students White Students
13 | P a g e

Operational Plan Year-End Monitoring Report 2015-16
______________________________________________________________________________________
KPI Score and Rationale Score = 1. Although all benchmark scores showed an increase in 2015, most of these increases were very small, ranging from 0.2 to 1.6.
Measure: CCSSE Benchmark Scores, RTC 2012 vs. 2015
Note: The CCSSE is only conducted once every three years. The next administration will be in spring 2018. Measure: SENSE Scores, 2012 vs. 2015
Benchmark 2012 Scores 2015 Scores Early Connections 55.8 62.5 High Expectations and Aspirations 88.6 84.2
Clear Academic Plan & Pathway 55.8 67.3
Effective Track to College Readiness 68.4 74.5
Engaged Learning 38.7 34.3 Academic & Social Support Network 82.8 81.8
Benchmark Met -- Yes
KPI Score and Rationale Score = 2. Although not all benchmark scores showed an increase in 2015, the benchmarks that were targeted the most by our Title III efforts showed substantial increases, ranging from 6.1-11.5.
4550.1
62.9
44.7 46.645.251.2
64.3
46.3 47.5
0
10
20
30
40
50
60
70
Active &Collaborative
Learning
Student Effort AcademicChallenge
Student-FacultyInteraction
Support forLearners
2012 2015
14 | P a g e

Operational Plan Year-End Monitoring Report 2015-16
______________________________________________________________________________________ Measure: SENSE Benchmark Scores, RTC 2012 vs. 2015
Note: The College will not be administering the SENSE in the future, but rather will conduct its own version of this type of survey. CORE THEME 1: STUDENT SUCCESS Objective 1.4: Identify and communicate learning outcomes to students, and use the assessment of student learning outcomes to enhance teaching, learning, and continuous improvement. Key Performance Indicator #6: Student Learning Outcomes Assessment.
Benchmark(s): This indicator is benchmarked against previous academic years’ results. 1) Course, program, and college outcomes are developed and aligned. 2) The program review process is implemented in all programs according to the published cycle.
Measure: Alignment of Course, Program, and College Outcomes
55.8
88.6
55.8
68.4
38.7
82.8
62.5
84.2
67.374.5
34.3
81.8
0
10
20
30
40
50
60
70
80
90
100
EarlyConnections
HighExpectations &
Aspirations
Clear AcademicPlan &
Pathway
Effective Trackto CollegeReadiness
EngagedLearning
Academic &Social Support
Network
2012 2015
2014-2015 2015-2016 Outcomes Developed and Aligned?
No No
Benchmark Met No No
KPI Score and Rationale
Score = 1. All program outcomes have been developed and aligned to college outcomes; however, not all course outcomes have been developed. Additionally, learning outcomes are not yet being used systematically to enhance teaching and learning or to inform continuous improvement. A committee has been formed to create a systematic assessment plan for the College to initiative this process.
15 | P a g e

Operational Plan Year-End Monitoring Report 2015-16
______________________________________________________________________________________ Measure: Program Review Implemented in All Programs
2014-2015 2015-2016 Program Review Implemented? No No
Benchmark Met No No
KPI Score and Rationale
Score = 1. Five programs have started the pilot for program review and have completed Steps 1-5 of Year One at this time. A timeline has been created for all additional programs, with every program starting Year One by the spring quarter of 2017.
CORE THEME 1: RECOMMENDATIONS 1) The measures for KPI #6, “Student Learning Outcomes Assessment,” are no longer meaningful. The
measures should more accurately reflect the College’s future goals for program review and assessment. The following measures should replace the current measures for this KPI: a. All course and program learning outcomes are published on the applicable program page on the
website, as well as in the syllabi. b. Curriculum mapping has been completed to ensure course learning outcomes align with the
program learning outcomes and provide opportunities for learning from introduction to mastery. c. The College has developed a systematic assessment plan and timeline for using assessment data
to drive changes in the classroom. d. All programs have followed the program review cycle according to the published timeline.
16 | P a g e

Operational Plan Year-End Monitoring Report 2015-16
______________________________________________________________________________________
CORE THEME 2: WORKFORCE EDUCATION Renton Technical College delivers workforce education programs that fulfill student and industry needs through preparation for viable career pathways. Industry needs are met through competency and outcomes based teaching, learning, and hands-on training facilities that reflect workplace best practices. Students become resilient workers by completing innovative educational programs that incorporate current industry trends. Key Performance Indicators #7: Completion Rates #8: Licensure and Certification Pass Rates #9: Advisory Committee Satisfaction with Programs #10: Placement Rates #11: Course and Program Learning Formats
17 | P a g e

Operational Plan Year-End Monitoring Report 2015-16
______________________________________________________________________________________
CORE THEME 2: WORKFORCE EDUCATION Objective 2.1: Achieve high rates of student progress and degree or certificate completion. Key Performance Indicator #7: Completion Rates.
Benchmark(s): 1) This indicator is benchmarked against previous academic years’ outcomes with an indicator of
achievement if rates are at least 2% higher than the previous year. RTC has exceptionally high completion rates, making substantial increases over time difficult to attain.
2) The completion rates for minority students will be equal to or within +/-5% of the completion rates for students identifying as White. A 5% difference is the minimum achievement gap that is considered acceptable and accounts for natural fluctuations over time.
Measure: 3-Year Completion Rates 2013-2014 2014-2015 2015-2016*
Cert Degree Total Cert Degree Total Cert Degree Total Completion Rate 54.1% 11.3% 65.4% 50.0% 16.4% 66.4% 49.6%* 13.8%* 63.3%*
Benchmark Met Yes No No No Yes No No* No* No*
KPI Score and Rationale
Score = 1. Completion rates for the 2012-13 cohorts decreased overall by 3%. The certificate completion rate only decreased by 0.4%, while the degree completion rate decreased by 2.6%. In prior years, degree completion showed an upward trend; however, the 2011-12 cohort completion rate could have been an outlier and the decrease for the 2012-13 cohorts a natural fluctuation back towards the mean.
Data Source: SBCTC Data Warehouse Student Achievement Database, PEP Cohorts, and Completion Tables. Completion rates are checked within three years of entry for each cohort. Therefore, the 2014-15 data reflects completion rates for the 2011-12 cohorts.
*Preliminary data, final completion data will be released around November 2016.
0%
10%
20%
30%
40%
50%
60%
70%
2013-2014 2014-2015 2015-2016*
3-Year Completion Rates
Certificates Degrees Total
18 | P a g e
Operational Plan Year-End Monitoring Report 2015-16
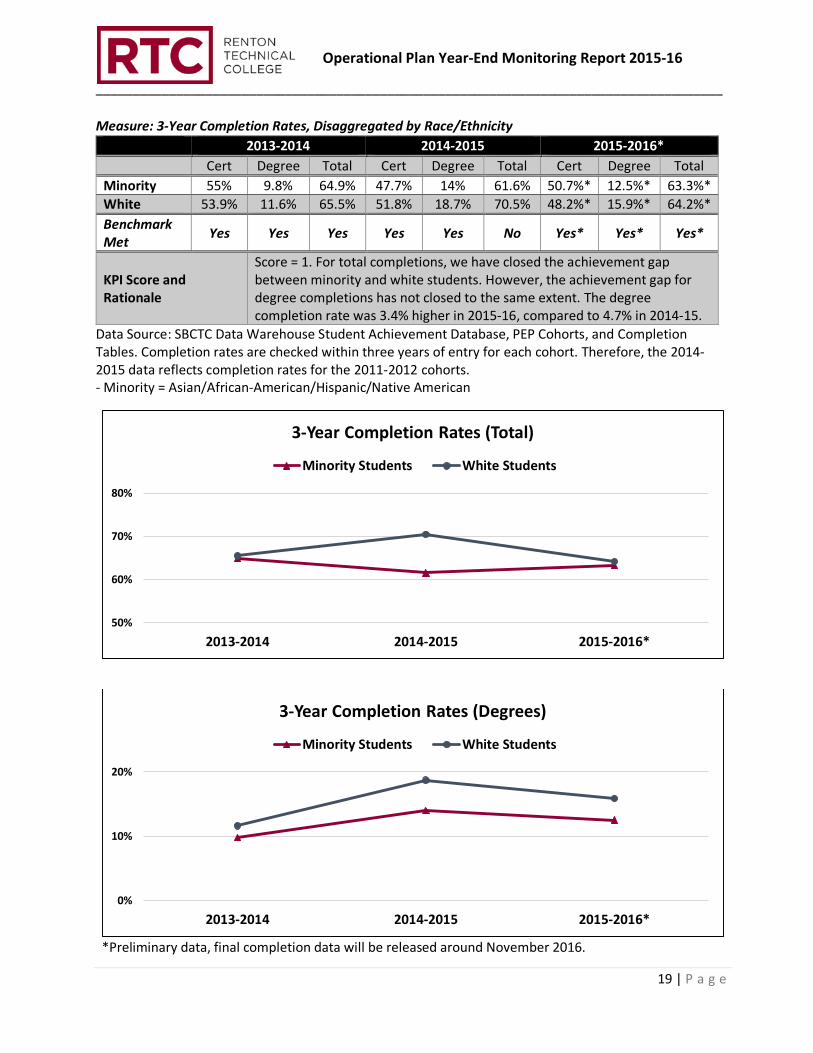
______________________________________________________________________________________ Measure: 3-Year Completion Rates, Disaggregated by Race/Ethnicity
2013-2014 2014-2015 2015-2016* Cert Degree Total Cert Degree Total Cert Degree Total Minority 55% 9.8% 64.9% 47.7% 14% 61.6% 50.7%* 12.5%* 63.3%* White 53.9% 11.6% 65.5% 51.8% 18.7% 70.5% 48.2%* 15.9%* 64.2%* Benchmark Met Yes Yes Yes Yes Yes No Yes* Yes* Yes*
KPI Score and Rationale
Score = 1. For total completions, we have closed the achievement gap between minority and white students. However, the achievement gap for degree completions has not closed to the same extent. The degree completion rate was 3.4% higher in 2015-16, compared to 4.7% in 2014-15.
Data Source: SBCTC Data Warehouse Student Achievement Database, PEP Cohorts, and Completion Tables. Completion rates are checked within three years of entry for each cohort. Therefore, the 2014-2015 data reflects completion rates for the 2011-2012 cohorts. - Minority = Asian/African-American/Hispanic/Native American
*Preliminary data, final completion data will be released around November 2016.
50%
60%
70%
80%
2013-2014 2014-2015 2015-2016*
3-Year Completion Rates (Total)
Minority Students White Students
0%
10%
20%
2013-2014 2014-2015 2015-2016*
3-Year Completion Rates (Degrees)
Minority Students White Students
19 | P a g e
Operational Plan Year-End Monitoring Report 2015-16
______________________________________________________________________________________ CORE THEME 2: WORKFORCE EDUCATION Objective 2.2: Deliver workforce programs that meet current industry demand and standards. Key Performance Indicator #8: Licensure and Certification Pass Rates. Key Performance Indicator #9: Advisory Committee Satisfaction with Programs.
Benchmark(s): 1) This indicator is benchmarked against previous academic years’ outcomes with an indicator of
achievement when average pass rates are 75% or higher. 2) This indicator is benchmarked against previous academic years’ outcomes with an indicator of
achievement if rates are equal to or higher than the previous year.
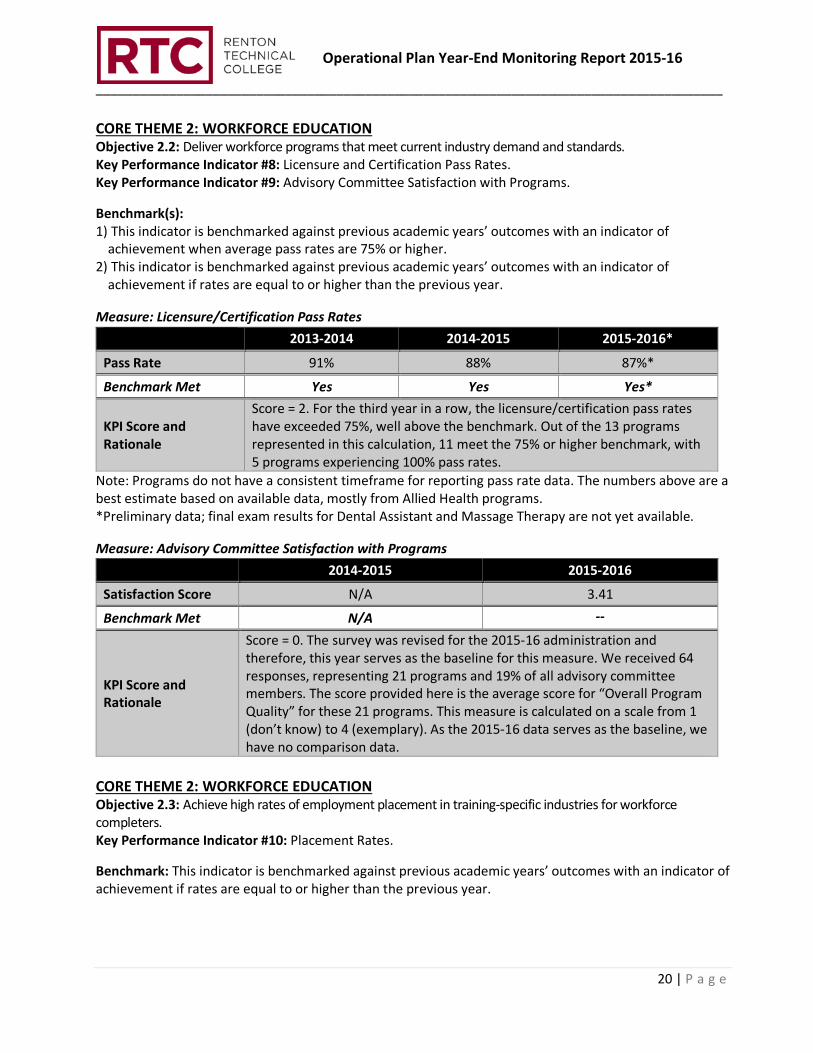
Measure: Licensure/Certification Pass Rates 2013-2014 2014-2015 2015-2016*
Pass Rate 91% 88% 87%*
Benchmark Met Yes Yes Yes*
KPI Score and Rationale
Score = 2. For the third year in a row, the licensure/certification pass rates have exceeded 75%, well above the benchmark. Out of the 13 programs represented in this calculation, 11 meet the 75% or higher benchmark, with 5 programs experiencing 100% pass rates.
Note: Programs do not have a consistent timeframe for reporting pass rate data. The numbers above are a best estimate based on available data, mostly from Allied Health programs. *Preliminary data; final exam results for Dental Assistant and Massage Therapy are not yet available.
Measure: Advisory Committee Satisfaction with Programs 2014-2015 2015-2016
Satisfaction Score N/A 3.41
Benchmark Met N/A --
KPI Score and Rationale
Score = 0. The survey was revised for the 2015-16 administration and therefore, this year serves as the baseline for this measure. We received 64 responses, representing 21 programs and 19% of all advisory committee members. The score provided here is the average score for “Overall Program Quality” for these 21 programs. This measure is calculated on a scale from 1 (don’t know) to 4 (exemplary). As the 2015-16 data serves as the baseline, we have no comparison data.
CORE THEME 2: WORKFORCE EDUCATION Objective 2.3: Achieve high rates of employment placement in training-specific industries for workforce completers. Key Performance Indicator #10: Placement Rates. Benchmark: This indicator is benchmarked against previous academic years’ outcomes with an indicator of achievement if rates are equal to or higher than the previous year.
20 | P a g e

Operational Plan Year-End Monitoring Report 2015-16
______________________________________________________________________________________ Measure: Estimated Placement Rates
2010-2011 2011-2012 2012-2013 2013-2014
Cert Degree Cert Degree Cert Degree Cert Degree Placement Rate 73% 79% 77% 77% 76% 83% 82% 89%
Benchmark Met -- -- Yes No No Yes Yes Yes
KPI Score and Rationale
Score = 2. Placement rates have increased over the 4-year period represented here. Students who received a degree in 2013-14 had placement rates 6% higher than students who received degrees in 2012-13, with an equivalent increase for certificate earners.
Data Source: SBCTC Data Warehouse, Data Linking for Outcomes Assessment database. Estimated placement rates include an adjustment factor of 1.1 to account for students who are employed, but are not in the Unemployment Insurance (UI) database. Placement rates are not yet available for the 2014-15 year and will be provided in the 2016-17 Mid-Year Monitoring Report.
CORE THEME 2: WORKFORCE EDUCATION Objective 2.4: Deliver instruction in a variety of suitable formats that expand opportunities for learning. Key Performance Indicator #11: Course and Program Learning Formats.
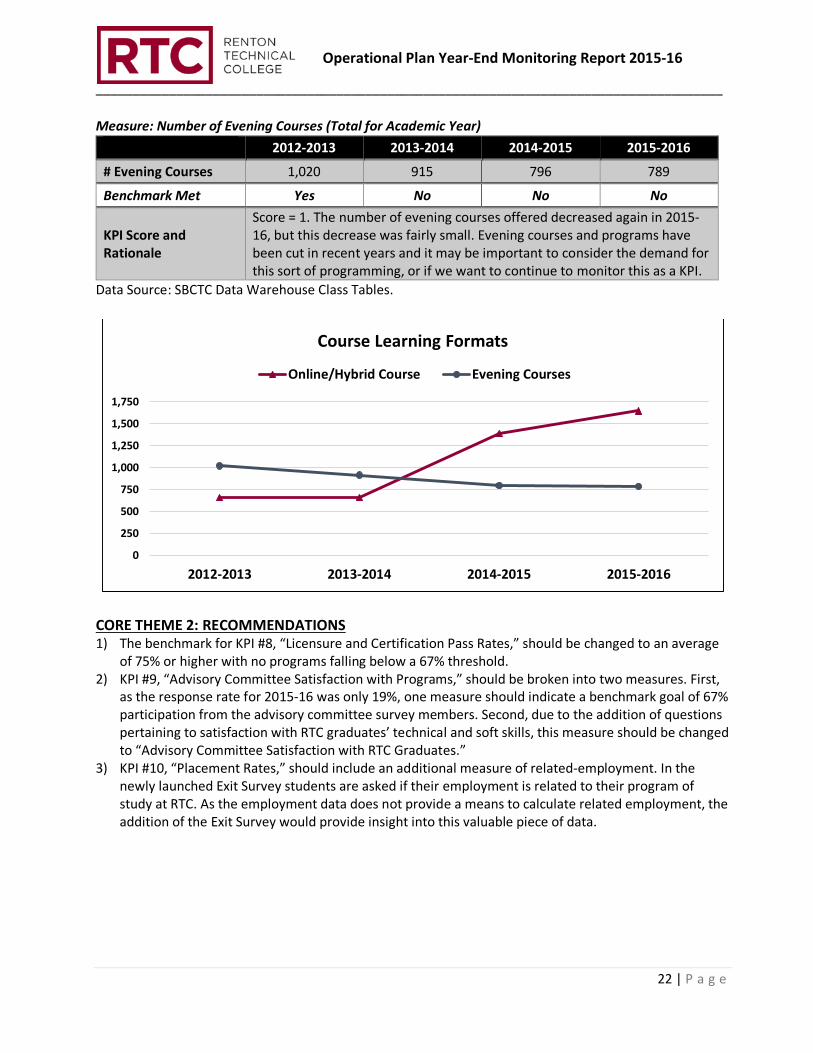
Benchmark: This indicator is benchmarked against previous academic years’ offerings with an indicator of achievement if RTC maintains or increases the number of evening and/or online/hybrid course offerings. Measure: Number of Hybrid/Online (Distance Education) Courses (Total for Academic Year)
2012-2013 2013-2014 2014-2015 2015-2016 # Hybrid/Online Courses 656 660 1,388 1,645
Benchmark Met Yes Yes Yes Yes
KPI Score and Rationale
Score = 2. The number of distance education courses offered in 2015-16 increased by almost 19% from the prior year, and has increased by 151% since 2012-13.
70%
75%
80%
85%
90%
2010-2011 2011-2012 2012-2013 2013-2014
Placement Rates
Certificates Degrees
21 | P a g e
Operational Plan Year-End Monitoring Report 2015-16
______________________________________________________________________________________ Measure: Number of Evening Courses (Total for Academic Year)
2012-2013 2013-2014 2014-2015 2015-2016
# Evening Courses 1,020 915 796 789
Benchmark Met Yes No No No
KPI Score and Rationale
Score = 1. The number of evening courses offered decreased again in 2015-16, but this decrease was fairly small. Evening courses and programs have been cut in recent years and it may be important to consider the demand for this sort of programming, or if we want to continue to monitor this as a KPI.
Data Source: SBCTC Data Warehouse Class Tables.
CORE THEME 2: RECOMMENDATIONS 1) The benchmark for KPI #8, “Licensure and Certification Pass Rates,” should be changed to an average
of 75% or higher with no programs falling below a 67% threshold. 2) KPI #9, “Advisory Committee Satisfaction with Programs,” should be broken into two measures. First,
as the response rate for 2015-16 was only 19%, one measure should indicate a benchmark goal of 67% participation from the advisory committee survey members. Second, due to the addition of questions pertaining to satisfaction with RTC graduates’ technical and soft skills, this measure should be changed to “Advisory Committee Satisfaction with RTC Graduates.”
3) KPI #10, “Placement Rates,” should include an additional measure of related-employment. In the newly launched Exit Survey students are asked if their employment is related to their program of study at RTC. As the employment data does not provide a means to calculate related employment, the addition of the Exit Survey would provide insight into this valuable piece of data.
0
250
500
750
1,000
1,250
1,500
1,750
2012-2013 2013-2014 2014-2015 2015-2016
Course Learning Formats
Online/Hybrid Course Evening Courses
22 | P a g e

Operational Plan Year-End Monitoring Report 2015-16
______________________________________________________________________________________
CORE THEME 3: BASIC SKILLS EDUCATION Renton Technical College offers basic skills courses that support the transition of students to college level study and career pathways. Student progression is supported through ESL instruction, high-school completion options, college-readiness instruction, and integration of basic skills instruction into workforce programs. Key Performance Indicators #12: Gains Made #13: Retention Rates – Basic Studies #14: Transition Rates
23 | P a g e

Operational Plan Year-End Monitoring Report 2015-16
______________________________________________________________________________________ CORE THEME 3: BASIC SKILLS EDUCATION Objective 3.1: Achieve significant student progression toward achieving educational goals. Key Performance Indicator #12: Gains Made.
Benchmark: This indicator is benchmarked against previous academic years’ outcomes with an indicator of achievement if rates are equal to or higher than the previous year.
Measure: Gains Made (Basic Studies Students) 2012-2013 2013-2014 2014-2015 2015-2016
% with Significant Gains 48% 44.8% 46.4% 43.9%
Benchmark Met No No Yes No
KPI Score and Rationale
Score = 0. The percentage of federally reportable students who received a 3 or 5 point gain on their CASAS test decreased by 2.5% in 2015-16. This is the lowest significant gains rate in the last four years. However, if we add students who completed a GED, the rates would increase to 49.6%, 47.1%, 47.4%, and 48.2% for the four years reported here and the KPI score would be a 1.
Data Source: SBCTC Data Warehouse, WABERS database. Significant gain = 3 or 5 point gain on the CASAS test.
0%
10%
20%
30%
40%
50%
60%
70%
80%
2012-2013 2013-2014 2014-2015 2015-2016
Significant Gains Made (CASAS Test)
24 | P a g e
Operational Plan Year-End Monitoring Report 2015-16
______________________________________________________________________________________ CORE THEME 3: BASIC SKILLS EDUCATION Objective 3.2: Achieve significant student progression toward achieving career goals. Key Performance Indicator #13: Retention Rates – Basic Studies.
Benchmark: This indicator is benchmarked against previous academic years’ outcomes with an indicator of achievement if rates are equal to or higher than the previous year.
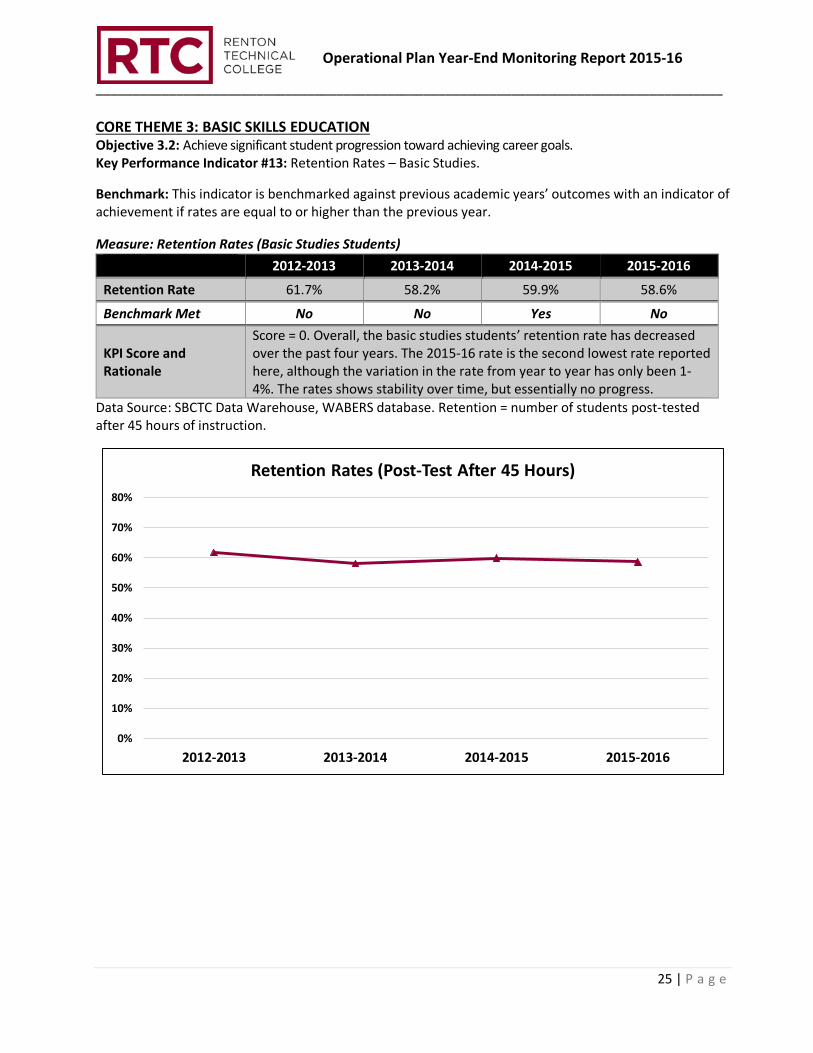
Measure: Retention Rates (Basic Studies Students) 2012-2013 2013-2014 2014-2015 2015-2016
Retention Rate 61.7% 58.2% 59.9% 58.6%
Benchmark Met No No Yes No
KPI Score and Rationale
Score = 0. Overall, the basic studies students’ retention rate has decreased over the past four years. The 2015-16 rate is the second lowest rate reported here, although the variation in the rate from year to year has only been 1-4%. The rates shows stability over time, but essentially no progress.
Data Source: SBCTC Data Warehouse, WABERS database. Retention = number of students post-tested after 45 hours of instruction.
0%
10%
20%
30%
40%
50%
60%
70%
80%
2012-2013 2013-2014 2014-2015 2015-2016
Retention Rates (Post-Test After 45 Hours)
25 | P a g e

Operational Plan Year-End Monitoring Report 2015-16
______________________________________________________________________________________ CORE THEME 3: BASIC SKILLS EDUCATION Objective 3.3: Transition students into college classes and programs. Key Performance Indicator #14: Transition Rates.
Benchmark: This indicator is benchmarked against previous academic years’ outcomes with an indicator of achievement if rates are equal to or higher than the previous year.
Measure: Transition Rates (Basic Studies Students) 2012-2013 2013-2014 2014-2015 2015-2016*
Transition Rate 13.7% 12.5% 12.3% 13.6%*
Benchmark Met Yes No No Yes*
KPI Score and Rationale
Score = 1. In 2015-16, the transition rate increased by 1.3%, which is on par with the 2012-13 rate. Although this does represent an increase, we did not meet our goal of increasing the rate by 5% each year. However, as this rate is only preliminary, it is likely that we will see a small increase when the final database is released. We do not have statewide data for 2015-16 yet, but our transition rates in 2013-14 and 2014-15 were lower than the state average.
Data Source: SBCTC Student Achievement Database.
*Preliminary data, the final completion data and Student Achievement Initiative (SAI) database will be released around November 2016.
0%
5%
10%
15%
20%
25%
2011-2012 2012-2013 2013-2014 2014-2015
Transition Rates
26 | P a g e

Operational Plan Year-End Monitoring Report 2015-16
______________________________________________________________________________________ CORE THEME 3: RECOMMENDATIONS 1) The current KPIs in the Basic Skills Education Core Theme may not be the most informative or valid
measures of student success for Basis Studies students. Changes should be made as follows: a) Remove KPI #12, “Gains Made.” b) Remove KPI #13, “Retention Rates – Basic Studies.” c) Add a new KPI that calculates the percentage of Basic Studies students who take any course
outside of Basic Studies, in addition to their course success rates in these courses. d) Add a new KPI that calculates the percentage of students who enroll in a career training program,
in addition to their subsequent completion rates in these programs. 2) These new KPIs, in addition to the current Transition Rate indicator should also be disaggregated by
race/ethnicity to examine achievement gaps in these measures.
27 | P a g e

Operational Plan Year-End Monitoring Report 2015-16
______________________________________________________________________________________
CORE THEME 4: INSTITUTIONAL SUSTAINABILITY Renton Technical College cultivates, manages and prioritizes its financial, human, and physical resources to advance the mission of the college. An optimal learning environment is created through a diverse and innovative faculty and staff, deployment of technologies that enhance teaching and student engagement, and financial planning that supports the college’s strategic priorities. Key Performance Indicators #15: Employee Demographics #16: Budget to Actual Variance #17: Technology Replacement Cycle/Enhance Technology Services #18: FTE Enrollment #19: Donations and Partnerships #20: Grants and Contracts Funding
28 | P a g e

Operational Plan Year-End Monitoring Report 2015-16
______________________________________________________________________________________ CORE THEME 4: INSTITUTIONAL SUSTAINABILITY Objective 4.1: Attract a diverse faculty and staff suited to prepare a diverse population for work. Key Performance Indicator #15: Employee Demographics.
Benchmark: This measure is benchmarked against ethnic diversity of the local population. Achievement of this indicator is earned if RTC’s faculty and staff are within 5% (+/-) of the local population. This margin is considered to be an acceptable gap, while also controlling for population variances over time.
Measure: Race/Ethnicity Breakdown for Faculty/Staff and Local Area 2012-2013* 2013-2014* 2014-2015* 2015-2016+
Minority RTC 23% 25% 27% 27%
Local Area 35% 35% 35% 38%
White RTC 77% 75% 73% 73%
Local Area 65% 65% 65% 62%
Benchmark Met -- No No No No
KPI Score and Rationale
Score = 1. In all four years represented here, RTC employed significantly more white employees and significantly fewer minority employees, compared to the race/ethnicity breakdown for the local King County area. However, over time, the percentage of minority employees has increased by 4%. It is important to note here that the ethnicity variable defaults to white for employees who do not disclose.
Data Source: *2010 Census Data for King County and the SBCTC Employee Database. +2015 Census Data for King County and the SBCTC Employee Database. - Minority = Asian/African-American/Hispanic/Native American/Multi-Racial
15%
20%
25%
30%
35%
40%
2012-2013 2013-2014 2014-2015 2015-2016
Percent of Minority RTC Employees vs. King County
RTC King County
29 | P a g e

Operational Plan Year-End Monitoring Report 2015-16
______________________________________________________________________________________ CORE THEME 4: INSTITUTIONAL SUSTAINABILITY Objective 4.2: Manage and prioritize financial, technological, and physical resources to advance the mission of the college. Key Performance Indicator #16: Budget-to-Actual Variance. Key Performance Indicator #17: Technology Replacement Cycle/Enhance Technology Services
Benchmark(s): 1) This measure is benchmarked against the budget to actual variance for revenue and expenditures, with
an indicator of achievement if the variance is within 5% (+/-) of the budget. This margin is considered to be acceptable from an auditing perspective, with any variance greater than 10% (+/-) needing additional explanation.
2) This measure is benchmarked against the College internal replacement cycle, with an indicator of achievement if 75% of the replacement cycle schedule is completed.
Measure: Budget to Actual Variance 2012-2013 2013-2014 2014-2015 2015-2016
Revenue -2.0% -8.0% -3.0% -2.7% Expenditures -0.7% -4.5% 1.1% 5.1% Benchmark Met Yes No Yes Yes
KPI Score and Rationale
Score = 2. In 2015-16, the revenue and expenditure budget to actual variance was within the acceptable +/- 5% margin, when rounded to the nearest percent.
Measure: Technology Replacement Cycle 2013-2014 2014-2015 2015-2016
Replacements Planned vs. Actual 90.6% 77.8% 62.1%
Benchmark Met Yes Yes No KPI Score and Rationale
Score = 1. For 2015-16, the amount of funds available for computer replacements was significantly lower than prior years, due to a decrease in
-10%
-5%
0%
5%
10%
2012-2013 2013-2014 2014-2015 2015-2016
Budget to Actual Variance
Revenue Expenditures
30 | P a g e

Operational Plan Year-End Monitoring Report 2015-16
______________________________________________________________________________________ tuition funding. In order to avoid affecting our reserves, we only purchased enough computers to stay within this budgeted amount.
CORE THEME 4: INSTITUTIONAL SUSTAINABILITY Objective 4.3: Align enrollment with FTE projections and state allocations. Key Performance Indicator #18: FTE Enrollment
Benchmark: The actual FTE is benchmarked against the system allocation. Achievement of this measure is earned when the percent difference falls between the tolerance thresholds of 98-105%.
Measure: FTE Allocation vs. FTE Actuals 2012-2013 2013-2014 2014-2015 2015-2016
% of Allocation 94% 97% 99% 101%
Benchmark Met No No Yes Yes
KPI Score and Rationale
Score = 2. For the second year in a row, RTC has met its threshold tolerance of 98-105% of our FTE allocation.
Data Source: SBCTC Allocation Monitoring Reports.
CORE THEME 4: INSTITUTIONAL SUSTAINABILITY Objective 4.4: Increase community partnerships to improve RTC’s effectiveness and positive impact in the region. Key Performance Indicator #19: Donations and Partnerships Benchmark: This indicator is benchmarked against previous academic years’ results with an indicator of achievement if values are equal to or higher than the previous year.
Measure: Number and Dollar Value of Donor Gifts 2012-2013 2013-2014 2014-2015 2015-2016
Number of Gifts 1,635 1,841 1,795 1,843
80%
100%
80%
85%
90%
95%
100%
105%
2012-2013 2013-2014 2014-2015 2015-2016
FTE Allocation vs. FTE Actuals
31 | P a g e

Operational Plan Year-End Monitoring Report 2015-16
______________________________________________________________________________________ Dollar Value $146,187.58 $213,212.08 $149,047.37 $360,979.93
Benchmark Met No Yes No Yes
KPI Score and Rationale
Score = 2. The number and dollar value of donor gifts increased by 3% and 142%, respectively. The majority of the dollar value increase was due to a large anonymous gift of $103,771. However, even if we adjust for that gift, we still raised $257,208.93, which is a 21% increase from 2013-14.
CORE THEME 4: INSTITUTIONAL SUSTAINABILITY Objective 4.5: Pursue strategic funding opportunities to ensure fiscal sustainability. Key Performance Indicator #20: Grants and Contracts Funding
Benchmark: This indicator is benchmarked against previous academic years’ results.
Measure: Number and Dollar Amount of Grants Funded 2013-2014 2014-2015 2015-2016
Number Funded 17 24 26
Dollar Value $3,202,928 $4,647,976 $4,502,781
Benchmark Met -- Yes Yes
KPI Score and Rationale
Score = 2. The number of awarded grants increased from 2014-15 to 2015-16, with only a slight decrease (-3%) in the award amount for 2015-16. The amount of indirect costs secured has increased substantially since 2013-14, from $40,270 to $172,490 in 2014-15, and $239,363 in 2015-16, respectively.
0
500
1000
1500
2000
2012-2013 2013-2014 2014-2015 2015-2016$0
$50,000
$100,000
$150,000
$200,000
$250,000
$300,000
$350,000
$400,000
Number and Dollar Value of Donor Gifts
Dollar Value # Gifts
32 | P a g e

Operational Plan Year-End Monitoring Report 2015-16
______________________________________________________________________________________
CORE THEME 4: RECOMMENDATIONS 1) For KPI #18, “FTE Enrollment,” an additional measure should be added to disaggregate FTE by area;
i.e., Career-Training, Basic Studies, Apprenticeships, and Supplemental courses. This would align with our work in the Strategic Enrollment Committee as enrollments in certain areas are already decreasing.
0
5
10
15
20
25
30
2013-2014 2014-2015 2015-2016$0
$500,000
$1,000,000
$1,500,000
$2,000,000
$2,500,000
$3,000,000
$3,500,000
$4,000,000
$4,500,000
$5,000,000
Number and Dollar Value of Grants Funded
Dollar Value # Grants
33 | P a g e

Operational Plan Year-End Monitoring Report 2015-16
______________________________________________________________________________________
CONCLUSION AND RECOMMENDATIONS Currently, a total of 20 KPIs are used to measure success towards mission fulfillment. KPIs receive a score of “2” (green), “1” (yellow) or “0” (red). A score of “2” indicates that the goal has been met and serves as a model or best practice, and should continue to be supported by the College. A score of “1” indicates that progress towards meeting the goal has occurred. A score of “0” indicates that no progress has been made toward the goal, and an action plan should be developed to move these indicators from a score of “0” to “1”. As outlined on pages 5-6, RTC’s total mission fulfillment score (out of 56 possible points) is 34, or 61%. Core Theme 4: Institutional Sustainability, received a score of ten out of 12, or 83%. Core Theme 2: Workforce Education, received a score of nine out of 14, or 64%. Core Theme 1: Student Success, received a score of 14 out of 24, or 58%. Core Theme 3: Basic Skills Education, received a score of one out of six, or 17%. The overall mission fulfillment score of 61% represents an increase of 2% over the previous 2015-16 Mid-Year Monitoring Report. However, the score for Core Theme 1: Student Success increased by 4%, the score for Core Theme 4: Institutional Sustainability increased by 8%, the score for Core Theme 3: Basic Skills Education decreased by 16%, and the score for Core Theme 2: Workforce Education stayed the same. Data sources used in this report include:
• SBCTC Data Warehouse, Student Achievement Database • SBCTC Data Warehouse, Transcript Database (as of August 2016) • SBCTC Data Warehouse, Data Linking for Outcomes Assessment Database • SBCTC Data Warehouse, Class Tables • SBCTC Data Warehouse, WABERS Database • SBCTC Allocation Monitoring Reports • RTC Program Enhancement Plan (PEP) cohorts
Outlined below are key recommendations proposed by the Institutional Research Office. These recommendations include changes to current KPIs as well as additional disaggregation of data. CORE THEME 1: STUDENT SUCCESS – Objective 1.4
1) The measures for KPI #6, “Student Learning Outcomes Assessment,” are no longer meaningful. The measures should more accurately reflect the College’s future goals for program review and assessment. The following measures should replace the current measures for this KPI: a. All course and program learning outcomes are published on the applicable programs pages on
the website, as well as in the syllabi. b. Curriculum mapping has been completed to ensure course learning outcomes align with the
program learning outcomes and provide opportunities for learning from introduction to mastery.
c. The College has developed a systematic assessment plan and timeline for using assessment data to drive changes in the classroom.
d. All programs have followed the program review cycle according to the published timeline.
34 | P a g e
Operational Plan Year-End Monitoring Report 2015-16
______________________________________________________________________________________ CORE THEME 2: WORKFORCE EDUCATION – Objectives 2.2 and 2.3
1) The benchmark for KPI #8, “Licensure and Certification Pass Rates,” should be changed to an average of 75% or higher with no programs falling below a 67% threshold.
2) KPI #9, “Advisory Committee Satisfaction with Programs,” should be broken into two measures. First, as the response rate for 2015-16 was only 19%, one measure should indicate a benchmark goal of 50% participation from the advisory committee survey members. Second, due to the addition of questions pertaining to satisfaction with RTC graduates’ technical and soft skills, this measure should be changed to “Advisory Committee Satisfaction with RTC Graduates” and include an average score for technical and soft skills.
3) KPI #10, “Placement Rates,” should include an additional measure of related-employment. In the newly launched Exit Survey students are asked if their employment is related to their program of study at RTC. As the employment data does not provide a means to calculate related employment, the addition of the Exit Survey would provide insight into this valuable piece of data.
CORE THEME 3: BASIC SKILLS EDUCATION – Objectives 3.1, 3.2 and 3.3
1) The current KPIs in this core theme may not be the most informative or valid measures of student success for basic studies students. Changes should be made as follows: a) Remove KPI #12, “Gains Made.” b) Remove KPI #13, “Retention Rates – Basic Studies.” c) Add a new KPI that calculates the percentage of basic studies students who take any course
outside of Basic Studies, in addition to their course success rates in these courses. d) Add a new KPI that calculates the percentage of students who enroll in a career training
program, in addition to their subsequent completion rates in these programs. 2) These new KPIS, in addition to the current transition rate indicator should also be disaggregated
by race/ethnicity to examine achievement gaps in these measures. CORE THEME 4: INSTITUTIONAL SUSTAINABILITY – Objective 4.3
1) For KPI #18, “FTE Enrollment,” an additional measure should be added to disaggregate FTE by area; i.e., Career-Training, Basic Studies, Apprenticeships, and Supplemental courses. This would align with our work in the Strategic Enrollment Management Committee, as enrollments in certain areas are already decreasing.
35 | P a g e