moving cooler study findings policy gap
TRANSCRIPT
Title
Moving Cooler
Study Findings
Policy Gap:
America’s Clean Energy and Security Act
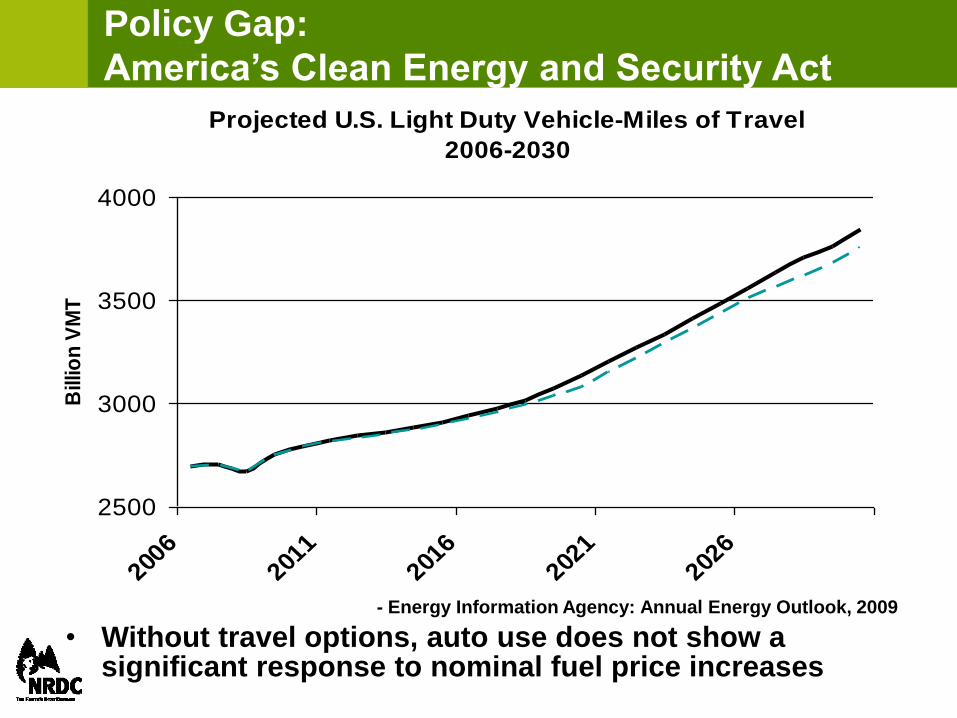
Projected U.S. Light Duty Vehicle-Miles of Travel
2006-2030
2500
3000
3500
4000
2006
2011
2016
2021
2026
Bill
ion
VM
T
- Energy Information Agency: Annual Energy Outlook, 2009
• Without travel options, auto use does not show a significant response to nominal fuel price increases
Policy Gap:
America’s Clean Energy and Security Act
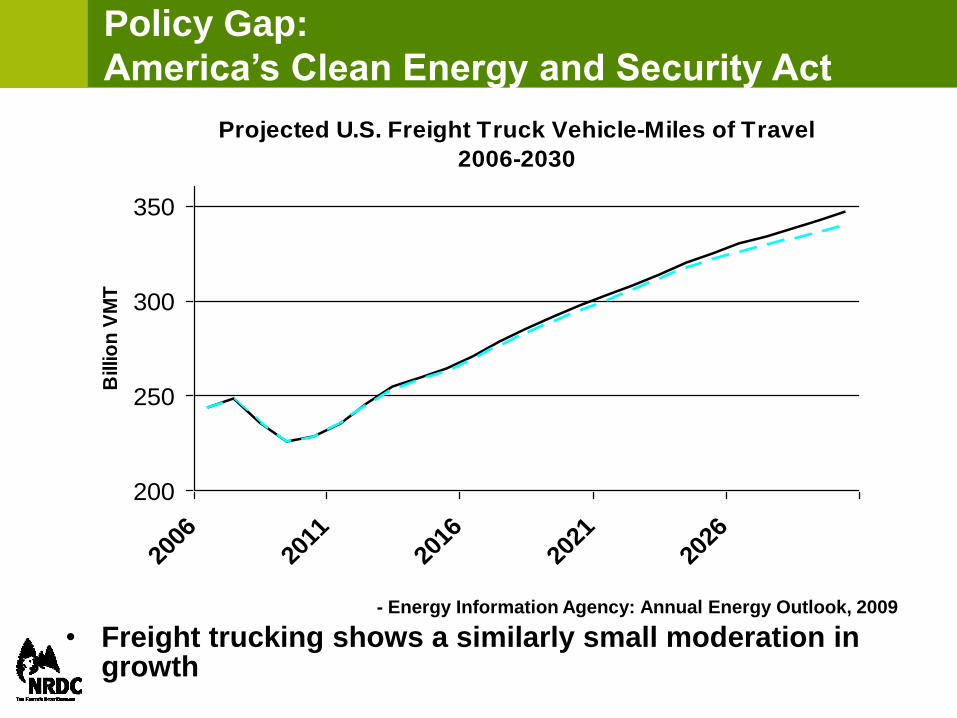
- Energy Information Agency: Annual Energy Outlook, 2009
• Freight trucking shows a similarly small moderation in growth
Projected U.S. Freight Truck Vehicle-Miles of Travel
2006-2030
200
250
300
350
2006
2011
2016
2021
2026
Billio
n V
MT
Knowledge Gap:
Surface Transportation and Climate Policy
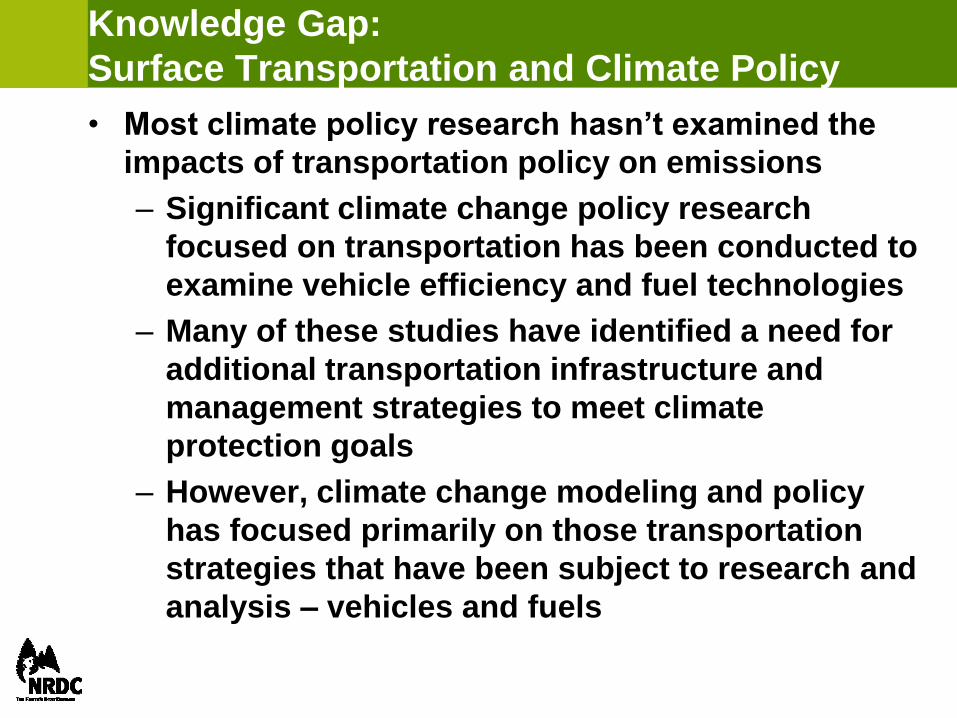
• Most climate policy research hasn’t examined the
impacts of transportation policy on emissions
– Significant climate change policy research
focused on transportation has been conducted to
examine vehicle efficiency and fuel technologies
– Many of these studies have identified a need for
additional transportation infrastructure and
management strategies to meet climate
protection goals
– However, climate change modeling and policy
has focused primarily on those transportation
strategies that have been subject to research and
analysis – vehicles and fuels
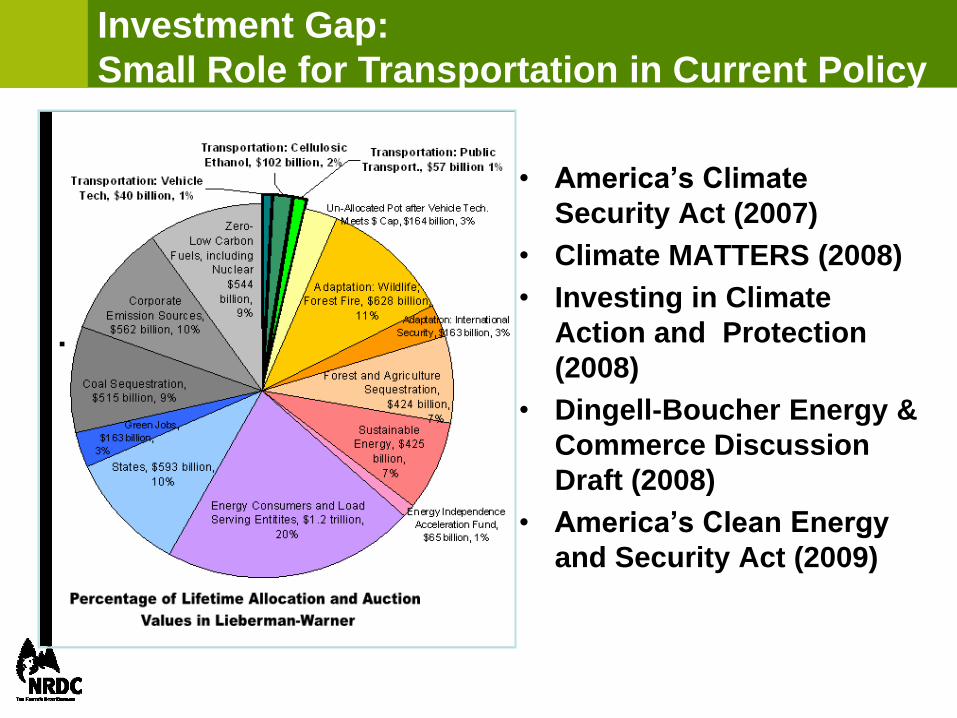
Policy Gap:
Small Role for Transportation in Current Policy• America’s Climate
Security Act (2007)
• Climate MATTERS (2008)
• Investing in Climate
Action and Protection
(2008)
• Dingell-Boucher Energy &
Commerce Discussion
Draft (2008)
• America’s Clean Energy
and Security Act (2009)
Investment Gap:
Small Role for Transportation in Current Policy
Helping to Fill the Gap: Moving Cooler
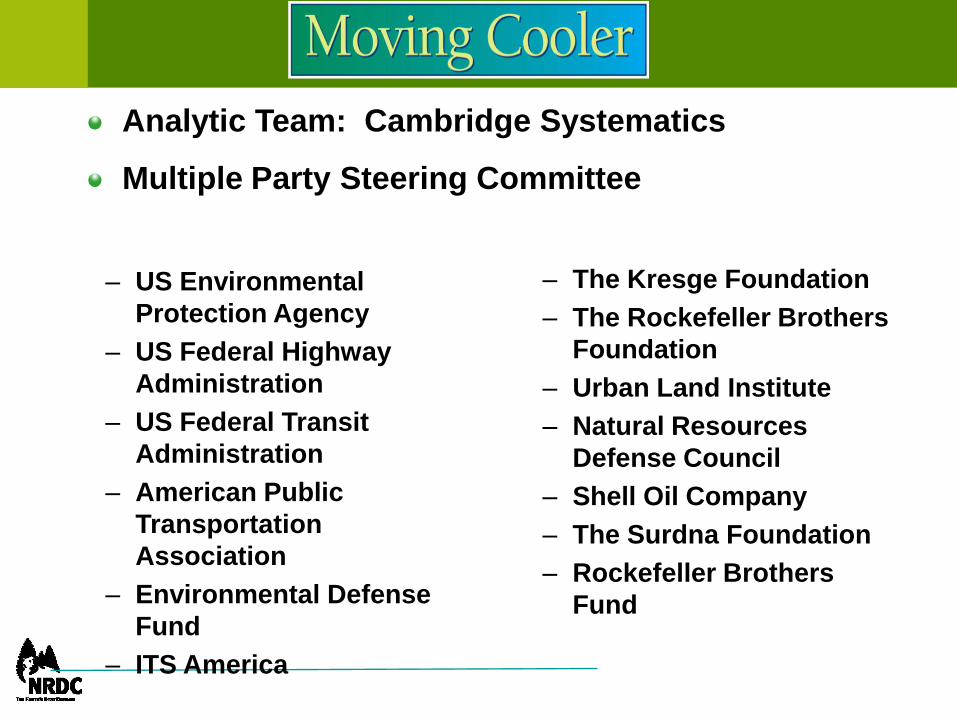
– The Kresge Foundation
– The Rockefeller Brothers
Foundation
– Urban Land Institute
– Natural Resources
Defense Council
– Shell Oil Company
– The Surdna Foundation
– Rockefeller Brothers
Fund
Analytic Team: Cambridge Systematics
Multiple Party Steering Committee
– US Environmental
Protection Agency
– US Federal Highway
Administration
– US Federal Transit
Administration
– American Public
Transportation
Association
– Environmental Defense
Fund
– ITS America
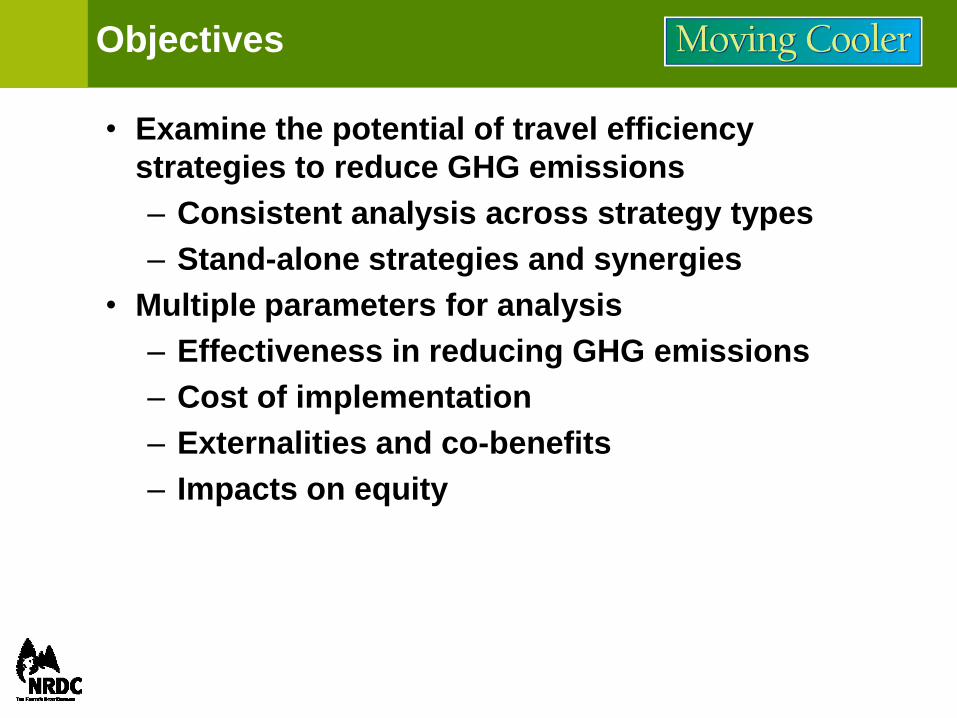
Objectives
• Examine the potential of travel efficiency
strategies to reduce GHG emissions
– Consistent analysis across strategy types
– Stand-alone strategies and synergies
• Multiple parameters for analysis
– Effectiveness in reducing GHG emissions
– Cost of implementation
– Externalities and co-benefits
– Impacts on equity
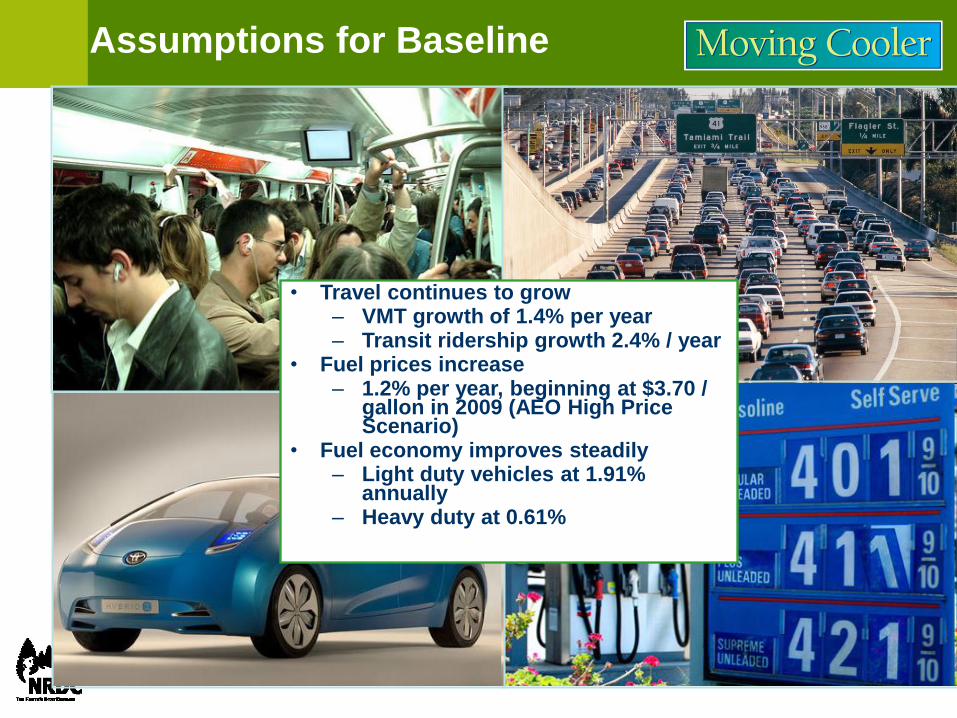
• Travel continues to grow– VMT growth of 1.4% per year– Transit ridership growth 2.4% / year
• Fuel prices increase– 1.2% per year, beginning at $3.70 /
gallon in 2009 (AEO High Price Scenario)
• Fuel economy improves steadily– Light duty vehicles at 1.91%
annually– Heavy duty at 0.61%
Assumptions for Baseline
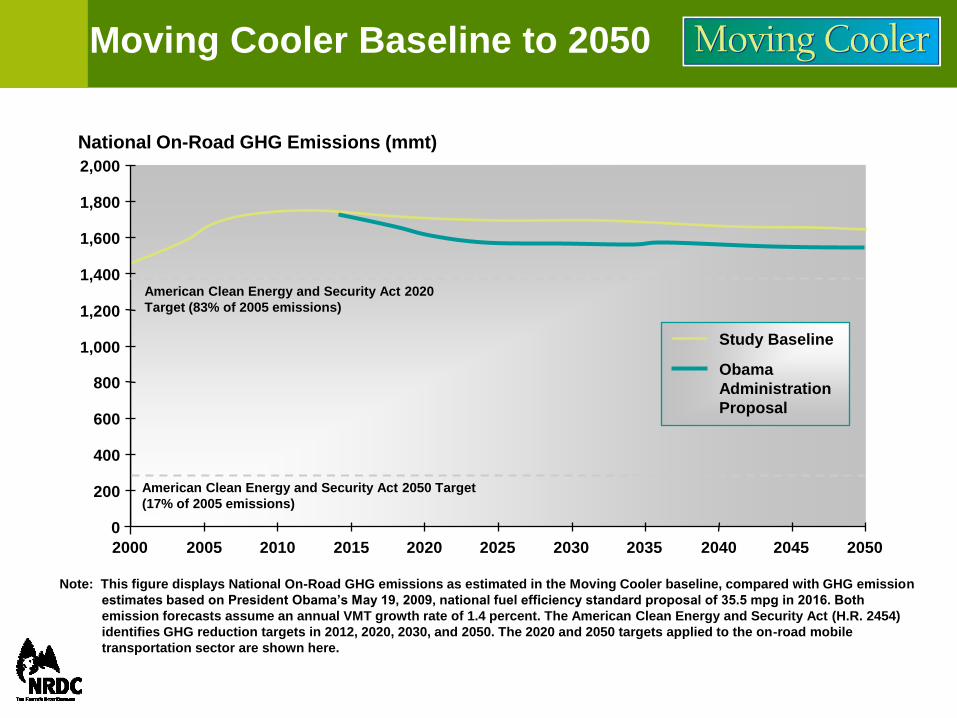
Moving Cooler Baseline to 2050
Note: This figure displays National On-Road GHG emissions as estimated in the Moving Cooler baseline, compared with GHG emission
estimates based on President Obama’s May 19, 2009, national fuel efficiency standard proposal of 35.5 mpg in 2016. Both
emission forecasts assume an annual VMT growth rate of 1.4 percent. The American Clean Energy and Security Act (H.R. 2454)
identifies GHG reduction targets in 2012, 2020, 2030, and 2050. The 2020 and 2050 targets applied to the on-road mobile
transportation sector are shown here.
National On-Road GHG Emissions (mmt)
0
200
400
600
800
1,000
1,200
1,400
1,600
1,800
2,000
2000 2005 2010 2015 2020 2025 2030 2035 2040 2045 2050
Study Baseline
American Clean Energy and Security Act 2020
Target (83% of 2005 emissions)
American Clean Energy and Security Act 2050 Target
(17% of 2005 emissions)
Obama
Administration
Proposal
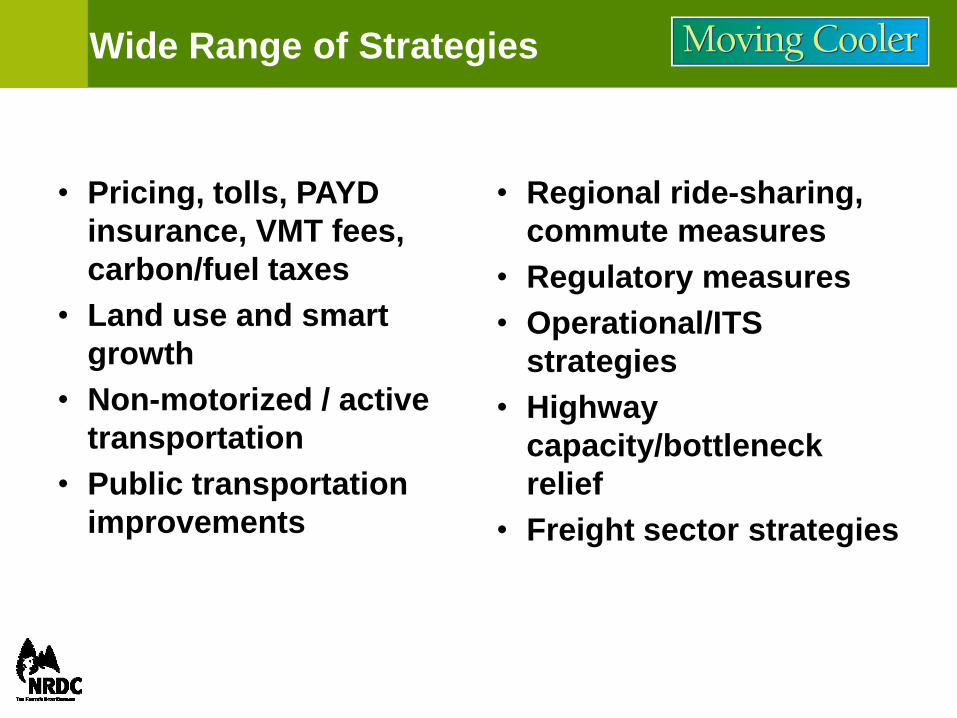
Wide Range of Strategies
• Pricing, tolls, PAYD
insurance, VMT fees,
carbon/fuel taxes
• Land use and smart
growth
• Non-motorized / active
transportation
• Public transportation
improvements
• Regional ride-sharing,
commute measures
• Regulatory measures
• Operational/ITS
strategies
• Highway
capacity/bottleneck
relief
• Freight sector strategies
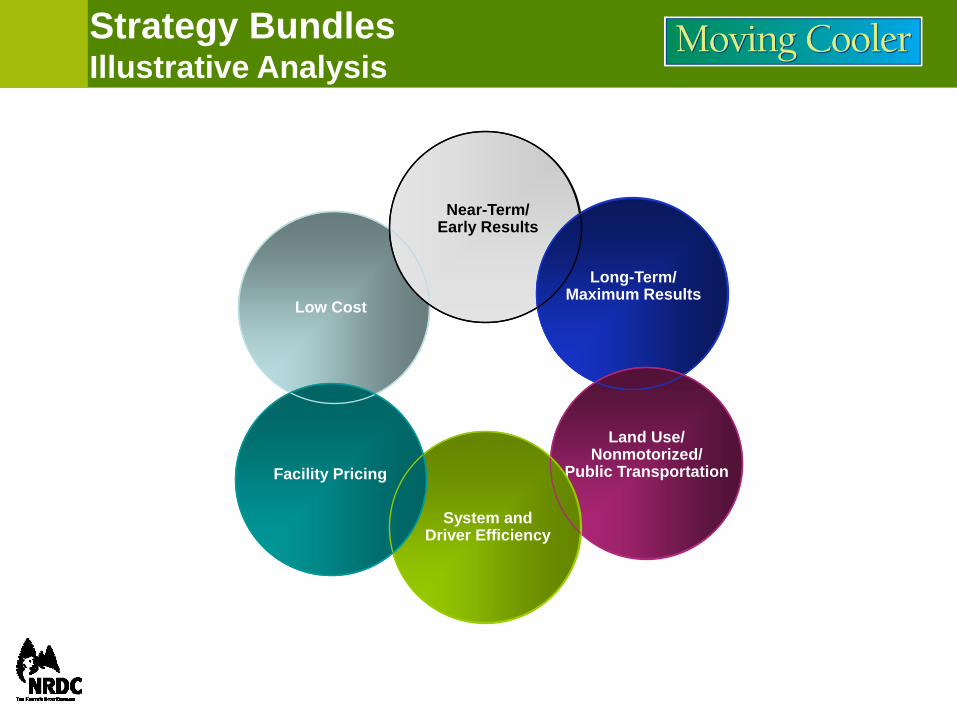
Strategy Bundles Illustrative Analysis
Low Cost
Near-Term/Early Results
Long-Term/Maximum Results
Land Use/Nonmotorized/
Public Transportation
System and Driver Efficiency
Facility Pricing

Geographic Variations
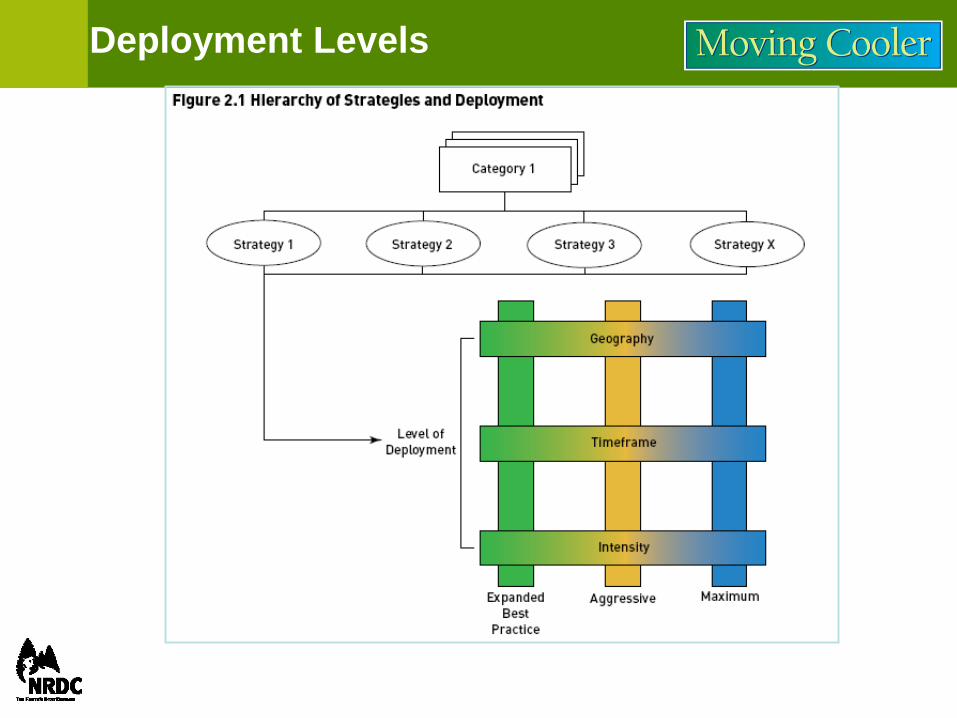
Deployment Levels

• Estimate the GHG reduction of each individual strategy
(change in fuel consumption)
– Cumulative reduction through 2030 and through
2050
– Annual reductions in critical target years
– 3 levels of intensity of implementation
• “Bundle” the strategies and examine the combined
impacts
– Effectiveness
– Interactions, synergies, antagonistic effects
– Implementation costs
– Other societal impacts / co-benefits / externalities
– Equity effects
Analytic Approach
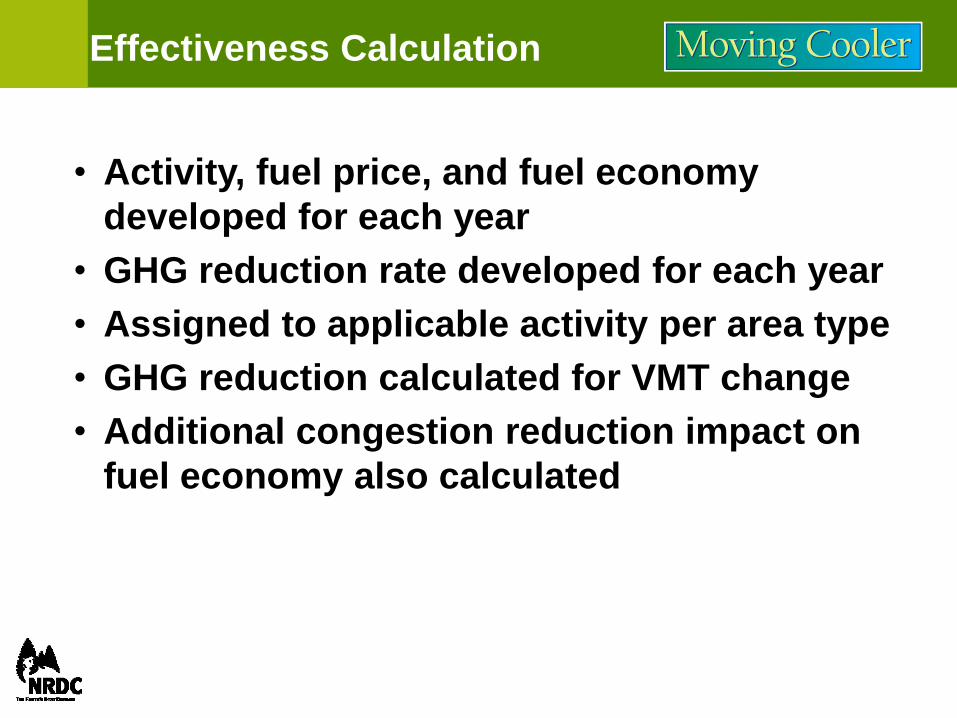
Effectiveness Calculation
• Activity, fuel price, and fuel economy
developed for each year
• GHG reduction rate developed for each year
• Assigned to applicable activity per area type
• GHG reduction calculated for VMT change
• Additional congestion reduction impact on
fuel economy also calculated
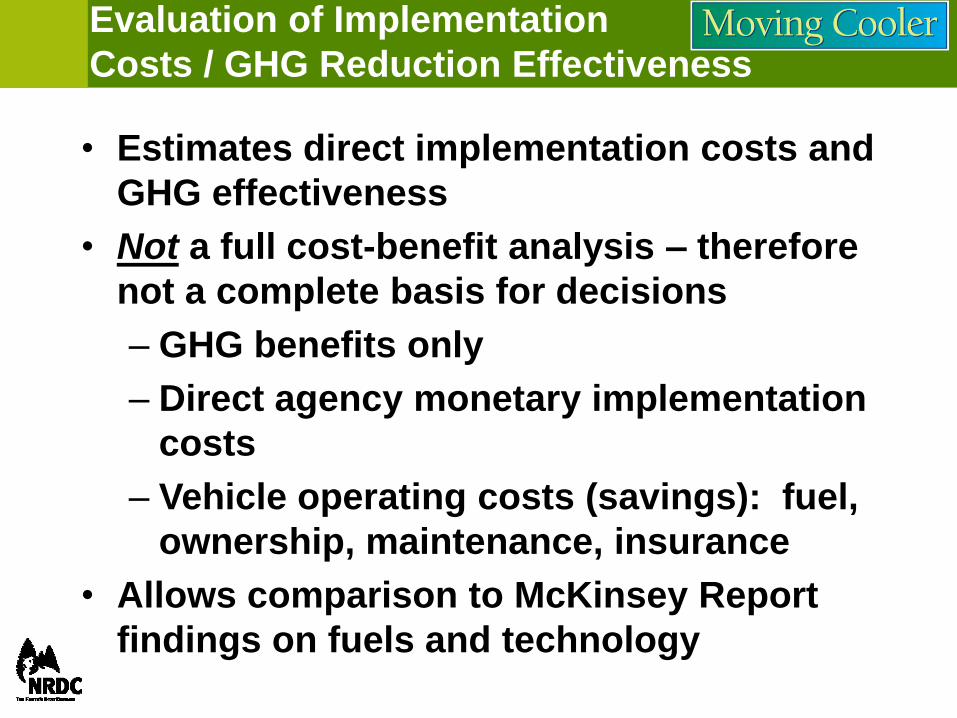
Evaluation of Implementation
Costs / GHG Reduction Effectiveness
• Estimates direct implementation costs and
GHG effectiveness
• Not a full cost-benefit analysis – therefore
not a complete basis for decisions
– GHG benefits only
– Direct agency monetary implementation
costs
– Vehicle operating costs (savings): fuel,
ownership, maintenance, insurance
• Allows comparison to McKinsey Report
findings on fuels and technology
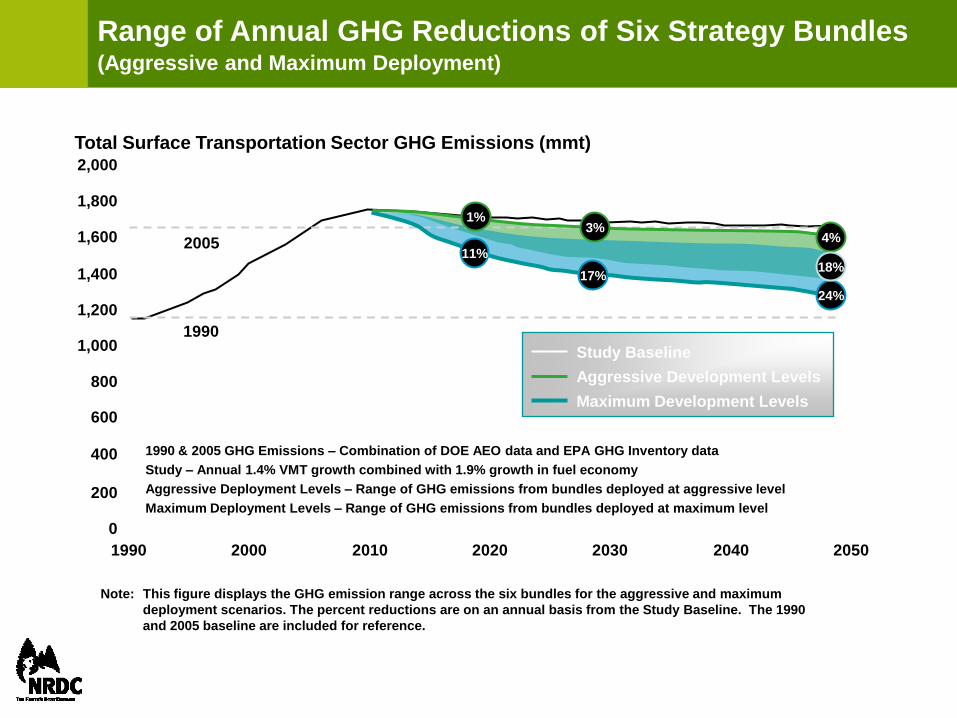
Range of Annual GHG Reductions of Six Strategy Bundles(Aggressive and Maximum Deployment)
1990 & 2005 GHG Emissions – Combination of DOE AEO data and EPA GHG Inventory data
Study – Annual 1.4% VMT growth combined with 1.9% growth in fuel economy
Aggressive Deployment Levels – Range of GHG emissions from bundles deployed at aggressive level
Maximum Deployment Levels – Range of GHG emissions from bundles deployed at maximum level
Total Surface Transportation Sector GHG Emissions (mmt)
0
200
400
600
800
1,000
1,200
1,400
1,600
1,800
2,000
1990 2000 2010 2020 2030 2040 2050
2005
1990
Note: This figure displays the GHG emission range across the six bundles for the aggressive and maximum
deployment scenarios. The percent reductions are on an annual basis from the Study Baseline. The 1990
and 2005 baseline are included for reference.
Study Baseline
Aggressive Development Levels
Maximum Development Levels
4%
24%
1%3%
11%
17%18%
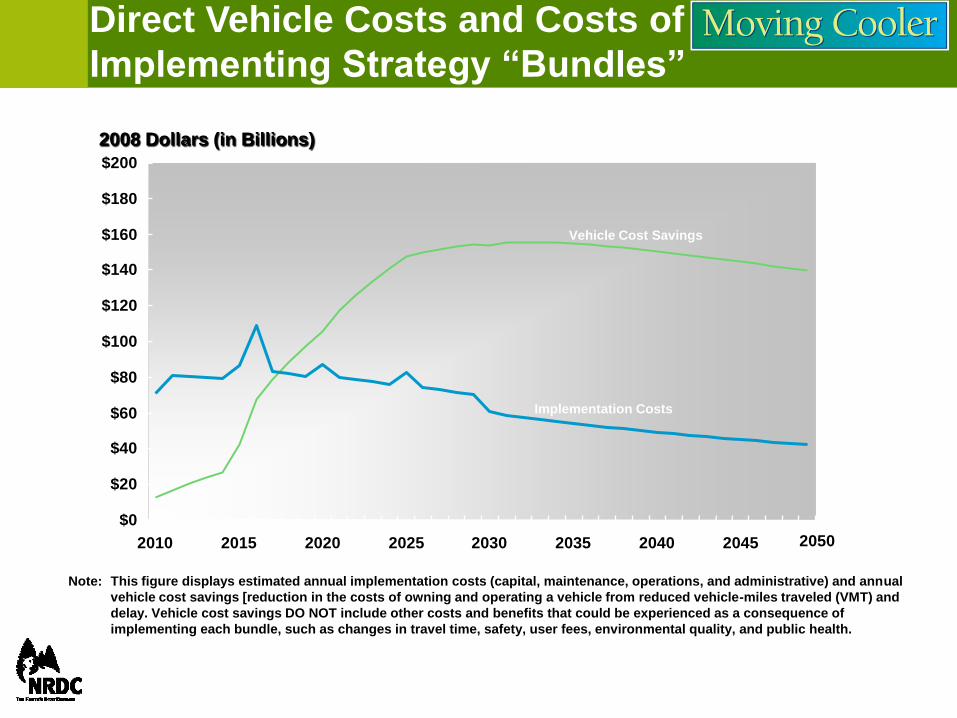
Direct Vehicle Costs and Costs of
Implementing Strategy “Bundles”
Note: This figure displays estimated annual implementation costs (capital, maintenance, operations, and administrative) and annual
vehicle cost savings [reduction in the costs of owning and operating a vehicle from reduced vehicle-miles traveled (VMT) and
delay. Vehicle cost savings DO NOT include other costs and benefits that could be experienced as a consequence of
implementing each bundle, such as changes in travel time, safety, user fees, environmental quality, and public health.
2008 Dollars (in Billions)
$0
$20
$40
$60
$80
$100
$120
$140
$160
$180
$200
2010 2015 2020 2025 2030 2035 2040 2045
Vehicle Cost Savings
Implementation Costs
2050

Summary of Bundle Results
(2010 to 2050 – Aggressive Deployment)
20
GHG
Reduction
(Gt)
Implement.
Costs
Change in Vehicle
Costs
Net Costs per
Tonne
1. Near Term /
Early Results7.1 $676 -$3,211 -$356
2. Long
Term/Maximum
Results7.6 $2,611 -$4,846 -$293
3. Land Use /
Transit / Non-
motorized3.8 $1,439 -$3,270 -$484
4. System and
Driver Efficiency5.0 $1,870 -$2,214 -$69
5. Facility
Pricing1.4 $2,371 -$1,121 $891
6. Low Cost 7.5 $599 -$3,499 -$387

Near-Term and
Long-Range Strategies
• Some strategies are effective in achieving near- term
reductions, reducing the cumulative GHG challenge in
later years
– Near term strategies include: speed limits,
congestion pricing, eco-driving, expanded transit
service
• Investments in land use and improved travel options
involved longer timeframes but would have enduring
benefits
– Substantial investments and policy changes required
Other Societal Goals
• Many strategies contribute to other social, economic and environmental goals while reducing GHGs
– Reduced congestion, livability, expanded travel options, improved environmental quality, economic development, improved safety, enhanced public health…
– Strong price signals combined with system investments enhance both environment and economy
• Both national level and state, regional, local approaches to deployment of strategies are important
– Effectiveness of bundles will differ according to regional variations
