mount alexander shire - centralvicpcp.com.au · central victoria, within the loddon mallee region,...
TRANSCRIPT

Mount Alexander Shire:
Demographic Profile
July 2017

2 | P a g e
Prepared by:
Central Victorian Primary Care Partnership
Published 2017
© Central Victorian Primary Care Partnership 2017
Room 9, Ground Floor,
Workspace Australia,
Halford Street,
PO BOX 687 Castlemaine 3450
T: 03 5472 5333
F: 03 5472 5461
Web: http://centralvicpcp.com.au/
3 | P a g e
Contents
1 INTRODUCTION ................................................................................................................................ 4
1.1 REGION ............................................................................................................................................. 4
1.2 STATISTICAL LOCAL AREAS .................................................................................................................... 5
2 DEMOGRAPHIC CHARACTERISTICS ................................................................................................... 6
2.1 POPULATION ...................................................................................................................................... 7
2.2 INDIGENOUS POPULATION .................................................................................................................... 9
2.3 POPULATION PROJECTED GROWTH ....................................................................................................... 10
2.4 AGE STRUCTURE ............................................................................................................................... 11
2.5 FAMILY STRUCTURE ........................................................................................................................... 16
2.6 CULTURAL DIVERSITY ......................................................................................................................... 16
4 | P a g e
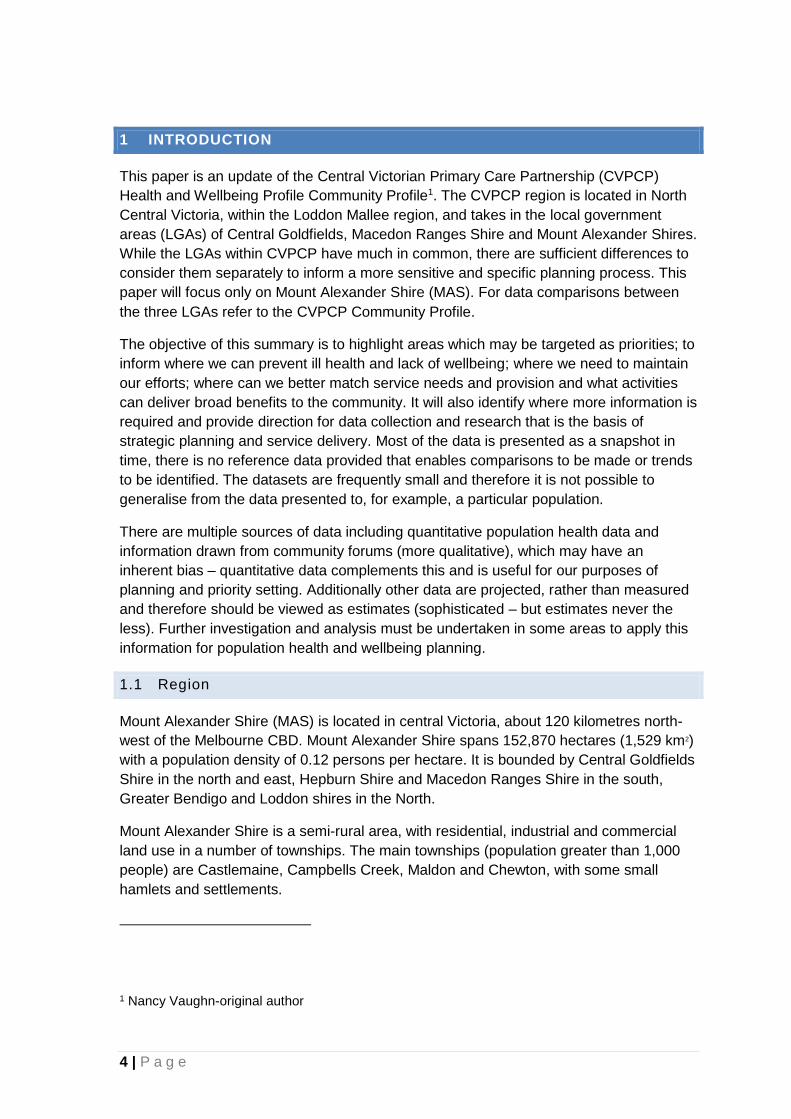
1 INTRODUCTION
This paper is an update of the Central Victorian Primary Care Partnership (CVPCP)
Health and Wellbeing Profile Community Profile1. The CVPCP region is located in North
Central Victoria, within the Loddon Mallee region, and takes in the local government
areas (LGAs) of Central Goldfields, Macedon Ranges Shire and Mount Alexander Shires.
While the LGAs within CVPCP have much in common, there are sufficient differences to
consider them separately to inform a more sensitive and specific planning process. This
paper will focus only on Mount Alexander Shire (MAS). For data comparisons between
the three LGAs refer to the CVPCP Community Profile.
The objective of this summary is to highlight areas which may be targeted as priorities; to
inform where we can prevent ill health and lack of wellbeing; where we need to maintain
our efforts; where can we better match service needs and provision and what activities
can deliver broad benefits to the community. It will also identify where more information is
required and provide direction for data collection and research that is the basis of
strategic planning and service delivery. Most of the data is presented as a snapshot in
time, there is no reference data provided that enables comparisons to be made or trends
to be identified. The datasets are frequently small and therefore it is not possible to
generalise from the data presented to, for example, a particular population.
There are multiple sources of data including quantitative population health data and
information drawn from community forums (more qualitative), which may have an
inherent bias – quantitative data complements this and is useful for our purposes of
planning and priority setting. Additionally other data are projected, rather than measured
and therefore should be viewed as estimates (sophisticated – but estimates never the
less). Further investigation and analysis must be undertaken in some areas to apply this
information for population health and wellbeing planning.
1.1 Region
Mount Alexander Shire (MAS) is located in central Victoria, about 120 kilometres north-
west of the Melbourne CBD. Mount Alexander Shire spans 152,870 hectares (1,529 km2)
with a population density of 0.12 persons per hectare. It is bounded by Central Goldfields
Shire in the north and east, Hepburn Shire and Macedon Ranges Shire in the south,
Greater Bendigo and Loddon shires in the North.
Mount Alexander Shire is a semi-rural area, with residential, industrial and commercial
land use in a number of townships. The main townships (population greater than 1,000
people) are Castlemaine, Campbells Creek, Maldon and Chewton, with some small
hamlets and settlements.
1 Nancy Vaughn-original author
5 | P a g e
1.2 Statistical Local Areas
The data in this paper is presented using different statistical areas. The Australian
Bureau of Statistics and some other agencies collate and present information at
Statistical Local Area (SLA) level. Statistical Area Level 1 (SA1) are the smallest
geographic areas on which most 2011 Census data are released.
Gazetted Localities are the officially recognised boundaries of suburbs (in cities and
larger towns) and localities (outside cities and larger towns). State Suburbs (SSCs) are
an ABS approximation of Gazetted Localities as described above. SSCs are
approximated using one or more SA1s. A Local Government Area (S) is typically made
up of one or more SLAs. Many State Suburb boundaries have changed considerably
between each census year 2006, 2011and 2016. Therefore, comparisons between years
should be made with caution.
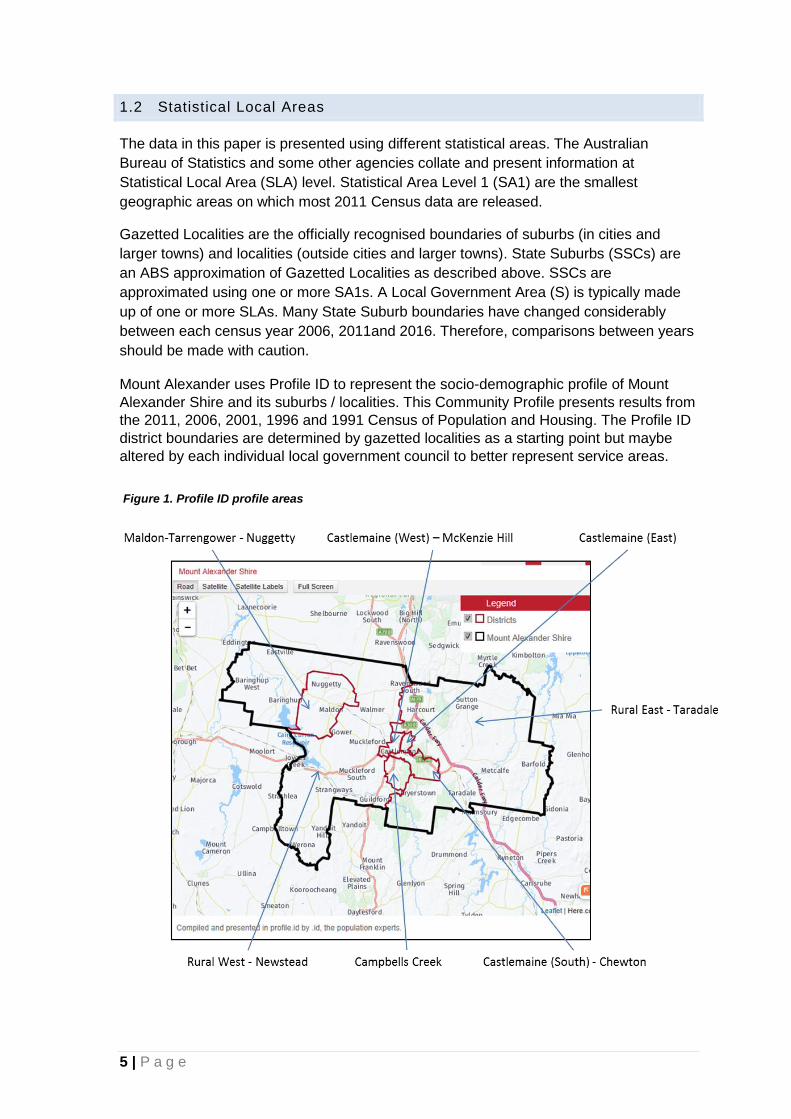
Mount Alexander uses Profile ID to represent the socio-demographic profile of Mount
Alexander Shire and its suburbs / localities. This Community Profile presents results from
the 2011, 2006, 2001, 1996 and 1991 Census of Population and Housing. The Profile ID
district boundaries are determined by gazetted localities as a starting point but maybe
altered by each individual local government council to better represent service areas.
Figure 1. Profile ID profile areas

6 | P a g e
2 DEMOGRAPHIC CHARACTERISTICS
Table 1: Demographic characteristics summary
Demographic Summary Table Page
MAS population in 2016 is 18,761. This has increased by 6.7% from 2011
(17,591). Victorian population has increased by 10.6%. Table 1 6
Campbells Creek (26.87%) and Guildford (21.1%) are the fastest growing
area within MAS* Table 1 6
Populations have decreased in Chewton (-0.3), Newstead (-6%), Taradale
(-3.4%) and Harcourt North (-11.7%).* Table 1 6
MAS population is estimated to continue to increase to 19,968 in 2031
(6.4% increase from 2016). Figure 2 8
In the 2016 census the proportion of Aboriginal people in the MAS area
increased to 1.1% of the population (n=209). This is higher than the
Victorian proportion of 0.8%
Table 2 7
In 2016, the median age of people in MAS (49) is 12 years higher than
Victoria’s median (37). Table 3 9
From 2006 to 2016 the younger age group (0-20) are decreasing and the
older age group over 60 years are increasing. Victoria In Future (VIF) 2016
predicts that this trend will continue into the year 2031
Figure 2 8
Compared to Victoria, MAS has considerably smaller percentage in the 20-
34 years age group Figure 3 11
Campbells Creek (20.2%) and Newstead (18.0%) have the highest
percentage of 0-14 years in MAS Table 5 12
Maldon (33.4%) and Castlemaine (28.8%) have the highest percentage of
65 years and over in MAS. This higher than Victoria (15.6%). Table 5 12
MAS has an increase in couples with no children from 2011 to 2016 (2%)
and remains higher than Victoria Table 6 13
MAS had a slight decrease in lone parents from 2011 to 2016 (0.8%) and
is lower than Victoria Table 6 13
In terms of cultural diversity, MAS is a predominantly Anglo-Celtic and very
homogenous community Table 7 14
In 2014, 72.1% of adults in MAS, definitely think multiculturalism makes life
in their area better - this is statistically significantly higher than the Victorian
average (55.4%).
- 15

7 | P a g e
2.1 Population
The MAS’s usual resident population (where people are on the night of the Census and
also by where they usually live) in 2016 is 18,761.
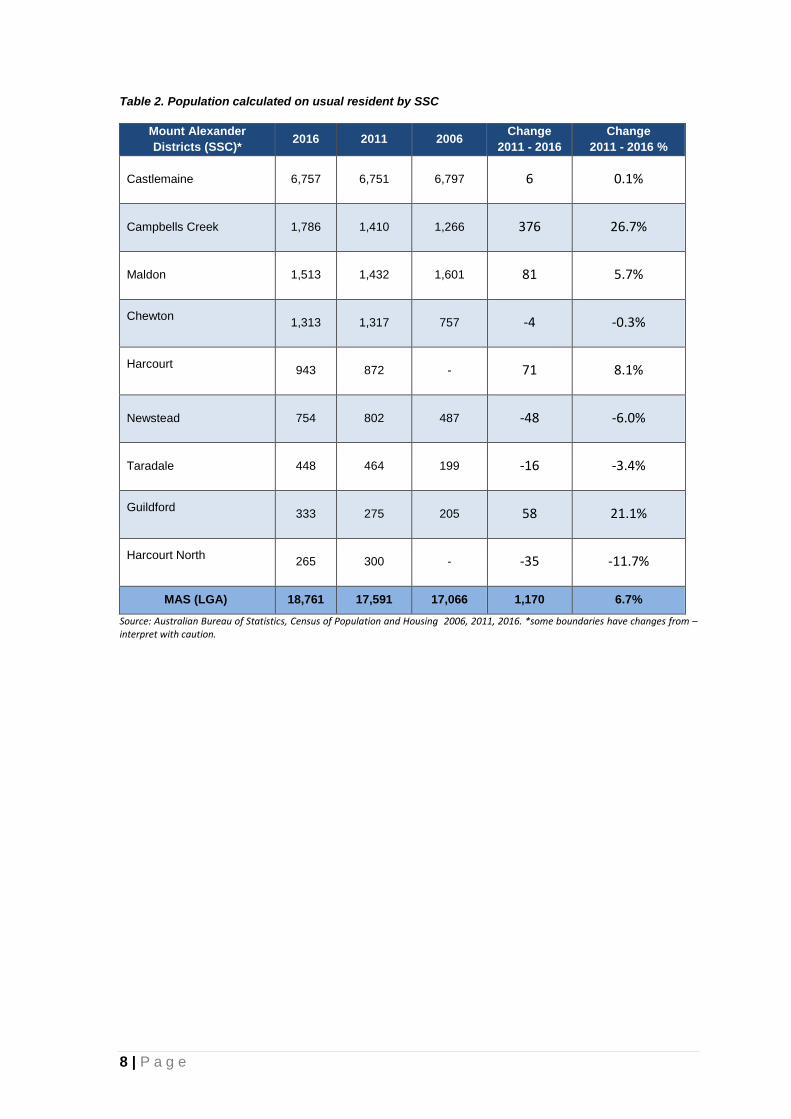
Between 2011 and 2016, the MAS population grew by 6.7% (n=1,170); across Victoria
the increase was 10.6%. Campbells Creek (26.87%) and Guildford (21.1%) are the
fastest growing area within MAS. Please note that the number for Guildford is smaller
and therefore any change will affect the percentage value. Populations have decreased
in Chewton, Newstead, Taradale and Harcourt North.
Figure 2 : Population map: calculated on usual resident population
8 | P a g e
Table 2. Population calculated on usual resident by SSC
Mount Alexander
Districts (SSC)* 2016 2011 2006
Change
2011 - 2016
Change
2011 - 2016 %
Castlemaine 6,757 6,751 6,797 6 0.1%
Campbells Creek 1,786 1,410 1,266 376 26.7%
Maldon 1,513 1,432 1,601 81 5.7%
Chewton 1,313 1,317 757 -4 -0.3%
Harcourt 943 872 - 71 8.1%
Newstead 754 802 487 -48 -6.0%
Taradale 448 464 199 -16 -3.4%
Guildford 333 275 205 58 21.1%
Harcourt North 265 300 - -35 -11.7%
MAS (LGA) 18,761 17,591 17,066 1,170 6.7%
Source: Australian Bureau of Statistics, Census of Population and Housing 2006, 2011, 2016. *some boundaries have changes from – interpret with caution.
9 | P a g e
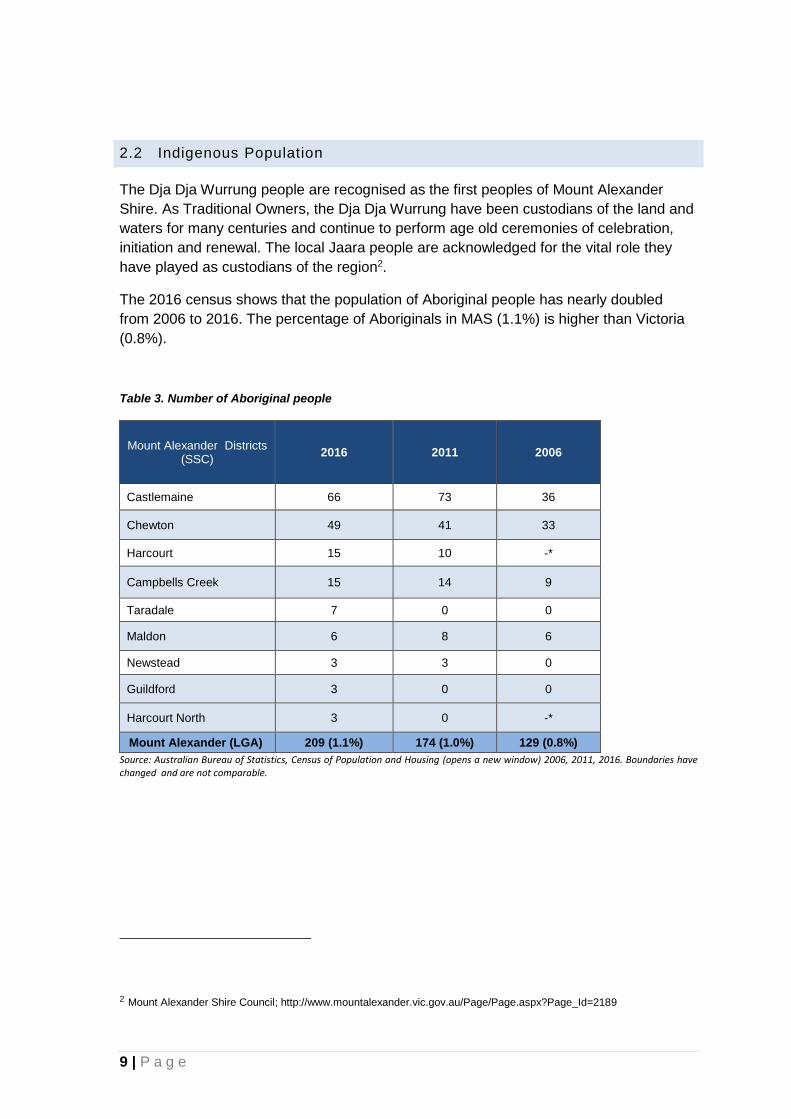
2.2 Indigenous Population
The Dja Dja Wurrung people are recognised as the first peoples of Mount Alexander
Shire. As Traditional Owners, the Dja Dja Wurrung have been custodians of the land and
waters for many centuries and continue to perform age old ceremonies of celebration,
initiation and renewal. The local Jaara people are acknowledged for the vital role they
have played as custodians of the region2.
The 2016 census shows that the population of Aboriginal people has nearly doubled
from 2006 to 2016. The percentage of Aboriginals in MAS (1.1%) is higher than Victoria
(0.8%).
Table 3. Number of Aboriginal people
Mount Alexander Districts (SSC)
2016 2011 2006
Castlemaine 66 73 36
Chewton 49 41 33
Harcourt 15 10 -*
Campbells Creek 15 14 9
Taradale 7 0 0
Maldon 6 8 6
Newstead 3 3 0
Guildford 3 0 0
Harcourt North 3 0 -*
Mount Alexander (LGA) 209 (1.1%) 174 (1.0%) 129 (0.8%)
Source: Australian Bureau of Statistics, Census of Population and Housing (opens a new window) 2006, 2011, 2016. Boundaries have changed and are not comparable.
2 Mount Alexander Shire Council; http://www.mountalexander.vic.gov.au/Page/Page.aspx?Page_Id=2189
10 | P a g e
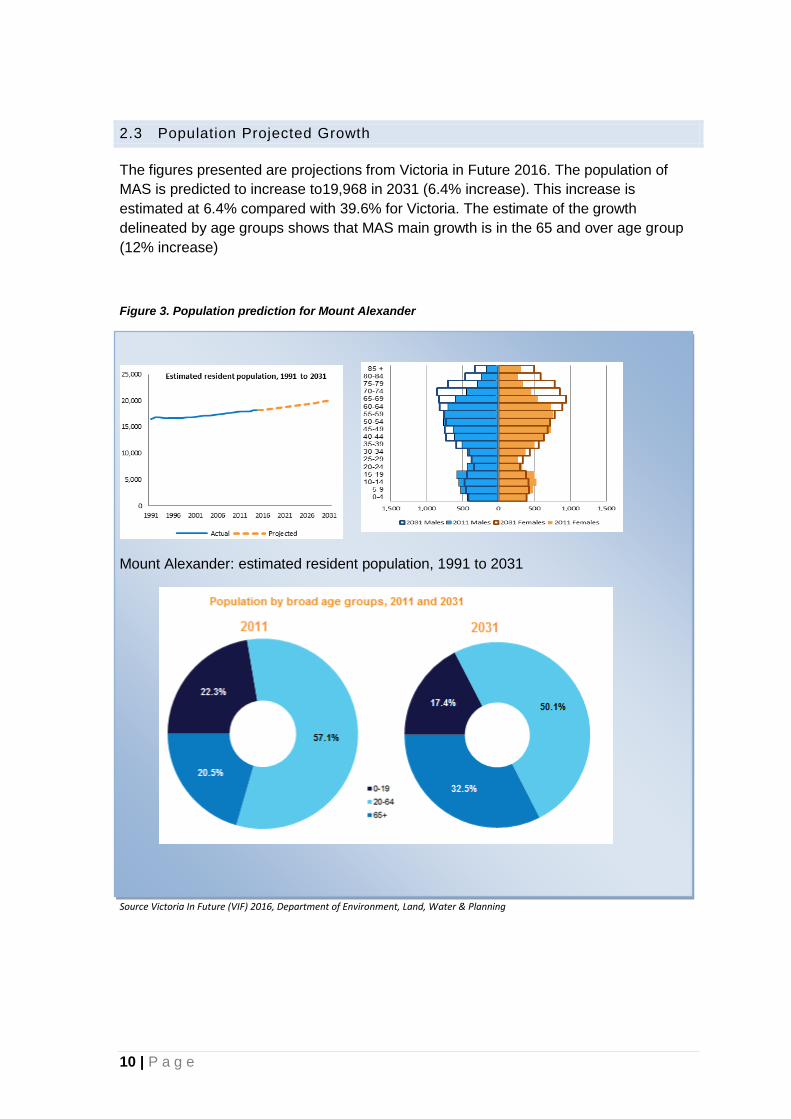
2.3 Population Projected Growth
The figures presented are projections from Victoria in Future 2016. The population of
MAS is predicted to increase to19,968 in 2031 (6.4% increase). This increase is
estimated at 6.4% compared with 39.6% for Victoria. The estimate of the growth
delineated by age groups shows that MAS main growth is in the 65 and over age group
(12% increase)
Figure 3. Population prediction for Mount Alexander
Mount Alexander: estimated resident population, 1991 to 2031
Source Victoria In Future (VIF) 2016, Department of Environment, Land, Water & Planning

11 | P a g e
2.4 Age structure
In 2016, the median age of people in MAS was 49 years. This has increased from 44
years in 2006. In 2016, Children aged 0 - 14 years made up 20.5% of the population and
people aged 65 years and over made up 17.1% of the population.
Campbells Creek and Newstead Gisborne have the highest percentage in the 0-14
years. Castlemaine and Maldon has the highest percentage in the 65 years and over
(Table 4).
2.4.1 Median age
Over the last 10years the median age across MAS has increased, compared to the
Victorian median age which remains constant. Maldon district has the highest median
age at 58 years and Campbells Creek has the lowest in MAS – still higher than the
Victorian median.
Table 4 Median age (SSC)
Mount Alexander Districts (SSC)
2016 2011 2006
Maldon 58 54 49
Harcourt North 53 49 -
Newstead 51 50 46
Castlemaine 50 48 46
Guildford 50 39 39
Chewton 49 41 38
Taradale 47 44 45
Harcourt 46 44 -
Campbells Creek 42 40 36
Mount Alexander (LGA) 49 47 44
Victoria 37 37 37
Source: 2006, 2011, 2016 Census of Population and Housing, Basic Community Profiles, ABS *Data for these locations is based on a State Suburb boundary (ABS) and this takes in a wide region around the town. Many State Suburb boundaries have changed considerably between 2006 and 2011. Therefore comparisons between 2006 and 2011 figures should be made with caution
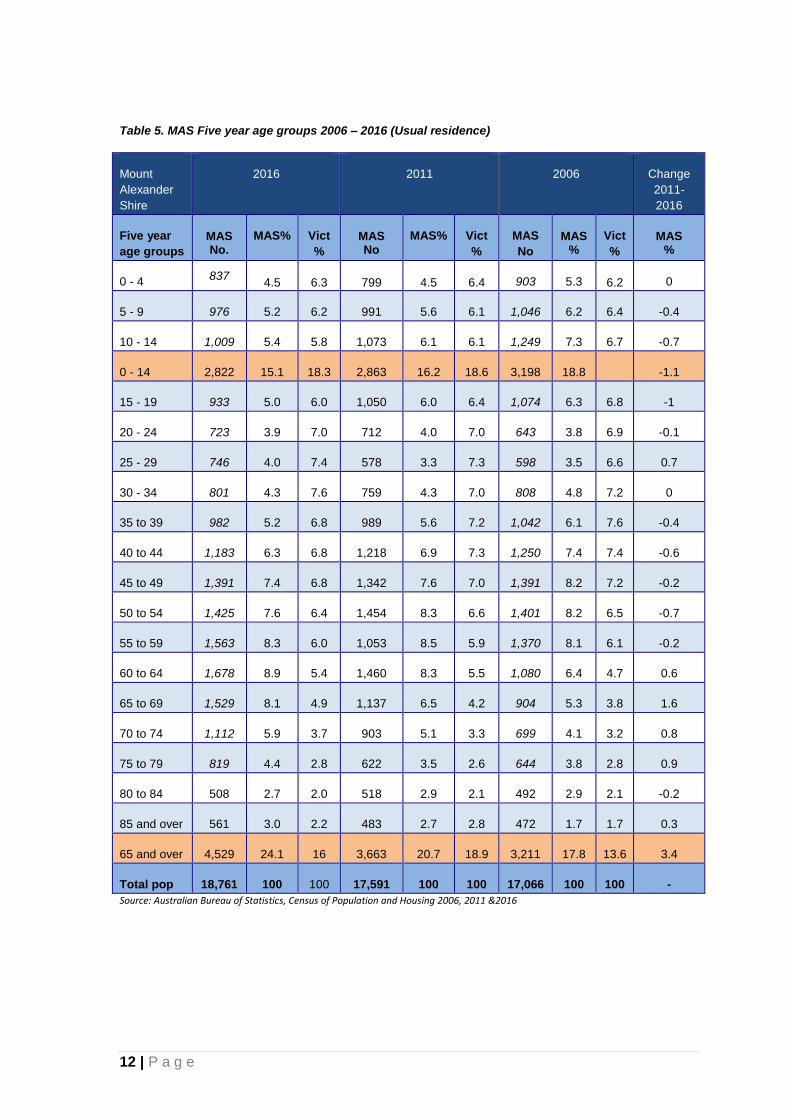
2.4.2 Five year age groups
The census data shows that from 2006 to 2016 the younger age group (0-20) are
decreasing and the older age group over 60 years are increasing. Victoria In Future
(VIF) 2016 predicts that this trend will continue into the year 2031.
12 | P a g e
Table 5. MAS Five year age groups 2006 – 2016 (Usual residence)
Mount
Alexander
Shire
2016 2011 2006 Change
2011-
2016
Five year
age groups
MAS No.
MAS% Vict
%
MAS No
MAS% Vict
%
MAS
No
MAS
%
Vict
%
MAS
%
0 - 4 837
4.5 6.3 799 4.5 6.4 903 5.3 6.2 0
5 - 9 976 5.2 6.2 991 5.6 6.1 1,046 6.2 6.4 -0.4
10 - 14 1,009 5.4 5.8 1,073 6.1 6.1 1,249 7.3 6.7 -0.7
0 - 14 2,822 15.1 18.3 2,863 16.2 18.6 3,198 18.8 -1.1
15 - 19 933 5.0 6.0 1,050 6.0 6.4 1,074 6.3 6.8 -1
20 - 24 723 3.9 7.0 712 4.0 7.0 643 3.8 6.9 -0.1
25 - 29 746 4.0 7.4 578 3.3 7.3 598 3.5 6.6 0.7
30 - 34 801 4.3 7.6 759 4.3 7.0 808 4.8 7.2 0
35 to 39 982 5.2 6.8 989 5.6 7.2 1,042 6.1 7.6 -0.4
40 to 44 1,183 6.3 6.8 1,218 6.9 7.3 1,250 7.4 7.4 -0.6
45 to 49 1,391 7.4 6.8 1,342 7.6 7.0 1,391 8.2 7.2 -0.2
50 to 54 1,425 7.6 6.4 1,454 8.3 6.6 1,401 8.2 6.5 -0.7
55 to 59 1,563 8.3 6.0 1,053 8.5 5.9 1,370 8.1 6.1 -0.2
60 to 64 1,678 8.9 5.4 1,460 8.3 5.5 1,080 6.4 4.7 0.6
65 to 69 1,529 8.1 4.9 1,137 6.5 4.2 904 5.3 3.8 1.6
70 to 74 1,112 5.9 3.7 903 5.1 3.3 699 4.1 3.2 0.8
75 to 79 819 4.4 2.8 622 3.5 2.6 644 3.8 2.8 0.9
80 to 84 508 2.7 2.0 518 2.9 2.1 492 2.9 2.1 -0.2
85 and over 561 3.0 2.2 483 2.7 2.8 472 1.7 1.7 0.3
65 and over 4,529 24.1 16 3,663 20.7 18.9 3,211 17.8 13.6 3.4
Total pop 18,761 100 100 17,591 100 100 17,066 100 100 -
Source: Australian Bureau of Statistics, Census of Population and Housing 2006, 2011 &2016
13 | P a g e
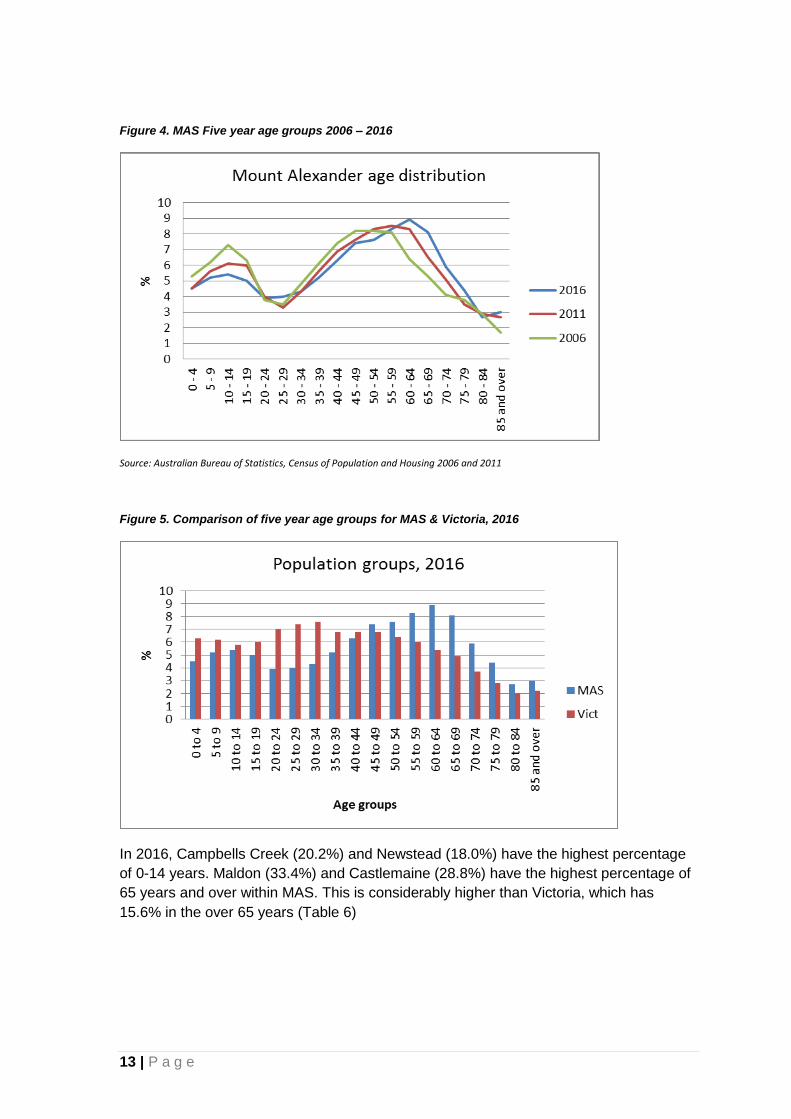
Figure 4. MAS Five year age groups 2006 – 2016
Source: Australian Bureau of Statistics, Census of Population and Housing 2006 and 2011
Figure 5. Comparison of five year age groups for MAS & Victoria, 2016
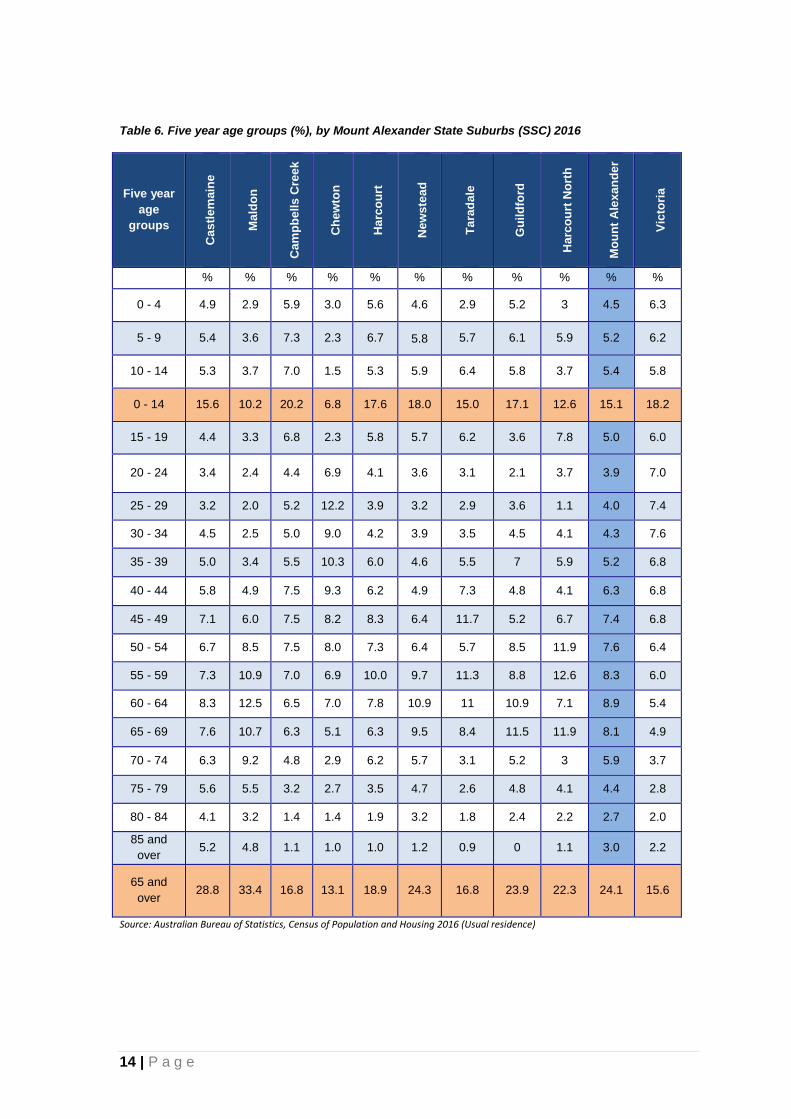
In 2016, Campbells Creek (20.2%) and Newstead (18.0%) have the highest percentage
of 0-14 years. Maldon (33.4%) and Castlemaine (28.8%) have the highest percentage of
65 years and over within MAS. This is considerably higher than Victoria, which has
15.6% in the over 65 years (Table 6)
14 | P a g e
Table 6. Five year age groups (%), by Mount Alexander State Suburbs (SSC) 2016
Five year
age
groups
Ca
stl
em
ain
e
Ma
ldo
n
Ca
mp
be
lls
Cre
ek
Ch
ew
ton
Ha
rco
urt
Ne
ws
tea
d
Ta
rad
ale
Gu
ild
ford
Ha
rco
urt
No
rth
Mo
un
t A
lex
an
de
r
Vic
tori
a
% % % % % % % % % % %
0 - 4 4.9 2.9 5.9 3.0 5.6 4.6 2.9 5.2 3 4.5 6.3
5 - 9 5.4 3.6 7.3 2.3 6.7 5.8 5.7 6.1 5.9 5.2 6.2
10 - 14 5.3 3.7 7.0 1.5 5.3 5.9 6.4 5.8 3.7 5.4 5.8
0 - 14 15.6 10.2 20.2 6.8 17.6 18.0 15.0 17.1 12.6 15.1 18.2
15 - 19 4.4 3.3 6.8 2.3 5.8 5.7 6.2 3.6 7.8 5.0 6.0
20 - 24 3.4 2.4 4.4 6.9 4.1 3.6 3.1 2.1 3.7 3.9 7.0
25 - 29 3.2 2.0 5.2 12.2 3.9 3.2 2.9 3.6 1.1 4.0 7.4
30 - 34 4.5 2.5 5.0 9.0 4.2 3.9 3.5 4.5 4.1 4.3 7.6
35 - 39 5.0 3.4 5.5 10.3 6.0 4.6 5.5 7 5.9 5.2 6.8
40 - 44 5.8 4.9 7.5 9.3 6.2 4.9 7.3 4.8 4.1 6.3 6.8
45 - 49 7.1 6.0 7.5 8.2 8.3 6.4 11.7 5.2 6.7 7.4 6.8
50 - 54 6.7 8.5 7.5 8.0 7.3 6.4 5.7 8.5 11.9 7.6 6.4
55 - 59 7.3 10.9 7.0 6.9 10.0 9.7 11.3 8.8 12.6 8.3 6.0
60 - 64 8.3 12.5 6.5 7.0 7.8 10.9 11 10.9 7.1 8.9 5.4
65 - 69 7.6 10.7 6.3 5.1 6.3 9.5 8.4 11.5 11.9 8.1 4.9
70 - 74 6.3 9.2 4.8 2.9 6.2 5.7 3.1 5.2 3 5.9 3.7
75 - 79 5.6 5.5 3.2 2.7 3.5 4.7 2.6 4.8 4.1 4.4 2.8
80 - 84 4.1 3.2 1.4 1.4 1.9 3.2 1.8 2.4 2.2 2.7 2.0
85 and
over 5.2 4.8 1.1 1.0 1.0 1.2 0.9 0 1.1 3.0 2.2
65 and
over 28.8 33.4 16.8 13.1 18.9 24.3 16.8 23.9 22.3 24.1 15.6
Source: Australian Bureau of Statistics, Census of Population and Housing 2016 (Usual residence)

15 | P a g e
Table 7.. Five year age groups (numbers), by Mount Alexander State Suburbs (SSC) 2016
Five year
age
groups C
as
tle
main
e
Ma
ldo
n
Ca
mp
be
lls
Cre
ek
Ch
ew
ton
Ha
rco
urt
Ne
ws
tea
d
Ta
rad
ale
Gu
ild
ford
Ha
rco
urt
No
rth
Mo
un
t A
lex
an
de
r
0 - 4 328 45 106 40 52 34 13 17 8 837
5 - 9 368 46 131 30 62 43 26 20 16 976
10 - 14 360 50 125 20 49 44 29 19 10 1,009
0 - 14 1,056 141 362 90 163 1221 68 56 34 2,822
15 - 19 298 42 121 30 54 42 28 12 21 933
20 - 24 229 33 79 91 38 27 14 7 10 723
25 - 29 214 31 92 161 36 24 13 12 3 746
30 - 34 303 27 90 118 39 29 16 15 11 801
35 - 39 336 49 99 136 32 34 25 23 16 982
40 - 44 390 57 134 123 34 36 33 16 11 1,183
45 - 49 477 78 134 108 77 47 53 17 18 1,391
50 - 54 451 106 134 105 68 47 26 28 32 1,425
55 - 59 492 135 125 91 93 72 51 29 34 1,563
60 - 64 560 157 116 92 73 81 50 36 19 1,678
65 - 69 516 132 113 67 59 70 38 38 32 1,529
70 - 74 429 111 85 38 58 42 14 17 8 1,112
75 - 79 376 66 57 35 33 35 12 16 11 819
80 - 84 278 44 25 19 18 24 8 8 6 508
85 -89 209 38 11 8 6 3 3 0 3 350
90 and
over 140 30 7 3 3 4 0 0 0 211
75 and
over 1,030 178 100 65 60 66 23 24 20 1,888
Source: Australian Bureau of Statistics, Census of Population and Housing 2016 (Usual residence)
16 | P a g e
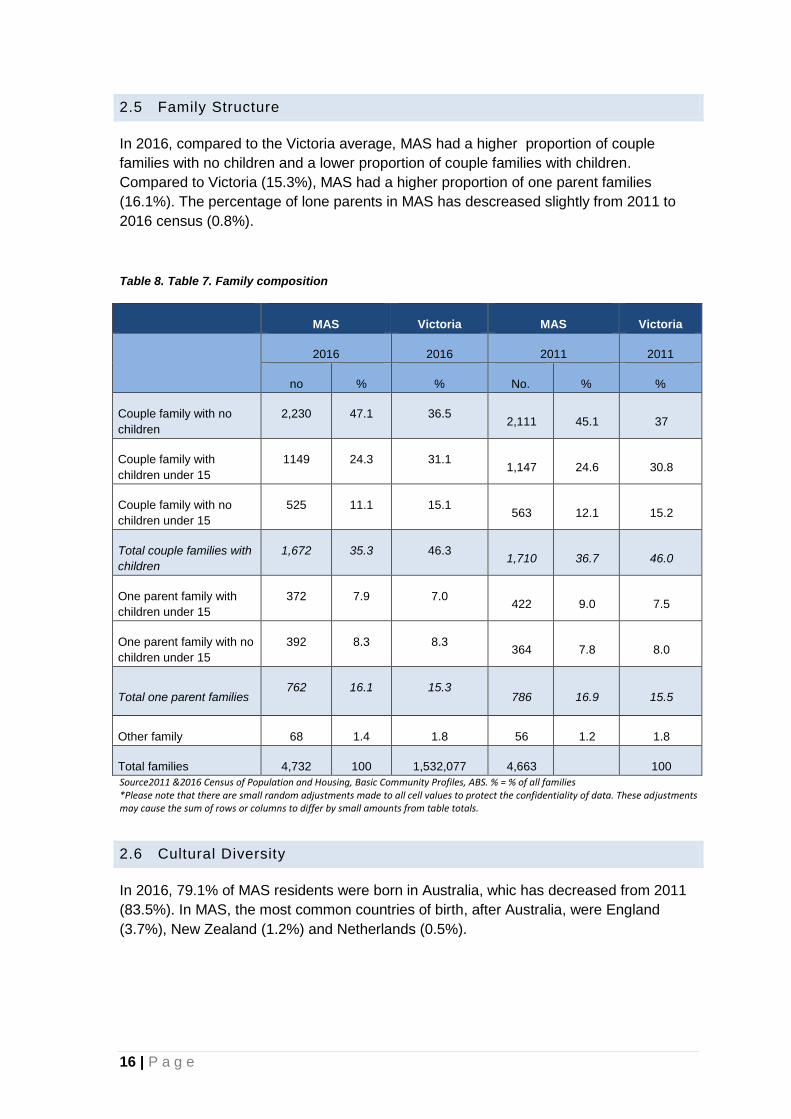
2.5 Family Structure
In 2016, compared to the Victoria average, MAS had a higher proportion of couple
families with no children and a lower proportion of couple families with children.
Compared to Victoria (15.3%), MAS had a higher proportion of one parent families
(16.1%). The percentage of lone parents in MAS has descreased slightly from 2011 to
2016 census (0.8%).
Table 8. Table 7. Family composition
MAS Victoria MAS Victoria
2016 2016 2011 2011
no % % No. % %
Couple family with no
children
2,230 47.1 36.5 2,111 45.1 37
Couple family with
children under 15
1149 24.3 31.1 1,147 24.6 30.8
Couple family with no
children under 15
525 11.1 15.1 563 12.1 15.2
Total couple families with
children
1,672 35.3 46.3 1,710 36.7 46.0
One parent family with
children under 15
372 7.9 7.0 422 9.0 7.5
One parent family with no
children under 15
392 8.3 8.3 364 7.8 8.0
Total one parent families 762 16.1 15.3
786 16.9 15.5
Other family 68 1.4 1.8 56 1.2 1.8
Total families 4,732 100 1,532,077 4,663 100
Source2011 &2016 Census of Population and Housing, Basic Community Profiles, ABS. % = % of all families *Please note that there are small random adjustments made to all cell values to protect the confidentiality of data. These adjustments may cause the sum of rows or columns to differ by small amounts from table totals.
2.6 Cultural Diversity
In 2016, 79.1% of MAS residents were born in Australia, whic has decreased from 2011
(83.5%). In MAS, the most common countries of birth, after Australia, were England
(3.7%), New Zealand (1.2%) and Netherlands (0.5%).

17 | P a g e
Table 9. Country of Birth
MAS Victoria MAS Victoria
2016 2016 2011 2011
No % % No. % %
Australia 14,846 79.1 64.9 14,689 83.5 68.6
England 697 3.7 2.9 -* - 4.0
New Zealand 232 1.2 1.4 215 1.2 1.5
Netherlands 93 0.5 0.3 77 0.4 0.4
Germany 85 0.5 0.4 78 0.4 0.5
Scotland 71 0.4 0.4 - - -
USA 68 0.4 0.3 51 0.3 0.3
Vietnam 61 0.3 1.4 37 0.2 1.3
India 58 0.3 2.9 41 0.2 2.1
Taiwan 50 0.3 0.2 - - -
Philippines 35 0.2 0.9 16 0.1 0.7
South Africa 34 0.2 0.5 30 0.2 0.5
China (excl. SARs & Taiwan)(b) 33 0.2 2.7 8 0.0 1.8
Italy 30 0.2 1.2 27 0.2 1.4
Malaysia 30 0.2 0.8 29 0.2 0.7
Canada 29 0.2 0.2 22 0.1 0.1
Ireland 28 0.1 0.1* 27 0.2 0.3
Hong Kong (SAR of China)(b) 27 0.1 0.4 5 0.0 0.3
Wales 23 0.1 0.1 -* - -
France 21 0.1 0.1 - - -
Greece 19 0.1 0.8 14 0.1 0.9
Lebanon 19 0.1 0.3 9 0.1 0.3
Sri Lanka 17 0.1 0.9 7 0.0 0.8
Croatia 10 0.1 0.3 4 0.0 0.3
Poland 17 0.1 0.2 8 0.0 0.3
Malta 16 0.1 0.3 14 0.1 0.4
South Eastern Europe nfd(c) 14 0.1 0.1 13 0.1 0.2
Japan 14 0.1 0.1 16 0.1 0.1
Thailand 12 0.1 0.3 15 0.1 0.2
Indonesia 11 0.1 0.3 12 0.1 0.3
Former Yugoslav Rep. of Macedonia 8 0.0 0.3 9 0.1 0.3
Chile 7 0.0 0.1 - - -
Cambodia 6 0.0 0.2 0 0.0 0.2
Iraq 6 0.0 0.3 3 0.0 0.2
Singapore 6 0.0 0.3 4 0.0 0.3
Fiji 6 0.0 0.2 4 0.0 0.2
Egypt 5 0.0 0.2 5 0.0 0.2
Turkey 5 0.0 0.3 4 0.0 0.3
Zimbabwe 4 0.0 0.1 - - -
Bosnia and Herzegovina 3 0.0 0.1 0 0.0 0.2
Korea, Republic of (South) 3 0.0 0.2 0 0.0 0.2
Born elsewhere(e) 198 1.1 3.1 258 1.5 4.3
Not stated 1,761 9.4 6.8 1,009 5.7 5.2
Total 100
Source: 2011 &2016 Census of Population and Housing, Basic Community Profiles, ABS (b) excluding Special Administrative Regions (SARs) comprise 'Hong Kong (SAR of China)' and 'Macau (SAR of China)'.and Taiwan (c) Includes persons who stated their birthplace as Yugoslavia. (e) Includes countries not identified individually, 'Australian External Territories', 'Inadequately described' and 'At sea'. *United Kingdom 2011 has been separated in 2016 into England, Northern Ireland, Wales & Scotland
18 | P a g e
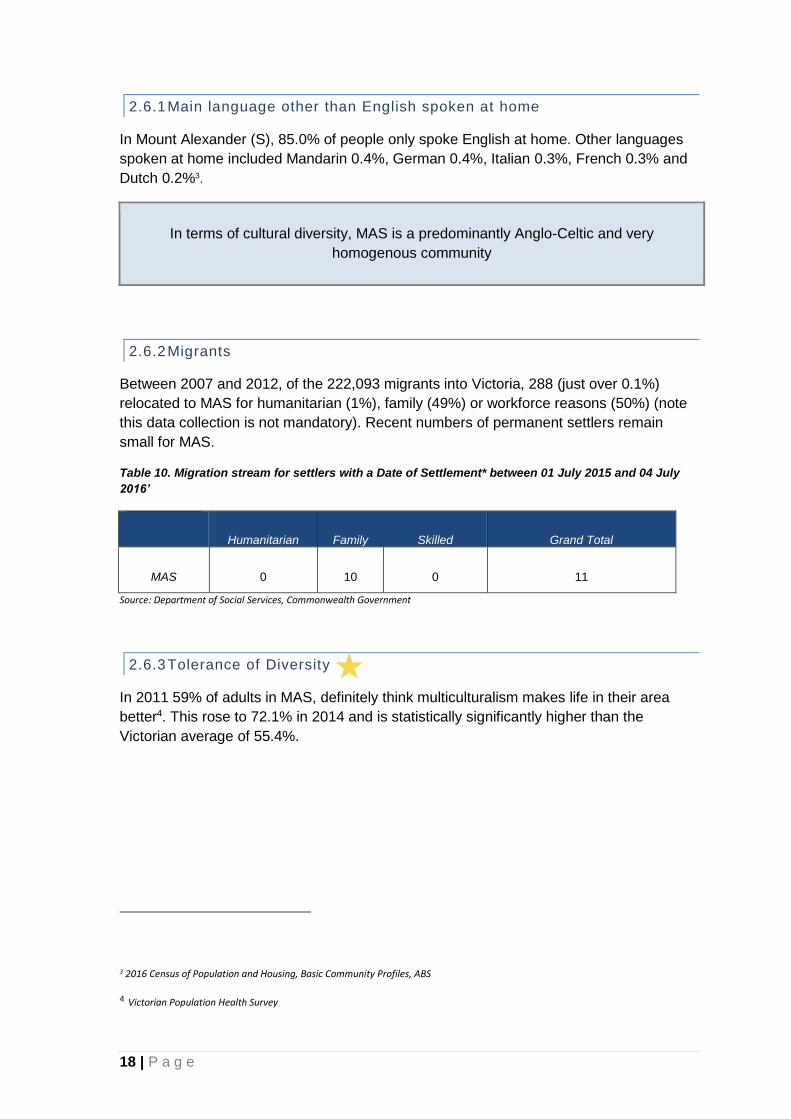
2.6.1 Main language other than English spoken at home
In Mount Alexander (S), 85.0% of people only spoke English at home. Other languages
spoken at home included Mandarin 0.4%, German 0.4%, Italian 0.3%, French 0.3% and
Dutch 0.2%3.
In terms of cultural diversity, MAS is a predominantly Anglo-Celtic and very
homogenous community
2.6.2 Migrants
Between 2007 and 2012, of the 222,093 migrants into Victoria, 288 (just over 0.1%)
relocated to MAS for humanitarian (1%), family (49%) or workforce reasons (50%) (note
this data collection is not mandatory). Recent numbers of permanent settlers remain
small for MAS.
Table 10. Migration stream for settlers with a Date of Settlement* between 01 July 2015 and 04 July
2016’
Humanitarian Family Skilled Grand Total
MAS 0 10 0 11
Source: Department of Social Services, Commonwealth Government
2.6.3 Tolerance of Diversity
In 2011 59% of adults in MAS, definitely think multiculturalism makes life in their area
better4. This rose to 72.1% in 2014 and is statistically significantly higher than the
Victorian average of 55.4%.
3 2016 Census of Population and Housing, Basic Community Profiles, ABS
4 Victorian Population Health Survey