motor imagery brain-computer interfaces: random forests vs...
TRANSCRIPT
Motor Imagery Brain-Computer Interfaces:Random Forests vs Regularized LDA -
Non-linear Beats LinearDavid Steyrl, Reinhold Scherer, Oswin Forstner and Gernot R. Muller-Putz
Graz University of Technology, Institute for Knowledge Discovery, Laboratory of Brain-ComputerInterfaces, Graz, Austria
[email protected], [email protected], [email protected],[email protected]
AbstractNowadays, non-linear classifiers are available that claim to generalize well at a low
amount of data. Recently, we conducted an on-line study, where a random forest (RF)classifier successfully drove an electroencephalography (EEG) based sensorimotor rhythms(SMR) brain-computer interface (BCI) by classifying discrete Fourier transform (DFT)features. In this work, we re-analyse that data-set and simulate the use of common spatialpatterns (CSP) features with a RF classifier and a shrinkage regularized linear discriminantanalysis (sLDA). We found that the RF classifier could make better use of the CSP featuresand outperformed sLDA. The mean and median classification accuracy during the feedbackperiod were improved by ∼ 2% and ∼ 3% when using a RF classifier. The effect is small, butstatistically significant (p < 0.05) and consistent over the participants. Therefore, we arguethat the widespread view that linear methods are ideal for BCIs should be reconsideredand RF classifiers should be taken into account when choosing a classifier for SMR-BCIs.
1 IntroductionThus far, linear machine-learning methods are considered ideal for the application in brain-computer interfaces (BCIs) [3]. Particularly with the main argument that simplicity should bepreferred, especially when limited data are available as in BCIs. However, substantial progresshas been made in the field of machine-learning. Nowadays, certain non-linear methods claimto generalize well when only limited amount of data are available. One such a method isthe random forests (RF) classifier [2]. Our interest in this classifier is mainly based on hisfollowing properties: (1) RF classifiers provide a complex model which allows non-linear decisionboundaries. (2) RF classifiers are “over-fitting” resistant, even with a large number of features.(3) RF classifiers are able to merge features originating from different statistical distributioninto one model. Particularly hybrid BCIs and passive BCIs make use of such features. (4)RF classifiers are regularized by nature. (5) There exist efficient implementations of the RFclassifiers which enables on-line operation. (6) RF classifiers are multi functional tools for dataanalysis. E.g. RF classifiers offer importance ratings of the features, they allow for analysis offeatures’ proximities and provide an estimate of the expected accuracy.
Recently, we conducted an on-line study, where a RF classifier was deployed in an elec-troencephalography (EEG) based sensorimotor rhythms BCI (SMR-BCI) [4]. Discrete Fouriertransform (DFT) magnitudes were used as features for the classification. The on-line feedbackresults in 13 users demonstrate an classification accuracy competitive to other state of the artSMR-BCIs. Detailed results will be published elsewhere.
In the present work, we address two questions arising from the RF driven SMR-BCI: (1)The first question addresses the features for classification. Common spatial patterns (CSP)
Proceedings of the 6th International Brain-Computer Interface Conference 2014 DOI:10.3217/978-3-85125-378-8-61
Published by Graz University of Technology Publishing House Article ID 061-1

filtering is a more powerful feature extraction method than DFT [5]. Hence, we hypothesizethat replacing the DFT features by CSP features will boost the performance of the RF classifierdriven SMR-BCI. (2) The second question addresses the impact of the RF classifier’s non-linearmodel. According to literature, we hypothesize that the RF non-linear model outperforms alinear classification model although only a limited amount of data is available. The linear modelis represented by an analytic-shrinkage-regularized linear discriminant analysis (sLDA) as LDAclassifier are commonly used in BCIs [1]. For evaluating this two hypothesis, we conduct BCIsimulations using the data of the on-line study mentioned above.
2 MethodsSummary of the on-line studies set-up. The paradigm was based on the cue-guided Graz-BCI training paradigm [4]. Hence, recording, training, and feedback was performed within asingle session. The session consisted of eight runs, five of them for training and three withfeedback for validation. One run was composed of 20 trials. Taken together, we recorded 50trials per class for training and 30 trials per class for validation. Participants had the taskof performing sustained (5 seconds) kinaesthetic motor imagery (MI) of the right hand and ofthe feet each as instructed by the cue. Feedback was presented in form of a white colouredbar-graph. The length of the bar-graph reflected the amount of correct classifications overthe last second. EEG was measured with a biosignal amplifier and active Ag/AgCl electrodes(g.USBamp, g.LADYbird, Guger Technologies OG, Schiedlberg, Austria) at a sampling rateof 512 Hz. The electrodes placement was designed for obtaining three Laplacian derivations.Center electrodes at positions C3, Cz, and C4 and four additional electrodes around each centerelectrode with a distance of 2.5 cm, 15 electrodes total. The reference electrode was mountedon the left mastoid and the ground electrode on the right mastoid. The 13 participants wereaged between 20 and 30 years, 8 naıve to the task, and had no known medical or neurologicaldiseases.
BCI simulation. In this work, we want a balance between data-sets from naıve and non-naıveparticipants. We include all 5 data-sets of the non-naıve participants and 5 data-sets from naıveparticipants chosen by random. For the BCI simulation, each data-set is divided in two parts.The first part is used for CSP and classifier training, the second part for validation. The valida-tion is carried out with a running classifier. The applied signal processing pipeline: (1) A filterbank of 8th order Butterworth band-pass-filters divides the EEG data into 15 sub-bands. Cut-off frequencies: [i, i+ 2] i = 6, 8, 10, 12 in the α-band and [i, i+ 5] i = 14, 17, 20, 23, 26, 29, 32, 35in the β-band. (2) We calculate a separate set of CSP filters for each sub-band [5]. The spatialfilters according to the three highest and three lowest eigenvalues of each set of CSP filtersare selected. Hence, one CSP calculation per sub-band and six filters per CSP results in 90virtual channels. (3) The features used for classification are obtained by calculating logarith-mic band-power for each of the 90 virtual channels. The logarithm changes the band-powerfeatures distribution to a normal distribution. Normal distributed features are not necessaryfor the RF classifier, but for the sLDA classifier. The band-power was estimated by squaringand subsequent averaging over a sliding window with a length of 1 s. (4) The classification wasperformed with a RF classifier on the one hand, and with a sLDA classifier on the other hand.
For training, we picked the features from the 1 s long window starting 2.5 s after the cueof each trial [6]. This implies a trials-to-features ratio of 100/90 = 1.11. For validation, weperformed a separate classification on each time point of each trial to obtain one course ofclassification accuracy per participant.
Proceedings of the 6th International Brain-Computer Interface Conference 2014 DOI:10.3217/978-3-85125-378-8-61
Published by Graz University of Technology Publishing House Article ID 061-2
Random Forests and analytic-shrinkage-regularized linear discriminant analysis.RF denotes for an ensemble classifier comprising of many decision trees. The decision treesare decorrelated by random processes during their construction. A majority voting of the treesdefines the forests’ decision. The voting is an important step as it reduces the variance of theforest which is commonly high for individual trees. This is a kind of regularization and improvesthe accuracy of a forests dramatically when compared with any single decision tree [2]. Due toour experience with the RF classifier, we chose to build 1000 trees per classifier and used thestandard value for randomly drawn features per node (
√#offeatures).
A comparison of the RF classifier with a non-regularized classifier is unfair since the RFclassifier is regularized by nature. Hence, we chose an sLDA classifier for comparison. Shrinkageis a common remedy for achieving well conditioned covariance matrices even when the data ishigh-dimensional and only a few data points are given. For further information on sLDA, pleasesee [1].
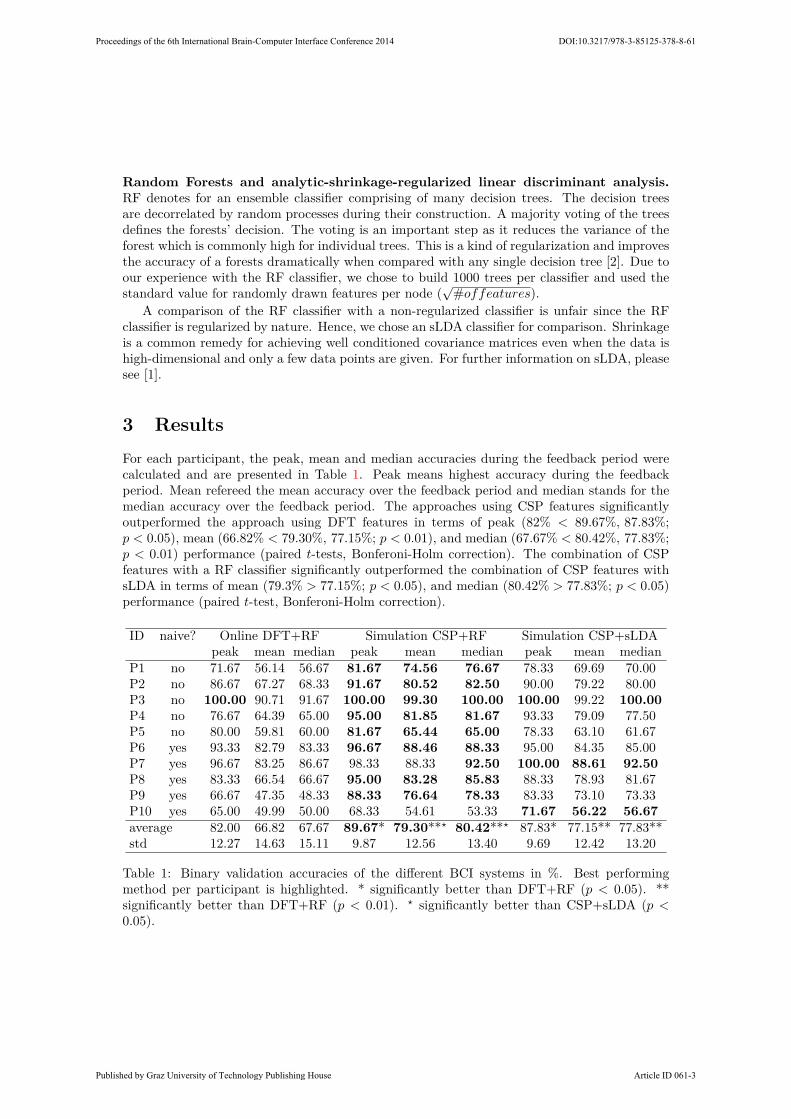
3 ResultsFor each participant, the peak, mean and median accuracies during the feedback period werecalculated and are presented in Table 1. Peak means highest accuracy during the feedbackperiod. Mean refereed the mean accuracy over the feedback period and median stands for themedian accuracy over the feedback period. The approaches using CSP features significantlyoutperformed the approach using DFT features in terms of peak (82% < 89.67%, 87.83%;p < 0.05), mean (66.82% < 79.30%, 77.15%; p < 0.01), and median (67.67% < 80.42%, 77.83%;p < 0.01) performance (paired t-tests, Bonferoni-Holm correction). The combination of CSPfeatures with a RF classifier significantly outperformed the combination of CSP features withsLDA in terms of mean (79.3% > 77.15%; p < 0.05), and median (80.42% > 77.83%; p < 0.05)performance (paired t-test, Bonferoni-Holm correction).
ID naive? Online DFT+RF Simulation CSP+RF Simulation CSP+sLDApeak mean median peak mean median peak mean median
P1 no 71.67 56.14 56.67 81.67 74.56 76.67 78.33 69.69 70.00P2 no 86.67 67.27 68.33 91.67 80.52 82.50 90.00 79.22 80.00P3 no 100.00 90.71 91.67 100.00 99.30 100.00 100.00 99.22 100.00P4 no 76.67 64.39 65.00 95.00 81.85 81.67 93.33 79.09 77.50P5 no 80.00 59.81 60.00 81.67 65.44 65.00 78.33 63.10 61.67P6 yes 93.33 82.79 83.33 96.67 88.46 88.33 95.00 84.35 85.00P7 yes 96.67 83.25 86.67 98.33 88.33 92.50 100.00 88.61 92.50P8 yes 83.33 66.54 66.67 95.00 83.28 85.83 88.33 78.93 81.67P9 yes 66.67 47.35 48.33 88.33 76.64 78.33 83.33 73.10 73.33P10 yes 65.00 49.99 50.00 68.33 54.61 53.33 71.67 56.22 56.67average 82.00 66.82 67.67 89.67* 79.30**? 80.42**? 87.83* 77.15** 77.83**std 12.27 14.63 15.11 9.87 12.56 13.40 9.69 12.42 13.20
Table 1: Binary validation accuracies of the different BCI systems in %. Best performingmethod per participant is highlighted. * significantly better than DFT+RF (p < 0.05). **significantly better than DFT+RF (p < 0.01). ? significantly better than CSP+sLDA (p <0.05).
Proceedings of the 6th International Brain-Computer Interface Conference 2014 DOI:10.3217/978-3-85125-378-8-61
Published by Graz University of Technology Publishing House Article ID 061-3
4 Discussion and ConclusionBy using CSP features instead of DFT features, the average peak, mean and median perfor-mance during the feedback period was significantly improved from 82% to 89.7%, from 66.8%to 79.3% and from 67.7% to 80.4%, respectively when combined with a RF classifier and from82% to 87.3%, from 66.8% to 77.2% and from 67.7% to 77.8%, respectively when combined withan sLDA classifier. It is not surprising that an optimized spatial filtering outperforms the DFTfeatures. CSP features have a higher signal-to-noise ratio and are therefore easier to classify.For example, the peak classification accuracy of one participant was improved by ∼ 22% (Table1, P9). However, our results show that a RF classifier can make better use of CSP featuresthan an sLDA classifier, at least for the present data. This is remarkable, as the RF classifierrelies on a complex, non-linear model and the trials-to-features ratio is low (100/90 = 1.11).The effect of using a RF classifier instead of a sLDA classifier is small (peak ∼ 2%, mean ∼ 2%,median ∼ 3%), but statistically significant for mean and median performance and consistentover the participants. For 8 of the 10 participants the combination of a RF classifier with CSPfeatures is the best performing method. For participant P7 the combination of sLDA with CSPfeatures performed slightly better, but not in median performance. For participant P10, bothmethods failed, since the achieved performance is around 70% only. The enhancement of thesustained (i.e. mean and median) performance is of particular importance, as the Graz-BCIparadigm calls for these. Concluding, the present work on performance, in combination withprevious work on RF classifiers as powerful tools for data analysis [7], underlines the potentialof the RF classifier in the field of BCIs. Further, we argue that the widespread view that linearmethods are ideal for BCIs should be reconsidered.
AcknowledgementsThis work is partly supported by the FP7 research projects BackHome (No. 288566) and ABC(No. 287774). This paper only reflects the authors’ views and funding agencies are not liablefor any use that may be made of the information contained herein.
References[1] B. Blankertz, S. Lemm, M. Treder, S. Haufe, and K.-R. Muller. Single-trial analysis and classifica-
tion of ERP components - a tutorial. Neuroimage, 56:814–825, 2011.[2] L. Breiman. Random forests. Mach. Learn., 45:5–32, 2001.[3] K. R. Muller, C. W. Anderson, and G. E. Birch. Linear and nonlinear methods for brain-computer
interfaces. IEEE Trans. Neural Syst. Rehabil. Eng., 11:165–9, 2003.[4] G. Pfurtscheller and C. Neuper. Motor imagery and direct brain-computer communication. Proc.
IEEE, 5(89):1123–1134, 2001.[5] H. Ramoser, J. Muller-Gerking, and G. Pfurtscheller. Optimal spatial filtering of single trial EEG
during imagined hand movement. IEEE Trans. Rehab. Eng., 8(4):441–446, 2000.[6] R. Scherer, G. Pfurtscheller, and C. Neuper. Motor imagery induced changes in oscillatory EEG
components: speed vs. accuracy. In Proc. of the 4th International Brain-Computer Interface Work-shop and Training Course 2008, pages 186–190, Graz, Austria, 2008. Verlag der Technischen Uni-versitat Graz.
[7] D. Steyrl, R. Scherer, and G. R. Muller-Putz. Random forests for feature selection in non-invasivebrain-computer interfacing. In HCI-KDD 2013, Lecture Notes in Comput. Sci., 7947, pages 207–216, Berlin Heidelberg, 2013. Springer.
Proceedings of the 6th International Brain-Computer Interface Conference 2014 DOI:10.3217/978-3-85125-378-8-61
Published by Graz University of Technology Publishing House Article ID 061-4