motor carrier safety survey - missouri department of ... · motor carrier safety survey july 10,...
TRANSCRIPT

Initial Report
TRyy1025a
Motor Carrier Safety Survey
Prepared for Missouri Department of Transportation
Organizational Results
By
Lance Gentry, Ph.D., M.B.A.
July 2010
The opinions, findings, and conclusions expressed in this publication are those of the principal investigators and the Missouri Department of Transportation. They are not necessarily those of the U.S. Department of Transportation, Federal Highway Administration. This report does not constitute a standard or regulation.

TECHNICAL REPORT DOCUMENTATION PAGE
1. Report No. TRyy1025a 2. Government Accession No. 3. Recipient's Catalog No. 4. Title and Subtitle 5. Report Date Motor Carrier Safety Survey
July 10, 2010 6. Performing Organization Code
7. Author(s) 8. Performing Organization Report No. Lance C. Gentry, Ph.D., M.B.A. 9. Performing Organization Name and Address 10. Work Unit No. Missouri Department of Transportation Research, Development and Technology P. O. Box 270-Jefferson City, MO 65102
11. Contract or Grant No. TRyy1025
12. Sponsoring Agency Name and Address 13. Type of Report and Period Covered Missouri Department of Transportation Research, Development and Technology P. O. Box 270-Jefferson City, MO 65102
Initial Report 14. Sponsoring Agency Code
15. Supplementary Notes The investigation was conducted in cooperation with the U. S. Department of Transportation, Federal Highway Administration. 16. Abstract 193 commercial drivers were surveyed to capture their current attitudes and awareness of specific items concerning highway safety. The research focused on seatbelt usage and related attitudes, but other elements of motor carrier highway safety were also measured. 17. Key Words 18. Distribution Statement Commercial driver survey, motor carriers, highway safety, seat belts, safety concerns
No restrictions. This document is available to the public through National Technical Information Center, Springfield, Virginia 22161
19. Security Classification (of this report) 20. Security Classification (of this page) 21. No. of Pages 22. Price Unclassified Unclassified
Form DOT F 1700.7 (06/98)

i
Table of Contents
LIST OF TABLES ................................................................................................................................................... II
LIST OF FIGURES ................................................................................................................................................ III
OBJECTIVES ........................................................................................................................................................ 1
TECHNICAL APPROACH ....................................................................................................................................... 1
RESULTS AND DISCUSSION ................................................................................................................................. 2
SEAT BELT USAGE ........................................................................................................................................................... 2 SAFETY CONCERNS .......................................................................................................................................................... 5 TRUST .......................................................................................................................................................................... 9
APPENDIX A: SURVEY QUESTIONS .................................................................................................................. A‐1
RESEARCH QUESTIONS ................................................................................................................................................. A‐2 DEMOGRAPHIC QUESTIONS .......................................................................................................................................... A‐5
APPENDIX B: DEMOGRAPHICS ........................................................................................................................ B‐1
TRUCK OPERATIONS .................................................................................................................................................... B‐1 DRIVER DEMOGRAPHICS .............................................................................................................................................. B‐4

ii
List of Tables Table 1: Motor Carrier Seatbelt Usage ......................................................................................................................... 2 Table 2: Perceived Chance of Obtaining Ticket for Violating Seat Belt Laws ............................................................ 2 Table 3: Why I Use a Seatbelt ...................................................................................................................................... 3 Table 4: Why I Don’t Use a Seatbelt ............................................................................................................................ 3 Table 5: Safety Concerns about Passenger Vehicle Drivers ......................................................................................... 5 Table 6: Safety Concerns about Commercial Drivers .................................................................................................. 6 Table 7: Trust in MCS .................................................................................................................................................. 9 Table 8: Truck Operations: Location ....................................................................................................................... B-1 Table 9: Truck Operations: Type of Vehicle ........................................................................................................... B-1 Table 10: Truck Operations: Straight Truck Type ................................................................................................... B-2 Table 11: Truck Operations: Combination Vehicle Type ........................................................................................ B-3 Table 12: Demographics: Age Groups .................................................................................................................... B-4 Table 13: Demographics: Gender ............................................................................................................................ B-4 Table 14: Demographics: Residence ....................................................................................................................... B-4 Table 12: Demographics: Ethnicity ......................................................................................................................... B-5 Table 13: Demographics: Household Income .......................................................................................................... B-5

iii
List of Figures Figure 1: Concerns about Passenger Vehicle Drivers vs. Commercial Drivers ............................................................ 8 Figure 2: Survey Welcome ...................................................................................................................................... A-1 Figure 3: Questions 1 and 2 ..................................................................................................................................... A-2 Figure 4: Question 1 Supplemental: Why I Use a Seatbelt ..................................................................................... A-3 Figure 5: Question 1 Supplemental: Why I Don’t Use a Seatbelt .......................................................................... A-3 Figure 6: Question 3: Safety Concerns about Passenger Vehicle Drivers .............................................................. A-4 Figure 7: Question 4: Safety Concerns about Commercial Drivers ........................................................................ A-4 Figure 8: Question 5: Trust in MCS ....................................................................................................................... A-5 Figure 9: Questions A and B: Truck Operations .................................................................................................... A-5 Figure 10: Question B1: Straight Truck Type ........................................................................................................ A-6 Figure 11: Question B2: Combination Vehicle Type ............................................................................................. A-6 Figure 12: Age, Gender, and Residence .................................................................................................................. A-7 Figure 13: Ethnicity and Household Income ........................................................................................................... A-7

1
Objectives
This research was intended to measure and evaluate the current attitudes and awareness of commercial drivers concerning highway safety. The research focused on seatbelt usage and related attitudes, but other elements of motor carrier highway safety were also measured.
Technical Approach
MoDOT Motor Carrier Services (MCS) and Heartland Market Research LLC (Heartland) jointly developed the surveys questions using the questions MoDOT developed for the June 2010 Highway Safety Driver Survey as a starting point. Heartland programmed these questionnaires into an online survey with two skip patterns to probe reasons for particular answers. A copy of the survey is available in Appendix A.
The survey list for research was developed by starting with every single MCS client with an email address who had conducted business with MoDOT in fiscal year 2010. This provided a list of 40,489 email addresses. After eliminating duplicates, the number of unique email addresses was 7,139. Since the focus of the research was motor carriers, 220 email addresses that obviously belonged to permit services, such as [email protected], were eliminated. The resulting list of 7,139 names was then fed into an email validation program which reduced this list to 1,866 working email addresses.
On the morning of June 21, 2010 an invitation to participate in the survey was emailed to all 1,866 people on the list. Heartland only received 95 failure to deliver messages (a failure rate of just 5.1%). Each failure to deliver was due to one of the following problems: bad email address (rare), email mailbox was full (common), or antispam software blocked survey (common). 193 survey responses were obtained by July 8, a response rate of 10.9% (193 responses divided by the 1,771 emails that were successfully sent). A response rate of 10.9% is high for an online survey and probably reflects both a high respondent interest in the subject and an overall willingness to provide information for MoDOT.

2
Results and Discussion
With a survey size of 193, the general margin of error at a 95% level of confidence is 7.05%.
Seat Belt Usage
Depending upon their opinions, respondents answered two, three, or four questions pertaining to their behavior and thoughts concerning seat belts.
Question 1: How often do you use seat belts when you drive or ride commercially?
The vast majority of drivers always wore their seatbelts (84.4%). Another 10.4% wore them most of the time. 97.4% of the drivers wore their seatbelts at least half of the time.
Table 1: Motor Carrier Seatbelt Usage How often do you use seat belts when you drive or ride commercially?
Frequency Percent Always 162 84.4%Most of the Time 20 10.4%Half of the Time 5 2.6%Rarely 4 2.1%Never 1 0.5%Total 192 100.0%
Question 2: What do you think the chances are of getting a ticket if you don't wear your safety belt?
A plurality (32.6%) of commercial drivers thought they would receive a ticket about half of time if they did not wear their seatbelt. 72.1% thought they would receive a ticket at least half of the time if they did not comply with the seatbelt law.
Table 2: Perceived Chance of Obtaining Ticket for Violating Seat Belt Laws What do you think the chances are of getting a ticket if you don't wear your safety
belt? Frequency Percent
Always 26 13.7%Most of the Time 49 25.8%Half of the Time 62 32.6%Rarely 51 26.8%Never 2 1.1%Total 190 100.0%

3
Question 1 Supplemental: Why I Use a Seatbelt: Pick the most accurate statements (select as many as apply) - I use a seat belt...
The most popular (38.6%) reason given for wearing a seatbelt was to comply with the law and company policy. However, three of the options were variants on prompting the driver to think about it (if I happen to think about it, when someone reminds me to buckle up, and when I see a sign that reminds me to buckle up). These three reminder options totaled almost half (47.7%) of the responses, indicating that reminders such as public service announcements are effective.
Table 3: Why I Use a Seatbelt Pick the most accurate statements (select as many as apply) - I use a seat belt...
Frequency Percent ...if I happen to think about it 10 22.7%...only in a passenger vehicle 3 6.8%...only in a commercial motor vehicle 3 6.8%...only because I have to - law and company policy 17 38.6%...when someone reminds me to buckle up 7 15.9%...when I see a sign that reminds me to buckle up 4 9.1%Total 44 100.0%
Question 1 Supplemental: Why I Don’t Use a Seatbelt: Pick the most accurate statements (select as many as apply) - I don’t use a seat belt...
The most frequent reason (29.5%) for not wearing a seatbelt was because of how tight or constraining the seatbelt makes some people feel.
Table 4: Why I Don’t Use a Seatbelt Pick the most accurate statements (select as many as apply) - I don't use a seat belt...
Frequency Percent ...because I forget 9 20.5%...on principle 3 6.8%...because it is too tight or constraining 13 29.5%...because I'm in and out of the vehicle a lot 10 22.7%...because of stories I've heard 2 4.5%...other 7 15.9%Total 44 100.0%

4
Question 1 Supplemental: Why I Don’t Use a Seatbelt - Other: If you selected OTHER above, please elaborate.
Respondents who answered “other” to the previous question were given the opportunity to elaborate. The responses of those who did so are presented here as they were entered by the drivers.
Because of the condition I work in ( dirt, grease, etc.)
I know driving is a privilege but im not killing or hurting anyone but myself. That’s why I sometimes I don’t wear one.
I seen an accident and was first on the scene to find a seat belt had cut the man's throat and he bleed to death while I was trying to hold his juggler vein together until emergency personnel got there.
I'm short and the belt doesn’t sit on my shoulder, it hits my neck
Should be my own choice of if I want to wear it just like if I want to all my vegetables or not. Do not need to be told what to do and people live by them just as much as they die by them
Three back surgeries, hurts like hell!
5
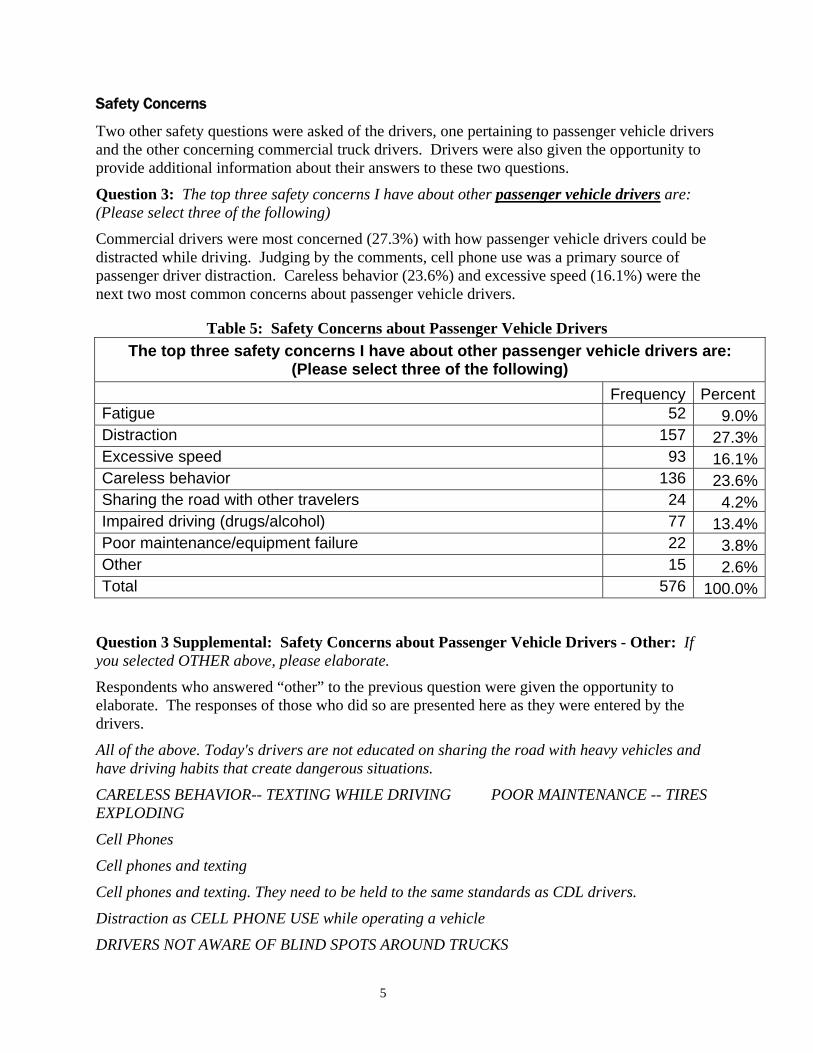
Safety Concerns
Two other safety questions were asked of the drivers, one pertaining to passenger vehicle drivers and the other concerning commercial truck drivers. Drivers were also given the opportunity to provide additional information about their answers to these two questions.
Question 3: The top three safety concerns I have about other passenger vehicle drivers are: (Please select three of the following)
Commercial drivers were most concerned (27.3%) with how passenger vehicle drivers could be distracted while driving. Judging by the comments, cell phone use was a primary source of passenger driver distraction. Careless behavior (23.6%) and excessive speed (16.1%) were the next two most common concerns about passenger vehicle drivers.
Table 5: Safety Concerns about Passenger Vehicle Drivers
The top three safety concerns I have about other passenger vehicle drivers are: (Please select three of the following)
Frequency Percent Fatigue 52 9.0%Distraction 157 27.3%Excessive speed 93 16.1%Careless behavior 136 23.6%Sharing the road with other travelers 24 4.2%Impaired driving (drugs/alcohol) 77 13.4%Poor maintenance/equipment failure 22 3.8%Other 15 2.6%Total 576 100.0%
Question 3 Supplemental: Safety Concerns about Passenger Vehicle Drivers - Other: If you selected OTHER above, please elaborate.
Respondents who answered “other” to the previous question were given the opportunity to elaborate. The responses of those who did so are presented here as they were entered by the drivers.
All of the above. Today's drivers are not educated on sharing the road with heavy vehicles and have driving habits that create dangerous situations.
CARELESS BEHAVIOR-- TEXTING WHILE DRIVING POOR MAINTENANCE -- TIRES EXPLODING
Cell Phones
Cell phones and texting
Cell phones and texting. They need to be held to the same standards as CDL drivers.
Distraction as CELL PHONE USE while operating a vehicle
DRIVERS NOT AWARE OF BLIND SPOTS AROUND TRUCKS

6
Elderly drivers causing congestion and their ability to enter and exit the roads.
I don't worry about other people or companies.
Lack of Missouri State Patrol to stop large trucking companies trucks that break every rule for fear of being reprimanded. They prefer to pick on small companies because they don't have the power that large companies. In our county everyone thinks the State Patrol is scared and hides out rather than being out on the road stopping these law breakers and dangerous drivers. It’s not uncommon to see Beelman trucks run 75+ mph on narrow two lane highways. You will never see a state patrolman stop a Beelman truck for fear of being transferred.
My first concern is talking and texting on cell phones.
people in cars and trucks texting and talking on cell phones, not paying attention to what they’re doing
poor education of driving skills, do not look far enough ahead, texting very big problem.
rocks coming out of the bottom half of dump trucks under the tail gate when they hit a bump in the highway!
texting and talking on the phone
texting while driving talking on cell phones
Question 4: The top three safety concerns I have about other commercial drivers are: (Please select three of the following)
As with concerns about passenger vehicle drivers, distracted driving (23.7%) heads the list of concerns about other commercial drivers. Judging by the comments, cell phone use was also a primary source of commercial driver distraction. Fatigue (21.8%) and careless behavior (17.3%) were the next two most common concerns about commercial vehicle drivers.
Table 6: Safety Concerns about Commercial Drivers
The top three safety concerns I have about other commercial drivers are: (Please select three of the following)
Frequency Percent Fatigue 121 21.8%Distraction 132 23.7%Excessive speed 55 9.9%Careless behavior 96 17.3%Sharing the road with other travelers 39 7.0%Impaired driving (drugs/alcohol) 31 5.6%Poor maintenance/equipment failure 74 13.3%Other 8 1.4%Total 556 100.0%

7
Question 4 Supplemental: Safety Concerns about Commercial Drivers - Other: If you selected OTHER above, please elaborate.
Respondents who answered “other” to the previous question were given the opportunity to elaborate. The responses of those who did so are presented here as they were entered by the drivers.
1 - Operators that can't speak or comprehend English creates confusion. 2 - I don't worry about other people or companies, none of my business.
Cell phones
company drivers that have no respect for anyone.
Distraction as in CELL PHONE USE while operating an 89,000 pound lethal weapon.
I believe shippers and receivers should be made more responsible for making and keeping appointment times so that drivers are able to manage their time better.
I put it on the other question, the rock coming out of dump trucks under the tail gates!
inexperience and selfish driving habits
improperly trained drivers and ones that should never been allowed behind the wheel of a semi.
NOT CHECKING THEIR BLIND SPOTS
OTHER TRAVELERS NOT UNDERSTANDING BLIND SPOTS, CUTTING OFF TRUCKS, AND NOT ALLOWING TRUCKS ROOM TO MERGE OR MAKE TURNS.
talking & texting on cell phones
use of cell phones while driving
8
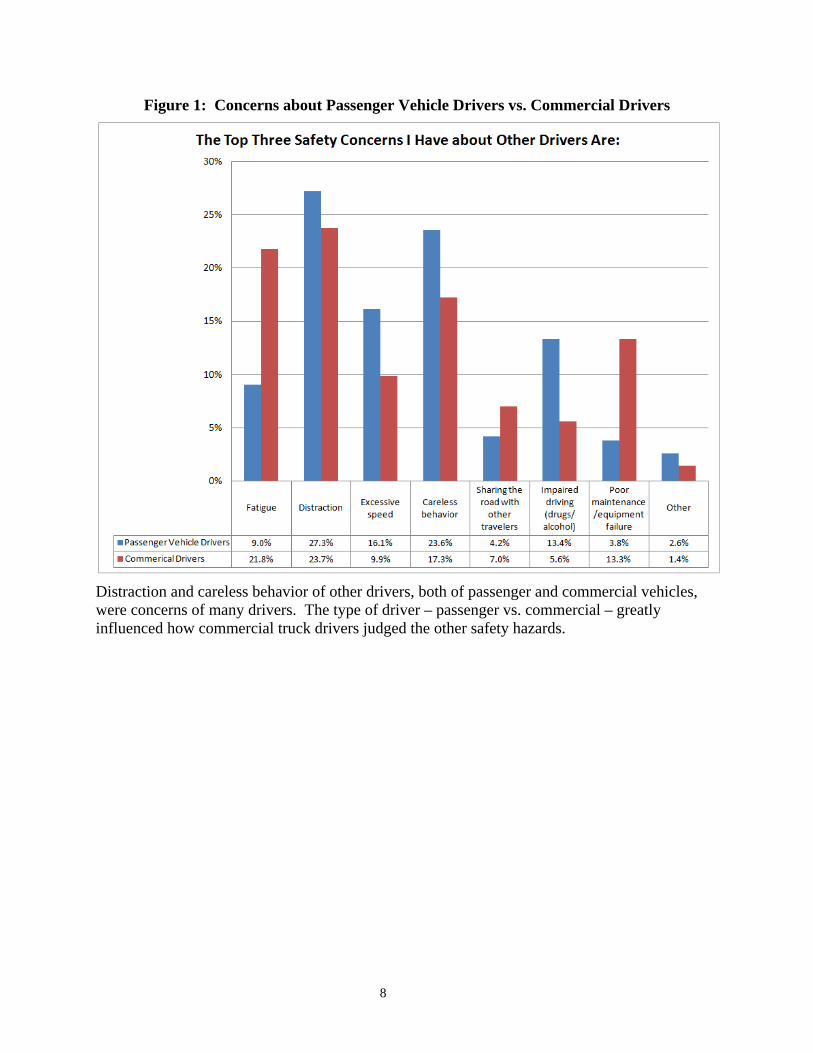
Figure 1: Concerns about Passenger Vehicle Drivers vs. Commercial Drivers
Distraction and careless behavior of other drivers, both of passenger and commercial vehicles, were concerns of many drivers. The type of driver – passenger vs. commercial – greatly influenced how commercial truck drivers judged the other safety hazards.

9
Trust
One question was asked about how the drivers felt about MCS.
Question 5: How much do you trust MoDOT Motor Carrier Services?
95.8% of the commercial drivers trusted MoDOT’s MCS. Judging by the comments, some commercial drivers associate MCS with Highway Troopers.
Table 7: Trust in MCS How much do you trust MoDOT Motor Carrier Services?
Frequency Percent Very much trust 115 60.2%Somewhat trust 68 35.6%Somewhat distrust 5 2.6%Very much distrust 3 1.6%Total 191 100.0%
Question 5 Supplemental: If you wish to explain why you trust (or do not trust) MoDOT, the following will provided to MoDOT exactly as you type it.
Respondents were given the opportunity to provide information on why they did or did not trust MCS. The responses of those who did so are presented here as they were entered by the drivers.
Dots think they are kings of the road and treat drivers like criminals even if they are pulling you over for no seat belt, or petty stuff like that.
Have no reason yet not to trust.
Have not been given reason not to trust.
haven't dealt with you enough to build any kind of trust
Highway patrol Troopers are highly trusted. Not so much Fixed Weight Scale Troopers.
I know DOT is out there trying to keep all safe, by inspections and proper paper work. I respect them for that. I know they are just doing their job when they stop us. Just like we are doing our job.
I see DOT pull over nice trucks, when trucks that you can see need to be pulled over drive right by. It seems that if a truck goes by that has problems they just don't want to deal with it. Some of the dump trucks are held together by duck tape and wire and you never see them getting stoped. Why do we see a new truck getting stopped and a 15 year old truck roll on by?
if you have a question all you have to do is ask
The law is interpreted by each officer in his own way. What is ok with one is not with the other. I have had officers delay myself and our drivers on several occasions for several hours while they try to determine if something is ok or not. I feel they are usually concerned more with collecting a fine than they are about keeping roads safe.

10
They have a lot less road side checks. I have trucks that travel in Kansas and they are check at least once a year, while in Missouri we have maybe one roadside check every two years and I have nine trucks that travel in both states.
They have been exceptionally helpful every time I contact them.
TRUST WITH WHAT
When stopped for checks we have spent as much as 2 hours waiting while too few individuals work on too many trucks during major check point operations.
But I don't think we have the man power to keep the bad drivers and none speaking English ones off the road or do the inspections as needed for safety.

A-1
Appendix A: Survey Questions
Each motor carrier received an email inviting them to participate in a brief survey. The email included a link to an online survey. Screen shots from the actual survey are presented here.
Figure 2: Survey Welcome

A-2
Research Questions
Figure 3: Questions 1 and 2
Question 1 was used to determine which questions the respondent was asked next. If the respondents always wore a seatbelt, they were taken to Question 3 after answering questions 1 and 2. If the respondents never wore a seatbelt, they were taken to Question 1 Supplemental: Why I Don’t Use a Seatbelt. The respondents who sometimes wore a seatbelt were asked both supplemental questions – both why they did and did not wear their seatbelt.

A-3
Figure 4: Question 1 Supplemental: Why I Use a Seatbelt
Figure 5: Question 1 Supplemental: Why I Don’t Use a Seatbelt
A-4
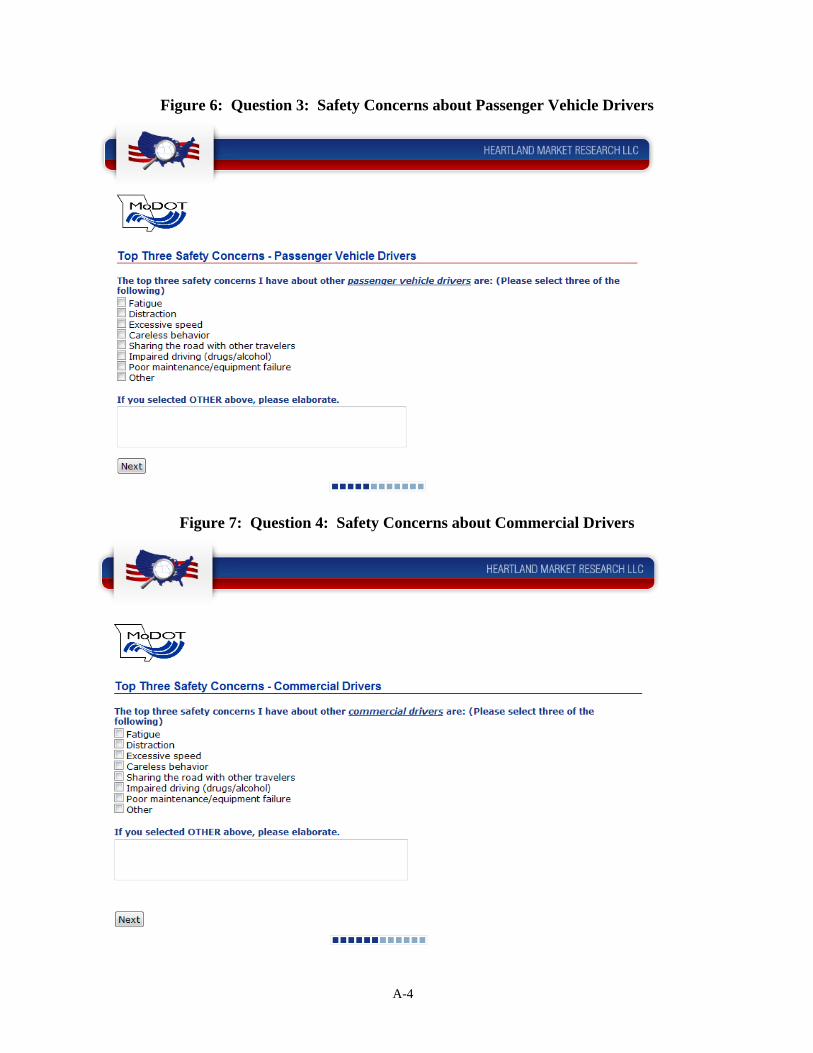
Figure 6: Question 3: Safety Concerns about Passenger Vehicle Drivers
Figure 7: Question 4: Safety Concerns about Commercial Drivers

A-5
Figure 8: Question 5: Trust in MCS
Demographic Questions
Figure 9: Questions A and B: Truck Operations
A-6
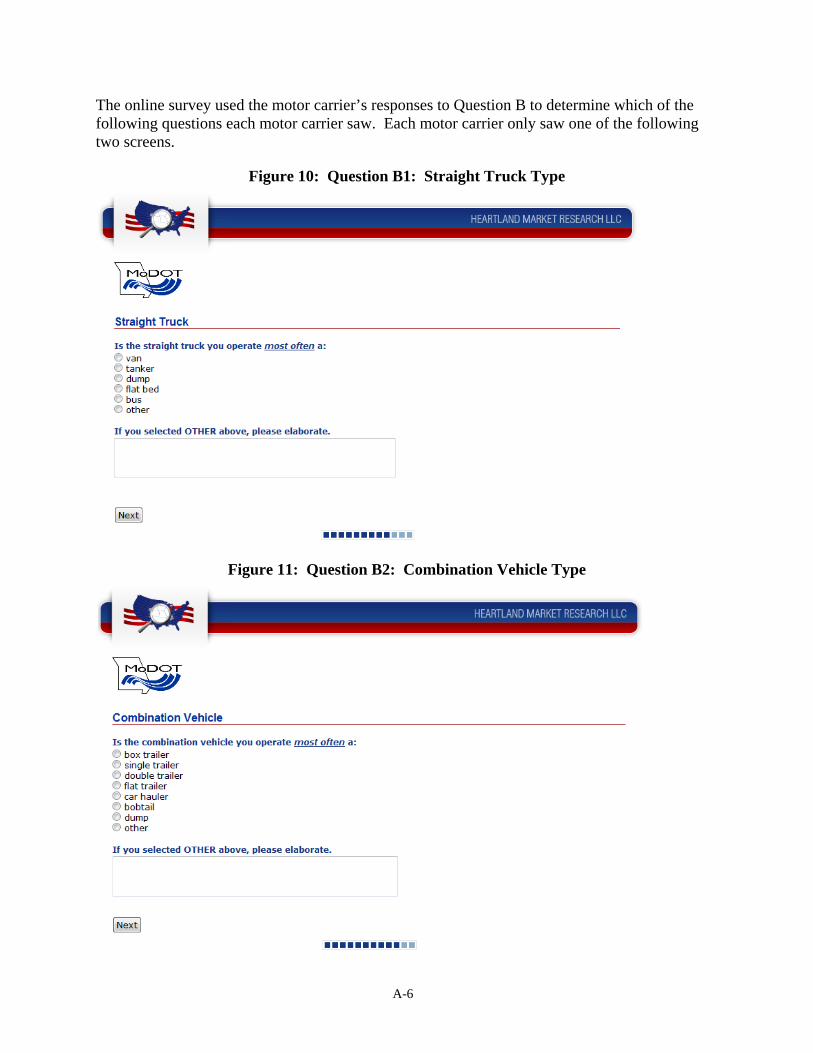
The online survey used the motor carrier’s responses to Question B to determine which of the following questions each motor carrier saw. Each motor carrier only saw one of the following two screens.
Figure 10: Question B1: Straight Truck Type
Figure 11: Question B2: Combination Vehicle Type

A-7
Figure 12: Age, Gender, and Residence
Figure 13: Ethnicity and Household Income

B-1
Appendix B: Demographics
Truck Operations
Each respondent was asked three of four possible questions concerning their truck operations. The first two questions were asked of all drivers and then the drivers were asked a follow-up question about the specific type of truck they drove most often. Drivers were also given the opportunity to elaborate if they indicated they drove an “other” type of truck.
Question A: I operate...
The vast majority (87.0%) of the drivers surveyed operated in more than just Missouri.
Table 8: Truck Operations: Location I operate...
Frequency Percent ...within Missouri only 25 13.0%...interstate 167 87.0%Total 192 100.0%
Question B: The truck type I operate most often is a
The majority (78.1%) of the commercials primarily operated a combination vehicle.
Table 9: Truck Operations: Type of Vehicle The truck type I operate most often is a
Frequency Percent Straight truck 42 21.9%Combination vehicle 150 78.1%Total 192 100.0%

B-2
Question B1: Is the straight truck you operate most often a
Table 10: Truck Operations: Straight Truck Type Is the straight truck you operate most often a:
Frequency Percent van 10 23.8%dump 6 14.3%flat bed 13 31.0%bus 2 4.8%other 11 26.2%Total 42 100.0%
Question B1 Supplemental: If you selected OTHER above, please elaborate.
Respondents who answered “other” to the previous question were given the opportunity to elaborate. The responses of those who did so are presented here as they were entered by the drivers.
26 ft straight, 26,000 lbs
box truck
concrete mixer
Concrete Pump Truck
derrick or aerial device
Electrical, digger derrick
Mixer truck
Motorcoaches
operate both van and flatbed
pickup
Pickup
Wrecker

B-3
Question B2: Is the combination vehicle you operate most often a:
Table 11: Truck Operations: Combination Vehicle Type Is the combination vehicle you operate most often a:
Frequency Percent box trailer 22 14.8%single trailer 45 30.2%double trailer 4 2.7%flat trailer 45 30.2%car hauler 4 2.7%dump 5 3.4%other 24 16.1%Total 149 100.0%
Question B2 Supplemental: If you selected OTHER above, please elaborate.
Respondents who answered “other” to the previous question were given the opportunity to elaborate. The responses of those who did so are presented here as they were entered by the drivers.
cement tankers and end dumps
Drop Deck Lowboy Trailer moving oversize equipment
gooseneck
Grain hopper
grain hopper
grain trailer
Grain trailer with hopper bottoms
hopper bottom
Hopper Bottom
LIVESTOCK CATTLE TRAILER
low boy
low boy Heavy hauler
LOWBOY MOVING HEAVY EQUIPMENT
Manufactured & Modular homes
marine transport trailer . Lowboy
mobile homes
Motorcoach
O/S- wide double drop
rgn

B-4
RGN(double drop)
SADDLEMOUNT
tanker
Driver Demographics
Question C: What is your age?
Table 12: Demographics: Age Groups What is your age?
Frequency Percent 18-29 years old 8 4.3%30-39 years old 33 17.7%40-49 years old 54 29.0%50-64 years old 82 44.1%65+ years old 9 4.8%Total 186 100.0%
Question D: Are you male or female?
Table 13: Demographics: Gender Are you male or female?
Frequency Percent male 148 80.0%female 37 20.0%Total 185 100.0%
Question E: Where do you currently live?
Table 14: Demographics: Residence Where do you currently live?
Frequency Percent Missouri 142 74.0%Other USA - not Missouri 43 22.4%Canada 4 2.1%Other 3 1.6%Total 192 100.0%
B-5
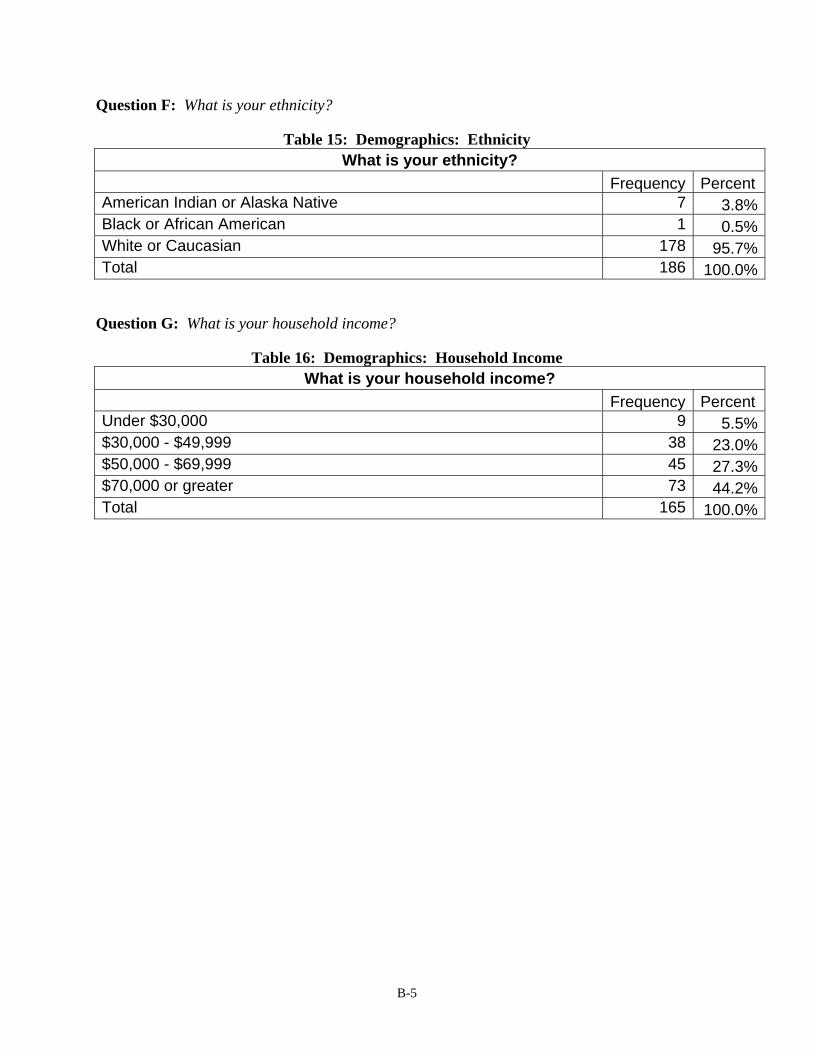
Question F: What is your ethnicity?
Table 15: Demographics: Ethnicity What is your ethnicity? Frequency Percent
American Indian or Alaska Native 7 3.8%Black or African American 1 0.5%White or Caucasian 178 95.7%Total 186 100.0%
Question G: What is your household income?
Table 16: Demographics: Household Income What is your household income?
Frequency Percent Under $30,000 9 5.5%$30,000 - $49,999 38 23.0%$50,000 - $69,999 45 27.3%$70,000 or greater 73 44.2%Total 165 100.0%