motion in one dimension - grade 10...3.3 chapter 3. motion in one dimension - grade 10 3.3...
TRANSCRIPT

Chapter 3
Motion in One Dimension - Grade
10
3.1 Introduction
This chapter is about how things move in a straight line or more scientifically how things move in
one dimension. This is useful for learning how to describe the movement of cars along a straightroad or of trains along straight railway tracks. If you want to understand how any object moves,for example a car on the freeway, a soccer ball being kicked towards the goal or your dog chasingthe neighbour’s cat, then you have to understand three basic ideas about what it means whensomething is moving. These three ideas describe different parts of exactly how an object moves.They are:
1. position or displacement which tells us exactly where the object is,
2. speed or velocity which tells us exactly how fast the object’s position is changing or morefamiliarly, how fast the object is moving, and
3. acceleration which tells us exactly how fast the object’s velocity is changing.
You will also learn how to use position, displacement, speed, velocity and acceleration to describethe motion of simple objects. You will learn how to read and draw graphs that summarise themotion of a moving object. You will also learn about the equations that can be used to describemotion and how to apply these equations to objects moving in one dimension.
3.2 Reference Point, Frame of Reference and Position
The most important idea when studying motion, is you have to know where you are. Theword position describes your location (where you are). However, saying that you are here ismeaningless, and you have to specify your position relative to a known reference point. Forexample, if you are 2 m from the doorway, inside your classroom then your reference point isthe doorway. This defines your position inside the classroom. Notice that you need a referencepoint (the doorway) and a direction (inside) to define your location.
3.2.1 Frames of Reference
Definition: Frame of Reference
A frame of reference is a reference point combined with a set of directions.
A frame of reference is similar to the idea of a reference point. A frame of reference is definedas a reference point combined with a set of directions. For example, a boy is standing still inside
23

3.2 CHAPTER 3. MOTION IN ONE DIMENSION - GRADE 10
a train as it pulls out of a station. You are standing on the platform watching the train movefrom left to right. To you it looks as if the boy is moving from left to right, because relativeto where you are standing (the platform), he is moving. According to the boy, and his frame of
reference (the train), he is not moving.
24

CHAPTER 3. MOTION IN ONE DIMENSION - GRADE 10 3.2
�
train moving from left to rightboy is standing still
From your frame of reference the boy is moving from left to right.
Figure 3.1: Frames of Reference
A frame of reference must have an origin (where you are standing on the platform) and at leasta positive direction. The train was moving from left to right, making to your right positive andto your left negative. If someone else was looking at the same boy, his frame of reference willbe different. For example, if he was standing on the other side of the platform, the boy will bemoving from right to left.
For this chapter, we will only use frames of reference in the x-direction. Frames of reference willbe covered in more detail in Grade 12.
A boy inside a train whichis moving from left to right
Where you are standingon the platform
(reference point or origin)
positive direction (towards your right)negative direction (towards your left)
3.2.2 Position
Definition: Position
Position is a measurement of a location, with reference to an origin.
A position is a measurement of a location, with reference to an origin. Positions can therefore benegative or positive. The symbol x is used to indicate position. x has units of length for examplecm, m or km. Figure 3.2.2 shows the position of a school. Depending on what reference pointwe choose, we can say that the school is 300 m from Joan’s house (with Joan’s house as thereference point or origin) or 500 m from Joel’s house (with Joel’s house as the reference pointor origin).
100 m 100 m 100 m 100 m 100 m 100 m
ShopSchool Jack John Joan Jill Joel
Figure 3.2: Illustration of position
The shop is also 300 m from Joan’s house, but in the opposite direction as the school. Whenwe choose a reference point, we have a positive direction and a negative direction. If we choose
25

3.2 CHAPTER 3. MOTION IN ONE DIMENSION - GRADE 10
+300 +200 +100 0 -100 -200 -300
SchoolJoan’s house
(reference point) Shop
x (m)
Figure 3.3: The origin is at Joan’s house and the position of the school is +300 m. Positionstowards the left are defined as positive and positions towards the right are defined as negative.
the direction towards the school as positive, then the direction towards the shop is negative. Anegative direction is always opposite to the direction chosen as positive.
Activity :: Discussion : Reference Points
Divide into groups of 5 for this activity. On a straight line, choose a refer-ence point. Since position can have both positive and negative values, discuss theadvantages and disadvantages of choosing
1. either end of the line,
2. the middle of the line.
This reference point can also be called “the origin”.
Exercise: Position
1. Write down the positions for objects at A, B, D and E. Do not forget the units.
-4 -3 -2 -1 0 1 2 3 4x (m)
reference pointA B D E
2. Write down the positions for objects at F, G, H and J. Do not forget the units.
-4-3-2-101234x (m)
reference pointF G H J
3. There are 5 houses on Newton Street, A, B, C, D and E. For all cases, assumethat positions to the right are positive.
20 m 20 m 20 m 20 m
A B C D E
26

CHAPTER 3. MOTION IN ONE DIMENSION - GRADE 10 3.2
(a) Draw a frame of reference with house A as the origin and write down thepositions of houses B, C, D and E.
(b) You live in house C. What is your position relative to house E?
(c) What are the positions of houses A, B and D, if house B is taken as thereference point?
27
3.3 CHAPTER 3. MOTION IN ONE DIMENSION - GRADE 10
3.3 Displacement and Distance
Definition: Displacement
Displacement is the change in an object’s position.
The displacement of an object is defined as its change in position (final position minus initialposition). Displacement has a magnitude and direction and is therefore a vector. For example,if the initial position of a car is xi and it moves to a final position of xf , then the displacementis:
xf − xi
However, subtracting an initial quantity from a final quantity happens often in Physics, so weuse the shortcut Δ to mean final - initial. Therefore, displacement can be written:
Δx = xf − xi
Important: The symbol Δ is read out as delta. Δ is a letter of the Greek alphabet and isused in Mathematics and Science to indicate a change in a certain quantity, or a final valueminus an initial value. For example, Δx means change in x while Δt means change in t.
Important: The words initial and final will be used very often in Physics. Initial will alwaysrefer to something that happened earlier in time and final will always refer to somethingthat happened later in time. It will often happen that the final value is smaller than theinitial value, such that the difference is negative. This is ok!
�
�
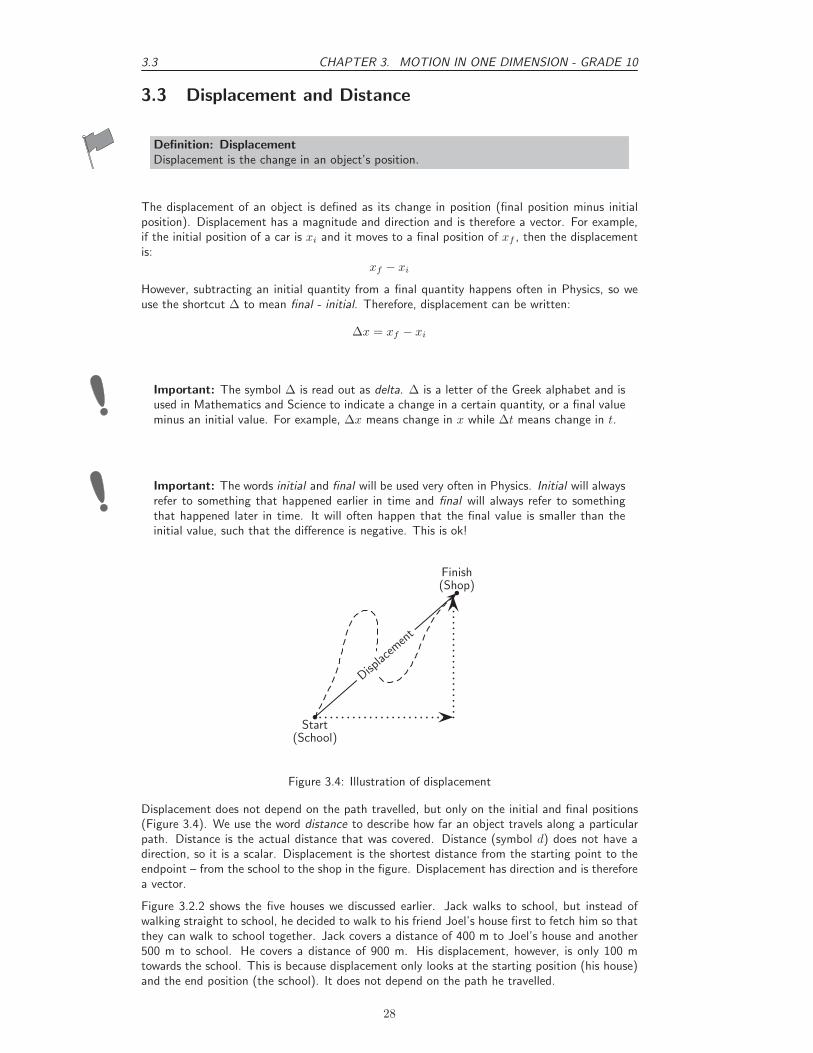
Start(School)
Finish(Shop)
Displac
emen
t
Figure 3.4: Illustration of displacement
Displacement does not depend on the path travelled, but only on the initial and final positions(Figure 3.4). We use the word distance to describe how far an object travels along a particularpath. Distance is the actual distance that was covered. Distance (symbol d) does not have adirection, so it is a scalar. Displacement is the shortest distance from the starting point to theendpoint – from the school to the shop in the figure. Displacement has direction and is thereforea vector.
Figure 3.2.2 shows the five houses we discussed earlier. Jack walks to school, but instead ofwalking straight to school, he decided to walk to his friend Joel’s house first to fetch him so thatthey can walk to school together. Jack covers a distance of 400 m to Joel’s house and another500 m to school. He covers a distance of 900 m. His displacement, however, is only 100 mtowards the school. This is because displacement only looks at the starting position (his house)and the end position (the school). It does not depend on the path he travelled.
28

CHAPTER 3. MOTION IN ONE DIMENSION - GRADE 10 3.3
To calculate his distance and displacement, we need to choose a reference point and a direction.Let’s choose Jack’s house as the reference point, and towards Joel’s house as the positive direc-tion (which means that towards the school is negative). We would do the calculations as follows:
Distance(d) = path travelled
= 400 m + 500 m
= 900 m
Displacement(Δx) = xf − xi
= −100 m + 0 m
= −100 m
Joel walks to school with Jack and after school walks back home. What is Joel’s displacementand what distance did he cover? For this calculation we use Joel’s house as the reference point.Let’s take towards the school as the positive direction.
Distance(d) = path travelled
= 500 m + 500 m
= 1000 m
Displacement(Δx) = xf − xi
= 0 m + 0 m
= 0 m
It is possible to have a displacement of 0 m and a distance that is not 0 m. This happenswhen an object completes a round trip back to its original position, like an athlete runningaround a track.
3.3.1 Interpreting Direction
Very often in calculations you will get a negative answer. For example, Jack’s displacement inthe example above, is calculated as -100 m. The minus sign in front of the answer means thathis displacement is 100 m in the opposite direction (opposite to the direction chosen as positivein the beginning of the question). When we start a calculation we choose a frame of referenceand a positive direction. In the first example above, the reference point is Jack’s house and thepositive direction is towards Joel’s house. Therefore Jack’s displacement is 100 m towards theschool. Notice that distance has no direction, but displacement has.
3.3.2 Differences between Distance and Displacement
Definition: Vectors and Scalars
A vector is a physical quantity with magnitude (size) and direction. A scalar is a physicalquantity with magnitude (size) only.
The differences between distance and displacement can be summarised as:
Distance Displacement
1. depends on the path 1. independent of path taken2. always positive 2. can be positive or negative3. is a scalar 3. is a vector
Exercise: Point of Reference
1. Use Figure 3.2.2 to answer the following questions.
(a) Jill walks to Joan’s house and then to school, what is her distance anddisplacement?
(b) John walks to Joan’s house and then to school, what is his distance anddisplacement?
29

3.3 CHAPTER 3. MOTION IN ONE DIMENSION - GRADE 10
(c) Jack walks to the shop and then to school, what is his distance and dis-placement?
(d) What reference point did you use for each of the above questions?
2. You stand at the front door of your house (displacement, Δx = 0 m). Thestreet is 10 m away from the front door. You walk to the street and back again.
(a) What is the distance you have walked?
(b) What is your final displacement?
(c) Is displacement a vector or a scalar? Give a reason for your answer.
30

CHAPTER 3. MOTION IN ONE DIMENSION - GRADE 10 3.4
3.4 Speed, Average Velocity and Instantaneous Velocity
Definition: Velocity
Velocity is the rate of change of position.
Definition: Instantaneous velocity
Instantaneous velocity is the velocity of an accelerating body at a specific instant in time.
Definition: Average velocity
Average velocity is the total displacement of a body over a time interval.
Velocity is the rate of change of position. It tells us how much an object’s position changes intime. This is the same as the displacement divided by the time taken. Since displacement is avector and time taken is a scalar, velocity is also a vector. We use the symbol v for velocity. Ifwe have a displacement of Δx and a time taken of Δt, v is then defined as:
velocity (in m · s−1) =change in displacement (in m)
change in time (in s)
v =Δx
Δt
Velocity can be positive or negative. Positive values of velocity mean that the object is movingaway from the reference point or origin and negative values mean that the object is movingtowards the reference point or origin.
Important: An instant in time is different from the time taken or the time interval. Itis therefore useful to use the symbol t for an instant in time (for example during the 4th
second) and the symbol Δt for the time taken (for example during the first 5 seconds ofthe motion).
Average velocity (symbol v) is the displacement for the whole motion divided by the time takenfor the whole motion. Instantaneous velocity is the velocity at a specific instant in time.
(Average) Speed (symbol s) is the distance travelled (d) divided by the time taken (Δt) forthe journey. Distance and time are scalars and therefore speed will also be a scalar. Speed iscalculated as follows:
speed (in m · s−1) =distance (in m)
time (in s)
s =d
Δt
Instantaneous speed is the magnitude of instantaneous velocity. It has the same value, but nodirection.
Worked Example 5: Average speed and average velocity
31

3.4 CHAPTER 3. MOTION IN ONE DIMENSION - GRADE 10
Question: James walks 2 km away from home in 30 minutes. He then turns aroundand walks back home along the same path, also in 30 minutes. Calculate James’average speed and average velocity.
2 km
Answer
Step 1 : Identify what information is given and what is asked for
The question explicitly gives
• the distance and time out (2 km in 30 minutes)
• the distance and time back (2 km in 30 minutes)
Step 2 : Check that all units are SI units.
The information is not in SI units and must therefore be converted.To convert km to m, we know that:
1 km = 1 000 m
∴ 2 km = 2 000 m (multiply both sides by 2, because we want to convert 2 km to m.)
Similarly, to convert 30 minutes to seconds,
1 min = 60s
∴ 30 min = 1 800 s (multiply both sides by 30)
Step 3 : Determine James’ displacement and distance.
James started at home and returned home, so his displacement is 0 m.
Δx = 0 m
James walked a total distance of 4 000 m (2 000 m out and 2 000 m back).
d = 4 000 m
Step 4 : Determine his total time.
James took 1 800 s to walk out and 1 800 s to walk back.
Δt = 3 600 s
Step 5 : Determine his average speed
s =d
Δt
=4 000 m
3 600 s
= 1,11 m · s−1
Step 6 : Determine his average velocity
v =Δx
Δt
=0 m
3 600 s
= 0 m · s−1
Worked Example 6: Instantaneous Speed and Velocity
32

CHAPTER 3. MOTION IN ONE DIMENSION - GRADE 10 3.4
Question: A man runs around a circular track of radius 100 m. It takes him 120 sto complete a revolution of the track. If he runs at constant speed, calculate:
1. his speed,
2. his instantaneous velocity at point A,
3. his instantaneous velocity at point B,
4. his average velocity between points A and B,
5. his average speed during a revolution.
6. his average velocity during a revolution.
N
S
W E
100 mDirection the man runs
�
A
�B
Answer
Step 1 : Decide how to approach the problem
To determine the man’s speed we need to know the distance he travels and howlong it takes. We know it takes 120 s to complete one revolution of the track.(Arevolution is to go around the track once.)
33

3.4 CHAPTER 3. MOTION IN ONE DIMENSION - GRADE 10
Step 2 : Determine the distance travelled
What distance is one revolution of the track? We know the track is a circle and weknow its radius, so we can determine the distance around the circle. We start withthe equation for the circumference of a circle
C = 2πr
= 2π(100 m)
= 628,32 m
Therefore, the distance the man covers in one revolution is 628,32 m.
Step 3 : Determine the speed
We know that speed is distance covered per unittime. So if we divide the distance covered by thetime it took we will know how much distance wascovered for every unit of time. No direction isused here because speed is a scalar.
s =d
Δt
=628,32 m
120 s
= 5,24 m · s−1
Step 4 : Determine the instantaneous velocity at A
Consider the point A in the diagram.We know which way the man is running aroundthe track and we know his speed. His velocityat point A will be his speed (the magnitude ofthe velocity) plus his direction of motion (thedirection of his velocity). The instant that hearrives at A he is moving as indicated in thediagram.
His velocity will be 5,24 m·s−1West.
Direction the man runs
�
A
�
A
Step 5 : Determine the instantaneous velocity at B
Consider the point B in the diagram.We know which way the man is running aroundthe track and we know his speed. His velocityat point B will be his speed (the magnitude ofthe velocity) plus his direction of motion (thedirection of his velocity). The instant that hearrives at B he is moving as indicated in thediagram.
His velocity will be 5,24 m·s−1South.
Direction the man runs�B
�B
34

CHAPTER 3. MOTION IN ONE DIMENSION - GRADE 10 3.4
Step 6 : Determine the average velocity between A and B
To determine the average velocity between A and B, we need the change in displace-ment between A and B and the change in time between A and B. The displacementfrom A and B can be calculated by using the Theorem of Pythagoras:
(Δx)2 = 1002 + 1002
= 20000
Δx = 141,42135... m
The time for a full revolution is 120 s, thereforethe time for a 1
4of a revolution is 30 s.
vAB =Δx
Δt
=141,42...
30 s
= 4.71 m · s−1
100 m
100 m
A
B O
Δx
Velocity is a vector and needs a direction.Triangle AOB is isosceles and therefore angle BAO = 45◦.The direction is between west and south and is therefore southwest.The final answer is: v = 4.71 m·s−1, southwest.
Step 7 : Determine his average speed during a revolution
Because he runs at a constant rate, we know that his speed anywhere around thetrack will be the same. His average speed is 5,24 m·s−1.
Step 8 : Determine his average velocity over a complete revolution
Important: Remember - displacement can be zero even when distance travelled is not!
To calculate average velocity we need his total displacement and his total time. Hisdisplacement is zero because he ends up where he started. His time is 120 s. Usingthese we can calculate his average velocity:
v =Δx
Δt
=0 m
120 s= 0 s
3.4.1 Differences between Speed and Velocity
The differences between speed and velocity can be summarised as:
Speed Velocity
1. depends on the path taken 1. independent of path taken2. always positive 2. can be positive or negative3. is a scalar 3. is a vector4. no dependence on direction andso is only positive
4. direction can be guessed fromthe sign (i.e. positive or negative)
Additionally, an object that makes a round trip, i.e. travels away from its starting point and thenreturns to the same point has zero velocity but travels a non-zero speed.
35

3.4 CHAPTER 3. MOTION IN ONE DIMENSION - GRADE 10
Exercise: Displacement and related quantities
1. Theresa has to walk to the shop to buy some milk. After walking 100 m, sherealises that she does not have enough money, and goes back home. If it tookher two minutes to leave and come back, calculate the following:
(a) How long was she out of the house (the time interval Δt in seconds)?
(b) How far did she walk (distance (d))?
(c) What was her displacement (Δx)?
(d) What was her average velocity (in m·s−1)?
(e) What was her average speed (in m·s−1)?
�
100 m
2 minute there and back100 m
homeshop
2. Desmond is watching a straight stretch of road from his classroom window.He can see two poles which he earlier measured to be 50 m apart. Using hisstopwatch, Desmond notices that it takes 3 s for most cars to travel from theone pole to the other.
(a) Using the equation for velocity (v = ΔxΔt
), show all the working needed tocalculate the velocity of a car travelling from the left to the right.
(b) If Desmond measures the velocity of a red Golf to be -16,67 m·s−1, inwhich direction was the Gold travelling?Desmond leaves his stopwatch running, and notices that at t = 5,0 s, ataxi passes the left pole at the same time as a bus passes the right pole.At time t = 7,5 s the taxi passes the right pole. At time t = 9,0 s, thebus passes the left pole.
(c) How long did it take the taxi and the bus to travel the distance betweenthe poles? (Calculate the time interval (Δt) for both the taxi and the bus).
(d) What was the velocity of the taxi and the bus?
(e) What was the speed of the taxi and the bus?
(f) What was the speed of taxi and the bus in km·h−1?
50 m
3 s
t = 5 s t = 7,5 s
t = 9 s t = 5 s
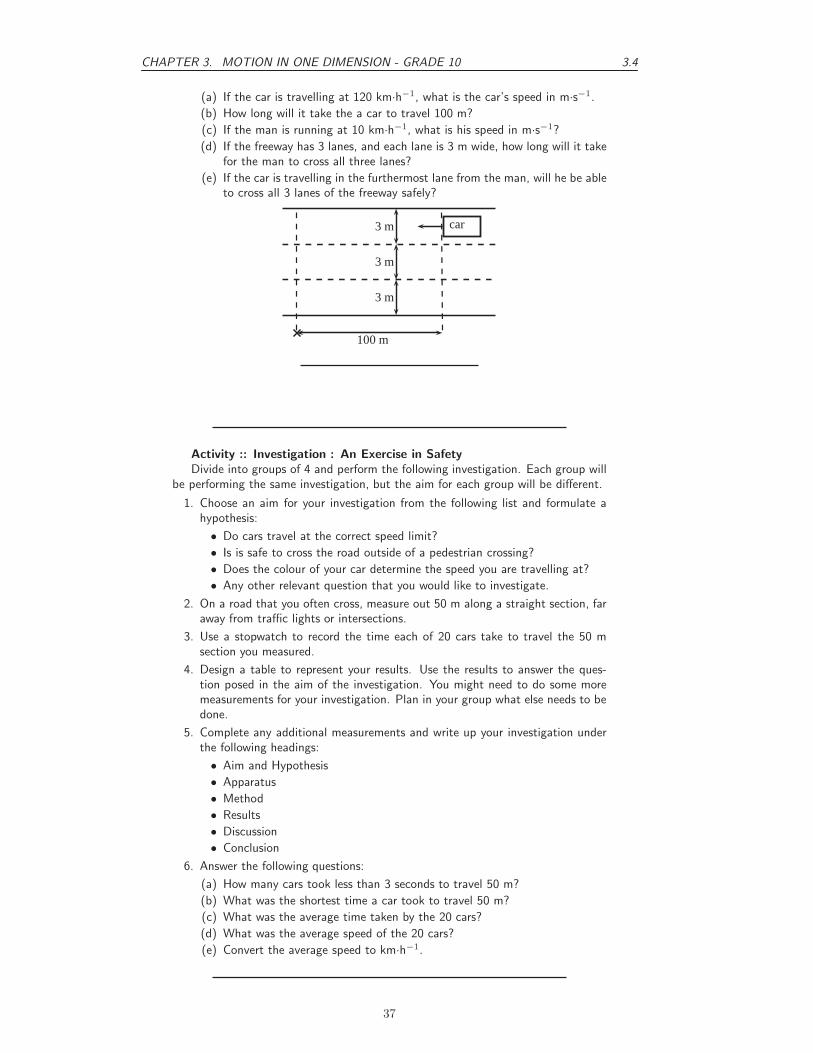
3. After a long day, a tired man decides not to use the pedestrian bridge to crossover a freeway, and decides instead to run across. He sees a car 100 m awaytravelling towards him, and is confident that he can cross in time.
36
CHAPTER 3. MOTION IN ONE DIMENSION - GRADE 10 3.4
(a) If the car is travelling at 120 km·h−1, what is the car’s speed in m·s−1.
(b) How long will it take the a car to travel 100 m?
(c) If the man is running at 10 km·h−1, what is his speed in m·s−1?
(d) If the freeway has 3 lanes, and each lane is 3 m wide, how long will it takefor the man to cross all three lanes?
(e) If the car is travelling in the furthermost lane from the man, will he be ableto cross all 3 lanes of the freeway safely?
car3 m
3 m
3 m
100 m
Activity :: Investigation : An Exercise in Safety
Divide into groups of 4 and perform the following investigation. Each group willbe performing the same investigation, but the aim for each group will be different.
1. Choose an aim for your investigation from the following list and formulate ahypothesis:
• Do cars travel at the correct speed limit?
• Is is safe to cross the road outside of a pedestrian crossing?
• Does the colour of your car determine the speed you are travelling at?
• Any other relevant question that you would like to investigate.
2. On a road that you often cross, measure out 50 m along a straight section, faraway from traffic lights or intersections.
3. Use a stopwatch to record the time each of 20 cars take to travel the 50 msection you measured.
4. Design a table to represent your results. Use the results to answer the ques-tion posed in the aim of the investigation. You might need to do some moremeasurements for your investigation. Plan in your group what else needs to bedone.
5. Complete any additional measurements and write up your investigation underthe following headings:
• Aim and Hypothesis
• Apparatus
• Method
• Results
• Discussion
• Conclusion
6. Answer the following questions:
(a) How many cars took less than 3 seconds to travel 50 m?
(b) What was the shortest time a car took to travel 50 m?
(c) What was the average time taken by the 20 cars?
(d) What was the average speed of the 20 cars?
(e) Convert the average speed to km·h−1.
37

3.5 CHAPTER 3. MOTION IN ONE DIMENSION - GRADE 10
3.5 Acceleration
Definition: Acceleration
Acceleration is the rate of change of velocity.
Acceleration (symbol a) is the rate of change of velocity. It is a measure of how fast the velocityof an object changes in time. If we have a change in velocity (Δv) over a time interval (Δt),then the acceleration (a) is defined as:
acceleration (in m · s−2) =change in velocity (in m · s−1)
change in time (in s)
a =Δv
Δt
Since velocity is a vector, acceleration is also a vector. Acceleration does not provide any infor-mation about a motion, but only about how the motion changes. It is not possible to tell howfast an object is moving or in which direction from the acceleration.Like velocity, acceleration can be negative or positive. We see that when the sign of the acceler-ation and the velocity are the same, the object is speeding up. If both velocity and accelerationare positive, the object is speeding up in a positive direction. If both velocity and accelerationare negative, the object is speeding up in a negative direction. If velocity is positive and accel-eration is negative, then the object is slowing down. Similarly, if the velocity is negative and theacceleration is positive the object is slowing down. This is illustrated in the following workedexample.
Worked Example 7: Acceleration
Question: A car accelerates uniformly from and initial velocity of 2 m·s−1 to a finalvelocity of 10 m·s1 in 8 seconds. It then slows down uniformly to a final velocity of 4m·s−1 in 6 seconds. Calculate the acceleration of the car during the first 8 secondsand during the last 6 seconds.Answer
Step 9 : Identify what information is given and what is asked for:
Consider the motion of the car in two parts: the first 8 seconds and the last 6 seconds.
For the first 8 seconds:
vi = 2 m · s−1
vf = 10 m · s−1
ti = 0 s
tf = 8 s
For the last 6 seconds:
vi = 10 m · s−1
vf = 4 m · s−1
ti = 8 s
tf = 14 s
Step 10 : Calculate the acceleration.For the first 8 seconds:
a =Δv
Δt
=10− 2
8− 0
= 1 m · s−2
For the next 6 seconds:
a =Δv
Δt
=4− 10
14− 8
= −1 m · s−2
During the first 8 seconds the car had a positive acceleration. This means that itsvelocity increased. The velocity is positive so the car is speeding up. During thenext 6 seconds the car had a negative acceleration. This means that its velocitydecreased. The velocity is positive so the car is slowing down.
38

CHAPTER 3. MOTION IN ONE DIMENSION - GRADE 10 3.6
Important: Acceleration does not tell us about the direction of the motion. Accelerationonly tells us how the velocity changes.
Important: Deceleration
Avoid the use of the word deceleration to refer to a negative acceleration. This word usuallymeans slowing down and it is possible for an object to slow down with both a positive andnegative acceleration, because the sign of the velocity of the object must also be taken intoaccount to determine whether the body is slowing down or not.
Exercise: Acceleration
1. An athlete is accelerating uniformly from an initial velocity of 0 m·s−1to a finalvelocity of 4 m·s−1in 2 seconds. Calculate his acceleration. Let the directionthat the athlete is running in be the positive direction.
2. A bus accelerates uniformly from an initial velocity of 15 m·s−1to a final velocityof 7 m·s−1in 4 seconds. Calculate the acceleration of the bus. Let the directionof motion of the bus be the positive direction.
3. An aeroplane accelerates uniformly from an initial velocity of 200 m·s−1to avelocity of 100 m·s−1in 10 seconds. It then accelerates uniformly to a finalvelocity of 240 m·s−1in 20 seconds. Let the direction of motion of the aeroplanebe the positive direction.
(a) Calculate the acceleration of the aeroplane during the first 10 seconds ofthe motion.
(b) Calculate the acceleration of the aeroplane during the next 14 seconds ofits motion.
(c) Calculate the acceleration of the aeroplane during the whole 24 seconds ofits motion.
3.6 Description of Motion
The purpose of this chapter is to describe motion, and now that we understand the definitions ofdisplacement, distance, velocity, speed and acceleration, we are ready to start using these ideasto describe how an object is moving. There are many ways of describing motion:
1. words
2. diagrams
3. graphs
These methods will be described in this section.
We will consider three types of motion: when the object is not moving (stationary object), whenthe object is moving at a constant velocity (uniform motion) and when the object is moving ata constant acceleration (motion at constant acceleration).
39

3.6 CHAPTER 3. MOTION IN ONE DIMENSION - GRADE 10
3.6.1 Stationary Object
The simplest motion that we can come across is that of a stationary object. A stationary objectdoes not move and so its position does not change, for as long as it is standing still. An exampleof this situation is when someone is waiting for something without moving. The person remainsin the same position.
Lesedi is waiting for a taxi. He is standing two metres from a stop street at t = 0 s. Afterone minute, at t = 60 s, he is still 2 metres from the stop street and after two minutes, att = 120 s, also 2 metres from the stop street. His position has not changed. His displacementis zero (because his position is the same), his velocity is zero (because his displacement is zero)and his acceleration is also zero (because his velocity is not changing).
STOP
2 m
t = 0 st = 60 st = 120 s
���
displacement = 0 m
velocity = 0 m·s−1
acceleration = 0 m·s−2
We can now draw graphs of position vs.time (x vs. t), velocity vs.time (v vs. t) and accelerationvs.time (a vs. t) for a stationary object. The graphs are shown in Figure 3.5. Lesedi’s positionis 2 metres from the stop street. If the stop street is taken as the reference point, his positionremains at 2 metres for 120 seconds. The graph is a horisontal line at 2 m. The velocity andacceleration graphs are also shown. They are both horisontal lines on the x-axis. Since hisposition is not changing, his velocity is 0 m·s−1and since velocity is not changing acceleration is0 m·s−2.
60 120
2
1
0 120 120time (s) time (s) time (s)
posi
tion
x(m
)
velo
city
v(m·s−
1)
acce
lera
tion
a(m·s−
2)
0 060 60(a) (b) (c)
Figure 3.5: Graphs for a stationary object (a) position vs. time (b) velocity vs. time (c)acceleration vs. time.
Definition: Gradient
The gradient of a line can be calculated by dividing the change in the y-value by the changein the x-value.m = Δy
Δx
Since we know that velocity is the rate of change of position, we can confirm the value for thevelocity vs. time graph, by calculating the gradient of the x vs. t graph.
Important: The gradient of a position vs. time graph gives the velocity.
40

CHAPTER 3. MOTION IN ONE DIMENSION - GRADE 10 3.6
If we calculate the gradient of the x vs. t graph for a stationary object we get:
v =Δx
Δt
=xf − xi
tf − ti
=2 m− 2 m
120 s− 60 s(initial position = final position)
= 0 m · s−1 (for the time that Lesedi is stationary)
Similarly, we can confirm the value of the acceleration by calculating the gradient of the velocityvs. time graph.
Important: The gradient of a velocity vs. time graph gives the acceleration.
If we calculate the gradient of the v vs. t graph for a stationary object we get:
a =Δv
Δt
=vf − vi
tf − ti
=0 m · s−1 − 0 m · s−1
120 s− 60 s
= 0 m · s−2
Additionally, because the velocity vs. time graph is related to the position vs. time graph, wecan use the area under the velocity vs. time graph to calculate the displacement of an object.
Important: The area under the velocity vs. time graph gives the displacement.
The displacement of the object is given by the area under the graph, which is 0 m. This isobvious, because the object is not moving.
3.6.2 Motion at Constant Velocity
Motion at a constant velocity or uniform motion means that the position of the object is changingat the same rate.
Assume that Lesedi takes 100 s to walk the 100 m to the taxi-stop every morning. If we assumethat Lesedi’s house is the origin, then Lesedi’s velocity is:
v =Δx
Δt
=xf − xi
tf − ti
=100 m− 0 m
100 s− 0 s
= 1 m · s−1
Lesedi’s velocity is 1 m·s−1. This means that he walked 1 m in the first second, another metrein the second second, and another in the third second, and so on. For example, after 50 s hewill be 50 m from home. His position increases by 1 m every 1 s. A diagram of Lesedi’s positionis shown in Figure 3.6.
We can now draw graphs of position vs.time (x vs. t), velocity vs.time (v vs. t) and accelerationvs.time (a vs. t) for Lesedi moving at a constant velocity. The graphs are shown in Figure 3.7.
41

3.6 CHAPTER 3. MOTION IN ONE DIMENSION - GRADE 10
�
x = 100 mt = 0 s t = 50 s t = 100 s
x = 50 mx = 0 m
��
v = 1m·s−1 v = 1m·s−1
Figure 3.6: Diagram showing Lesedi’s motion at a constant velocity of 1 m·s−1
50 100
100
50
0 100 100time (s) time (s) time (s)
posi
tion
x(m
)
velo
city
v(m·s−
1)
acce
lera
tion
a(m·s−
2)
0 050 50(a) (b) (c)
1ΔxΔt
Figure 3.7: Graphs for motion at constant velocity (a) position vs. time (b) velocity vs. time(c) acceleration vs. time. The area of the shaded portion in the v vs. t graph corresponds tothe object’s displacement.
In the evening Lesedi walks 100 m from the bus stop to his house in 100 s. Assume that Lesedi’shouse is the origin. The following graphs can be drawn to describe the motion.
50 100
100
50
0
100
100time (s)
time (s)
time (s)
posi
tion
x(m
)
velo
city
v(m·s−
1)
acce
lera
tion
a(m·s−
2)
0
0
50
50(a) (b) (c)
-1Δx
Δt
Figure 3.8: Graphs for motion with a constant negative velocity (a) position vs. time (b) velocityvs. time (c) acceleration vs. time. The area of the shaded portion in the v vs.t graph correspondsto the object’s displacement.
We see that the v vs. t graph is a horisontal line. If the velocity vs. time graph is a horisontalline, it means that the velocity is constant (not changing). Motion at a constant velocity isknown as uniform motion.
We can use the x vs. t to calculate the velocity by finding the gradient of the line.
v =Δx
Δt
=xf − xi
tf − ti
=0 m− 100 m
100 s− 0 s
= −1 m · s−1
42

CHAPTER 3. MOTION IN ONE DIMENSION - GRADE 10 3.6
Lesedi has a velocity of -1 m·s−1, or 1 m·s−1towards his house. You will notice that the v vs. t
graph is a horisontal line corresponding to a velocity of -1 m·s−1. The horisontal line means thatthe velocity stays the same (remains constant) during the motion. This is uniform velocity.
We can use the v vs. t to calculate the acceleration by finding the gradient of the line.
a =Δv
Δt
=vf − vi
tf − ti
=1 m · s−1 − 1 m · s−1
100 s− 0 s
= 0 m · s−2
Lesedi has an acceleration of 0 m·s−2. You will notice that the graph of a vs.t is a horisontal linecorresponding to an acceleration value of 0 m·s−2. There is no acceleration during the motionbecause his velocity does not change.
We can use the v vs. t to calculate the displacement by finding the area under the graph.
v = Area under graph
= �× b
= 100× (−1)
= −100 m
This means that Lesedi has a displacement of 100 m towards his house.
43
3.6 CHAPTER 3. MOTION IN ONE DIMENSION - GRADE 10
Exercise: Velocity and acceleration
1. Use the graphs in Figure 3.7 to calculate each of the following:
(a) Calculate Lesedi’s velocity between 50 s and 100 s using the x vs. t graph.Hint: Find the gradient of the line.
(b) Calculate Lesedi’s acceleration during the whole motion using the v vs. t
graph.
(c) Calculate Lesedi’s displacement during the whole motion using the v vs. t
graph.
2. Thandi takes 200 s to walk 100 m to the bus stop every morning. Draw a graphof Thandi’s position as a function of time (assuming that Thandi’s home is thereference point). Use the gradient of the x vs. t graph to draw the graph ofvelocity vs. time. Use the gradient of the v vs. t graph to draw the graph ofacceleration vs. time.
3. In the evening Thandi takes 200 s to walk 100 m from the bus stop to herhome. Draw a graph of Thandi’s position as a function of time (assuming thatThandi’s home is the origin). Use the gradient of the x vs. t graph to drawthe graph of velocity vs. time. Use the gradient of the v vs. t graph to drawthe graph of acceleration vs. time.
4. Discuss the differences between the two sets of graphs in questions 2 and 3.
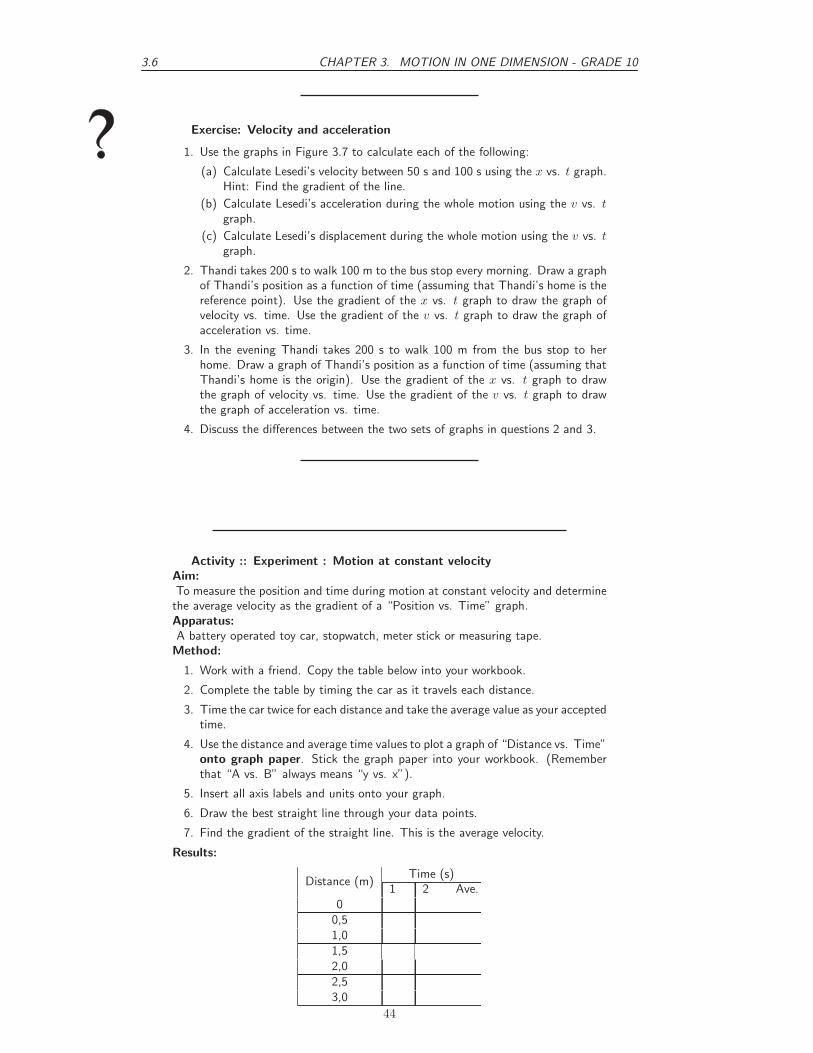
Activity :: Experiment : Motion at constant velocity
Aim:
To measure the position and time during motion at constant velocity and determinethe average velocity as the gradient of a “Position vs. Time” graph.Apparatus:
A battery operated toy car, stopwatch, meter stick or measuring tape.Method:
1. Work with a friend. Copy the table below into your workbook.
2. Complete the table by timing the car as it travels each distance.
3. Time the car twice for each distance and take the average value as your acceptedtime.
4. Use the distance and average time values to plot a graph of “Distance vs. Time”onto graph paper. Stick the graph paper into your workbook. (Rememberthat “A vs. B” always means “y vs. x”).
5. Insert all axis labels and units onto your graph.
6. Draw the best straight line through your data points.
7. Find the gradient of the straight line. This is the average velocity.
Results:
Distance (m)Time (s)
1 2 Ave.0
0,51,01,52,02,53,0
44

CHAPTER 3. MOTION IN ONE DIMENSION - GRADE 10 3.6
Conclusions:
Answer the following questions in your workbook.Questions:
1. Did the car travel with a constant velocity?
2. How can you tell by looking at the “Distance vs. Time” graph if the velocityis constant?
3. How would the “Distance vs. Time” look for a car with a faster velocity?
4. How would the “Distance vs. Time” look for a car with a slower velocity?
45

3.6 CHAPTER 3. MOTION IN ONE DIMENSION - GRADE 10
3.6.3 Motion at Constant Acceleration
The final situation we will be studying is motion at constant acceleration. We know thatacceleration is the rate of change of velocity. So, if we have a constant acceleration, thismeans that the velocity changes at a constant rate.
Let’s look at our first example of Lesedi waiting at the taxi stop again. A taxi arrived and Lesedigot in. The taxi stopped at the stop street and then accelerated as follows: After 1 s the taxicovered a distance of 2,5 m, after 2 s it covered 10 m, after 3 seconds it covered 22,5 m andafter 4 s it covered 40 m. The taxi is covering a larger distance every second. This means thatit is accelerating.
10 m 40 m2,5 m 22,5 mt = 1 s t = 2 s t = 3 s t = 4 s
STOP
To calculate the velocity of the taxi you need to calculate the gradient of the line at each second:
v1s =Δx
Δt
=xf − xi
tf − ti
=5m− 0m
1,5s− 0,5s
= 5 m · s−1
v2s =Δx
Δt
=xf − xi
tf − ti
=15m− 5m
2,5s− 1,5s
= 10 m · s−1
v3s =Δx
Δt
=xf − xi
tf − ti
=30m− 15m
3,5s− 2,5s
= 15 m · s−1
From these velocities, we can draw the velocity-time graph which forms a straight line.
The acceleration is the gradient of the v vs. t graph and can be calculated as follows:
a =Δv
Δt
=vf − vi
tf − ti
=15m · s−1 − 5m · s−1
3s− 1s
= 5 m · s−2
The acceleration does not change during the motion (the gradient stays constant). This ismotion at constant or uniform acceleration.
The graphs for this situation are shown in Figure 3.9.
Velocity from Acceleration vs. Time Graphs
Just as we used velocity vs. time graphs to find displacement, we can use acceleration vs. timegraphs to find the velocity of an object at a given moment in time. We simply calculate thearea under the acceleration vs. time graph, at a given time. In the graph below, showing anobject at a constant positive acceleration, the increase in velocity of the object after 2 secondscorresponds to the shaded portion.
v = area of rectangle = a×Δt
= 5 m · s−2 × 2 s
= 10 m · s−1
46

CHAPTER 3. MOTION IN ONE DIMENSION - GRADE 10 3.6
1 2
22,5
10
0 2 2time (s) time (s) time (s)
posi
tion
x(m
)
velo
city
v(m·s−
1)
acce
lera
tion
a(m·s−
2)
0 01 1(a) (b) (c)
Δ xΔ v
Δ tΔ t
10
55
15
33
�
�
�
Figure 3.9: Graphs for motion with a constant acceleration (a) position vs. time (b) velocity vs.time (c) acceleration vs. time.
The velocity of the object at t = 2 s is therefore 10 m·s−1. This corresponds with the valuesobtained in Figure 3.9.
Exercise: Graphs
1. A car is parked 10 m from home for 10 minutes. Draw a displacement-time,velocity-time and acceleration-time graphs for the motion. Label all the axes.
2. A bus travels at a constant velocity of 12 m·s−1for 6 seconds. Draw thedisplacement-time, velocity-time and acceleration-time graph for the motion.Label all the axes.
3. An athlete runs with a constant acceleration of 1 m·s−2for 4 s. Draw theacceleration-time, velocity-time and displacement time graphs for the motion.Accurate values are only needed for the acceleration-time and velocity-timegraphs.
4. The following velocity-time graph describes the motion of a car. Draw thedisplacement-time graph and the acceleration-time graph and explain the mo-tion of the car according to the three graphs.
6
20
v (m·s−1)
t (s)
5. The following velocity-time graph describes the motion of a truck. Draw thedisplacement-time graph and the acceleration-time graph and explain the mo-tion of the truck according to the three graphs.
8
40
v (m·s−1)
t (s)
47
3.7 CHAPTER 3. MOTION IN ONE DIMENSION - GRADE 10
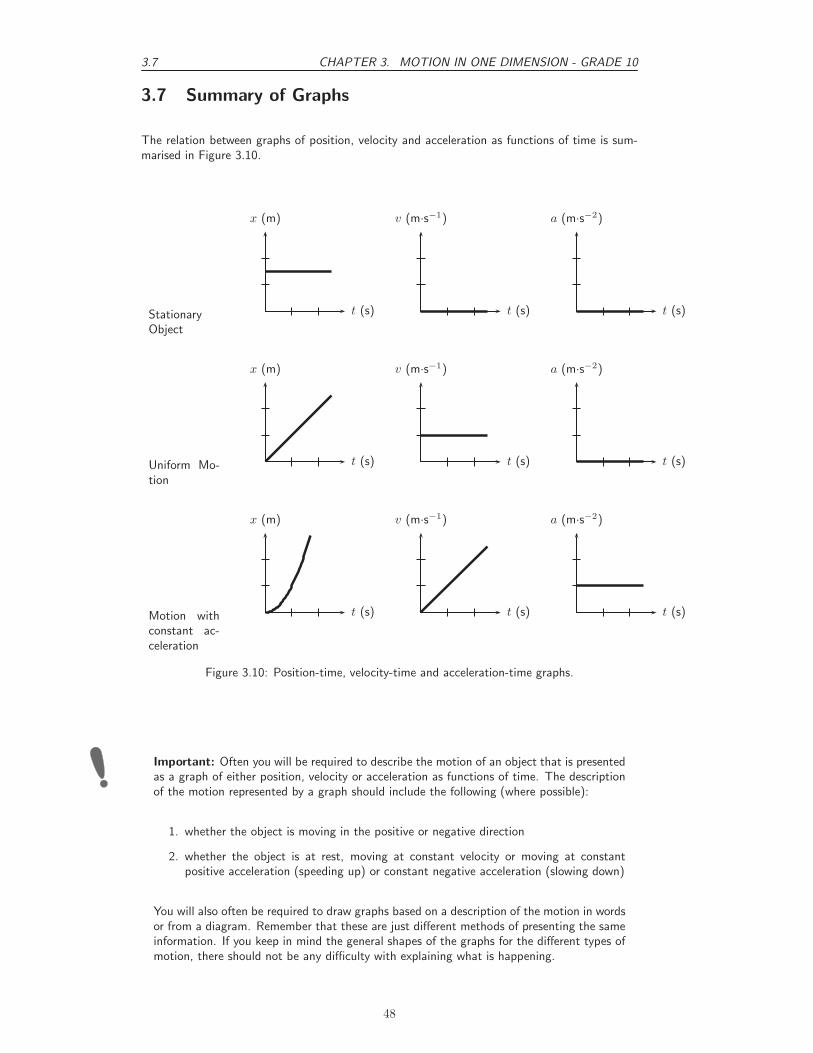
3.7 Summary of Graphs
The relation between graphs of position, velocity and acceleration as functions of time is sum-marised in Figure 3.10.
StationaryObject
x (m)
t (s)
v (m·s−1)
t (s)
a (m·s−2)
t (s)
Uniform Mo-tion
x (m)
t (s)
v (m·s−1)
t (s)
a (m·s−2)
t (s)
Motion withconstant ac-celeration
x (m)
t (s)
v (m·s−1)
t (s)
a (m·s−2)
t (s)
Figure 3.10: Position-time, velocity-time and acceleration-time graphs.
Important: Often you will be required to describe the motion of an object that is presentedas a graph of either position, velocity or acceleration as functions of time. The descriptionof the motion represented by a graph should include the following (where possible):
1. whether the object is moving in the positive or negative direction
2. whether the object is at rest, moving at constant velocity or moving at constantpositive acceleration (speeding up) or constant negative acceleration (slowing down)
You will also often be required to draw graphs based on a description of the motion in wordsor from a diagram. Remember that these are just different methods of presenting the sameinformation. If you keep in mind the general shapes of the graphs for the different types ofmotion, there should not be any difficulty with explaining what is happening.
48

CHAPTER 3. MOTION IN ONE DIMENSION - GRADE 10 3.8
3.8 Worked Examples
The worked examples in this section demonstrate the types of questions that can be asked aboutgraphs.
Worked Example 8: Description of motion based on a position-time graph
Question: The position vs. time graph for the motion of a car is given below.Draw the corresponding velocity vs. time and acceleration vs. time graphs, and thendescribe the motion of the car.
0 1 2 3 4 5 60
1
2
3
4
5
x (m)
t (s)
Answer
Step 1 : Identify what information is given and what is asked for
The question gives a position vs. time graph and the following three things arerequired:
1. Draw a v vs. t graph.
2. Draw an a vs. t graph.
3. Describe the motion of the car.
To answer these questions, break the motion up into three sections: 0 - 2 seconds,2 - 4 seconds and 4 - 6 seconds.
Step 2 : Velocity vs. time graph for 0-2 seconds
For the first 2 seconds we can see that the displacement remains constant - so theobject is not moving, thus it has zero velocity during this time. We can reach thisconclusion by another path too: remember that the gradient of a displacement vs.time graph is the velocity. For the first 2 seconds we can see that the displacementvs. time graph is a horizontal line, ie. it has a gradient of zero. Thus the velocityduring this time is zero and the object is stationary.
Step 3 : Velocity vs. time graph for 2-4 seconds
For the next 2 seconds, displacement is increasing with time so the object is mov-ing. Looking at the gradient of the displacement graph we can see that it is notconstant. In fact, the slope is getting steeper (the gradient is increasing) as timegoes on. Thus, remembering that the gradient of a displacement vs. time graph isthe velocity, the velocity must be increasing with time during this phase.
Step 4 : Velocity vs. time graph for 4-6 seconds
For the final 2 seconds we see that displacement is still increasing with time, butthis time the gradient is constant, so we know that the object is now travelling ata constant velocity, thus the velocity vs. time graph will be a horizontal line duringthis stage. We can now draw the graphs:
49
3.8 CHAPTER 3. MOTION IN ONE DIMENSION - GRADE 10
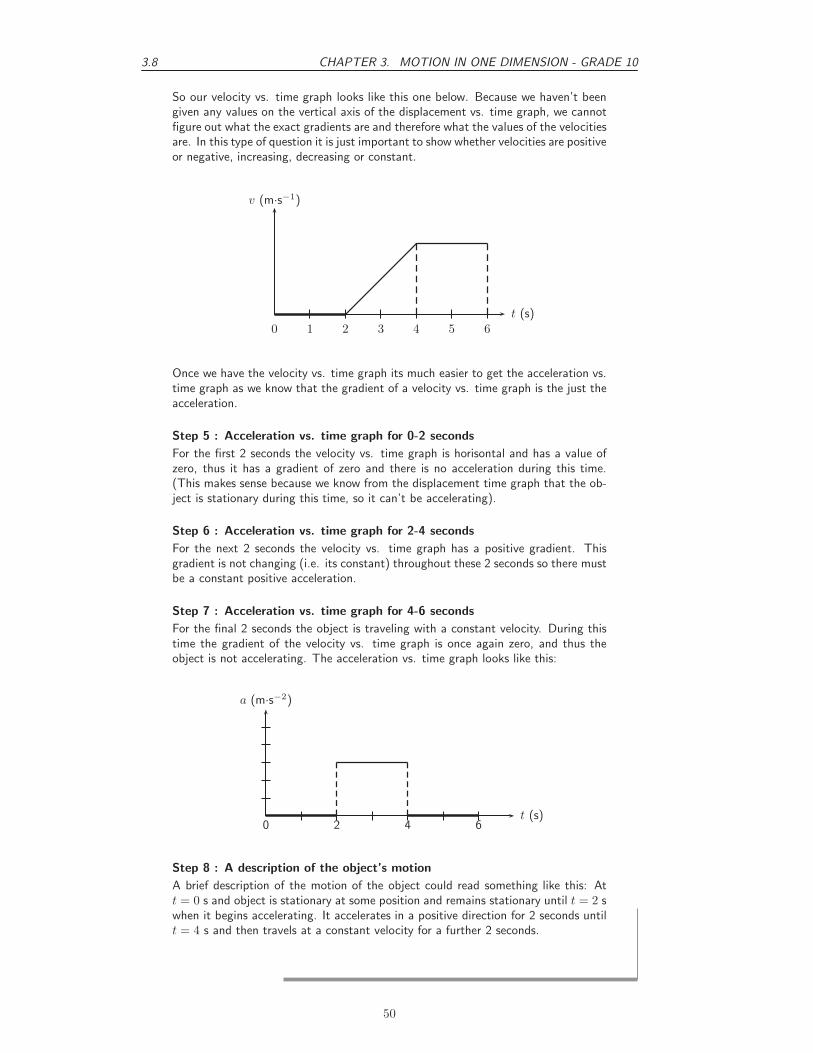
So our velocity vs. time graph looks like this one below. Because we haven’t beengiven any values on the vertical axis of the displacement vs. time graph, we cannotfigure out what the exact gradients are and therefore what the values of the velocitiesare. In this type of question it is just important to show whether velocities are positiveor negative, increasing, decreasing or constant.
0 1 2 3 4 5 6
v (m·s−1)
t (s)
Once we have the velocity vs. time graph its much easier to get the acceleration vs.time graph as we know that the gradient of a velocity vs. time graph is the just theacceleration.
Step 5 : Acceleration vs. time graph for 0-2 seconds
For the first 2 seconds the velocity vs. time graph is horisontal and has a value ofzero, thus it has a gradient of zero and there is no acceleration during this time.(This makes sense because we know from the displacement time graph that the ob-ject is stationary during this time, so it can’t be accelerating).
Step 6 : Acceleration vs. time graph for 2-4 seconds
For the next 2 seconds the velocity vs. time graph has a positive gradient. Thisgradient is not changing (i.e. its constant) throughout these 2 seconds so there mustbe a constant positive acceleration.
Step 7 : Acceleration vs. time graph for 4-6 seconds
For the final 2 seconds the object is traveling with a constant velocity. During thistime the gradient of the velocity vs. time graph is once again zero, and thus theobject is not accelerating. The acceleration vs. time graph looks like this:
a (m·s−2)
t (s)0 2 4 6
Step 8 : A description of the object’s motion
A brief description of the motion of the object could read something like this: Att = 0 s and object is stationary at some position and remains stationary until t = 2 swhen it begins accelerating. It accelerates in a positive direction for 2 seconds untilt = 4 s and then travels at a constant velocity for a further 2 seconds.
50

CHAPTER 3. MOTION IN ONE DIMENSION - GRADE 10 3.8
Worked Example 9: Calculations from a velocity vs. time graph
Question: The velocity vs. time graph of a truck is plotted below. Calculate thedistance and displacement of the truck after 15 seconds.
1 2 3 4 5 6 7 8 9 10 11 12 13 14 150
1
2
3
4
−1
−2
v (m·s−1)
t (s)
Answer
Step 1 : Decide how to tackle the problem
We are asked to calculate the distance and displacement of the car. All we need toremember here is that we can use the area between the velocity vs. time graph andthe time axis to determine the distance and displacement.
Step 2 : Determine the area under the velocity vs. time graph
Break the motion up: 0 - 5 seconds, 5 - 12 seconds, 12 - 14 seconds and 14 - 15seconds.
For 0 - 5 seconds: The displacement isequal to the area of the triangle on theleft:
Area� =1
2b× h
=1
2× 5 × 4
= 10 m
For 5 - 12 seconds: The displacementis equal to the area of the rectangle:
Area� = �× b
= 7 × 4
= 28 m
For 12 - 14 seconds the displacement isequal to the area of the triangle abovethe time axis on the right:
Area� =1
2b× h
=1
2× 2 × 4
= 4 m
For 14 - 15 seconds the displacement isequal to the area of the triangle belowthe time axis:
Area� =1
2b× h
=1
2× 1 × 2
= 1 m
Step 3 : Determine the total distance of the car
Now the total distance of the car is the sum of all of these areas:
Δx = 10 + 28 + 4 + 1
= 43 m
51

3.8 CHAPTER 3. MOTION IN ONE DIMENSION - GRADE 10
Step 4 : Determine the total displacement of the car
Now the total displacement of the car is just the sum of all of these areas. HOW-EVER, because in the last second (from t = 14 s to t = 15 s) the velocity of thecar is negative, it means that the car was going in the opposite direction, i.e. backwhere it came from! So, to find the total displacement, we have to add the first 3areas (those with positive displacements) and subtract the last one (because it is adisplacement in the opposite direction).
Δx = 10 + 28 + 4− 1
= 41 m in the positive direction
Worked Example 10: Velocity from a position vs. time graph
Question: The position vs. time graph below describes the motion of an athlete.
1. What is the velocity of the athlete during the first 4 seconds?
2. What is the velocity of the athlete from t = 4 s to t = 7 s?
0 1 2 3 4 5 6 70
1
2
3
4
x (m)
t (s)
Answer
Step 1 : The velocity during the first 4 seconds
The velocity is given by the gradient of a position vs. time graph. During the first4 seconds, this is
v =Δx
Δt
=4− 0
4− 0
= 1 m · s−1
Step 2 : The velocity during the last 3 seconds
For the last 3 seconds we can see that the displacement stays constant. The graphshows a horisontal line and therefore the gradient is zero. Thus v = 0 m · s−1.
52
CHAPTER 3. MOTION IN ONE DIMENSION - GRADE 10 3.8
Worked Example 11: Drawing a v vs. t graph from an a vs. t graph
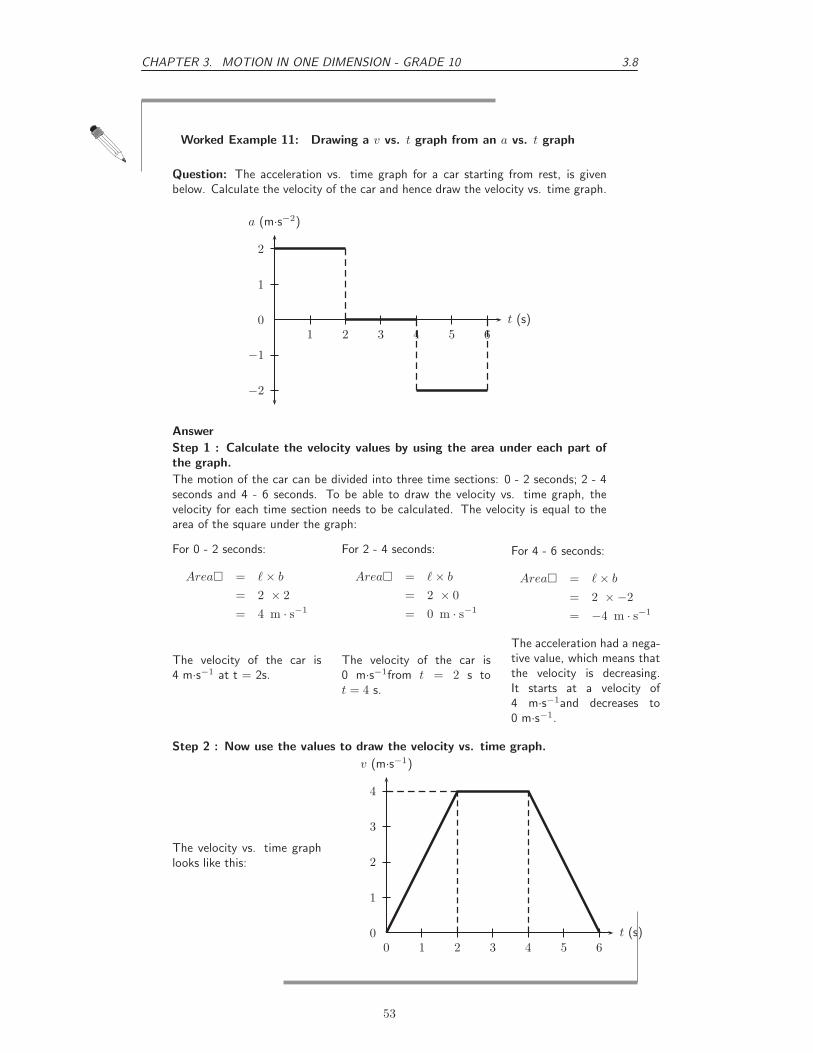
Question: The acceleration vs. time graph for a car starting from rest, is givenbelow. Calculate the velocity of the car and hence draw the velocity vs. time graph.
1 2 3 4 5 60
1
2
−1
−2
a (m·s−2)
t (s)
Answer
Step 1 : Calculate the velocity values by using the area under each part of
the graph.
The motion of the car can be divided into three time sections: 0 - 2 seconds; 2 - 4seconds and 4 - 6 seconds. To be able to draw the velocity vs. time graph, thevelocity for each time section needs to be calculated. The velocity is equal to thearea of the square under the graph:
For 0 - 2 seconds:
Area� = �× b
= 2 × 2
= 4 m · s−1
The velocity of the car is4 m·s−1 at t = 2s.
For 2 - 4 seconds:
Area� = �× b
= 2 × 0
= 0 m · s−1
The velocity of the car is0 m·s−1from t = 2 s tot = 4 s.
For 4 - 6 seconds:
Area� = �× b
= 2 ×−2
= −4 m · s−1
The acceleration had a nega-tive value, which means thatthe velocity is decreasing.It starts at a velocity of4 m·s−1and decreases to0 m·s−1.
Step 2 : Now use the values to draw the velocity vs. time graph.
The velocity vs. time graphlooks like this:
0 1 2 3 4 5 60
1
2
3
4
v (m·s−1)
t (s)
53

3.9 CHAPTER 3. MOTION IN ONE DIMENSION - GRADE 10
3.9 Equations of Motion
In this chapter we will look at the third way to describe motion. We have looked at describingmotion in terms of graphs and words. In this section we examine equations that can be used todescribe motion.
This section is about solving problems relating to uniformly accelerated motion. In other words,motion at constant acceleration.The following are the variables that will be used in this section:
vi = initial velocity (m·s−1) at t = 0 s
vf = final velocity (m·s−1) at time t
Δx = displacement (m)
t = time (s)
Δt = time interval (s)
a = acceleration (m·s−2)
vf = vi + at (3.1)
Δx =(vi + vf )
2t (3.2)
Δx = vit +1
2at2 (3.3)
v2f = v2
i + 2aΔx (3.4)
The questions can vary a lot, but the following method for answering them will always work.Use this when attempting a question that involves motion with constant acceleration. You needany three known quantities (vi, vf , Δx, t or a) to be able to calculate the fourth one.
1. Read the question carefully to identify the quantities that are given. Write them down.
2. Identify the equation to use. Write it down!!!
3. Ensure that all the values are in the correct unit and fill them in your equation.
4. Calculate the answer and fill in its unit.
Interesting
Fact
erest
FactGalileo Galilei of Pisa, Italy, was the first to determined the correct mathematicallaw for acceleration: the total distance covered, starting from rest, is proportionalto the square of the time. He also concluded that objects retain their velocityunless a force – often friction – acts upon them, refuting the accepted Aristotelianhypothesis that objects ”naturally” slow down and stop unless a force acts uponthem. This principle was incorporated into Newton’s laws of motion (1st law).
3.9.1 Finding the Equations of Motion
The following does not form part of the syllabus and can be considered additional information.
54

CHAPTER 3. MOTION IN ONE DIMENSION - GRADE 10 3.9
Derivation of Equation 3.1
According to the definition of acceleration:
a =Δv
t
where Δv is the change in velocity, i.e. Δv = vf - vi. Thus we have
a =vf − vi
tvf = vi + at
Derivation of Equation 3.2
We have seen that displacement can be calculated from the area under a velocity vs. time graph.For uniformly accelerated motion the most complicated velocity vs. time graph we can have isa straight line. Look at the graph below - it represents an object with a starting velocity of vi,accelerating to a final velocity vf over a total time t.
v (m·s−1)
t (s)
vi
vf
t
To calculate the final displacement we must calculate the area under the graph - this is justthe area of the rectangle added to the area of the triangle. This portion of the graph has beenshaded for clarity.
Area� =1
2b× h
=1
2t× (vf − vi)
=1
2vf t−
1
2vit
Area� = �× b
= t× vi
= vit
Displacement = Area� + Area�
Δx = vit +1
2vf t−
1
2vit
Δx =(vi + vf )
2t
55

3.9 CHAPTER 3. MOTION IN ONE DIMENSION - GRADE 10
Derivation of Equation 3.3
This equation is simply derived by eliminating the final velocity vf in equation 3.2. Rememberingfrom equation 3.1 that
vf = vi + at
then equation 3.2 becomes
Δx =vi + vi + at
2t
=2vit + at2
2
Δx = vit +1
2at2
56

CHAPTER 3. MOTION IN ONE DIMENSION - GRADE 10 3.9
Derivation of Equation 3.4
This equation is just derived by eliminating the time variable in the above equation. FromEquation 3.1 we know
t =vf − vi
a
Substituting this into Equation 3.3 gives
Δx = vi(vf − vi
a) +
1
2a(
vf − vi
a)2
=vivf
a−
v2i
a+
1
2a(
v2f − 2vivf + v2
i
a2)
=vivf
a−
v2i
a+
v2f
2a−
vivf
a+
v2i
2a
2aΔx = −2v2i + v2
f + v2i
v2f = v2
i + 2aΔx (3.5)
This gives us the final velocity in terms of the initial velocity, acceleration and displacement andis independent of the time variable.
Worked Example 12: Equations of motion
Question: A racing car is travelling north. It accelerates uniformly covering adistance of 725 m in 10 s. If it has an initial velocity of 10 m·s−1, find its acceleration.
Answer
Step 1 : Identify what information is given and what is asked for
We are given:
vi = 10 m · s−1
Δx = 725 m
t = 10 s
a = ?
Step 2 : Find an equation of motion relating the given information to the
acceleration
If you struggle to find the correct equation, find the quantity that is not given andthen look for an equation that does not have this quantity in it.We can use equation 3.3
Δx = vit +1
2at2
Step 3 : Substitute your values in and find the answer
Δx = vit +1
2at2
725 = (10× 10) +1
2a× (10)2
725− 100 = 50 a
a = 12,5 m · s−2
Step 4 : Quote the final answer
The racing car is accelerating at 12,5 m·s−2 north.
57

3.9 CHAPTER 3. MOTION IN ONE DIMENSION - GRADE 10
Worked Example 13: Equations of motion
Question: A motorcycle, travelling east, starts from rest, moves in a straight linewith a constant acceleration and covers a distance of 64 m in 4 s. Calculate
• its acceleration
• its final velocity
• at what time the motorcycle had covered half the total distance
• what distance the motorcycle had covered in half the total time.
Answer
Step 1 : Identify what information is given and what is asked for
We are given:
vi = 0 m · s−1(because the object starts from rest.)
Δx = 64 m
t = 4 s
a = ?
vf = ?
t = ? at half the distance Δx = 32 m.
Δx = ? at half the time t = 2 s.
All quantities are in SI units.Step 2 : Acceleration: Find a suitable equation to calculate the acceleration
We can use equations 3.3
Δx = vit +1
2at2
Step 3 : Substitute the values and calculate the acceleration
Δx = vit +1
2at2
64 = (0× 4) +1
2a× (4)2
64 = 8a
a = 8 m · s−2 east
Step 4 : Final velocity: Find a suitable equation to calculate the final velocity
We can use equation 3.1 - remember we now also know the acceleration of theobject.
vf = vi + at
Step 5 : Substitute the values and calculate the final velocity
vf = vi + at
vf = 0 + (8)(4)
= 32 m · s−1 east
Step 6 : Time at half the distance: Find an equation to calculate the time
We can use equation 3.3:
Δx = vi +1
2at2
32 = (0)t +1
2(8)(t)2
32 = 0 + 4t2
8 = t2
t = 2,83 s
58

CHAPTER 3. MOTION IN ONE DIMENSION - GRADE 10 3.10
Step 7 : Distance at half the time: Find an equation to relate the distance
and time
Half the time is 2 s, thus we have vi, a and t - all in the correct units. We can useequation 3.3 to get the distance:
Δx = vit +1
2at2
= (0)(2) +1
2(8)(2)2
= 16 m east
Exercise: Acceleration
1. A car starts off at 10 m·s−1 and accelerates at 1 m·s−2 for 10 s. What is itsfinal velocity?
2. A train starts from rest, and accelerates at 1 m·s−2 for 10 s. How far does itmove?
3. A bus is going 30 m·s−1 and stops in 5 s. What is its stopping distance for thisspeed?
4. A racing car going at 20 m·s−1 stops in a distance of 20 m. What is itsacceleration?
5. A ball has a uniform acceleration of 4 m·s−1. Assume the ball starts from rest.Determine the velocity and displacement at the end of 10 s.
6. A motorcycle has a uniform acceleration of 4 m·s−1. Assume the motorcyclehas an initial velocity of 20 m·s−1. Determine the velocity and displacement atthe end of 12 s.
7. An aeroplane accelerates uniformly such that it goes from rest to 144 km·hr−1in8 s. Calculate the acceleration required and the total distance that it hastraveled in this time.
3.10 Applications in the Real-World
What we have learnt in this chapter can be directly applied to road safety. We can analyse therelationship between speed and stopping distance. The following worked example illustrates thisapplication.
Worked Example 14: Stopping distance
Question: A truck is travelling at a constant velocity of 10 m·s−1when the driversees a child 50 m in front of him in the road. He hits the brakes to stop the truck.The truck accelerates at a rate of -1.25 m·s−2. His reaction time to hit the brakesis 0,5 seconds. Will the truck hit the child?Answer
Step 1 : Analyse the problem and identify what information is given
It is useful to draw a timeline like this one:
59

3.10 CHAPTER 3. MOTION IN ONE DIMENSION - GRADE 10
driverseeschild
driverhitsbrakes
constant v negative acceleration
childishere
A B C� � ��
50 m
0,5 sv = 10 m·s−1
We need to know the following:
• What distance the driver covers before hitting the brakes.
• How long it takes the truck to stop after hitting the brakes.
• What total distance the truck covers to stop.
Step 2 : Calculate the distance AB
Before the driver hits the brakes, the truck is travelling at constant velocity. Thereis no acceleration and therefore the equations of motion are not used. To find thedistance traveled, we use:
v =d
t
10 =d
0,5
d = 5 m
The truck covers 5 m before the driver hits the brakes.
Step 3 : Calculate the time BC
We have the following for the motion between B and C:
vi = 10 m · s−1
vf = 0 m · s−1
a = −1,25 m · s−2
t = ?
We can use equation 3.1
vf = vi + at
0 = 10 + (−1,25)t
−10 = −1,25t
t = 8 s
Step 4 : Calculate the distance BC
For the distance we can use equation 3.2 or equation 3.3. We will use equation 3.2:
Δx =(vi + vf )
2t
Δx =10 + 0
s(8)
Δx = 40 m
Step 5 : Write the final answer
The total distance that the truck covers is dAB + dBC = 5 + 40 = 45 meters. Thechild is 50 meters ahead. The truck will not hit the child.
60

CHAPTER 3. MOTION IN ONE DIMENSION - GRADE 10 3.11
3.11 Summary
• A reference point is a point from where you take your measurements.
• A frame of reference is a reference point with a set of directions.
• Your position is where you are located with respect to your reference point.
• The displacement of an object is how far it is from the reference point. It is the shortestdistance between the object and the reference point. It has magnitude and directionbecause it is a vector.
• The distance of an object is the length of the path travelled from the starting point to theend point. It has magnitude only because it is a scalar.
• A vector is a physical quantity with magnitude and direction.
• A scalar is a physical quantity with magnitude only.
• Speed (s) is the distance covered (d) divided by the time taken (Δt):
s =d
Δt
• Average velocity (v) is the displacement (Δx) divided by the time taken (Δt):
v =Δx
Δt
• Instantaneous speed is the speed at a specific instant in time.
• Instantaneous velocity is the velocity at a specific instant in time.
• Acceleration (a) is the change in velocity (Δx) over a time interval (Δt):
a =Δv
Δt
• The gradient of a position - time graph (x vs. t) give the velocity.
• The gradient of a velocity - time graph (v vs. t) give the acceleration.
• The area under a velocity - time graph (v vs. t) give the displacement.
• The area under an acceleration - time graph (a vs. t) gives the velocity.
• The graphs of motion are summarised in figure 3.10.
• The equations of motion are used where constant acceleration takes place:
vf = vi + at
Δx =(vi + vf )
2t
Δx = vit +1
2at2
v2f = v2
i + 2aΔx
61

3.12 CHAPTER 3. MOTION IN ONE DIMENSION - GRADE 10
3.12 End of Chapter Exercises: Motion in One Dimension
1. Give one word/term for the following descriptions.
(a) The shortest path from start to finish.
(b) A physical quantity with magnitude and direction.
(c) The quantity defined as a change in velocity over a time period.
(d) The point from where you take measurements.
(e) The distance covered in a time interval.
(f) The velocity at a specific instant in time.
2. Choose an item from column B that match the description in column A. Write down onlythe letter next to the question number. You may use an item from column B more thanonce.
Column A Column Ba. The area under a velocity - time graph gradientb. The gradient of a velocity - time graph areac. The area under an acceleration - time graph velocityd. The gradient of a displacement - time graph displacement
accelerationslope
3. Indicate whether the following statements are TRUE or FALSE. Write only ’true’ or ’false’.If the statement is false, write down the correct statement.
(a) A scalar is the displacement of an object over a time interval.
(b) The position of an object is where it is located.
(c) The sign of the velocity of an object tells us in which direction it is travelling.
(d) The acceleration of an object is the change of its displacement over a period in time.
4. [SC 2003/11] A body accelerates uniformly from rest for t0 seconds after which it continueswith a constant velocity. Which graph is the correct representation of the body’s motion?
t
x
t0 t
x
t0 t
x
t0 t
x
t0
(a) (b) (c) (d)
5. [SC 2003/11] The velocity-time graphs of two cars are represented by P and Q as shown
0 1 2 3 40
1
2
3
4
5
6 P
Q
t (s)
v (m·s−1)
The difference in the distance travelled by the two cars (in m) after 4 s is . . .
62
CHAPTER 3. MOTION IN ONE DIMENSION - GRADE 10 3.12
(a) 12
(b) 6
(c) 2
(d) 0
6. [IEB 2005/11 HG] The graph that follows shows how the speed of an athlete varies withtime as he sprints for 100 m.
speed (m·s−1)
time (s)
10
t 11
Which of the following equations can be used to correctly determine the time t for whichhe accelerates?
(a) 100 = (10)(11)− 1
2(10)t
(b) 100 = (10)(11) + 1
2(10)t
(c) 100 = 10t + 1
2(10)t2
(d) 100 = 1
2(0)t + 1
2(10)t2
7. [SC 2002/03 HG1] In which one of the following cases will the distance covered and themagnitude of the displacement be the same?
(a) A girl climbs a spiral staircase.
(b) An athlete completes one lap in a race.
(c) A raindrop falls in still air.
(d) A passenger in a train travels from Cape Town to Johannesburg.
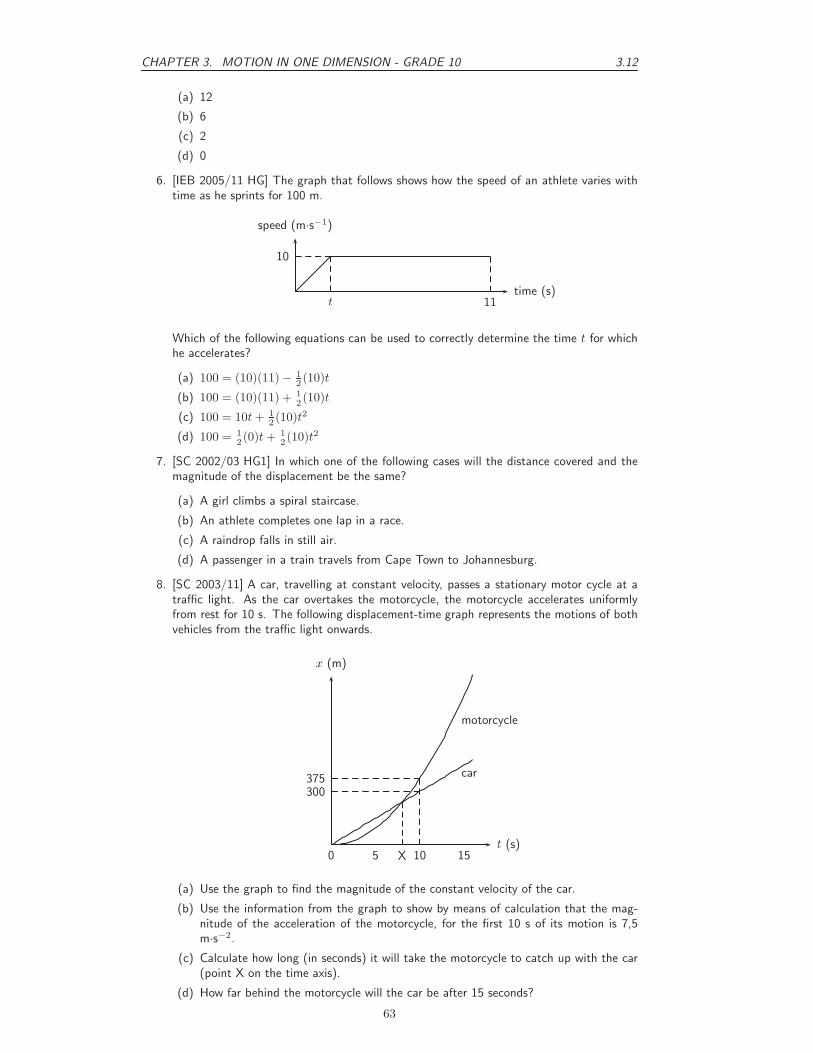
8. [SC 2003/11] A car, travelling at constant velocity, passes a stationary motor cycle at atraffic light. As the car overtakes the motorcycle, the motorcycle accelerates uniformlyfrom rest for 10 s. The following displacement-time graph represents the motions of bothvehicles from the traffic light onwards.
motorcycle
car
x (m)
t (s)
375300
0 5 X 10 15
(a) Use the graph to find the magnitude of the constant velocity of the car.
(b) Use the information from the graph to show by means of calculation that the mag-nitude of the acceleration of the motorcycle, for the first 10 s of its motion is 7,5m·s−2.
(c) Calculate how long (in seconds) it will take the motorcycle to catch up with the car(point X on the time axis).
(d) How far behind the motorcycle will the car be after 15 seconds?
63
3.12 CHAPTER 3. MOTION IN ONE DIMENSION - GRADE 10
9. [IEB 2005/11 HG] Which of the following statements is true of a body that acceleratesuniformly?
(a) Its rate of change of position with time remains constant.
(b) Its position changes by the same amount in equal time intervals.
(c) Its velocity increases by increasing amounts in equal time intervals.
(d) Its rate of change of velocity with time remains constant.
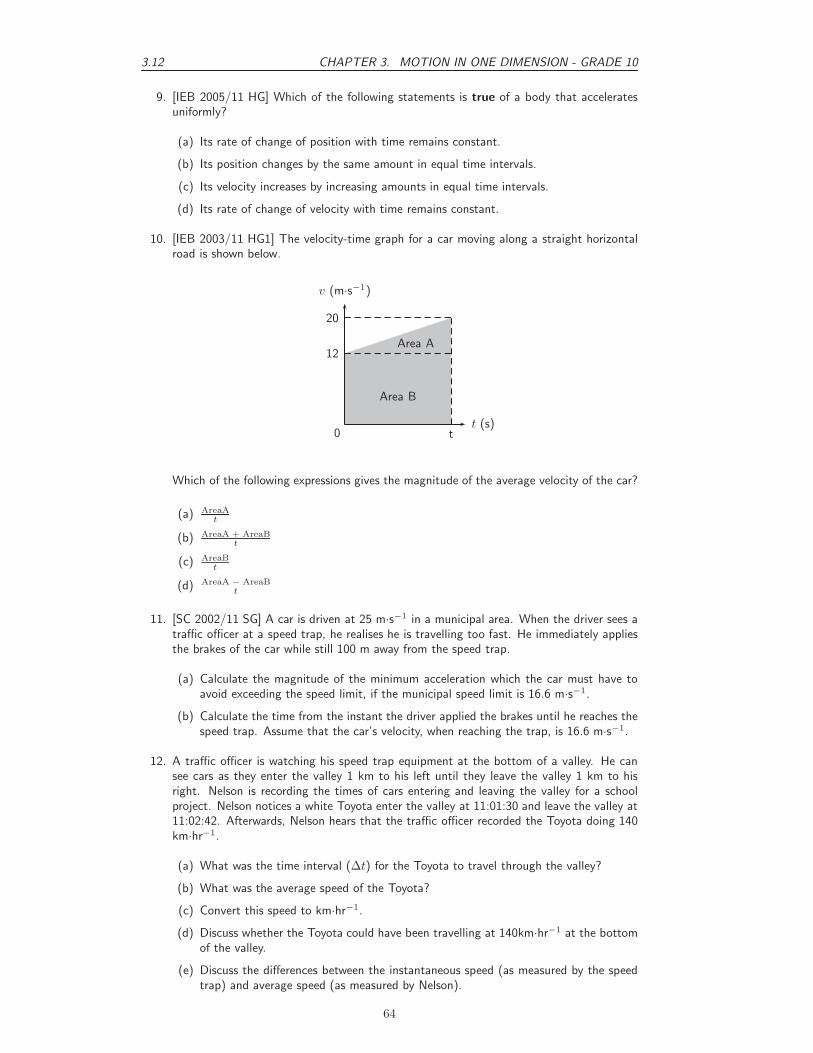
10. [IEB 2003/11 HG1] The velocity-time graph for a car moving along a straight horizontalroad is shown below.
t (s)
v (m·s−1)
20
12
0 t
Area A
Area B
Which of the following expressions gives the magnitude of the average velocity of the car?
(a) AreaA
t
(b) AreaA + AreaB
t
(c) AreaB
t
(d) AreaA − AreaB
t
11. [SC 2002/11 SG] A car is driven at 25 m·s−1 in a municipal area. When the driver sees atraffic officer at a speed trap, he realises he is travelling too fast. He immediately appliesthe brakes of the car while still 100 m away from the speed trap.
(a) Calculate the magnitude of the minimum acceleration which the car must have toavoid exceeding the speed limit, if the municipal speed limit is 16.6 m·s−1.
(b) Calculate the time from the instant the driver applied the brakes until he reaches thespeed trap. Assume that the car’s velocity, when reaching the trap, is 16.6 m·s−1.
12. A traffic officer is watching his speed trap equipment at the bottom of a valley. He cansee cars as they enter the valley 1 km to his left until they leave the valley 1 km to hisright. Nelson is recording the times of cars entering and leaving the valley for a schoolproject. Nelson notices a white Toyota enter the valley at 11:01:30 and leave the valley at11:02:42. Afterwards, Nelson hears that the traffic officer recorded the Toyota doing 140km·hr−1.
(a) What was the time interval (Δt) for the Toyota to travel through the valley?
(b) What was the average speed of the Toyota?
(c) Convert this speed to km·hr−1.
(d) Discuss whether the Toyota could have been travelling at 140km·hr−1 at the bottomof the valley.
(e) Discuss the differences between the instantaneous speed (as measured by the speedtrap) and average speed (as measured by Nelson).
64
CHAPTER 3. MOTION IN ONE DIMENSION - GRADE 10 3.12
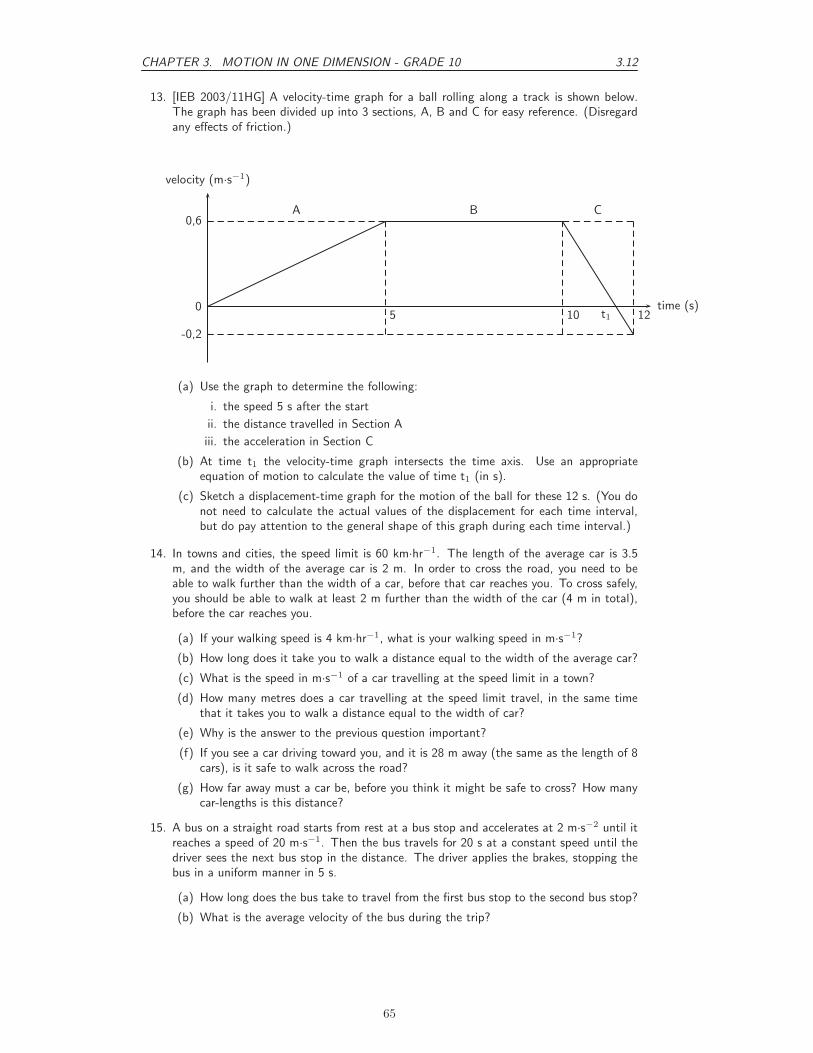
13. [IEB 2003/11HG] A velocity-time graph for a ball rolling along a track is shown below.The graph has been divided up into 3 sections, A, B and C for easy reference. (Disregardany effects of friction.)
time (s)
velocity (m·s−1)
A B C
121050
-0,2
0,6
t1
(a) Use the graph to determine the following:
i. the speed 5 s after the start
ii. the distance travelled in Section A
iii. the acceleration in Section C
(b) At time t1 the velocity-time graph intersects the time axis. Use an appropriateequation of motion to calculate the value of time t1 (in s).
(c) Sketch a displacement-time graph for the motion of the ball for these 12 s. (You donot need to calculate the actual values of the displacement for each time interval,but do pay attention to the general shape of this graph during each time interval.)
14. In towns and cities, the speed limit is 60 km·hr−1. The length of the average car is 3.5m, and the width of the average car is 2 m. In order to cross the road, you need to beable to walk further than the width of a car, before that car reaches you. To cross safely,you should be able to walk at least 2 m further than the width of the car (4 m in total),before the car reaches you.
(a) If your walking speed is 4 km·hr−1, what is your walking speed in m·s−1?
(b) How long does it take you to walk a distance equal to the width of the average car?
(c) What is the speed in m·s−1 of a car travelling at the speed limit in a town?
(d) How many metres does a car travelling at the speed limit travel, in the same timethat it takes you to walk a distance equal to the width of car?
(e) Why is the answer to the previous question important?
(f) If you see a car driving toward you, and it is 28 m away (the same as the length of 8cars), is it safe to walk across the road?
(g) How far away must a car be, before you think it might be safe to cross? How manycar-lengths is this distance?
15. A bus on a straight road starts from rest at a bus stop and accelerates at 2 m·s−2 until itreaches a speed of 20 m·s−1. Then the bus travels for 20 s at a constant speed until thedriver sees the next bus stop in the distance. The driver applies the brakes, stopping thebus in a uniform manner in 5 s.
(a) How long does the bus take to travel from the first bus stop to the second bus stop?
(b) What is the average velocity of the bus during the trip?
65

3.12 CHAPTER 3. MOTION IN ONE DIMENSION - GRADE 10
66