motion correction in fmri time series
DESCRIPTION
Motion Correction in fMRI time series. J.-F. Mangin, L. Freire, A. Roche, C Poupon. Service Hospitalier Frédéric Joliot, CEA, Orsay, France Instituto de Biofisica e Engenharia Biomedica, FCUL, Lisboa, Portugal Instituto de Medicina Nuclear, FML, Lisboa, Portugal - PowerPoint PPT PresentationTRANSCRIPT

IPAM 2004 DSVSHFJ
Motion Correction in fMRI time series
J.-F. Mangin, L. Freire, A. Roche, C Poupon
Service Hospitalier Frédéric Joliot, CEA, Orsay, FranceInstituto de Biofisica e Engenharia Biomedica, FCUL, Lisboa, Portugal
Instituto de Medicina Nuclear, FML, Lisboa, PortugalProjet Epidaure, INRIA, Sophia-Antipolis, France
Medical Vision Laboratory, Oxford, UK
IPAM 2004 DSVSHFJ
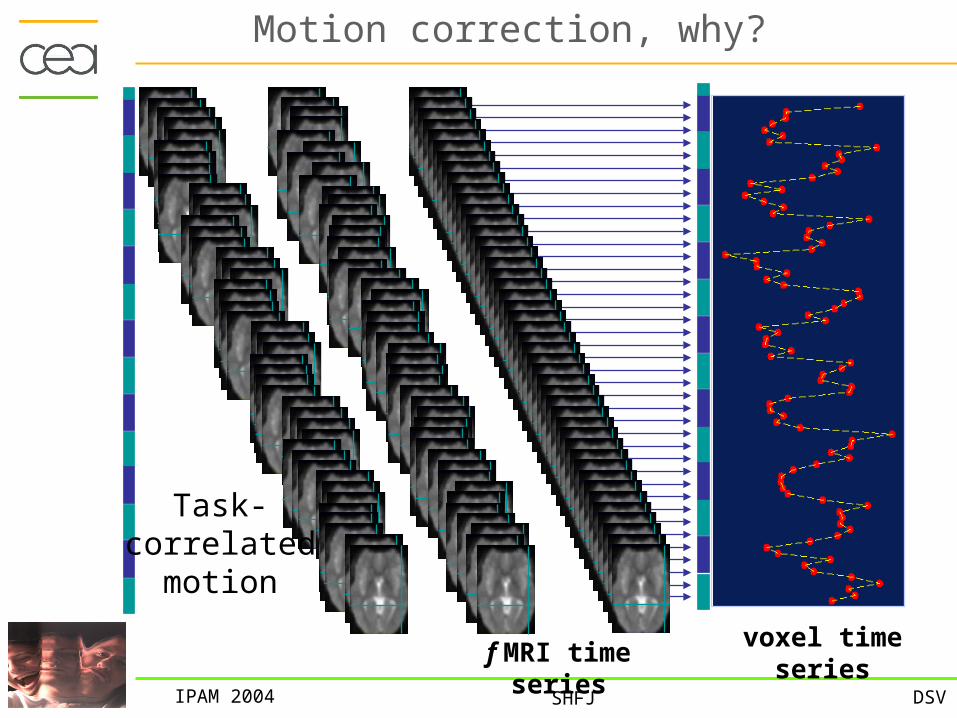
f MRI time seriesvoxel time series
Motion correction, why?
Task-correlated
motion

IPAM 2004 DSVSHFJ
Which solutions?
• Some constraints in the scanner to minimize motion
• Tracking (anatomical or artificial landmarks)
• On line corrections (MR Echo Navigator)
• Postprocessing: image registration

IPAM 2004 DSVSHFJ
Image registration
Definition: given two images, find the geometrical transformation that « best » aligns homologous voxels
First 3D image Second 3D image

IPAM 2004 DSVSHFJ
Classification of registration problems
• Search space (rigid, non-rigid)
• Monomodal / multimodal
• Intra-subject / inter-subjects

IPAM 2004 DSVSHFJ
General formulation of image registration
Given two images I et J,
),,(maxargˆΤ
TJISTT
Similarity measure
Search space (rigid, affine, spline, etc.)
Optimization scheme

IPAM 2004 DSVSHFJ
Building a similarity measure
Geometric Approach
• Detect features (points, lines, surfaces,… graphs) • Measure the distance between these features
Iconic Approach
Direct comparison of intensities

IPAM 2004 DSVSHFJ
Intuitive example
How to register these images ?

IPAM 2004 DSVSHFJ
Geometric/Iconic Approach
Feature detection (here, points with high curvature)
Measure: for instance, k
kkTTS2
)()( yx

IPAM 2004 DSVSHFJ
Feature detection (here, points with high curvature)
Measure: for instance, k
kkTTS2
)()( yx
Geometric/Iconic Approach

IPAM 2004 DSVSHFJ
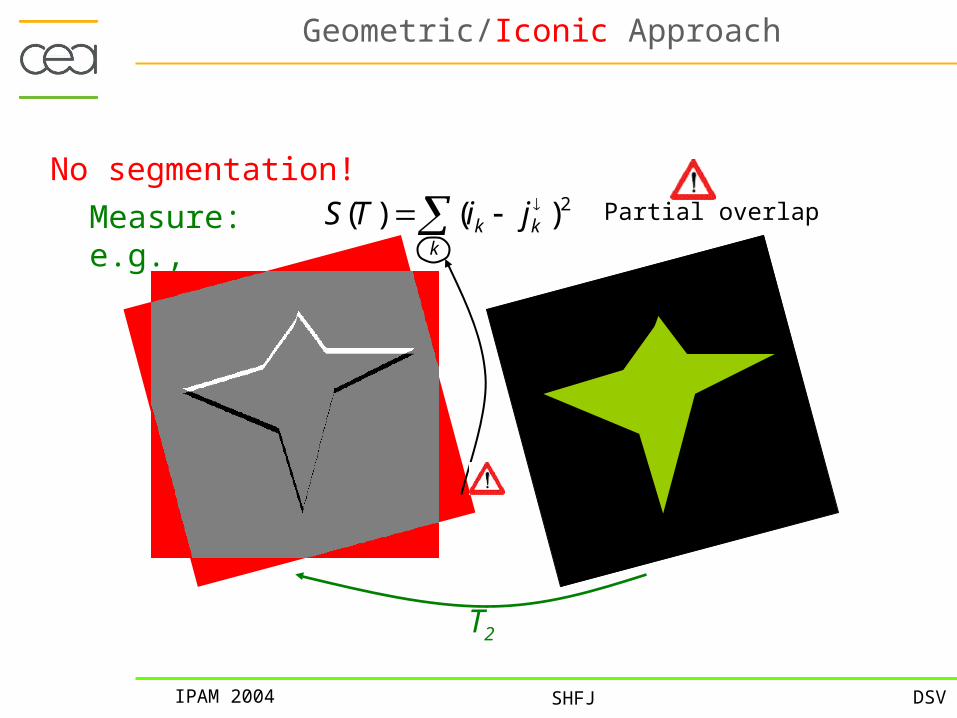
No segmentation!
Measure: e.g., k
kk jiTS 2)()(
kikj
)( kT x kx
T
))(( kk TJj xInterpolation:
Geometric/Iconic Approach

IPAM 2004 DSVSHFJ
No segmentation!
T1 =Id
Measure: e.g., k
kk jiTS 2)()(
Geometric/Iconic Approach
The simple case of binary images…
IPAM 2004 DSVSHFJ
No segmentation!
T2
Measure: e.g., k
kk jiTS 2)()( Partial overlap
Geometric/Iconic Approach

IPAM 2004 DSVSHFJ
Iconic approach for fMRI!
A typical fMRI imageof the nineties
A lot of widely used softwares:SPM, AIR, AFNI, etc.
Minimize thesum of squared differences
Search through rigid motions(sometimes affine)

IPAM 2004 DSVSHFJ
Main differences between softwares?
•Preprocessing (smoothing)•Interpolation
•Optimization scheme (iterative)
nearest neighbor linear spline
•Powell•Levenberg Marquardt•Modified Gauss-Newton
Fighting with local optimaImproving accuracy

IPAM 2004 DSVSHFJ
Iterative optimization of smooth measure
Small motion = good initialization

IPAM 2004 DSVSHFJ
Is everything fine?
t180 frames
18 frames (2 sec/frame)
Block design, 3T magnet
versus
Activations?
Motion correction

IPAM 2004 DSVSHFJ
The consequences of motions
Motion-related artifacts:
– intrascan motion;
– the spin history effect;
– interaction between motion and susceptibility;
– Non perfect estimation and interpolation.
Task-correlated motion =Confounds in cognitive analysis
Use motion estimations as regressors?

IPAM 2004 DSVSHFJ
Could activated areas be responsibleFor the task-correlated motion estimation?
BUT!
Is this monomodal situation so secure?
IPAM 2004 DSVSHFJ
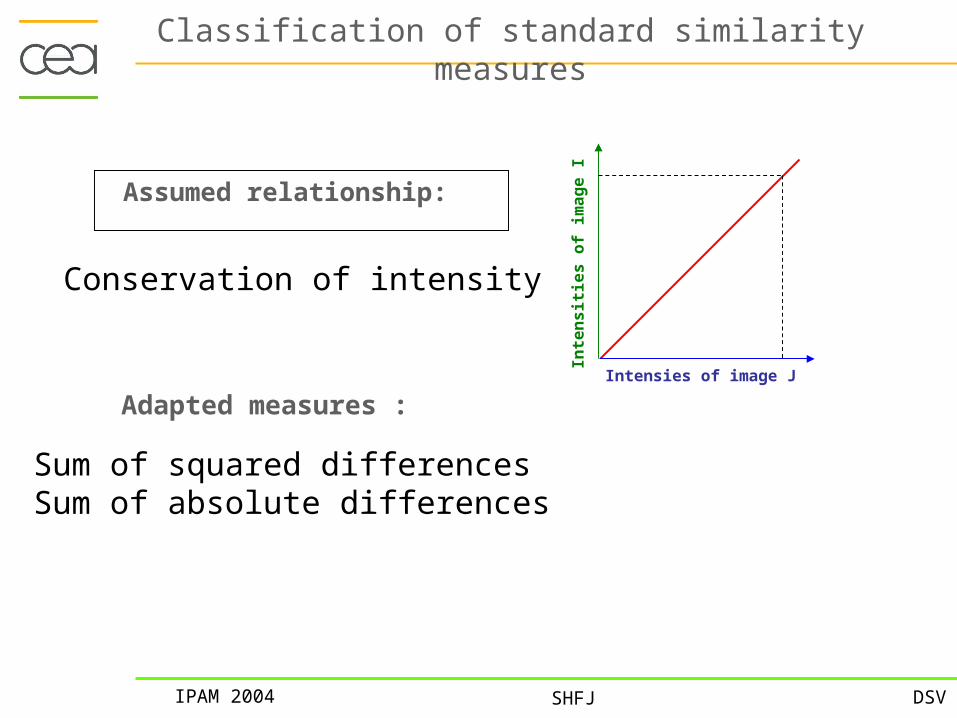
Classification of standard similarity measures
Assumed relationship:
Sum of squared differencesSum of absolute differences
Adapted measures :
Conservation of intensity
Intensies of image J
Inte
ns
itie
s o
f im
ag
e I
IPAM 2004 DSVSHFJ
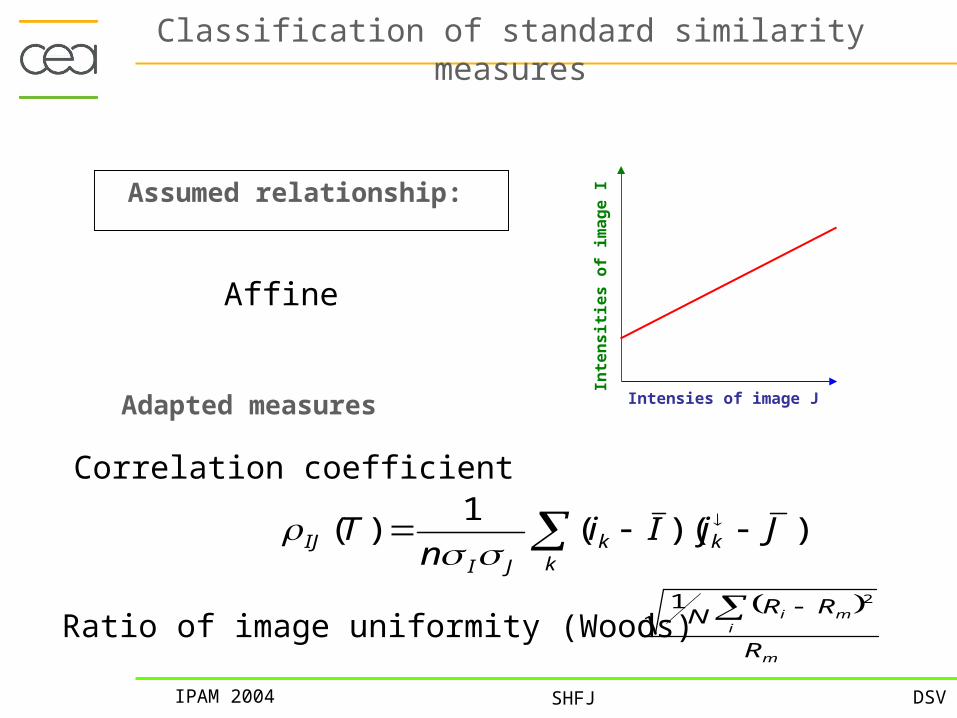
Affine
Adapted measures
Correlation coefficient
kkk
JIIJ JjIi
nT ))((
1)(
Classification of standard similarity measures
Assumed relationship:
Intensies of image J
Inte
ns
itie
s o
f im
ag
e I
m
imi
R
RRN 21
Ratio of image uniformity (Woods)

IPAM 2004 DSVSHFJ
Woods criterion (1993)Woods variants (Ardekani, 95; Alpert, 96; Nikou, 97)Correlation Ratio (Roche, 98)
Functional
Adapted measures
Classification of standard similarity measures
Assumed relationship:
Intensies of image J
Inte
ns
itie
s o
f im
ag
e I

IPAM 2004 DSVSHFJ
Joint entropy (Hill, 95; Collignon, 95)Mutual Information (Collignon, 95; Viola, 95)Normalized Mutual Information (Studholme, 98)
Statistical
Adapted measures
Classification of standard similarity measures
Assumed relationship:
Intensies of image J
Inte
ns
itie
s o
f im
ag
e I

IPAM 2004 DSVSHFJ
II. Methods Similarity Measures
• LS-SPM (Friston);• LS-AIR (Woods);• GM - custom (INRIAlign);• RIU-AIR (Woods);• CR – custom (Roche)• MI - custom (Wells, Maes, Viola).
Confounds related to interpolation method or search method ?
In some experiments
• LS - Custom;• RIU - Custom;
IPMI’01Do activated areas bias Least Square approaches?
Let us compare various methods…
The “sum of squared differences” measure
assumes Gaussiannoise for the differencebetween both images…

IPAM 2004 DSVSHFJ
Entropy for Image Registration
Define a joint probability distribution:
– Generate a 2-D histogram where each axis is the number of possible greyscale values in each image
– Each histogram cell is incremented each time a pair (I_1(x,y), I_2(x,y)) occurs in the pair of images
• If the images are perfectly aligned then the histogram is highly focused. As the images mis-align the dispersion grows
• recall Entropy is a measure of histogram dispersion

IPAM 2004 DSVSHFJ
– Define joint entropy to be:
– Images are registered when one is transformed relative
to the other to minimize the joint entropy
– The dispersion in the joint histogram is thus minimized
ji
jipjipBAH,
)],(log[),(),(
Using joint entropy for Image Registration

IPAM 2004 DSVSHFJ
Definitions of Mutual Information
Commonly used definitions:
I(A,B) = H(A) + H(B) - H(A,B)Maximizing the mutual info is equivalent to
minimizing the joint entropy (last term)
This definition is related to the Kullback-Leibler distance between two distributions
ba bpap
bapbapBAI
, )()(
),(log),(),(

IPAM 2004 DSVSHFJ
Aim of the comparison of methods:
– assess the potential bias in motion parameter estimation due to activation presence, whatever the actual accuracy of each method.
Accuracy study has been done in several works (Jiang, Frouin, West, Holden, etc.), and requires the study and optimization of each parameter influence, which is far beyond the scope of this work.
IPMI’01This is not a robustness or accuracy study !

IPAM 2004 DSVSHFJ
II. Methods Image Acquisition
– Brucker scanner operating at 3T using a 30 contiguous slice 2D EPI sequence (slice array of 64x64 voxels).
– Pixel size of 3.75mm and slice thickness of 4mm.
– Various simulated time series.
– Actual time series using a block design.
IPMI’01A few words about the datasets
IPAM 2004 DSVSHFJ
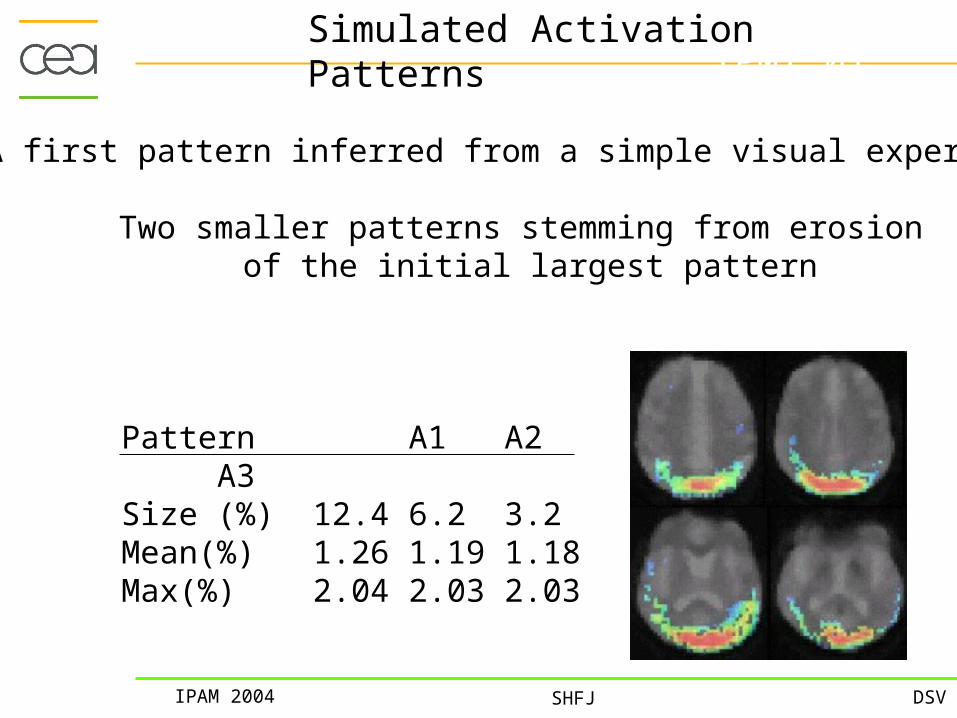
IPMI’01Simulated Activation Patterns
Pattern A1 A2 A3Size (%) 12.4 6.2 3.2Mean(%) 1.26 1.19 1.18Max(%) 2.04 2.03 2.03
A first pattern inferred from a simple visual experiment
Two smaller patterns stemming from erosion of the initial largest pattern

IPAM 2004 DSVSHFJ
Design of Simulated Time SeriesIPMI’01
3x3x3 median filtering
Tsim applied. 62x62x28 geometry. Gaussian/Rician noise ( = 2.5%)
Activation pattern
Reference image
Test images1 2 n

IPAM 2004 DSVSHFJ
Simulated Activations Without Motion
Run the six registration methods and evaluate the transformation parameters (tx, ty, tz, rx, ry, rz) for each package.
40 3-D Frames
Compute cross-correlation between each parameter and A1 time course and infer activated areas.
0 1 2 39
Test,1 Test,2 Test,39
+
I
x

IPAM 2004 DSVSHFJ
A couple of estimated motion parameters I

IPAM 2004 DSVSHFJ
Spatial Gaussian smoothing - 5mm
Low-pass filtering with 2-frame width
Spurious Clustered Voxels (false positives)
LS-SPM – 227 LS-AIR –16 RIU-AIR and MI - 0
Voxels activated if p-value > 0.001
Detection of “activated areas” using General Linear Model I

IPAM 2004 DSVSHFJ
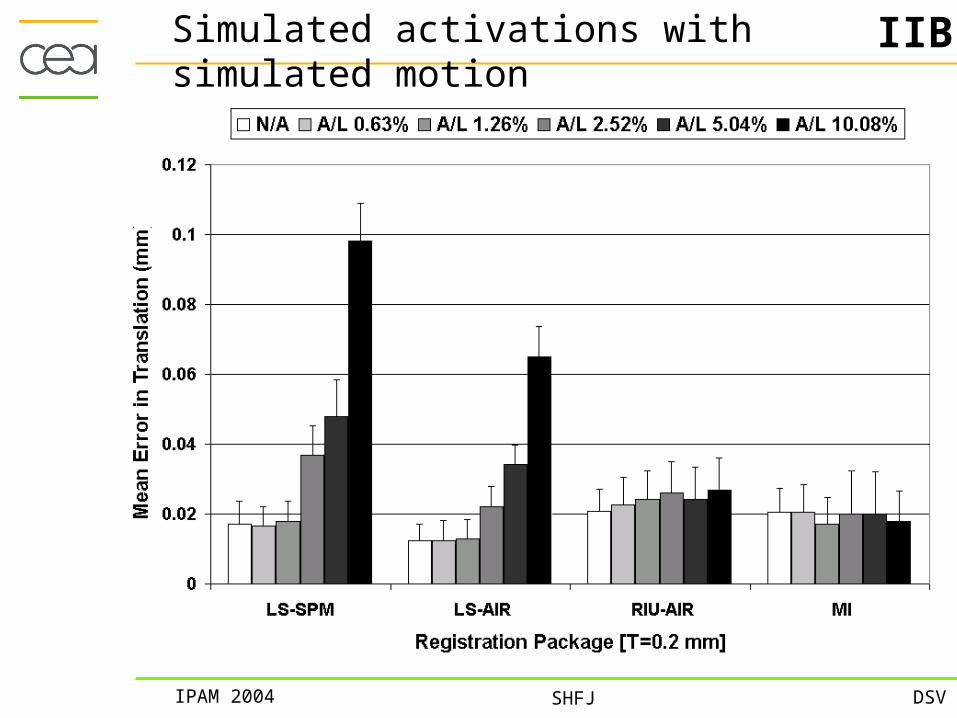
IPMI’01Simulated activations with simulated motion
t = 0.1, 0.2, 0.5, 1.0, 2.0 and 5.0 mm
r = 0.1, 0.2, 0.5, 1.0, and 2.0 deg
t=0.1mm
t=5.0mm
r=0.1deg
r=2.0deg
1 2 20
1 2 20
1 2 20
Tsim
II

IPAM 2004 DSVSHFJ
8 Different Reference Images
Nº Pattern Mean Signal Increase (%)
1 NA NA
2 A1 0.63
3 A1 1.26
4 A1 2.52
5 A1 5.04
6 A1 10.08
7 A2 2.52
8 A3 2.52
Simulated activations with simulated motion II

IPAM 2004 DSVSHFJ
Influence of motion amplitude
- 2 Reference images:
Pattern Mean Signal Increase (%)1 NA NA2 A1 0.633 A1 1.264 A1 2.525 A1 5.046 A1 10.087 A2 2.528 A3 2.52
- Test images:t = 0.1, 0.2, 0.5, 1.0, 2.0, 5.0 mm.r = 0.1, 0.2, 0.5, 1.0, 2.0 deg.
IPMI’01Simulated activations with simulated motion IIA

IPAM 2004 DSVSHFJ
Simulated activations with simulated motion IIA

IPAM 2004 DSVSHFJ
IIASimulated activations with simulated motion

IPAM 2004 DSVSHFJ
IPMI’01
Influence of activation amplitude
- 6 Reference images:
Pattern Mean Signal Increase (%)1 NA NA2 A1 0.633 A1 1.264 A1 2.525 A1 5.046 A1 10.087 A2 2.528 A3 2.52
- Test images:t = 0.2 mm.r = 0.2 deg.
Simulated activations with simulated motion IIB
IPAM 2004 DSVSHFJ
Simulated activations with simulated motion IIB

IPAM 2004 DSVSHFJ
Simulated activations with simulated motion IIB

IPAM 2004 DSVSHFJ
IPMI’01
Influence of activation size
- 4 Reference images:
Pattern Mean Signal Increase (%)1 NA NA2 A1 0.633 A1 1.264 A1 2.525 A1 5.046 A1 10.087 A2 2.528 A3 2.52
- Test images:t = 0.2 mm.r = 0.2 deg.
Simulated activations with simulated motion IIC

IPAM 2004 DSVSHFJ
Simulated activations with simulated motion IIC

IPAM 2004 DSVSHFJ
Simulated activations with simulated motion IIC

IPAM 2004 DSVSHFJ
– We have also performed an additional experiment on the influence of the initial spatial smoothing applied by SPM and AIR
– RIU-AIR problems are overcome by a large smoothing, but motion estimates turn out to be biased.
– For SPM, low smoothing implies smaller bias but motion estimates are less accurate.
IPMI’01Evaluation of spatial filtering pre-processing effect III

IPAM 2004 DSVSHFJ
III

IPAM 2004 DSVSHFJ
IPMI’01Experiment With Actual Time Series
t180 frames
18 frames (2 sec/frame)
IV

IPAM 2004 DSVSHFJ

IPAM 2004 DSVSHFJ
Statistical Inference: Gaussian smoothing (FWHM 5mm); High-pass temporal filtering (period 120s); Low-pass temporal filtering by a Gaussian function (4s).Two explanatory variables: Periodic stimulus convolved with a standard hemodynamic response; Time derivative of hemodynamic response.Voxels reported activated if the p-value > 0.05.
Experiment With Actual Time Series IV

IPAM 2004 DSVSHFJ
Experiment With Actual Time Series: “activations”

IPAM 2004 DSVSHFJ
IV. Discussion
“Robust” similarity measures have been classicaly used in multimodality registration studies.
In monomodality studies, when the residuals are endowed with a Gaussian distribution, LS-based methods are optimal estimators.
The experiments presented in this work prove that the use of LS-based methods for functional studies may be questioned, due to the presence of activated areas.
Activations can bias “sum of squares” measure

IPAM 2004 DSVSHFJ
– In first simulation, the use of the LS-custom method shows that the bias in LS-based similarity measures is related to the nature of the measure and not to the intrinsic computational implementation of each method.
– The bias may induce spurious activations along high-contrast brain edges, in the absence of subject motion.
– RIU-AIR and MI are more robust to activation presence, but presented qualitatively different results.
Accuracy vs. Robustness.
Measure comparison, first simulation

IPAM 2004 DSVSHFJ
– The second set of simulations indicates that RIU-AIR and MI accuracy does not depend on the presence of activations.
– Also that the bias magnitude is highly related to the signal change amplitude. This may explain why our 3T magnet led to more difficulties than more usual 1.5T scanners. Indeed, it can be seen that activation level has a more dramatic role on the accuracy decline than activation size.
Measure comparison, other simulations

IPAM 2004 DSVSHFJ
– The experiment with actual time series seems to be consistent with our interpretation of the simulation studies.
– LS-SPM and LS-AIR give different results, particularly in pitch. The other two methods do not detect this putative motion.
– Yaw estimations obtained by the four methods do not agree. This may be related to distortions that cannot be corrected with rigid-body transformations.
Actual time series

IPAM 2004 DSVSHFJ
– LS-based methods create spurious clusters of activated voxels, whose localization depends, in our opinion, on the brain edge orientation relatively to actual activation localization.
– Spurious activations may appear at the same place across individuals and survive to group analysis
– While we hope that this alarming prediction is too pessimistic, it calls for trying to minimize the risk.
Spurious activations

IPAM 2004 DSVSHFJ
V. Conclusion
– Our work has shown that “robust” similarity measures could improve the situation with activation-based outliers
– MI was used for historical reasons, but it may not be the best choice. MI is prone to local maxima problems.
– Could we build a dedicated robust similarity measure?
IPMI’01So what?

IPAM 2004 DSVSHFJ
Mutual Information weaknesses (Pluim, Tsao)
Numberof bins
Interpolationmethod
Estimation of the joint histogram (Parzen windows…)

IPAM 2004 DSVSHFJ
Taxonomy S. Measure Expression
Intensity Conservation
Least-squares (LS)
Least-squares with a GM estimator (GM)
Affine Dependence
Ratio of Image Uniformity (RIU)
Functional Dependence
Correlation Ratio (CR)
Statistical Mutual Information
Dependence (MI) a b ba
abab pp
pp log
22
2
2
/1 cba
bap
bap
a bab
a bab
m
imi
R
RRN 21
b
BbA
p 22
11
Which similarity measures?

IPAM 2004 DSVSHFJ
The influence of the cut-off parameter in GM
In the GM expression:
one shall tune the value of c.
However, the robustness against “outliers” may lead to local optima problems.
2
2
2
1c
ba
bap
a bab
Back to first simulation…

IPAM 2004 DSVSHFJ
The influence of spatial smoothing
GM with no smoothing leads to many local minima problems, thus smoothing is required.
In return, the CR and CRsym methods turn out to be more biased as the smoothing level increases.

IPAM 2004 DSVSHFJ
Simulated motionless time series.

IPAM 2004 DSVSHFJ
The actual time series

IPAM 2004 DSVSHFJ
Discussion
- MI and GM methods seem to be the most robust methods relatively to activation presence.
- The GM has a disadvantage, which is related to the tuning of the c parameter. A dynamic strategy to perform this tuning could eventually lead to better results.
- However, some correlations with the activation task persist.
- Build new dedicated measure after activation detection?

IPAM 2004 DSVSHFJ
Let us try this simple idea with a couple of measures
• LS – Custom (Friston et al., 1996);
• GM – Custom (Nikou et al., 1998);
• RIU – Custom (Woods et al., 1992);
• CR – Custom (Roche et al., 1998);
• MI – Custom (Collignon et al. 1995, Wells et al., 1996).
Similarity measures implemented according to the conventional (1) and the proposed approach (2), which discards the activation signal.

IPAM 2004 DSVSHFJ
Discarding the Activated areas
LS(1) RLS(1) RIU(1) CR(1) MI(1)
Mask LS(2) RLS(2) RIU(2) CR(2) MI(2)
reference test images
IPAM 2004 DSVSHFJ
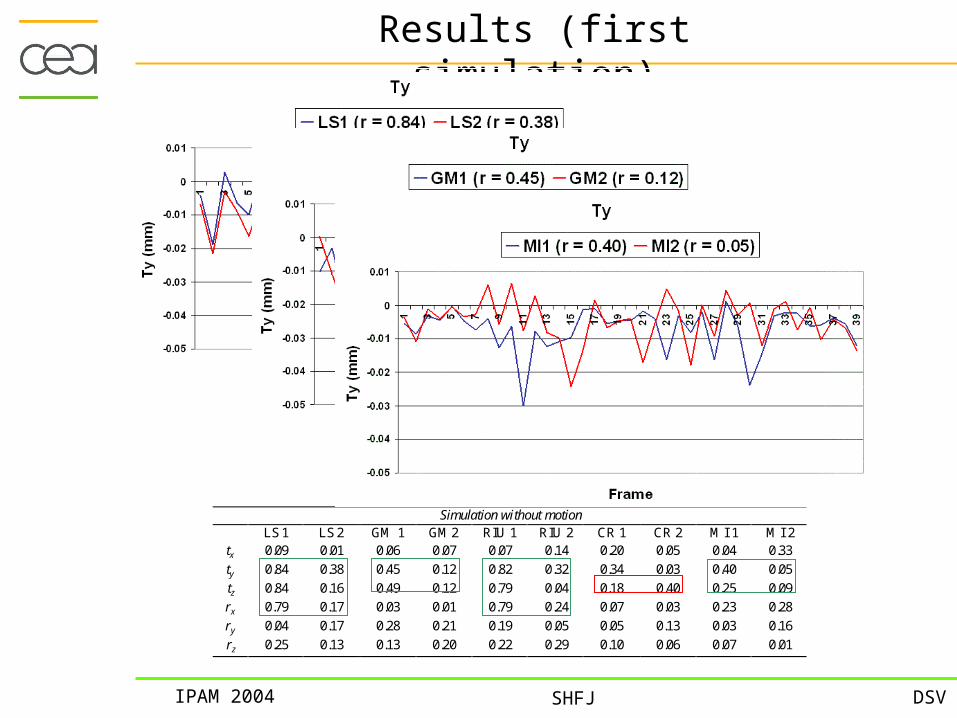
Results (first simulation)
Simulation without motion LS 1 LS 2 GM 1 GM2 RIU 1 RIU 2 CR 1 CR 2 MI 1 MI 2
tx 0.09 0.01 0.06 0.07 0.07 0.14 0.20 0.05 0.04 0.33
ty 0.84 0.38 0.45 0.12 0.82 0.32 0.34 0.03 0.40 0.05
tz 0.84 0.16 0.49 0.12 0.79 0.04 0.18 0.40 0.25 0.09
rx 0.79 0.17 0.03 0.01 0.79 0.24 0.07 0.03 0.23 0.28
ry 0.04 0.17 0.28 0.21 0.19 0.05 0.05 0.13 0.03 0.16
rz 0.25 0.13 0.13 0.20 0.22 0.29 0.10 0.06 0.07 0.01

IPAM 2004 DSVSHFJ
Results (actual time series)

IPAM 2004 DSVSHFJ
SET 1
LS 1 LS 2 GM 1 GM2 RIU 1 RIU 2 CR 1 CR 2 MI 1 MI 2 tx 0.27 0.27 0.14 0.13 0.29 0.23 0.04 0.05 0.02 0.14
ty 0.65 0.17 0.32 0.12 0.64 0.12 0.27 0.01 0.41 0.06
tz 0.46 0.14 0.16 0.34 0.17 0.25 0.12 0.27 0.19 0.42
rx 0.72 0.10 0.35 0.03 0.74 0.13 0.36 0.01 0.58 0.06
ry 0.02 0.05 0.14 0.09 0.07 0.07 0.06 0.03 0.14 0.07
rz 0.01 0.13 0.18 0.15 0.13 0.18 0.07 0.13 0.18 0.01
SET 2 LS 1 LS 2 GM 1 GM2 RIU 1 RIU 2 CR 1 CR 2 MI 1 MI 2
tx 0.17 0.24 0.03 0.02 0.20 0.30 0.13 0.01 0.01 0.02
ty 0.57 0.27 0.45 0.18 0.58 0.18 0.25 0.09 0.34 0.04
tz 0.63 0.29 0.27 0.02 0.45 0.19 0.11 0.15 0.17 0.05
rx 0.72 0.37 0.53 0.26 0.73 0.33 0.41 0.02 0.57 0.15
ry 0.05 0.16 0.12 0.04 0.21 0.20 0.01 0.02 0.10 0.20
rz 0.20 0.03 0.03 0.02 0.03 0.07 0.01 0.18 0.08 0.06
SET 3 LS 1 LS 2 GM 1 GM2 RIU 1 RIU 2 CR 1 CR 2 MI 1 MI 2
tx 0.36 0.40 0.03 0.15 0.36 0.41 0.03 0.09 0.29 0.21
ty 0.67 0.29 0.51 0.17 0.62 0.22 0.17 0.08 0.32 0.07
tz 0.64 0.11 0.33 0.03 0.46 0.04 0.33 0.06 0.23 0.10
rx 0.69 0.05 0.44 0.01 0.68 0.14 0.23 0.08 0.40 0.13
ry 0.01 0.04 0.06 0.03 0.10 0.02 0.04 0.15 0.07 0.01
rz 0.38 0.17 0.13 0.09 0.29 0.22 0.12 0.19 0.08 0.06
Results (3 actual time series)

IPAM 2004 DSVSHFJ
Results (2 actual time series, activations)

IPAM 2004 DSVSHFJ
Discussion
- This last work rules out the hypothesis of a true task-related motion. Indeed, discarding about 20% of the voxels almost removes the correlation with the task.
- The dilation of the mask is fundamental in order to avoid contamination of neighbor voxels by activated voxels
- The proposed strategy is easy to implement and suitable for most conventional studies. Improvements may be required when registering complex studies.
IPAM 2004 DSVSHFJ
- We have shown that the problem of registration of fMRI time series should be revised in order to take into account the influence of activation.
- We will have to study situations including true task-correlated motion.
- Detecting motion and activation simultaneously ?(Orchard et al., 2003).
- Interactions between motion and distortions!
General Conclusions & Further Work
Be careful!

IPAM 2004 DSVSHFJ
Eddy-Current Distortion Correction for MR Diffusion Imaging
+

IPAM 2004 DSVSHFJ
Several gradient directions ( at
least 6)
Several gradient strengths and
durations
Diffusion tensor imaging
Diffusion-weighted signal attenuation:
One gradient chronogram
= One b matrix
Chronogram
<x2>1/2
Td
D
50
1750
Tensor estimation:Tensor estimation:

IPAM 2004 DSVSHFJ
Eddy current related EPI distortions
Spatial resolution :1,875 mm x 1,875 mm x 2,8 mm
No gradient
Translation Shearing
Scaling
8 mm
Gradient 0 mT/m Gradient 22 mT/m
Diffusion-sensitizing gradientrelated distortion

IPAM 2004 DSVSHFJ
Slice by slice estimation of affine transformations
1T
1T
0T
S
Mutual information landscape
Maximum
Parzen window = truncated gaussianLinear resampling
grey value coded with 6 bits
Powellalgorithm
Mutual information maximization

IPAM 2004 DSVSHFJ
Results forone slice128 x 128
2mm x 2mm
Reference:T2-weighted4 repetitions
Diffusion gradients:
6 directions5 amplitudes4 repetitions
Higher variabilitywith CR
than with MI
X gradient:shearing
(frequency)
Y gradient:shrinking(phase)
Z gradient:translation (T0)
(slice)

IPAM 2004 DSVSHFJ
Improvements achieved by the new estimation scheme
T2-weightedFractional anisotropywithout corrections
Fractional anisotropywith the corrections
Fractionalanisotropy
=variability
ofthe tensor
eigenvalues
IPAM 2004 DSVSHFJ
That’s all
A SPM plug-in performing fMRI motion
correction using the Geman McClure robust estimator
is freely distributed by the Epidaure group (INRIA)
INRIAlign…