morphological, functional and …doktori.bibl.u-szeged.hu/4142/1/katadiána_phd_thesis.pdf · kata...
TRANSCRIPT

MORPHOLOGICAL, FUNCTIONAL AND IMMUNOMODULATORY
EFFECTS OF ROSUVASTATIN AND ASPIRIN IN CULTURED
MICROGLIAL CELLS
Diána Kata
Theoretical Medicine Doctoral School
Department of Cell Biology and Molecular Medicine
Faculty of Medicine and Faculty of Science and Informatics
University of Szeged
Ph.D. Thesis
Szeged, 2017

1
PUBLICATIONS RELATED TO THE THESIS:
I. Kata D, Földesi I, Feher LZ, Hackler L Jr, Puskas LG, Gulya K (2016)
Rosuvastatin enhances anti-inflammatory and inhibits pro-inflammatory functions
in cultured microglial cells. Neuroscience 314:47-63. (IF: 3.231)
II. Kata D, Földesi I, Feher LZ, Hackler L Jr, Puskas LG, Gulya K (2017) A novel
pleiotropic effect of aspirin: beneficial regulation of pro-and anti-inflammatory
mechanisms in microglial cells. Brain Research Bulletin Accepted for
publication, DOI: 10.1016/j.brainresbull.2017.05.009 (IF:2.572)
POSTERS RELATED TO THE THESIS:
I. Kata D, Gulya K (2014) Aspirin regulates the inflammatory responses of
activated microglia. 9th
FENS Forum of Neuroscience, Milan, Italy, FENS-
0477; C112
II. Kata D, Földesi I, Feher LZ, Hackler L Jr, Puskas LG, Gulya K (2015) A
rosuvastatin gyulladásgátló hatása bakteriális lipopoliszacharid által aktivált tiszta
mikroglia kultúrában. MÉT 79. Vándorgyűlése és a MMVBT 2015. évi
konferenciája, Szeged, Magyarország, P2.7

2
TABLE OF CONTENTS
Abbreviations
SUMMARY
1. INTRODUCTION
1.1. Roles of microglial cells in the central nervous system
1.2. Mechanisms and effects of statins
1.3. Mechanisms and effects of aspirin
2. SPECIFIC AIMS
3. MATERIALS AND METHODS
3.1. Animals
3.2. Antibodies
3.3. Preparation and maintenance of cell cultures
3.4. Cell culture treatments
3.5. Immunocytochemistry
3.6. Western blot analysis
3.7. Quantitative determination of in vitro phagocytosis
3.8. Quantitative determination of IL-1β, IL-10 and TNF-α
3.9. Determination of cell adhesion and proliferation
3.10. RNA isolation
3.11. RNA expression
3.12. Digital processing and image analysis
3.13. Statistical analysis
4. RESULTS
4.1. Morphological effects of rosuvastatin and aspirin treatments
4.2. Rosuvastatin inhibits proliferation and cell adhesion
4.3. Rosuvastatin and aspirin reduce the phagocytic activity in activated
microglia
4.4. Both rosuvastatin and aspirin decrease pro-inflammatory and increase anti-
inflammatory cytokine levels
4.5. The effects of rosuvastatin and aspirin on the expression of inflammation-
related genes
5. DISCUSSION
6. CONCLUSION
7. ACKNOWLEDGMENTS
8. REFERENCES
9. APPENDIX
3
4
6
6
8
11
13
14
14
14
14
15
16
16
17
18
18
18
19
20
21
22
22
29
30
33
36
47
54
55
56
69

3
Abbreviations
AA: arachidonic acid; Aβ: amyloid beta; AD: Alzheimer’s disease; APP: amyloid
precursor protein; BBB: blood-brain barrier; BDNF: brain derived neurotrophic factor;
Cd: cluster of differentiation; Cdc42: cell division control protein 42 homolog; CNS:
central nervous system COX: cyclooxygenase (prostaglandin-endoperoxide synthase; EC
1.14.99.1); DIV: days in vitro; DMEM: Dulbecco's Modified Eagle's Medium; E18:
embryonic day 18; ELISA: enzyme-linked immunosorbent assay; ERK: extracellular
signal-regulated kinase; FBS: fetal bovine serum; FPP: farnesyl-pyrophosphate; GAPDH:
glyceraldehyde 3-phosphate dehydrogenase (EC 1.2.1.12); GGPP: geranylgeranyl-
pyrophosphate; HDL: high density lipoprotein; HMG-CoA: 3-hydroxy-3-methyl glutaryl
coenzyme A; Iba1: ionized calcium-binding adaptor molecule 1; IL: interleukin; IκB:
inhibitor of kappa B; LDL: low-density lipoprotein ; LPS: bacterial lipopolysaccharide;
MAPK: mitogen activated protein kinase; MHC: major histocompatibility complex; MIP:
macrophage inflammatory protein; MS: multiple sclerosis; NF-κB: nuclear transcription
factor kappa B; NO: nitrogen oxide; NOS: nitrogen oxide synthase (EC 1.14.13.39);
NSAID: non-steroidal anti-inflammatory drug; OATP: organic anion transporting
polypeptide; PCR: polymerase chain reaction; PD: Parkinson's disease; PG:
prostaglandin; PBS: phosphate-buffered saline; RT: room temperature; RhoA: Ras
homolog family member A; ROS: reactive oxygen species; S.D.: standard deviation;
SDS: sodium dodecyl sulfate; subDIV: subcloned days in vitro; TBS: Tris-buffered
saline; TI: transformation index; TLR: toll-like receptor; TNF-: tumor necrosis factor .

4
SUMMARY
Microglia is the principal immune cell in the central nervous system. Under
pathophysiological conditions (injury, infection or neurodegeneration) microglia become
activated and proliferate, phagocytose and release pro- and anti-inflammatory cytokines,
growth factors or reactive species; this leads to profound morphological, functional and
gene expression changes that affect the inflammatory mechanism of these cells. Statins
are commonly used in the treatment of high blood cholesterol level. Although statins also
have beneficial effects on inflammation, they have not been thorougly investigated for
their ability to affect microglial function. Rosuvastatin inhibits cholesterol biosynthesis
most efficiently, and it is one of the most commonly prescribed drugs in cardiovascular
therapy. Aspirin, one of the most widely used non-steroidal anti-inflammatory drugs, also
has extensively studied effects on the cardiovascular system.
To reveal further pleiotropic, beneficial effects of rosuvastatin and aspirin on a
number of pro- and anti-inflammatory microglial mechanisms, we performed
morphometric and functional studies relating to cell adhesion and proliferation,
phagocytosis, pro- and anti-inflammatory cytokine production (IL-1β, tumor necrosis
factor- (TNF-) and IL-10, respectively), and analyzed the expression of a number of
inflammation-related genes, including those related to the above functions, in pure
microglial cells. We examined the effects of rosuvastatin (1 µM) and aspirin (0.1 mM and
1 mM) in unchallenged (control) and bacterial lipopolysaccharide (LPS)-challenged
secondary pure microglial cultures.
We found that microglia could be an important therapeutic target of rosuvastatin. In
unchallenged (control) microglia, rosuvastatin inhibited proliferation and cell adhesion,
but promoted microspike formation and elevated the expression of certain anti-
inflammatory genes (Cxcl1, Ccl5, Mbl2), while phagocytosis or pro- and anti-
inflammatory cytokine production were unaffected. Moreover, rosuvastatin markedly
inhibited microglial activation in LPS-challenged cells by affecting both their
morphology and functions as it inhibited LPS-elicited phagocytosis and inhibited pro-
inflammatory cytokine (IL-1, TNF-) production, concomitantly increasing the level of
IL-10, an anti-inflammatory cytokine. Finally, rosuvastatin beneficially and differentially
affected the expression of a number of inflammation-related genes in LPS-challenged
cells by inhibiting numerous pro-inflammatory and stimulating several anti-inflammatory
genes. In an overall similar fashion, aspirin affected microglial morphology and functions

5
in a dose-dependent manner as it inhibited LPS-elicited microglial activation by
promoting ramification and the inhibition of phagocytosis in both concentrations. Aspirin
strongly reduced the pro-inflammatory IL-1β and TNF-α production, while it increased
the anti-inflammatory IL-10 level in LPS-challenged cells. Moreover, aspirin
differentially regulated the expression of a number of inflammation-related genes as it
downregulated such pro-inflammatory genes as Nos2, Kng1, IL-1β, Ptgs2 or Ccr1, while
it upregulated some anti-inflammatory genes such as IL-10, Csf2, Cxcl1, Ccl5 or Tgfb1.
Since microglial cells could elicit pro-inflammatory responses leading to
neurodegeneration, it is important to attenuate such mechanisms and promote anti-
inflammatory properties, and develop prophylactic therapies. Thus, based on our studies,
the use of rosuvastatin and aspirin could be beneficial in the medication of certain
neurodegenerative disorders.

6
1. INTRODUCTION
1.1. Roles of microglial cells in the central nervous system
Microglial cells are the resident immune cells in the central nervous system (CNS) and
contribute to 10-12% of its total cell population. They are from the monocyte/macrophage
lineage and belong to the group of mononuclear phagocytes (Ginhoux et al., 2010; Prinz
and Priller, 2014). Microglial cells are the most remarkable sensors that contribute to the
homeostatis of the CNS (Franco and Fernandez-Suarez, 2015). They play important roles
in both physiological and pathophysiologycal conditions such as traumatic injury, stroke,
ischemia or neurodegenerative diseases (Kreutzberg, 1996). Microglial cells enter the
brain during the early embryonic development. From the middle of the first trimester to
the early part of the second trimester blood monocytes invade the CNS and give rise to
the microglia population (Kettenmann et al., 2011). In the healthy intact brain microglial
cells exist in a stable population. After damage to the blood brain barrier (BBB) blood
monocytes are able to enter the brain and transform into microglial cells.
Microglial cells are well known for their functions related to morphological
features. In the healty brain micoglial cells have a ramified morphology. These cells have
small soma with branching cellular processes. This appearance is associated with the
"resting" state (Block and Hong, 2005; Kettenmann et al, 2011). Upon challenges such as
infection, ischemia, trauma, neurodegenerative diseases or altered brain homeostasis
microglia transforms from resting to activated state. The activation leads to rapid and
profound changes in microglial morphology, functions and gene expression. During the
activation microglia reduce their cellular complexity by retracting their processes and turn
into an amoeboid phenotype (Block and Hong, 2005; Kettenmann et al., 2011). In
connection with the morphological features of these cells in vivo, it must be noted that
microglial cells in vitro generally do not show this typical ramified morphology. Under in
vivo conditions, they usually have heterogeneous shapes such as bushy, rod-shaped or bi -
and tripolar spindle-shaped forms with short, thick processes and lamellopodias
(Kettenmann et al., 2011). The morphological changes and reorganization by the
activation can still be imposed and remain noticeable in vitro.
Activated microglial cells are also capable of releasing different types of soluble
factors with inflammatory and immunoregulatory effects. They are able to release
chemoattractive factors which can guide immune cells to the CNS. Further, surface
molecules for cell-cell and cell-matrix interactions such as complement receptors and

7
major histocompatibility complex (MHC) molecules are also upregulated. Activated
microglial cells also have increased proliferative and phagocytic activity (Block and
Hong, 2005; Kettenmann et al., 2011). Similarly to macrophage cells activated microglial
cells can be divided to subtypes (Franco and Fernandez-Suarez, 2015). M1 type cells are
cytotoxic and exhibit proinflammatory markers and factors such as reactive oxygen and
nitrogen intermediates, proinflammatory cytokines (e.g. IL-1β, IL-12, IL-23, TNF-α),
proteolytic enzymes and arachidonic acid metabolites. M2 type cells contribute to repair
and regeneration by expressing anti-inflammatory cytokines such as IL-10,
immunoregulatory molecules and trophic factors such as brain-derived neurotrophic
factor (BDNF) (Stollg and Jander, 1999; Block and Hong, 2005; Franco and Fernandez-
Suarez, 2015). M2 cells also show increased phagocytic capability (Prinz and Priller,
2014). Although such anti-inflammatory mechanisms are essential in protecting the CNS,
activated microglial cells can also be harmful to neurons by eliciting neuroinflammation
that could lead to neurodegeneration (Banati et al., 1993; Gehrmann et al., 1995;
Gonzalez-Scarano and Baltuch, 1999; Streit, 2002; Graeber, 2010; Gresa-Arribas et al.,
2012; Ghosh et al., 2013).
Unregulated and maladapted responses or chronic over-activation could lead to
neurotoxic consequences. Accumulating evidences indicate that microglial cells and
inflammatory responses play crucial role in connection with multiple neurodegenerative
diseases (Long-Smith et al, 2009; Prokop et al., 2013). For example, previous studies
revealed that in Alzheimer's disease (AD) brain microglial cells could be located in the
centre of senile plaques (Stollg and Jander, 1999). The activated and proliferating
microglial cells present around the amyloid deposits activate inflammatory processes
(Arends et al., 2000). Amyloid-beta (Aβ) activates the production of proinflammatory
cytokines and mediators such as IL-1β, IL-6, IL-8, TNF-α, the macrophage inflammatory
protein (MIP) - 1α, nitric oxide (NO), inducible nitric oxide sythase (iNOS) and
glutamate in microglial cells (McGeer and McGeer, 1995, 2003; Arends et al., 2000;
Benveniste et al., 2001). The proinflammatory cytokine IL-1 that promotes the synthesis
of amyloid precursor protein (APP) is overexpressed in the AD brain and therefore
triggers further amyloid production (McGeer and McGeer, 1995, 2003; Akiyama et al.,
2000). Parkinson's disease (PD) can also be characterized by overactive immune response
of the brain (Phani et al., 2011). Previous studies suggested that many proinflammatory
cytokines are upregulated in PD such as IL-1β, IL-2, IL-6, TNF-α (Orr et al., 2004). IL-1
increases the expression of α-synuclein, the main component of the Lewy-body protein

8
aggregates; α-synuclein is able to activate further microglial cells to produce superoxide
and increase the concentration of reactive oxigen species (ROS) and reactive nitrogen
species that are the main sources of the oxidative stress responsible for dopaminergic cell
death (McGeer and McGeer, 2004; Block and Hong, 2005; Phani et al., 2011). Microglial
cells also play crucial role in multiple sclerosis (MS). MS is a well-known inflammation-
mediated demyelinating disease (Block and Hong, 2005). During MS an increased
microglial activity can be observed. Microglial cells proliferate and increase lysosomal
activity around the site of demyelinization (Block and Hong, 2005). At the site of the
lesion microglia display increased COX-2 and iNOS expression which in turn promote
the production of neurotoxic prostaglandin E2 (PGE2) and NO. Activated microglial cells
also secrete proteases and TNF-α (Minagar et al., 2002, Muzio et al., 2007). NO and
TNF-α damage oligodendrocytes and the myelin sheet, and contribute to demyelination
(Block and Hong, 2005). Microglial cells are also capable of engulfing myelin (Minagar
et al., 2002). Perivascular microglial cells excert antigen presenting cell function to
myelin-specific T-cells infiltrating the CNS which initiates the progression of MS (Block
and Hong, 2005; Muzio et al., 2007). Pharmacological regulation of microglial functions
may therefore play an important role in the prevention and during the progression of
several neurodegenerative diseases.
1.2. Mechanisms and effects of statins
The 3-hydroxy-3-methyl glutaryl coenzyme A (HMG-CoA) reductase inhibitors
(HMGCRIs), commonly known as statins, are the agents of first choice for the treatment
of high blood cholesterol levels (Wierzbicki et al., 2003; Taylor et al., 2013). They were
discovered in 1975 as natural products of some moulds. These inhibitors can be divided
in two groups: the natural compounds derived from fungal fermentation, and the fully
synthetic compounds (Zipp et al., 2007). Their main biochemical effect is the reduction of
the amount of low-density lipoprotein (LDL) cholesterol, but they can also increase the
amount of high density lipoprotein (HDL) cholesterol and reduce triglyceride
concentration (Wierzbicki et al., 2003). Statins act by blocking the cholesterol synthesis
through inhibition of the enzyme necessary for the production of L-mevalonate. Statins
can bind competitively to the HMGCR displacing its natural substrate HMG-CoA (Zipp
et al., 2007). Inhibition of the first step of cholesterol synthesis also decreases the pools of
intermediate metabolites in the pathway that have crucial metabolic functions (Wierzbicki
9
et al., 2003; Cordle et al., 2005). The pathway of cholesterol synthesis produces farnesyl-
pyrophosphate (FPP) which can be used for the production of geranylgeranyl-
pyrophosphate (GGPP). Both FPP and GGPP are isoprenoids that are involved in the
post-translational protein modification process called prenylation. Isoprenylated proteins
include nuclear lamins, protein kinases and G-proteins. Prenylation is required for the
assembly of G-protein heterotrimers. Through their effect of isoprenylated G-protein-
mediated signalling, statins regulate a wide range of cellular functions.
The small monomer G-proteins, such as Rho, are also regulated by prenylation.
Small G-proteins are part of many cellular functions including cell growth, transcriptional
regulation, intracellular trafficking, cell motility, phagocytosis and cytoskeleton
rearrangement (Takai et al., 2001; Cordle et al., 2005). The Rho subfamily of small G-
proteins regulates the actin-based cytoskeleton. Activation of RhoA, Rac and Cdc42 leads
to the formation of stress fibres, lamellopodia, filopodia (Corde et al., 2015). GTPases are
also involved in events leading to inflammation (Zipp et al., 2007). RhoA is involved in
inflammatory signal transduction cascades that lead to the synthesis of cytokines and
chemokines (Corde et al., 2015). HMGCRIs are interfering with the process of antigen
presentation. They reduce the MHC II class molecules and promote the differentation of
T-cells towards the Th2 phenotype. They decrease the secretion of pro-inflammatory Th1
cytokines and increase the anti-inflammatory Th2 cytokines. Statins are also target the
Rac-stress kinase pathway and the Rab-dependent pathway of receptor-induced
endocytosis.
Apart from their therapeutic use in cardiovascular diseases, statins may also have
beneficial effects in the CNS (Zipp et al., 2007; van der Most et al., 2009; Famer et al.,
2010). Animal studies have demonstrated that statins attenuate neuroinflammation (Zelcer
et al., 2007) and reduce senile plaques and inflammatory responses (Kurata et al., 2012).
Experiments revealed that statin treatment after brain damage increases neurogenesis and
synaptogenesis (van der Most et al., 2009). Statins induce neuroprotection by promoting
the expression of neurotrophic factors such as BDNF (van der Most et al., 2009). Statins
protect cells and tissues from oxidative damage by reducing the production of ROS (van
der Most et al., 2009). They can induce the beneficial NO production by eNOS while
reducing the NO overexpression by reducing iNOS (van der Most et al., 2009). The
eNOS generation is essential for promoting cerebral blood flow to ischemic regions of the
brain (Zipp et al., 2007).

10
Several epidemiological studies suggested that statins reduced the risk of
developing AD by as much as 70% (Jick et al, 2000; Wolozin et al, 2000). The Aβ
stimulated phagocytosis is dependent on Rac to drive actin polimerization and phagosome
formation (Corde et al., 2015). Aβ production is increased by high levels of cholesterol.
Lipid rafts are known to be the site of Aβ production. Raft depletion is suggested to
reduce neuronal Aβ production in vitro (van der Most et al., 2009). The APP is found
both in and outside of lipid rafts, while the enzyme that converts it into Aβ only occurs in
rafts. Cholesterol depletion reduces the Aβ production. Animal models show that statins
reduce leukocyte migration and infiltration to the inflamed tissue by inhibiting the β2
integrin leukocyte function antigene (LFA-1) (van der Most et al., 2009). LFA-1 plays
important role in leukocyte recirculation and tissue infiltration, as well as in the activation
of T-cells by antigen presenting cells. These functions suggest that statins may have an
inportant role in the treatment of MS (van der Most et al., 2009).
Of all the commercially available statins rosuvastatin exhibits the greatest inhibitory
effect on cholesterol biosynthesis. Rosuvastatin is part of the fully synthetic class of
HMGCRIs, relatively hydrophylic compared to other statins, and is anionic in neutral pH
(Kitamura et al., 2008). Uptake studies revealed that organic anion transporting
polypeptides (OATPs) accept rosuvastatin as a substrate (Kitamura et al., 2008). OATPs
are polyspecific anion transporters expressed on the endothelial cell of BBB, the choroid
plexus and other organs (e.g. liver) (Stieger and Gao, 2015). They belong to the
superfamily of solute carriers (Stieger and Gao, 2015). Rosuvastatin is able to transport
through OATP1A2, OATP1B1, OATP1B3 and OATP2B1 transporters (Ho et al., 2006;
Kitamura et al., 2008). While the OATP1B1 and OATP1B3 tranporters show liver-
specific expression, OATP1A2 and OATP2B1 are found at the BBB (Kitamura et al.,
2008; Stieger and Gao, 2015). OATP1A2 is strongly expressed in brain capillary
endothelial cells and has emerged as an important BBB uptake transporter for drugs (Liu
et al., 2015). It transports amphipathic substrates, including bile salts, steroid conjugates,
thyroid hormones, organic dyes and anionic oligopeptides (Liu et al., 2015). Experiments
on MDCKII-WT monolayer cells revealed that OATP1A2 contributes to the transcellular
permeability of rosuvastatin (Liu et al., 2015).
The effective anti-inflammatory and immunomodulatory effets of statins indicate
that these drugs may have beneficial regulatory effects on microglial cells and may be
able to modulate the strong neuroinflammatory processes orchestrated by microglial cells.

11
1.3. Mechanisms and effects of aspirin
Aspirin is one of the most widely used medicines worldwide. Aspirin belongs to the
nonsteroidal anti-inflammatory drugs (NSAIDs) and exerts analgesic, anti-inflammatory
and antipyretic effets. It is extensively studied in the cardiovascular system. Its main
action is the ireversible inhibition of cyclooxygenase (COX) enzyme activity by selective
acetylation of the serine residue (Ser530) (Amman and Peskar, 2002; Vane and Botting,
2003). COX is the key enzyme in the conversion of arachidonic acid (AA) to
prostaglandins (PGs) and other lipid mediators that are involved in several physiological
and pathological processes including inflammation (Choi et al, 2009). During the initial
phase of the inflammation prostaglandins play crucial role as local mediators in the
development of inflammatory conditions and promote the activation of proinflammatory
cytokines (Berk et al., 2013). COX-mediated production of inflammatory cytokines and
prostanoids such as prostaglandins (e.g. PGE2, PGI2) and thromboxanes (e.g. TXA2) play
a critical tole in modulating the immune response (Hussain et al, 2012). Aspirin, a COX
inhibitor, modulates the prostanoid-mediated immune regulation (Hussain et al., 2012)
and suppresses the NF-κB-mediated proinflammatory signalling by inhibiting the binding
of NF-κB to TNF-α promoter leading to the downregulation of TNF-α (Marchini et al.,
2005; Hussain et al., 2012; Pettit et al., 2013). Aspirin is able to downregulate other
proinflammatory cytokines released by macrophages such as IL-1β, IL-6, IL-12, IFN-γ
(Hussain et al., 2012; Berk et al., 2013). Aspirin modulates the phagocytic capacity and
antigen presenting function in macrophages, and inhibits the MHC I and MHC II
associated antigen presentation in dencritic cells (Hussain et al., 2012). There are two
main isoforms of the COX enzyme. COX-1 considered to be the constitutive isoform that
support beneficial homeostatic function wherease COX-2 can be induced by variety of
inflammatory stimuli and is the main isoform responsible for the PG biosynthesis in
inflammed tissue (Amman and Peskar, 2002; Vane and Botting, 2003).
Previous studies revealed that COX-2 acetylation by aspirin resulting in a
modulated enzymatic activity initiates the generation of new substrates that can interact
with lipoxygenase to genetare aspirin-triggered lipoxins (Amann and Peskar, 2002;
Schrör and Rauch, 2015). Aspirin-triggered lipoxins are anti-inflammatory mediators that
inhibit proinflammatory cytokine release by activation of the supressor of cytokine
signalling-2 (SOCS-2) expression (Hussain et al., 2012).

12
In the brain both COX-1 and COX-2 are constitutively expressed (Aid and Bosetti,
2011). Under physiological conditions COX-1 is mainly expressed in microglial cells and
COX-2 is found in excitatory terminals and post-synaptic dendrites (Aid and Bosetti,
2011). COX-1 is an important player in several inflammatory actions in the CNS and
upregulated in numerous models of neuroinflammation (Aid and Bosetti, 2011). In AD
brain an increased level of COX-1, COX-2 and PGE2 can be observed (Phillis et al.,
2006). COX-1 expressing microglial cells surrounding amyloid plaques in AD (Choi et
al., 2009; Aid and Bosetti, 2011). COX-1 and COX-2 maintain Aβ generation through the
interaction between PGE2 synthesis and γ-secretase activity that modulate Aβ deposition
and induce neuroinflammation (Phillis et al., 2006). Prevoius studies suggested that COX-
1 inhibitors can reduce the level of amyloid plaques in transgenic models of AD brain
(Sung et al., 2004). COX-1 expressing microglial cells are located in the developing
necrotic core after focal ischemia (Schwab et al., 2000) and COX-1 inhibition reduces the
oxidative stress and neuronal injury after global ischemia (Candelario-Jalil et al., 2003).
These observations suggest that COX-expressing microglial cells play crucial roles
under pathological situations and COX inhibition by aspirin might be beneficial during
the therapy.

13
2. SPECIFIC AIMS
Inflammation has a critical role in the progression of neurodegeneration. Microglial
activation results in profound morphological, functional and gene expression changes that
activate both pro- and anti-inflammatory mechanisms that, in turn, not only protect the
nervous tissue but could elicit chronic inflammation leading to the development of
neuropathological conditions. Drugs that are able to alter the excessive microglial
activation might therefore be useful for the prevention and treatment of several
neurodegenerative diseases. Statins are used for the primary treatment of
hypercholesterolemia albeit their anti-inflammatory effects are also noted. Although a
few previous studies examined the effets of statins on the CNS, these experiments only
used lipophilic statins such as simvastatin or atorvastatin. Rosuvastatin exhibits the
greatest inhibitory effect on cholesterol biosynthesis but its effect on the CNS was not
examined perhaps because of its presumed hydrophylic feature. Since rosuvastatin was
able to enter the brain through specific transporters we decided to investigate its effect on
microglial cells. Aspirin is one of the most commonly used non-steroidal anti-
inflammatory drugs. It also has widespread effects on immune cell functions, but it has
not been extensively studied in microglial cells so we decided to clarify its effects on
CNS immune functions. Therefore, we investigated the pleiotropic effects of rosuvastatin
and aspirin on secondary microglial cultures derived from mixed primary cultures of 18-
day-old embryonic (E18) rat forebrains under control (unchallenged) and bacterial
lipopolysaccharide (LPS)-challenged conditions.
Our specific aims were:
1. To characterize the effects of rosuvastatin and aspirin on the morphological, including
cytoskeletal and immunocytochemical, features of microglial cells;
2. To characterize the effect of rosuvastatin on cell adhesion and proliferation of
microglial cells;
3. To determine if rosuvastatin and aspirin alter microglial phagocytic properties;
4. To determine the effects of rosuvastatin and aspirin on microglial release of both
proinflammatory (IL-1β, TNF-α) and anti-inflammatory (IL-10) cytokines;
5. To characterize the effects of rosuvastatin and aspirin on the expression patterns of
inflammation related genes in pure microglial cells.

14
3. MATERIALS AND METHODS
3.1. Animals
All animal experiments were carried out in strict compliance with the European Council
Directive (86/609/EEC) and EC regulations (O.J. of EC No. L 358/1, 18/12/1986) regarding
the care and use of laboratory animals for experimental procedures, and followed the
relevant Hungarian and local legislation requirements. The experimental protocols were
approved by the Institutional Animal Welfare Committee of the University of Szeged (I-74-
II/2009/MÁB). The pregnant Sprague-Dawley rats (170-190 g) were kept under standard
housing conditions and fed ad libitum.
3.2. Antibodies
For a thorough characterization of different microglial phenotypes developed in vitro, an
antibody against Iba1, an intracellular actin- and Ca2+
-binding protein expressed in the CNS
specifically in macrophages and microglia (Ahmed et al., 2007), was used in our
immunocytochemical and Western blot analyses. The anti-glyceraldehyde 3-phosphate
dehydrogenase (GAPDH) antibody was used as an internal control in Western blot
experiments (Wu et al, 2012). Dilutions of primary and secondary antibodies, and also
incubation times and blocking conditions for each antibody used were carefully tested for
both immunocytochemistry and Western blot analysis. To detect the specificities of the
secondary antisera, omission control experiments (staining without the primary antibody)
were performed. In such cases, no fluorescent or Western blot signals were detected.
3.3. Preparation and maintenance of cell cultures
Pure microglial cells were isolated from mixed primary cortical cell cultures of rat embryos
of either sex by the method we described earlier (Szabó and Gulya, 2013; Kata et al., 2016).
Sibling embryos obtained from the same pregnancy were processed for culturing together;
each pregnancy was considered as an independent experiment. Briefly, 10-12 fetal rats
(E18) under anesthesia were decapitated and the frontal lobe of the cerebral cortex was
removed, minced with scissors, incubated in 9 ml Dulbecco’s Modified Eagle’s Medium
(DMEM; Invitrogen, Carlsbad, USA) containing 1 g/l D-glucose, 110 mg/l Na-pyruvate, 4
mM L-glutamine, 3.7 g/l NaHCO3, 10,000 U/ml penicillin G, 10 mg/ml streptomycin
sulfate, 25 g/ml amphotericin B and 0.25% trypsin for 10 min at 37 oC, and then

15
centrifuged at 1,000g for 10 min at room temperature (RT). The pellet was resuspended and
washed twice in 5 ml DMEM containing 10% heat-inactivated fetal bovine serum (FBS;
Invitrogen) and centrifuged for 10 min at 1,000g at RT. The final pellet was resuspended in
2 ml DMEM/10% FBS, after which the cells were plated in the same medium on a poly-L-
lysine-coated culture flask (75 cm2
, 12 x 106 cell/flask) and cultured for a number of days
in vitro (DIV) at 37 C in a humidified air atmosphere supplemented with 5% CO2 for the
subsequent generation of pure microglial cell cultures.
Secondary microglial cells were subcloned from mixed primary cultures (DIV7)
maintained in a poly-L-lysine-coated culture flask (75 cm2
, 12 x 106 cells/flask) by shaking
the cultures at 100 rpm in a platform shaker for 30 min at 37 C. Microglia from the
supernatant were collected by centrifugation at 3,000g for 8 min at RT and resuspended in 2
ml DMEM/10% FBS. The cells were seeded 1) in poly-L-lysine-coated Petri dishes (60 mm
x 15 mm; 4 x 10⁵ cells/dish) for Western blot and enzyme-linked immunosorbent assays
(ELISA); 2) in poly-L-lysine-coated coverslips (15 x 15 mm; 2 x 10⁵cells/coverslip) for
immunocytochemistry, proliferation or phagocytosis assays; or 3) in poly-L-lysine-coated
Petri dishes (60 mm x 15 mm; 1 x 10⁶ cells/dish) for RNA expression and cultured in
DMEM in a humidified atmosphere supplemented with 5% CO2 at 37 C. The medium was
changed on the first day after seeding (subDIV1).
3.4. Cell culture treatments
On the fourth day of subcloning (subDIV4), DMEM was replaced and the expanded pure
microglial cells were treated with either bacterial lipopolysaccharide (LPS; 20 ng/ml final
conc., dissolved in DMEM; Sigma, St. Louis, MO, USA), rosuvastatin (1 µM final conc.,
dissolved in sterile, distilled water; Santa Cruz Biotechnology, Inc., Dallas, TX, USA) or
aspirin (0.1 mM (low) and 1 mM (high) final conc., from ≥ 99% acetylsalicylic acid
dissolved in sterile, distilled water; Sigma) alone, or with a combination of LPS +
rosuvastatin, or LPS + aspirin, and the effects were compared in a variety of
morphological and functional tests. LPS treatment served as an immunochallenge.
Eight types of treatment regimens were used: 1) control (unchallenged and
untreated) cultures; 2) LPS-challenged cultures received 20 ng/ml LPS; 3) rosuvastatin
treated cultures received 1 µM rosuvastatin; 4) LPS-challenged + rosuvastatin treated
cultures received 20 ng/ml LPS and 1µM rosuvastatin; 5) aspirin-treated cultures received
0.1 mM aspirin; 6) aspirin-treated cultures received 1 mM aspirin; 7) LPS-challenged +

16
aspirin-treated cultures were challenged with 20 ng/ml LPS and treated with 0.1 mM
aspirin; 8) LPS-challenged + aspirin-treated cultures received 20 ng/ml LPS and 1 mM
aspirin. Depending on the experiments, the treatments lasted for 6, 24, or 72 h at 37 oC.
3.5. Immunocytochemistry
Pure secondary microglial cultures treated with different treatment regimens were fixed on
coverslips with 4% formaldehyde for 5 min and rinsed with 0.05 M phosphate-buffered
saline (PBS) for 2 x 5 min. After permeabilization and blocking of the nonspecific sites in
0.05 M PBS solution containing 5% normal goat serum (Sigma), 1% heat-inactivated
bovine serum albumin (Sigma) and 0.05% Triton X-100 for 30 min at 37 C, the cells on
the coverslips were incubated overnight in a humidified chamber at 4 C with rabbit anti-
Iba1 polyclonal antibody (1:500 final dilution; Wako, Japan) in the above solution (Szabó
and Gulya, 2013). The cultured cells were washed for 4 x 10 min at RT in 0.05 M PBS, and
then incubated with the Alexa Fluor 568 fluorochrome-conjugated goat anti-rabbit antibody
(1:1,000 final dilution; Invitrogen) in the dark for 3 h at RT. The cells on the coverslip were
washed for 4 x 10 min in 0.05 M PBS at RT, and the nuclei were stained in 0.05 M PBS
solution containing 1 mg/ml polyvinylpyrrolidone and 0.5 l/ml Hoechst 33258 dye
(Sigma). The coverslips were rinsed in distilled water for 5 min, air-dried and mounted on
microscope slides in Vectashield mounting medium (Vector Laboratories, Burlingame, CA,
USA). Cells were viewed on a Nikon Microphot-FXA epifluorescent microscope (Nikon
Corp., Tokyo, Japan) and photographed with a Spot RT Color CCD camera (SPOT RT/ke,
Diagnostic Instruments, Inc., Sterling Heights, MI, USA).
3.6. Western blot analysis
Cultured microglial cells (subDIV4) were collected through use of a rubber policeman,
homogenized in 50 mM Tris-HCl (pH 7.5) containing 150 mM NaCl, 0.1% Nonidet P40,
0.1% cholic acid, 2 μg/ml leupeptin, 1 μg/ml pepstatin, 2 mM phenylmethylsulfonyl
fluoride and 2 mM EDTA, and centrifuged at 10,000g for 10 min. The pellet was discarded
and the protein concentration of the supernatant was determined (Lowry et al., 1951). For
the Western blot analyses, 5-10 g of protein was separated on a sodium dodecyl
sulfate/polyacrylamide gel (4%/10% stacking gel/resolving gel), transferred onto Hybond-
ECL nitrocellulose membrane (Amersham Biosciences, Little Chalfont, Buckinghamshire,

17
England), blocked for 1 h in 5% nonfat dry milk in Tris-buffered saline (TBS) containing
0.1% Tween 20, and incubated overnight with either a rabbit anti-Iba1 polyclonal antibody
(1:1,000 final dilution; Wako) or a mouse anti-GAPDH monoclonal antibody (clone
GAPDH-71.1; 1:20,000 final dilution; Sigma). After 5 rinses in 0.1% TBS–Tween 20, the
membranes were incubated for 1 h with the peroxidase-conjugated goat anti-rabbit
secondary antibody (1:2,000 final dilution; Invitrogen) for Iba1 or with the peroxidase-
conjugated rabbit anti-mouse secondary antibody (1:2,000 final dilution; Sigma) for
GAPDH Western blots, and washed 5 times as before. The enhanced chemiluminescence
method (ECL Plus Western blotting detection reagents; Amersham Biosciences) was used
to reveal immunoreactive bands according to the manufacturer's protocol.
3.7. Quantitative determination of in vitro phagocytosis
The fluid-phase phagocytic capabilities of the control and variously treated pure microglial
cell cultures were determined via the uptake of fluorescent microspheres (carboxylate-
modified polystyrene beads, fluorescent yellow-green (λex ~470 nm; λem ~505 nm),
aqueous suspension, 2.0 μm mean particle size; L4530, Sigma) as described previously
(Szabó and Gulya, 2013). Unchallenged (control) and LPS-challenged pure microglial cell
cultures (subDIV4) with or without rosuvastatin or aspirin treatments were tested for 24 h.
At the end of the treatment period, 1 l of a 2.5% aqueous suspension of fluorescent
microspheres per ml was added to the culture, which was then incubated for 60 min at 37
C. The cells were next washed 5 times with 2 ml of PBS to remove dish- or cell surface-
bound residual fluorescent microspheres, and fixed with 4% formaldehyde in PBS. In
another setup, we also determined the number of microglial cell membrane-associated but
not phagocytosed beads. Such negative controls were treated as above with the exception
that microglial cultures with beads were incubated for 60 min at 4 C. At this temperature,
the number of beads associated with cell surface averaged less than 1 bead per 100 Iba1-
labeled cells, thus the phagocytosis was not considered significant. For measurement of the
phagocytic activity, cells labelled with phagocytosed microbeads and processed for Iba1
immunocytochemistry were counted in 20 random fields in each treatment group (mean ±
S.D.) under a 20 x or 40 x objectives. Statistically significant differences were determined
by two-way ANOVA.

18
3.8. Quantitative determination of IL-1β, IL-10 and TNF-α
For ELISA assays, the supernatants were collected from each treatment and stored at -20
oC. Concentrations of IL-1β, IL-10 and TNF-α were measured with rat-specific ELISA kits
(eBioscience, Vienna, Austria). The sensitivity of IL-1β (Cat# BMS630), IL-10 (Cat#
BMS629) and TNF-α (Cat#BMS622) assays was 4 pg/ml, 1.5 pg/ml and 11 pg/ml,
respectively. As stated by the manufacturer, the overall intra- and interassay coefficients of
variation were <10% in both cases for IL-1β and TNF-α, and <5% in both cases for IL-10.
3.9. Determination of cell adhesion and proliferation
To measure changes in cell adhesion, proliferation and cell viability, the ACEA Real-Time
Cell Analysis (RTCA) system and 16-well E-Plates (Acea Biosciences, Inc., San Diego,
CA, USA) were used. This system measured the electrical impedance of the cells expressed
as cell index in real-time. Briefly, 4 x 10⁵
pure microglial cells in poly-L-lysine-coated Petri
dishes were plated as described above. On the fourth day of culturing, the cells were
trypsinized, centrifuged as above and seeded into gelatin-coated 16-well E-Plates at a
density of 6,000 cells per well. Test doses of LPS and rosuvastatin, either alone or in
combination, were added to the wells before plating. After equilibration at RT for 10 min,
the E-plate was loaded into the RTCA machine and the cell index was measured
continuously for 60 h using the xCELLigence real-time cell analysis system (RTCA DP;
Acea Biosciences) as published earlier (Ozsvári et al., 2010). Cell indices at 24 h were
analyzed for comparison with cell proliferation data. Data analysis was carried out with the
system’s dedicated software (RTCA Software 1.2; Acea Biosciences) and Excel (Microsoft
Corp., Redmond, WA, USA). To estimate the number of surviving/proliferating microglial
cells after treatments, the cells were washed twice with 2 ml PBS to remove cell debris,
treated with 0.25% trypsin solution for 10 min at 37 C, collected and counted in a Burker
chamber. The number of viable cells was presented as mean S.D.
3.10. RNA isolation
Total RNA from control and treated pure microglial cells was purified as described
previously (Fabian et al., 2011); columns and wash buffer were from Bioneer (Viral RNA
extraction kit; Daejon, South Korea). Briefly, cells were washed with PBS, incubated in
lysis buffer (RA1; Macherey-Nagel, Düren, Germany), then collected and mixed with 70%

19
ethanol in RNase-free water (Bioneer). The mixture was transferred through columns
(Bioneer) and washed with 350 µl 80% ethanol in diethylpyrocarbonate-treated water, and
then with 600 µl and 300 µl W2 wash buffer (Bioneer). Total RNA was eluted in 50 µl
RNase free-water. One µl RNase inhibitor (Applied Biosystems, Foster City, CA, USA)
was added to the samples. The quality and quantity of the isolated RNA was measured with
NanoDrop1000 Version 3.8.1. (Thermo Scientific, Budapest, Hungary).
3.11. RNA expression
Reverse transcription from 3 µg total RNA in 30 µl was performed with the High
Capacity cDNA Archive Kit (Applied Biosystems) according to the manufacturer’s
protocol. cDNA was diluted to 80 µl with nuclease-free water. The instrumentation
included the Bravo automatic liquid handling system (Agilent Technologies, Inc., Santa
Clara, CA, USA) for polymerase chain reaction (PCR) assay preparation and a
LightCycler 1536 System (Roche Diagnostics Corp., Indianapolis, IN, USA) or a Light
Cycler Nano Instrument (Roche) for cycling (Woudstra et al., 2013). The expression of
116 inflammation-related genes, together with that of 6 control genes (see below), was
measured with Universal Probe Library (UPL) assays using intron-spanning gene-specific
primers (Rat Immune Panel; Avidin Ltd., Szeged, Hungary,
www.avidinbiotech.com/services/gene-expression) and the LightCycler 1536 DNA Probe
Master kit (Roche). Moreover, the expression of certain phagocytosis-related genes such
as the integrin associated protein or cluster of differentiation 47 (Cd47, NM_019195_2),
the engulfment or cell motility protein (Elmo1, NM_001108415.1), the scavenger
receptor class B member 1 (Scarb1, NM_031541_1), the plasminogen activator inhibitor-
1 (Serpine1, NM_012620_1), the signal-regulatory protein (Sirpa, NM_013016_2) and
the vesicle-associated membrane protein 7 (Vamp7, NM_053531_1) were also analyzed
by the Light Cycler Nano Instrument. For the 1536 System, each 2 µl PCR reaction
contained 8 ng cDNA, 0.4 µl LightCycler DNA Probes Master (5x), the corresponding
primer set and UPL probe and the Setup Control. The PCR cycling protocol was as
follows: enzyme activation at 95 °C for 60 sec, 50 cycles of denaturation at 95 °C for 0
sec, and annealing and extension at 60 °C for 30 sec. For the Nano Instrument, each 20 µl
PCR reaction contained 20 ng cDNA, 10 µl Lightcycler DNA Probes Master (5x), the
corresponding primer set and UPL probe and the Setup Control. The PCR protocol was as
follows: enzyme activation at 95 °C for 10 min, 50 cycles of denaturation at 95 °C for 15

20
sec, and annealing and extension at 60 °C for 30 sec. Gene expression was normalized to
the average values of clathrin, heavy chain (Cltc, NM_019299.1), Gapdh (M17701.1),
glucuronidase, beta (Gusb, NM_017015.2), hypoxanthine phosphoribosyl transferase 1
(Hprt1, NM_012583.2), phosphoglycerate kinase 1(Pgk1, NM_053291.3) and tubulin,
beta 5 class I (Tubb5, NM_173102.2) expression as endogenous controls and expressed
relative to the unchallenged controls by using the 2-ΔΔCt
method.
A total of 122 gene-specific assays were run on 3 independent samples from each
condition. Gene expression was analyzed by GraphPad Prism 6 (GraphPad Software, Inc.,
La Jolla, CA, USA). For hierarchical cluster analysis and visualization, the Hierarchical
Clustering Explorer (v3.0) software was used (Human-Computer Interaction Lab.,
University of Maryland, MD, USA; publicly available at
http://www.cs.umd.edu/hcil/multi-cluster/hce3.html). The complete linkage clustering
method was applied with Euclidean distance metric.
3.12. Digital processing and image analysis
Digital images were captured by a Nikon Microphot-FXA epifluorescent microscope
(Nikon Corp., Tokyo, Japan), using a Spot RT Color CCD camera and the Spot RT
software (Spot RT/ke Diagnostic Instruments, Sterling Heights, MI, USA). For the
determination of microglial cell purity, Hoechst 33258-labelled cell nuclei that belonged to
Iba1-immunopositive cells were counted on coverslip-cultured samples. For each culture,
50-100 randomly selected microscope fields were analyzed. In every case, the cultures had,
on average, at least 99 Iba1-positive somata for 100 Hoechst 33258-labelled cell nuclei (>
99% purity for microglial cells). Phagocytosed microspheres on 20 randomly sampled
microscope fields from 3 coverslips for each treatment regimen were counted with the use
of the computer program ImageJ (version 1.47; http://rsb.info.nih.gov/ij). For the
measurement of area (μm2), perimeter (μm) and transformation index (TI), Iba1-
immunoreactive microglial cell images were converted into binary replicas by using
thresholding procedures implemented by ImageJ and Adobe Photoshop CS5.1 software
(Adobe Systems, Inc., San Jose, CA, USA) as we published earlier (Szabó and Gulya, 2013;
Szabó et al., 2016). Microglial cell silhouettes were acquired by transforming the raw
digital files of Iba1-immunoreactive cells recorded under fluorescent microscope light to
binary files. The color cell images were transformed into their binary replicas (silhouettes)
by using automatic thresholding procedures (Szabó and Gulya, 2013; Szabó et al., 2016).

21
After the values of cell perimeter (μm) and cell area (μm2) had been determined, the TI
reflecting the degree of process extension was determined according to the following
formula: [perimeter of cell (μm)]2
/4π [cell area (µm2)] (Fujita et al., 1996). Color correction
and cropping of the light microscopic images were performed when photomicrographs were
made for publication and assembled for a panel. Gray-scale digital images of the
immunoblots were acquired by scanning the autoradiographic films with a desktop scanner
(Epson Perfection V750 PRO; Seiko Epson Corp., Japan). The images were scanned and
processed at identical settings to allow comparisons of the Western blots from different
samples. The bands were analyzed through the use of ImageJ. The immunoreactive
densities of equally loaded lanes were quantified, and all samples were normalized to the
internal GAPDH load controls.
3.13. Statistical analysis
All statistical comparisons were made by using R 3.1.0 for Windows (The R Foundation for
Statistical Computing; Vienna University of Economics and Business, Vienna, Austria).
Results were analyzed with two-way ANOVA, and the Bonferroni correction was used to
establish significance between groups. Values were presented as means ± SD; p < 0.05 was
considered significant; *, ** and *** denote p < 0.05, p < 0.01 and p < 0.001, respectively.

22
4. RESULTS
All experiments were performed on pure microglial cultures 4 days after seeding
(subDIV4). Immunocytochemistry routinely performed on these secondary cultures
consistently detected a >99% incidence of the Iba1 immunopositive microglial cells for
the Hoechst 33258 dye-labeled cell nuclei (Fig. 1).
Fig. 1. Localization of Iba1 immunoreactive microglial cells in a pure secondary microglial culture
(subDIV4). The typical purity of the culture is >99%; in this representative photomicrograph of a field of
view the purity is 100% since every Hoechst 33258-labeled cell nuclei (blue) is surrounded by Iba1
immunopositive cytoplasm (red). Scale bar: 50 μm.
4.1. Morphological effects of rosuvastatin and aspirin treatments
The morphological changes elicited by rosuvastatin and aspirin in unchallenged (control)
and LPS-challenged pure microglia cultures were documented through the use of Iba1
immunocytochemistry (Fig. 2A-D and Fig. 4A-F) and quantitatively analyzed on binary
silhouettes of individual microglial cells (Fig. 3A-G and Fig. 5A-F). Iba1 protein expression
was also monitored during treatments (Fig. 2E and Fig. 4G).
Our experiments with rosuvastatin demonstrated that most of the unchallenged and
untreated (control) microglia displayed ameboid morphology with TI <3; they had
predominantly ameboid shape, occasionally with small pseudopodia (Fig. 2A, Fig. 3A).
When administered alone for 24 h, rosuvastatin induced the formation of numerous
microspikes (Fig. 2B, Fig. 3B); these slender cytoplasmic projections (filopodia) resulted in
significantly increased perimeter and TI values of these cells (Fig. 3F, G).

23
Fig. 2. Rosuvastatin affects microglial cell morphology and Iba1 immunoreactivity in pure microglial
cells after various treatments. Representative fluorescent immunocytochemical pictures demonstrate the
typical cellular distribution of Iba1 immunoreactivity (red) in (A) control (unchallenged and untreated), (B)
rosuvastatin-treated, (C) LPS-challenged and (D) LSP-challenged + rosuvastatin-treated microglial cells. The
effects of rosuvastatin in unchallenged and LSP-challenged microglia were the most marked. Hoechst 33258-
labeled cell nuclei are shown in blue. Scale bar in A (for all pictures): 50 µm. (E), Quantitative Western blot
analysis of Iba1 and GAPDH immunoreactivities in pure microglial cell cultures. Protein samples from the
cultures were separated by gel electrophoresis, transferred to nitrocellulose membranes and probed with either
the Iba1 or the GAPDH antibody. Gray scale digital images of the immunoblots were acquired by scanning
the autoradiographic films with a desktop scanner. The images were scanned and processed at identical
settings to allow comparisons between the Western blots from different samples. Error bars indicate integrated
optical density values (means SD) normalized to the internal standard GAPDH. Representative Western blot
pictures are shown below the graphs. Data were analyzed with two-way ANOVA. *p <0.05, **p <0.01.

24
Fig.3. Quantitative analysis of microglial morphology in pure microglial cell cultures after various
treatments I. Iba1-positive microglial cells from pure microglial cultures (subDIV4) were photographed, the
pictures were digitized, and the morphological characteristics were quantitatively analyzed on binary
silhouettes of unchallenged (A), rosuvastatin-treated (B), LPS-challenged (C) and LPS-challenged +
rosuvastatin-treated (D) microglia. Four representative binary silhouettes are shown for each culturing
protocol. Scale bar for all silhouettes: 50 μm. Area (E) in μm2, perimeter (F) in μm, and TI values (G),
calculated as [perimeter of cell (μm)]2/4[cell area (μm
2)], are indicated for each digitized cell. Unchallenged
and untreated (control) cells, similarly to LPS-challenged cells, displayed a typical ameboid morpology with
low TI values. Rosuvastatin affected the morphology of both the control and the LPS-challenged microglia (B,

25
D). In unchallenged cultures, it promoted microspike formation with a concurrent slight ramification of the
cells (B). In the LPS-challenged + rosuvastatin-treated cultures (D), the microglia became larger and, while
retaining microspikes, also developed thicker processes. Both the rosuvastatin treatment alone and the
combined treatment with LPS resulted in larger perimeter (F) and higher TI values (G) as compared with both
the unchallenged and the LPS-challenged cultures. (E) Average area (in μm2
± S.D.) measurements for
cultured pure microglial cells. (F) Average perimeter (in μm ± S.D.) measurements for cultured pure
microglial cells. (G) Average TI values (± S.D.) for cultured pure microglial cells. LPS: 20 ng/ml;
rosuvastatin: 1 µM. For (E-G), error bars indicate means ± SD of six replicate measurements from three
independent culturings. Data were analyzed with two-way analysis of variance (ANOVA). **p <0.01, ***p <
0.001.
For example, the average TI in this group increased about 10-fold, to above 19, as
compared with the controls (Fig. 3G). The LPS challenge did not result in any significant
morphometric change (Fig. 2C, Fig. 3C, E-G). However, rosuvastatin treatment in LPS-
challenged cells resulted in a significantly enlarged and more ramified cell form (TI> 7)
with a much larger perimeter value as compared with their respective control values (Fig.
2D, Fig. 3D, E-G), indicating that rosuvastatin profoundly antagonized the morphological
changes characteristic of LPS-induced microglial activation. In relation to the substantially
increased size of the LPS-challenged and rosuvastatin-treated microglia (Fig. 2D, Fig. 3D,
E), their Iba1 immunoreactivity was also significantly increased (Fig. 2E, Fig. 3E).
The amount of Iba1 immunoreactivity was significantly increased in the aspirin-
treated (low: 2.09 0.49; high: 2.22 0.75) and the LPS-challenged + aspirin-treated
groups (low: 2.30 0.79; high: 2.49 0.92) as compared to LPS-challenged values (1.35
0.34; Fig. 4G).

26
Fig. 4. Aspirin affects microglial morphology and Iba1 immunoreactivity in pure microglial cells.
Representative fluorescent immunocytochemical pictures demonstrate the typical cellular distribution of
Iba1 immunoreactivity (red) in (A) control (unchallenged and untreated), (B) LPS-challenged, (C) 0.1 mM
aspirin-treated, (D) 1 mM aspirin-treated, (E) LPS-challenged + 0.1 mM aspirin-treated and (F) LPS-
challenged + 1 mM aspirin-treated microglial cells. Hoechst 33258-labeled cell nuclei are shown in blue.
Scale bar in A (for all pictures): 50 µm. G, Quantitative Western blot analysis of Iba1 and GAPDH
immunoreactivities in pure microglial cell cultures. Protein samples from the cultures were separated by gel
electrophoresis, transferred to nitrocellulose membranes and probed with either the Iba1 or the GAPDH
antibody. Gray scale digital images of the immunoblots were acquired by scanning the autoradiographic
films with a desktop scanner. The images were scanned and processed at identical settings to allow
comparisons between the Western blots from different samples. Error bars indicate integrated optical
density values (means SD) normalized to the internal standard GAPDH. Representative Western blot
pictures are shown beside the graph. Data were analyzed with two-way analysis of variance (ANOVA). *p
< 0.05, **p< 0.01.

27
Fig. 5. Quantitative analysis of microglial morphology in pure microglial cell cultures after different
treatments II. (A-F) Iba1-positive microglial cells from pure microglial cultures (subDIV4) were
photographed, the pictures were digitized and the morphological characteristics were quantitatively
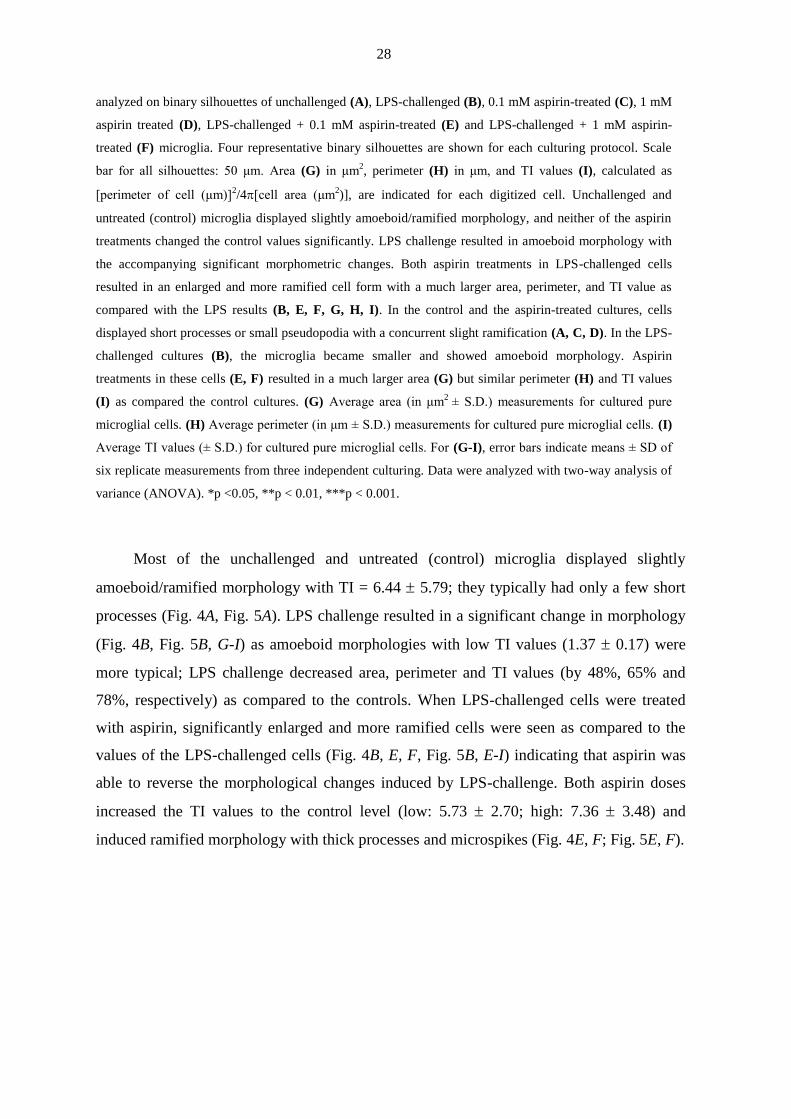
28
analyzed on binary silhouettes of unchallenged (A), LPS-challenged (B), 0.1 mM aspirin-treated (C), 1 mM
aspirin treated (D), LPS-challenged + 0.1 mM aspirin-treated (E) and LPS-challenged + 1 mM aspirin-
treated (F) microglia. Four representative binary silhouettes are shown for each culturing protocol. Scale
bar for all silhouettes: 50 μm. Area (G) in μm2, perimeter (H) in μm, and TI values (I), calculated as
[perimeter of cell (μm)]2/4[cell area (μm
2)], are indicated for each digitized cell. Unchallenged and
untreated (control) microglia displayed slightly amoeboid/ramified morphology, and neither of the aspirin
treatments changed the control values significantly. LPS challenge resulted in amoeboid morphology with
the accompanying significant morphometric changes. Both aspirin treatments in LPS-challenged cells
resulted in an enlarged and more ramified cell form with a much larger area, perimeter, and TI value as
compared with the LPS results (B, E, F, G, H, I). In the control and the aspirin-treated cultures, cells
displayed short processes or small pseudopodia with a concurrent slight ramification (A, C, D). In the LPS-
challenged cultures (B), the microglia became smaller and showed amoeboid morphology. Aspirin
treatments in these cells (E, F) resulted in a much larger area (G) but similar perimeter (H) and TI values
(I) as compared the control cultures. (G) Average area (in μm2
± S.D.) measurements for cultured pure
microglial cells. (H) Average perimeter (in μm ± S.D.) measurements for cultured pure microglial cells. (I)
Average TI values (± S.D.) for cultured pure microglial cells. For (G-I), error bars indicate means ± SD of
six replicate measurements from three independent culturing. Data were analyzed with two-way analysis of
variance (ANOVA). *p <0.05, **p < 0.01, ***p < 0.001.
Most of the unchallenged and untreated (control) microglia displayed slightly
amoeboid/ramified morphology with TI = 6.44 5.79; they typically had only a few short
processes (Fig. 4A, Fig. 5A). LPS challenge resulted in a significant change in morphology
(Fig. 4B, Fig. 5B, G-I) as amoeboid morphologies with low TI values (1.37 0.17) were
more typical; LPS challenge decreased area, perimeter and TI values (by 48%, 65% and
78%, respectively) as compared to the controls. When LPS-challenged cells were treated
with aspirin, significantly enlarged and more ramified cells were seen as compared to the
values of the LPS-challenged cells (Fig. 4B, E, F, Fig. 5B, E-I) indicating that aspirin was
able to reverse the morphological changes induced by LPS-challenge. Both aspirin doses
increased the TI values to the control level (low: 5.73 2.70; high: 7.36 3.48) and
induced ramified morphology with thick processes and microspikes (Fig. 4E, F; Fig. 5E, F).

29
4.2. Rosuvastatin inhibits proliferation and cell adhesion
Rosuvastatin significantly inhibited cell proliferation in both unchallenged and LPS-
challenged cultures, by 47.8% and 68.9%, respectively, after a 24 h treatment period (Fig.
6A). We used a 16-well E-Plate-based real-time analysis to determine whether rosuvastatin
affects cell adhesion. Rosuvastatin inhibited cell adhesion in both unchallenged (control)
and LPS-challenged microglia (Fig. 6B). The differences in the levels of inhibition of cell
adhesion between cultures with or without rosuvastatin (unchallenged and LPS-challenged
microglia vs. rosuvastatin-treated and LPS-challenged + rosuvastatin-treated microglia)
were significant by 20 h of culturing and thereafter. This was probably due to the
significantly larger cell populations in the control and LSP-challenged microglial cultures as
compared with those in the rosuvastatin or LPS + rosuvastatin-treated cultures (Fig. 6B),
and to the ability of rosuvastatin to stimulate the formation of microspikes (Fig. 3B, D), i.e.
the actin-based filamentous protrusions implicated in the cell motility, and consequently in
the decreased adhesion of these cells.
Fig. 6. Rosuvastatin inhibits cell proliferation and decreases cell adhesion. (A) After culturing, the cells
were collected and the number of surviving microglia was determined with a Bürker chamber. Rosuvastatin,
in both unchallenged and LPS-challenged cultures, inhibited cell proliferation and displayed some anti-mitotic
characteristic. LPS treatment did not affect cell proliferation. (B) Real-time monitoring of microglial cell
adhesion after different treatment regimens. The ACEA Real-Time Cell Analysis (RTCA) system and 16-well
E-Plates were used to determine cell indices as described in the Materials and methods section. Normalized
cell index values are plotted as a function of time. In both unchallenged and LPS-challenged cells,
rosuvastatin decreased cell adhesion (blue and red lines, respectively). Error bars indicate means ± SD of six
replicate measurements from three independent culturings. Data were analyzed with two-way analysis of
variance (ANOVA). **p < 0.01, ***p < 0.001.

30
4.3. Rosuvastatin and aspirin reduce the phagocytic activity in activated microglia
The microglial function is inherently related to its phagocytic activity. In pure microglial
cultures (subDIV4), the control (unchallenged and untreated) microglia exhibited a low
level of fluid-phase phagocytosis (Fig. 7A, E), engulfing only 2.62 1.7 beads per cell (n =
91) during rosuvastatin treatment, and only 3.63 1.6 beads per cell (n = 60; Fig. 8A, G)
during aspirin treatment. Rosuvastatin did not affect phagocytosis appreciably (Fig. 7B, E)
as the number of phagocytosed microbeads remained low (2.70 1.7; n = 50).
Fig. 7. Rosuvastatin is a potent inhibitor of phagocytosis. Pure microglial cultures (subDIV4) were
maintained and treated with fluorescent microbeads (2 µm in diameter) as described in the Materials and
methods 3.7 section (A-D). Iba1-specific fluorescent immunocytochemistry (red: microglia; blue: nucleus;
green: microspheres) on unchallenged (A), rosuvastatin-treated unchallenged cells (B), LPS-challenged cells

31
(C) and LPS-challlenged + rosuvastatin-treated microglial cells (D) revealed that rosuvastatin inhibited
phagocytosis in both naive, unchallenged (B) and LPS-challenged cells (D). Scale bar in A (for all pictures) =
50 µm. (E) Quantitative analysis of the number of phagocytosed microbeads revealed that LPS dramatically
activated phagocytosis, while rosuvastatin, when present, significantly decreased this microglial function.
Error bars indicate means ± SD of six replicate measurements from three independent culturings. Data were
analyzed with two-way ANOVA. *p < 0.05, **p < 0.01, ***p < 0.001.
As expected, the LPS challenge increased the phagocytic activity of the microglial
cells significantly (Fig.7C, E). On average, the LPS-challenged cells accumulated 25.39
11.4 beads per cell (n = 70), and some of the cells engulfed as many as 40 microbeads. In
the LPS-challenged microglia, however, rosuvastatin inhibited phagocytosis drastically, by
nearly 80% (Fig.7D, E), as the fluid-phase phagocytotic activity was returned close to the
level of the control cells (4.67 3.9 microbeads per cell; n = 88).
During aspirin treatments, microglial activation was associated with a robust
phagocytic activity as LPS challenge increased phagocytosis significantly to about 350% of
the control level (12.87 4.86; n = 58; Fig. 8A, B, G). Aspirin alone did not affect the
phagocytosis appreciably (Fig. 8C, D, G), as the number of phagocytosed microbeads
remained low in both cases (low: 2.72 1.47, high: 3.30 1.64; n = 60). However, aspirin
inhibited phagocytosis significantly in LPS-challenged microglia (Fig. 8E, F, G). Aspirin
(0.1 mM or 1 mM) decreased phagocytosis dose-dependently by about 30% (9.20 4.25; n
= 55; Fig. 8E, G) and 70% (3.86 1.85 microbeads per cell; n = 67; Fig. 8F, G),
respectively, as compared to LPS treatment. As activated microglial cells often damage
neuronal tissue; such a strong inhibition of a proinflammatory action by rosuvastatin and
aspirin could be beneficial in preventing or ameliorating neurodegeneration.

32
Fig. 8. Aspirin strongly inhibits phagocytosis. Pure microglial cultures (subDIV4) were maintained and
treated with fluorescent microbeads (2 µm in diameter) as described in the Materials and methods 3.7
section (A-F). Iba1-specific fluorescent immunocytochemistry (red: microglia; blue: nucleus; green:
microspheres) on unchallenged (A), LPS-challenged (B), 0.1 mM aspirin-treated (C), 1 mM aspirin-treated
(D), LPS-challenged + 0.1 mM aspirin-treated (E), and LPS-challenged + 1 mM aspirin-treated (F)
microglia. Scale bar in A (for all pictures) = 50 µm. (G) Quantitative analysis of the number of
phagocytosed microbeads revealed that LPS dramatically activated phagocytosis, while aspirin significantly
decreased this microglial function. Error bars indicate means ± SD of six replicate measurements from three
independent culturing. Data were analyzed with two-way ANOVA. *p < 0.05, ***p < 0.001.

33
4.4. Both rosuvastatin and aspirin decrease proinflammatory and increase anti-
inflammatory cytokine levels
Activated microglia are known to express several pro- and anti-inflammatory cytokines. As
previous studies indicated that statins were able to reduce the inflammatory effect in the
vicinity of atherosclerotic plaques, we presumed that rosuvastatin regulates the amount of
cytokines released by the microglia. Indeed, when the basal levels of the proinflammatory
cytokines IL-1 and TNF- and the anti-inflammatory cytokine IL-10 in unchallenged
microglia were compared with the levels from rosuvastatin–treated LPS-challenged or
unchallenged cells, a unique regulatory pattern emerged (Fig. 9A-C). The basal level for IL-
1β in unchallenged (control) microglia was 15.00 5.6 pg/ml (Fig.9A). Rosuvastatin did
not change this level significantly (9.56 13.1 pg/ml). As expected, a 24 h-long LPS
challenge significantly elevated the IL-1β level in the activated microglia, to 156.05 63.0
pg/ml. However, when added together with LPS, rosuvastatin significantly inhibited the
development of this elevated IL-1β level, by about 45%, to 86.25 49.3 pg/ml.
A similarly strong effect of rosuvastatin was demonstrated on the level of TNF-α,
another proinflammatory cytokine, in LPS-challenged microglial cells (Fig.9B). Two
different treatment times (6 h and 24 h) were used as the TNF-α production responded
quickly to the LPS challenge. The level of TNF-α in the unchallenged (control) and the
rosuvastatin-treated microglia could not be detected, but its level quickly rose, to 906.80
281.7 pg/ml in the LPS-challenged cells after 6 h, and the level was still robust after 24 h
(188.19 38.6 pg/ml). When rosuvastatin was co-administered to LPS-challenged cells for
either 6 h or 24 h, it significantly inhibited the overproduction of TNF-α, by 39% and 40%,
respectively (Fig. 9B).
More importantly, however, rosuvastatin affected the production of IL-10, an anti-
inflammatory cytokine (Fig.9C). The basal and rosuvastatin-treated levels of IL-10 in the
unchallenged microglia were not significantly different (37.01 18.4 pg/ml vs. 75.32
35.4 pg/ml), although elevated IL-10 production was noted after rosuvastatin treatment.
Interestingly, LPS increased the IL-10 protein expression significantly to about 340% of the
level of the unchallenged microglia (125.3 25.3 pg/ml pg/ml). When rosuvastatin was co-
administered with LPS, it boosted the IL-10 protein expression even higher, to about 750%
of the basal level (276.84 85.6 pg/ml), indicating the very strong anti-inflammatory action
of rosuvastatin.

34
Fig.9. Rosuvastatin reduces the pro-inflammatory cytokine IL-1β and TNF-α levels and increases the
anti-inflammatory IL-10 production. After treatments for 6 or 24 h, immunoreactive protein levels (pg/ml ±
SD) for IL-1β (A), TNF-α (B) and IL-10 (C) were detected by ELISA. TNF-α production was measured after
6 h and 24 h (B). As expected, pro-inflammatory cytokine production was significantly increased in the LPS-
challenged cells (A, B). Rosuvastatin was a potent inhibitor of this effect for both IL-1β (A) and TNF-α (B).
The level of the anti-inflammatory cytokine IL-10 was measured after 24 h (C). Rosuvastatin increased the
value of IL-10 both in unchallenged and in LPS-challenged microglia, to 750% of the control level in the latter
case (C). Error bars indicate means ± SD of six replicate measurements from three independent culturings.
Data were analyzed with two-way ANOVA. n.d. = not detected. *p< 0.05; ** p< 0.01, ***p< 0.001.
When the basal levels of the proinflammatory cytokines IL-1 and TNF- and the
anti-inflammatory cytokine IL-10 in unchallenged microglia were compared with the levels
from aspirin-treated LPS-challenged cells, a regulatory pattern similar to that seen after
rosuvastatin treatments emerged (Fig. 10). In the case of IL-1β the basal level in
unchallenged (control) microglia was 22.45 11.14 pg/ml (Fig. 10A). Both aspirin
treatments were able to change this level (low: 10.26 6.9 pg/ml; high: 10.19 6.7 pg/ml).
As expected, LPS challenge significantly elevated the IL-1β level to 336.15 206.91 pg/ml.
However, co-incubation of LPS and 1 mM aspirin significantly inhibited IL-1β level by
about 50%, to 169.6 89.0 pg/ml, while 0.1 mM aspirin decreased it by about 16.5 %, to
280.05 100.0 pg/ml (Fig. 10A). A similarly strong effect of aspirin was demonstrated on
the level of TNF-α, another proinflammatory cytokine, in LPS-challenged microglial cells
(Fig. 10C, D). Two different treatment periods (6 h and 24 h) were used as the TNF-α
production responded quickly to the LPS challenge. The level of TNF-α in the control
group could not be detected, but its level quickly rose, to 1135.88 276.30 pg/ml in the
LPS-challenged cells after 6 h, and the level was still elevated after 24 h (189.92 82.20
pg/ml). Aspirin treatments (0.1 mM and 1 mM) resulted in small, detectable TNF-α levels

35
for both doses (27.69 6.47 pg/ml and 29.23 3.87 pg/ml after 6 h, while 8.24 3.14
pg/ml and 9.09 1.03 pg/ml after 24 h). When aspirin was co-administered to LPS-
challenged cells for either 6 h or 24 h, it inhibited the production of TNF-α significantly in
both doses: 1 mM aspirin decreased the TNF-α level by about 25% (to 863.42 157.40
pg/ml after 6 h) and 50% (96.79 14.70 pg/ml after 24 h), and 0.1 mM aspirin inhibited its
level only after 6 h by about 16% (to 946.95 84.74 pg/ml) (Fig. 10C, D).
Fig.10. Aspirin reduces the pro-inflammatory cytokine IL-1β and TNF-α levels and increases the
anti-inflammatory IL-10 production. After treatments for 6 or 24 h, immunoreactive protein levels
(pg/ml ± SD) for IL-1β (A), TNF-α (C, D) and IL-10 (B) were detected by ELISA. TNF-α production was
measured after 6 h and 24 h (C, D). As expected, pro-inflammatory cytokine production was significantly
increased in the LPS-challenged cells (A, C, D). Aspirin (1 mM) inhibited this effect for both IL-1β (A) and
TNF-α (C, D). The level of the anti-inflammatory cytokine IL-10 was measured after 24 h (B). Aspirin (0.1
mM and 1 mM) did not increase the level of IL-10 in unchallenged cultures but strongly increased it in
LPS-challenged cultures (to 115% and 130% of the control values, respectively) (B). Error bars indicate
means ± SD of six replicate measurements from three independent culturing. Data were analyzed with two-
way ANOVA. n.d. = not detected. *p < 0.05; **p < 0.01, ***p < 0.001.

36
Aspirin also affected the production of IL-10, an anti-inflammatory cytokine (Fig.
10B). When administered alone to unchallenged cells it decreased the IL-10 levels.
However, LPS challenge increased the basal IL-10 level (24.98 10.40 pg/ml) significantly
(134.0 32.85 pg/ml). When aspirin was co-administered with LPS, the IL-10 protein
expression was further increased as compared to the LPS challenged value (low: 309.47
27.49 pg/ml, high: 280.95 90.91 pg/ml).
These data indicate that both rosuvastatin and aspirin have strong overall anti-
inflammatory effects, the result of a combination of a strong inhibition of pro-inflammatory
cytokine production and a similarly strong activation of anti-inflammatory cytokine
synthesis, in LPS-challenged (activated) microglia.
4.5. The effects of rosuvastatin and aspirin on the expression of inflammation-
related genes
When the profound morphological and functional effects of rosuvastatin and aspirin on
the pro- and anti-inflammatory capabilities of the microglia had become apparent, we set
out to analyze the effects of these treatments on the expression of 116 inflammation-
related genes in unchallenged and LPS-challenged pure microglial cells. For the
rosuvastatin experiments the hierarchical cluster analysis of 75 such genes is summarized
in Fig. 11, and the genes with 47 of the the most noteworthy and significant expression
changes in response to treatment are listed in Table 1. For the aspirin experiments the
hierarchical cluster analysis of 46 such genes is summarized in Fig. 12, and those with the
most noteworthy and significant expression changes in response to the treatments are
summarized in Table 2.
Our analysis indicated that treatment with 1 M rosuvastatin in unchallenged and
LPS-challenged microglia could induce either the upregulation or the downregulation of a
number of genes. The levels of expression of selected inflammation-related genes (for
example, Ccl24, Ccr1, IL-11, Cxcl1, Ccl4, Ccl5, Hspb1, TGFb-2 and Mbl2) are
highlighted in Fig. 13.

37
Fig. 11 Hierarchical cluster analysis of inflammation related genes I. Cells (subDIV4) were cultured
with or without LPS for 24 h in the presence or absence of rosuvastatin. Rosuvastatin: 1 µM; LPS: 20
ng/ml; LPS + rosuvastatin: LPS (20 ng/ml) + rosuvastatin (1 µM). For hierarchical cluster analysis and
visualization, the Hierarchical Clustering Explorer (v3.0) software was used. The complete linkage
clustering method was applied with Euclidean distance metric. The heat map depicts expression values
relative to control samples on a log2 scale (overexpression: red, repression: green and no change: black).
Missing values are indicated in gray.

38
Fig. 12. Hierarchical cluster analysis of inflammation related genes II. Cells (subDIV4) were cultured
with or without LPS for 24 h in the presence or absence of aspirin. Aspirin: 0.1 mM or 1 mM; LPS: 20
ng/ml; LPS + aspirin: LPS (20 ng/ml) + aspirin (0.1 mM or 1 mM). For hierarchical cluster analysis and
visualization, the Hierarchical Clustering Explorer (v3.0) software was used. The complete linkage
clustering method was applied with Euclidean distance metric. The heat map depicts expression values
relative to control samples on a log2 scale (overexpression: red, repression: green and no change: black).
Missing values are indicated in grey.

39
Some of these genes responded to rosuvastatin in unchallenged or challenged cells, or
were affected by the LPS challenge. The genes upregulated by the LPS challenge included
those coding for chemokine ligands 1, 2, 4, 5, 9, 19 and 24 (Cxcl1 = 111.6-fold, Ccl2 =
34.5-fold, Ccl4 = 17.6-fold, Ccl5 = 147.0-fold, Cxcl9 = 118.2-fold, Ccl19 = 5.2-fold and
Ccl24 = 24.6-fold), IL-11 (Il11 = 19.3-fold), IL-23 receptor (Il23r = 246.6-fold) and
mannose-binding lectin (protein C) 2 receptor (Mbl2 = 33.2-fold). Only a few genes were
downregulated by the LPS challenge, the most affected one being that of the myosin
regulatory light chain 2 (Myl2 = -4.4-fold). Rosuvastatin treatment in unchallenged cells
affected fewer, but similarly important microglial genes involved in pro- and anti-
inflammatory processes. The genes upregulated by rosuvastatin included Cxcl1 (7.0-fold;
Fig. 13D), Ccl5 (6.6-fold; Fig. 13F), and, most importantly, Mbl2 (126.2-fold; Fig. 13I), a
crucial factor in the development of innate immunity (Worthley et al., 2005). Rosuvastatin
was in general a weak inhibitor of the expression of inflammatory genes as it
downregulated only a few genes, notably the anti-inflammatory interleukin-10 (Il10 = -4.0-
fold) and the proinflammatory chemokine (C-C motif) receptor 1(Ccr1 = -2.9-fold). When
rosuvastatin was applied to LPS-challenged cultures (Table 1, Figs. 11, 13), a more
complex picture emerged. Some of the LPS-upregulated genes were inhibited by
rosuvastatin, as seen in the case of Ccl24, where a substantial, 73.5% decrease in gene
expression was observed, down from the 24.5-fold increase after LPS treatment to a 6.5-
fold increase (Fig. 13A), or in the case of Ccr1, where a 49.5% decrease in gene expression
was detected (Fig. 13B). Interestingly, rosuvastatin alone did not exhibit a strong effect on
these latter genes, but only in those cells activated by LPS (Fig. 13C, D). Other genes were
regulated synergistically by rosuvastatin when applied to LPS-challenged microglia. For
example, Cxcl1 and Ccl4 were both further upregulated by rosuvastatin in LPS-challenged
cells (Fig. 13D, E). Some of the genes related to inflammation were not affected by the LPS
challenge, but reacted weakly to rosuvastatin, as seen in Hspb1 gene expression (Fig. 13G,
H), where a 2.8-fold increase was detected.
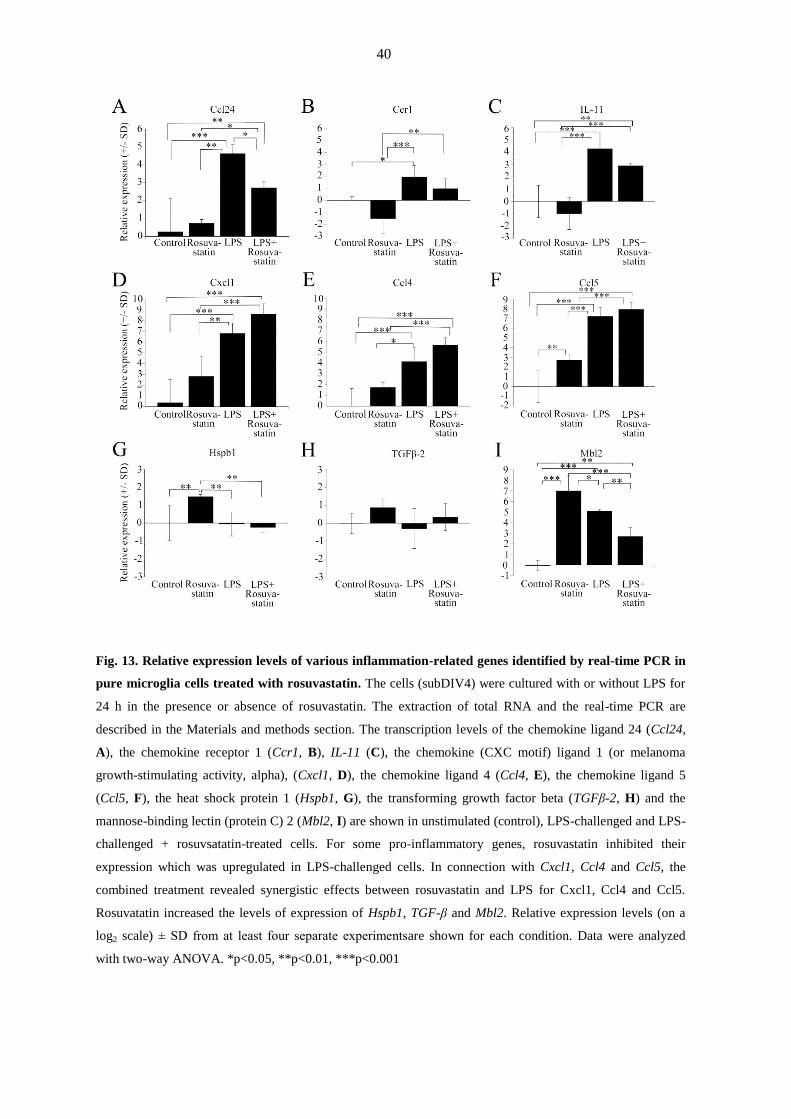
40
Fig. 13. Relative expression levels of various inflammation-related genes identified by real-time PCR in
pure microglia cells treated with rosuvastatin. The cells (subDIV4) were cultured with or without LPS for
24 h in the presence or absence of rosuvastatin. The extraction of total RNA and the real-time PCR are
described in the Materials and methods section. The transcription levels of the chemokine ligand 24 (Ccl24,
A), the chemokine receptor 1 (Ccr1, B), IL-11 (C), the chemokine (CXC motif) ligand 1 (or melanoma
growth-stimulating activity, alpha), (Cxcl1, D), the chemokine ligand 4 (Ccl4, E), the chemokine ligand 5
(Ccl5, F), the heat shock protein 1 (Hspb1, G), the transforming growth factor beta (TGFβ-2, H) and the
mannose-binding lectin (protein C) 2 (Mbl2, I) are shown in unstimulated (control), LPS-challenged and LPS-
challenged + rosuvsatatin-treated cells. For some pro-inflammatory genes, rosuvastatin inhibited their
expression which was upregulated in LPS-challenged cells. In connection with Cxcl1, Ccl4 and Ccl5, the
combined treatment revealed synergistic effects between rosuvastatin and LPS for Cxcl1, Ccl4 and Ccl5.
Rosuvatatin increased the levels of expression of Hspb1, TGF-β and Mbl2. Relative expression levels (on a
log2 scale) ± SD from at least four separate experimentsare shown for each condition. Data were analyzed
with two-way ANOVA. *p<0.05, **p<0.01, ***p<0.001

41
Table 1. Differentially expressed transcripts in rosuvastatin-treated pure microglial cells with or without
LPS challenge
Gene Name
NCBI Reference Sequence ID
RGD ID
Rosuva-
statin
LPS LPS+
Rosuva-
statin
Cxcl1 Chemokine ligand 1 (melanoma growth- stimulating
activity, alpha)
NM_030845.1, RGD ID 619869
+7.05
+111.55 +394.01
Csf3 Colony stimulating factor 3
NM_017104.1 (old), NM_017104.2, RGD ID2426
+2.9 +310.7 +321.7
Il23r Interleukin 23 receptor
XM_001072576.2, RGD ID 1586368
+2.12 +246.56 +268.81
Ccl5 Chemokine ligand 5
NM_031116.3, RGD ID 69069
+6.56 +146.97 +241.56
Nos2 Nitric oxide synthase
U26686.1, RGD ID 3185
+1.82 +169.95 +135.48
Cxcl9 Chemokine ligand 9
NM_145672.4, RGD ID 628798
+3.82 +118.20 +100.95
Il12b Interleukin 12B
NM_022611.1, RGD ID628704
+1.7 +42.0 +87.7
Cxcl2 Chemokine ligand 2
NM_053647.1, RGD ID70069
+1.2 +75.4 +67.3
Il1a Interleukin 1 alpha
NM_017019.1, RGD ID2890
+1.1 +45.3 +57.0
Ccl4 Chemokine ligand 4
NM_053858.1, RGD ID 620441
+3.33 +17.65 +51.0
Cxcl5 Chemokine ligand 5 (also known as Cxcl6)
NM_022214.1, RGD ID708540
+1.1 +54.9 +43.4
Ccl2 Chemokine ligand 2
NM_031530.1, RGD ID 3645
+2.34 +34.49 +33.27
Ccl7 Chemokine ligand 7
NM_001007612.1, RGD ID1359152
-1.4 +12.4 +14.4
Ccl3 Chemokine ligand 3
NM_013025.2, RGD ID3647
-1.3 +9.1 +11.4
Il6 Interleukin 6
M26744.1, RGD ID2901
-1.1 +5.6 +8.4
Il11 Interleukin 11
NM_133519.4, RGD ID 621475
-1.99 +19.28 +7.40
Ptgs2 Prostaglandin endoperoxide synthase 2
NM_017232.3, RGD ID620349
-1.2 +11.8 +7.2
Ccl19 Chemokine ligand 19
NM_001108661.1, RGD ID 1310336
+2.39 +5.21 +6.87
Mbl2 Mannose-binding lectin 2
NM_022704.2, RGD ID 67380
+126.17 +33.22 +6.46
Ccl24 Chemokine ligand 24
NM_001013045.1, RGD ID 1310245
+1.65 +24.55 +6.51
Cxcl10 Chemokine ligand 10
NM_139089.1, RGD ID620209
+1.8 +4.5 +5.5
Il22ra2 Interleukin 22 receptor, alpha 2
NM_001003404.1, RGD ID1303169
+1.1 +2.5 +4.0
Il10 Interleukin 10
NM_012854.2, RGD ID 2886
-3.97 +3.08 +2.69
Il1rn Interleukin 1 receptor antagonist
NM_022194.2, RGD ID 621159
-2.19 +3.76 +2.63
Tlr2 Toll-like receptor 2
NM_198769.2, RGD ID735138
-1.5 +1.8 +2.1

42
Ccr1 Chemokine receptor 1
NM_020542.2, RGD ID 708446
-2.89 +3.88 +1.96
Traf2 Tnf receptor-associated factor 2
NM_001107815.2, RGD ID1310457
+1.6 +1.9 +1.6
Mknk1 MAP kinase-interacting serine/threonine kinase 1
NM_001044267.1, RGD ID1559603
+1.4 +1.6 +1.5
CD47 Cluster of differentiation 47
NM_019195.2, RGD ID 2308
-1.1 +1.3 +1.4
Pla2g4a Phospholipase A2, group IVA (cytosolic, Ca-dependent)
NM_133551.2, RGD ID67366
-1.7 +1.7 +1.3
Tlr7 Toll-like receptor 7
EF032637.1, RGD ID1563357
-1.2 +1.8 +1.3
Ddit3 DNA-damage-inducible transcript 3
NM_001109986.1, RGD ID62391
-1.3 +1.7 +1.3
Il18rap Interleukin 18 receptor accessory protein
XM_003750691.2, RGD ID727867
+1.2 +1.7 +1.2
Hmgn1 High-mobility group nucleosome binding domain 1
NM_001013184.1, RGD ID1307761
+1.6 +1.2 +1.0
Scarb1 Scavenger receptor class B, member 1
NM_031541.1, RGD ID2302
+1.1 -1.3 +1.0
Jun Jun proto-oncogene
NM_021835.3, RGD ID2943
+1.2 -1.8 -1.1
Hspb1 Heat shock protein 1
NM_031970.3, RGD ID 61306
+2.79 -1.04 -1.19
Hc Clathrin, heavy chain
NM_019299.1, RGD ID2364
+1.0 +1.1 -1.3
Tgfb3 Transforming growth factor, beta 3
NM_013174.2, RGD ID3851
+1.2 -1.9 -1.4
Elmo1 Engulfment and cell motility 1
NM_001108415.1, RGD ID1308182
-1.0 -1.7 -1.6
Prkca Protein kinase C, alpha
NM_001105713.1, RGD ID3395
+1.3 -2.1 -1.7
Il10rb Interleukin 10 receptor, beta
NM_001107111.1, RGD ID1560373
-1.4 -1.1 -1.9
Tgfbr1 Transforming growth factor, beta receptor 1
NM_012775.2, RGD ID3852
-1.2 -2.5 -2.0
Sirpa The signal-regulatory protein a
NM_013016.2, RGD ID3449
-1.5 -2.7 -2.8
Tlr5 Toll-like receptor 5
FJ750588.1, RGD ID631351
-1.2 -3.0 -2.9
Ccl11 Chemokine ligand 11
NM_019205.1, RGD ID3644
-1.2 -1.4 -3.0
Myl2 Myosin, light polypeptide 2
NM_001035252.1 (old), NM_001035252.2,
RGD ID1564245
-1.3 -4.4 -5.2
The National Center for Biotechnology Information (NCBI) Reference Sequence Database can be retrieved
at http://www.ncbi.nlm.nih.gov/refseq/. A description of a gene function (RGD ID) can be found in The Rat
Genome Database 2015 (Shimoyama et al., 2015) at http://rgd.mcw.edu/. Data are expressed as fold-change
over the expression of unchallenged and untreated (control) microglial cells. Treatments had different
effects on inflammation-related genes. LPS mostly induced the upregulation of genes as compared with the
untreated control microglia. Rosuvastatin alone also had some effects on these genes. Combined treatment
demonstrated that rosuvastatin had different effects on LPS-activated microglia cells: inhibited the effect of
LPS on certain genes (e.g. Ccl24, Ccr1, Kng1, Nos2, Il11), while it had a synergistic effect with LPS on
others (e.g. Cxcl1, Ccl4, Il23r). Note that in Fig. 13 relative expression levels in log2 scale are used.
43
The analysis of experiments that involved aspirin indicated that treatments with 0.1
mM or 1 mM aspirin in unchallenged and LPS-challenged microglia could induce either the
upregulation or the downregulation of a number of inflammation-related genes. The genes
upregulated by the LPS challenge included those coding for chemokine ligands 1, 2, 4, 5, 7,
9 (Cxcl1 = 84.30-fold, Ccl2 = 16.95-fold, Ccl4 = 9.80-fold, Ccl5 = 38.26-fold, Cxcl5 =
33.19, Cxcl9 = 73.44-fold,) IL-1β (Il1β = 24.70-fold), IL-6 receptor (Il6 = 7.57-fold) and
nitric oxide synthase (Nos2 = 369.22-fold). Only a few genes were downregulated by the
LPS challenge, including Tgfb2 (-1.73-fold), Sirpa (-2.42-fold), Tlr5 (-3.42-fold) and Myl2
(-4.46-fold).
The levels of expression of some inflammation-related genes strongly downregulated
by aspirin are highlighted in Fig. 14. Aspirin treatment in unchallenged cells affected fewer,
but similarly important microglial genes involved in pro- and anti-inflammatory processes.
In unchallenged cells the genes downregulated by aspirin (0.1 mM or 1 mM) included the
anti-inflammatory DNA damage inducible transcript 3 (Ddit =-1.43-fold, and -1.79-fold),
the interleukin 1 receptor antagonist (Il1rn = -1.37-fold; -1.44-fold), the proinflammatory
IL6 (Il6 = -1.23-fold; -1.55-fold) and the proinflammatory chemokine (C-C motif) receptor
1(Ccr1 = -1.42-fold, -1.44-fold). When aspirin was co-administered to LPS-challenged
cultures (Table 2), a more complex picture emerged. Some of the LPS-upregulated genes
were inhibited by aspirin, as seen in the case of Ccr1 (Fig. 14A), IL1-rn (Fig. 14B) or Nos2
(Fig. 14D). Kng1 (Fig. 14C), a proinflammatory gene was downregulated by both aspirin
treatments following LPS challenge. Other genes were further upregulated by aspirin when
applied to LPS-challenged microglia such as the proinflammatory Ccl4 or the chemokine
Ccl5 or Csf2 (Table 2).
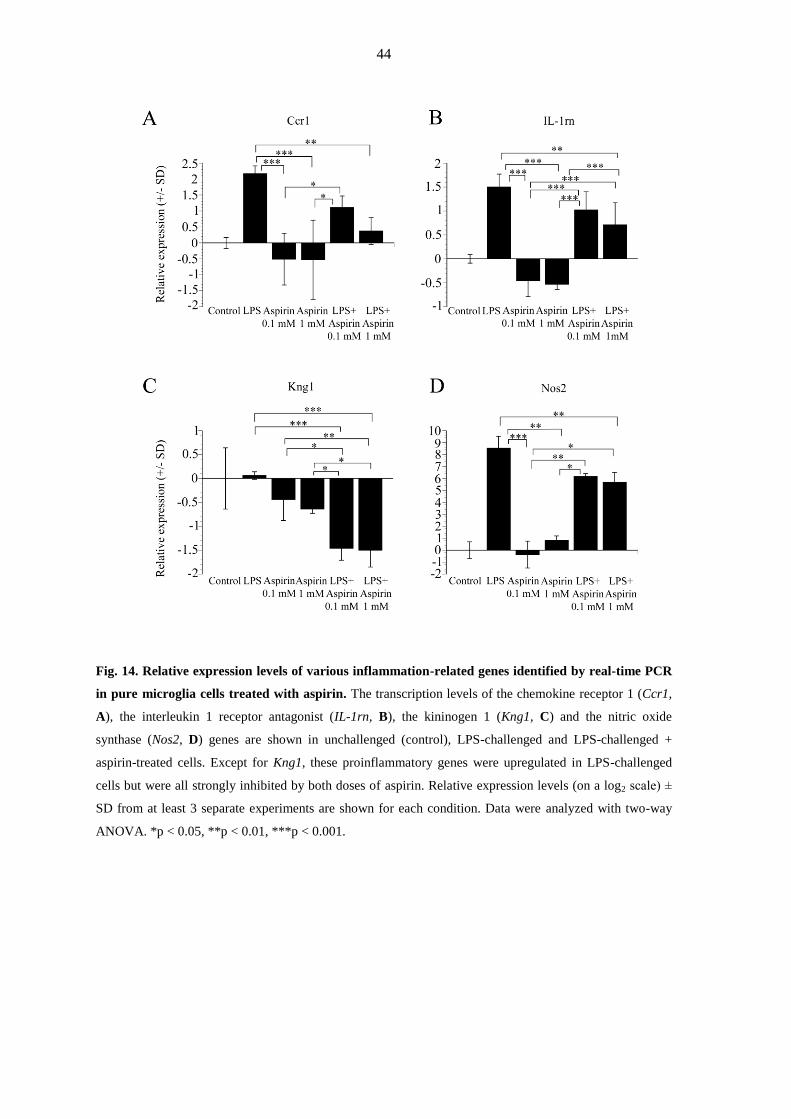
44
Fig. 14. Relative expression levels of various inflammation-related genes identified by real-time PCR
in pure microglia cells treated with aspirin. The transcription levels of the chemokine receptor 1 (Ccr1,
A), the interleukin 1 receptor antagonist (IL-1rn, B), the kininogen 1 (Kng1, C) and the nitric oxide
synthase (Nos2, D) genes are shown in unchallenged (control), LPS-challenged and LPS-challenged +
aspirin-treated cells. Except for Kng1, these proinflammatory genes were upregulated in LPS-challenged
cells but were all strongly inhibited by both doses of aspirin. Relative expression levels (on a log2 scale) ±
SD from at least 3 separate experiments are shown for each condition. Data were analyzed with two-way
ANOVA. *p < 0.05, **p < 0.01, ***p < 0.001.

45
Table 2. Differentially expressed transcripts in aspirin-treated pure microglial cells with or without
LPS challenge
Gene Name
NCBI Reference Sequence ID
RGD ID
LPS Aspirin
0.1 mM
Aspirin
1 mM
LPS+
Aspirin
0.1 mM
LPS+
Aspirin
1 mM
Ccl2 Chemokine ligand 2
NM_031530.1
RGD ID 3645
+16.95 +1.14 + 1.70 + 20.92
+ 21.35
Ccl3 Chemokine ligand 3
NM_013025.2
RGD ID 3647
+ 11.33
-1.01
-1.31
+18.41
+24.79
Ccl4 Chemokine ligand 4
NM_053858.1
RGD ID 620441
+9.80
-1.05
+1.06
+17.68
+29.80
Ccl5 Chemokine ligand 5
NM_031116.3
RGD ID 69069
+38.26
+1.02
+1.35
+84.12
+62.69
Ccl7 Chemokine ligand 7
NM_001007612.1
RGD ID 1359152
+11.48
-1.14
+1.50
+10.82
+11.82
Ccr1 Chemokine receptor 1
NM_020542.2
RGD ID 708446
+4.51
-1.42
-1.44
+2.16
+1.29
Cxcl1 Chemokine ligand 1 (melanoma growth-
stimulating activity, alpha)
NM_030845.1
RGD ID 619869
+84.30
-1.51
+4.11
+43.46
+246.78
Cxcl2 Chemokine ligand 2
NM_053647.1
RGD ID 70069
+69.02
-1.37
+1.73
+63.70
+60.07
Cxcl5 Chemokine ligand 5 (Cxcl6)
NM_022214.1
RGD ID 708540
+33.19
+1.41
+2.11
+34.89
+46.37
Cxcl9 Chemokine ligand 9
NM_145672.4
RGD ID 628798
+73.44
+1.40
+1.22
+86.22
+68.51
Cxcl10 Chemokine ligand 10
NM_139089.1
RGD ID 620209
+2.83
-1.30
-1.24
+3.93
+3.21
Csf1 Colony stimulating factor-1
AF515736.1
RGD ID621063
+1.31
-1.49
-1.03
+1.48
+1.30
Csf2 Colony stimulating factor-2
XM_001074265.1(old)
NM_053852.1
RGD ID621065
+10.01
+1.20
-1.00
+20.66
+14.84
Csf3 Colony stimulating factor 3
NM_017104.1 (old), NM_017104.2
RGD ID 2426
+305.58
+1.23
+4.96
+282.90
+278.46
Ddit3 DNA-damage inducible transcript 3
NM_001109986.1
RGD ID 62391
+1.25
-1.43
-1.79
+1.14
+1.04
Il1β Interleukin 1 beta
NM_031512.2
RGD ID 2891
+24.70
+1.18
+1.62
+19.88
+22.98
Il1rap Interleukin 1 receptor accessory protein
NM_012968.1
RGD ID2893
+1.97
-1.02
+1.06
+2.30
+2.08

46
Il1rn Interleukin 1 receptor antagonist
NM_022194.2
RGD ID 621159
+2.83
-1.37
-1.44
+2.02
+1.64
Il6 Interleukin 6
M26744.1
RGD ID 2901
+7.57
-1.23
-1.55
+10.82
+7.22
Il10 Interleukin 10
NM_012854.2
RGD ID 2886
+8.47
+2.01
+1.04
+6.28
+11.87
Il18 IFN-gamma-inducing factor (IL-18)
AY077842.1
RGD ID 2889
+2.24
+1.63
-1.29
+1.90
+2.03
Kng1 Kininogen 1
NM_012696.2
RGD ID 2980
+1.04
-1.36
-1.55
-2.75
-2.82
Nos2 Nitric oxide synthase
U26686.1
RGD ID 3185
+369.22
-1.28
+1.78
+73.06
+51.21
Pla2g4a Phospholipase A2, group IVA (cytosolic,
calcium-dependent)
NM_133551.2
RGD ID 67366
+1.73
-1.33
-1.16
+1.66
+1.07
Ptgs2 Prostaglandin endoperoxide synthase 2
NM_017232.3
RGD ID 620349
+16.83
-1.33
+2.14
+11.76
+12.55
Sirpa The signal-regulatory protein a
NM_013016.2
RGD ID 3449
-2.42
-1.22
+1.04
-2.84
-2.63
Tgfb1 Transforming growth factor, beta 1
NM_021578.2
RGD ID 69051
-1.21
+1.05
-1.10
+1.25
+1.34
Tgfb2 Transforming growth factor, beta 2
NM_031131.1
RGD ID 70491
-1.73
-1.15
-1.43
-1.47
-2.41
Tlr2 Toll-like receptor 2
NM_198769.2
RGD ID 735138
-1.03
-1.49
-1.22
+1.63
+1.63
Tlr7 Toll-like receptor 7
EF032637.1
RGD ID 1563357
+2.71
+1.05
-1.36
+1.79
+2.21
The National Center for Biotechnology Information (NCBI) Reference Sequence Database can be retrieved at
http://www.ncbi.nlm.nih.gov/refseq/. A description (Shimoyama et al., 2015) of a gene function (RGD ID) can
be found in The Rat Genome Database 2015 at http://rgd.mcw.edu/. Data are expressed as fold-change over the
expression of unchallenged and untreated (control) microglial cells. Treatments had different effects on
inflammation-related genes. Most of the genes were upregulated by LPS challenge. Aspirin, either alone or in
combination with LPS, had differential effects on the expression of certain genes. For example, aspirin
treatment downregulated Tgfb2, Kng1 or Ddit3, while upregulated other genes such as Csf3, IL-10 and CxCl1 in
unchallenged cells. In LPS-challenged microglia, aspirin inhibited IL1rn, Ccr1, Kng1, Nos2, while it had a
synergistic effect with LPS on others (e.g. Cxcl5, Ccl4, Csf2). Note that in Fig. 13 relative expression levels in
log2 scale are used.

47
5. DISCUSSION
We carried out a complex quantitative investigation of the morphological, functional and
gene expression characteristics of pure microglial cells of embryonic origin after either
rosuvastatin or aspirin treatment in unstimulated or LPS-challenged cultures, and
highlighted the complex beneficial effects of both drugs that make them excellent
candidates for preventive neuroinflammatory therapy with well-balanced properties of
enhanced anti-inflammatory and subdued proinflammatory effects. Although microglial
cells prepared from embryonic nervous tissue may differ from those of the adult brain in
certain characteristics (Floden and Combs, 2006), they are nevertheless similarly responsive
to immunological (LPS) challenge and suitable for morphological, functional and gene
expression studies. When activated, the microglia display both pro- and anti-inflammatory
properties as they can be polarized along a continuum toward a detrimental (M1) or a
beneficial (M2) state in the injured CNS (Kroner et al., 2014). Inflammation that is
mediated, and perhaps enhanced, by the microglia has been implicated in a number of
neuropathological conditions, ranging from acute injuries (Loane and Byrnes, 2010) and
chronic inflammatory conditions (Gay, 2007; Napoli and Neumann, 2010) to
neurodegenerative diseases (Long-Smith et al., 2009; Prokop et al., 2013).
Statins are commonly used for the treatment of high blood cholesterol levels (Burg
and Espenshade, 2011). They are classified on the basis of their lipid-lowering efficacy and
their lipophilic/hydrophilic nature (Hamelin and Turgeon, 1998; Jones et al., 1998;
Davidson, 2002; Schachter, 2005); while lipophilic statins penetrate the cell membrane,
hydrophilic statins such as rosuvastatin (Crestor; AstraZeneca Pharmaceuticals, LP,
Wilmington, DE, USA) are transported through the blood-brain barrier via multiple
transporters, including the family of organic anion-transporting polypeptides (Kitamura et
al., 2008; Abbott et al., 2010). Rosuvastatin exhibits the greatest inhibitory effect on
cholesterol biosynthesis (McTaggart et al., 2001) and most favorably alters the high-density
lipoprotein profile among statins (Asztalos et al., 2007); it was the fourth highest-selling
prescription drug in the USA in 2013 (http://www.drugs.com/stats/top100/2013/sales).
Although their main action is to block cholesterol synthesis, other effects of statins,
including those on the regression of atherosclerotic coronary lesions, are also important
(Wierzbicki et al., 2003). Expecting similarly beneficial effects on the microglia, we
determined how rosuvastatin modulates both pro- and anti-inflammatory actions by
affecting numerous morphological, functional and gene expression parameters in pure

48
microglial cultures. These cultures provide a unique opportunity to study these functional
and expression parameters without the significant influence of any contaminating cell types.
Our microglial cultures were > 99% pure, a crucial factor when the levels of secreted pro-
and anti-inflammatory peptides or gene expression levels are measured, as other cell types
in the CNS are also capable of expressing such peptides (Gruol et al., 2014).
Our studies revealed the effects of rosuvastatin on various quantitative morphological
properties of the microglia. Rosuvastatin affected the area, perimeter and TI profoundly in
both unchallenged and LPS-challenged cells. It generally promoted microspike formation
and increased the cell perimeter and TI through ramification. Concomitantly with the
increase in cell area in both unchallenged and LPS-challenged cells, rosuvastatin affected
the synthesis of Iba1, a protein that is implicated in actin cytoskeleton remodeling (Sasaki et
al., 2001; Ohsawa et al., 2004). As expected, LPS treatment caused microglia activation that
resulted in a low TI, but the combined treatment with LPS + rosuvastatin inhibited this
activation through the development of microspikes and the cells becoming more ramified.
Rosuvastatin strongly inhibited microglia proliferation and adhesion as it significantly
decreased the number of cells in both naïve and LPS-challenged cultures. Although the
precise mechanisms are not known, statins are able to inhibit mitosis through cell cycle
arrest in G1 (Yang et al., 2008) and G2/M (Gao et al., 2012). As rosuvastatin displays some
anti-mitogenic effect, its regular use may prove beneficial in lowering the risks of a number
of cancer types (Simon et al., 2012). To quantify cell adhesion, we used the cell index value
(Atienza et al., 2005; Jarvis et al., 2011). Our finding that rosuvastatin lowered cell
adhesion in both unchallenged and LPS-challenged cells is in harmony with previous
reports on the ability of statins to decrease the expression of cell adhesion molecules
(Weber et al., 1997; Wierzbicki et al., 2003).
We also examined how rosuvastatin altered fluid-phase phagocytosis. Phagocytosis is
crucial in both the normal and the pathologic CNS as it efficiently eliminates foreign
materials, apoptotic cells and cell debris (Kettenmann et al., 2011), and alteration of this
clearance function could be harmful (Hickman and El Khoury, 2014; Lue et al., 2014). For
example, proinflammatory phenotypes are linked to the phagocytic activity, and the
blocking of phagocytosis may prevent some forms of inflammatory neurodegeneration, and
might therefore be beneficial during infection, trauma, ischemia, neurodegeneration and
aging (Neher et al., 2011; He et al., 2014). LPS is a strong activator of microglial
phagocytosis (Nakamura, 2002; Lund et al., 2006; Szabo and Gulya, 2013). In our study,
rosuvastatin inhibited phagocytosis completely in the LPS-challenged microglia, while it
49
was ineffective in inhibiting the basal-level phagocytosis in unchallenged cells, indicating
that rosuvastatin is a potent inhibitor of this function only in proinflammatory situations.
Cytokines, important immunomodulators in the normal functioning of the CNS, can
be released, among others, by the microglial cells. Cytokines can also be harmful: previous
studies have shown that neurodegeneration originating through neuroinflammation is often
elicited by activated microglia (McGeer and McGeer, 2003, 2010) through the release of
different proinflammatory cytokines and chemokines (Hanisch, 2002). High levels of IL-1β
could be observed, for instance, in the vicinity of amyloid plaques of AD patients (McGeer
et al., 1993; Lindberg et al., 2005; Ghosh et al., 2013), where activated microglia
accumulate (Rodriguez et al., 2014). Previous studies also suggested that statins reduce the
levels of some of the proinflammatory cytokines (Lindberg et al., 2005; Nakamichi et al.,
2006; Veillard et al., 2006) and increase the anti-inflammatory cytokine IL-10 (Schönbeck
and Libby, 2004). As expected, both pro- (IL-1β, TNF-α) and anti-inflammatory cytokines
(IL-10) were increased in LPS-challenged cells as compared with the unchallenged
(control) group. Rosuvastatin did not significantly affect the basal cytokine levels in
unchallenged microglia, but strongly inhibited the levels of the proinflammatory cytokines
IL-1β and TNF-α when tested in LPS-challenged cells. Besides the inhibition of these pro-
inflammatory agents, rosuvastatin exerted a direct anti-inflammatory effect by elevating the
level of IL-10 in both unchallenged and LPS-challenged cells. Effects of rosuvastatin on
such diverse immune mechanisms of microglia as phagocytosis and cytokine production
indicated a strong likelihood of its involvement in many other immune system-wide
functions and possible effects on inflammation-related genes.
We demonstrated that rosuvastatin, LPS and their combination had differential effects
on the expression of inflammation-related genes. Several genes were upregulated after LPS
challenge, confirming its strong proinflammatory effects on the microglia. Rosuvastatin
itself, and in combination with LPS, displayed different effects on gene expression.
Although rosuvastatin was not able to decrease all the LPS-upregulated genes, it suppressed
the pro-inflammatory effects of LPS on some genes such as Ccl24 or Ccr1. Ccl24 is a
chemokine that can readily be upregulated by proinflammatory cytokines or microbial
stimulus such as LPS (Watanabe et al., 2002). Ccr1 is implicated in MS and experimental
autoimmune encephalomyelitis (EAE). Previous studies suggested that Ccr1 could be
upregulated in EAE (Rottman et al., 2000), and the microglia expressed Ccr1 around the
demyelinating plaques, making Ccr1 antagonists or inhibitors possible targets for the
development of an effective therapy for MS (Hesselgesser et al., 1998; Eltayeb et al., 2007).

50
Rosuvastatin additionally increased the expression of certain other genes. Its general
effects on the microglia were predominantly anti-inflammatory. The gene most upregulated
by rosuvastatin was Mbl2, which is important in innate immunity (Worthley et al., 2005; Ip
et al., 2009) and involved in the stimulation of phagocytosis (Stuart et al., 2005). Hspb1 was
also upregulated by rosuvastatin. Hspb1 is a heat-shock protein with strong anti-apoptotic
potential that regulates the cytoskeleton dynamics through F-actin stabilization (Concannon
et al., 2003). Cxcl1 has been reported to be an anti-inflammatory protein with a
neuroprotective role (Omari et al., 2009). Additional chemokine genes such as Ccl2 (El
Khoury et al., 2007; El Khoury and Luster, 2008), Cxcl1 (Bosivert et al., 2006) and Ccl5
were all upregulated in our studies and implicated in microglia recruitment to areas of
inflammation. Although Ccl5 has been demonstrated to induce proinflammatory
mechanisms (Skuljec et al., 2011), it has also been shown to ameliorate AD-like pathology
by recruiting microglia to β-amyloid deposits (Lee et al., 2012) and to protect against
neuronal injury (Campbell et al., 2013; Lim and Mochetti, 2015).
We also examined if aspirin was able to exert similar effects on microgial cells. As
being one of the most commonly used drugs, it is noted for its strong anti-inflammatory
actions. It acetylates the active site of the enzyme COX, and irreversibly blocks the
conversion of arachidonic acid to prostanoid (Vane and Botting, 2003). Apart from its
classical beneficial role in cardiovascular diseases, however, aspirin may also be beneficial
in neuroinflammation-related disorders given that appropriate target cells, the microglia, are
present in the nervous tissue.
Aspirin reversed the morphological effects of LPS-induced microglia activation
through the increase of the area, perimeter and TI values; the combined treatment with LPS
also inhibited this activation through the development of microspikes and inducing the cells
to become more ramified. Aspirin also affected the synthesis of Iba1 protein (Oshawa et al.,
2004; Szabo et al., 2016). Similarly to rosuvastatin, aspirin inhibited phagocytosis in the
LPS-challenged microglia only, while it did not affect the basal phagocytotic activity in
unchallenged cells, a physiological microglial function crucial for maintaining a healthy
CNS.
LPS is the main ligand for Toll-like receptor 4 (TLR4). TLR4-induced signalling
activates the NF-κB and MAPK pathways leading to the production of proinflammatory
cytokines (Fuentes et al., 2016; Korneev et al., 2017). Aspirin inhibits the production of
proinflammatory cytokines through the suppression of LPS-induced NF-κB and MAPK
pathways in microglial cells (Cianciulli et al., 2016; Sun et al., 2017; Yang et al., 2014).

51
NF-κB activity is suppressed in the cytoplasm with an inhibitory IκB protein. The
phosphorylation and degradation of IκB activates NF-κB and allows to the NF-κB dimer to
translocate to the nucleus and activate target genes such as IL-1β and TNF-α (Sun et al,
2017; Yang et al, 2014). LPS-stimulated degradation of IκB could be strongly inhibited by
aspirin (Yang et al, 2014). The anti-inflammatory property is mediated by inhibition of
several members of MAPK family, e.g. p38 MAPK and ERK1/2 (Jung et.al, 2009; Li et al.,
2017); according to recent data, aspirin enhances the inhibition of p38 MAPK and ERK
phosphorylation in BV2 microglial cells (Yang et al., 2014).
Previous studies demonstrated a strong relationship between cytokines and
neurodegenerative diseases through the activation of microglia (McGeer and McGeer,
2010). Microglial cells activated by β-amyloid deposits produce toxic mediators and pro-
inflammatory cytokines such as IL-1β, IL-6, TNF-α and enzymes such as iNos that could
result in chronic inflammation (Benveniste et al, 2001). High level of IL-1β could be
observed in the vicinity of amyloid plaques of AD patients (McGeer et al., 1993) that could
also be responsible for plaque accumulation (Akiyama et al., 2000). COX-2 is also
increased in AD patients (Akiyama et al., 2000). Similarly to the findings for AD, previous
studies also suggested that activated microglia was associated with neuronal loss during PD
due to the activation of cytokines, COX-2 and iNos expression (Orr et al., 2002; Phani et
al., 2012). Increased levels of TNF-α and NO could cause demyelination in MS (Minagar et
al., 2002). As expected, both pro- (IL-1β, TNF-α) and anti-inflammatory (IL-10) cytokines
were increased in LPS-challenged microglia as compared with the unchallenged cells.
Aspirin did not significantly affect the basal cytokine levels in unchallenged cells, but
effectively reduced the levels of the proinflammatory cytokines IL-1β and TNF-α when
tested in LPS-challenged microglia. Besides the inhibition of these proinflammatory agents,
aspirin was also able to elevate the anti-inflammatory IL-10 in LPS-challenged cells. Thus,
aspirin is remarkably beneficial as it concomitantly decreased proinflammation- but
increased anti-inflammation-related mechanisms in immunochallenged cells.
We also demonstrated that aspirin, LPS and their combination had differential effects
on the expression of several inflammation-related genes in pure microglial cells. Some of
these genes encode markers that can be related to different microglia subtypes proposed as
M1 or M2 phenotypes (Moehle and West, 2015; Orihuela et al., 2016). In this context, for
example, the proinflammatory IL-1β, IL-6, IL-18, Cxcl9, TNF-α, Cxcl10, and the
chemokine Ccl5, genes encode M1 markers, while the anti-inflammatory IL-10 and the
proinflammatory Tgfb2 genes are M2 markers (Franco and Fernández-Suárez, 2015). In an

52
LPS-based animal model for PD, a Rho kinase inhibitor reversed the inflammatory M1 to
anti-inflammatory M2 microglia, decreased NF-кB activation, and inhibited IL-12 and
TNF- generation (He et al., 2016), demonstrating a protective effect against LPS-mediated
dopamine degeneration. It must be noted, however, that the concept of M1/M2 polarization
of microglia cells is not universally accepted and needs reassessment (Martinez and
Gordon, 2014; Ransohoff, 2016). Our study demonstrated that several genes were
upregulated after LPS challenge, confirming its strong proinflammatory effects on
microglia. Aspirin, both alone and in combination with LPS, displayed different effects on
microglial gene expression. It suppressed the proinflammatory effects of LPS on some
genes such as Ccr1 and Nos2. It may be of importance that Ccr1 was previously associated
with both MS and EAE (Rottman et al., 2000) and Ccr1 protein was localized around the
demyelinating plaques (Eltayeb et al., 2007). In our experiment (Fig. 14A) both aspirin
doses decreased Ccr1 expression. Multiple studies concluded that Nos2 has a central role in
inflammatory reactions and pathogenesis of certain neurodegenerative diseases (Galea and
Feinstein, 1999; Akiyama et al., 2000; Block and Hong, 2005). Thus, downregulating Nos2
expression could be crucial for possible future therapies. We demonstrated that aspirin
inhibited Nos2 expression significantly in LPS-challenged microglia. Kininogen (Kng1) is
well known for its proinflammatory properties (Stewart et al., 1997; Sharma and Yusof,
1998) as it increases the release of inflammatory cytokines and affects the formation of
inflammatory exudate and pain (Ueno and Ohishi, 2003). Aspirin also increased the
expression of genes that were predominantly anti-inflammatory e.g. IL-10, Tgfb1 or Ccl5.
For example, IL-10 is a well known anti-inflammatory cytokine that limits the production
of proinflammatory cytokines including IL-1 and -, IL-6, IL-12, IL-18, and TNF-
(Couper et al., 2008). Previous studies showed that Tgfb1 had a protective effect against
excitotoxicity and the loss of this protein resulted in neurodegeneration (Brionne et al.,
2003). Ccl5 was also upregulated due to aspirin treatment similarly to that of rosuvastatin,.
Upregulation of such anti-inflammatory genes in the prevention or amelioration of
neurodegenerative disorders could prove beneficial.
In summary, both rosuvastatin and aspirin elicit strong responses to microglial
functions in vitro. They inhibit the harmful proinflammatory signals and significantly
enhance the beneficial anti-inflammatory actions after LPS challenge in pure microglial
cells. Their pleiotropic beneficial effects include the robust inhibition of phagocytosis and
the synthesis of proinflammatory cytokines combined with a very strong stimulation of anti-

53
inflammatory cytokine production, and a beneficial differential expression of a number of
inflammation-related genes. In connection with rosuvastatin we also observed some anti-
mitogenic effect. As activated microglia often damage neuronal tissues or cause chronic
inflammation by excessive cytokine production combined with high level of phagocytosis,
effective inhibition of proinflammatory actions by these drugs could be an important
prophylactic therapy in preventing or ameliorating neuroinflammation and thus
neurodegeneration. Our data indicate that both rosuvastatin and aspirin beneficially regulate
microglia, cells that could be a target in treating or preventing neurodegenerative disorders.
Given the large population who receives aspirin for pain medication and prevention of a
number of pathologic conditions or rosuvastatin for lipid-lowering treatment, to study the
interactions of theses drugs with the nervous system is even more important. Early
observations revealed that NSAIDs could reduce the risk of AD (McGeer et al., 1996;
Stewart et al., 1997), a notion that has not been proven in randomised controlled trials
assessing the efficacies of aspirin, steroidal and non-steroidal anti-inflammatory drugs in
AD (Jaturapatporn et al., 2012). Previous studies also suggested that statins may reduce the
risk of dementia (Jick et al., 2000). As the effects of aspirin on selected morphological,
functional and gene expression characteristics of microglia are very similar to that of
rosuvastatin, and these drugs are frequently prescribed together for a number of
cardiovascular illnesses, their extended use may have contributed to the lower than
expected incidence of AD (Schrijvers et al., 2012). Thus, the individual and combined
effects of aspirin and rosuvastatin on microglial functions should be further analyzed for a
prophylactic therapeutic approach in neurodegenerative disorders. Microglial cells could
therefore be a novel, specific therapeutic targets in fighting neurodegenerative disorders.
54
6. CONCLUSION
We characterized the morphological, functional and immunomodulatory effects of
rosuvastatin and aspirin in pure secondary microglial cells derived from mixed primary
cortical cultures of embryonic (E18) rat forebrains.
Analyzing Iba1 immunoreactivity and binary silhouettes of microglia we
determined the morphological changes of microglial cells by measuring their TI values.
LPS-induced activation resulted in low TI (TI < 2) but both rosuvastatin and aspirin were
able to inhibit this effect and increased the cell size, filopodia and microspike
development of microglial cells (TI > 6).
The quantitative analysis of the engulfed fluorescent microspheres revaled that both
rosuvastatin and aspirin inhibited the LPS-induced phagocytosis by more than 50%.
We used enzyme-linked immunosorbent assay to determine the amount of pro-
inflammatory and anti-inflammatory cytokine level released by microglia. Although LPS
treatment elevated the proinflammatory IL-1β (over 150 pg/ml) and TNF-α (over 900
pg/ml) levels, both drugs significantly reduced the levels of these cytokines by about 20-
50%. Rosuvastatin and aspirin were also able to increase the anti-inflammatory IL-10
production in LPS-activated cells from 25-40 pg/ml to 280-310 pg/ml as compared to
unchallenged (control) cells.
Rosuvastatin and aspirin also affected the expression patterns of certain genes. We
analyzed the effects of these treatments on 116 inflammation related genes in the
unchallenged and LPS-induced pure microglial cells. Both drugs induced either the
upregulation or the downregulation of a number of genes. Rosuvastatin was able to
supress the proinflammatory effects of LPS on some genes such as Ccl24 or Ccr1, and
upregulated anti-inflammatory genes such as Cxcl1 or Hspb1, while aspirin
downregulated proinflammatory genes such as IL-6, Ccr1 or Nos2 and upregulated the
anti-inflammatory Ccl5.
In summary the main findings of this study are:
1. TI values revealed that both rosuvastatin and aspirin promoted ramified microglial
morphology with TI > 6, and both drugs were able to antagonize the morphological
changes characteristic of LPS-induced microglial activation (TI < 2);
2. Rosuvastatin inhibited the cell proliferation by 40-60% and decreased the adhesion of
microglial cells;

55
3. Both rosuvastatin and aspirin were able to reduce the LPS-induced robust phagocytic
activity but they did not affect to the basal (physiological) phagocytosis;
4. Rosuvastatin and aspirin had strong overall anti-inflammatory effect as they inhibited
the proinflammatory cytokines (IL-1β, TNF-α) and stimulated the anti-inflammatory
IL-10 in activated microglial cells;
5. Analysis of the gene expression patterns revealed that both rosuvastatin and aspirin
had various effects on a large number of inflammation-related genes in pure microglial
cells. Out of the 116 inflammation related genes rosuvastatin significantly changed the
expression pattern of 47 genes, while aspirin altered significantly the expression level
of 30 genes. They inhibited several proinflammatory genes such as Ccr1, Ccl24, IL-6
or Nos2, while they upregulated other genes such as the anti-inflammatory Cxcl1, Ccl5
or IL-10.
7. ACKNOWLEDGMENTS
I would like to thank to my supervisor Professor Karoly Gulya for his help. I am also
grateful to Zsuzsa Ambrus and Olga Darányi for the technical support. This work was
supported by the program project grants to the University of Szeged from the Ministry of
Resources (TÁMOP-4.2.1.B-09/1/KONV-2010-0005 and TÁMOP-4.2.2.A-11/1/KONV-
2012-0052) through the European Union Cohesion Fund and from the National
Development Agency of Hungary (KMR_12_1_2012_0072). I dedicate this work to my
family for their help and support.

56
8. REFERENCES
Abbott NJ, Patabendige AA, Dolman DE, Yusof SR, Begley DJ (2010) Structure and
function of the blood-brain barrier. Neurobiol Dis 37:13-25.
Ahmed Z, Shaw G, Sharma VP, Yang C, McGowan E, Dickson DW (2007) Actin-binding
proteins coronin-1a and IBA-1 are effective microglial markers for
immunohistochemistry. J Histochem Cytochem 55:687-700.
Aïd S, Bosetti F (2011) Targeting cyclooxygenases-1 and -2 in neuroinflammation:
Therapeutic implications. Biochimie 93(1):46-51.
Akiyama H, Barger S, Barnum S, Bradt B, Bauer J, Cole GM, Cooper NR, Eikelenboom
P, Emmerling M, Fiebich BL, Finch CE, Frautschy S, Griffin WS, Hampel H, Hull
M, Landreth G, Lue L, Mrak R, Mackenzie IR, McGeer PL, O'Banion MK, Pachter
J, Pasinetti G, Plata-Salaman C, Rogers J, Rydel R, Shen Y, Streit W, Strohmeyer R,
Tooyoma I, Van Muiswinkel FL, Veerhuis R, Walker D, Webster S, Wegrzyniak B,
Wenk G, Wyss-Coray T (2000) Inflammation and Alzheimer's disease. Neurobiol
Aging 21:383-421.
Amann R, Peskar BA (2002) Anti-inflammatory effects of aspirin and sodium salicylate.
Eur J Pharmacol 447:1-9.
Arends YM, Duyckaerts C, Rozemuller JM, Eikelenboom P, Hauw JJ (2000) Microglia,
amyloid and dementia in alzheimer disease. A correlative study. Neurobiol Aging
21(1):39-47.
Asztalos BF, Le Maulf F, Dallal GE, Stein E, Jones PH, Horvath KV, McTaggart F,
Schaefer EJ (2007) Comparison of the effects of high doses of rosuvastatin versus
atorvastatin on the subpopulations of high-density lipoproteins. Am J Cardiol 99:681-
685.
Atienza JM, Zhu J, Wang X, Xu X, Abassi Y (2005) Dynamic monitoring of cell adhesion
and spreading on microelectronic sensor arrays. J Biomol Screen 10:795.
Banati RB, Gehrmann J, Schubert P, Kreutzberg GW (1993) Cytotoxicity of microglia. Glia
7:111-118.
Benveniste EN, Nguyen VT, O'Keefe GM (2001) Immunological aspects of microglia:
relevance to Alzheimer's disease. Neurochem Int 39:381-391.

57
Berk M, Dean O, Drexhage H, McNeil JJ, Moylan S, O'Neil A, Davey CG, Sanna L,
Maes M (2013) Aspirin: a review of its neurobiological properties and therapeutic
potential for mental illness. BMC Med 11:74.
Block ML, Hong JS (2005) Microglia and inflammation-mediated neurodegeneration:
multiple triggers with a common mechanism. Prog Neurobiol 76:77-98.
Brionne TC, Tesseur I, Masliah E, Wyss-Coray T (2003) Loss of TGF-beta 1 leads to
increased neuronal cell death and microgliosis in mouse brain. Neuron 40:1133-1145.
Boisvert WA, Rose DM, Johnson KA, Fuentes ME, Lira SA, Curtiss LK, Terkeltaub RA
(2006) Up-regulated expression of the CXCR2 ligand KC/GRO-alpha in
atherosclerotic lesions plays a central role in macrophage accumulation and lesion
progression. Am J Pathol 168:1385-1395.
Burg JS, Espenshade PJ (2011) Regulation of HMG-CoA reductase in mammals and
yeast. Progr Lipid Research 50:403-410.
Campbell LA, Avdoshina V, Rozzi S, Mocchetti I (2013) CCL5 and cytokine expression
in the rat brain: differential modulation by chronic morphine and morphine
withdrawal. Brain Behav Immun 34:130-140.
Candelario-Jalil E, González-Falcón A, García-Cabrera M, Alvarez D, Al-Dalain S,
Martínez G, León OS, Springer JE (2003) Assessment of the relative contribution of
COX-1 and COX-2 isoforms to ischemia-induced oxidative damage and
neurodegeneration following transient global cerebral ischemia. J Neurochem
86(3):545-55.
Cianciulli A, Calvello R, Porro C, Trotta T, Salvatore R, Panaro MA (2016) PI3k/Akt
signalling pathway plays a crucial role in the anti-inflammatory effects of curcumin
in LPS-activated microglia. Int Immunopharmacol 36:282-290.
Choi SH, Aid S, Bosetti F (2009) The distinct roles of cyclooxygenase-1 and -2 in
neuroinflammation: implications for translational research. Trends Pharmacol Sci
30(4):174-81.
Concannon CG, Gorman AM, Samali A (2003) On the role of Hsp27 in regulating
apoptosis. Apoptosis 8:61-70.
Couper KN, Blount DG, Riley EM (2008) IL-10: the master regulator of immunity to
infection. J Immunol 180:5771-5777.
58
Cordle A, Landreth G (2005) 3-Hydroxy-3-methylglutaryl-coenzyme A reductase inhibitors
attenuate β-amyloid-induced microglial inflammatory responses. J Neurosci 25:299-
307.
Davidson MH (2002) Rosuvastatin: a highly efficacious statin for the treatment of
dyslipidaemia. Exp Opin Invest Drugs 11:125–141.
El Khoury J, Toft M, Hickman SE, Means TK, Terada K, Geula C, Luster AD (2007) Ccr2
deficiency impairs microglial accumulation and accelerates progression of Alzheimer-
like disease. Nat Med 13:432-438.
El Khoury J, Luster AD (2008) Mechanisms of microglia accumulation in Alzheimer's
disease: therapeutic implications. Trends Pharmacol Sci 29:626-632.
Eltayeb S, Berg AL, Lassmann H, Wallström E, Nilsson M, Olsson T, Ericsson-Dahlstrand
A, Sunnemark D (2007) Temporal expression and cellular origin of CC chemokine
receptors CCR1, CCR2 and CCR5 in the central nervous system: insight into
mechanism of MOG-induced EAE. J Neuroinflamm 4:14.
Fabian G, Farago N, Feher LZ, Nagy LI, Kulin S, Kitajka K, Bito T, Tubak V, Katona
RL, Tiszlavicz L, Puskas LG (2011) High-density real-time PCR-based in vivo
toxicogenomic screen to predict organ-specific toxicity. Int J Mol Sci 12:6116-6134.
Famer D, Wahlund LO, Crisby M (2010) Rosuvastatin reduces microglia in the brain of
wild type and ApoE knockout mice on a high cholesterol diet; implications for
prevention of stroke and AD. Biochem Biophys Res Commun 402:367-372.
Floden AM, Combs CK (2006) Beta-amyloid stimulates murine postnatal and adult
microglia cultures in a unique manner. J Neurosci 26(17):4644-8.
Franco R, Fernández-Suárez D (2015) Alternatively activated microglia and macrophages
in the central nervous system. Prog Neurobiol 131:65-86.
Fuentes E, Rojas A, Palomo I (2016) NF-κB signaling pathway as target for antiplatelet
activity. Blood Rev 30:309-315.
Fujita H, Tanaka J, Toku K, Tateishi N, Suzuki Y, Matsuda S, Sakanaka M, Maeda N
(1996) Effects of GM-CSF and ordinary supplements on the ramification of
microglia in culture: A morphometrical study. Glia 18:269-281.
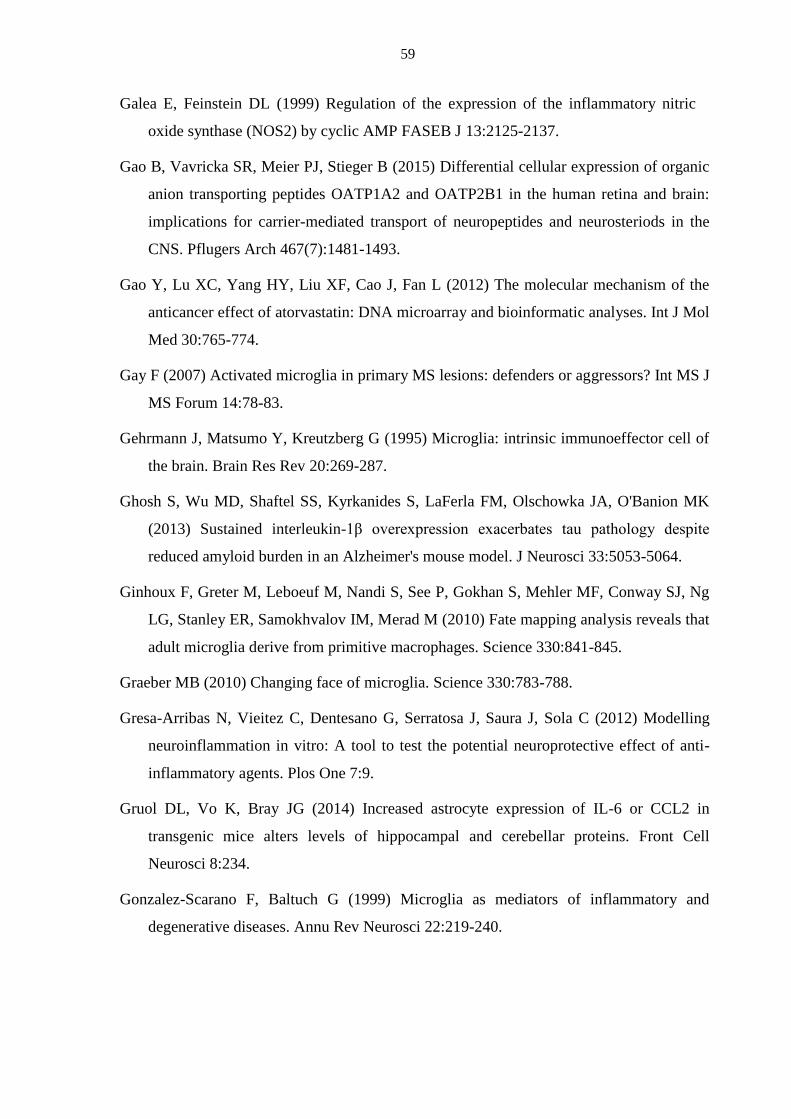
59
Galea E, Feinstein DL (1999) Regulation of the expression of the inflammatory nitric
oxide synthase (NOS2) by cyclic AMP FASEB J 13:2125-2137.
Gao B, Vavricka SR, Meier PJ, Stieger B (2015) Differential cellular expression of organic
anion transporting peptides OATP1A2 and OATP2B1 in the human retina and brain:
implications for carrier-mediated transport of neuropeptides and neurosteriods in the
CNS. Pflugers Arch 467(7):1481-1493.
Gao Y, Lu XC, Yang HY, Liu XF, Cao J, Fan L (2012) The molecular mechanism of the
anticancer effect of atorvastatin: DNA microarray and bioinformatic analyses. Int J Mol
Med 30:765-774.
Gay F (2007) Activated microglia in primary MS lesions: defenders or aggressors? Int MS J
MS Forum 14:78-83.
Gehrmann J, Matsumo Y, Kreutzberg G (1995) Microglia: intrinsic immunoeffector cell of
the brain. Brain Res Rev 20:269-287.
Ghosh S, Wu MD, Shaftel SS, Kyrkanides S, LaFerla FM, Olschowka JA, O'Banion MK
(2013) Sustained interleukin-1β overexpression exacerbates tau pathology despite
reduced amyloid burden in an Alzheimer's mouse model. J Neurosci 33:5053-5064.
Ginhoux F, Greter M, Leboeuf M, Nandi S, See P, Gokhan S, Mehler MF, Conway SJ, Ng
LG, Stanley ER, Samokhvalov IM, Merad M (2010) Fate mapping analysis reveals that
adult microglia derive from primitive macrophages. Science 330:841-845.
Graeber MB (2010) Changing face of microglia. Science 330:783-788.
Gresa-Arribas N, Vieitez C, Dentesano G, Serratosa J, Saura J, Sola C (2012) Modelling
neuroinflammation in vitro: A tool to test the potential neuroprotective effect of anti-
inflammatory agents. Plos One 7:9.
Gruol DL, Vo K, Bray JG (2014) Increased astrocyte expression of IL-6 or CCL2 in
transgenic mice alters levels of hippocampal and cerebellar proteins. Front Cell
Neurosci 8:234.
Gonzalez-Scarano F, Baltuch G (1999) Microglia as mediators of inflammatory and
degenerative diseases. Annu Rev Neurosci 22:219-240.

60
Hamelin BA, Turgeon J (1998) Hydrophilicity/lipophilicity: relevance for the
pharmacology and clinical effects of HMG-CoA reductase inhibitors. Trends
Pharmacol Sci 19:26–37.
Hanisch UK (2002) Microglia as a source and target of cytokines. Glia 40:140-155.
He GL, Liu Y, Li M, Chen CH, Gao P, Yu ZP, Yang XS (2014) The amelioration of
phagocytic ability in microglial cells by curcumin through the inhibition of EMF-
induced pro-inflammatory responses. J Neuroinflamm 11:49.
He Q, Li YH, Guo SS, Wang Y, Lin W, Zhang Q, Wang J, Ma CG, Xiao BG (2016)
Inhibition of Rho-kinase by Fasudil protects dopamine neurons and attenuates
inflammatory response in an intranasal lipopolysaccharide-mediated Parkinson's model.
Eur J Neurosci 43:41–52.
Hesselgesser J, Ng HP, Liang M, Zheng W, May K, Bauman JG, Monahan S, Islam I, Wei
GP, Ghannam A, Taub DD, Rosser M, Snider RM, Morrissey MM, Perez HD, Horuk R
(1998) Identification and characterization of small molecule functional antagonists of
the CCR1 chemokine receptor. J Biol Chem 273:15687-15692.
Hickman SE, El Khoury J (2014) TREM2 and the neuroimmunology of Alzheimer's
disease. Biochem Pharmacol 88:495-498.
Ho RH, Tirona RG, Leake BF, Glaeser H, Lee W, Lemke CJ, Wang Y, Kim RB (2006)
Drug and bile acid transporters in rosuvastatin hepatic uptake: function, expression, and
pharmacogenetics. Gastroenterology 130(6):1793-806.
Hussain M, Javeed A, Ashraf M, Zhao Y, Mukhtar MM, Rehman MU (2012) Aspirin and
immune system. Int. Immunopharmacol 12:10-20.
Jarvis GE, Bihan, Hamaia S, Pugh N, Ghevaert JG, Pearce C, Hughes CE, Watson SP,
Ware J, Rudd E, Farndale RW (2011) A role for adhesion and degranulation-promoting
adapter protein in collagen-induced platelet activation mediated via integrin α2β1. J
Thrombosis Haemostasis 10:268-277.
Jaturapatporn D, Isaac MG, McCleery J. & Tabet N (2012) Aspirin, steroidal and non-
steroidal anti-inflammatory drugs for the treatment of Alzheimer's disease. Cochrane
Database Syst Rev 2, CD006378.
Jick H, Zornberg GL, Jick SS, Seshadri S, Drachman DA (2000) Statins and the risk of
dementia. Lancet 356(9242):1627-1631.
61
Jones P, Kafonek S, Laurora I, Hunninghake D (1998) Comparative dose efficacy study of
atorvastatin versus simvastatin, pravastatin, lovastatin, and fluvastatin in patients with
hypercholesterolemia (the CURVES study). Am J Cardiol. 81:582-587.
Jung HW, Yoon CH, Park KM, Han HS, Park YK (2009) Hexane fraction of Zingiberis
Rhizoma Crudus extract inhibits the production of nitric oxide and proinflammatory
cytokines in LPS-stimulated BV2 microglial cells via the NF-kappaB pathway. Food
Chem Toxicol 47:1190-1197.
Kata D, Földesi I, Feher LZ, Hackler LJr, Puskas LG, Gulya K (2016) Rosuvastatin
enhances anti-inflammatory and inhibits pro-inflammatory functions in cultured
microglial cells. Neuroscience 314:47-63.
Kettenmann H, Hanisch UK, Noda M, Verkhratsky A (2011) Physiology of microglia.
Physiol Rev 91:461-553.
Kitamura S, Maeda K, Wang Y, Sugiyama Y (2008) Involvement of multiple transporters
in the hepatobiliary transport of rosuvastatin. Drug Metab Dispos 36:2014-2023.
Korneev KV, Atretkhany KN, Drutskaya MS, Grivennikov SI, Kuprash DV, Nedospasov
SA (2017) TLR-signaling and proinflammatory cytokines as drivers of tumorigenesis.
Cytokine 89:127-135.
Kreutzberg GW (1996) Microglia: a sensor for pathological events in the CNS. Trends
Neurosci 19:312-318.
Kroner A, Greenhalgh AD, Zarruk JG, Passos Dos Santos R, Gaestel M, David S (2014)
TNF and increased intracellular iron alter macrophage polarization to a detrimental M1
phenotype in the injured spinal cord. Neuron 83:1098-1116.
Kurata T, Miyazaki K, Kozuki M, Morimoto N, Ohta Y, Ikeda Y, Abe K (2012)
Atorvastatin and pitavastatin reduce senile plaques and inflammatory responses in a
mouse model of Alzheimer's disease. Neurol Res 34:601-610.
Lee JK, Schuchman EH, Jin HK, Bae JS (2012) Soluble CCL5 derived from bone marrow-
derived mesenchymal stem cells and activated by amyloid β ameliorates Alzheimer's
disease in mice by recruiting bone marrow-induced microglia immune responses. Stem
Cells 30:1544-1555.

62
Li H, Yoon JH, Won HJ, Ji HS, Yuk HJ, Park KH, Park HY, Jeong TS (2017) Isotrifoliol
inhibits pro-inflammatory mediators by suppression of TLR/NF-κB and TLR/MAPK
signaling in LPS-induced RAW264.7 cells. Int Immunopharmacol 45:110-119.
Lim ST, Mocchetti I (2015) Pharmacological induction of CCL5 in vivo prevents gp120-
mediated neuronal injury. Neuropharmacology 92:98-107.
Lindberg C, Crisby M, Winblad B, Schultzberg M (2005) Effects of statins on microglia. J
Neurosci Res 82:10-19.
Liu H, Yu N, Lu S, Ito S, Zhang X, Prasad B, He E, Lu X, Li Y, Wang F, Xu H, An G,
Unadkat JD, Kusuhara H, Sugiyama Y, Sahi J (2015) Solute Carrier Family of the
Organic Anion-Transporting Polypeptides 1A2- Madin-Darby Canine Kidney II: A
Promising In Vitro System to Understand the Role of Organic Anion-Transporting
Polypeptide 1A2 in Blood-Brain Barrier Drug Penetration. Drug Metab Dispos
43(7):1008-1018.
Loane DJ, Byrnes KR (2010) Role of microglia in neurotrauma. Neurother J Am Soc Exp
Neurother 7:366–377.
Long-Smith CM, Sullivan AM, Nolan YM (2009) The influence of microglia on the
pathogenesis of Parkinson’s disease. Progr Neurobiol 89:277-287.
Lowry OH, Rosebrough NJ, Farr AL, Randall RJ (1951) Protein measurement with the
Folin phenol reagent. J Biol Chem 193:265-275.
Lue LF, Schmitz C, Walker DG (2014) What happens to microglial TREM2 in Alzheimer's
disease: Immunoregulatory turned into immunopathogenic? Neuroscience 302:138-50.
Lund S, Christensen KV, Hedtjärn M, Mortensen AL, Hagberg H, Falsig J, Hasseldam H,
Schrattenholz A, Pörzgen P, Leis M (2006) The dynamics of the LPS triggered
inflammatory response of murine microglia under different culture and in vivo
conditions. J Neuroimmunol 180:71-87.
Marchini C, Angeletti M, Eleuteri AM, Fedeli A, Fioretti E (2005) Aspirin modulates LPS-
induced nitric oxide release in rat glial cells. Neurosci Lett 381(1-2):86-91.
Martinez FO, Gordon S (2014) The M1 and M2 paradigm of macrophage activation: time
for reassessment. F1000 Prime Rep. 6:13.

63
McGeer PL, Kawamata T, Walker DG, Akiyama H, Tooyama I, McGeer EG (1993)
Microglia in degenerative neurological disease. Glia 7:84-92.
McGeer PL, McGeer EG (1995) The inflammatory response system of brain: implications
for therapy of Alzheimer and other neurodegenerative diseases. Brain Res Brain Res
Rev. 21(2):195-218.
McGeer PL, Schulzer M, McGeer EG (1996) Arthritis and anti-inflammatory agents as
possible protective factors for Alzheimer's disease: a review of 17 epidemiologic
studies. Neurology 47:425-432.
McGeer EG, McGeer PL (2003) Inflammatory processes in Alzheimer’s disease. Progr
Neuropsychopharm Biol Psychiatry 27:741-749.
McGeer PL, McGeer EG (2004) Inflammation and neurodegeneration in Parkinson's
disease. Parkinsonism Relat Disord 10, Suppl 1, S3-7.
McGeer EG, McGeer PL (2003) Inflammatory processes in Alzheimer’s disease. Progr
Neuropsychopharm Biol Psychiatry 27:741-749.
McGeer EG, McGeer PL (2010) Neuroinflammation in Alzheimer's disease and mild
cognitive impairment: a field in its infancy. J Alzheimers Dis 19:355-361.
McTaggart F, Buckett L, Davidson R, Holdgate G, McCormick A, Schneck D, Smith G,
Warwick M (2001) Preclinical and clinical pharmacology of Rosuvastatin, a new 3-
hydroxy-3-methylglutaryl coenzyme A reductase inhibitor. Am J Cardiol 87(5A):28B-
32B.
Minagar A. Shapshak P, Fujimura R, Ownby R, Heyes M, Eisdorfer C (2002) The role of
macrophage/microglia and astrocytes in the pathogenesis of three neurologic
disorders: HIV-associated dementia, Alzheimer disease, and multiple sclerosis. J
Neurol Sci 202:13-23.
Moehle MS, West AB (2015) M1 and M2 immune activation in Parkinson's Disease: Foe
and ally? Neuroscience 302:59-73.
Muzio L, Martino G, Furlan R (2007) Multifaceted aspects of inflammation in multiple
sclerosis: the role of microglia. J Neuroimmunol 191:39-44.

64
Nakamichi K, Saiki M, Kitani H, Kuboyama Y, Morimoto K, Takayama-Ito M, Kurane I
(2006) Suppressive effect of simvastatin on interferon-beta-induced expression of CC
chemokine ligand 5 in microglia. Neurosci Lett 407:205-210.
Nakamura Y (2002) Regulating factors for microglial activation. Biol Pharm Bull 25:945-
953.
Napoli I, Neumann H (2010) Protective effects of microglia in multiple sclerosis. Exp
Neurol 225:24-28.
Neher JJ, Neniskyte U, Zhao JW, Bal-Price A, Tolkovsky AM, Brown GC (2011)
Inhibition of microglial phagocytosis is sufficient to prevent inflammatory neuronal
death. J Immunol 186:4973-4983.
Ohsawa K, Imai Y, Sasaki Y, Kohsaka S (2004) Microglia/macrophage-specific protein
Iba1 binds to fimbrin and enhances its actin-bundling activity. J Neurochem 88:844–
856.
Omari KM, Lutz SE, Santambrogio L, Lira SA, Raine CS (2009) Neuroprotection and
remyelination after autoimmune demyelination in mice that inducibly overexpress
CXCL1. Am J Pathol 174:164-176.
Orihuela R, McPherson CA, Harry GJ (2016) Microglial M1/M2 polarization and metabolic
states. Br J Pharmacol 173:649-665.
Orr CF, Rowe DB, Halliday GM (2002) An inflammatory review of Parkinson's disease.
Prog Neurobiol 68:325-340.
Pettit LK, Varsanyi C, Tadros J, Vassiliou E (2013) Modulating the inflammatory
properties of activated microglia with Docosahexaenoic acid and Aspirin. Lipids Health
Dis 12:16.
Phani, S., Loike, J. D. & Przedborski, S (2012) Neurodegeneration and inflammation in
Parkinson's disease. Parkinsonism Relat Disord 18, Suppl 1, S207-209.
Phillis JW, Horrocks LA, Farooqui AA (2006) Cyclooxygenases, lipoxygenases, and
epoxygenases in CNS: their role and involvement in neurological disorders. Brain Res
Rev 52(2):201-243.
Prinz M, Priller J (2014) Microglia and brain macrophages in the molecular age: from
origin to neuropsychiatric disease. Nat Rev Neurosci 15(5):300-312.

65
Prokop S, Miller KR, Heppner FL (2013) Microglia actions in Alzheimer’s disease. Acta
Neuropathol 126:461–477.
Ransohoff RM (2016) A polarizing question: do M1 and M2 microglia exist? Nat Neurosci
19:987-991.
Rodriguez GA, Tai LM, LaDu MJ, Rebeck GW (2014) Human APOE4 increases microglia
reactivity at Aβ plaques in a mouse model of Aβ deposition. J Neuroinflamm 11:111.
Rottman JB, Slavin AJ, Silva R, Weiner HL, Gerard CG, Hancock WW (2000) Leukocyte
recruitment during onset of experimental allergic encephalomyelitis is CCR1
dependent. Eur J Immunol 30:2372-2377.
Sasaki Y, Ohsawa K, Kanazawa H, Kohsaka S, Imai Y (2001) Iba1 Is an actin-cross-linking
protein in macrophages/microglia. Biochem Biophys Res Commun 286:292-297.
Schachter M (2005) Chemical, pharmacokinetic and pharmacodynamic properties of
statins: an update. Fundam Clin Pharmacol 19:117-125.
Sharma JN, Yusof AP (1998) Pro-inflammatory properties of the kallikrein-kinin system:
potential for new drug therapy. Inflammopharmacology 6:289-296.
Shimoyama M, De Pons J, Hayman GT, Laulederkind SJ, Liu W, Nigam R, Petri V,
Smith JR, Tutaj M, Wang SJ, Worthey E, Dwinell M, Jacob H (2015) The Rat
Genome Database 2015: genomic, phenotypic and environmental variations and
disease. Nucleic Acids Res 43 Database Issue, D743-D750.
Schönbeck U, Libby P (2004) Inflammation, immunity, and HMG-CoA reductase
Inhibitors: statins as antiinflammatory agents. Circulation 109 (S1) II18-26.
Schrijvers EM, Verhaaren BF, Koudstaal PJ, Hofman A, Ikram MA, Breteler MM (2012)
Is dementia incidence declining?: Trends in dementia incidence since 1990 in the
Rotterdam Study. Neurology 78:1456-1463.
Schrör K, Rauch BH (2015) Aspirin and lipid mediators in the cardiovascular system.
Prostaglandins Other Lipid Mediat 17-23.
Schwab JM, Nguyen TD, Postler E, Meyermann R, Schluesener HJ (2000) Selective
accumulation of cyclooxygenase-1-expressing microglial cells/macrophages in lesions
of human focal cerebral ischemia. Acta Neuropathol 99(6):609-614.

66
Simon MS, Rosenberg CA, Rodabough RJ, Greenland P, Ockene I, Roy HK, Lane DS,
Cauley JA, Khandekar J (2012) Prospective analysis of association between use of
statins or other lipid-lowering agents and colorectal cancer risk. Ann Epidemiol 22:17-
27.
Skuljec J, Sun H, Pul R, Bénardais K, Ragancokova D, Moharregh-Khiabani D, Kotsiari A,
Trebst C, Stangel M (2011) CCL5 induces a pro-inflammatory profile in microglia in
vitro. Cell Immunol 270:164-171.
Stewart WF, Kawas C, Corrada M, Metter EJ (1997) Risk of Alzheimer's disease and
duration of NSAID use. Neurology 48:626-632.
Stuart LM, Takahashi K, Shi L, Savill J, Ezekowitz RA (2005) Mannose-binding lectin-
deficient mice display defective apoptotic cell clearance but no autoimmune phenotype.
J Immunol174: 3220–3226. Erratum in: J Immunol 175:3447.
Sung S, Yang H, Uryu K, Lee EB, Zhao L, Shineman D, Trojanowski JQ, Lee VM, Praticò
D (2004) Modulation of nuclear factor-kappa B activity by indomethacin influences A
beta levels but not A beta precursor protein metabolism in a model of Alzheimer's
disease. Am J Pathol 165(6):2197-206.
Stieger B, Gao B (2015) Drug transporters in the central nervous system. Clin
Pharmacokinet 54(3):225-242.
Stoll G, Jander S (1999) The role of microglia and macrophages in the pathophysiology
of the CNS. Prog Neurobiol 58(3):233-247.
Streit WJ (2002) Microglia as neuroprotective immunocompetent cells of the CNS. Glia
40:133-139.
Sun KY, Xu DH, Xie C, Plummer S, Tang J, Yang XF, Ji XH (2017) Lactobacillus
paracasei modulates LPS-induced inflammatory cytokine release by monocyte-
macrophages via the up-regulation of negative regulators of NF-kappaB signaling in
a TLR2-dependent manner. Cytokine 92:1-11.
Szabo M, Gulya K (2013) Development of the microglial phenotype in culture.
Neuroscience 241:280-295.
Szabo M, Dulka K, Gulya K (2016) Calmodulin inhibition regulates morphological and
functional changes related to the actin cytoskeleton in pure microglial cells. Brain
Res Bull 120:41-57.

67
Takai Y, Sasaki T, Matozaki T (2001) Small GTP-binding proteins. Physiol Rev 81(1):153-
208.
Taylor F, Huffman MD, Macedo AF, Moore TH, Burke M, Davey Smith G, Ward K,
Ebrahim S (2013) Statins for the primary prevention of cardiovascular disease.
Cochrane Database Syst Rev 2013 1:CD004816.
Ueno A, Oh-ishi S (2003) Roles for the kallikrein-kinin system in inflammatory
exudation and pain: lessons from studies on kininogen-deficient rats. J Pharmacol
Sci. 93:1-20.
van der Most PJ, Dolga AM, Nijholt IM, Luiten PGM, Eisel UL (2009) Statins:
mechanisms of neuroprotection. Progr Neurobiol 88:64-75.
Vane JR, Botting RM (2003) The mechanism of action of aspirin. Thromb Res 110:255-
258.
Veillard NR, Braunersreuther V, Arnaud C, Burger F, Pelli G, Steffens S, Mach F (2006)
Simvastatin modulates chemokine and chemokine receptor expression by
geranylgeranyl isoprenoid pathway in human endothelial cells and macrophages.
Atherosclerosis 188:51-58.
Watanabe K, Jose PJ, Rankin SM (2002) Eotaxin-2 generation is differentially regulated by
lipopolysaccharide and IL-4 in monocytes and macrophages. J Immunol 168:1911-
1918.
Weber C, Erl W, Weber KS, Weber PC (1997) HMG-CoA reductase inhibitors decrease
CD11b expression and CD11b-dependent adhesion of monocytes to endothelium and
reduce increased adhesiveness of monocytes isolated from patients with
hypercholesterolemia. J Am Coll Cardiol 30:1212-1217.
Wierzbicki AS, Poston R, Ferro A (2003) The lipid and non-lipid effects of statins.
Pharmacol Therap 99:95-112.
Wolozin B, Kellman W, Ruosseau P, Celesia GG, Siegel G (2000) Decreased prevalence
of Alzheimer disease associated with 3-hydroxy-3-methyglutaryl coenzyme A
reductase inhibitors. Arch Neurol 57(10):1439-43.
Worthley DL, Bardy PG, Mullighan CG (2005) Mannose-binding lectin: biology and
clinical implications. Intern Med J 35:548-555.

68
Yang YC, Huang WF, Chuan LM, Xiao DW, Zeng YL, Zhou DA, Xu GQ, Liu W, Huang
B, Hu Q (2008) In vitro and in vivo study of cell growth inhibition of simvastatin on
chronic myelogenous leukemia cells. Chemotherapy 54:438-446.
Yang JM, Rui BB, Chen C, Chen H, Xu TJ, Xu WP, Wei W (2014) Acetylsalicylic acid
enhances the anti-inflammatory effect of fluoxetine through inhibition of NF-κB,
p38-MAPK and ERK1/2 activation in lipopolysaccharide-induced BV-2 microglia
cells. Neuroscience 275:296-304.
Zelcer N, Khanlou N, Clare R, Jiang Q, Reed-Geaghan EG, Landreth GE, Vinters HV,
Tontonoz P (2007) Attenuation of neuroinflammation and Alzheimer's disease
pathology by liver x receptors. Proc Natl Acad Sci USA 104:10601-10606.
Zipp F, Waiczies S, Aktas O, Neuhaus O, Hemmer B, Schraven B, Nitsch R, Hartung HP
(2007) Impact of HMG-CoA reductase inhibition on brain pathology. Trends
Pharmacol Sci 28:342-349.

69
9. APPENDIX

ARTICLE I.

Neuroscience 314 (2016) 47–63
ROSUVASTATIN ENHANCES ANTI-INFLAMMATORY AND INHIBITSPRO-INFLAMMATORY FUNCTIONS IN CULTURED MICROGLIAL CELLS
D. KATA, a I. FOLDESI, b L. Z. FEHER, c L. HACKLER, Jr. c
L. G. PUSKAS c AND K. GULYA a*
aDepartment of Cell Biology and Molecular Medicine, University
of Szeged, Szeged, Hungary
bDepartment of Laboratory Medicine, University of Szeged,
Szeged, Hungary
cAvidin Ltd., Szeged, Hungary
Abstract—Microglial activation results in profound morpho-
logical, functional and gene expression changes that affect
the pro- and anti-inflammatory mechanisms of these cells.
Although statins have beneficial effects on inflammation,
they have not been thoroughly investigated for their ability
to affect microglial functions. Therefore the effects of
rosuvastatin, one of the most commonly prescribed drugs
in cardiovascular therapy, either aloneor in combinationwith
bacterial lipopolysaccharide (LPS), were profiled in pure
microglial cultures derived from the forebrains of 18-day-
old rat embryos. To reveal the effects of rosuvastatin on a
number of pro- and anti-inflammatory mechanisms, we per-
formed morphometric, functional and gene expression stud-
ies relating to cell adhesion and proliferation, phagocytosis,
pro- and anti-inflammatory cytokine (IL-1b, tumor necrosis
factor a (TNF-a) and IL-10, respectively) production, and the
expression of various inflammation-related genes, including
those related to the abovemorphological parameters and cel-
lular functions. We found that microglia could be an impor-
tant therapeutic target of rosuvastatin. In unchallenged
(control) microglia, rosuvastatin inhibited proliferation and
cell adhesion, but promoted microspike formation and ele-
vated the expression of certain anti-inflammatory genes
(Cxcl1, Ccl5, Mbl2), while phagocytosis or pro- and anti-
inflammatory cytokine production were unaffected. More-
over, rosuvastatin markedly inhibited microglial activation
in LPS-challenged cells by affecting both their morphology
and functions as it inhibited LPS-elicited phagocytosis and
inhibited pro-inflammatory cytokine (IL-1b, TNF-a) produc-
tion, concomitantly increasing the level of IL-10, an anti-
http://dx.doi.org/10.1016/j.neuroscience.2015.11.0530306-4522/� 2015 The Authors. Published by Elsevier Ltd. on behalf of IBRO.This is an open access article under the CC BY-NC-ND license (http://creativecomm
*Corresponding author. Address: Department of Cell Biology andMolecular Medicine, University of Szeged, 4 Somogyi u., SzegedH-6720, Hungary. Tel: +36-(62)-544-570; fax: +36-(62)-544-569.
E-mail address: [email protected] (K. Gulya).Abbreviations: AD, Alzheimer’s disease; Cd, cluster of differentiation;CNS, central nervous system; DIV, days in vitro; DMEM, Dulbecco’sModified Eagle’s Medium; E18, embryonic day 18; EAE, experimentalautoimmune encephalomyelitis; ELISA, enzyme-linked immunosorbentassay; FBS, fetal bovine serum; GAPDH, glyceraldehyde 3-phosphatedehydrogenase (EC 1.2.1.12); Iba1, ionized calcium-binding adaptormolecule 1; IL, interleukin; LPS, bacterial lipopolysaccharide; MS,multiple sclerosis; PBS, phosphate-buffered saline; RT, roomtemperature; S.D., standard deviation; subDIV, subcloned daysin vitro; TBS, Tris-buffered saline; TI, transformation index; TNF-a,tumor necrosis factor a.
47
inflammatory cytokine. Finally, rosuvastatin beneficially
and differentially affected the expression of a number of
inflammation-related genes in LPS-challenged cells by
inhibiting numerous pro-inflammatory and stimulating sev-
eral anti-inflammatory genes. Since the microglia could elicit
pro-inflammatory responses leading toneurodegeneration, it
is important to attenuatesuchmechanismsandpromoteanti-
inflammatoryproperties, anddevelopprophylactic therapies.
By beneficially regulating both pro- and anti-inflammatory
microglial functions, rosuvastatin may be considered as a
prophylactic agent in the prevention of inflammation-related
neurological disorders. � 2015 The Authors. Published by
Elsevier Ltd. on behalf of IBRO. This is an open access article
under theCCBY-NC-ND license (http://creativecommons.org/
licenses/by-nc-nd/4.0/).
Key words: anti-inflammation, gene expression, lipopolysac-
charide, phagocytosis, pro-inflammation, rosuvastatin.
INTRODUCTION
Microglia, the main immune cells in the central nervous
system (CNS), are derived from the monocyte/macrophage
lineage (Ginhoux et al., 2010). They play important roles
in both physiological and pathophysiological conditions
such as traumatic injury, stroke, ischemia or neurodegen-
erative diseases (Kreutzberg, 1996). In response to activa-
tion, the microglia transform from a resting state to an
activated form, during which profound morphological and
functional changes take place, such as process retraction,
proliferation, phagocytosis and cytokine expression
(Gehrmann et al., 1995; Kreutzberg, 1996; Hanisch, 2002;
Luo and Chen, 2012). Although such anti-inflammatory
mechanisms are essential in protecting the CNS, activated
microglial cells can also be harmful to neurons by eliciting
neuroinflammation that could lead to neurodegeneration
(Banati et al., 1993; Gehrmann et al., 1995; Gonzalez-
Scarano and Baltuch, 1999; Streit, 2002; Graeber, 2010;
Gresa-Arribaset al., 2012;Ghoshet al., 2013). InAlzheimer’s
disease (AD), for example, the microglia produce pro-
inflammatory factors such as interleukin-1b (IL-1b) aroundthe amyloid plaques, and these factors may themselves
become important components of theADpathology because
of their ability to increase the expression of amyloid precursor
protein (Cordle and Landreth, 2005; Ghosh et al., 2013).
Accumulating evidence indicates that a sequence of
events contributes to the development and progression
of AD, including oxidative stress, inflammation, and
altered cholesterol metabolism (Gamba et al., 2015).
Oxidative stress may be crucial in the development of
ons.org/licenses/by-nc-nd/4.0/).

48 D. Kata et al. / Neuroscience 314 (2016) 47–63
neuroinflammation as oxidized cholesterol could act as a
link connecting peripheral hypercholesterolemia to altered
cholesterol metabolism in the brain (Gamba et al., 2015).
Cholesterol modulates the processing of amyloid precur-
sor protein and the production of b-amyloid peptides
(Shobab et al., 2005), while removing cholesterol amelio-
rates the production these peptides in animal models
(Bodovitz and Klein, 1996; Simons et al., 1998).
Statins (3-hydroxy-3-methylglutaryl coenzyme A
reductase inhibitors) are the agents of first choice for
the treatment of high cholesterol levels (Taylor et al.,
2013). Although their main effects are related to the lipid
metabolism (inhibition of cholesterol synthesis, reduction
of the levels of low-density lipoproteins and triglycerides,
and stimulation of the expression of high-density lipopro-
teins), they also strongly modulate inflammatory cells
around atherosclerotic plaques (Wierzbicki et al., 2003;
Burg and Espenshade, 2011). Apart from their therapeu-
tic use in cardiovascular diseases, statins may also have
beneficial effects in the CNS (Zipp et al., 2007; van der
Most et al., 2009; Famer et al., 2010) as animal studies
have demonstrated that statins attenuate neuroinflamma-
tion (Zelcer et al., 2007) and reduce senile plaques and
inflammatory responses (Kurata et al., 2012).
Interestingly, in spite of being an obvious target for
statins, microglial cells have not been at the focus of
statin research. There have only been a few studies to
demonstrate that under in vitro circumstances the
microglia respond to statins such as atorvastatin and
simvastatin (Lindberg et al., 2005; Nakamichi et al.,
2006). In the present study, we investigated the effects
of rosuvastatin, the most widely used and arguably the
most effective statin (Nissen et al., 2006; Nicholls et al.,
2011), on cultured pure microglia cells derived from mixed
cultures of 18-day-old embryonic (E18) rat forebrains
under control (unstimulated) and bacterial lipopolysac-
charide (LPS)-stimulated conditions (Nakamura et al.,
1999; Lund et al., 2006; Gresa-Arribas et al., 2012). To
reveal the effects of rosuvastatin on a number of
pro- and anti-inflammatory mechanisms, we performed
morphometric, functional and gene expression studies
relating to cell adhesion and proliferation, phagocytic
capability, pro- and anti-inflammatory cytokine (IL-1b,tumor necrosis factor a (TNF-a) and IL-10, respectively)
production, and the expression of various inflammation-
related genes, including those related to the above mor-
phological parameters and cellular functions.
EXPERIMENTAL PROCEDURES
Animals
All animal experiments were carried out in strict
compliance with the European Council Directive
(86/609/EEC) and EC regulations (O.J. of EC No. L
358/1, 18/12/1986) regarding the care and use of
laboratory animals for experimental procedures, and
followed the relevant Hungarian and local legislation
requirements. The experimental protocols were
approved by the Institutional Animal Welfare Committee
of the University of Szeged (I-74-II/2009/MAB). The
pregnant Sprague–Dawley rats (45 rats, 170–190 g)
were kept under standard housing conditions and fed
ad libitum.
Antibodies
For a thorough characterization of different microglial
phenotypes developed in vitro, an antibody against
ionized calcium-binding adaptor molecule 1 (Iba1), an
intracellular actin- and Ca2+-binding protein expressed
in the CNS specifically in macrophages and microglia
(Ahmed et al., 2007), was used in our immunocytochem-
ical and Western blot analyses. The anti-glyceraldehyde
3-phosphate dehydrogenase (GAPDH) antibody was
used as an internal control in Western blot experiments
(Wu et al., 2012). Dilutions of primary and secondary anti-
bodies, and also incubation times and blocking conditions
for each antibody used were carefully tested for both
immunocytochemistry and Western blot analysis. To
detect the specificities of the secondary antisera, omis-
sion control experiments (staining without the primary
antibody) were performed. In such cases, no fluorescent
or Western blot signals were detected.
Cell cultures
Pure microglial cells were isolated from mixed primary
cortical cell cultures of rat embryos of either sex by the
method we described earlier (Szabo and Gulya, 2013).
Sibling embryos obtained from the same pregnancy were
processed for culturing together; each pregnancy was
considered as an independent experiment. Briefly,
10–12 fetal rats (E18) under anesthesia were decapitated
and the frontal lobe of the cerebral cortex was removed,
minced with scissors, incubated in 9 ml Dulbecco’s Modi-
fied Eagle’s Medium (DMEM; Invitrogen, Carlsbad, USA)
containing 1 g/l D-glucose, 110 mg/l Na-pyruvate, 4 mM
L-glutamine, 3.7 g/l NaHCO3, 10,000 U/ml penicillin G,
10 mg/ml streptomycin sulfate, 25 lg/ml amphotericin B
and 0.25% trypsin for 10 min at 37 �C, and then cen-
trifuged at 1000g for 10 min at room temperature (RT).
The pellet was resuspended and washed twice in 5 ml
DMEM containing 10% heat-inactivated fetal bovine
serum (FBS; Invitrogen) and centrifuged for 10 min at
1000g at RT. The final pellet was resuspended in 2 ml
DMEM/10% FBS, after which the cells were plated in
the same medium on a poly-L-lysine-coated culture flask
(75 cm2, 12 � 106 cell/flask) and cultured at 37 �C in a
humidified air atmosphere supplemented with 5% CO2,
in one or other of the following ways: (1) in poly-L-lysine-
coated coverslips (15 � 15 mm; 2 � 105 cells/coverslip)
for immunocytochemistry; (2) in poly-L-lysine-coated Petri
dishes (60 mm � 15 mm; 4 � 105 cells/dish) for Western
blot analyses and enzyme-linked immunosorbent assay
(ELISA) studies; or (3) in a poly-L-lysine-coated culture
flask (75 cm2, 12 � 106 cells/flask) for the subsequent
generation of pure microglial cell cultures.
Secondary microglial cells were subcloned from
mixed primary cultures (DIV7) maintained in a poly-L-
lysine-coated culture flask (75 cm2, 12 � 106 cells/flask)
by shaking the cultures at 100 rpm in a platform shaker
for 30 min at 37 �C. Cultures from the same pregnancy
were kept separate. Microglia from the supernatant

D. Kata et al. / Neuroscience 314 (2016) 47–63 49
were collected by centrifugation at 3000g for 8 min at
RT and resuspended in 2 ml DMEM/10% FBS. The cells
were seeded at a density of 4 � 105 cells/Petri dish for
Western blots or 2 � 105 cells/coverslip/Petri dish for
immunocytochemistry, proliferation or phagocytosis
assays, and cultured in DMEM in a humidified
atmosphere supplemented with 5% CO2 at 37 �C. The
medium was changed on the first day after seeding
(subDIV1). Immunocytochemistry routinely performed on
the pure microglial cultures four days after seeding
(subDIV4) consistently detected a >99% incidence of
the Iba1-immunopositive microglial cells for the Hoechst
33258 dye-labeled cell nuclei.
Cell culture treatments
On the fourth day of subcloning (subDIV4), DMEM was
replaced and the expanded pure microglial cells were
treated for 24 h with either LPS (20 ng/ml final conc.,
dissolved in DMEM; Sigma, St. Louis, MO, USA) or
rosuvastatin (1 lM final conc., dissolved in sterile,
distilled water; Santa Cruz Biotechnology, Inc., Dallas,
TX, USA) alone, or with a combination of LPS
+ rosuvastatin, and the effects were compared in a
variety of morphological and functional tests. LPS
treatment served as an immunochallenge. Four types of
treatment regimens were used: (1) control
(unchallenged and untreated) cultures; (2) LPS-
challenged cultures received 20 ng/ml LPS; (3)
rosuvastatin-treated cultures were stimulated with 1 lMrosuvastatin; (4) LPS-challenged + rosuvastatin-treated
cultures received both drugs in the indicated doses.
Depending on the experiments, the treatments lasted for
6, 24 or 72 h at 37 �C.
Cell adhesion and proliferation
To measure changes in cell adhesion and proliferation
and cell viability, the ACEA Real-Time Cell Analysis
(RTCA) system and 16-well E-Plates (Acea
Biosciences, Inc., San Diego, CA, USA) were used.
This system measured the electrical impedance of the
cells expressed as cell index in real time. Briefly,
4 � 105 pure microglial cells in poly-L-lysine-coated Petri
dishes were plated as described above. On the fourth
day of culturing, the cells were trypsinized, centrifuged
as above and seeded into gelatin-coated 16-well
E-Plates at a density of 6000 cells per well. Test doses
of LPS and rosuvastatin, either alone or in combination,
were added to the wells before plating. After
equilibration at RT for 10 min, the E-plate was loaded
into the RTCA machine and the cell index was
measured continuously for 60 h using the cell
microelectronic sensing technique with the xCELLigence
real-time cell analysis system (RTCA DP; Acea
Biosciences) as we published earlier (Ozsvari et al.,
2010). Cell indices at 24 h were analyzed for comparison
with cell proliferation data. Data analysis was carried out
with the system’s dedicated software (RTCA Software
1.2; Acea Biosciences) and Excel (Microsoft Corp., Red-
mond, WA, USA). To estimate the number of surviving/
proliferating microglial cells after treatments, the cultures
were washed twice with 2 ml phosphate-buffered saline
(PBS) to remove cell debris, treated with 0.25% trypsin
solution for 10 min at 37 �C, collected and counted in a
Burker cell counting chamber. The number of viable cells
was presented as mean ± S.D.
Immunocytochemistry
Pure microglial cultures treated with different treatment
regimens were fixed on coverslips with 4%
formaldehyde for 5 min and rinsed with 0.05 M PBS for
2 � 5 min. After permeabilization and blocking of the
nonspecific sites in 0.05 M PBS solution containing 5%
normal goat serum (Sigma), 1% heat-inactivated bovine
serum albumin (Sigma) and 0.05% Triton X-100 for
30 min at 37 �C, the cells on the coverslips were
incubated overnight in a humidified chamber at 4 �Cwith rabbit anti-Iba1 polyclonal antibody (1:500 final
dilution; Wako, Japan), a microglia-specific actin-binding
protein, in the above solution as we described
previously (Szabo and Gulya, 2013). The cultured cells
were washed for 4 � 10 min at RT in 0.05 M PBS, and
then incubated with the Alexa Fluor 568 fluorochrome-
conjugated goat anti-rabbit antibody (1:1000 final dilution;
Invitrogen) in the dark for 3 h at RT. The cells on the cov-
erslip were washed for 4 � 10 min in 0.05 M PBS at RT,
and the nuclei were stained in 0.05 M PBS solution
containing 1 mg/ml polyvinylpyrrolidone and 0.5 ll/ml
Hoechst 33258 dye (Sigma). The coverslips were rinsed
in distilled water for 5 min, air-dried and mounted on
microscope slides in Vectashield mounting medium (Vec-
tor Laboratories, Burlingame, CA, USA). Cells were
viewed on a Nikon Microphot-FXA epifluorescent micro-
scope (Nikon Corp., Tokyo, Japan) and photographed
with a Spot RT Color CCD camera (SPOT RT/ke,
Diagnostic Instruments, Inc., Sterling Heights, MI, USA).
Western blot analysis
Cultured microglial cells (subDIV4) were collected
through use of a rubber policeman, homogenized in
50 mM Tris–HCl (pH 7.5) containing 150 mM NaCl,
0.1% Nonidet P40, 0.1% cholic acid, 2 lg/ml leupeptin,
1 lg/ml pepstatin, 2 mM phenylmethylsulfonyl fluoride
and 2 mM EDTA, and centrifuged at 10,000g for 10 min.
The pellet was discarded and the protein concentration
of the supernatant was determined (Lowry et al., 1951).
For the Western blot analyses, 5–10 lg of protein was
separated on an SDS polyacrylamide gel (4–10% stack-
ing gel/resolving gel), transferred onto Hybond-ECL nitro-
cellulose membrane (Amersham Biosciences, Little
Chalfont, Buckinghamshire, England), blocked for 1 h in
5% nonfat dry milk in Tris-buffered saline (TBS) contain-
ing 0.1% Tween 20, and incubated overnight with either
a rabbit anti-Iba1 polyclonal antibody (1:1000 final dilu-
tion; Wako) or a mouse anti-GAPDH monoclonal antibody
(clone GAPDH-71.1; 1:20,000 final dilution; Sigma). After
five rinses in 0.1% TBS–Tween 20, the membranes were
incubated for 1 h with the peroxidase-conjugated goat
anti-rabbit secondary antibody (1:2000 final dilution; Invit-
rogen) for Iba1 or with the peroxidase-conjugated rabbit
anti-mouse secondary antibody (1:2000 final dilution;

50 D. Kata et al. / Neuroscience 314 (2016) 47–63
Sigma) for GAPDH Western blots, and washed five times
as before. The enhanced chemiluminescence method
(ECL Plus Western blotting detection reagents; Amersham
Biosciences) was used to reveal immunoreactive bands
according to the manufacturer’s protocol.
In vitro phagocytosis
The fluid-phase phagocytotic capabilities of the control
and variously treated pure microglial cell cultures were
determined via the uptake of fluorescent microspheres
(carboxylate-modified polystyrene beads, fluorescent
yellow-green (kex �470 nm; kem �505 nm), aqueous
suspension, 2.0 lm mean particle size; L4530, Sigma)
as we described previously (Szabo and Gulya, 2013).
Unstimulated (control) and LPS-stimulated pure microglial
cell cultures (subDIV4) with or without rosuvastatin were
tested for 24 h. At the end of the treatment period, 1 llof a 2.5% aqueous suspension of fluorescent micro-
spheres per ml was added to the culture, which was then
incubated for 60 min at 37 �C. The cells were next washed
five times with 2 ml of PBS to remove dish- or cell surface-
bound residual fluorescent microspheres, and fixed with
4% formaldehyde in PBS. In another setup, we also deter-
mined the number of microglial cell membrane-associated
but not phagocytosed beads. Such negative controls were
treated as above with the exception that microglial cul-
tures with beads were incubated for 60 min at 4 �C. At thistemperature, the number of beads associated with cell
surface averaged less than 1 bead per 100 Iba1-labeled
cells, thus the phagocytosis was not considered signifi-
cant. For measurement of the phagocytotic activity, cells
labeled with phagocytosed microbeads and processed
for Iba1 immunocytochemistry were counted in 20
random fields in each treatment group (mean ± S.D.)
under a 20� or 40� objective. Statistically significant
differences were determined by a two-way ANOVA.
Determination of IL-1b, IL-10 and TNF-a
For ELISA assays, the supernatants were collected from
each treatment and stored at �20 �C. Concentrations of
IL-1b, IL-10 and TNF-a were measured with rat-specific
ELISA kits (eBioscience, Vienna, Austria). The
sensitivity of IL-1b (Cat# BMS630), IL-10 (Cat#
BMS629) and TNF-a (Cat#BMS622) assays was
4 pg/ml, 1.5 pg/ml and 11 pg/ml, respectively. As stated
by the manufacturer, the overall intra- and interassay
coefficients of variation were <10% in both cases for
IL-1b and TNF-a, and <5% in both cases for IL-10.
RNA isolation
Total RNA from control and treated pure microglial cells
was purified as described previously (Fabian et al.,
2011); columns and wash buffer were from Bioneer (Viral
RNA extraction kit; Daejon, South Korea). Briefly, cells
were washed with PBS, incubated in lysis buffer (RA1;
Macherey-Nagel, Duren, Germany), then collected and
mixed with 70% ethanol in RNase-free water (Bioneer).
The mixture was transferred through columns (Bioneer)
and washed with 350 ll 80% ethanol in diethyl
pyrocarbonate-treated water, and then with 600 ll and300 ll W2 wash buffer (Bioneer). Total RNA was eluted
in 50 ll RNase free-water. One ll RNase inhibitor
(Applied Biosystems, Foster City, CA, USA) was added
to the samples. The quality and quantity of the isolated
RNA were measured with NanoDrop1000 Version 3.8.1.
(Thermo Scientific, Budapest, Hungary).
RNA expression
Reverse transcription from 3 lg of total RNA in 30 ll wasperformed with the High-Capacity cDNA Archive Kit
(Applied Biosystems) according to the manufacturer’s
protocol. cDNA was diluted to 80 ll. The instrumentation
included the Bravo automatic liquid handling system
(Agilent Technologies, Inc., Santa Clara, CA, USA) for
polymerase chain reaction (PCR) assay preparation and
a LightCycler 1536 System (Roche Diagnostics Corp.,
Indianapolis, IN, USA) or a Light Cycler Nano
Instrument (Roche) for cycling (Woudstra et al., 2013).
The expression of 116 inflammation-related genes,
together with that of six control genes (see below), was
measured with Universal Probe Library assays using
intron-spanning gene-specific primers (Rat Immune
Panel; Avidin Ltd., Szeged, Hungary, www.avidin-
biotech.com/services/gene-expression) and the LightCy-
cler 1536 DNA Probe Master kit (Roche). Moreover, the
expression of certain phagocytosis-related genes such
as the integrin-associated protein or cluster of differentia-
tion 47 (Cd47, NM_019195_2), the engulfment or cell
motility protein (Elmo1, NM_001108415.1), the scavenger
receptor class B member 1 (Scarb1, NM_031541_1), the
plasminogen activator inhibitor-1 (Serpine1,NM_012620_1), the signal-regulatory protein a (Sirpa,
NM_013016_2) and the vesicle-associated membrane
protein 7 (Vamp7, NM_053531_1) were also analyzed,
by the Light Cycler Nano Instrument. For the 1536 Sys-
tem, each 2 ll PCR reaction contained 8 ng of cDNA,
0.4 ll Lightcycler DNA Probes Master (5�), the corre-
sponding primer set and UPL probe and the Setup Con-
trol. The PCR cycling protocol was as follows: enzyme
activation at 95 �C for 60 s, 50 cycles of denaturation at
95 �C for 0 s, and annealing and extension at 60 �C for
30 s. For the Nano Instrument, each 20 ll PCR reaction
contained 20 ng cDNA, 10 ll Lightcycler DNA Probes
Master (5�), the corresponding primer set and UPL probe
and the Setup Control. The PCR protocol was as follows:
enzyme activation at 95 �C for 10 min, 50 cycles of denat-
uration at 95 �C for 15 s, and annealing and extension at
60 �C for 30 s. Gene expression was normalized to the
average values of clathrin, heavy chain (Cltc,NM_019299.1), glyceraldehyde-3-phosphate-dehydrogen
ase (Gapdh, M17701.1), glucuronidase, beta (Gusb,
NM_017015.2), hypoxanthine phosphoribosyltransferase
1 (Hprt1, NM_012583.2), phosphoglycerate kinase 1
(Pgk1, NM_053291.3), and tubulin, beta 5 class I (Tubb5,NM_173102.2) expression as endogenous controls and
expressed relative to the unstimulated controls by using
the 2�DDCt method. A total of 122 gene-specific assays
were run on four independent samples from each condi-
tion. Student’s t-test and a two-way ANOVA were applied
for the analysis of significance where p< 0.05 was

D. Kata et al. / Neuroscience 314 (2016) 47–63 51
considered significant. For hierarchical cluster analysis
and visualization, the Hierarchical Clustering Explorer
(v3.0) software was used (publicly available at http://
www.cs.umd.edu/hcil/multi-cluster/hce3.html). The com-
plete linkage clustering method was applied with Eucli-
dean distance metric.
Image analysis and statistics
Digital images were captured by a Nikon Microphot-FXA
epifluorescent microscope (Nikon Corp., Tokyo, Japan),
using a Spot RT Color CCD camera and the Spot RT
software (Spot RT/ke Diagnostic Instruments, Sterling
Heights, MI, USA). For the determination of microglial
cell purity, Hoechst 33258-labeled cell nuclei that
belonged to Iba1-immunopositive cells were counted on
coverslip-cultured samples. For each culture, 50–100
randomly selected microscope fields were analyzed. In
every case, the cultures had, on average, at least 99
Iba1-positive somata for 100 Hoechst 33258-labeled
cell nuclei (>99% purity for microglial cells).
Phagocytosed microspheres on 20 randomly sampled
microscope fields from three coverslips for each
treatment regimen were counted with the use of the
computer program ImageJ (version 1.47; http://rsb.info.
nih.gov/ij). For the measurement of area (lm2),
perimeter (lm) and transformation index (TI), Iba1-
immunoreactive microglial cell images were converted
into binary replicas by using thresholding procedures
implemented by ImageJ and Adobe Photoshop CS5.1
software (Adobe Systems, Inc., San Jose, CA, USA)
as published by Szabo and Gulya (2013). TI was deter-
mined according to Fujita et al. (1996) by using the fol-
lowing formula: [perimeter of cell (lm)]2/4p [cell area
(lm2)]. Color correction and cropping of the light micro-
scopic images were performed when photomicrographs
were made for publication and assembled for a panel.
Gray-scale digital images of the immunoblots were
acquired by scanning the autoradiographic films with a
desktop scanner (Epson Perfection V750 PRO; Seiko
Epson Corp., Japan). The images were scanned and
processed at identical settings to allow comparisons of
the Western blots from different samples. The bands
were analyzed through the use of ImageJ. The
immunoreactive densities of equally loaded lanes were
quantified, and all samples were normalized to the inter-
nal GAPDH load controls.
All statistical comparisons were made by using R
3.1.0 for Windows (The R Foundation for Statistical
Computing; Wirtschafts-Universitat, Wien, Austria).
Results were analyzed with a two-way ANOVA, and the
Bonferroni correction was used to establish significance
between groups. Values were presented as mean ± S.
D.; p< 0.05 was considered significant; *, ** and ***
denote p< 0.05, p< 0.01 and p< 0.001, respectively.
RESULTS
Rosuvastatin affects microglial morphology
The morphological changes elicited by rosuvastatin in
unchallenged (control) and LPS-challenged pure
microglia cultures were documented through the use of
Iba1 immunocytochemistry (Fig. 1A–D) and quantitatively
analyzed on binary silhouettes of individual microglial
cells (Fig. 2A–G). Iba1 protein expression was also
monitored during treatments (Fig. 1E). Most of the
unchallenged and untreated (control) microglia displayed
ameboid morphology with TI < 3; they had a
predominantly ameboid shape, occasionally with small
pseudopodia (Figs. 1A and 2A). When administered
alone for 24 h, rosuvastatin induced the formation of
numerous microspikes (Figs. 1B and 2B); these slender
cytoplasmic projections (filopodia) resulted in significantly
increased perimeter and TI values of these cells (Fig. 2F,
G). Quantitative analysis showed that the average TI in
this group increased about 10-fold, to above 19, as
compared with the controls (Fig. 2G). The LPS challenge
did not result in any significant morphometric change
(Figs. 1C and 2C, E–G). However, rosuvastatin treatment
in LPS-challenged cells resulted in a significantly
enlarged and more ramified cell form (TI > 7) with a
much larger perimeter value as compared with their
respective control values (Figs. 1D and 2D, E–G),
indicating that rosuvastatin profoundly antagonized the
morphological changes characteristic of LPS-induced
microglial activation. In relation to the substantially
increased size of the LPS-challenged and rosuvastatin-
treated microglia (Figs. 1D and 2D, E), their Iba1
immunoreactivity was also significantly increased
(Figs. 1E and 2E).
Rosuvastatin inhibits proliferation and cell adhesionin both unchallenged and LPS-challenged microglia
Rosuvastatin significantly inhibited cell proliferation in
both unchallenged and LPS-challenged cultures, by
47.8% and 68.9%, respectively, after a 24-h treatment
period (Fig. 3A). We used a 16-well E-Plate-based real-
time analysis to determine whether rosuvastatin affects
cell adhesion. Rosuvastatin inhibited cell adhesion in
both unchallenged (control) and LPS-challenged
microglia (Fig. 3B). The differences in levels of inhibition
of cell adhesion between cultures with or without
rosuvastatin (unchallenged and LPS-challenged
microglia vs. rosuvastatin-treated and LPS-challenged
+ rosuvastatin-treated microglia) were significant by
20 h of culturing and thereafter, probably due to the
significantly larger cell populations in the control and
LSP-challenged microglial cultures as compared with
those in the rosuvastatin or LPS + rosuvastatin-treated
cultures (Fig. 3B), and to the ability of rosuvastatin to
stimulate the formation of microspikes (Fig. 2B, D), i.e.
the actin-based filamentous protrusions implicated in the
cell motility, and consequently in the decreased
adhesion of these cells.
Rosuvastatin reduces phagocytotic activity inLPS-challenged cells
The microglial function is inherently related to its
phagocytotic activity. In pure microglial cultures
(subDIV4), the control (unchallenged and untreated)
microglia exhibited a low level of fluid-phase

Fig. 1. Rosuvastatin affects microglial cell morphology and Iba1 immunoreactivity in pure microglial cells after various treatments. Pure microglia
cell cultures (subDIV4) were maintained as described in Experimental procedures. (A–D) Representative fluorescent immunocytochemical pictures
demonstrate the typical cellular distribution of Iba1 immunoreactivity (red) in (A) control (unchallenged and untreated), (B) rosuvastatin-treated, (C)
LPS-challenged and (D) LSP-challenged + rosuvastatin-treated microglial cells. The effects of rosuvastatin in unchallenged and LSP-challenged
microglia were the most marked. Hoechst 33258-labeled cell nuclei are shown in blue. Scale bar in A (for all pictures): 50 lm. (E) Quantitative
Western blot analysis of Iba1 and GAPDH immunoreactivities in pure microglial cell cultures. Protein samples from the cultures were separated by
gel electrophoresis, transferred to nitrocellulose membranes and probed with either the Iba1 or the GAPDH antibody. Gray-scale digital images of
the immunoblots were acquired by scanning the autoradiographic films with a desktop scanner. The images were scanned and processed at
identical settings to allow comparisons between the Western blots from different samples. Error bars indicate integrated optical density values
(mean ± SD) normalized to the internal standard GAPDH. Representative Western blot pictures are shown below the graphs. Data were analyzed
with a two-way analysis of variance (ANOVA). *p< 0.05, **p< 0.01. (For interpretation of the references to colour in this figure legend, the reader is
referred to the web version of this article.)
52 D. Kata et al. / Neuroscience 314 (2016) 47–63

Fig. 2. Quantitative analysis of microglial morphology in pure microglial cell cultures after various treatments. Pure microglial cell cultures (subDIV4)
were maintained as described in the Experimental procedure. (A–D) Iba1-positive microglial cells from pure microglial cultures (subDIV4) were
photographed, the pictures were digitized and the morphological characteristics were quantitatively analyzed on binary silhouettes of unchallenged
(A), rosuvastatin-treated (B), LPS-challenged (C) and LCS-challenged + rosuvastatin-treated (D) microglia. Four representative binary silhouettes
are shown for each culturing protocol. Scale bar for all silhouettes: 50 lm. Area (E) in lm2, perimeter (F) in lm, and TI values (G), calculated as
[perimeter of cell (lm)]2/4p[cell area (lm2)], are indicated for each digitized cell. Unchallenged and untreated (control) cells, similarly to LPS-
challenged cells, displayed a typical ameboid morphology with low TI values. Rosuvastatin affected the morphology of both the control and the LPS-
challenged microglia (B, D). In unchallenged cultures, it promoted microspike formation with a concurrent slight ramification of the cells (B). In the
LPS-challenged + rosuvastatin-treated cultures (D), the microglia became larger and, while retaining microspikes, also developed thicker
processes. Both the rosuvastatin treatment alone and the combined treatment with LPS resulted in larger perimeter (F) and higher TI values (G) as
compared with both the unchallenged and the LPS-challenged cultures. (E) Average area (in lm2 ± S.D.) measurements for cultured pure
microglial cells. (F) Average perimeter (in lm± S.D.) measurements for cultured pure microglial cells. (G) Average TI values (± S.D.) for cultured
pure microglial cells. LPS: 20 ng/ml; rosuvastatin: 1 lM. For (E–G), error bars indicate mean ± SD of six replicate measurements from three
independent culturings. Data were analyzed with a two-way analysis of variance (ANOVA). **p< 0.01; ***p< 0.001.
D. Kata et al. / Neuroscience 314 (2016) 47–63 53
Fig. 3. Rosuvastatin inhibits cell proliferation and decreases cell adhesion. Pure microglial cultures (subDIV4) were maintained and treated as
described in Experimental procedures section. (A) After culturing, the cells were collected and the number of surviving microglia was determined
with a Burker chamber. Rosuvastatin, in both unchallenged and LPS-challenged cultures, inhibited cell proliferation and displayed a strong anti-
mitotic characteristic. LPS treatment did not affect cell proliferation. (B) Real-time monitoring of microglial cell adhesion after different treatment
regimens. The ACEA Real-Time Cell Analysis (RTCA) system and 16-well E-Plates were used to determine cell indices as described in
Experimental procedures section. Normalized cell index values are plotted as a function of time. In both unchallenged and LPS-challenged cells,
rosuvastatin decreased cell adhesion (blue and red lines, respectively). Error bars indicate mean ± SD of six replicate measurements from three
independent culturings. Data were analyzed with a two-way analysis of variance (ANOVA). **p< 0.01; ***p= 0.001. (For interpretation of the
references to colour in this figure legend, the reader is referred to the web version of this article.)
54 D. Kata et al. / Neuroscience 314 (2016) 47–63
phagocytosis (Fig. 4A, E), engulfing only 2.62 ± 1.7
beads per cell (n= 91). Rosuvastatin did not affect the
phagocytosis appreciably (Fig. 4B, E), the number of
phagocytosed microbeads remaining low (2.70 ± 1.7;
n= 50). As expected, the LPS challenge increased the
phagocytotic activity of the microglial cells significantly
(Fig. 4C, E). On average, the LPS-challenged cells
accumulated 25.39 ± 11.4 beads per cell (n= 70), and
some of the cells engulfed as many as 40 microbeads.
In the LPS-challenged microglia, however, rosuvastatin
inhibited the phagocytosis drastically, by nearly 80%
(Fig. 4D, E) as the fluid-phase phagocytotic activity was
returned close to the level of the control cells (4.67
± 3.9 microbeads per cell; n= 88). As activated
microglial cells often damage neuronal tissue, such a
strong inhibition of a pro-inflammatory action by
rosuvastatin could be beneficial in preventing or
ameliorating neurodegeneration.
Rosuvastatin concomitantly decreasespro-inflammatory and increases anti-inflammatorycytokine levels
Activated microglia are known to express several pro- and
anti-inflammatory cytokines, while statins are able to
reduce the inflammatory effect in the vicinity of
atherosclerotic plaques. We therefore expected
rosuvastatin to regulate the amount of cytokines
released by the microglia. Indeed, when the basal levels
of the pro-inflammatory cytokines IL-1b and TNF-a and
the anti-inflammatory cytokine IL-10 in unchallenged
microglia were compared with the levels from
rosuvastatin-treated LPS-challenged or unchallenged
cells, a unique regulatory pattern emerged (Fig. 5). The
basal level for IL-1b in unchallenged (control) microglia
was 15.00 ± 5.6 pg/ml (Fig. 5A). Rosuvastatin did not
change this level significantly (9.56 ± 13.1 pg/ml). As
expected, a 24 h-long LPS challenge significantly
elevated the IL-1b level in the activated microglia, to
156.05 ± 63.0 pg/ml. However, when added together
with LPS, rosuvastatin significantly inhibited the
development of this elevated IL-1b level, by about 45%,
to 86.25 ± 49.3 pg/ml. A similarly strong effect of
rosuvastatin was demonstrated on the level of TNF-a,another pro-inflammatory cytokine, in LPS-challenged
microglial cells (Fig. 5B). Two different treatment times
(6 h and 24 h) were used as the TNF-a production
responded quickly to the LPS challenge. The level of
TNF-a in the unchallenged (control), rosuvastatin-
treated microglia could not be detected, but its level
quickly rose, to 906.80 ± 281.7 pg/ml in the LPS-
challenged cells after 6 h, and the level was still robust
after 24 h (188.19 ± 38.6 pg/ml). When rosuvastatin
was co-administered to LPS-challenged cells for either
6 h or 24 h, it significantly inhibited the production of
TNF-a, by 39% and 40%, respectively (Fig. 5B).
Moreover, rosuvastatin affected the production of
IL-10, an anti-inflammatory cytokine (Fig. 5C). The basal
and rosuvastatin-treated levels of IL-10 in the
unchallenged microglia were not significantly different
(37.01 ± 18.4 pg/ml vs. 75.32 ± 35.4 pg/ml), although
elevated IL-10 production was noted after rosuvastatin
treatment. Interestingly, LPS increased the IL-10 protein
expression significantly to about 340% of the level of the
unchallenged microglia (125.3 ± 25.3 pg/ml pg/ml).
When rosuvastatin was co-administered with LPS, it
boosted the IL-10 protein expression even higher, to
about 750% of the basal level (276.84 ± 85.6 pg/ml),
indicating the very strong anti-inflammatory action of
rosuvastatin.
Rosuvastatin affects the expression ofinflammation-related genes
When the profound morphological and functional effects
of rosuvastatin on the pro- and anti-inflammatory

Fig. 4. Rosuvastatin is a potent inhibitor of phagocytosis. Pure microglial cultures (subDIV4) were maintained and treated with fluorescent
microbeads (2 lm in diameter) as described in Experimental procedures section. Iba1-specific fluorescent immunocytochemistry (red: microglia;
blue: nucleus; green: microspheres) on unchallenged (A), rosuvastatin-treated unchallenged cells (B), LPS-challenged cells (C) and LPS-
challenged + rosuvastatin-treated microglial cells (D) revealed that rosuvastatin inhibited phagocytosis in both naive, unchallenged (B) and LPS-
challenged cells (D). Scale bar in A (for all pictures) = 50 lm. (E) Quantitative analysis of the number of phagocytosed microbeads revealed that
LPS dramatically activated phagocytosis, while rosuvastatin when present significantly decreased this microglial function. Error bars indicate mean
± SD of six replicate measurements from three independent culturings. Data were analyzed with a two-way ANOVA. *p< 0.05, ***p< 0.001. (For
interpretation of the references to colour in this figure legend, the reader is referred to the web version of this article.)
D. Kata et al. / Neuroscience 314 (2016) 47–63 55
capabilities of the microglia had become apparent, we
set out to analyze the effects of rosuvastatin on the
expression of 122 inflammation-related genes in
unchallenged and LPS-challenged pure microglial cells.
The hierarchical cluster analysis of 75 such genes is
summarized in Fig. 6, and the genes with 47 of the
most noteworthy and significant expression changes in
response to treatment are listed in Table 1. The results
of the analysis indicated that treatment with 1 lMrosuvastatin in unchallenged and LPS-challenged
microglia could induce either the upregulation or the
downregulation of a number of genes. Levels of
expression of selected inflammation-related genes (for
example, Ccl24, Ccr1, IL-11, Cxcl1, Ccl4, Ccl5, Hspb1,TGFb-2 and Mbl2) are highlighted in Fig. 7. Some of
these genes responded to rosuvastatin in unchallenged
or challenged cells, or were affected by the LPS
challenge. The genes upregulated by the LPS challenge
included those coding for chemokine ligands 1, 2, 4, 5,
9, 19 and 24 (Cxcl1= 111.6-fold, Ccl2= 34.5-fold,
Ccl4= 17.6-fold, Ccl5= 147.0-fold, Cxcl9= 118.2-
fold, Ccl19= 5.2-fold and Ccl24= 24.6-fold), IL-11

Fig. 5. Rosuvastatin reduces the pro-inflammatory cytokine IL-1b and TNF-a levels and increases the anti-inflammatory IL-10 production. Pure
microglial cultures (subDIV4) were maintained and treated as described in Experimental procedures section. After treatments for 6 or 24 h,
immunoreactive protein levels (pg/ml ± S.D.) for IL-1b (A), TNF-a (B) and IL-10 (C) were detected by ELISA. TNF-a production was measured after
6 h and 24 h (B). As expected, pro-inflammatory cytokine production was significantly increased in the LPS-challenged cells (A, B). Rosuvastatin
was a potent inhibitor of this effect for both IL-1b (A) and TNF-a (B). The level of the anti-inflammatory cytokine IL-10 was measured after 24 h (C).
Rosuvastatin slightly increased the level of IL-10 both in unchallenged and in LPS-challenged microglia, to 750% of the control level in the latter
case (C). Error bars indicate mean ± S.D. of six replicate measurements from three independent culturings. Data were analyzed with a two-way
ANOVA. n.d. = not detected. *p< 0.05; **p< 0.01; ***p< 0.001.
56 D. Kata et al. / Neuroscience 314 (2016) 47–63
(Il11= 19.3-fold), IL-23 receptor (Il23r= 246.6-fold)
and mannose-binding lectin (protein C) two receptor
(Mbl2=33.2-fold). Only a few genes were downregulated
by the LPS challenge, the most affected one being that of
the myosin regulatory light chain 2 (Myl2=�4.4-fold).
Rosuvastatin treatment in unchallenged cells affected
fewer, but similarly important microglial genes involved in
pro- and anti-inflammatory processes. The genes
upregulated by rosuvastatin included Cxcl1 (7.0-fold;
Fig. 7D), the anti-inflammatory Ccl5 (6.6-fold; Fig. 7F),
and, most importantly, Mbl2 (126.2-fold; Fig. 7I), a
crucial factor in the development of innate immunity
(Worthley et al., 2005). Rosuvastatin was in general a
weak inhibitor of the expression of inflammatory genes
as it downregulated only a few genes, notably the anti-
inflammatory interleukin-10 (Il10= �4.0-fold) and the
pro-inflammatory chemokine (C–C motif) receptor 1
(Ccr1= �2.9-fold). When rosuvastatin was applied to
LPS-challenged cultures (Table 1, Figs. 6 and 7), a more
complex picture emerged. Some of the LPS-upregulated
genes were inhibited by rosuvastatin, as seen in the case
of Ccl24, where a substantial, 377% decrease in gene
expression was observed, down from the 24.5-fold
increase after LPS treatment to a 6.5-fold increase
(Fig. 7A), or in the case of Ccr1, where a 198% decrease
in gene expression was detected (Fig. 7B). Interestingly,
rosuvastatin alone did not exhibit a strong effect on these
latter genes, but only when activated by LPS (Fig. 7C, D).
Other genes were regulated synergistically by rosuvas-
tatin when applied to LPS-challenged microglia. For
example, Cxcl1 and Ccl4 were both further upregulated
by rosuvastatin in LPS-challenged cells (Fig. 7D, E).
Some of the genes related to inflammation were not
affected by the LPS challenge, but reacted weakly to
rosuvastatin, as seen in Hspb1 gene expression
(Fig. 7G, H), where a 2.8-fold increase was detected.
DISCUSSION
We carried out a quantitative investigation of the complex
morphological, functional and gene expression
characteristics of pure microglial cells of embryonic
origin after rosuvastatin treatment in unstimulated and
LPS-challenged cultures, and highlighted the complex
beneficial effects of rosuvastatin that make it an
excellent candidate for preventive neuroinflammatory
therapy with well-balanced properties of enhanced anti-
inflammatory and subdued pro-inflammatory effects.
Although microglial cells prepared from embryonic
nervous tissue may differ from those of the adult brain
in certain characteristics (Floden and Combs, 2006), they
are nevertheless similarly responsive to immunological
(LPS) challenge and suitable for morphological, functional
and gene expression studies. When activated, the micro-
glia display both pro- and anti-inflammatory properties as
they can be polarized along a continuum toward a detri-
mental (M1) or a beneficial (M2) state in the injured
CNS (Kroner et al., 2014). Inflammation that is mediated,
and perhaps enhanced, by the microglia has been impli-
cated in a number of neuropathological conditions, rang-
ing from acute injuries (Loane and Byrnes, 2010) and
chronic inflammatory conditions (Gay, 2007; Napoli and
Neumann, 2010) to neurodegenerative diseases (Long-
Smith et al., 2009; Prokop et al., 2013).
Statins are commonly used in the treatment of high
blood cholesterol levels (Burg and Espenshade, 2011).
They are classified on the basis of their lipid-lowering effi-
cacy and their lipophilic/hydrophilic nature (Hamelin and
Turgeon, 1998; Jones et al., 1998; Davidson, 2002;
Schachter, 2005); while lipophilic statins penetrate the cell
membrane, hydrophilic statins such as rosuvastatin
(Crestor; AstraZeneca Pharmaceuticals, LP, Wilmington,
DE, USA) are transported through the blood–brain barrier
via multiple transporters (Kitamura et al., 2008; Abbott
et al., 2010; Ellis et al., 2013) or ATP-binding cassette
efflux transporters in microglia (Gibson et al., 2012).
Rosuvastatin exhibits the greatest inhibitory effect on
cholesterol biosynthesis (McTaggart et al., 2001) and
most favorably alters the high-density lipoprotein profile
among statins (Asztalos et al., 2007); it was the fourth
highest-selling prescription drug in the USA in 2013
(http://www.drugs.com/stats/top100/2013/sales).

Fig. 6. Hierarchical cluster analysis of inflammation-related genes.
Pure microglial cultures (subDIV4) were maintained and treated as
described in Experimental procedures section. The cells (subDIV4)
were cultured with or without LPS for 24 h in the presence or absence of
rosuvastatin. Rosuvastatin: 1 lM; LPS: 20 ng/ml; LPS+ rosuvastatin:
LPS (20 ng/ml) + rosuvastatin (1 lM). For hierarchical cluster analysis
and visualization, the Hierarchical Clustering Explorer (v3.0) software
was used. The complete linkage clustering method was applied with
Euclidean distance metric. The heat map depicts expression values
relative to control samples on a log2 scale (overexpression: red,
repression: green and no change: black). Missing values are indicated
in gray. (For interpretation of the references to colour in this figure
legend, the reader is referred to the web version of this article.)
D. Kata et al. / Neuroscience 314 (2016) 47–63 57
Although their main action is to block cholesterol synthe-
sis, other effects of statins, including those on the regres-
sion of atherosclerotic coronary lesions, are also
important (Wierzbicki et al., 2003). Expecting similarly
beneficial effects on the microglia, we determined how
rosuvastatin modulates both pro- and anti-inflammatory
actions by affecting numerous morphological, functional
and gene expression parameters in pure microglial cul-
tures. These cultures provide a unique opportunity to
study these functional and expression parameters without
the significant influence of any contaminating cell types.
Our secondary microglial cultures were >99% pure, a
crucial factor when levels of secreted pro- and anti-
inflammatory peptides or gene expression levels are mea-
sured, as other cell types in the CNS are also capable of
expressing such peptides (Gruol et al., 2014).
Our studies revealed the effects of rosuvastatin on
various quantitative morphological properties of the
microglia. Rosuvastatin affected the area, perimeter and
TI profoundly in both unchallenged and LPS-challenged
cells. It generally promoted microspike formation and
increased the cell perimeter and TI through ramification.
Concomitantly with the increase in cell area in both
unchallenged and LPS-challenged cells, rosuvastatin
affected the protein synthesis of Iba1, a protein that is
implicated in actin cytoskeleton remodeling (Sasaki
et al., 2001; Ohsawa et al., 2004). As expected, LPS
treatment caused microglia activation that resulted in a
low TI, but the combined treatment with LPS + rosuvas-
tatin inhibited this activation through the development of
microspikes and the cells becoming more ramified.
Rosuvastatin strongly inhibited microglia proliferation
and adhesion as it significantly decreased the number of
cells in both naıve and LPS-challenged cultures.
Although the precise mechanisms are not known, statins
are able to inhibit mitosis through cell cycle arrest in G1
(Yang et al., 2008) and G2/M (Gao et al., 2012). As rosu-
vastatin displays a weak anti-mitogenic effect, its regular
use may prove helpful in lowering the risks of a number
of cancer types (Simon et al., 2012). To quantify cell adhe-
sion, we used the cell index value (Atienza et al., 2005;
Jarvis et al., 2011). Our finding that rosuvastatin lowered
cell adhesion in both unchallenged and LPS-challenged
cells is in harmony with previous reports on the ability of
statins to decrease the expression of cell adhesion mole-
cules (Weber et al., 1997; Wierzbicki et al., 2003).
We also examined how rosuvastatin altered fluid-
phase phagocytosis. Phagocytosis is crucial in both the
normal and the pathologic CNS as it efficiently
eliminates foreign materials, apoptotic cells and cell
debris (Kettenmann et al., 2011), and alteration of this
clearance function could be harmful (Hickman and El
Khoury, 2014; Lue et al., 2015). For example, pro-
inflammatory phenotypes are linked to the phagocytic
activity, and the blocking of phagocytosis may prevent
some forms of inflammatory neurodegeneration, and
might therefore be beneficial during infection, trauma,
ischemia, neurodegeneration and aging (Neher et al.,
2011; He et al., 2014). LPS is a strong activator of micro-
glial phagocytosis (Nakamura, 2002; Lund et al., 2006;
Szabo and Gulya, 2013). In our study, rosuvastatin

Table 1. Differentially expressed transcripts in rosuvastatin-treated pure microglial cells with or without LPS challenge
Gene Name, NCBI reference sequence ID, RGD ID Rosuvastatin LPS LPS+ Rosuvastatin
Cxcl1 Chemokine ligand 1 (melanoma growth-stimulating activity, alpha)
NM_030845.1, RGD ID 619869
+7.05 +111.55 +394.01
Csf3 Colony-stimulating factor 3
NM_017104.1 (old), NM_017104.2, RGD ID 2426
+2.9 +310.7 +321.7
Il23r Interleukin 23 receptor
XM_001072576.2, RGD ID 1586368
+2.12 +246.56 +268.81
Ccl5 Chemokine ligand 5
NM_031116.3, RGD ID 69069
+6.56 +146.97 +241.56
Nos2 Nitric oxide synthase
U26686.1, RGD ID 3185
+1.82 +169.95 +135.48
Cxcl9 Chemokine ligand 9
NM_145672.4, RGD ID 628798
+3.82 +118.20 +100.95
Il12b Interleukin 12B
NM_022611.1, RGD ID 628704
+1.7 +42.0 +87.7
Cxcl2 Chemokine ligand 2
NM_053647.1, RGD ID 70069
+1.2 +75.4 +67.3
Il1a Interleukin 1 alpha
NM_017019.1, RGD ID 2890
+1.1 +45.3 +57.0
Ccl4 Chemokine ligand 4
NM_053858.1, RGD ID 620441
+3.33 +17.65 +51.0
Cxcl5 Chemokine ligand 5 (also known as Cxcl6)
NM_022214.1, RGD ID 708540
+1.1 +54.9 +43.4
Ccl2 Chemokine ligand 2
NM_031530.1, RGD ID 3645
+2.34 +34.49 +33.27
Ccl7 Chemokine ligand 7
NM_001007612.1, RGD ID 1359152
�1.4 +12.4 +14.4
Ccl3 Chemokine ligand 3
NM_013025.2, RGD ID 3647
�1.3 +9.1 +11.4
Il6 Interleukin 6
M26744.1, RGD ID 2901
�1.1 +5.6 +8.4
Il11 Interleukin 11
NM_133519.4, RGD ID 621475
�1.99 +19.28 +7.40
Ptgs2 Prostaglandin endoperoxide synthase 2
NM_017232.3, RGD ID 620349
�1.2 +11.8 +7.2
Ccl19 Chemokine ligand 19
NM_001108661.1, RGD ID 1310336
+2.39 +5.21 +6.87
Mbl2 Mannose-binding lectin 2
NM_022704.2, RGD ID 67380
+126.17 +33.22 +6.46
Ccl24 Chemokine ligand 24
NM_001013045.1, RGD ID 1310245
+1.65 +24.55 +6.51
Cxcl10 Chemokine ligand 10
NM_139089.1, RGD ID 620209
+1.8 +4.5 +5.5
Il22ra2 Interleukin 22 receptor, alpha 2
NM_001003404.1, RGD ID 1303169
+1.1 +2.5 +4.0
Il10 Interleukin 10
NM_012854.2, RGD ID 2886
�3.97 +3.08 +2.69
Il1rn Interleukin 1 receptor antagonist
NM_022194.2, RGD ID 621159
�2.19 +3.76 +2.63
Tlr2 Toll-like receptor 2
NM_198769.2, RGD ID 735138
�1.5 +1.8 +2.1
Ccr1 Chemokine receptor 1
NM_020542.2, RGD ID 708446
�2.89 +3.88 +1.96
Traf2 Tnf receptor-associated factor 2
NM_001107815.2, RGD ID 1310457
+1.6 +1.9 +1.6
Mknk1 MAP kinase-interacting serine/threonine kinase 1
NM_001044267.1, RGD ID 1559603
+1.4 +1.6 +1.5
CD47 Cluster of differentiation 47
NM_019195.2, RGD ID 2308
�1.1 +1.3 +1.4
Pla2g4a Phospholipase A2, group IVA (cytosolic, Ca-dependent)
NM_133551.2, RGD ID 67366
�1.7 +1.7 +1.3
Tlr7 Toll-like receptor 7
EF032637.1, RGD ID 1563357
�1.2 +1.8 +1.3
(continued on next page)
58 D. Kata et al. / Neuroscience 314 (2016) 47–63

Table 1 (continued)
Gene Name, NCBI reference sequence ID, RGD ID Rosuvastatin LPS LPS+ Rosuvastatin
Ddit3 DNA-damage-inducible transcript 3
NM_001109986.1, RGD ID 62391
�1.3 +1.7 +1.3
Il18rap Interleukin 18 receptor accessory protein
XM_003750691.2, RGD ID 727867
+1.2 +1.7 +1.2
Hmgn1 High-mobility group nucleosome-binding domain 1
NM_001013184.1, RGD ID 1307761
+1.6 +1.2 +1.0
Scarb1 Scavenger receptor class B, member 1
NM_031541.1, RGD ID 2302
+1.1 �1.3 +1.0
Jun Jun proto-oncogene
NM_021835.3, RGD ID 2943
+1.2 �1.8 �1.1
Hspb1 Heat shock protein 1
NM_031970.3, RGD ID 61306
+2.79 �1.04 �1.19
Hc Clathrin, heavy chain
NM_019299.1, RGD ID 2364
+1.0 +1.1 �1.3
Tgfb3 Transforming growth factor, beta 3
NM_013174.2, RGD ID 3851
+1.2 �1.9 �1.4
Elmo1 Engulfment and cell motility 1
NM_001108415.1, RGD ID 1308182
�1.0 �1.7 �1.6
Prkca Protein kinase C, alpha
NM_001105713.1, RGD ID 3395
+1.3 �2.1 �1.7
Il10rb Interleukin 10 receptor, beta
NM_001107111.1, RGD ID 1560373
�1.4 �1.1 �1.9
Tgfbr1 Transforming growth factor, beta receptor 1
NM_012775.2, RGD ID 3852
�1.2 �2.5 �2.0
Sirpa The signal-regulatory protein a
NM_013016.2, RGD ID 3449
�1.5 �2.7 �2.8
Tlr5 Toll-like receptor 5
FJ750588.1, RGD ID 631351
�1.2 �3.0 �2.9
Ccl11 Chemokine ligand 11
NM_019205.1, RGD ID 3644
�1.2 �1.4 �3.0
Myl2 Myosin, light polypeptide 2
NM_001035252.1 (old), NM_001035252.2,
RGD ID 1564245
�1.3 �4.4 �5.2
The National Center for Biotechnology Information (NCBI) Reference Sequence Database can be retrieved at http://www.ncbi.nlm.nih.gov/refseq/. A description of a gene
function (RGD ID) can be found in The Rat Genome Database 2015 (Shimoyama et al., 2015) at http://rgd.mcw.edu/. Data are expressed as fold-change over the expression
of unchallenged and untreated (control) microglial cells. Treatments had different effects on inflammation-related genes. LPS mostly induced the upregulation of genes as
compared with the untreated control microglia. Rosuvastatin alone also had some effects on these genes. Combined treatment demonstrated that rosuvastatin had different
effects on LPS-activated microglia cells: inhibited the effect of LPS on certain genes (e.g. Ccl24, Ccr1, Kng1, Nos2, Il11), while it had a synergistic effect with LPS on others
(e.g. Cxcl1, Ccl4, Il23r).
D. Kata et al. / Neuroscience 314 (2016) 47–63 59
inhibited phagocytosis completely in the LPS-challenged
microglia, while it was ineffective in inhibiting the basal-
level phagocytosis in unchallenged cells, indicating that
rosuvastatin is a potent inhibitor of this function only in
pro-inflammatory situations and does not alter the normal
clearance of cell debris in a healthy tissue. Thus, rosuvas-
tatin could be helpful when excess microglial activity could
harm the nervous tissue.
Cytokines, important immunomodulators in the normal
functioning of the CNS, can be released, among others,
by the microglial cells. Cytokines can also be harmful:
previous studies have shown that neurodegeneration
originating through neuroinflammation is often elicited by
activated microglia (McGeer and McGeer, 2003, 2010)
through the release of different pro-inflammatory cytoki-
nes and chemokines (Hanisch, 2002). High levels of
IL-1b could be observed, for instance, in the vicinity of
amyloid plaques of AD patients (McGeer et al., 1993;
Lindberg et al., 2005; Ghosh et al., 2013), where activated
microglia accumulate (Rodriguez et al., 2014). Previous
studies also suggested that statins reduce levels of some
of the pro-inflammatory cytokines (Lindberg et al., 2005;
Nakamichi et al., 2006; Veillard et al., 2006) and increase
the anti-inflammatory cytokine IL-10 (Schonbeck and
Libby, 2004). As expected, both pro- (IL-1b, TNF-a) andanti-inflammatory cytokines (IL-10) were increased in
LPS-challenged cells as compared with the unchallenged
(control) group. Rosuvastatin did not significantly affect
the basal cytokine levels in unchallenged microglia, but
strongly inhibited levels of the pro-inflammatory cytokines
IL-1b and TNF-a when tested in LPS-challenged cells.
Besides the inhibition of these pro-inflammatory agents,
rosuvastatin exerted a direct anti-inflammatory effect by
elevating the level of IL-10 in both unchallenged and
LPS-challenged cells.
Effects of rosuvastatin on such diverse immune
mechanisms of microglia as phagocytosis and cytokine
production indicated a strong likelihood of its
involvement in many other immune system-wide
functions and possible effects on inflammation-related
genes. We demonstrated that rosuvastatin, LPS and
their combination had differential effects on the
expression of inflammation-related genes. Several
genes were upregulated after LPS challenge, confirming

Fig. 7. Relative expression levels of various inflammation-related genes identified by real-time PCR in pure microglia cells. Pure microglial cultures
(subDIV4) were maintained and treated as described in Experimental procedures section. The cells (subDIV4) were cultured with or without LPS for
24 h in the presence or absence of rosuvastatin. The extraction of total RNA and the real-time PCR are described in Experimental procedures
section. The transcription levels of the chemokine ligand 24 (Ccl24, A), the chemokine receptor 1 (Ccr1, B), IL-11 (C), the chemokine (CXC motif)
ligand 1 (or melanoma growth-stimulating activity, alpha), (Cxcl1, D), the chemokine ligand 4 (Ccl4, E), the chemokine ligand 5 (Ccl5, F), the heat
shock protein 1 (Hspb1, G), the transforming growth factor beta (TGFbl-2, H) and the mannose-binding lectin (protein C) 2 (Mbl2, I) are shown in
unstimulated (control), LPS-challenged and LPS-challenged + rosuvastatin-treated cells. For some pro-inflammatory genes, rosuvastatin inhibited
their expression which was upregulated in LPS-challenged cells. In connection with Cxcl1, Ccl4 and Ccl5, the combined treatment revealed
synergistic effects between rosuvastatin and LPS for Cxcl1, Ccl4 and Ccl5. Rosuvastatin increased levels of expression of Hspb1, TGF-b andMbl2.Relative expression levels (on a log2 scale) ± SD from at least four separate experiments are shown for each condition. Data were analyzed with a
two-way ANOVA. *p< 0.05; **p< 0.01; ***p< 0.001.
60 D. Kata et al. / Neuroscience 314 (2016) 47–63
its strong pro-inflammatory effects on the microglia.
Rosuvastatin itself and in combination with LPS
displayed different effects on gene expression. Although
rosuvastatin was not able to decrease all the LPS-
upregulated genes, it suppressed the pro-inflammatory
effects of LPS on some genes such as Ccl24 or Ccr1.Ccl24 is a chemokine that can readily be upregulated by
pro-inflammatory cytokines or microbial stimulus such
as LPS (Watanabe et al., 2002). Ccr1 is implicated in mul-
tiple sclerosis (MS) and experimental autoimmune
encephalomyelitis (EAE). Previous studies suggested
that Ccr1 could be upregulated in EAE (Rottman et al.,
2000), and the microglia expressed Ccr1 around the
demyelinating plaques, making Ccr1 antagonists or inhibi-
tors possible targets for the development of MS-therapy
(Hesselgesser et al., 1998; Eltayeb et al., 2007).
Rosuvastatin additionally increased the expression of
certain genes. Its general effects on microglia were
predominantly anti-inflammatory. The gene most
upregulated by rosuvastatin was Mbl2, which is important
in innate immunity (Worthley et al., 2005; Ip et al., 2009)
and involved in the stimulation of phagocytosis (Stuart

D. Kata et al. / Neuroscience 314 (2016) 47–63 61
et al., 2005). Hspb1 was also upregulated by rosuvas-
tatin. Hspb1 is a heat-shock protein with strong
anti-apoptotic potential that regulates the cytoskeleton
dynamics through F-actin stabilization (Concannon
et al., 2003). Cxcl1 has been reported to be an anti-
inflammatory protein with a neuroprotective role (Omari
et al., 2009). Additional chemokine genes such as Ccl2(El Khoury et al., 2007; El Khoury and Luster, 2008),
Cxcl1 (Bosivert et al., 2006) and Ccl5 were all upregulated
in our studies and implicated in microglia recruitment to
areas of inflammation. Although Ccl5 has been demon-
strated to induce pro-inflammatory mechanisms (Skuljec
et al., 2011), it has also been shown to ameliorate
AD-like pathology by recruiting microglia to b-amyloid
deposits (Lee et al., 2012). The expression of a number
of phagocytosis-related gene was also tested. For
example, Mbl2 was upregulated in rosuvastatin-treated
microglia in a seemingly contradictory action, while
several other genes known to be involved in phagocytosis
were inhibited, as expected from the phagocytosis
essays, by rosuvastatin (for example Myl2 (�1.27), Sirpa
(�1.50), Elmo1 (�1.05), or CD47 (�1.07)). Although the
overall downstream effect in the microglia is a strong inhi-
bition of phagocytosis upon rosuvastatin treatment, it
remains to be seen as to what intracellular signalization
is activated to affect these genes or how these genes
interact to elicit this particular cell response.
In summary, rosuvastatin elicits robust changes in the
microglial functions in vitro as it potently inhibits the
harmful pro-inflammatory signals and significantly
enhances the beneficial anti-inflammatory actions of
pure microglial cells after LPS challenge. Its effects
include anti-mitogenic and anti-phagocytic action, strong
inhibition of the synthesis of pro-inflammatory cytokines
paralleled by a very strong stimulation of anti-
inflammatory cytokine production, and a beneficial
differential expression of a number of inflammation-
related genes. As activated microglia often damage
neuronal tissues by excessive cytokine and chemokine
production and phagocytosis, the strong inhibition of
such pro-inflammatory action by rosuvastatin illustrates
an advantageous effect of this drug. Thus, rosuvastatin
may be used prophylactically to inhibit pro-inflammatory
and activate anti-inflammatory mechanisms of the
microglia in order to reduce neuroinflammation and
consequently neurodegeneration substantially. The
microglia could therefore be a novel, specific therapeutic
target in the fight against neurodegenerative disorders.
COMPETING INTERESTS
L.G.P. holds an equity position in Avidin Ltd. that
produces a high-throughput QPCR product (Rat immune
panel) and has a service using the same kit.
AUTHORS’ CONTRIBUTIONS
This study is based on an original idea of K.G. L.H.,
L.G.P. and K.G. designed the experiments. D.K., I.F.,
L.Z.F. and L.H. performed research; L.G.P. contributed
unpublished reagents/analytic tools; D.K., I.F. and L.H.
analyzed data; D.K. and K.G. wrote the paper. All
authors have read and approved the final manuscript.
Acknowledgments—This work was supported by program project
grants to the University of Szeged from the Ministry of National
Resources (TAMOP-4.1.1.C-13/1/KONV-2014-0001, TAMOP-4.
2.1.B-09/1/KONV-2010-0005 and TAMOP-4.2.2.A-11/1/KONV-2
012-0052) through the European Union Cohesion Fund
and from the National Development Agency of Hungary
(KMR_12_1_2012_0072). The funders had no role in the study
design, the data collection and analysis, the decision to publish,
or the preparation of the manuscript. At the time of the experi-
ments, D.K. was a Ph.D. student at the University of Szeged.
We thank Mrs. Susan Ambrus for excellent technical help.
REFERENCES
Abbott NJ, Patabendige AA, Dolman DE, Yusof SR, Begley DJ
(2010) Structure and function of the blood–brain barrier. Neurobiol
Dis 37:13–25.
Ahmed Z, Shaw G, Sharma VP, Yang C, McGowan E, Dickson DW
(2007) Actin-binding proteins coronin-1a and IBA-1 are effective
microglial markers for immunohistochemistry. J Histochem
Cytochem 55:687–700.
Asztalos BF, Le Maulf F, Dallal GE, Stein E, Jones PH, Horvath KV,
McTaggart F, Schaefer EJ (2007) Comparison of the effects of
high doses of rosuvastatin versus atorvastatin on the
subpopulations of high-density lipoproteins. Am J Cardiol
99:681–685.
Atienza JM, Zhu J, Wang X, Xu X, Abassi Y (2005) Dynamic
monitoring of cell adhesion and spreading on microelectronic
sensor arrays. J Biomol Screen 10:795.
Banati RB, Gehrmann J, Schubert P, Kreutzberg GW (1993)
Cytotoxicity of microglia. Glia 7:111–118.
Bodovitz S, Klein WL (1996) Cholesterol modulates alpha-secretase
cleavage of amyloid precursor protein. J Biol Chem 271:
4436–4440.
Boisvert WA, Rose DM, Johnson KA, Fuentes ME, Lira SA, Curtiss
LK, Terkeltaub RA (2006) Up-regulated expression of the CXCR2
ligand KC/GRO-alpha in atherosclerotic lesions plays a central
role in macrophage accumulation and lesion progression. Am J
Pathol 168:1385–1395.
Burg JS, Espenshade PJ (2011) Regulation of HMG-CoA reductase
in mammals and yeast. Progr Lipid Res 50:403–410.
Concannon CG, Gorman AM, Samali A (2003) On the role of Hsp27
in regulating apoptosis. Apoptosis 8:61–70.
Cordle A, Landreth G (2005) 3-Hydroxy-3-methylglutaryl-coenzyme A
reductase inhibitors attenuate b-amyloid-induced microglial
inflammatory responses. J Neurosci 25:299–307.
Davidson MH (2002) Rosuvastatin: a highly efficacious statin for the
treatment of dyslipidaemia. Exp Opin Invest Drugs 11:125–141.
El Khoury J, Luster AD (2008) Mechanisms of microglia accumulation
in Alzheimer’s disease: therapeutic implications. Trends
Pharmacol Sci 29:626–632.
El Khoury J, Toft M, Hickman SE, Means TK, Terada K, Geula C,
Luster AD (2007) Ccr2 deficiency impairs microglial accumulation
and accelerates progression of Alzheimer-like disease. Nat Med
13:432–438.
Ellis LC, Hawksworth GM, Weaver RJ (2013) ATP-dependent
transport of statins by human and rat MRP2/Mrp2. Toxicol Appl
Pharmacol 269:187–194.
Eltayeb S, Berg AL, Lassmann H, Wallstrom E, Nilsson M, Olsson T,
Ericsson-Dahlstrand A, Sunnemark D (2007) Temporal
expression and cellular origin of CC chemokine receptors
CCR1, CCR2 and CCR5 in the central nervous system: insight
into mechanism of MOG-induced EAE. J Neuroinflamm 4:14.
Fabian G, Farago N, Feher LZ, Nagy LI, Kulin S, Kitajka K, Bito T,
Tubak V, Katona RL, Tiszlavicz L, Puskas LG (2011) High-density

62 D. Kata et al. / Neuroscience 314 (2016) 47–63
real-time PCR-based in vivo toxicogenomic screen to predict
organ-specific toxicity. Int J Mol Sci 12:6116–6134.
Famer D, Wahlund LO, Crisby M (2010) Rosuvastatin reduces
microglia in the brain of wild type and ApoE knockout mice on a
high cholesterol diet; implications for prevention of stroke and AD.
Biochem Biophys Res Commun 402:367–372.
Floden AM, Combs CK (2006) Beta-amyloid stimulates murine
postnatal and adult microglia cultures in a unique manner. J
Neurosci 26:4644–4648.
Fujita H, Tanaka J, Toin R, Tateishi N, SuzugI Y, Matsuda S,
Sakanaka M, Maedap N (1996) Effects of GM-CSF and ordinary
supplements on the ramification of microglia in culture: a
morphometrical study. Glia 18:269–281.
Gamba P, Testa G, Gargiulo S, Staurenghi E, Poli G, Leonarduzzi G
(2015) Oxidized cholesterol as the driving force behind the
development of Alzheimer’s disease. Front Aging Neurosci 7:119.
Gao Y, Lu XC, Yang HY, Liu XF, Cao J, Fan L (2012) The molecular
mechanism of the anticancer effect of atorvastatin: DNA
microarray and bioinformatic analyses. Int J Mol Med 30:765–774.
Gay F (2007) Activated microglia in primary MS lesions: defenders or
aggressors? Int MS J MS Forum 14:78–83.
Gehrmann J, Matsumo Y, Kreutzberg G (1995) Microglia: intrinsic
immunoeffector cell of the brain. Brain Res Rev 20:269–287.
Ghosh S, Wu MD, Shaftel SS, Kyrkanides S, LaFerla FM, Olschowka
JA, O’Banion MK (2013) Sustained interleukin-1b overexpression
exacerbates tau pathology despite reduced amyloid burden in an
Alzheimer’s mouse model. J Neurosci 33:5053–5064.
Gibson CJ, Hossain MM, Richardson JR, Aleksunes LM (2012)
Inflammatory regulation of ATP binding cassette efflux transporter
expression and function in microglia. J Pharmacol Exp Ther
343:650–660.
Ginhoux F, Greter M, Leboeuf M, Nandi S, See P, Gokhan S, Mehler
MF, Conway SJ, Ng LG, Stanley ER, Samokhvalov IM, Merad M
(2010) Fate mapping analysis reveals that adult microglia derive
from primitive macrophages. Science 330:841–845.
Gonzalez-Scarano F, Baltuch G (1999) Microglia as mediators of
inflammatory and degenerative diseases. Annu Rev Neurosci
22:219–240.
Graeber MB (2010) Changing face of microglia. Science 330:
783–788.
Gresa-Arribas N, Vieitez C, Dentesano G, Serratosa J, Saura J, Sola
C (2012) Modelling neuroinflammation in vitro: a tool to test the
potential neuroprotective effect of anti-inflammatory agents. Plos
One 7:9.
Gruol DL, Vo K, Bray JG (2014) Increased astrocyte expression of
IL-6 or CCL2 in transgenic mice alters levels of hippocampal and
cerebellar proteins. Front Cell Neurosci 8:234.
Hamelin BA, Turgeon J (1998) Hydrophilicity/lipophilicity: relevance
for the pharmacology and clinical effects of HMG-CoA reductase
inhibitors. Trends Pharmacol Sci 19:26–37.
Hanisch UK (2002) Microglia as a source and target of cytokines. Glia
40:140–155.
He GL, Liu Y, Li M, Chen CH, Gao P, Yu ZP, Yang XS (2014) The
amelioration of phagocytic ability in microglial cells by curcumin
through the inhibition of EMF-induced pro-inflammatory
responses. J Neuroinflamm 11:49.
Hesselgesser J, Ng HP, Liang M, Zheng W, May K, Bauman JG,
Monahan S, Islam I, Wei GP, Ghannam A, Taub DD, Rosser M,
Snider RM, Morrissey MM, Perez HD, Horuk R (1998)
Identification and characterization of small molecule functional
antagonists of the CCR1 chemokine receptor. J Biol Chem
273:15687–15692.
Hickman SE, El Khoury J (2014) TREM2 and the neuroimmunology
of Alzheimer’s disease. Biochem Pharmacol 88:495–498.
Ip WK, Takahashi K, Ezekowitz RA, Stuart LM (2009) Mannose-
binding lectin and innate immunity. Immunol Rev 230:9–21.
Jarvis GE, Bihan Hamaia S, Pugh N, Ghevaert JG, Pearce C,
Hughes CE, Watson SP, Ware J, Rudd E, Farndale RW (2011) A
role for adhesion and degranulation-promoting adapter protein in
collagen-induced platelet activation mediated via integrin a2b1.J Thromb Haemost 10:268–277.
Jones P, Kafonek S, Laurora I, Hunninghake D (1998) Comparative
dose efficacy study of atorvastatin versus simvastatin,
pravastatin, lovastatin, and fluvastatin in patients with
hypercholesterolemia (the CURVES study). Am J Cardiol 81:
582–587.
Kettenmann H, Hanischuk Noda M, Verkhratsky A (2011) Physiology
of microglia. Physiol Rev 91:461–553.
Kitamura S, Maeda K, Wang Y, Sugiyama Y (2008) Involvement of
multiple transporters in the hepatobiliary transport of rosuvastatin.
Drug Metab Dispos 36:2014–2023.
Kreutzberg GW (1996) Microglia: a sensor for pathological events in
the CNS. Trends Neurosci 19:312–318.
Kroner A, Greenhalgh AD, Zarruk JG, Passos Dos Santos R, Gaestel
M, David S (2014) TNF and increased intracellular iron alter
macrophage polarization to a detrimental M1 phenotype in the
injured spinal cord. Neuron 83:1098–1116.
Kurata T, Miyazaki K, Kozuki M, Morimoto N, Ohta Y, Ikeda Y, Abe K
(2012) Atorvastatin and pitavastatin reduce senile plaques and
inflammatory responses in a mouse model of Alzheimer’s
disease. Neurol Res 34:601–610.
Lee JK, Schuchman EH, Jin HK, Bae JS (2012) Soluble CCL5
derived from bone marrow-derived mesenchymal stem cells and
activated by amyloid b ameliorates Alzheimer’s disease in mice by
recruiting bone marrow-induced microglia immune responses.
Stem cells 30:1544–1555.
Lindberg C, Crisby M, Winblad B, Schultzberg M (2005) Effects of
statins on microglia. J Neurosci Res 82:10–19.
Loane DJ, Byrnes KR (2010) Role of microglia in neurotrauma.
Neurother J Am Soc Exp Neurother 7:366–377.
Long-Smith CM, Sullivan AM, Nolan YM (2009) The influence of
microglia on the pathogenesis of Parkinson’s disease. Progr
Neurobiol 89:277–287.
Lowry OH, Rosebrough NJ, Farr AL, Randall RJ (1951) Protein
measurement with the folin phenol reagent. J Biol Chem 193:
265–275.
Lue LF, Schmitz C, Walker DG (2015) What happens to microglial
TREM2 in Alzheimer’s disease: immunoregulatory turned into
immunopathogenic? Neuroscience 302:138–150.
Lund S, Christensen KV, Hedtjarn M, Mortensen AL, Hagberg H,
Falsig J, Hasseldam H, Schrattenholz A, Porzgen P, Leis M
(2006) The dynamics of the LPS triggered inflammatory response
of murine microglia under different culture and in vivo conditions. J
Neuroimmunol 180:71–87.
Luo XG, Chen SD (2012) The changing phenotype of microglia from
homeostasis to disease. Translat Neurodegener 1:9.
McGeer EG, McGeer PL (2003) Inflammatory processes in
Alzheimer’s disease. Progr Neuropsychopharm Biol Psychiatry
27:741–749.
McGeer EG, McGeer PL (2010) Neuroinflammation in Alzheimer’s
disease and mild cognitive impairment: a field in its infancy.
J Alzheimers Dis 19:355–361.
McGeer PL, Kawamata T, Walker DG, Akiyama H, Tooyama I,
McGeer EG (1993) Microglia in degenerative neurological
disease. Glia 7:84–92.
McTaggart F, Buckett L, Davidson R, Holdgate G, McCormick A,
Schneck D, Smith G, Warwick M (2001) Preclinical and
clinical pharmacology of Rosuvastatin, a new 3-hydroxy-3-
methylglutaryl coenzyme A reductase inhibitor. Am J Cardiol
87(5A):28B–32B.
Nakamichi K, Saiki M, Kitani H, Kuboyama Y, Morimoto K,
Takayama-Ito M, Kurane I (2006) Suppressive effect of
simvastatin on interferon-beta-induced expression of CC
chemokine ligand 5 in microglia. Neurosci Lett 407:205–210.
Nakamura Y (2002) Regulating factors for microglial activation. Biol
Pharm Bull 25:945–953.
Nakamura Y, Si QS, Kataoka K (1999) Lipopolysaccharide-induced
microglial activation in culture: temporal profiles of morphological
change and release of cytokines and nitric oxide. Neurosci Res
35:95–100.
Napoli I, Neumann H (2010) Protective effects of microglia in multiple
sclerosis. Exp Neurol 225:24–28.

D. Kata et al. / Neuroscience 314 (2016) 47–63 63
Neher JJ, Neniskyte U, Zhao JW, Bal-Price A, Tolkovsky AM, Brown
GC (2011) Inhibition of microglial phagocytosis is sufficient to
prevent inflammatory neuronal death. J Immunol 186:4973–4983.
Nicholls SJ, Ballantyne CM, Barter PJ, Chapman MJ, Erbel RM,
Libby P, Raichlen JS, Uno K, Borgman M, Wolski K, Nissen SE
(2011) Effect of two intensive statin regimens on progression of
coronary disease. N Engl J Med 365:2078–2087.
Nissen SE, Nicholls SJ, Sipahi I, Libby P, Raichlen JS, Ballantyne
CM, Davignon J, Erbel R, Fruchart JC, Tardif JC, Schoenhagen
P, Crowe T, Cain V, Wolski K, Goormastic M, Tuzcu EM,
ASTEROID Investigators (2006) Effect of very high-intensity statin
therapy on regression of coronary atherosclerosis: the
ASTEROID trial. JAMA 295:1556–1565.
Ohsawa K, Imai Y, Sasaki Y, Kohsaka S (2004)
Microglia/macrophage-specific protein Iba1 binds to fimbrin and
enhances its actin-bundling activity. J Neurochem 88:844–856.
Omari KM, Lutz SE, Santambrogio L, Lira SA, Raine CS (2009)
Neuroprotection and remyelination after autoimmune demyelination
inmice that inducibly overexpressCXCL1.AmJPathol 174:164–176.
Ozsvari B, Puskas LG, Nagy LI, Kanizsai I, Gyuris M, Madacsi R,
Feher LZ, Gero D, Szabo C (2010) A cell-microelectronic sensing
technique for the screening of cytoprotective compounds. Int J
Mol Med 25:525–530.
Prokop S, Miller KR, Heppner FL (2013) Microglia actions in
Alzheimer’s disease. Acta Neuropathol 126:461–477.
Rodriguez GA, Tai LM, LaDu MJ, Rebeck GW (2014) Human APOE4
increases microglia reactivity at Ab plaques in a mouse model of
Ab deposition. J Neuroinflammation 11:111.
Rottman JB, Slavin AJ, Silva R, Weiner HL, Gerard CG, Hancock
WW (2000) Leukocyte recruitment during onset of experimental
allergic encephalomyelitis is CCR1 dependent. Eur J Immunol
30:2372–2377.
Sasaki Y, Ohsawa K, Kanazawa H, Kohsaka S, Imai Y (2001) Iba1 Is
an actin-cross-linking protein in macrophages/microglia. Biochem
Biophys Res Commun 286:292–297.
Schachter M (2005) Chemical, pharmacokinetic and
pharmacodynamic properties of statins: an update. Fundam Clin
Pharmacol 19:117–125.
Schonbeck U, Libby P (2004) Inflammation, immunity, and HMG-CoA
reductase Inhibitors: statins as antiinflammatory agents.
Circulation 109(S1):II18–II26.
Shimoyama M, De Pons J, Hayman GT, Laulederkind SJ, Liu W,
Nigam R, Petri V, Smith JR, Tutaj M, Wang SJ, Worthey E,
Dwinell M, Jacob H (2015) The Rat Genome Database 2015:
genomic, phenotypic and environmental variations and disease.
Nucleic Acids Res 43(Database issue):D743–D750.
Shobab LA, Hsuing GY, Feldman HH (2005) Cholesterol in
Alzheimer’s disease. Lancet Neurol 4:841–852.
Simon MS, Rosenberg CA, Rodabough RJ, Greenland P, Ockene I,
Roy HK, Lane DS, Cauley JA, Khandekar J (2012) Prospective
analysis of association between use of statins or other lipid-lowering
agents and colorectal cancer risk. Ann Epidemiol 22:17–27.
Simons M, Keller P, De Strooper B, Beyreuther K, Dotti CG, Simons
K (1998) Cholesterol depletion inhibits the generation in
hippocampal neurons. Proc Natl Acad Sci USA 95:6460–6464.
Skuljec J, Sun H, Pul R, Benardais K, Ragancokova D, Moharregh-
Khiabani D, Kotsiari A, Trebst C, Stangel M (2011) CCL5 induces
a pro-inflammatory profile in microglia in vitro. Cell Immunol
270:164–171.
Streit WJ (2002) Microglia as neuroprotective immunocompetent
cells of the CNS. Glia 40:133–139.
Stuart LM, Takahashi K, Shi L, Savill J, Ezekowitz RA (2005)
Mannose-binding lectin-deficient mice display defective apoptotic
cell clearance but no autoimmune phenotype. J Immunol
174:3220–3226. Erratum in: J Immunol 175:3447.
Szabo M, Gulya K (2013) Development of the microglial phenotype in
culture. Neuroscience 241:280–295.
Taylor F, Huffman MD, Macedo AF, Moore TH, Burke M, Davey
Smith G, Ward K, Ebrahim S (2013) Statins for the primary
prevention of cardiovascular disease. Cochrane Database Syst
Rev 1:CD004816. 2013.
van der Most PJ, Dolga AM, Nijholt IM, Luiten PGM, Eisel UL (2009)
Statins: mechanisms of neuroprotection. Progr Neurobiol
88:64–75.
Veillard NR, Braunersreuther V, Arnaud C, Burger F, Pelli G, Steffens
S, Mach F (2006) Simvastatin modulates chemokine and
chemokine receptor expression by geranylgeranyl isoprenoid
pathway in human endothelial cells and macrophages.
Atherosclerosis 188:51–58.
Watanabe K, Jose PJ, Rankin SM (2002) Eotaxin-2 generation is
differentially regulated by lipopolysaccharide and IL-4 in
monocytes and macrophages. J Immunol 168:1911–1918.
Weber C, Erl W, Weber KS, Weber PC (1997) HMG-CoA reductase
inhibitors decrease CD11b expression and CD11b-dependent
adhesion of monocytes to endothelium and reduce increased
adhesiveness of monocytes isolated from patients with
hypercholesterolemia. J Am Coll Cardiol 30:1212–1217.
Wierzbicki AS, Poston R, Ferro A (2003) The lipid and non-lipid
effects of statins. Pharmacol Therap 99:95–112.
Worthley DL, Bardy PG, Mullighan CG (2005) Mannose-binding
lectin: biology and clinical implications. Intern Med J 35:
548–555.
Woudstra C, Lambert D, Anniballi F, De Medici D, Austin J, Fach P
(2013) Genetic diversity of the flagellin genes of Clostridium
botulinum groups I and II. Appl Environ Microbiol 79:3926–3932.
Wu Y, Wu M, He G, Zhang X, Li W, Gao Y, Li Z, Wang Z, Zhang C
(2012) Glyceraldehyde-3-phosphate dehydrogenase: a universal
internal control for Western blots in prokaryotic and eukaryotic
cells. Anal Biochem 423:15–22.
Yang YC, Huang WF, Chuan LM, Xiao DW, Zeng YL, Zhou DA, Xu
GQ, Liu W, Huang B, Hu Q (2008) In vitro and in vivo study of cell
growth inhibition of simvastatin on chronic myelogenous leukemia
cells. Chemotherapy 54:438–446.
Zelcer N, Khanlou N, Clare R, Jiang Q, Reed-Geaghan EG, Landreth
GE, Vinters HV, Tontonoz P (2007) Attenuation of
neuroinflammation and Alzheimer’s disease pathology by liver x
receptors. Proc Natl Acad Sci USA 104:10601–10606.
Zipp F, Waiczies S, Aktas O, Neuhaus O, Hemmer B, Schraven B,
Nitsch R, Hartung HP (2007) Impact of HMG-CoA reductase
inhibition on brain pathology. Trends Pharmacol Sci 28:342–349.
(Accepted 23 November 2015)(Available online 26 November 2015)

ARTICLE II.

UN
CO
RR
EC
TE
DP
RO
OF
Brain Research Bulletin xxx (2017) xxx-xxx
Contents lists available at ScienceDirect
Brain Research Bulletinjournal homepage: www.elsevier.com
A novel pleiotropic effect of aspirin: Beneficial regulation of pro- andanti-inflammatory mechanisms in microglial cellsDiana Kataa, Imre Földesib, Liliana Z. Feherc, Laszlo Hackler Jr. c, Laszlo G. Puskas c, Karoly Gulya a, ⁎
a Department of Cell Biology and Molecular Medicine, University of Szeged, Szeged, Hungaryb Department of Laboratory Medicine, University of Szeged, Szeged, Hungaryc Avidin Ltd., Szeged, Hungary
A R T I C L E I N F O
Keywords:AspirinAnti-inflammationGene expressionLipopolysaccharidePhagocytosisPro-inflammation
A B S T R A C T
Aspirin, one of the most widely used non-steroidal anti-inflammatory drugs, has extensively studied effects onthe cardiovascular system. To reveal further pleiotropic, beneficial effects of aspirin on a number of pro- andanti-inflammatory microglial mechanisms, we performed morphometric and functional studies relating to phago-cytosis, pro- and anti-inflammatory cytokine production (IL-1β, tumor necrosis factor-α (TNF-α) and IL-10, re-spectively) and analyzed the expression of a number of inflammation-related genes, including those related tothe above functions, in pure microglial cells. We examined the effects of aspirin (0.1 mM and 1 mM) in un-challenged (control) and bacterial lipopolysaccharide (LPS)-challenged secondary microglial cultures. Aspirin af-fected microglial morphology and functions in a dose-dependent manner as it inhibited LPS-elicited microglialactivation by promoting ramification and the inhibition of phagocytosis in both concentrations. Remarkably, as-pirin strongly reduced the pro-inflammatory IL-1β and TNF-α production, while it increased the anti-inflamma-tory IL-10 level in LPS-challenged cells. Moreover, aspirin differentially regulated the expression of a number ofinflammation-related genes as it downregulated such pro-inflammatory genes as Nos2, Kng1, IL1β, Ptgs2 or Ccr1,while it upregulated some anti-inflammatory genes such as IL10, Csf2, Cxcl1, Ccl5 or Tgfb1. Thus, the use of as-pirin could be beneficial for the prophylaxis of certain neurodegenerative disorders as it effectively amelioratesinflammation in the brain.
1. Introduction
Microglia is the principal immune cell in the central nervous sys-tem (CNS). Under pathophysiological conditions such as injury, in-fection or neurodegeneration (Kettenmann et al., 2011; Kreutzberg,1996) microglia become activated that proliferate, phagocytose andrelease pro- and anti-inflammatory cytokines, growth factors or reac-tive species (Gehrmann et al., 1995; Hanisch, 2002; Kreutzberg, 1996;Luo and Chen, 2012; Smith et al., 2012). Neuroinflammatory
processes are strongly associated with the development of Alzheimer’sdisease (AD; Akiyama et al., 2000; McGeer and McGeer, 2004), Parkin-son’s disease (PD; Phani et al., 2012; Shin et al., 2015) and multi-ple sclerosis (MS; Minagar et al., 2002; Muzio et al., 2007). In AD,for example, β-amyloid accumulation leads to the production of cy-tokines (IL-1β, IL-6, TNF-α) and the activation of nitric oxide synthase(Nos) gene through the nuclear transcription factor kappa B (NF-κB)signaling pathway (Medeiros et al., 2007). IL-1β in turn increases theexpression of amyloid precursor protein (Ge and Lahiri, 2002), whileincreased expression of TNF-α is reported for both MS
Abbreviations: AD, Alzheimer’s disease; Cd, cluster of differentiation; CNS, central nervous system; COX, cyclooxygenase (prostaglandin-endoperoxide synthase, EC 1.14.99.1); DIV,days in vitro; DMEM, Dulbecco’s Modified Eagle’s Medium; E18, embryonic day 18; ELISA, enzyme-linked immunosorbent assay; ERK1/2, extracellular-regulated kinase 1/2; FBS, fetalbovine serum; GAPDH, glyceraldehyde 3-phosphate dehydrogenase (EC 1.2.1.12); Iba1, ionized calcium binding adaptor molecule 1; IL, interleukin; IκB, inhibitor of κB; LPS, bacteriallipopolysaccharide; MS, multiple sclerosis; NF-κB, nuclear transcription factor kappa B; NO, nitrogen oxide; Nos, nitrogen oxide synthase (EC 1.14.13.39); NSAID, non-steroidal anti-in-flammatory drug; p38-MAPK, p38 mitogen-activated protein kinase; PCR, polymerase chain reaction; PD, Parkinson’s disease; PBS, phosphate-buffered saline; RT, room temperature;SEM, standard error of mean; SDS, sodium dodecyl sulfate; subDIV, subcloned days in vitro; TBS, Tris-buffered saline; TI, transformation index; TLR4, Toll-like receptor 4; TNF-α, tumornecrosis factor α.
⁎ Corresponding author at: Department of Cell Biology and Molecular Medicine, University of Szeged, Somogyi u. 4, Szeged, H-6720, Hungary.Email addresses: [email protected] (D. Kata); [email protected] (I. Földesi); [email protected] (L.Z. Feher); [email protected] (L. Hackler);
[email protected] (L.G. Puskas); [email protected] (K. Gulya)
http://dx.doi.org/10.1016/j.brainresbull.2017.05.009Received 5 November 2016; Received in revised form 27 April 2017; Accepted 12 May 2017Available online xxx0361-9230/ © 2017 Published by Elsevier Ltd.
Research report

UN
CO
RR
EC
TE
DP
RO
OF
D. Kata et al. Brain Research Bulletin xxx (2017) xxx-xxx
and PD (Minagar et al., 2002). Strong anti-inflammatory mechanismscan also lead to the development of neurodegenerative diseases(Gehrmann et al., 1995; Ghosh et al., 2013; Gonzalez-Scarano andBaltuch, 1999; Graeber, 2010; Streit, 2002).
Aspirin (acetylsalicylic acid) is one of the most commonly usednon-steroidal anti-inflammatory drugs (NSAIDs). By inhibiting the en-zyme cyclooxygenase (COX; prostaglandin-endoperoxide synthase, EC1.14.99.1) it blocks the conversion of arachidonic acid to prostanoids(Vane and Botting, 2003). Apart from its well known beneficial anti-in-flammatory effects in the cardiovascular system (Amann and Peskar,2002) and its role in anti-cancer therapy (Cuzick et al., 2014), it also haswidespread effects on immune cell functions such as NO production, cy-tokine (e.g. IL-1β, IL-6, IL-8, TNF-α) and adhesion molecule expression(Hussain et al., 2012). Its anti-inflammatory function is based on theinhibition of the NF-κB signaling pathway (Amann and Peskar, 2002),while its neuroprotective effect in the injured brain is linked to COX-2inhibition; overexpression of COX-2 is indicative of neuronal damage(Berk et al., 2013; Strauss, 2008). Although aspirin has not been exten-sively studied in microglia, its anti-inflammatory actions are recently re-ported (Medeiros et al., 2013; Wang et al., 2011; Yang et al., 2014).
In the present study we investigated the pleiotropic effects of aspirinon secondary, pure microglial cultures derived from mixed primary cul-tures of 18-day-old embryonic (E18) rat forebrains under control (un-challenged) and bacterial lipopolysaccharide (LPS)-challenged condi-tions (Gresa-Arribas et al., 2012; Kata et al., 2016; Lund et al., 2006). Toreveal the effects of aspirin on pro- and anti-inflammatory mechanisms,we performed quantitative morphometric, functional and gene expres-sion studies relating to phagocytic capability, pro- and anti-inflamma-tory cytokine production (IL-1β, TNF-α, and IL-10, respectively) and theexpression of various genes related to inflammation. A preliminary re-port on the effects of aspirin on pure microglial cultures was presentedin poster form (Kata and Gulya, 2014).
2. Material and methods
2.1. Animals
All animal experiments were carried out in strict compliance withthe European Council Directive (86/609/EEC) and EC regulations (O.J.of EC No. L 358/1, 18/12/1986) regarding the care and use of lab-oratory animals for experimental procedures, and followed the rele-vant Hungarian and local legislation requirements. The experimentalprotocols were approved by the Institutional Animal Welfare Com-mittee of the University of Szeged (I-74-II/2009/MÁB). The pregnantSprague-Dawley rats (170–190 g) were kept under standard housingconditions and fed ad libitum.
2.2. Antibodies
For a thorough characterization of different microglial phenotypesdeveloped in vitro, an antibody against the ionized calcium bindingadaptor molecule 1 (Iba1), an intracellular actin- and Ca2+-binding pro-tein expressed in the CNS specifically in macrophages and microglia(Ahmed et al., 2007), was used in our immunocytochemical and West-ern blot analyses. The anti-glyceraldehyde 3-phosphate dehydrogenase(GAPDH) antibody was used as an internal control in Western blot ex-periments (Wu et al., 2012). Antibody dilutions, incubation times andblocking conditions were tested for both immunocytochemistry andWestern blot analysis. To detect the specificities of the secondary an-tisera, staining without the primary antibody was performed. In suchcases, no fluorescent or Western blot signals were detected.
2.3. Cell cultures
Pure microglial cells were isolated from mixed primary cortical cellcultures of rat embryos of either sex by the method we described ear-lier (Kata et al., 2016; Szabo and Gulya, 2013). Sibling embryos ob-tained from the same pregnancy were processed for culturing together;each pregnancy was considered as an independent experiment. Briefly,10–12 fetal rats (E18) under anesthesia were decapitated and the frontallobe of the cerebral cortex was removed, minced with scissors, incu-bated in 9 ml Dulbecco’s Modified Eagle’s Medium (DMEM; Invitro-gen, Carlsbad, USA) containing 1 g/l D-glucose, 110 mg/l Na-pyruvate,4 mM L-glutamine, 3.7 g/l NaHCO3, 10,000 U/ml penicillin G, 10 mg/ml streptomycin sulfate, 25 μg/ml amphotericin B and 0.25% trypsinfor 10 min at 37 °C, and then centrifuged at 1000 g for 10 min at roomtemperature (RT). The pellet was resuspended, washed twice in 5 mlDMEM containing 10% heat-inactivated fetal bovine serum (FBS; Invit-rogen) and centrifuged for 10 min at 1000 g at RT. The final pellet wasresuspended in 2 ml DMEM/10% FBS, after which the cells were platedin the same medium on a poly-l-lysine-coated culture flask (75 cm2,12 × 106 cell/flask) and cultured for a number of days in vitro (DIV)at 37 °C in a humidified air atmosphere supplemented with 5% CO2, inone or other of the following ways: 1) in poly-l-lysine-coated coverslips(15 × 15 mm; 2 × 10⁵cells/coverslip) for immunocytochemistry; 2) inpoly-l-lysine-coated Petri dishes (60 mm x 15 mm; 4 × 10⁵ cells/dish)for Western blot and enzyme-linked immunosorbent assays (ELISA); or3) in a poly-l-lysine-coated culture flask (75 cm2, 12 × 106 cells/flask)for the subsequent generation of pure microglial cell cultures.
Secondary microglial cells were subcloned from mixed primary cul-tures (DIV7) maintained in a poly-l-lysine-coated culture flask (75 cm2,12 × 106 cells/flask) by shaking the cultures at 100 rpm in a platformshaker for 30 min at 37 °C. Microglia from the supernatant were col-lected by centrifugation at 3000 g for 8 min at RT and resuspended in2 ml DMEM/10% FBS. The cells were seeded at a density of 4 × 10⁵
cells/Petri dish for Western blots or 2 × 10⁵ cells/coverslip/Petri dishfor immunocytochemistry or phagocytosis assays, and cultured inDMEM in a humidified atmosphere supplemented with 5% CO2 at 37 °C.The medium was changed on the first day after seeding (subDIV1).
2.4. Cell culture treatments
The aspirin concentrations used in our study are comparable to thetherapeutic plasma salicylate levels for pain relief, inhibition of plateletaggregation or anti-inflammation (Higgs et al., 1987). On the fourth dayof subcloning (subDIV4), DMEM was replaced and the expanded puremicroglial cells were treated with either bacterial lipopolysaccharide(LPS; 20 ng/ml final conc., dissolved in DMEM; Sigma, St. Louis, MO,USA) or aspirin (0.1 mM (low) and 1 mM (high) final conc., from ≥99%acetylsalicylic acid dissolved in sterile, distilled water; Sigma) alone, orwith a combination of LPS + aspirin, and the effects were compared ina variety of morphological and functional tests. LPS treatment servedas an immunochallenge. Six types of treatment regimens were used:1) control (unchallenged and untreated) cultures; 2) LPS-challengedcultures received 20 ng/ml LPS; 3) aspirin-treated cultures received0.1 mM aspirin; 4) aspirin-treated cultures received 1 mM aspirin; 5)LPS-challenged + aspirin-treated cultures were challenged with 20 ng/ml LPS and treated with 0.1 mM aspirin; 6) LPS-challenged + as-pirin-treated cultures were challenged with 20 ng/ml LPS and received
2

UN
CO
RR
EC
TE
DP
RO
OF
D. Kata et al. Brain Research Bulletin xxx (2017) xxx-xxx
1 mM aspirin. Depending on the experiments, the treatments lasted for6 or 24 h at 37 °C.
2.5. Immunocytochemistry
Pure secondary microglial cultures treated with different treatmentregimens were fixed on coverslips with 4% formaldehyde for 5 min andrinsed with 0.05 M phosphate-buffered saline (PBS) for 2 × 5 min. Afterpermeabilization and blocking of the nonspecific sites in 0.05 M PBS so-lution containing 5% normal goat serum (Sigma), 1% heat-inactivatedbovine serum albumin (Sigma) and 0.05% Triton X-100 for 30 min at37 °C, the cells on the coverslips were incubated overnight in a humid-ified chamber at 4 °C with rabbit anti-Iba1 polyclonal antibody (1:500final dilution; Wako, Japan) in the above solution (Kata et al., 2016).The cultured cells were washed for 4 × 10 min at RT in 0.05 M PBS,and then incubated with the Alexa Fluor 568 fluorochrome-conjugatedgoat anti-rabbit antibody (1:1000 final dilution; Invitrogen) in the darkfor 3 h at RT. The cells on the coverslip were washed for 4 × 10 min in0.05 M PBS at RT, and the nuclei were stained in 0.05 M PBS solutioncontaining 1 mg/ml polyvinylpyrrolidone and 0.5 μl/ml Hoechst 33258dye (Sigma). The coverslips were rinsed in distilled water for 5 min,air-dried and mounted on microscope slides in Vectashield mountingmedium (Vector Laboratories, Burlingame, CA, USA).
2.6. Western blot analysis
Cultured microglial cells (subDIV4) were collected through use of arubber policeman, homogenized in 50 mM Tris-HCl (pH 7.5) contain-ing 150 mM NaCl, 0.1% Nonidet P40, 0.1% cholic acid, 2 μg/ml le-upeptin, 1 μg/ml pepstatin, 2 mM phenylmethylsulfonyl fluoride and2 mM EDTA, and centrifuged at 10,000g for 10 min (Kata et al., 2016;Szabo and Gulya, 2013). The pellet was discarded and the protein con-centration of the supernatant was determined (Lowry et al., 1951).For the Western blot analyses, 5–10 μg of protein was separated ona sodium dodecyl sulfate/polyacrylamide gel (4%/10% stacking gel/resolving gel), transferred onto Hybond-ECL nitrocellulose membrane(Amersham Biosciences, Little Chalfont, Buckinghamshire, England),blocked for 1 h in 5% nonfat dry milk in Tris-buffered saline (TBS)containing 0.1% Tween 20, and incubated overnight with either a rab-bit anti-Iba1 polyclonal antibody (1:1000 final dilution; Wako) or amouse anti-GAPDH monoclonal antibody (clone GAPDH-71.1; 1:20,000final dilution; Sigma). The membranes were rinsed 5 times in 0.1%TBS-Tween 20 and incubated for 1 h with the peroxidase-conjugatedgoat anti-rabbit secondary antibody (1:2000 final dilution; Invitrogen)for Iba1 or with the peroxidase-conjugated rabbit anti-mouse secondaryantibody (1:2000 final dilution; Sigma) for GAPDH Western blots, thenwashed 5 times as before. The enhanced chemiluminescence method(ECL Plus Western blotting detection reagents; Amersham Biosciences)was used to reveal immunoreactive bands according to the manufac-turer’s protocol.
2.7. In vitro phagocytosis
The fluid-phase phagocytic capabilities of the control and variouslytreated pure microglial cell cultures were determined via the uptake offluorescent microspheres (carboxylate-modified polystyrene beads, flu-orescent yellow-green (λex ∼ 470 nm; λem ∼ 505 nm), aqueous suspen-sion, 2.0 μm mean particle size; L4530, Sigma) as we described pre-viously (Szabo and Gulya, 2013; Szabo et al., 2016). Unchallenged(control) and LPS-challenged pure microglial cell cultures (subDIV4)with or without aspirin treatments
were tested for 24 h. At the end of the treatment period, 1 μl of a 2.5%aqueous suspension of fluorescent microspheres per ml was added tothe culture, which was then incubated for 60 min at 37 °C. The cellswere next washed 5 times with 2 ml of PBS to remove dish- or cellsurface-bound residual fluorescent microspheres, and fixed with 4%formaldehyde in PBS. In another setup, we also determined the num-ber of cell membrane-associated but not phagocytosed beads. Such neg-ative controls were treated as above with the exception that microglialcultures with beads were incubated for 60 min at 4 °C. At this tem-perature, the number of beads associated with cell surface averagedless than 1 bead/100 Iba1-labeled cells, thus the phagocytosis was notconsidered significant. For measurement of the phagocytotic activity,cells labelled with phagocytosed microbeads and processed for Iba1 im-munocytochemistry were counted in 20 random fields in each treatmentgroup (mean ± SEM) under a 20× or 40× objective. Statistically signifi-cant differences were determined by two-way ANOVA.
2.8. Determination of IL-1β, IL-10 and TNF-α
Our protocols for ELISA assays were described previously (Kata etal., 2016). Briefly, the supernatants were collected from each treat-ment and stored at −20 °C. Concentrations of IL-1β, IL-10 and TNF-αwere measured with rat-specific ELISA kits (eBioscience, Vienna, Aus-tria). The sensitivity of IL-1β (Cat# BMS630), IL-10 (Cat# BMS629) andTNF-α (Cat#BMS622) assays was 4 pg/ml, 1.5 pg/ml and 11 pg/ml, re-spectively. As stated by the manufacturer, the overall intra- and interas-say coefficients of variation were <10% in both cases for IL-1β andTNF-α, and <5% in both cases for IL-10.
2.9. RNA isolation
Total RNA from control and treated pure microglial cells was puri-fied as described previously (Fabian et al., 2011); columns and washbuffer were from Bioneer (Viral RNA extraction kit; Daejon, South Ko-rea). Briefly, cells were washed with PBS, incubated in lysis buffer (RA1;Macherey-Nagel, Düren, Germany), then collected and mixed with 70%ethanol in RNase-free water (Bioneer). The mixture was transferredthrough columns (Bioneer) and washed with 350 μl 80% ethanol in di-ethylpyrocarbonate-treated water, and then with 600 μl and 300 μl W2wash buffer (Bioneer). Total RNA was eluted in 50 μl RNase free-wa-ter. One μl RNase inhibitor (Applied Biosystems, Foster City, CA, USA)was added to the samples. The quality and quantity of the isolated RNAwas measured with NanoDrop1000 Version 3.8.1. (Thermo Scientific,Budapest, Hungary).
2.10. RNA expression
Reverse transcription from 3 μg total RNA in 30 μl was performedwith the High Capacity cDNA Archive Kit (Applied Biosystems) accord-ing to the manufacturer’s protocol as described previously (Kata et al.,2016). cDNA was diluted to 80 μl with nuclease-free water. The instru-mentation included the Bravo automatic liquid handling system (Agi-lent Technologies, Inc., Santa Clara, CA, USA) for polymerase chain re-action (PCR) assay preparation and a LightCycler 1536 System (RocheDiagnostics Corp., Indianapolis, IN, USA) or a Light Cycler Nano In-strument (Roche) for cycling (Woudstra et al., 2013). The expression of116 inflammation-related genes, together with that of 6 control genes(see below), was measured with Universal Probe Library assays usingintron-spanning gene-specific primers (Rat Immune Panel; Avidin Ltd.,Szeged, Hungary, www.avidinbiotech.com/custom-pathways/) and theLightCycler 1536 DNA Probe Master kit (Roche). Moreover, the ex-pression of certain
3

UN
CO
RR
EC
TE
DP
RO
OF
D. Kata et al. Brain Research Bulletin xxx (2017) xxx-xxx
phagocytosis-related genes such as the integrin associated protein orcluster of differentiation 47 (Cd47, NM_019195_2), the engulfment orcell motility protein (Elmo1, NM_001108415.1), the scavenger recep-tor class B member 1 (Scarb1, NM_031541_1), the plasminogen activa-tor inhibitor-1 (Serpine1, NM_012620_1), the signal-regulatory proteinα (Sirpa, NM_013016_2) and the vesicle-associated membrane protein 7(Vamp7, NM_053531_1) were also analyzed by the Light Cycler Nano In-strument. For the 1536 System, each 2 μl PCR reaction contained 8 ngcDNA, 0.4 μl LightCycler DNA Probes Master (5x), the correspondingprimer set and UPL probe and the Setup Control (Kata et al., 2016).The PCR cycling protocol was as follows: enzyme activation at 95 °C for60 s, 50 cycles of denaturation at 95 °C for 0 s, and annealing and ex-tension at 60 °C for 30 s. For the Nano Instrument, each 20 μl PCR reac-tion contained 20 ng cDNA, 10 μl Lightcycler DNA Probes Master (5x),the corresponding primer set and UPL probe and the Setup Control. ThePCR protocol was as follows: enzyme activation at 95 °C for 10 min, 50cycles of denaturation at 95 °C for 15 s, and annealing and extension at60 °C for 30 s. Gene expression was normalized to the average valuesof clathrin, heavy chain (Cltc, NM_019299.1), Gapdh (M17701.1), glu-curonidase, beta (Gusb, NM_017015.2), hypoxanthine phosphoribosyl-transferase 1 (Hprt1, NM_012583.2), phosphoglycerate kinase 1(Pgk1,NM_053291.3), and tubulin, beta 5 class I (Tubb5, NM_173102.2) ex-pression as endogenous controls and expressed relative to the unchal-lenged controls by using the 2−ΔΔCt method.
A total of 122 gene-specific assays were run on 3 independent sam-ples from each condition. Student’s t-test and two-way ANOVA were ap-plied for the analysis of significance where p < 0.05 was considered sig-nificant. Gene expression was analyzed by GraphPad Prism 6 (GraphPadSoftware, Inc., La Jolla, CA, USA). For hierarchical cluster analysis andvisualization, the Hierarchical Clustering Explorer (v3.0) software wasused (Human-Computer Interaction Lab., University of Maryland, MD,USA; publicly available at http://www.cs.umd.edu/hcil/multi-cluster/hce3.html). The complete linkage clustering method was applied withEuclidean distance metric.
2.11. Image analysis and statistics
Digital images were captured by a Nikon Microphot-FXA epifluores-cent microscope (Nikon Corp., Tokyo, Japan), using a Spot RT ColorCCD camera and the Spot RT software (Spot RT/ke Diagnostic In-struments, Sterling Heights, MI, USA). For the determination of mi-croglial cell purity, Hoechst 33258-labelled cell nuclei that belongedto Iba1-immunopositive cells were counted on coverslip-cultured sam-ples. For each culture, 50–100 randomly selected microscope fieldswere analyzed. In every case, the cultures had, on average, at least99 Iba1-positive somata for 100 Hoechst 33258-labelled cell nuclei(>99% purity for microglial cells). Phagocytosed microspheres on 20randomly sampled microscope fields from 3 coverslips for each treat-ment regimen were counted with the use of the computer programImageJ (version 1.47; http://rsb.info.nih.gov/ij). For the measurementof area (μm2), perimeter (μm) and transformation index (TI), Iba1-im-munoreactive microglial cell images were converted into binary replicasby using thresholding procedures implemented by ImageJ and AdobePhotoshop CS5.1 software (Adobe Systems, Inc., San Jose, CA, USA)as we published earlier (Kata et al., 2016; Szabo and Gulya, 2013;Szabó et al., 2016). TI was determined (Fujita et al., 1996) accord-ing to the following formula: [perimeter of cell (μm)]2/4π [cell area(μm2)]. Color correction and cropping of the light microscopic im-ages were performed when photomicrographs were made for publi-cation and assembled for a panel. Gray-scale digital images of theimmunoblots were acquired by scanning the autoradiographic filmswith a desktop scanner and processed at identi
cal settings to allow comparisons of the Western blots from differentsamples. The bands were analyzed through the use of ImageJ. The im-munoreactive densities of equally loaded lanes were quantified, and allsamples were normalized to the internal GAPDH load controls.
All statistical comparisons were made by using R 3.1.0 for Win-dows (The R Foundation for Statistical Computing; Vienna University ofEconomics and Business, Vienna, Austria). Results were analyzed withtwo-way ANOVA, and the Bonferroni correction was used to establishsignificance between groups. Values were presented as means ± SEM;p < 0.05 was considered significant; *, ** and *** denote p < 0.05,p < 0.01 and p < 0.001, respectively.
3. Results
3.1. Aspirin regulates microglial morphology in vitro
Microglial morphology was analyzed on pure microglial cultures4 days after seeding (subDIV4). Immunocytochemistry routinely per-formed on these secondary cultures consistently detected a >99% in-cidence of the Iba1 immunopositive microglial cells for the Hoechst33258 dye-labeled cell nuclei (Fig. 1). The morphological changeselicited by aspirin treatments in unchallenged and LPS-challenged puremicroglia cultures (Fig. 2A–F) were quantitatively analyzed on binarysilhouettes of individual microglial cells (Fig. 3A–I). Iba1 protein ex-pression was also monitored during treatments (Fig. 2G). The amount ofIba1 immunoreactivity was significantly increased in the aspirin-treated(low: 2.09 ± 0.17; high: 2.22 ± 0.26) and the LPS-challenged + as-pirin-treated groups (low: 2.30 ± 0.29; high: 2.49 ± 0.32) as comparedto LPS-challenged values (1.35 ± 0.14; Fig. 2G). Most of the unchal-lenged and untreated (control) microglia displayed slightly amoeboid/ramified morphology with TI = 6.44 ± 1.33; they typically had only afew short processes (Figs. 2A, 3A). LPS challenge resulted in a signifi-cant change in morphology (Figs. 2B, 3B, G–I) as amoeboid morpholo-gies with low TI values (1.37 ± 0.03) were more typical; LPS challengedecreased area, perimeter and TI values (by 48%, 65% and 78%, re-spectively) as compared to the controls. When LPS-challenged cells weretreated with aspirin, significantly enlarged and more ramified cells wereseen as compared to the values of the LPS-challenged cells (Figs. 2B,E, F, 3B, E–I) indicating that aspirin was able to reverse the morpho
Fig. 1. Localization of Iba1 immunoreactive microglial cells in a pure secondary mi-croglial culture (subDIV4).The typical purity of the culture is >99%; in this representativephotomicrograph of a field of view the purity is 100% since every Hoechst 33258-labeledcell nuclei (blue) is surrounded by Iba1 immunopositive cytoplasm (red). Scale bar: 50 μm.
4

UN
CO
RR
EC
TE
DP
RO
OF
D. Kata et al. Brain Research Bulletin xxx (2017) xxx-xxx
Fig. 2. Aspirin affects microglial morphology and Iba1 immunoreactivity in pure microglial cells.Pure microglia cell cultures (subDIV4) were maintained as described in the Methodssection. (A–F) Representative fluorescent immunocytochemical pictures demonstrate the typical cellular distribution of Iba1 immunoreactivity (red) in A) control (unchallenged anduntreated), B) LPS-challenged, C) 0.1 mM aspirin treated, D) 1 mM aspirin treated, E) LPS-challenged + 0.1 mM aspirin-treated and F) LPS-challenged + 1 mM aspirin-treated microglialcells. Hoechst 33258-labeled cell nuclei are shown in blue. Scale bar in A (for all pictures): 50 μm. G, Quantitative Western blot analysis of Iba1 and GAPDH immunoreactivities in puremicroglial cell cultures. Protein samples from the cultures were separated by gel electrophoresis, transferred to nitrocellulose membranes and probed with either the Iba1 or the GAPDHantibody. Gray scale digital images of the immunoblots were acquired by scanning the autoradiographic films with a desktop scanner. The images were scanned and processed at identicalsettings to allow comparisons between the Western blots from different samples. Error bars indicate integrated optical density values (means ± SEM) normalized to the internal standardGAPDH. Representative Western blot pictures are shown beside the graph. Data were analyzed with two-way analysis of variance (ANOVA). *p < 0.05, **p < 0.01.
logical changes induced by LPS-challenge. Both aspirin doses increasedthe TI values to the control level (low: 5.73 ± 0.56; high: 7.36 ± 0.61)and induced ramified morphology with thick processes and microspikes(Figs. 2E, F; 3E, F).
3.2. Aspirin inhibits increases in LPS-induced phagocytosis by microglia
Unchallenged and untreated microglia exhibited a low level offluid-phase phagocytosis engulfing only 3.63 ± 0.21 beads per cell(n = 60; Fig. 4A, G). As expected, microglial activation was associ-ated with robust phagocytic activity as LPS challenge increased phago-cytosis significantly to about 350% of the control level (12.87 ± 0.65;n = 58; Fig. 4A, B, G). Aspirin alone did not affect the phagocyto-sis appreciably (Fig. 4C, D, G), as the number of
phagocytosed microbeads remained low in both cases (low: 2.72 ± 1.19,high: 3.30 ± 0.22; n = 60). However, aspirin inhibited phagocytosissignificantly in LPS-challenged microglia (Fig. 4E, F, G). Aspirin(0.1 mM or 1 mM) decreased phagocytosis dose-dependently by about30% (9.20 ± 0.59; n = 55; Fig. 4E, G) and 70% (3.86 ± 0.23 mi-crobeads per cell; n = 67; Fig. 4F, G), respectively, as compared to LPStreatment.
3.3. Aspirin strongly influences both pro- and anti-inflammatory cytokinelevels
Activated microglia express several inflammatory cytokines. Whenthe basal levels of the pro-inflammatory cytokines IL-1β and TNF-αand the anti-inflammatory cytokine IL-10 in unchallenged mi
5

UN
CO
RR
EC
TE
DP
RO
OF
D. Kata et al. Brain Research Bulletin xxx (2017) xxx-xxx
Fig. 3. Quantitative analysis of microglial morphology in pure microglial cell cultures after different treatments.Pure microglial cell cultures (subDIV4) were maintained as described in theMethods section. (A–F) Iba1-positive microglial cells from pure microglial cultures (subDIV4) were photographed, the pictures were digitized and the morphological characteristics werequantitatively analyzed on binary silhouettes of unchallenged (A), LPS-challenged (B), 0.1 mM aspirin treated (C), 1 mM aspirin treated (D), LPS-challenged + 0.1 mM aspirin-treated(E) and LPS-challenged + 1 mM aspirin-treated (F) microglia. Four representative binary silhouettes are shown for each culturing protocol. Scale bar for all silhouettes: 50 μm.Area (G) in μm2, perimeter (H) in μm, and TI values (I), calculated as [perimeter of cell (μm)]2/4π[cell area (μm2)], are
6

UN
CO
RR
EC
TE
DP
RO
OF
D. Kata et al. Brain Research Bulletin xxx (2017) xxx-xxx
indicated for each digitized cell. Unchallenged and untreated (control) microglia displayed slightly amoeboid/ramified morphology, and neither of the aspirin treatments changed thecontrol values significantly. LPS challenge resulted in amoeboid morphology with the accompanying significant morphometric changes. Both aspirin treatments in LPS-challenged cellsresulted in an enlarged and more ramified cell form with a much larger area, perimeter, and TI value as compared with the LPS results (B, E, F, G, H, I). In the control and the aspirintreated cultures, cells displayed short processes or small pseudopodia with a concurrent slight ramification (A, C, D). In the LPS-challenged cultures (B), the microglia became smaller andshowed amoeboid morphology. Aspirin treatments in these cells (E, F) resulted in a much larger area (G) but similar perimeter (H) and TI values (I) as compared the control cultures.(G) Average area (in μm2 ± SD) measurements for cultured pure microglial cells. (H) Average perimeter (in μm ± SEM) measurements for cultured pure microglial cells. (I) Average TIvalues (±SEM) for cultured pure microglial cells. For (G–I), error bars indicate means ± SEM of 6 replicate measurements from 3 independent culturing. Data were analyzed with two-wayanalysis of variance (ANOVA). *p < 0.05, **p < 0.01, ***p < 0.001.
Fig. 4. Aspirin strongly inhibits phagocytosis.Pure microglial cultures (subDIV4) were maintained and treated with fluorescent microbeads (2 μm in diameter) as described in the Methodssection. Iba1-specific fluorescent immunocytochemistry (red: microglia; blue: nucleus; green: microspheres) on unchallenged (A), LPS-challenged (B), 0.1 mM aspirin treated (C), 1 mMaspirin treated (D), LPS-challenged + 0.1 mM aspirin-treated (E), and LPS-challenged + 1 mM aspirin-treated (F) microglia. Scale bar in A (for all pictures) = 50 μm. (G) Quantitativeanalysis of the number of phagocytosed microbeads revealed that LPS dramatically activated phagocytosis, while aspirin significantly decreased this microglial function. Error bars indicatemeans ± SEM of 6 replicate measurements from 3 independent culturing. Data were analyzed with two-way ANOVA. *p < 0.05, ***p < 0.001.
croglia were compared with the levels from aspirin-treated LPS-chal-lenged cells, a unique regulatory pattern emerged (Fig. 5). In the caseof IL-1β the basal level in unchallenged (control) microglia was22.45 ± 2.87 pg/ml (Fig. 5A). Both aspirin treatments were able tochange this level (low: 10.26 ± 2.62 pg/ml; high: 10.19 ± 2.23 pg/ml).As expected, LPS challenge significantly elevated the IL-1β level to336.15 ± 51.72 pg/ml. However, co-incubation of LPS and 1 mM as-pirin significantly inhibited IL-1β level by about 50%, to169.6 ± 19.42 pg/ml, while 0.1 mM aspirin decreased it by about16.5%, to 280.05 ± 25.0 pg/ml (Fig. 5A).
A similarly strong effect of aspirin was demonstrated on the levelof TNF-α, another pro-inflammatory cytokine, in LPS-challenged mi-croglial cells (Fig. 5C, D). Two different treatment periods (6 h and24 h) were used as the TNF-α production responded quickly to the
LPS challenge. The level of TNF-α in the control group could not be de-tected, but its level quickly rose, to 1187 ± 94.12 pg/ml in the LPS-chal-lenged cells after 6 h, and the level was still elevated after 24 h(189.92 ± 27.4 pg/ml). Aspirin treatments (0.1 mM and 1 mM) resultedin small, detectable TNF-α levels for both doses (27.69 ± 2.89 pg/mland 29.23 ± 1.73 pg/ml after 6 h, while 8.24 ± 1.81 pg/ml and9.09 ± 0.6 pg/ml after 24 h). When aspirin was co-administered toLPS-challenged cells for either 6 h or 24 h, it inhibited the production ofTNF-α in both cases, but only the high aspirin concentration decreasedthe TNF-α level significantly by about 25% (to 844.76 ± 67.11 pg/mlafter 6 h) and 50% (96.79 ± 6.02 pg/ml after 24 h) (Fig. 5C, D).
Aspirin also affected the production of IL-10 (Fig. 5B). LPS chal-lenge increased the basal IL-10 level (24.98 ± 3.47 pg/ml) signifi
7

UN
CO
RR
EC
TE
DP
RO
OF
D. Kata et al. Brain Research Bulletin xxx (2017) xxx-xxx
Fig. 5. Aspirin reduces the pro-inflammatory cytokine IL-1β and TNF-α levels and increases the anti-inflammatory IL-10 production.Pure microglial cultures (subDIV4) were maintainedand treated as described in the Methods section. After treatments for 6 or 24 h, immunoreactive protein levels (pg/ml ± SD) for IL-1β (A), TNF-α (C, D) and IL-10 (B) were detected byELISA. TNF-α production was measured after 6 h and 24 h (C, D). As expected, pro-inflammatory cytokine production was significantly increased in the LPS-challenged cells (A, C, D).Aspirin (1 mM) inhibited this effect for both IL-1β (A) and TNF-α (C, D). The level of the anti-inflammatory cytokine IL-10 was measured after 24 h (B). Aspirin (0.1 mM and 1 mM) didnot increase the level of IL-10 in unchallenged cultures but strongly increased it in LPS-challenged cultures (to 115% and 130% of the control values, respectively) (B). Error bars indicatemeans ± SEM of 6 replicate measurements from 3 independent culturing. Data were analyzed with two-way ANOVA. n.d. = not detected. *p < 0.05; **p < 0.01, ***p < 0.001.
cantly (134.0 ± 9.9 pg/ml). When aspirin was co-administered withLPS, the IL-10 protein expression was further increased as comparedto the LPS challenged value (low: 309.47 ± 12.29 pg/ml, high:280.95 ± 30.3 pg/ml). Aspirin administered alone to unchallenged cellshad no significant effects on the microglial IL-10 levels.
3.4. Aspirin affects the expression of inflammation-related genes
We analyzed the effects of aspirin on the expression of 116 in-flammation-related genes in unchallenged and LPS-challenged pure mi-croglial cells with or without aspirin treatment. The hierarchical clus-ter analysis of 46 such genes is summarized in Fig. 6, and those withthe most noteworthy and significant expression changes in responseto the treatments are listed in Table 1. The genes upregulated bythe LPS challenge included those coding for chemokine ligands 1, 2,4, 5, 7, 9 (Cxcl1 = 84.30-fold, Ccl2 = 16.95-fold, Ccl4 = 9.80-fold,Ccl5 = 38.26-fold, Cxcl5 = 33.19, Cxcl9 = 73.44-fold,) IL-1β(Il1β = 24.70-fold), IL-6 receptor (Il6 = 7.57-fold) and nitric oxide syn-thase (Nos2 = 369.22-fold). Only a few genes were downregulated bythe LPS challenge, including Tgfb2 (−1.73-fold), Sirpa (−2.42-fold),Tlr5 (−3.42-fold) and Myl2 (−4.46-fold).
The levels of expression of some inflammation-related genes stronglydownregulated by aspirin are highlighted in Fig. 7. Aspirin treatmentin unchallenged cells affected fewer, but similarly impor
tant microglial genes involved in pro- and anti-inflammatory processes.In unchallenged cells the genes downregulated by aspirin (0.1 mMor 1 mM) included the interleukin 1 receptor antagonist(Il1rn = −1.37-fold; −1.44-fold), the anti-inflammatory DNA damageinducible transcript 3 (Ddit = −1.43-fold, and −1.79-fold), the pro-in-flammatory IL6 (Il6 = −1.23-fold; −1.55-fold) and the pro-inflam-matory chemokine (C-C motif) receptor 1(Ccr1 = −1.42-fold,−1.44-fold). When aspirin was co-administered to LPS-challenged cul-tures (Table 1), a more complex picture emerged. Some of the LPS-up-regulated genes were inhibited by aspirin, as seen in the case of Ccr1(Fig. 7A), IL1rn (Fig. 7B) or Nos2 (Fig. 7D). Kng1 (Fig. 7C), a pro-inflam-matory gene was downregulated by both aspirin treatments followingLPS challenge. Other genes were further upregulated by aspirin whenapplied to LPS-challenged microglia such as Ccl5 or Csf2, or the pro-in-flammatory Ccl4 (Table 1).
4. Discussion
Microglial activation results in profound morphological, functionaland gene expression changes that activate both pro- and anti-inflam-matory mechanisms (Kroner et al., 2014) that in turn not only pro-tect the nervous tissue but can elicit chronic inflammation that couldlead to the development of neuropathological conditions (Jones andThomsen, 2013; Long-Smith et al., 2009). Aspirin, one of
8

UN
CO
RR
EC
TE
DP
RO
OF
D. Kata et al. Brain Research Bulletin xxx (2017) xxx-xxx
Fig. 6. Hierarchical cluster analysis of inflammation related genes.Pure microglial cultures (subDIV4) were maintained and treated as described in the Methods section. Cells (subDIV4)were cultured with or without LPS for 24 h in the presence or absence of aspirin. Aspirin: 0.1 mM or 1 mM; LPS: 20 ng/ml; LPS + aspirin: LPS (20 ng/ml) + aspirin (0.1 mM or 1 mM).For hierarchical cluster analysis and visualization, the Hierarchical Clustering Explorer (v3.0) software was used. The complete linkage clustering method was applied with Euclideandistance metric. The heat map depicts expression values relative to control samples on a log2 scale (overexpression: red, repression: green and no change: black). Missing values areindicated in grey.
the most commonly used drugs, is noted for its strong anti-inflamma-tory actions. It acetylates the active site of the enzyme COX, and irre-versibly blocks the conversion of arachidonic acid to prostanoid (Vaneand Botting, 2003). Apart from its classical beneficial role in cardiovas-cular diseases, however, aspirin may be beneficial in neuroinflamma-tion-related disorders given that appropriate target cells, the microglia,are present in the nervous tissue.
In the present study we investigated the complex pleiotropic, ben-eficial effects of aspirin on the modulation of inflammation by quan
titatively analyzing numerous morphological, functional (phagocytosis,cytokine release) and gene expression parameters in pure, secondarymicroglial cultures. As our cultures were >99% pure, they provided aunique opportunity to study these functional and expression parameterswithout the significant influence of any contaminating cell types. Thisis a crucial factor when, for example, the levels of secreted pro- andanti-inflammatory peptides or gene expression levels are measured, asother cell types in the CNS are also capable of expressing such genes(Gruol et al., 2014).
9

UN
CO
RR
EC
TE
DP
RO
OF
D. Kata et al. Brain Research Bulletin xxx (2017) xxx-xxx
Table 1Differentially expressed transcripts in aspirin-treated pure microglial cells with or without LPS challenge.
Gene
NameNCBI Reference Sequence IDRGD ID LPS
Aspirin0.1 mM
Aspirin1 mM
LPS + Aspirin0.1 mM
LPS + Aspirin1 mM
Ccl2 Chemokine ligand 2NM_031530.1RGD ID 3645
+16.95 +1.14 +1.70 +20.92 +21.35
Ccl3 Chemokine ligand 3NM_013025.2RGD ID 3647
+ 11.33 −1.01 −1.31 +18.41 +24.79
Ccl4 Chemokine ligand 4NM_053858.1RGD ID 620441
+9.80 −1.05 +1.06 +17.68 +29.80
Ccl5 Chemokine ligand 5NM_031116.3RGD ID 69069
+38.26 +1.02 +1.35 +84.12 +62.69
Ccl7 Chemokine ligand 7NM_001007612.1RGD ID 1359152
+11.48 −1.14 +1.50 +10.82 +11.82
Ccr1 Chemokine receptor 1NM_020542.2RGD ID 708446
+4.51 −1.42 −1.44 +2.16 +1.29
Cxcl1 Chemokine ligand 1 (melanoma growth-stimulatingactivity, alpha)NM_030845.1RGD ID 619869
+84.30 −1.51 +4.11 +43.46 +246.78
Cxcl2 Chemokine ligand 2NM_053647.1RGD ID 70069
+69.02 −1.37 +1.73 +63.70 +60.07
Cxcl5 Chemokine ligand 5 (Cxcl6)NM_022214.1RGD ID 708540
+33.19 +1.41 +2.11 +34.89 +46.37
Cxcl9 Chemokine ligand 9NM_145672.4RGD ID 628798
+73.44 +1.40 +1.22 +86.22 +68.51
Cxcl10 Chemokine ligand 10NM_139089.1RGD ID 620209
+2.83 −1.30 −1.24 +3.93 +3.21
Csf1 Colony stimulating factor-1AF515736.1RGD ID621063
+1.31 −1.49 −1.03 +1.48 +1.30
Csf2 Colony stimulating factor-2XM_001074265.1(old)NM_053852.1RGD ID621065
+10.01 +1.20 −1.00 +20.66 +14.84
Csf3 Colony stimulating factor 3NM_017104.1 (old), NM_017104.2RGD ID 2426
+305.58 +1.23 +4.96 +282.90 +278.46
Ddit3 DNA-damage inducible transcript 3NM_001109986.1RGD ID 62391
+1.25 −1.43 −1.79 +1.14 +1.04
Il1β Interleukin 1 betaNM_031512.2RGD ID 2891
+24.70 +1.18 +1.62 +19.88 +22.98
Il1rap Interleukin 1 receptor accessory proteinNM_012968.1RGD ID2893
+1.97 −1.02 +1.06 +2.30 +2.08
Il1rn Interleukin 1 receptor antagonistNM_022194.2RGD ID 621159
+2.83 −1.37 −1.44 +2.02 +1.64
Il6 Interleukin 6M26744.1RGD ID 2901
+7.57 −1.23 −1.55 +10.82 +7.22
Il10 Interleukin 10NM_012854.2RGD ID 2886
+8.47 +2.01 +1.04 +6.28 +11.87
Il18 IFN-gamma-inducing factor IL-18AY077842.1RGD ID 2889
+2.24 +1.63 −1.29 +1.90 +2.03
Kng1 Kininogen 1NM_012696.2RGD ID 2980
+1.04 −1.36 −1.55 −2.75 −2.82
Nos2 Nitric oxide synthaseU26686.1RGD ID 3185
+369.22 −1.28 +1.78 +73.06 +51.21
10

UN
CO
RR
EC
TE
DP
RO
OF
D. Kata et al. Brain Research Bulletin xxx (2017) xxx-xxx
Table 1 (Continued)
Gene
NameNCBI Reference Sequence IDRGD ID LPS
Aspirin0.1 mM
Aspirin1 mM
LPS + Aspirin0.1 mM
LPS + Aspirin1 mM
Pla2g4a Phospholipase A2, group IVA (cytosolic, calcium-dependent)NM_133551.2RGD ID 67366
+1.73 −1.33 −1.16 +1.66 +1.07
Ptgs2 Prostaglandin endoperoxide synthase 2NM_017232.3RGD ID 620349
+16.83 −1.33 +2.14 +11.76 +12.55
Sirpa The signal-regulatory protein aNM_013016.2RGD ID 3449
−2.42 −1.22 +1.04 −2.84 −2.63
Tgfb1 Transforming growth factor, beta 1NM_021578.2RGD ID 69051
−1.21 +1.05 −1.10 +1.25 +1.34
Tgfb2 Transforming growth factor, beta 2NM_031131.1RGD ID 70491
−1.73 −1.15 −1.43 −1.47 −2.41
Tlr2 Toll-like receptor 2NM_198769.2RGD ID 735138
−1.03 −1.49 −1.22 +1.63 +1.63
Tlr7 Toll-like receptor 7EF032637.1RGD ID 1563357
+2.71 +1.05 −1.36 +1.79 +2.21
The National Center for Biotechnology Information (NCBI) Reference Sequence Database can be retrieved at http://www.ncbi.nlm.nih.gov/refseq/. A description of a gene function (RGDID) can be found in The Rat Genome Database 2015 (Shimoyama et al., 2015) at http://rgd.mcw.edu/. Data are expressed as fold-change over the expression of unchallenged and untreated(control) microglial cells. Treatments had different effects on inflammation-related genes. Most of the genes were upregulated by LPS challenge. Aspirin, either alone or in combinationwith LPS, had differential effects on the expression of certain genes. For example, aspirin treatment downregulated Tgfb2, Kng1 or Ddit3, while upregulated other genes such as Csf3, IL10and CxCl1 in unchallenged cells. In LPS-challenged microglia, aspirin inhibited IL1rn, Ccr1, Kng1, Nos2, while it had a synergistic effect with LPS on others (e.g. Cxcl5, Ccl4, Csf2).
Aspirin reversed the morphological effects of LPS-induced microgliaactivation through the increase of the area, perimeter and TI values; thecombined treatment with LPS also inhibited this activation through thedevelopment of microspikes and inducing the cells to become more ram-ified. Aspirin also affected the protein synthesis of Iba1, a Ca2+-bindingprotein that is implicated in actin cytoskeleton remodeling (Ohsawa etal., 2004; Szabo et al., 2016).
LPS is a potent activator of microglial phagocytosis (Kata et al.,2016; Lund et al., 2006; Szabo and Gulya, 2013; Szabo et al., 2016),a crucial factor both in normal and pathologic functions of the CNS(Kettenmann et al., 2011). Alteration of this function could be harm-ful (Hickman and El Khoury, 2014; Lue et al., 2015). Pro-inflamma-tory phenotypes are associated with increased phagocytic activity, andblocking of phagocytosis may prevent some forms of inflammatory neu-rodegeneration; this may be beneficial under different neuropatholog-ical conditions (He et al., 2014; Neher et al., 2011). Aspirin inhibitedphagocytosis in the LPS-challenged microglia only, while it did not in-hibit the basal phagocytotic activity in unchallenged cells, a physiologi-cal microglial function crucial for the healthy CNS.
LPS is the main ligad for Toll-like receptor 4 (TLR4). TLR4-in-duced signalling activates the NF-κB and MAPK pathways leading tothe production of pro-inflammatory cytokines (Fuentes et al., 2016;Korneev et al., 2017). Aspirin inhibits the production of pro-inflam-matory cytokines through the suppression of LPS-induced NF-κB andMAPK pathways in microglial cells (Cianciulli et al., 2016; Sun et al.,2017; Yang et al., 2014). NF-κB activity is suppressed in the cyto-plasm with an inhibitory IκB protein. The phosphorylation and degra-dation of IκB activates NF-κB and allows to the NF-κB dimer to translo-cate to the nucleus and activate target genes such as IL1β and TNF-α(Sun et al., 2017; Yang et al., 2014). LPS-stimutated degradation ofIκB could be strongly inhibited by aspirin (Yang et al., 2014). Anti-in-flammatory property is mediated by inhibition of several membersof MAPK family, e.g., p38 MAPK and ERK1/2 (Jung et al., 2009;Li et al., 2017); according to recent data, aspirin enhances the
inhibition of p38-MAPK and ERK phosphorylation in a microglial cellline (Yang et al., 2014).
Cytokines are important to the normal and pathologic immunomod-ulatory functions of the microglia. Previous studies demonstrated astrong relationship between cytokines and neurodegenerative diseases(McGeer and McGeer, 2010; Smith et al., 2012). Microglial cells acti-vated by β-amyloid deposits produce toxic mediators and pro-inflamma-tory cytokines such as IL-1β, IL-6, TNF-α and iNos that could result inchronic inflammation (Benveniste et al., 2001). High level of IL-1β couldbe observed in the vicinity of amyloid plaques of AD patients (McGeer etal., 1993) that could be responsible for plaque accumulation (Akiyamaet al., 2000). COX-2 is also increased in AD patients (Akiyama et al.,2000). Recent attempts have been made to ameliorate neuroinflamma-tion through the suppression of microglial activation both in vivo and invitro (Lim et al., 2015; Wang et al., 2011; Yang et al., 2016). Similarlyto the findings for AD, previous studies also suggested that activated mi-croglia could be associated with neuronal loss during PD due to the acti-vation of cytokines, COX-2 and iNos expression (Orr et al., 2002; Phaniet al., 2012) or increased levels of TNF-α and nitrogen oxide could causedemyelination in MS (Minagar et al., 2002).
As expected, both pro- (IL-1β, TNF-α) and anti-inflammatory (IL-10)cytokines were increased in LPS-challenged microglia as compared withthe unchallenged cells. Aspirin did not significantly affect the basalcytokine levels in unchallenged cells, but strongly reduced the lev-els of the pro-inflammatory cytokines IL-1β and TNF-α when tested inLPS-challenged microglia. Besides the inhibition of these pro-inflamma-tory agents, aspirin was also able to elevate the anti-inflammatory IL-10in LPS-challenged cells. Thus, aspirin is remarkably beneficial as it con-comitantly decreased pro-inflammation-related cytokines but increasedanti-inflammation-related cytokine peptides in immunochallenged cells.
We also demonstrated that aspirin, LPS and their combination haddifferential effects on the expression of several inflammation-relatedgenes in pure microglial cells. Some of these genes encode
11

UN
CO
RR
EC
TE
DP
RO
OF
D. Kata et al. Brain Research Bulletin xxx (2017) xxx-xxx
Fig. 7. Relative expression levels of various inflammation-related genes identified by real-time PCR in pure microglia cells.Pure microglial cultures (subDIV4) were maintained and treatedas described in the Methods section. The transcription levels of the chemokine receptor 1 (Ccr1, A), the interleukin 1 receptor antagonist (IL1rn, B), the kininogen 1 (Kng1, C) and thenitric oxide synthase (Nos2, D) genes are shown in unchallenged (control), LPS-challenged and LPS-challenged + aspirin-treated cells. Except for Kng1, these pro-inflammatory genes wereupregulated in LPS-challenged cells but were all strongly inhibited by both doses of aspirin. Relative expression levels (on a log2 scale) ± SEM from at least 3 separate experiments areshown for each condition. Data were analyzed with two-way ANOVA. *p < 0.05, **p < 0.01, ***p < 0.001.
markers that can be related to different microglia subtypes proposedas M1 or M2 phenotypes (Moehle and West, 2015; Orihuela et al.,2016). In this context, for example, the pro-inflammatory IL1β, IL6,IL18, Cxcl9, TNF-α, Cxcl10, and the chemokine Ccl5, genes encode M1markers, while the anti-inflammatory IL10 and the pro-inflammatoryTgfb2 genes are M2 markers (Franco and Fernández-Suárez, 2015). In anLPS-based animal model for Parkinson’s disease, a Rho kinase inhibitorreversed the inflammatory M1 to anti-inflammatory M2 microglia, de-creased NF-кB activation, and inhibited IL-12 and TNF-α generation (Heet al., 2016), demonstrating a protective effect against LPS-mediateddopaminergic degeneration. It must be noted, however, that the conceptof M1/M2 polarization of microglia cells is not universally accepted andneeds reassessment (Martinez and Gordon, 2014; Ransohoff, 2016).
Our study demonstrated that several genes were upregulated afterLPS challenge, confirming its strong pro-inflammatory effects on mi-croglia. Aspirin, both alone and in combination with LPS, displayed dif-ferent effects on microglial gene expression. It suppressed the pro-in-flammatory effects of LPS on some genes such as Ccr1 and Nos2. Itmay be of importance that Ccr1 was previously associated with bothMS and experimental autoimmune encephalomyelitis (Rottman et al.,2000) and Ccr1 protein was localized around the demyelinating plaques(Eltayeb et al., 2007). In our experiment (Fig. 7A) both aspirin dosesdecreased Ccr1 expression. Multiple studies suggested
that Nos2 has a central role in inflammatory reactions and pathogenesisof certain neurodegenerative diseases (Akiyama et al., 2000; Block andHong, 2005; Galea and Feinstein, 1999). Thus, downregulating Nos2 ex-pression could be crucial for possible future therapies. We showed thataspirin inhibited Nos2 expression significantly in LPS-challenged mi-croglia. Kininogen (Kng1) is well known for its pro-inflammatory prop-erties (Sharma and Yusof , 1998; Stewart et al., 1997) as it increases therelease of inflammatory cytokines and affects the formation of inflam-matory exudate and pain (Ueno and Oh-ishi, 2003).
Aspirin also increased the expression of genes that were predomi-nantly anti-inflammatory e.g. IL10, Tgfb1 or Ccl5. IL-10 is a well knownanti-inflammatory cytokine that limits the production of pro-inflamma-tory cytokines including IL-1α and -β, IL-6, IL-12, IL-18, and TNF-α(Couper et al., 2008). Previous studies showed that Tgfb1 had a pro-tective effect against excitotoxicity and the loss of this protein resultedin neurodegeneration (Brionne et al., 2003). Ccl5 was also upregulatedin our studies. Although Ccl5 was demonstrated to induce pro-inflam-matory mechanisms (Skuljec et al., 2011), it was also shown to ame-liorate AD-like pathology by recruiting microglia to β-amyloid deposits(Lee et al., 2012) and to protect against neuronal injury (Campbell etal., 2013; Lim and Mocchetti, 2015). Upregulation of such anti-inflam-matory genes in neurodegenerative disorders could be beneficial.
12

UN
CO
RR
EC
TE
DP
RO
OF
D. Kata et al. Brain Research Bulletin xxx (2017) xxx-xxx
As activated microglia often damage neuronal tissues (Hong et al.,2016; Lui et al., 2016) or cause chronic inflammation by excessive cy-tokine production combined with high level of phagocytosis, effectiveinhibition of pro-inflammatory actions by aspirin could be an importantprophylactic therapy in preventing neuroinflammation and thus neu-rodegeneration. Our data indicate that aspirin beneficially regulates mi-croglia, cells that could be targets in treating or preventing neurodegen-erative disorders. With respect to the large population who receives as-pirin for pain medication or prevention of a number of pathologic con-ditions, to study the interactions of this drug with the nervous systemis even more important. Early observations revealed that NSAIDs couldreduce the risk of AD (McGeer et al., 1996; Stewart et al., 1997), a no-tion that has not been proven in randomised controlled trials assessingthe efficacies of aspirin, steroidal and non-steroidal anti-inflammatorydrugs in AD (Jaturapatporn et al., 2012). However, we recently demon-strated that rosuvastatin, a new generation 3-hydroxy-3-methylglutarylcoenzyme A reductase inhibitor regulated microglial pro- and anti-in-flammatory functions very favorably (Kata et al., 2016). As the effects ofaspirin on selected morphological, functional and gene expression char-acteristics of microglia are very similar to that of rosuvastatin, and thesedrugs are frequently prescribed together for a number of cardiovascu-lar illnesses, their extended use may have contributed to the lower thanexpected incidence of AD (Schrijvers et al., 2012). Thus, the individualand combined effects of aspirin and rosuvastatin on microglial functionsshould be further analyzed for a prophylactic therapeutic approach inneurodegenerative disorders.
5. Conclusion
Aspirin elicits strong responses to microglial functions in LPS-chal-lenged pure microglial cells. The most important pleiotropic beneficialeffects of aspirin are 1) the robust inhibition of phagocytosis in activatedmicroglia, 2) the inhibition of synthesis of pro-inflammatory cytokinescombined with a very strong stimulation of anti-inflammatory cytokineproduction, and 3) the beneficial differential expression of a numberof inflammation-related genes. Such beneficial regulation of microglialfunctions could point to the possible benefits of aspirin therapy in cer-tain neuroinflammatory and neurodegenerative diseases.
Author contributions
This study is based on an original idea of KG. Designed the exper-iments: LH, LGP and KG. Performed the experiments: DK, IF, LZF andLH. Contributed unpublished reagents/analytic tools: LGP. Analyzed thedata: DK, IF and LH. Wrote the paper: DK and KG. All authors have readand approved the final manuscript.
Conflict of interests
LGP holds an equity position in Avidin Ltd. that produces ahigh-throughput QPCR product (Rat immune panel) and has a serviceusing the same kit (http://avidinbiotech.com/custom-pathways/).
Acknowledgements
This work was supported by grants to the University of Szegedfrom the Ministry of National Resources (GINOP_2.3.2-15-2016-00034and GINOP_2.3.2-15-2016-00039) through the European Union Cohe-sion Fund and from the National Development Agency of Hungary(KMR_12_1_2012_0072). The funders had no role in the study design,the data collection and analysis, the decision to pub
lish, or the preparation of the manuscript. At the time of the experi-ments, D.K. was a Ph.D. student at the University of Szeged.
References
Ahmed, Z., Shaw, G., Sharma, V.P., Yang, C., McGowan, E., Dickson, D.W., 2007.Actin-binding proteins coronin-1a and IBA-1 are effective microglial markers for im-munohistochemistry. J. Histochem. Cytochem. 55, 687–700.
Akiyama, H., Barger, S., Barnum, S., Bradt, B., Bauer, J., Cole, G.M., Cooper, N.R., Eike-lenboom, P., Emmerling, M., Fiebich, B.L., et al., 2000. Inflammation and Alzheimer’sdisease. Neurobiol. Aging 21, 383–421.
Amann, R., Peskar, B.A., 2002. Anti-inflammatory effects of aspirin and sodium salicylate.Eur. J. Pharmacol. 447, 1–9.
Benveniste, E.N., Nguyen, V.T., O’Keefe, G.M., 2001. Immunological aspects of microglia:relevance to Alzheimer’s disease. Neurochem. Int. 39, 381–391.
Berk, M., Dean, O., Drexhage, H., McNeil, J.J., Moylan, S., O’Neil, A., Davey, C.G., Sanna,L., Maes, M., 2013. Aspirin: a review of its neurobiological properties and therapeuticpotential for mental illness. BMC Med. 11, 74.
Block, M.L., Hong, J.S., 2005. Microglia and inflammation-mediated neurodegeneration:multiple triggers with a common mechanism. Prog. Neurobiol. 76, 77–98.
Brionne, T.C., Tesseur, I., Masliah, E., Wyss-Coray, T., 2003. Loss of TGF-beta 1 leads to in-creased neuronal cell death and microgliosis in mouse brain. Neuron 40, 1133–1145.
Campbell, L.A., Avdoshina, V., Rozzi, S., Mocchetti, I., 2013. CCL5 and cytokine expres-sion in the rat brain: differential modulation by chronic morphine and morphine with-drawal. Brain Behav. Immun. 34, 130–140.
Cianciulli, A., Calvello, R., Porro, C., Trotta, T., Salvatore, R., Panaro, M.A., 2016. PI3k/Akt signalling pathway plays a crucial role in the anti-inflammatory effects of cur-cumin in LPS-activated microglia. Int. Immunopharmacol. 36, 282–290.
Couper, K.N., Blount, D.G., Riley, E.M., 2008. IL-10: the master regulator of immunity toinfection. J. Immunol. 180, 5771–5777.
Cuzick, J., Thorat, M.A., Andriole, G., Brawley, O.W., Brown, P.H., Culig, Z., Eeles, R.A.,Ford, L.G., Hamdy, F.C., Holmberg, L., et al., 2014. Prevention and early detection ofprostate cancer. Lancet Oncol. 15, e484–e492.
Eltayeb, S., Berg, A.L., Lassmann, H., Wallström, E., Nilsson, M., Olsson, T., Erics-son-Dahlstrand, A., Sunnemark, D., 2007. Temporal expression and cellular origin ofCC chemokine receptors CCR1, CCR2 and CCR5 in the central nervous system: insightinto mechanism of MOG-induced EAE. J. Neuroinflammation 4, 14.
Fabian, G., Farago, N., Feher, L.Z., Nagy, L.I., Kulin, S., Kitajka, K., Bito, T., Tubak,V., Katona, R.L., Tiszlavicz, L., Puskas, L.G., 2011. High-density real-time PCR-basedin vivo toxicogenomic screen to predict organ-specific toxicity. Int. J. Mol.Sci. 12, 6116–6134.
Franco, R., Fernández-Suárez, D., 2015. Alternatively activated microglia andmacrophages in the central nervous system. Prog. Neurobiol. 131, 65–86.
Fuentes, E., Rojas, A., Palomo, I., 2016. NF-κB signaling pathway as target for antiplateletactivity. Blood Rev. 30, 309–315.
Fujita, H., Tanaka, J., Toku, R., Tateishi, N., Suzuki, Y., Matsuda, S., Sakanaka, M., Maeda,N., 1996. Effects of GM-CSF and ordinary supplements on the ramification of mi-croglia in culture: a morphometrical study. Glia 18, 269–281.
Galea, E., Feinstein, D.L., 1999. Regulation of the expression of the inflammatory nitricoxide synthase (NOS2) by cyclic AMP. FASEB J. 13, 2125–2137.
Ge, Y.W., Lahiri, D.K., 2002. Regulation of promoter activity of the APP gene by cy-tokines and growth factors: implications in Alzheimer’s disease. Ann. N. Y. Acad.Sci. 973, 463–467.
Gehrmann, J., Matsumo, Y., Kreutzberg, G., 1995. Microglia: intrinsic immunoeffector cellof the brain. Brain Res. Rev. 20, 269–287.
Ghosh, S., Wu, M.D., Shaftel, S.S., Kyrkanides, S., LaFerla, F.M., Olschowka, J.A., O’Ban-ion, M.K., 2013. Sustained interleukin-1β overexpression exacerbates tau pathol-ogy despite reduced amyloid burden in an Alzheimer’s mouse model. J. Neu-rosci. 33, 5053–5064.
Gonzalez-Scarano, F., Baltuch, G., 1999. Microglia as mediators of inflammatory and de-generative diseases. Annu. Rev. Neurosci. 22, 219–240.
Graeber, M.B., 2010. Changing face of microglia. Science 330, 783–788.Gresa-Arribas, N., Vieitez, C., Dentesano, G., Serratosa, J., Saura, J., Sola, C., 2012. Mod-
elling neuroinflammation in vitro: a tool to test the potential neuroprotective effect ofanti-inflammatory agents. PLoS One 7, e45227.
Gruol, D.L., Vo, K., Bray, J.G., 2014. Increased astrocyte expression of IL-6 or CCL2 intransgenic mice alters levels of hippocampal and cerebellar proteins. Front. Cell. Neu-rosci. 8, 234.
Hanisch, U.K., 2002. Microglia as a source and target of cytokines. Glia 40, 140–155.He, G.L., Liu, Y., Li, M., Chen, C.H., Gao, P., Yu, Z.P., Yang, X.S., 2014. The amelioration
of phagocytic ability in microglial cells by curcumin through the inhibition of EMF-in-duced pro-inflammatory responses. J. Neuroinflammation 11, 49.
He, Q., Li, Y.H., Guo, S.S., Wang, Y., Lin, W., Zhang, Q., Wang, J., Ma, C.G., Xiao, B.G.,2016. Inhibition of Rho-kinase by Fasudil protects dopamine neurons and attenu-ates inflammatory response in an intranasal lipopolysaccharide-mediated Parkinson’smodel. Eur. J. Neurosci. 43, 41–52.
Hickman, S.E., El Khoury, J., 2014. TREM2 and the neuroimmunology of Alzheimer’s dis-ease. Biochem. Pharmacol. 88, 495–498.
Higgs, G.A., Salmon, J.A., Henderson, B., Vane, J.R., 1987. Pharmacokinetics of aspirinand salicylate in relation to inhibition of arachidonate cyclooxygenase and antiinflam-matory activity. Proc. Natl. Acad. Sci. U. S. A. 84, 1417–1420.
Hong, S., Beja-Glasser, V.F., Nfonoyim, B.M., Frouin, A., Li, S., Ramakrishnan, S., Merry,K.M., Shi, Q., Rosenthal, A., Barres, B.A., Lemere, C.A., Selkoe, D.J., Stevens, B., 2016.Complement and microglia mediate early synapse loss in Alzheimer mouse models.Science 352, 712–716.
13

UN
CO
RR
EC
TE
DP
RO
OF
D. Kata et al. Brain Research Bulletin xxx (2017) xxx-xxx
Hussain, M., Javeed, A., Ashraf, M., Zhao, Y., Mukhtar, M.M., Rehman, M.U., 2012. As-pirin and immune system. Int. Immunopharmacol. 12, 10–20.
Jaturapatporn, D., Isaac, M.G., McCleery, J., Tabet, N., 2012. Aspirin, steroidal andnon-steroidal anti-inflammatory drugs for the treatment of Alzheimer’s disease.Cochrane Database Syst. Rev. 2, CD006378.
Jones, K.A., Thomsen, C., 2013. The role of the innate immune system in psychiatric dis-orders. Mol. Cell. Neurosci. 53, 52–62.
Jung, H.W., Yoon, C.H., Park, K.M., Han, H.S., Park, Y.K., 2009. Hexane fraction of Zin-giberis Rhizoma Crudus extract inhibits the production of nitric oxide and proinflam-matory cytokines in LPS-stimulated BV2 microglial cells via the NF-kappaB pathway.Food Chem. Toxicol. 47, 1190–1197.
Kata, D., Gulya, K., 2014. Aspirin regulates the inflammatory responses of activated mi-croglia. Poster No. C112. In: FENS Forum of Neuroscience. July 5–9, 2014, Milan,Italy. p. 219.
Kata, D., Földesi, I., Feher, L.Z., Hackler Jr., L., Puskas, L.G., Gulya, K., 2016. Rosuvastatinenhances anti-inflammatory and inhibits pro-inflammatory functions in cultured mi-croglial cells. Neuroscience 314, 47–63.
Kettenmann, H., Hanisch, U.K., Noda, M., Verkhratsky, A., 2011. Physiology of microglia.Physiol. Rev. 91, 461–553.
Korneev, K.V., Atretkhany, K.N., Drutskaya, M.S., Grivennikov, S.I., Kuprash, D.V., Ne-dospasov, S.A., 2017. TLR-signaling and proinflammatory cytokines as drivers of tu-morigenesis. Cytokine 89, 127–135.
Kreutzberg, G.W., 1996. Microglia: a sensor for pathological events in the CNS. TrendsNeurosci. 19, 312–318.
Kroner, A., Greenhalgh, A.D., Zarruk, J.G., Passos Dos Santos, R., Gaestel, M., David, S.,2014. TNF and increased intracellular iron alter macrophage polarization to a detri-mental M1 phenotype in the injured spinal cord. Neuron 83, 1098–1116.
Lee, J.K., Schuchman, E.H., Jin, H.K., Bae, J.S., 2012. Soluble CCL5 derived from bonemarrow-derived mesenchymal stem cells and activated by amyloid β amelioratesAlzheimer’s disease in mice by recruiting bone marrow-induced microglia immune re-sponses. Stem Cells 30, 1544–1555.
Li, H., Yoon, J.H., Won, H.J., Ji, H.S., Yuk, H.J., Park, K.H., Park, H.Y., Jeong, T.S.,2017. Isotrifoliol inhibits pro-inflammatory mediators by suppression of TLR/NF-κBand TLR/MAPK signaling in LPS-induced RAW264.7 cells. Int. Immunopharma-col. 45, 110–119.
Lim, S.T., Mocchetti, I., 2015. Pharmacological induction of CCL5 in vivo preventsgp120-mediated neuronal injury. Neuropharmacology 92, 98–107.
Lim, H.W., Park, J.I., More, S.V., Park, J.Y., Kim, B.W., Jeon, S.B., Yun, Y.S., Park, E.J.,Yoon, S.H., Choi, D.K., 2015. Anti-neuroinflammatory effects of DPTP, a novel syn-thetic clovamide derivative in in vitro and in vivo model of neuroinflammation. BrainRes. Bull. 112, 25–34.
Long-Smith, C.M., Sullivan, A.M., Nolan, Y.M., 2009. The influence of microglia on thepathogenesis of Parkinson’s disease. Prog. Neurobiol. 89, 277–287.
Lowry, O.H., Rosebrough, N.J., Farr, A.L., Randall, R.J., 1951. Protein measurement withthe Folin phenol reagent. J. Biol. Chem. 193, 265–275.
Lue, L.F., Schmitz, C., Walker, D.G., 2015. What happens to microglial TREM2 inAlzheimer’s disease: immunoregulatory turned into immunopathogenic?. Neuro-science 302, 138–150.
Lui, H., Zhang, J., Makinson, S.R., Cahill, M.K., Kelley, K.W., Huang, H.Y., Shang, Y., Old-ham, M.C., Martens, L.H., Gao, F., Coppola, G., et al., 2016. Progranulin deficiencypromotes circuit-specific synaptic pruning by microglia via complement activation.Cell 165, 921–935.
Lund, S., Christensen, K.V., Hedtjärn, M., Mortensen, A.L., Hagberg, H., Falsig, J., Hassel-dam, H., Schrattenholz, A., Pörzgen, P., Leis, M., 2006. The dynamics of the LPS trig-gered inflammatory response of murine microglia under different culture and in vivoconditions. J. Neuroimmunol. 180, 71–87.
Luo, X.G., Chen, S.D., 2012. The changing phenotype of microglia from homeostasis todisease. Transl. Neurodegener. 1, 9.
Martinez, F.O., Gordon, S., 2014. The M1 and M2 paradigm of macrophage activation:time for reassessment. F1000Prime Rep. 6, 13.
McGeer, P.L., McGeer, E.G., 2004. Inflammation and neurodegeneration in Parkinson’sdisease. Parkinsonism Relat. Disord. 10 (Suppl. 1), S3–S7.
McGeer, E.G., McGeer, P.L., 2010. Neuroinflammation in Alzheimer’s disease and mildcognitive impairment: a field in its infancy. J. Alzheimers Dis. 19, 355–361.
McGeer, P.L., Kawamata, T., Walker, D.G., Akiyama, H., Tooyama, I., McGeer, E.G., 1993.Microglia in degenerative neurological disease. Glia 7, 84–92.
McGeer, P.L., Schulzer, M., McGeer, E.G., 1996. Arthritis and anti-inflammatory agents aspossible protective factors for Alzheimer’s disease: a review of 17 epidemiologic stud-ies. Neurology 47, 425–432.
Medeiros, R., Prediger, R.D., Passos, G.F., Pandolfo, P., Duarte, F.S., Franco, J.L., Dafre,A.L., Di Giunta, G., Figueiredo, C.P., Takahashi, R.N., et al., 2007. Connecting TNF-al-pha signaling pathways to iNOS expression in a mouse model of Alzheimer’s disease:relevance for the behavioral and synaptic deficits induced by amyloid beta protein. J.Neurosci. 27, 5394–5404.
Medeiros, R., Kitazawa, M., Passos, G.F., Baglietto-Vargas, D., Cheng, D., Cribbs, D.H.,LaFerla, F.M., 2013. Aspirin-triggered lipoxin A4 stimulates alternative activationof microglia and reduces Alzheimer disease-like pathology in mice. Am. J.Pathol. 182, 1780–1789.
Minagar, A., Shapshak, P., Fujimura, R., Ownby, R., Heyes, M., Eisdorfer, C., 2002. Therole of macrophage/microglia and astrocytes in the pathogenesis of three neurologicdisorders: HIV-associated dementia, Alzheimer disease, and multiple sclerosis. J. Neu-rol. Sci. 202, 13–23.
Moehle, M.S., West, A.B., 2015. M1 and M2 immune activation in Parkinson’s Disease: foeand ally?. Neuroscience 302, 59–73.
Muzio, L., Martino, G., Furlan, R., 2007. Multifaceted aspects of inflammation in multiplesclerosis: the role of microglia. J. Neuroimmunol. 191, 39–44.
Neher, J.J., Neniskyte, U., Zhao, J.W., Bal-Price, A., Tolkovsky, A.M., Brown, G.C., 2011.Inhibition of microglial phagocytosis is sufficient to prevent inflammatory neuronaldeath. J. Immunol. 186, 4973–4983.
Ohsawa, K., Imai, Y., Sasaki, Y., Kohsaka, S., 2004. Microglia/macrophage-specific pro-tein Iba1 binds to fimbrin and enhances its actin-bundling activity. J. Neu-rochem. 88, 844–856.
Orihuela, R., McPherson, C.A., Harry, G.J., 2016. Microglial M1/M2 polarization andmetabolic states. Br. J. Pharmacol. 173, 649–665.
Phani, S., Loike, J.D., Przedborski, S., 2012. Neurodegeneration and inflammation inParkinson’s disease. Parkinsonism Relat. Disord. 18 (Suppl. 1), S207–S209.
Ransohoff, R.M., 2016. A polarizing question: do M1 and M2 microglia exist?. Nat. Neu-rosci. 19, 987–991.
Rottman, J.B., Slavin, A.J., Silva, R., Weiner, H.L., Gerard, C.G., Hancock, W.W., 2000.Leukocyte recruitment during onset of experimental allergic encephalomyelitis isCCR1 dependent. Eur. J. Immunol. 30, 2372–2377.
Schrijvers, E.M., Verhaaren, B.F., Koudstaal, P.J., Hofman, A., Ikram, M.A., Breteler, M.M.,2012. Is dementia incidence declining?: Trends in dementia incidence since 1990 inthe Rotterdam Study. Neurology 78, 1456–1463.
Sharma, J.N., Yusof, A.P., 1998. Pro-inflammatory properties of the kallikrein-kinin sys-tem: potential for new drug therapy. Inflammopharmacology 6, 289–296.
Shimoyama, M., De Pons, J., Hayman, G.T., Laulederkind, S.J., Liu, W., Nigam, R.,Petri, V., Smith, J.R., Tutaj, M., Wang, S.J., et al., 2015. The Rat Genome Database2015: genomic, phenotypic and environmental variations and disease. Nucleic AcidsRes. 43 (Database Issue), D743–D750.
Shin, W.H., Jeon, M.T., Leem, E., Won, S.Y., Jeong, K.H., Park, S.J., McLean, C., Lee, S.J.,Jin, B.K., Jung, U.J., Kim, S.R., 2015. Induction of microglial toll-like receptor 4 byprothrombin kringle-2: a potential pathogenic mechanism in Parkinson’s disease. Sci.Rep. 5, 14764.
Skuljec, J., Sun, H., Pul, R., Bénardais, K., Ragancokova, D., Moharregh-Khiabani, D., Kot-siari, A., Trebst, C., Stangel, M., 2011. CCL5 induces a pro-inflammatory profile inmicroglia in vitro. Cell. Immunol. 270, 164–171.
Smith, J.A., Das, A., Ray, S.K., Banik, N.L., 2012. Role of pro-inflammatory cytokines re-leased from microglia in neurodegenerative diseases. Brain Res. Bull. 87, 10–20.
Stewart, W.F., Kawas, C., Corrada, M., Metter, E.J., 1997. Risk of Alzheimer’s disease andduration of NSAID use. Neurology 48, 626–632.
Strauss, K.I., 2008. Antiinflammatory and neuroprotective actions of COX2 inhibitors inthe injured brain. Brain Behav. Immun. 22, 285–298.
Streit, W.J., 2002. Microglia as neuroprotective immunocompetent cells of the CNS.Glia 40, 133–139.
Sun, K.Y., Xu, D.H., Xie, C., Plummer, S., Tang, J., Yang, X.F., Ji, X.H., 2017. Lacto-bacillus paracasei modulates LPS-induced inflammatory cytokine release by mono-cyte-macrophages via the up-regulation of negative regulators of NF-kappaB signalingin a TLR2-dependent manner. Cytokine 92, 1–11.
Szabo, M., Gulya, K., 2013. Development of the microglial phenotype in culture. Neuro-science 241, 280–295.
Szabo, M., Dulka, K., Gulya, K., 2016. Calmodulin inhibition regulates morphological andfunctional changes related to the actin cytoskeleton in pure microglial cells. Brain Res.Bull. 120, 41–57.
Ueno, A., Oh-ishi, S., 2003. Roles for the kallikrein-kinin system in inflammatory ex-udation and pain: lessons from studies on kininogen-deficient rats. J. Pharmacol.Sci. 93, 1–20.
Vane, J.R., Botting, R.M., 2003. The mechanism of action of aspirin. Thromb.Res. 110, 255–258.
Wang, Y.P., Wu, Y., Li, L.Y., Zheng, J., Liu, R.G., Zhou, J.P., Yuan, S.Y., Shang, Y., Yao,S.L., 2011. Aspirin-triggered lipoxin A4 attenuates LPS-induced pro-inflammatory re-sponses by inhibiting activation of NF-κB and MAPKs in BV-2 microglial cells. J. Neu-roinflammation 8, 95.
Woudstra, C., Lambert, D., Anniballi, F., De Medici, D., Austin, J., Fach, P., 2013. Geneticdiversity of the flagellin genes of Clostridium botulinum groups I and II. Appl. Envi-ron. Microbiol. 79, 3926–3932.
Wu, Y., Wu, M., He, G., Zhang, X., Li, W., Gao, Y., Li, Z., Wang, Z., Zhang, C., 2012. Glyc-eraldehyde-3-phosphate dehydrogenase: a universal internal control for Western blotsin prokaryotic and eukaryotic cells. Anal. Biochem. 423, 15–22.
Yang, J.M., Rui, B.B., Chen, C., Chen, H., Xu, T.J., Xu, W.P., Wei, W., 2014. Acetylsalicylicacid enhances the anti-inflammatory effect of fluoxetine through inhibition of NF-κB,p38-MAPK and ERK1/2 activation in lipopolysaccharide-induced BV-2 microglia cells.Neuroscience 275, 296–304.
14