mornington harbour coastal processes investigation
TRANSCRIPT

Mornington Harbour Coastal Processes Investigation
J648/R01-C, October 2008, Rev 08 Page 8
Climate Change
Design water levels for the assessment of impacts of the proposed pier protection and harbour
wavescreen have been adopted from the 100 and 1 year return levels with an additional
provision for a predicted sea level rise due to climate change of 0.4m by 2100.
The Intergovernmental Panel on Climate Change (IPCC) was formed in 1988 to assess the
potential impacts of climate change (greenhouse effect) around the world. It is operated by
the World Meteorological Organization (WMO) and the United Nations Environment
Programme (UNEP) and is recognised as an independent panel. The role of the IPCC is to
review the available literature and provide summary reports and information to governments
and other organisations. Their latest report (Climate Change 2007 – The Physical Science
Basis) provides a range of predicted sea level rises from numerous scenarios and different
predictive models. In this latest IPCC report, the range of predicted sea level increases for a
100 year horizon (to the year 2100) varies from 0.18 to 0.59 m with a mean value of about
0.40 m.
It is noted that the draft third Victorian Coastal Strategy (Victorian Coastal Council, 2007)
reviews the main findings of the IPCC Fourth Assessment and other recent Climate Change
material and concludes that “for planning purposes, we will assume a sea level rise of
approximately 0.4 to 0.8 m by the end of the century.”
Given that coastal structures, such as piers and breakwaters have a nominal life span of 50
years, it was therefore considered reasonable to include an allowance of 0.4m in the design
water levels to allow for the effects of sea level rise associated with climate change and global
warming. The resulting design water levels are presented in Table 3-2, below.
Table 3-2 Design Water Levels – Mornington Harbour
Water Level
Height
(m AHD)
100 Year Design Water Level 1.7
1 Year Design Water Level 1.3
Along with increased water levels, the main threats associated with Climate Change will be
an increase in the frequency and intensity of storms, and the corresponding increases in wind
speeds, wave heights and storm surge levels. There is, however, little information available at
present to quantify these risks.
3.3 Wind Conditions
Long periods of recorded wind data over open water are available in Port Phillip Bay at 3
locations – Fawkner Beacon, South Channel Island and Point Wilson. Periodic readings have
also been taken at Hovell Pile during previous studies (Hydrodynamics Investigation, Water
Technology 2008); however these recording periods have been limited to a short amount of
time and are not considered reliable for purposes of this investigation. Similarly, the location
of the Point Wilson anemometer means winds measured here cannot be considered indicative
of conditions near Mornington.

Mornington Harbour Coastal Processes Investigation
J648/R01-C, October 2008, Rev 08 Page 9
Review of the available wind data showed that the data from Fawkner Beacon and South
Channel Island was likely to be the most representative of the conditions at Mornington. The
data from both these sites had median and maximum wind speeds for each season of the same
order of magnitude, with a median wind speed approximately 13kts. They also showed
summer winds coming predominantly from the south, while winter winds came
predominantly from the north.
After further review of the two sites, it was decided that South Channel Island (23km west
southwest of Mornington) were a more realistic representation of winds at Mornington as it
presented considerably more wind action from the northwest, west and south west than
Fawkner Beacon (located 30km north northwest of Mornington), as would be the case on the
eastern coast of Port Phillip Bay. The South Channel Island wind record was subsequently
chosen as the most suitable for use in modelling exercises.
A wind rose showing data recorded at South Channel Island between 1999 and 2007 is shown
below in Figure 3-2.
Figure 3-3 illustrates the seasonal variation in wind speed and direction where summer winds
are dominated by southerly winds and northerly winds dominate in the winter months. Spring
and autumn have a comparably even spread of wind speeds and directions.
Figure 3-2 South Channel Island Wind Climate, 1999 – 2007
Wind Speed (m/s)
Above 1512.5 - 15
10 - 12.57.5 - 10
5 - 7.52.5 - 5
1 - 2.5Below 1
N
Calm2.24 %
10 %

Mornington Harbour Coastal Processes Investigation
Figure 3-3 South Channel Island Seasonal Wind Variation, 1999 – 2007
N
Calm1.10 %
10 %
N
Calm3.14 %
10 %
N
Calm4.13 %
10 %
N
Calm0.95 %
10 %
Summer
Winter
Autumn
Spring

Mornington Harbour Coastal Processes Investigation
J648/R01-C, October 2008, Rev 08 Page 11
4 REGIONAL WAVE CONDITIONS
The wave climate offshore of Mornington has been calculated using the MIKE 21 Spectral
Wave (SW) model (Section 2.1.1).
4.1 Bathymetry
The bathymetry for the MIKE 21 SW model was developed using a digital version of
Admiralty Charts of Port Phillip (CMAP). The model uses a flexible mesh grid allowing finer
detail along the coast and areas of steep gradients, while reducing computations in areas
where topography is constant in slope and shape. The topography used to develop the models
is shown in Figure 4-1. The model does not extend outside of Port Phillip Bay as wave energy
from Bass Strait does not penetrate into the main body of the Bay.
Figure 4-1 MIKE 21 SW Model Bathymetry
4.2 Model simulations
Winds from 15 degree bands were simulated for 12 hours each through the model for a range
of winds speeds from zero to 30 m/s.
Wave height, period and direction at a point offshore of Mornington were extracted from the
results. These wave properties were used to create a matrix for which known wind conditions
could be combined to provide an accurate estimate of the wave climate for any given wind
input.
It should be noted that the incident wave direction is not necessarily the same as the direction
of the wind that generates the wave. This is due to topographic and bathymetric effects that
modify the wave’s direction. When considering the position of Mornington Harbour within
Port Phillip Bay, it can easily be established that the main wave directions will be from west

Mornington Harbour Coastal Processes Investigation
J648/R01-C, October 2008, Rev 08 Page 12
through to north. Refraction occurs as the waves propagate into shallow water, with refraction
greatest for waves whose angle of incidence is highly oblique to the shore normal direction.
Thus, shore normal NW winds tend to generate NW waves, whereas obliquely incident NNE
winds (shore parallel) result in almost northerly waves at the site (Figure 4-2).
This report refers to the northerly wave event as being the wave climate generated by the
northerly wind, and the northwesterly wave referring to the wave climate generated by a
northwesterly wind, and so on.
Figure 4-2 Mornington Harbour wind-wave interaction
4.3 Offshore Wave Climate
Using the method described above in Section 4.2, the 9 year record of wind data at South
Channel Island was transferred to an offshore wave climate at Mornington. This is shown in
the form of wave roses in Figure 4-3. These roses are presented in terms of the significant
wave height Hs, and are given for overall conditions, summer conditions and winter
conditions.
It is noted that the significant wave height is defined as the average height of the highest one-
third of waves within a record. The significant wave height is used to describe the general
character of the sea. The actual highest wave height within a record may be much higher (up
to two times higher) than the significant wave height and is used in design to ensure structures
will withstand the maximum height expected in a given return period.

Mornington Harbour Coastal Processes Investigation
Figure 4-3 Offshore Wave Climate at Mornington
The wave roses in Figure 4-3 show waves coming from the north through west to southwest.
Highest waves come from the north-northwest through to west-northwest, reflecting the
longer fetches (i.e., the distance over which the wind can generate wave action) in these
directions.
The seasonal variation noted in the winds in Section 3.3 is evident in the wave climate such
that summer conditions are dominated by waves from the southwest whilst winter conditions
have predominantly north to west-northwest waves. Further, with the longer fetches to the
northwest, the winter waves tend to be higher than those occurring in summer.
In addition to the above, it is noted that the beaches between Schnapper Point and Red Bluff
are directly exposed to incoming wave action from the north to northwest, but become
progressively more sheltered from more west and southwest waves. Thus, the summer
southwest waves are not only lower initially than the winter northwest waves, but they also
undergo greater attenuation due to diffraction around Schnapper Point. As a result, it is
expected that most of the sediment transport occurring along the beaches will take place
during the winter months.
Boussinesq wave modelling has been carried out to provide an understanding of the offshore
to nearshore wave transformations due to shoaling, refraction and diffraction of waves into
the harbour. To keep the number of simulations within reasonable limits, the 1 month
average return period wave conditions offshore from Mornington for each direction was
calculated for input to the Boussinesq model. These conditions represent the average
maximum significant wave heights Hs to occur in any one month. The results are shown in
Table 4-1.
Wave height (m)
Above 1.21 - 1.2
0.8 - 10.6 - 0.80.4 - 0.6
0.2 - 0.40.1 - 0.2
Below 0.1
N
Calm33.55 %
10 %
N
Calm35.55 %
10 %
N
Calm27.75 %
10 %
1999 – 2007 Wind-waves
Summer
Winter

Mornington Harbour Coastal Processes Investigation
J648/R01-C, October 2008, Rev 08 Page 14
Table 4-1 1 Month ARI Wind Wave Heights
Wind
Direction
Wave
Direction
(deg)
Water
Level
(m AHD)
1 Month Wave
Height
Hs (m)
Period
Ts (s)
NNE 23 1.3 0.43 2.67
N 352 1.3 1.01 3.79
NNW 344 1.3 1.25 4.14
NW 310 1.3 1.24 4.15
WNW 296 1.3 1.31 4.26
W 267 1.3 1.08 3.87

Mornington Harbour Coastal Processes Investigation
J648/R01-C, October 2008, Rev 08 Page 15
5 BOUSSINESQ WAVE MODELLING
Wave energy is the dominant factor for determining sediment transport along the Mornington
Harbour beaches. Numerical Boussinesq wave modelling has been carried out to investigate
the transformation of the offshore wave conditions, determined in the previous section, to the
nearshore areas where most of the sediment transport takes place. The wave model was
developed using DHI Software’s MIKE 21 Boussinesq Wave (BW) module (see Section
2.1.2). The wave conditions derived from the Boussinesq modelling are then used in the
sediment transport calculations described below in Section 6.5.
Some limited wave protection in the harbour is currently provided by the existing pier works.
These consist of a rubble mound structure underneath the landward end of the pier, and
closely spaced piles along the seaward end. However, there is little protection for the
majority of the harbour area and beaches, especially during north and north north-westerly
events.
The proposed harbour works investigated in this report consist of a wavescreen along the
seaward side of the existing public pier and a second wavescreen oriented roughly east-west
along the 7m depth contour to the east of the pier. The wavescreen along the pier was
considered as extending along the full length of the pier, approximately 130m.
The wavescreens were modelled as full depth vertical walls reflecting 100% of the wave
energy approaching the site. It is noted that there is a perception that partial wavescreens will
provide better flushing and have less impact on coastal processes than full wavescreens.
However, the use of full depth wavescreens was considered to be more appropriate for
Mornington. This was because partial depth wavescreens can result in the following issues:
• Reduced wave blocking ability of the wavescreen (due to a proportion of the wave
energy passing under the wavescreen) can lead to an undesirable wave climate within
the harbour
• Acceleration of wave-induced flows under the screen can lead to localised erosion,
turbidity generation, reduced effectiveness of the screen, and possible stability issues
for the structure.
Further, the wavescreens will change the wave climate within the harbour, irrespective of
whether there is or isn’t a gap underneath. For example, to reduce a 2.0m incident wave to
0.3m or less (required to obtain a good wave climate within the harbour), the energy of the
transmitted wave will need to be reduced to just over 2% of that of the incident wave. That is,
the existence of the gap under the wavescreen will not significantly reduce the impact of the
wavescreen on coastal processes and wave induced sediment transport. Further, as shown in
the Hydrodynamics Report (Water Technology, 2008) excellent water circulation and
flushing will be maintained within the harbour, even with a full depth wavescreen.
Given the potential problems, and lack of significant benefits associated with the use of an
above bed wavescreen, it was strongly recommended that full depth wavescreens be used at
Mornington.
5.1.1 Bathymetry
The bathymetry for the model was created by combining the digitalised Admiralty Charts of
Port Phillip Bay (CMAP) with the surveyed data of Mornington recorded in 1995. There is

Mornington Harbour Coastal Processes Investigation
J648/R01-C, October 2008, Rev 08 Page 16
not expected to have been a significant change in bed levels since 1995 and the survey data is
adequate for modelling purposes.
The configuration of the development provided by SKM is combined with the Admiralty
Charts and 1995 survey data as shown below in Figure 5-1. This information was used to
create bathymetries for the Boussinesq modelling.
Figure 5-1 Bathymetric Data Inputs
Separate model grids were developed to simulate incident waves from north-northeast, north,
north-northwest, northwest, west-northwest and west. To improve their computational
effectiveness, the bathymetries used for waves from the west northwest to north northwest
were rotated by 45 degrees. This enables the wave generation lines, which create the waves in
the BW model, to be more closely aligned with the model grid.
The model bathymetries had a grid spacing of 0.5m or 0.6m, for the north and north northeast,
and west to north northwest wave models respectively. This is due to the smaller period of the
north and north northeast waves demanding a finer grid for accurate computation. A time step
of 0.039 seconds was used, over a total simulation time of 25 minutes to allow the wave to
fully propagate into the harbour and beach area.
The six grids covered an area of approximately 1km2 each, depending on the direction of
incoming wave. The bathymetry for the north wave is shown in Figure 5-2 below. Areas not
relevant to the harbour area are filled with land values to reduce the computational size and
simulation time by decreasing the number of grid cells calculations are performed in. This is
true for all bathymetries.

Mornington Harbour Coastal Processes Investigation
J648/R01-C, October 2008, Rev 08 Page 17
Figure 5-2 Boussinesq Wave Modelling – North wave model bathymetry
5.1.2 Input parameters
Once the model bathymetry has been determined, the remaining input parameters required to
define the model are described below. These have been developed in line with current wave
modelling practice.
Boundaries
The model contained only land boundaries. Land surface level was set at 5m AHD. The
water surface elevation was set at 0m AHD.
Porosity Layer
A porosity layer was established for each simulation to account for the effects of wave
dissipation upon structures with sloping banks. The layer contained porosity values of 1 for
the open water, 5 for land values, and a 6m thick buffer of 0.7 around Schnapper Point and
the rock protection on the landward end of the harbour area.
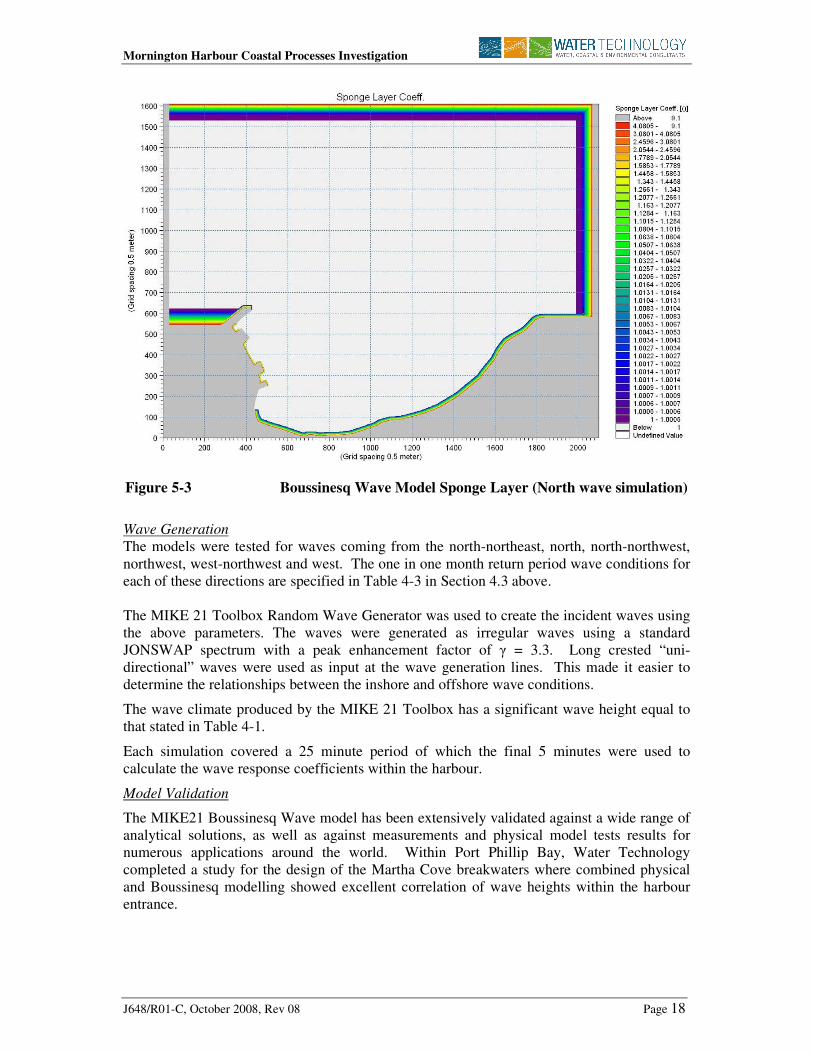
Sponge Layer
A sponge layer was used in the model to represent the dissipative effect of waves breaking on
the beach. Sponge layers were also added along the northern, eastern and southern boundaries
to allow wave energy to radiate out of the model domain without reflection.
The sponge layer along the boundaries was 80 grid cells thick, whilst along the beach the
sponge layer is only 5 grid cells wide as the model reduces wave energy due to wave breaking
in shallower waters and little wave energy is required to be dissipated at the land-water
interface. The sponge layer for the north wave simulation can be seen in Figure 5-3 below.
Mornington Harbour Coastal Processes Investigation
J648/R01-C, October 2008, Rev 08 Page 18
Figure 5-3 Boussinesq Wave Model Sponge Layer (North wave simulation)
Wave Generation
The models were tested for waves coming from the north-northeast, north, north-northwest,
northwest, west-northwest and west. The one in one month return period wave conditions for
each of these directions are specified in Table 4-3 in Section 4.3 above.
The MIKE 21 Toolbox Random Wave Generator was used to create the incident waves using
the above parameters. The waves were generated as irregular waves using a standard
JONSWAP spectrum with a peak enhancement factor of γ = 3.3. Long crested “uni-
directional” waves were used as input at the wave generation lines. This made it easier to
determine the relationships between the inshore and offshore wave conditions.
The wave climate produced by the MIKE 21 Toolbox has a significant wave height equal to
that stated in Table 4-1.
Each simulation covered a 25 minute period of which the final 5 minutes were used to
calculate the wave response coefficients within the harbour.
Model Validation
The MIKE21 Boussinesq Wave model has been extensively validated against a wide range of
analytical solutions, as well as against measurements and physical model tests results for
numerous applications around the world. Within Port Phillip Bay, Water Technology
completed a study for the design of the Martha Cove breakwaters where combined physical
and Boussinesq modelling showed excellent correlation of wave heights within the harbour
entrance.

Mornington Harbour Coastal Processes Investigation
J648/R01-C, October 2008, Rev 08 Page 19
5.2 Existing Wave Climate
Resulting wave properties from the Boussinesq modelling were used to create “effective”
wave climates at the seaward end of 5 profiles shown in Figure 5-4. Results from the 1
month ARI model simulations were extracted along each profile at a depth of 2m. This area
represents the beginning of the wave breaker zone.
The wave conditions for each modelled direction at the 2m depth mark were transformed to a
deep water equivalent offshore wave using linear refraction and shoaling coefficients. This
was done assuming the beach had long straight parallel depth contours. The difference
between the modelled wave transformations and the linear refraction and shoaling
transformations was then used to provide an estimate of the effects of diffraction at the start of
the breaker zone.
The wave time series established in Section 4.3 was broken down into a matrix which
described the proportion of time a wave height with a particular period occurred. Wave
heights were broken down into 0.1m bands and wave periods were separated into 0.5 second
bands.
Equivalent offshore waves were then derived for the different wave direction and period
bands using the results of the one month return period Boussinesq model results as a guide to
quantifying the effects of diffraction. Additional changes in wave height and direction due to
variations in wave shoaling and refraction due to changes in the incident wave period and
direction were then calculated using linear wave theory and Snell’s Law.
An equivalent wave height, direction and period wave climate could be then calculated for use
at the offshore offends of the beach profiles as shown below in Figure 5-5.
Figure 5-4 Wave profile locations

Mornington Harbour Coastal Processes Investigation
Figure 5-5 Existing Wave Climate
5.3 Developed Wave Conditions
The developed condition was considered to consist of the harbour wavescreen and a full
length wavescreen along the existing pier. The full length pier wavescreen was considered to
be the worst case scenario (compared to the existing or partial length pier wavescreen) for the
coastal process investigations as it will have the greatest impact on wave climate within the
harbour. As discussed above, both wavescreens were assumed to be full depth structures.
5.3.1 Developed Wave Climate
Using the same approach as for the existing conditions, described above, the equivalent
offshore wave climates for each of the beach profiles under consideration were determined.
These are presented in Figure 5-6 and show a significant reduction in the wave climate at the
western end of the beach.
At Profile 1, the wave action has become almost non-existent and wave conditions would be
expected to be calm for the vast majority of the time. At Profile 2, the wave action is
significantly attenuated, there are a greater percentage of calms, and there is now no wave
action from the north, or west of north. At Profile 3 the degree of attenuation is somewhat
N
Calm70.62 %
10 %
N
Calm64.94 %
10 %
N
Calm62.38 %
10 %
N
Calm63.25 %
10 %
N
Calm61.36 %
10 %
Wave height (m)
Above 1.21 - 1.2
0.8 - 1
0.6 - 0.80.4 - 0.60.2 - 0.4
0.1 - 0.2Below 0.1
Profile 1
Profile 2 Profile 3
Profile 4 Profile 5

Mornington Harbour Coastal Processes Investigation
less, but there is a greater incidence of calms relative to existing conditions, and there is no
wave action from west of north. At Profile 4, the wave climate is less affected, however,
there is a slightly higher incidence of calms, and the main direction of in-coming waves has
been rotated slightly from northwest to north-northwest. At Profile 5 the wave climate is only
slightly affected by the presence of the wavescreens.
Figure 5-6 Developed Wave Climate
N
Calm99.93 %
2 %
N
Calm92.12 %
10 %
N
Calm74.81 %
10 %
N
Calm67.34 %
10 %
N
Calm62.93 %
10 %
Wave height (m)
Above 1.2
1 - 1.2
0.8 - 1
0.6 - 0.8
0.4 - 0.6
0.2 - 0.4
0.1 - 0.2
Below 0.1
Profile 1
Profile 2
Profile 3
Profile 4
Profile 5
Mornington Harbour Coastal Processes Investigation
J648/R01-C, October 2008, Rev 08 Page 22
6 COASTAL PROCESSES
6.1 Regional Geomorphology
The coastal alignment of the Mornington Peninsula between Frankston and Mt Martha is
parallel to the Selwyn Fault which bounds the western side of the Mornington Plateau.
The coastal slopes in the region are related to lithology and rock structures, with resistant
units of granite and ferruginous sandstone forming headlands interspaced with weathered and
poorly consolidated beds which have been eroded to form steep and unstable cliffs along the
shore.
Schnapper Point, on the western extent of Mornington Harbour, is a prominent headland of
red-brown ferruginous sandstone with a boulder and rough platform shoreline. The point is
comprised of sediments from the Baxter Formation which are variable in composition -
dominated by iron-stained coarse to medium-grained cross-bedded, there are mottled sands
with thin finely-laminated clay and fine sand and occasional gravel beds which dip gently to
the south. The gravel beds are occasionally iron-cemented and form angular blocks in the
intertidal shore platforms in front of the cliffs and bluffs. In this respect, the geology is
distinctly different in origin and structure from the volcanic and granite rocks elsewhere on
the Mornington Peninsula.
To the south of Mornington Harbour, Linley Point provides protection from southerly weather
at Fishermans beach, whilst Royal Beach on the south side of Schnapper Point is a small
sandy beach backed by 15 to 20m high sandstone cliffs, protected from the northerly weather
by Schnapper Point.
To the east of Mornington Harbour, Tanti Point (also known as Red Bluff) is surrounded by a
broad rocky reef which separates the mouth of the Tanti Creek and Mills Beach from the
harbour area.
Schnapper Point marks a local change in coastal orientation from north-south to east-west for
a short distance east of the point and the northerly trend continues north of Tanti Point.
6.2 Regional Coastal Processes
The regional coastal processes are dominated by wave conditions, sediment size and local
geography. The Mornington area from Mt Eliza in the north to Mt Martha in the south is
geographically different to the surrounding areas, as shown in Figure 6-1. To the north,
Frankston is the southern boundary of a long, uninterrupted lowland area with a long sandy
beach extending to Mentone. To the south, there is a similar low sandy beach extending
westward from Safety Beach to Blairgowrie.
The Mornington area itself is part of a raised rocky area, consisting of sandstone and clay
cliffs, opposed to the siliceous and calcareous sands found to the north and south.
The long sandy beaches to the north and south of Mornington have a different sediment
transport system, with sediment able to travel uninterrupted for kilometres under wave and
current movements. The beaches in the Mornington area however, consist more of a series of
“closed” cell systems where rock and clay headlands and outcrops prevent significant
amounts of sediment from moving more than a few 100m in any direction.
Sediments within the Mothers, Scout and Shire Hall Beach system are more than likely to
have been supplied by the erosion of the coastal cliffs backing the beaches rather than
transport from another part of the coast, with the exception of a small amount of supply from