morning insight - 6 may 2016 - · pdf filehdfc, has picked banks to ... morning insight may 6,...
TRANSCRIPT

MAY 6, 2016
Economy News RBI has proposed granting on-tap universal banking licences to
individuals, groups or entities and companies. According to the draftguidelines, at least 60 per cent of a group's income should come fromfinancial services which will effectively rule out entry for business houseslike Reliance, Tata and Birla, which had ambitions of floating universalbanks. (BS)
The Lok Sabha has approved a Bill to overhaul century-old laws thatregulate insolvency. The proposed Insolvency and Bankruptcy Code aimsto slash the time it takes to wind up a company or recover dues from adefaulter. (BS)
Domestic air traffic in India grew 27.4 per cent in March, about six timeshigher than in the US, the second fastest growing market, according tothe International Air Transport Association (IATA). India outperformed allother global markets because of a combination of increased capacity andlow fares. (BS)
Dedicated Freight Corridor Corporation will award contracts worth Rs 140bn in the current financial year (2016-17) in a bid to quickly wrap up workand meet the 2019 deadline for commissioning the Rs 820 bn project. (BS)
Corporate News DLF is planning to bring its mall assets under separate special purpose
vehicles so that it can sell stakes in them and convert them into real estateinvestment trusts in the future. The company could raise as much as $1billion through this route, a executive aware of the plan said. (BS)
NMDC has cut iron ore prices of fines (with low Fe content) 11 per centfor May to align its prices with global markets. The company has also cuthigh-grade iron ore (lumps) prices by four per cent to encourage domesticsteel mills to procure the raw material from it. (BS)
According to statistics of the stock exchanges, pharmaceutical firm, Lupinspent the most in R&D as percentage of its net sales (8.9 per cent), TataMotors spent the maximum in value terms (Rs 22 bn) in the financial year2015. (BS)
Idea Cellular, the third largest telecom company in terms of subscribers,has announced a partnership with internet giant Google to offer carrierbilling services for its users while purchasing apps on Google Play. (BS)
Bharti Airtel has entered into an agreement with Helios Towers Africa(HTA) for divestment of about 950 towers in the Democratic Republic ofCongo (DRC). The deal will help Airtel deleverage through debt reductionand reduced capital expenditure, though the size was not disclosed. (BS)
HDFC, has picked banks to arrange an IPO of its life insurance jointventure that could raise as much as $400 million (around Rs 26.6 bn),people with knowledge of the matter said. HDFC Standard Life maycompete for investors with ICICI Prudential Life Insurance Co that is alsopreparing an IPO. (BS)
Reliance Defence has received 16 licences to manufacture an array ofhardware ranging from small arms, heavy weapons, ammunition andexplosives to electronic warfare systems, missiles, unmanned vehicles andlaser systems for all defence platforms. (BL)
SKS Microfinance aims 45% growth in AUM to Rs. 110 bn at the end ofFY17. The company says broadening of borrowers' base and cross-sellingof products paid off in boosting earnings which jumped over two-fold toalmost Rs. 850 mn in Q4FY16. (BL)
Raymond is reducing its capital expenditure from Rs. 3 bn in FY 2016 toRs. 2.5 bn this fiscal. The bulk of its capital expenditure last year wastowards capacity expansion, renovation of stores and capital machinery.The textile major is seeking better margins and returns on capital nextyear. (BL)
Equity% Chg
5 May 16 1 Day 1 Mth 3 Mths
Indian IndicesSENSEX Index 25,262 0.6 1.5 2.6NIFTY Index 7,736 0.4 1.6 3.3BANKEX Index 18,510 0.0 4.1 7.8SPBSITIP Index 11,126 0.2 (1.4) (0.6)BSETCG INDEX 13,223 1.6 3.1 7.2BSEOIL INDEX 9,174 (0.2) 1.3 3.1CNXMcap Index 12,965 0.0 1.6 4.7SPBSSIP Index 10,921 (0.0) 2.6 3.3
World IndicesDow Jones 17,661 0.1 (0.3) 9.0Nasdaq 4,717 (0.2) (4.1) 8.1FTSE 6,117 0.1 (0.7) 4.6NIKKEI 16,147 (3.1) (0.8) (6.7)HANGSENG 20,450 (0.4) 0.0 4.8
Value traded (Rs cr)5 May 16 % Chg - Day
Cash BSE 2,194 (6.8)Cash NSE 16,299 1.7Derivatives 197,408 2.1
Net inflows (Rs cr)4 May 16 % Chg MTD YTD
FII (31) (96) (430) 11,361Mutual Fund 144 75 241 2,837
FII open interest (Rs cr)4 May 16 % Chg
FII Index Futures 13,721 (5.8)FII Index Options 56,239 7.8FII Stock Futures 46,599 1.2FII Stock Options 2,563 9.9
Advances / Declines (BSE)5 May 16 A B T Total % total
Advances 126 554 24 704 47Declines 166 571 27 764 50Unchanged 7 34 4 45 3
Commodity % Chg
5 May 16 1 Day 1 Mth 3 Mths
Crude (US$/BBL) 44.1 (0.4) 16.9 42.9Gold (US$/OZ) 1,276.7 (0.1) 4.7 10.6Silver (US$/OZ) 17.4 0.4 15.5 17.5
Debt / forex market5 May 16 1 Day 1 Mth 3 Mths
10 yr G-Sec yield % 7.4 7.4 7.5 7.8Re/US$ 66.6 66.6 66.5 67.7
Sensex
Source: ET = Economic Times, BS = Business Standard, FE = Financial Express,BL = Business Line, ToI: Times of India, BSE = Bombay Stock Exchange
22700
24700
26700
28700
30700
May-15 Sep-15 Jan-16 May-16

Kotak Securities - Private Client Research Please see the disclaimer on the last page For Private Circulation 2
MORNING INSIGHT May 6, 2016
Kotak Securities Limited has two independent equity research groups: Institutional Equities and Private Client Group. This report hasbeen prepared by the Private Client Group. The views and opinions expressed in this document may or may not match or may be contrarywith the views, estimates, rating, target price of the Institutional Equities Research Group of Kotak Securities Limited.
CARBORUNDUM UNIVERSAL LTD (CUMI)PRICE: RS.202 RECOMMENDATION: ACCUMULATETARGET PRICE: RS.215 FY18E P/E: 15.1X
CUMI Q4FY16 result were above our estimates; operating marginexpanded mainly on 1) higher volumes in domestic market driven bymarket share gain in abrasives segment and 2) loss curtailment in overseassubsidiaries driven by restructuring initiatives at Thukela and Foskor.Russian business continues to recover in constant currency terms.
Restructuring savings are fully built in margins; revenues to be driven byconsumables in near term while project part of business is yet to recover.We roll forward our valuation on FY18 projected earnings (value CUMI at16x FY18 earnings) and maintain 'ACCUMULATE' with a revised targetprice of Rs 215 (Rs 193 earlier).
Consolidated Result
(Rs mn) Q4FY16 Q4FY15 YoY (%) Q3FY16 QoQ (%)
Income from Operations 5351 4771 12.2 5325 0.5
Decrease/ (Increase) in stock 21 271 (34)
Material consumed 1565 1206 29.8 1643 (4.7)
Purchase of traded goods 364 260 305
Employee expenses 635 604 5.2 691 (8.1)
Power and fuel 547 604 (9.5) 627 (12.8)
Other expenses 1290 1065 1333
Total Expenses 4422 4010 10.3 4566 (3.2)
EBITDA 929 761 22.2 759 22.4
Other income 72 84 (13.4) 28 163.3
Depreciation 235 230 2.2 241 (2.3)
EBIT 767 614 24.8 546 40.4
Finance cost 52 55 57
Exceptional Items 0 565 0
Foreign exchange difference exp. (44) (36) 42
PBT 670 1089 (38.4) 532 26.0
Total tax 237 383 (38.2) 199 19.1
Minority Interest (37) (45) (25)
PAT 397 661 (40.0) 308 28.8
Adjusted PAT 397 296 34.0 308 28.8
Adj. EPS (Rs) 2.1 1.6 34.0 1.6 28.8
EBITDA% 17.4 15.9 14.3
Tax Rate (%) 35.3 35.2 37.3
Source: Company
Subsidiaries Result
(Rs mn) Q4FY16 Q4FY15 YoY (%) Q3FY16 QoQ (%)
Income from Operations 1856 1780 4.3 1999 (7.1)
EBITDA 377 415 (9.0) 253 48.9
PAT 105 8 83 -
EBITDA% 20.3 23.3 12.7
Source: Kotak Securities - Private Client Research
RESULT UPDATE
Ruchir [email protected]+91 22 6218 6431
Summary table
(Rs mn) FY16 FY17E FY18E
Sales 20,843 23,681 27,416Growth (%) 1.7 13.0 15.8EBITDA 3,279 3,907 4,798EBITDA margin (%) 15.7 16.5 17.5PBT 2439 2851 3737Net profit 1,391 1,853 2,504EPS (Rs) 8.2 9.9 13.4Growth (%) 11.7 20.0 35.1CEPS (Rs) 13.3 15.7 19.4BV (Rs/share) 63.3 69.6 78.4DPS (Rs) 2.1 2.6 3.6ROE (%) 13.6 14.9 18.1ROCE (%) 9.5 11.5 14.5Net cash (debt) (1,391) (1,302) (914)NW Capital (Days) 86.6 94.0 93.3EV/Sales (x) 1.8 1.6 1.4EV/EBITDA (x) 12.2 10.2 8.3P/E (x) 24.5 20.4 15.1P/Cash Earnings (x) 15.2 12.9 10.4P/BV (x) 3.2 2.9 2.6
Source: Company, Kotak Securities - Pri-vate Client Research
Kotak Securities - Private Client Research Please see the disclaimer on the last page For Private Circulation 3
MORNING INSIGHT May 6, 2016
Result Highlights
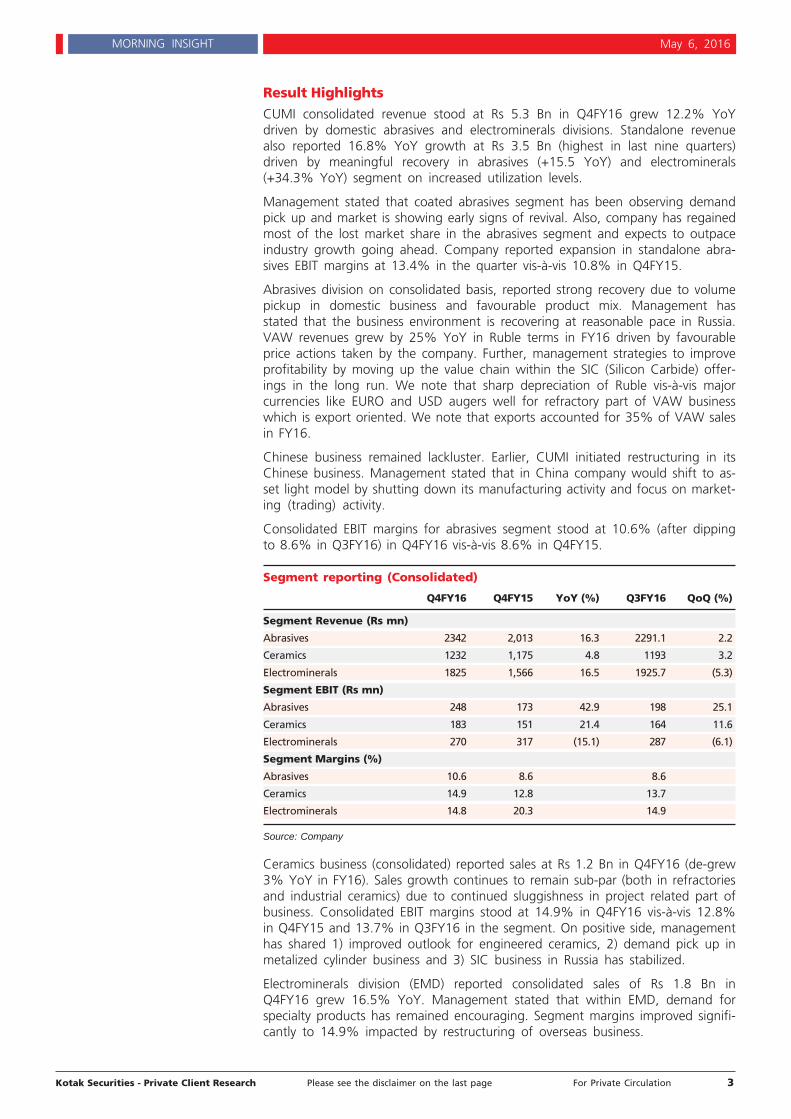
CUMI consolidated revenue stood at Rs 5.3 Bn in Q4FY16 grew 12.2% YoYdriven by domestic abrasives and electrominerals divisions. Standalone revenuealso reported 16.8% YoY growth at Rs 3.5 Bn (highest in last nine quarters)driven by meaningful recovery in abrasives (+15.5 YoY) and electrominerals(+34.3% YoY) segment on increased utilization levels.
Management stated that coated abrasives segment has been observing demandpick up and market is showing early signs of revival. Also, company has regainedmost of the lost market share in the abrasives segment and expects to outpaceindustry growth going ahead. Company reported expansion in standalone abra-sives EBIT margins at 13.4% in the quarter vis-à-vis 10.8% in Q4FY15.
Abrasives division on consolidated basis, reported strong recovery due to volumepickup in domestic business and favourable product mix. Management hasstated that the business environment is recovering at reasonable pace in Russia.VAW revenues grew by 25% YoY in Ruble terms in FY16 driven by favourableprice actions taken by the company. Further, management strategies to improveprofitability by moving up the value chain within the SIC (Silicon Carbide) offer-ings in the long run. We note that sharp depreciation of Ruble vis-à-vis majorcurrencies like EURO and USD augers well for refractory part of VAW businesswhich is export oriented. We note that exports accounted for 35% of VAW salesin FY16.
Chinese business remained lackluster. Earlier, CUMI initiated restructuring in itsChinese business. Management stated that in China company would shift to as-set light model by shutting down its manufacturing activity and focus on market-ing (trading) activity.
Consolidated EBIT margins for abrasives segment stood at 10.6% (after dippingto 8.6% in Q3FY16) in Q4FY16 vis-à-vis 8.6% in Q4FY15.
Segment reporting (Consolidated)
Q4FY16 Q4FY15 YoY (%) Q3FY16 QoQ (%)
Segment Revenue (Rs mn)
Abrasives 2342 2,013 16.3 2291.1 2.2
Ceramics 1232 1,175 4.8 1193 3.2
Electrominerals 1825 1,566 16.5 1925.7 (5.3)
Segment EBIT (Rs mn)
Abrasives 248 173 42.9 198 25.1
Ceramics 183 151 21.4 164 11.6
Electrominerals 270 317 (15.1) 287 (6.1)
Segment Margins (%)
Abrasives 10.6 8.6 8.6
Ceramics 14.9 12.8 13.7
Electrominerals 14.8 20.3 14.9
Source: Company
Ceramics business (consolidated) reported sales at Rs 1.2 Bn in Q4FY16 (de-grew3% YoY in FY16). Sales growth continues to remain sub-par (both in refractoriesand industrial ceramics) due to continued sluggishness in project related part ofbusiness. Consolidated EBIT margins stood at 14.9% in Q4FY16 vis-à-vis 12.8%in Q4FY15 and 13.7% in Q3FY16 in the segment. On positive side, managementhas shared 1) improved outlook for engineered ceramics, 2) demand pick up inmetalized cylinder business and 3) SIC business in Russia has stabilized.
Electrominerals division (EMD) reported consolidated sales of Rs 1.8 Bn inQ4FY16 grew 16.5% YoY. Management stated that within EMD, demand forspecialty products has remained encouraging. Segment margins improved signifi-cantly to 14.9% impacted by restructuring of overseas business.

Kotak Securities - Private Client Research Please see the disclaimer on the last page For Private Circulation 4
MORNING INSIGHT May 6, 2016
Management has stated that the restructuring of Thukela Refractories andFoskor is moving on track (details highlighted below) and is expected to finish asper schedule. We believe that the benefits from restructuring exercise shouldcapture fully from 4QFY17 onwards.
Consolidated EBITDA margins expanded to 17.4% in the quarter from 15.9% inQ4FY15 on 1) cost savings in overseas subsidiaries 2) reduced power/fuel cost(fell 9.5% YoY) on back of fall in oil price. We believe that current margin fac-tors in savings from normalization of losses in South African business.
Adjusted consolidated PAT at Rs 397 mn in Q4FY16 vis-à-vis Rs 296 mn inQ4FY15 led by higher operating margins aided by market share gain in domesticabrasives market, growth in standalone EMD business and loss minimization inThukela and Foskor. We highlight that in Q4FY15, CUMI reported an exceptionalgain of Rs 565 mn (against net of sale of land and impairment of assets).
Management has maintained that company has fully realized cost savings fromoverseas business restructuring and future growth would be driven by demandpick up across key product categories. We believe that full benefits from shiftingof manufacturing base to India should start flowing through FY17/FY18.
Plant re-location progressing as per schedule; South Africa busi-ness restructuring could increase profitability over 2HFY17/FY18
In FY15, CUMI had initiated restructuring of South Africa business, viz. Thukelaand Foskor. Company has halted production from its 22,000 tons capacity atThukela where it has been operating at low utilization levels given global slow-down in glass refractory industry
Further company is planning to transfer Thukela's refractories plant to Jabalpurto address local market. We note that there has been a constant decline in de-mand in South Africa (end users are mainly steel plants) and company opinesthat shifting of this plant could generate value in the long term. Managementalso stated that by shifting production to India, company aims to achieve consis-tency in production as technical manpower is available more readily in India.CUMI has failed to commission core team at Thukela. Company has maintainedthat relocation of this plant could result in sales of close to Rs 150 mn initiallywith one time relocation expenditure of Rs 80 mn.
Overseas business restructuring also includes shifting of Thukela's fusion facili-ties to Cochin. This is likely to come in phases spread over Q4FY16-2HFY17. Thisplant upon commissioning would manufacture value-added alumina products butroll out would be gradual. CUMI is likely to incur nearly Rs 250 mn in the Cochinplant which includes cost of relocation of Thukela fusion facility.
Bubble Zirconia (this caters to very high end industries, mostly non-cyclical likecolour pigment, nuclear industry etc) plant would likely get operational in3QFY17 in Cochin. Company aims to use this facility to cater to high end exportsdemand while taking advantage of low cost of production in India. CUMI wouldentail a total investment of Rs 550 mn in this facility over the next few quarters.
We believe that CUMI's consolidated operating margins are likely to increasesubstantially through FY17E and FY18E on back of restructuring in overseas sub-sidiaries margin profile.

Kotak Securities - Private Client Research Please see the disclaimer on the last page For Private Circulation 5
MORNING INSIGHT May 6, 2016
Revenue growth to improve over FY17/FY18; operating marginslikely to improve driven by operating leverage
We project 14.7% CAGR between FY16-18 in consolidated revenues fromRs.20.8 Bn in FY16 to Rs 27.4 Bn in FY18E on back of 1) recovery in demand forabrasives in the domestic/international market, 2) pick up in international subsid-iaries business and 3) relocated facilities achieving scale. Management hasguided for achieving 2x GDP growth in domestic business over next two years.
We expect that the company is likely to maintain its current revenue mix withabrasives division contributing to nearly 40%, industrial ceramics 25% andelectro minerals 30% of the revenue pie.
At consolidated level, management stated that operating margins would normal-ize at current levels of 16-17% and further improvement (through FY17-FY18)would be a function of 1) increased utilization levels across currently functioningand relocated factories (currently CUMI is operating at close to 75% of averagecapacity utilization level) and 2) improved demand for specialized products. Webuild EBITDA margin at 16.5% and 17.5% in FY17E and FY18E respectively.
EBITDA trend
Source: Company, Kotak Securities - Private Client Research
We expect CUMI to report net profit growth at 34.1% CAGR between FY16 andFY18 resulting an EPS of Rs 9.9 and Rs 13.4 in FY17E and FY18E respectively. Atthe end of FY16, company reported net debt at Rs 1.3 Bn (implying D/E of 0.2)against Rs 1.7 Bn in FY15. CUMI incurred a consolidated capex of Rs 1.8 Bn inFY16.
Valuation and RecommendationAt current price of Rs 202, CUMI stock is trading at 15.1x P/E and 8.3x EV/EBITDA on FY18 earnings.
We roll forward our valuation on FY18 projected earnings (value CUMI at 16xFY18 earnings) and maintain 'ACCUMULATE' with a revised target price of Rs215 (Rs 193 earlier).
5.0%
10.0%
15.0%
20.0%
-
1.5
3.0
4.5
6.0
FY14 FY15 FY16 FY17E FY18E
EBITDA (Rs bn - LHS) EBITDA (% - RHS)
We maintain ACCUMULATErating on Carborundum
Universal Ltd with a pricetarget of Rs.215

Kotak Securities - Private Client Research Please see the disclaimer on the last page For Private Circulation 6
MORNING INSIGHT May 6, 2016
Kotak Securities Limited has two independent equity research groups: Institutional Equities and Private Client Group. This report hasbeen prepared by the Private Client Group. The views and opinions expressed in this document may or may not match or may be contrarywith the views, estimates, rating, target price of the Institutional Equities Research Group of Kotak Securities Limited.
RESULT UPDATE
Arun [email protected]
+91 22 6218 6443
HERO MOTOCORP (HMC)PRICE: RS.2894 RECOMMENDATION: ACCUMULATETARGET PRICE: RS.3134 FY18E P/E: 15.2X
HMC's 4QFY16 results came in line with estimates. Revenues grew by 11%YoY driven by 10% sales volume increase. Led by gross margin expansionEBITDA margin improved YoY to 15.7%. Adjusted PAT grew by 39% toRs8.14bn, in line with our estimate of Rs8.07bn. HMC's sales volume in thepast three months has been strong supported by certain festivals andpreponement of marriage season. Forecast of good monsoons augurs wellfor HMC. On expectations of good monsoons, we expect HMC's volumesover FY16-FY18E to grow by 10% CAGR, much higher than the growthwitnessed in the past 4 years. We introduce FY18 estimates and base ourtarget price on FY18 expected earnings. Due to recent run-up in the stockprice, we change our rating on the stock to ACCUMULATE (earlier BUY)with revised price target of Rs3,134 (earlier Rs2,864). We have valued thestock at 16.5x on FY18E earnings.
Quarterly performance
(Rs mn) 4QFY16 4QFY15 YoY (%) 3QFY16 QoQ (%)
Revenues 75,122 67,939 10.6 72,948 3.0
Total expenditure 63,364 59,555 6.4 61,549 2.9
RM consumed 49,549 47,696 3.9 48,833 1.5
Employee cost 3,509 3,040 15.4 3,445 1.8
Other expenses 10,306 8,819 16.9 9,270 11.2
EBITDA 11,758 8,384 40.2 11,399 3.1
EBITDA margin (%) 15.7 12.3 - 15.6 -
Depreciation 1,155 897 28.6 1,139 1.3
Interest cost 5 8 (29.3) 6 (3.6)
Other Income 1,024 929 10.3 842 21.7
Exceptional item (1,550) - -
PBT 11,623 6,857 69.5 11,096 4.7
PBT margins (%) 15.5 10.1 15.2
Tax 3,481 2,092 66.4 3,138 10.9
Tax rate (%) 30.0 30.5 - 28.3 -
Reported PAT 8,142 4,765 70.9 7,958 2.3
PAT margins (%) 10.8 7.0 - 10.9 -
Reported EPS (Rs) 40.8 23.9 70.9 39.9 2.3
Volumes (nos) 1,721,240 1,575,501 9.3 1,690,354 1.8
Net Realization (Rs) 42,906 42,496 1.0 42,442 1.1
RM cost per vehicle (Rs) 28,787 30,273 (4.9) 28,889 (0.4)
Source: Company
Result Highlights
Revenues for the quarter came in at Rs75bn, 11% higher over 4QFY15 rev-enues of Rs68bn. Volumes in 4QFY16 was up by 9% YoY and average sellingprice (ASP) moved up by 1%. ASP increase was due to increased spare partsales.
On the back of fall in commodity prices and benefits of LEAP program in thepast one year, HMC reported gross margin expansion of 415bps YoY from28.8% to 32.9%. Sequentially gross margin improved by 98bps.
Summary table
(Rs mn) FY16 FY17E FY18E
Sales 285,993 319,836 352,674Growth (%) 3.7 11.8 10.3EBITDA 44,470 47,618 52,528EBITDA margin (%) 15.5 14.9 14.9PBT 43,946 47,348 52,675Net profit 31,324 34,090 37,926EPS (Rs) 156.9 170.7 189.9Growth (%) 31.3 8.8 11.3CEPS (Rs) 179.0 195.6 217.5BV (Rs/share) 397.9 460.2 542.1Dividend per share (Rs) 72 80 90ROE (%) 43.2 39.8 37.9ROCE (%) 60.7 55.3 52.7Net cash (debt) 33,784 41,560 56,647NW Capital (Days) (5.8) (7.4) (6.4)P/E (x) 18.4 17.0 15.2P/BV (x) 7.3 6.3 5.3EV/Sales (x) 1.9 1.7 1.5EV/EBITDA (x) 12.2 11.3 9.9
Source: Company, Kotak Securities - Pri-vate Client Research

Kotak Securities - Private Client Research Please see the disclaimer on the last page For Private Circulation 7
MORNING INSIGHT May 6, 2016
Employee cost during the quarter increased significantly. Even other ex-panses saw sharp growth YoY and QoQ,. Management indicated that higherR&D charge during the quarter led to increased employee/other cost. We be-lieve that auto expo related expenses too contributed towards increasedother expenses.
EBITDA margin expanded 331bps YoY to 15.7%, completely driven by grossmargin increase. Over 3QFY16, gross margin were almost unchanged.
Depreciation charges were sharply higher YoY due to start of Neemranaplant.
Company reported PAT of Rs8.14bn, inline with our expectation of Rs8.07bn.Adjusted PAT was up by 39% YoY.
Conference Call Highlights
Management expects that domestic two-wheeler volumes to grow in low tomid-single digit in 1HFY17 for the company and industry. Depending uponmonsoon, growth in 2HFY17 is likely to be better than 1HFY17. Scooters likecontinue to outperform motorcycle growth.
In the past two months robust volume growth has been on the back of festi-val season and preponement of marriage season. Management said that de-mand in North and East regions is better, but weak in Central and West re-gions. In FY16, urban demand growth was 5-7%, outperforming rural de-mand growth of 1-2%.
HMC's current scooter capacity is ~100,000 units per month and the samewill increased to 125,000 units per month during the current month. HMC'sretail market share stands at 18-19%.
Company's current production capacity is 8.2mn units per annum and will beadd another 750,000 units (Gujarat plant) in later half of 2QFY17. HMC'scapex plans for FY17 stands at Rs11-13bn. Like the Rajasthan plant, HMC'sGujarat plant will also enjoy VAT benefit for within state sales (maximumbenefit will be equal to investment made) and is likely to last seven years.
Spare part sales grew by 16% in FY16 and company expects growth rate of14-17% in FY17.
Lower dependence on Haridwar plant will likely increase effective tax rategoing ahead. Haridwar plant benefit will end in FY18. Company expects100bps impact of this on the margins.
Under the LEAP program, company added Rs2.78bn (~90bps) to the margins.In FY17, the company aims at adding another 90bps to margins under thisprogram.
HMC's import content is 14% of sales of which 5% is direct and 9% is indi-rect exposure. Of the 9% indirect exposure, 25-30% is JPY denominated.
Management indicated that they would strive for 14-15% EBITDA margin.Management feels that the commodity cycle has bottomed. Impact of recentincrease in steel price will likely come from 2QFY17. R&D expense (revenue)is likely to increase by 30bps in FY17.
Company paid royalty of Rs800mn in FY16 as against Rs1,200mn paid inFY15.
Dealer inventory is around 5-5.5 weeks. HMC took a price hike of Rs200-675in May 2016.
For HMC, 25-26% sales are financed. Hero FinCorp, in which HMC hold 48%stake, financed 470,000 vehicles in FY16 and FY17 target stands at 650,000-700,000 units.

Kotak Securities - Private Client Research Please see the disclaimer on the last page For Private Circulation 8
MORNING INSIGHT May 6, 2016
Outlook and Valuation
As against 17% CAGR volume growth between FY08-FY12, HMC's volumegrowth slowed down to 2% CAGR between FY12-FY16. Slowdown in ruraldemand was one of the prime reasons for HMC's volume slowdown.
Forecast of good monsoon has come as a significant positive for rural de-mand. In our view, HMC is the prime beneficiary of recovery of rural de-mand. Further seventh commission payout will likely provide additional boostto two wheeler demand. We have factored in 10% CAGR volume growth forHMC over FY16-FY18E.
Impact of increase in commodity price, rise in R&D expense and marketingcost will be more than the 90bps savings expected under LEAP program. Weaccordingly factor in EBITDA margin of 14.9% for FY17/FY18 as against15.7% reported in 4QFY16.
We introduce FY18 estimates and base our target price on FY18 expectedearnings. Due to recent run-up in the stock price, we change our rating onthe stock to ACCUMULATE (earlier BUY) with revised price target of Rs3,134(earlier Rs2,864). We have valued the stock at 16.5x on FY18E earnings.
We recommendACCUMULATE on HeroMotoCorp with a price
target of Rs.3134

Kotak Securities - Private Client Research Please see the disclaimer on the last page For Private Circulation 9
MORNING INSIGHT May 6, 2016
Kotak Securities Limited has two independent equity research groups: Institutional Equities and Private Client Group. This report hasbeen prepared by the Private Client Group. The views and opinions expressed in this document may or may not match or may be contrarywith the views, estimates, rating, target price of the Institutional Equities Research Group of Kotak Securities Limited.
EICHER MOTORS LTD (EML)PRICE: RS.19,687 RECOMMENDATION: REDUCETARGET PRICE: RS.20,054 FY18E P/E: 24.2X
EML's 5QCY15 results was broadly on expected lines. Standalone businessremained robust and VECV JV performance was also strong but belowexpectations. Consolidated revenues grew by 47% YoY to Rs37.7bn.EBITDA margin expanded by 275bps YoY to 17% and net profit grew by71% YoY to Rs3.35bn. RE order book remains healthy. However withgrowing base and production constraints (in FY17), growth rates willcome down going ahead. In the CV business, we expect volume growth tocontinue over FY17/FY18, driven economic recovery. We introduce FY18estimates and roll over our target price based on FY18 estimates. At thecurrent market price, we do not see any significant upside on the stockand thereby retain our REDUCE rating with revised price target of Rs20,054(earlier Rs18,288).
Standalone Result Highlight
Quarterly performance (Standalone)
(Rs mn) 4QFY16 1QCY15 YoY (%) 4QCY15 QoQ (%)
Revenues 15,450 9,612 60.7 12,839 20.3
Total expenditure 10,829 7,100 52.5 9,170 18.1
RM consumed 8,418 5,484 53.5 6,925 21.6
Employee cost 697 506 37.7 742 (6.1)
Other expenses 1,714 1,110 54.4 1,503 14.1
EBITDA 4,620 2,512 83.9 3,668 26.0
EBITDA margin (%) 29.9 26.1 - 28.6 -
Depreciation 374 191 96.1 323 15.9
Interest cost 3 6 (50.9) 2 68.8
Other Income 807 649 24.3 209 286
PBT 5,050 2,965 70.3 3,553 42.1
PBT margins (%) 32.7 30.8 27.7
Tax 1,457 830 75.5 1,103 32.1
Tax rate (%) 28.9 28.0 - 31.0 -
Reported PAT 3,593 2,135 68.3 2,450 46.7
PAT margins (%) 23.3 22.2 - 19.1 -
Reported EPS (Rs) 132.4 78.6 68.3 90.3 46.7
Volumes (Units) 148,186 92,846 59.6 125,690 17.9
Net Realization (Rs) 103,890 103,042 0.8 101,820 2.0
RM cost per vehicle (Rs) 56,810 59,061 (3.8) 55,098 3.1
Source: Company
Standalone results for the company were robust on all fronts. Revenues camein at Rs15.5bn, 61% growth over similar quarter last year. Growth in rev-enues was completely driven by 60% increase in sales volumes. Average sell-ing price witnessed a marginal 1% increase.
Benign commodity price continued to aid gross margins. During the quartergross margins was at 45.5%, 256bps up YoY. However, sequentially grossmargin came down by 55bps due to increase in steel prices.
RESULT UPDATE
Arun [email protected]
+91 22 6218 6443
Summary table
(Rs mn) FY16E* FY17E FY18E
Sales 156,887 173,972 216,446Growth (%) 79.5 10.9 24.4EBITDA 24,472 29,933 38,605EBITDA margin (%) 15.6 17.2 17.8PBT 14,519 19,176 25,468Rep Net profit 12,779 16,796 22,015EPS (Rs) 471.5 619.7 812.2Growth (%) 107.7 31.4 31.1CEPS (Rs) 638.1 782.2 998.0BV (Rs/share) 1,278 1,785 2,481Dividend / share (Rs) 100.0 100.0 100.0ROE (%) 42.7 40.5 38.1ROCE (%) 50.3 49.3 48.3Net cash (debt) 12,153 38,010 59,483NW Capital (Days) (11) (14) (13)P/E (x) 41.8 31.8 24.2P/BV (x) 15.4 11.0 7.9EV/Sales (x) 3.3 2.8 2.2EV/EBITDA (x) 21.3 16.6 12.3
Source: Company, Kotak Securities - Pri-vate Client Research; * EML has decided tochange the financial year from "Jan-Dec" to"April- March”. Accordingly, FY16 will be 15month period.

Kotak Securities - Private Client Research Please see the disclaimer on the last page For Private Circulation 10
MORNING INSIGHT May 6, 2016
Increased operations and investment in future growth led to increase in em-ployee and other cost. Employee cost was higher by 38% YoY and other ex-penses increased by 54% YoY. During the same period volume growth was60%. Accordingly, the company derived operational leverage benefits on aYoY basis.
Increase in gross margins and operating leverage helped the company reportits highest ever EBITDA margin of 29.9%. EBITDA margins expanded by377bps YoY and 133bps QoQ.
Rise in depreciation cost is on account of capacity expansion, new productlaunch and review of estimated economic useful life of fixed assets. Otherincome was higher due to dividend from VECV.
Backed by robust topline growth and margin improvement, standalone busi-ness PAT grew by 68% YoY to Rs3,593mn.
VECV Result Highlights
Quarterly performance (VECV) - Derived
(Rs mn) 4QFY16 1QCY15 YoY (%) 4QCY15 QoQ (%)
Revenues 22,199 16,069 38.2 20,327 9.2
Total expenditure 20,421 14,921 36.9 18,825 8.5
RM consumed 15,712 11,045 42.3 14,391 9.2
Employee cost 1,576 1,347 17.0 1,535 2.7
Other expenses 3,133 2,530 23.8 2,900 8.0
EBITDA 1,779 1,148 55.0 1,502 18.4
EBITDA margin (%) 8.0 7.1 - 7.4 -
Source: Company
VECV performance came in below expectation on account of fall in ASP andlower than expected operating margin expansion.
Revenues came in at Rs22bn, 38% higher YoY but lower than expectation onaccount of decline in ASP. On a YoY basis, volumes grew 42%, but ASP wasdown by 3%. Sequentially, on a higher base, ASP dropped by 11%. ASP wasdown due to product mix change. Company sold ~6,000 units of engine blockduring the quarter.
Discounting for the company/industry continues to stay at elevated levels.
Gross margins continued to be lower YoY despite benign commodity price.Gross margins declined YoY from 31.3% to 29.2%. However on a QoQ basis,gross margins remained static.
Employee cost increased by 17% YoY and other expenses were up by 24%YoY. Rise in staff and other expenses was partly due to 42% jump in vol-umes.
Benefits of operating leverage negated gross margin contraction and led toEBITDA margin coming in at 8% as against 7.1% in corresponding period lastyear. However, EBITDA margins were below our estimates. VECV margins(excluding Polaris) was ~8.5% during the quarter.

Kotak Securities - Private Client Research Please see the disclaimer on the last page For Private Circulation 11
MORNING INSIGHT May 6, 2016
Consolidated Result Highlights
Quarterly performance (Consolidated)
(Rs mn) 4QFY16 1QCY15 YoY (%) 4QCY15 QoQ (%)
Revenues 37,649 25,680 46.6 33,166 13.5
Total expenditure 31,250 22,021 41.9 27,995 11.6
RM consumed 24,131 16,528 46.0 21,316 13.2
Employee cost 2,273 1,853 22.7 2,277 (0.2)
Other expenses 4,847 3,640 33.2 4,402 10.1
EBITDA 6,399 3,660 74.9 5,170 23.8
EBITDA margin (%) 17.0 14.3 - 15.6 -
Depreciation 1,086 767 41.5 991 9.6
Interest cost 10 12 (20.3) 22 (55.9)
Other Income 281 337 (16.6) 308 (9)
Exceptional item - -
PBT 5,585 3,217 73.6 4,465 25.1
PBT margins (%) 14.8 12.5 13.5
Tax 1,760 1,054 67.0 1,358 29.6
Tax rate (%) - -
PAT (before minority int/ass pft) 3,825 2,163 76.8 3,107 23.1
Minority Interest 480 210 128.5 399 20
Reported PAT 3,345 1,953 71.3 2,708 23.5
PAT margins (%) 8.9 7.6 8.2
Reported EPS (Rs) 123.2 72.0 71.3 99.8 23.5
Source: Company
High volume in the two wheeler and the commercial vehicle segment trans-lated into consolidated revenues growing by 47%, to Rs38bn.
On the operational front, company reported margin improvement in both thebusinesses. Consolidated EBITDA margin came in at 17% - 275bps/141bpshigher YoY/QoQ.
Buoyed by robust revenue growth and margin expansion, consolidated PATjumped by 71% YoY to Rs3.35bn, as against our estimates of Rs3.48bn.
Conference Call Highlights In the Royal Enfield (RE) business, order book remains strong with orders
more than supply. Average waiting period for high selling model is aroundthree months. Waiting period has come down due to increase in production.Same store growth for the company is ~15%. Around 10-12% of RE salesare to first time motorcycle users. Almost 30-40% of RE sales are financed.
RE is sold through 500 dealerships. Company will add another 100 dealershipsin FY17. Around 80% of the 500 dealerships have new retail identity.
On the global front, the company has expanded its footprint in the past 12-15 months. In January 2016 and February 2016, RE opened showroom in In-donesia and Thailand - both are large two wheeler markets.
Management gave production guidance of 675,000 units in FY17 and main-tained its CY18 guidance of 900,000 units. Company FY17 exit production isexpected to be ~60,000 units per month.
In 4QFY16, VECV gained market share across all segments. VECV's marketshare increased from 10.9% to 12% YoY. VECV have at 290 dealers.

Kotak Securities - Private Client Research Please see the disclaimer on the last page For Private Circulation 12
MORNING INSIGHT May 6, 2016
EML's FY17 capex plans for RE and VECV business stands at Rs6bn and Rs4bnrespectively. Capex will be on capacity addition, technical center, productdevelopment and developing marketing infrastructure.
For the Polaris JV, the company has increased its presence across 34 loca-tions in 8 states.
In Jan 2016, company took 1-1.5% and 1% average price hike for the RE andVECV business respectively.
Outlook
RE order book remains healthy. However with growing base and due to pro-duction constraints (in FY17), growth rates will come down as compared tothe growth witnessed in the past few years. We expect 29% CAGR volumegrowth over FY17/FY18.
In the CV business, we expect growth in volumes to continue over FY17/FY18, driven economic recovery.
EBITDA margins are expected to improve on the back of healthy margins inthe RE business and margin expansion at VECV.
We introduce FY18 estimates and roll over our target price based on FY18estimates. At the current market price, we do not see any significant upsideon the stock and thereby retain our REDUCE rating with revised price targetof Rs20,054 (earlier Rs18,288). We have valued the RE business at 25x onFY18 adjusted earnings (earlier 32x on FY17 adjusted EPS) and VECV businessat 13x FY18 EV/EBITDA (13x FY17 EV/EBITDA).
We retain REDUCE on EicherMotors Ltd with a price
target of Rs.20054

Kotak Securities - Private Client Research Please see the disclaimer on the last page For Private Circulation 13
MORNING INSIGHT May 6, 2016
Kotak Securities Limited has two independent equity research groups: Institutional Equities and Private Client Group. This report hasbeen prepared by the Private Client Group. The views and opinions expressed in this document may or may not match or may be contrarywith the views, estimates, rating, target price of the Institutional Equities Research Group of Kotak Securities Limited.
GE SHIPPING COMPANY (GESCO)PRICE: RS.317 RECOMMENDATION: SELLTARGET PRICE: RS.300 FY18E P/E: 5.0X
Weak shipping markets impacts performanceWeak global shipping markets (esp. bulk) and lower crude prices whichnegatively impacts the offshore segment has impacted the topline andearnings of GESCO for Q4FY16, with revenue of Rs 9.48 bn (-7.5% QoQ),Ebidta margin of 48.42 % (-520 bps QoQ) and PAT of Rs 575mn (-79%QoQ).Earnings was also impacted by impairment on assets of Rs 1455 mn andpenalty of Rs 327 mn on a cancelled contract.
Shipping and offshore markets are weak and we estimate a sustainablerecovery only after FY18E. Hence, we estimate a weak earning profile forGESCO over FY16 to FY18E. Historically, GESCO has traded in a range of 0.6to 1.0x of its NAV. To factor in weakness in the shipping markets, we arelowering the value of GESCO from 0.75x to 0.67x of its decreased NAV ofRs 450 (Q3FY16 NAV was Rs 480). Recommend SELL with a reduced TP ofRs 300 (from Rs 360).
Consolidated quarterly (Rs mn)
(Rs mn) Q4FY15 Q1FY16 Q2FY16 Q3FY16 Q4FY16
Net Sales 8,842 9,465 10,334 9,477 8,767
Growth QOQ (%) 0.7 7.0 9.2 -8.3 -7.5
Growth YOY (%) 10.7 17.1 19.1 8.0 -0.8
Direct expenses 2,564 2,063 2,006 1,944 2,025
Employee cost 1,500 1,464 1,547 1,495 1,449
Other expenses 1,225 873 894 948 1,048
Expenditure 5,289 4,400 4,447 4,387 4,522
EBIDTA 3,553 5,065 5,887 5,090 4,245
EBIDTA (%) 40.18 53.51 56.97 53.71 48.42
Depreciation 1,562 1,614 1,667 1,679 1,786
Impairment 0 0 0 162 1,455
EBIT 1,991 3,451 4,220 3,249 1,004
Interest 755 699 739 703 705
Profit from sale of ships -366 252 -153 0 2
Other income 553 551 718 476 916
PBT 1,423 3,555 4,046 3,022 1,217
Tax 50 298 217 271 315
Effective tax rate (%) 3.51 8.38 5.36 8.97 25.88
PAT 1373 3257 3829 2751 902
Exceptional 0 0 0 0 -327
PAT (after exceptions) 1,373 3,257 3,829 2,751 575
Equity 1,508 1,508 1,508 1,508 1,508
EPS (Rs) 9.1 21.6 25.4 18.2 3.8
Source: Company
RESULT UPDATE
Amit [email protected]
+91 22 6218 6439
Summary table
(Rs mn) FY16 FY17E FY18E
Sales 38,043 39,620 37,043Growth (%) 10.7 4.1 -6.5EBITDA 20,287 19,612 18,188EBITDA margin (%) 53.3 49.5 49.1PBT 11,412 11,968 10,346Net profit 10,613 11,130 9,621EPS (Rs) 70.4 73.8 63.8Growth (%) 40.3 4.9 -13.6CEPS (Rs) 115.1 119.6 110.2BV (Rs/share) 565 628 681Dividend / share (Rs) 13.5 11.0 11.0ROE (%) 12.5 11.8 9.4ROCE (%) 8.9 8.6 7.3Net cash (debt) (19,910) (21,909) (23,908)NW Capital (Days) (22.5) (21.5) (20.9)EV/EBITDA (x) 3.3 3.6 3.9P/E (x) 4.5 4.3 5.0P/Cash Earnings 2.8 2.7 2.9P/BV (x) 0.6 0.5 0.5
Source: Company, Kotak Securities - Pri-vate Client Research

Kotak Securities - Private Client Research Please see the disclaimer on the last page For Private Circulation 14
MORNING INSIGHT May 6, 2016
Key Financial highlights:
Weak global shipping markets (esp. bulk) and lower crude prices which nega-tively effects the offshore segment has impacted the topline, which was re-ported at Rs 9.48 bn (-7.5% QoQ).
Shipping reported revenue of Rs 5.5 bn (flat QoQ) and offshore segment re-ported revenue of Rs 4.2 bn ( -9%% QoQ)
Ebidta was reported at Rs 4.24 bn translating into Ebidta margin of 48.42 %(-520 bps QoQ) supported by weak bunker prices (fuel)
Company has provided for impairment of Rs 1.46 bn primarily on offshore as-sets which impacted the PAT
The company has also provided for penalty of Rs 327 mn for cancellation of ashipping contract which also impacted the PAT
Consequently PAT was reported at Rs 575mn (-79%QoQ)
Company has declared a total dividend of Rs. 13.5/- per share to the equityshareholders for FY16.
TCY earnings - weak trend across segments except tanker
TCY ($/day) Q4FY15 Q1FY16 Q2FY16 Q3FY16 Q4FY16
Crude Carrier 30,324 32,485 31,012 30,767 33,838
Product Carrier 23,034 22,402 30,128 24,092 21,613
Bulk Carrier 7,717 7,423 7,874 6,320 4,418
Source: Company
Current shape of shipping marketsThe Baltic Dry Index (BDI) is trading at its historical low (at 300) weakest since2010 primarily due to slowdown in the Chinese economy and a huge over-capac-ity in vessels. Freight rates in the bulk sector are currently so low that it fails tocover even the operating cost of running a vessel. (Without taking into accountpossible financing). On the other, with crude oil prices falling considerably, netimporting countries like China and to some extent India are importing more oilkeeping the dirty tanker/product segment in viable condition. Plus scrapping hasdecreased across segments especially in the tanker and product segment. All theabove, with continuous ordering (though at a slow rate) is keeping the freightrates under pressure.
Assets prices continue to move downWe had a close look at the recent deals in sales/purchase of assets in the ship-ping segment. The downward movement in asset prices has also impacted theNAV of shipping companies.
Asset prices across categories (for 5 year old in USD mn)
Segment Mar-16 Mar-15 Mar-14 Mar-12 Mar-11 Mar-10
Aframax 30.3 37.5 30.0 31.0 33.3 44.8
Suezmax 39.3 48.0 38.5 45.0 49.0 62.0
VLCC 52.0 74.0 59.0 58.0 57.0 89.5
Handy Size 13.0 19.5 15.0 16.0 19.0 27.0
Supramax 14.0 23.5 18.0 22.7 25.0 32.3
Panamax 16.0 23.5 18.5 23.4 26.5 39.5
Capesize 27.0 47.0 30.0 34.0 37.0 55.5
Source: Bloomberg

Kotak Securities - Private Client Research Please see the disclaimer on the last page For Private Circulation 15
MORNING INSIGHT May 6, 2016
Low Bunker prices providing some respite
With fall in crude prices, the bunker prices have come down significantly. Thefall was more significant in the last one year, and this has helped the margins ofshipping companies as bunker is forming almost 25 to 30% of the operatingcost. Going forward, we expect bunker prices to remain low for GESCO.
Bunker cost 380 centistoke
$ per tonne May 16 Aug-15 May-15 May-14 May-13 May-12 May-11
Singapore 192 214 330 590 602 625 640
Source: Bloomberg
Current shipping fleet of GESCO - 2.5 mn dwt
Segment No's Avg Average (yrs.)
Crude Carriers 8 12.2
Product Carriers 14 8.8
Gas Carrier 1 21
Tankers total 23 11
Kamsarmax 4 3.0
Supramax 5 8.4
Dry Bulk total 9 6.4
Total 32 10
Source: Company
GESCO current shipping fleet consists of 31 ships aggregating 2.40 mn dwt (In-creased from 29 ships (2.28 mn dwt) in March 2015 and from 30 ships (2.36 mnDwt) in December 2015). Company has taken advantage of the low asset pricesand has added ships in FY16.
Greatship India Limited (GIL)
Current fleet of GIL
Segment No's
350 feet Jack up 4
PSV 5
AHTS 8
MPSSV 2
ROV 6
Source: Company
Company currently has a fleet of 25 offshore assets including four 350 feet jackrig. Rigs are deployed with ONGC/Private oil explorer on long term contracts,while other assets are deployed on medium to long term contracts for day ratesvarying from $15,000 to $ 50,000 per day. Management indicated that GIL hascompleted most of its capex and future capex would be limited for the subsid-iary. Till date GESCO has made equity investment of ~Rs 18 bn in the subsidiary.GIL does not have any capex programme over FY16 to FY18E.

Kotak Securities - Private Client Research Please see the disclaimer on the last page For Private Circulation 16
MORNING INSIGHT May 6, 2016
Performance of offshore segment getting impacted due to fall incrude prices
In case of offshore segment, we estimate day rates of assets to have comedown by 10 to 25%. GESCO has placed more than 90% of its offshore assets onlong term contracts. Of which almost 25 % would come up of renewal of con-tract in FY17 and another 25% in FY18. With significant fall in crude prices, weestimate the new contracts may be signed at lower rates. Also, few assetswhich are placed in the spot market are not commanding healthy rates cur-rently. Consequently, we estimate the offshore segment to not perform wellover the next two financial years.
Business environment and sentiments to remain weak
Weak global shipping markets (esp. bulk) and lower crude prices which nega-tively effects the offshore segment are expected to keep sentiments weak andcontinue to de-rate the sector. However, we estimate GESCO to remain partiallycushioned in near term from the current weakness on the back of long termcontracts of the company, healthy BS, relationships of the company and prudentmanagement.
Healthy Balance Sheet and Dividend yield - act as valuation support
GESCO continues to have a strong balance sheet with cash balance of Rs 25 bnand investments of Rs 12 bn. Put together (cash plus investments) form morethan 25% of the BS. Also dividend yield of the company is on the healthy side. InFY16 company had announced a total dividend of Rs 13.5/share and Rs 11/sharein FY15.
Valuation and recommendation:
Shipping and offshore markets are weak and we estimate a sustainable recoveryonly after FY18E. Hence, we estimate a weak earning profile for GESCO overFY16 to FY18E. Historically, GESCO has traded in a range of 0.6 to 1.0x of itsNAV. To factor in weakness in the shipping markets, we are lowering the valueof GESCO from 0.75x to 0.67x of its decreased NAV of Rs 450 (Q3FY16 NAV wasRs 480). Recommend SELL with a reduced TP of Rs 300 (from Rs 360).
We recommend SELL on GEShipping Company with a
price target of Rs.300

Kotak Securities - Private Client Research Please see the disclaimer on the last page For Private Circulation 17
MORNING INSIGHT May 6, 2016
Kotak Securities Limited has two independent equity research groups: Institutional Equities and Private Client Group. This report hasbeen prepared by the Private Client Group. The views and opinions expressed in this document may or may not match or may be contrarywith the views, estimates, rating, target price of the Institutional Equities Research Group of Kotak Securities Limited.
CASTROL INDIA LTD. (CIL)PRICE: RS.411 RECOMMENDATION: ACCUMULATETARGET PRICE: RS.457 CY17E P/E: 28.5X
Castrol's Q1CY16 reported results are well above markets and ourestimates led by impressive 9% lubricant volume growth. Castrol hasreported a PAT growth of 18% yoy and 22% qoq to Rs.1.7 bn mainly onaccount of 1). Lower raw material cost (down 5% yoy), 2). Higher autoand non-auto sales volume and 3). Lower depreciation cost (-23% yoy).With improved industrial activity the lubricant demand is expected toimprove going forward, we opine. Additionally, new product launcheswith further boost lubricant sales.
Key trigger in the short to medium term is good monsoon resulting inincreased vehicle sales and freight movement. On the basis of ourestimates, the stock at current market price of Rs.411 is fairly valued at18.1x EV/EBIDTA, 28.5x P/E and 26.2x P/BV on the basis of CY17E earnings.Based on our DCF valuation model, the target price of Castrol is Rs. 457/share (earlier Rs.455/share) and we maintain Accumulate (Buy on dips)rating on the stock.
Volume growth - Castrol's industrial segment has registered double digitvolume growth in Q1CY16 supported by new customer acquisition and in-creased business share from existing key customers. Commercial vehicle vol-ume growth has also been decent.
Earlier, the Company has launched couple of new products such as CastrolCRB Mini Truck, Castrol Vecton, Castrol MAGNATEC stop-start and CastrolActiv Scooter which has supported auto segment lubricant volume growth. Inparticular, Castrol Activ (the lead brand in the two-wheeler segment) hasmeaningfully contributed to the double digit volume growth and CastrolMAGNATEC (the flagship brand for passenger cars) has seen strong demandled by new customer activation and marketing initiatives.
CIL continues its focus on high growth personal mobility business with CastrolActiv increasing its market share and strengthening its leadership position inthe two-wheeler engine oil category. Power brands and independent work-shop channel are also performing extremely well. The contribution of pre-mium synthetic products like Castrol MAGNATEC and Castrol EDGE continueto grow.
Quarterly Result Analysis - Q1CY16
Castrol Results Mar-16 Mar-15 YoY (%) QoQ (%)
Net Sales 8,521 7,958 7.1 8.1
Incr/(Decr) in stock 78 171
Total Expenditure 6,083 6,256 (2.8) 11.2
EBIDTA 2,516 1,873 34.3 20.2
Depreciation 86 111 (22.5) (5.5)
EBIT 2,430 1,762 37.9 21.4
Other income 223 469 (52.5) (10.8)
Interest-net 4.0 3.0 33.3 100.0
PBT 2,649 2,228 18.9 17.7
Tax 925 761 21.6 9.9
PAT 1,724 1,467 17.5 22.4
Equity Capital 2,473 2,473
Basic EPS 3.49 2.97 17.5 22.5
Source: Company. Face value is Rs.5/share.
RESULT UPDATE
Sumit [email protected]+91 22 6218 6438
Summary table
(Rs mn) CY15 CY16E CY17E
Sales 32,899 33,347 34,419Growth (%) -2.8 1.4 3.2EBITDA 9,228 10,492 10,799EBITDA Margin 28.0 31.5 31.4PBT 9,509 10,516 10,800Net Profit 6,152 6,942 7,129EPS (Rs.) 11.9 14.0 14.4Growth (%) 24.3 17.5 2.7CEPS 12.7 14.9 15.4Book Value (Rs/Share) 11.6 13.6 15.7DPS (Rs.) 9.0 10.2 10.4ROE (%) 73.8 75.2 69.2ROCE (%) 73.9 75.3 69.3Net Debt / (Cash) (6,965) (6,577) (7,445)NW Capital (Days) 12.9 22.6 23.5P/E (X) 34.4 29.3 28.5P/BV (X) 35.3 30.2 26.2EV/Sales (X) 6.0 5.9 5.7EV/EBITDA (X) 21.3 18.7 18.1
Source: Company, Kotak Securities - Pri-vate Client Research

Kotak Securities - Private Client Research Please see the disclaimer on the last page For Private Circulation 18
MORNING INSIGHT May 6, 2016
Key risk remains in terms of:
Any significant rise in the crude oil price will increase the base-oil price (witha lag of six months) which can negative impact its margins.
Any significant rupee depreciation will increase the raw material cost.
Lower industrial activity can impact volume growth.
Quarterly result analysis - Q1CY16
Profitability Analysis (%) Mar-16 Mar-15 YoY (%) QoQ (%)
EBITDA Margin 29.5 23.5 6.0 3.0
EBIT Margin 28.5 22.1 6.4 3.1
Adj. PAT Margin 20.2 18.4 1.8 2.4
Other Income/PBT 8.4 21.1 (12.6) (2.7)
Tax/PBT 34.9 34.2 0.8 (2.5)
Source: Company
Operational parameters
Mar-16 Mar-15 YoY (%) QoQ (%)
Raw Materials 3,522 3,837 (8.2) 18.2
Staff costs 441 422 4.5 2.1
Purchase of Finished Goods 475 356 33.4 11.5
Advertisement Exp. 605 759 (20.3) 12.9
Carriage, Freight & Insurance (CIF) 282 250 12.8 10.6
Other Expenses 758 632 19.9 (9.8)
Total 6,083 6,256 (2.8) 11.2
Source: Company
Cost ratio analysis (% of (Net sales + Inventory)
Mar-16 Mar-15 YoY (%) QoQ (%)
RM & Service cost 41.0 47.2 (6.2) 1.6
Staff cost 5.1 5.2 (0.1) (0.6)
Purchase of FG 5.5 4.4 1.1 (0.1)
Advertisement Exp. (Net Sales) 7.1 9.5 (2.4) 0.3
Carriage, Freight & Insurance 3.3 3.1 0.2 (0.1)
Other expenses 8.81 7.77 1.0 (2.3)
Source: Company
NOTE: The lubricant business is a seasonal business and volume gets affecteddue to various seasonal factors. Hence, quarter-on-quarter result comparisonwill not give the correct picture. We have observed that for Castrol Quarter 2(April- June) and Quarter 4 (Oct-Dec) of the calendar year are generally the bestquarters.

Kotak Securities - Private Client Research Please see the disclaimer on the last page For Private Circulation 19
MORNING INSIGHT May 6, 2016
Quarterly Result Analysis -
Revenue growth: In Q1CY16, Castrol's net revenue increased 7% yoy toRs.8.5 bn (8% qoq) mainly on account of 9% volume growth. The Companywitnessed volume growth in both the segments (Auto and Industrial seg-ment).
Castrol's industrial segment has registered double digit volume growth inQ1CY16 supported by new customer acquisition and increased business sharewith key customers. Commercial vehicle volume growth has also been de-cent. Earlier, the Company has launched couple of new products such asCastrol CRB Mini Truck, Castrol Vecton, Castrol MAGNATEC stop-start andCastrol Activ Scooter which has also supported volume growth. In particular,Castrol Activ (the lead brand in the two-wheeler segment) has meaningfullycontributed to the double digit volume growth and Castrol MAGNATEC (theflagship brand for passenger cars) has also shown excellent volume growthled by new customer activation and marketing initiatives.
Raw material cost declined: In Q1CY16, raw material cost has decreased5% yoy to Rs.4 bn (17.4% qoq) mainly on account of decrease in base oilprices. Raw material cost (including purchase of finished goods) to sales ratio(%) has decreased by 578 bps yoy but up 371 bps qoq to 46.9% in Q1CY16.Raw material cost is dependent on lube oil prices and rupee movement.
Carriage, Freight & Insurance (CIF): In Q1CY16, carriage, freight & insur-ance cost has increased by 12.8% yoy and 10.6% qoq to Rs. 282 mn mainlyon account of higher lubricant sales volume. CIF is dependent on volumes ofraw material.
Advertisement expenses increased: In Q1CY16, advertisement expensehas increased 12.9% qoq but down 20% yoy to Rs.605 mn as the Companyhas under taken higher marketing initiatives, sequentially. Advertisement ex-pense to sales ratio increased 30bps qoq basis to 7.1% in Q1CY16.
Employee cost: Staff cost has increased 4.5% yoy and 2% qoq to Rs.441mn. As on 31st Dec'15, the total headcount stands at 763 only.
Other expenses: In Q1CY16, other expense has increased 19.9% yoy butdown 9.8% qoq to Rs.758 mn. Sequential decline is partly due to base effect.
Operating margin improved: Overall operating margin improved 600 bpsyoy and 300 bps qoq to 29.5% in Q1CY16. YoY improvement in margins ismainly on account of lower raw material cost and lower advertisement ex-penses. This also reflects that the Company has not passed on the full ben-efit of lower raw material cost to end consumers.
Chart showing co-relation between raw material costs and operating margins
Source: Kotak Securities - Private Client Research

Kotak Securities - Private Client Research Please see the disclaimer on the last page For Private Circulation 20
MORNING INSIGHT May 6, 2016
Depreciation: In Q1CY16, depreciation cost has decreased 23% yoy and 6%qoq to Rs. 86 mn. This has partly helped in yoy bottom line growth.
Other income: In Q1CY16, other income has decreased meaningfully 11%qoq and 53% yoy to Rs.223 mn partly due to base effect and partly due tolower interest/dividend income.
PAT: Castrol reported a PAT growth of 18% yoy and 22% qoq to Rs.1.7 bnmainly on account of 1). Lower raw material cost (down 5% yoy), 2). Higherauto and non-auto sales volume and 3). Lower depreciation cost (-23% yoy).
Castrol's adj. PAT margin has increased 180 bps yoy and 240 bps qoq to20.2% in Q1CY16 due to reasons mentioned above.
Outlook and valuation:
Earlier, Castrol has highlighted that its brand value has moved up from USD$ 1.3bn to USD$ 1.8 bn. On the basis of our estimates, the stock at current marketprice of Rs.411 is fairly valued at 18.1x EV/EBIDTA, 28.5x P/E and 26.2x P/BV onthe basis of CY17E earnings. Based on our DCF valuation model, the target priceof Castrol is Rs. 457/share (earlier Rs.455/share) and we maintain ACCUMULATE(Buy on dips) rating on the stock.
Company Background
Castrol India manufactures and markets a range of automotive and industrial lu-bricants. With the largest manufacturing and marketing network among the lu-bricant companies in India, the Company has leadership positions in most of thesegments in which it operates including passenger-car engines oils, four-strokeoils and multi-grade diesel engine oils. The three manufacturing facilities includea state-of-the-art plant in Silvassa. Customers are reached through distributors,servicing over 91,000 retail outlets.
We maintain ACCUMULATErating on Castrol India with
a price target of Rs.457

Kotak Securities - Private Client Research Please see the disclaimer on the last page For Private Circulation 21
MORNING INSIGHT May 6, 2016
Gainers & Losers Nifty Gainers & LosersPrice (Rs) chg (%) Index points Volume (mn)
Gainers
HDFC 1,163 2.9 NA 4.7
Tech Mahindra 479 2.7 NA 1.5
BHEL 123 2.5 NA 5.10
Losers
Idea Cellular 114 (5.3) NA 6.2
Adani Ports 198 (4.9) NA 17.2
Ultratech Cements 3,119 (2.0) NA 0.3
Source: Bloomberg
Bulk deals
Forthcoming events Company/MarketDate Event
6 - May Geometric, Greaves Cotton, NIIT Tech, Siemens India earnings expected
7 - May Andhra Bank, Grasim earnings expected
9 - May Hindustan Unilever earnings expected
10 - May Century Plyboard, NIIT Ltd, Zee Entertainment earnings expected
11 - May Apollo Tyre, Asian Paint, Havells India, Indian Bank earnings expected
Source: Bloomberg
Trade details of bulk deals
Date Scrip name Name of client Buy/ Quantity Avg.Sell of shares price
(Rs)
05-May ABGSHIP Ecl Finance Limited S 324,309 39.7
05-May DUNE Paresh Gangji Gala S 26,250 20.8
05-May DUNE Navalben Gangji Gala S 25,250 20.8
05-May DUNE Gangji Arjan Gala S 27,250 20.8
05-May DUNE Maheshbhai N Purabia B 42,000 20.8
05-May DUNE Kunal J Parmar B 99,000 20.8
05-May GHUSHINE Akshat Ashok Gupta B 30,000 9.2
05-May GRAVITA Albula Investment Fund Ltd S 383,795 24.5
05-May KRISHFAB Chandika Infrastructure Pvt Ltd S 19,950 26.0
05-May KRISHFAB S R Venkatesh B 22,000 26.0
05-May SUPRBPA Jayesh Mansukhlal Dawda S 30,006 31.1
05-May SYSCO Chander Mohan Bhatia B 40,000 26.3
05-May VAMA Atluri Shiva Rama Krishna H Prasad S 50,000 25.0
05-May VAMA Grandeur Products Limited B 50,000 25.0
Source: BSE
Kotak Securities - Private Client Research Please see the disclaimer on the last page For Private Circulation 22
MORNING INSIGHT May 6, 2016
RATING SCALE
Definitions of ratingsBUY – We expect the stock to deliver more than 12% returns over the next 9 months
ACCUMULATE – We expect the stock to deliver 5% - 12% returns over the next 9 months
REDUCE – We expect the stock to deliver 0% - 5% returns over the next 9 months
SELL – We expect the stock to deliver negative returns over the next 9 months
NR – Not Rated. Kotak Securities is not assigning any rating or price target to the stock. The report has been prepared for information purposesonly.
RS – Rating Suspended. Kotak Securities has suspended the investment rating and price target for this stock, either because there is not a suffi-cient fundamental basis for determining, or there are legal, regulatory or policy constraints around publishing, an investment rating or target.The previous investment rating and price target, if any, are no longer in effect for this stock and should not be relied upon.
NA – Not Available or Not Applicable. The information is not available for display or is not applicable
NM – Not Meaningful. The information is not meaningful and is therefore excluded.
NOTE – Our target prices are with a 9-month perspective. Returns stated in the rating scale are our internal benchmark.
Fundamental Research Team
Dipen ShahInformation [email protected]+91 22 6218 5409
Sanjeev ZarbadeCapital Goods, [email protected]+91 22 6218 6424
Teena VirmaniConstruction, [email protected]+91 22 6218 6432
Saday SinhaBanking, NBFC, [email protected]+91 22 6218 6437
Arun AgarwalAuto & Auto [email protected]+91 22 6218 6443
Ruchir KhareCapital Goods, [email protected]+91 22 6218 6431
Ritwik RaiFMCG, [email protected]+91 22 6218 6426
Sumit PokharnaOil and [email protected]+91 22 6218 6438
Amit AgarwalLogistics, [email protected]+91 22 6218 6439
Meeta Shetty, [email protected]+91 22 6218 6425
Jatin DamaniaMetals & [email protected]+91 22 6218 6440
Pankaj [email protected]+91 22 6218 6434
Nipun GuptaInformation [email protected]+91 22 6218 6433
Jayesh [email protected]+91 22 6218 5373
K. [email protected]+91 22 6218 6427
Technical Research Team
Shrikant [email protected] 22 6218 5408
Amol [email protected]+91 20 6620 3350
Derivatives Research TeamSahaj [email protected]+91 79 6607 2231
Rahul [email protected]+91 22 6218 5498
Malay [email protected]+91 22 6218 6420
Prashanth [email protected]+91 22 6218 5497
Kotak Securities - Private Client Research Please see the disclaimer on the last page For Private Circulation 23
MORNING INSIGHT May 6, 2016
DisclaimerKotak Securities Limited established in 1994, is a subsidiary of Kotak Mahindra Bank Limited. Kotak Securities is one of India's largest brokerage anddistribution house.Kotak Securities Limited is a corporate trading and clearing member of Bombay Stock Exchange Limited (BSE), National Stock Exchange of India Limited (NSE),Metropolitan Stock Exchange of India Limited (MSEI). Our businesses include stock broking, services rendered in connection with distribution of primarymarket issues and financial products like mutual funds and fixed deposits, depository services and Portfolio Management.Kotak Securities Limited is also a depository participant with National Securities Depository Limited (NSDL) and Central Depository Services (India) Limited(CDSL). Kotak Securities Limited is also registered with Insurance Regulatory and Development Authority as Corporate Agent for Kotak Mahindra Old MutualLife Insurance Limited and is also a Mutual Fund Advisor registered with Association of Mutual Funds in India (AMFI). We are registered as a Research Analystunder SEBI (Research Analyst) Regulations, 2014.We hereby declare that our activities were neither suspended nor we have defaulted with any stock exchange authority with whom we are registered in lastfive years. However SEBI, Exchanges and Depositories have conducted the routine inspection and based on their observations have issued advise letters orlevied minor penalty on KSL for certain operational deviations. We have not been debarred from doing business by any Stock Exchange / SEBI or any otherauthorities; nor has our certificate of registration been cancelled by SEBI at any point of time.We offer our research services to clients as well as our prospects.This document is not for public distribution and has been furnished to you solely for your information and must not be reproduced or redistributed to any otherperson. Persons into whose possession this document may come are required to observe these restrictions.This material is for the personal information of the authorized recipient, and we are not soliciting any action based upon it. This report is not to be construedas an offer to sell or the solicitation of an offer to buy any security in any jurisdiction where such an offer or solicitation would be illegal. It is for the generalinformation of clients of Kotak Securities Ltd. It does not constitute a personal recommendation or take into account the particular investment objectives,financial situations, or needs of individual clients.We have reviewed the report, and in so far as it includes current or historical information, it is believed to be reliable though its accuracy or completenesscannot be guaranteed. Neither Kotak Securities Limited, nor any person connected with it, accepts any liability arising from the use of this document. Therecipients of this material should rely on their own investigations and take their own professional advice. Price and value of the investments referred to in thismaterial may go up or down. Past performance is not a guide for future performance. Certain transactions -including those involving futures, options andother derivatives as well as non-investment grade securities - involve substantial risk and are not suitable for all investors. Reports based on technical analysiscenters on studying charts of a stock's price movement and trading volume, as opposed to focusing on a company's fundamentals and as such, may not matchwith a report on a company's fundamentals.Opinions expressed are our current opinions as of the date appearing on this material only. While we endeavor to update on a reasonable basis theinformation discussed in this material, there may be regulatory, compliance or other reasons that prevent us from doing so. Prospective investors and othersare cautioned that any forward-looking statements are not predictions and may be subject to change without notice. Our proprietary trading and investmentbusinesses may make investment decisions that are inconsistent with the recommendations expressed herein.Kotak Securities Limited has two independent equity research groups: Institutional Equities and Private Client Group. This report has been prepared by thePrivate Client Group. The views and opinions expressed in this document may or may not match or may be contrary with the views, estimates, rating, targetprice of the Institutional Equities Research Group of Kotak Securities Limited.We and our affiliates/associates, officers, directors, and employees, Research Analyst(including relatives) worldwide may: (a) from time to time, have long orshort positions in, and buy or sell the securities thereof, of company (ies) mentioned herein or (b) be engaged in any other transaction involving such securitiesand earn brokerage or other compensation or act as a market maker in the financial instruments of the subject company/company (ies) discussed herein oract as advisor or lender / borrower to such company (ies) or have other potential/material conflict of interest with respect to any recommendation and relatedinformation and opinions at the time of publication of Research Report or at the time of public appearance. Kotak Securities Limited (KSL) may haveproprietary long/short position in the above mentioned scrip(s) and therefore may be considered as interested. The views provided herein are general innature and does not consider risk appetite or investment objective of particular investor; readers are requested to take independent professional advicebefore investing. This should not be construed as invitation or solicitation to do business with KSL. Kotak Securities Limited is also a Portfolio Manager.Portfolio Management Team (PMS) takes its investment decisions independent of the PCG research and accordingly PMS may have positions contrary to thePCG research recommendation. Kotak Securities Limited does not provide any promise or assurance of favourable view for a particular industry or sector orbusiness group in any manner. The investor is requested to take into consideration all the risk factors including their financial condition, suitability to riskreturn profile and take professional advice before investing.The analyst for this report certifies that all of the views expressed in this report accurately reflect his or her personal views about the subject company orcompanies and its or their securities, and no part of his or her compensation was, is or will be, directly or indirectly related to specific recommendations orviews expressed in this report.No part of this material may be duplicated in any form and/or redistributed without Kotak Securities' prior written consent.Details of Associates are available on our website ie www.kotak.comResearch Analyst has served as an officer, director or employee of subject company(ies): NoWe or our associates may have received compensation from the subject company(ies) in the past 12 months. We or our associates may have managed or co-managed public offering of securities for the subject company(ies) in the past 12 months. We or our associates may have received compensation forinvestment banking or merchant banking or brokerage services from the subject company(ies) in the past 12 months. We or our associates may have receivedany compensation for products or services other than investment banking or merchant banking or brokerage services from the subject company(ies) in thepast 12 months. We or our associates have not received any compensation or other benefits from the subject company(ies) or third party in connection withthe research report. Our associates may have financial interest in the subject company(ies).Research Analyst or his/her relative's financial interest in the subject company(ies): NoKotak Securities Limited has financial interest in the subject company(ies): Hero Motocorp, Eicher Motors, GE Shipping - YesOur associates may have actual/beneficial ownership of 1% or more securities of the subject company(ies) at the end of the month immediately precedingthe date of publication of Research Report.Research Analyst or his/her relatives has actual/beneficial ownership of 1% or more securities of the subject company(ies) at the end of the monthimmediately preceding the date of publication of Research Report: NoKotak Securities Limited has actual/beneficial ownership of 1% or more securities of the subject company(ies) at the end of the month immediately precedingthe date of publication of Research Report: NoSubject company(ies) may have been client during twelve months preceding the date of distribution of the research report."A graph of daily closing prices of securities is available at www.nseindia.com and http://economictimes.indiatimes.com/markets/stocks/stock-quotes. (Choosea company from the list on the browser and select the "three years" icon in the price chart)."Kotak Securities Limited. Registered Office: 27 BKC, C 27, G Block, Bandra Kurla Complex, Bandra (E), Mumbai 400051. CIN: U99999MH1994PLC134051,Telephone No.: +22 43360000, Fax No.: +22 67132430. Website: www.kotak.com. Correspondence Address: Infinity IT Park, Bldg. No 21, Opp. Film City Road,A K Vaidya Marg, Malad (East), Mumbai 400097. Telephone No: 42856825. SEBI Registration No: NSE INB/INF/INE 230808130, BSE INB 010808153/INF011133230, MSEI INE 260808130/INB 260808135/INF 260808135, AMFI ARN 0164, PMS INP000000258 and Research Analyst INH000000586. NSDL/CDSL: IN-DP-NSDL-23-97. Our research should not be considered as an advertisement or advice, professional or otherwise. The investor is requested to take intoconsideration all the risk factors including their financial condition, suitability to risk return profile and the like and take professional advice before investing.Investments in securities are subject to market risk; please read the SEBI prescribed Combined Risk Disclosure Document prior to investing. Derivatives are asophisticated investment device. The investor is requested to take into consideration all the risk factors before actually trading in derivative contracts.Compliance Officer Details: Mr. Manoj Agarwal. Call: 022 - 4285 6825, or Email: [email protected] case you require any clarification or have any concern, kindly write to us at below email ids: Level 1: For Trading related queries, contact our customer service at '[email protected]' and for demat account related queries contact us at
[email protected] or call us on: Online Customers - 30305757 (by using your city STD code as a prefix) or Toll free numbers 18002099191 / 1800222299,Offline Customers - 18002099292
Level 2: If you do not receive a satisfactory response at Level 1 within 3 working days, you may write to us at [email protected] or call us on 022-42858445 and if you feel you are still unheard, write to our customer service HOD at [email protected] or call us on 022-42858208.
Level 3: If you still have not received a satisfactory response at Level 2 within 3 working days, you may contact our Compliance Officer (Name: ManojAgarwal ) at [email protected] or call on 91- (022) 4285 6825.
Level 4: If you have not received a satisfactory response at Level 3 within 7 working days, you may also approach CEO (Mr. Kamlesh Rao) [email protected] or call on 91- (022) 6652 9160.