more than an advisory committee ingels
TRANSCRIPT

More than an Advisory Committee:Farmers Take the Lead in Northeast Iowa
Watershed Improvement
Chad IngelsClearWater Ag Strategies, LLC
ISU Extension Watershed Projects
Soil & Water Conservation Society Annual ConferenceJuly 25, 2016

Northeast Iowa Farmer-led watershedimprovement projects
Improving Water Quality is the Goal

Citizen ParticipationIn
Performance-basedManagement
Goals-PlansPerformance
Targeting
Evaluation
Awareness
Assessment
Performance-based Watershed Management

Residents come together as a watershed community
Watershed Council Development

Watershed Resident Leadership
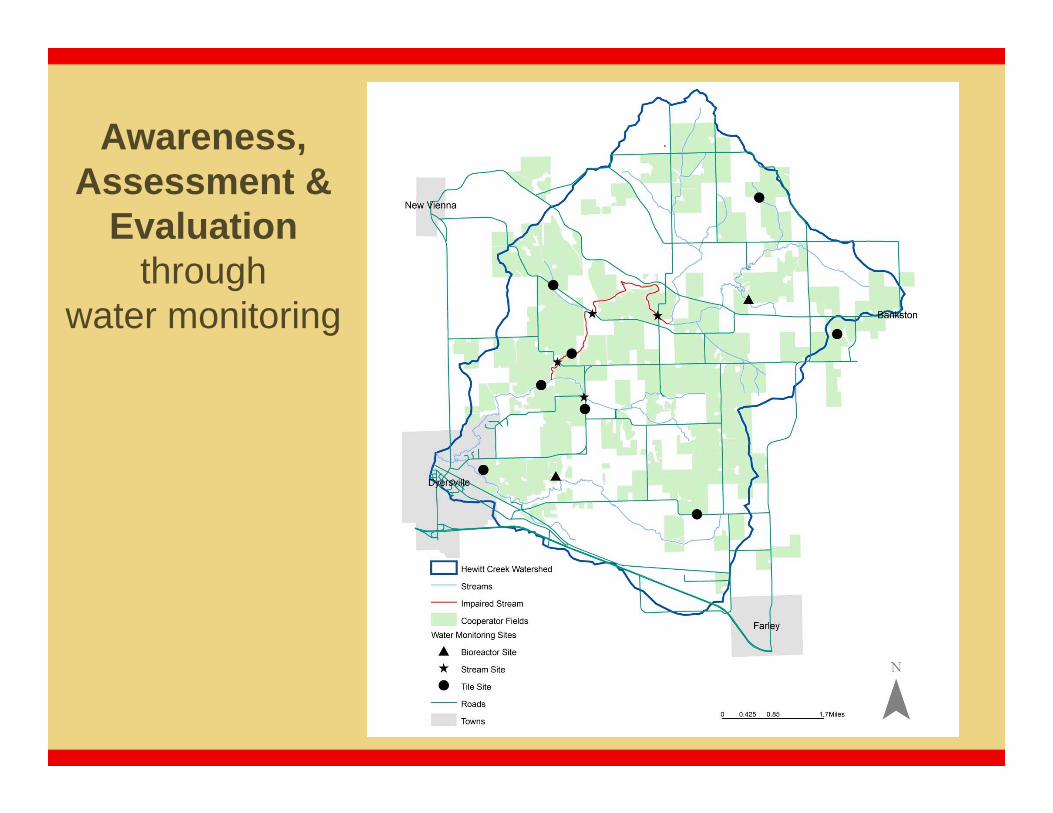
Awareness, Assessment &
Evaluationthrough
water monitoring

Awareness, Assessment & Evaluationreporting results

Enhancing and developing waterways
46% less sediment loss, costing $8.85/A
Exclude crop removal fertilizer applicationson high testing fields12% less soluble N32% less soluble P, saving $18.86/A PN
Full nitrogen accounting from manure to reduce commercial N use
43% less soluble N, saving $9.24/A N
Sed
Performance-based Watershed Management

• Iowa Phosphorus Index– Developed by ISU, Soil Tilth Lab, NRCS– Used in Iowa DNR MMPs– Incorporates soil loss, distance to stream, soil test P,
management practices, P application• Soil Conditioning Index
– Product of RUSLE2 calculation– Eligibility standard for CSP enrollment
• Cornstalk Nitrate Test– Developed at ISU– Testing available at many Iowa labs– Recognized for use with CSP N management enhancements
Performance-based Watershed Management
Performance Tools

Seed cover crops on 20 fields receiving manure applications
Reduce annual sediment by 7,500 tons
Two consecutive years of season-long, rain event, average total phosphorus water analysis of less than 1.40 mg/L at Site 3
Watershed average PI of 2.00and SCI of 0.6
A recreation season indicator bacteria (E. coli) geometric mean less than the Class A2 criterion of 630 orgs/100 ml at monitoring site DRC 19
Watershed participation rate of 85%
Goal setting

Incentive Program

Incentive Program

Incentive Program Alternatives

P-Index list – HewittP-Index list – Coldwater/PalmerPRODUCER_ID FIELD_ID FIELD_ACRES P_INDEX SCI SOILTEST_P STALK_N STREAM_DIS ROTATION CONTOUR NOTILL
9 12 7.9 9.85 0.54 311 0 320 CCOHH Y33 b2 17.6 9.56 0.46 399 0 570 CS Y9 11 4.4 8.88 0.82 535 0 200 CCOHH N19 H6 10.0 8.84 0.14 248 0 3230 CCCOMMM N25 2 8.2 7.51 0.23 217 0 560 CCB N41 4A 20.3 7.20 -0.04 145 0 800 CC Y45 V-1 20.8 7.19 -0.31 23 0 260 CS Y25 3 18.4 6.86 -0.11 130 0 1360 CCB N44 H-2 36.5 6.65 -0.02 125 0 940 CS Y25 4 64.7 6.61 -0.11 111 0 860 CCB N9 13 13.8 6.52 0.54 201 0 440 CCOHH Y44 K-3 7.9 6.51 -0.76 23 0 1610 CS Y9 10 1.1 6.36 0.72 224 0 630 CCOHH N13 1 38.3 5.90 0.25 105 0 330 CC N31 5 6.6 5.84 0.56 148 0 480 CCOMMM Y41 4B 9.5 5.82 0.42 145 0 185 CC Y12 2 36.6 5.56 0.17 126 0 2120 CS Y12 4 18.4 5.55 0.17 93 0 1075 CS Y26 2 8.8 5.55 0.14 46 0 380 CCCOHHH Y33 b1 12.7 5.43 0.66 399 0 300 CS26 8 5.8 5.42 0.49 45 0 280 CCCOHHH N30 N4 20.7 5.26 0.06 22 0 220 CS Y43 1 32.4 5.24 -0.23 32 0 1080 CC Y6 B4 11.4 5.20 -0.02 73 0 740 CC Y23 H-east 67.6 5.14 0.43 277 0 1550 CC N35 W4 12.4 5.09 0.23 58 0 670 CCCOHHH Y13 2 117.0 4.99 0.24 145 0 1090 CC N26 7 8.4 4.96 0.35 58 0 990 CCCOHHH N6 R3 19.9 4.92 0.49 99 0 600 CCCOHHH Y
21 6 5.4 0.44 1.00 21 0 500 RGraze N Y14 a5 5.6 0.38 0.85 23 0 240 CS N Y21 1 32.3 0.20 1.10 19 0 730 RGraze N Y5 14 52.6 0.00 0.46 0 0 4200 CCCCS Y
38 P-fs 3.0 0.00 0.64 0 0 380 CS N Y38 H-fsw 3.2 0.00 0.63 0 0 720 CS N Y
PI Category # of fields total acres avg. PI avg. SCI avg. soil P avg N avg. distance % hay/graze % contour % no till>5 26 513 6.24 0.13 150 0 958 35 62 0
3 to 5 98 2236 3.83 0.34 79 0 1488 52 48 22 to 3 112 3039 2.51 0.50 55 0 1693 65 57 51 to 2 83 2351 1.54 0.62 48 0 2534 34 48 300 to 1 50 1319 0.74 0.79 26 0 1569 28 22 80No PI 3 59 0.00 0.48 0 0 3816
372 9516
2.54 0.51 60 0 1785 47 48 19
>5 20 413 6.62 0.15 181 0 1054 45 40 03 to 5 84 1692 3.72 0.41 86 0 1661 58 52 12 to 3 106 2828 2.48 0.54 57 0 1572 67 57 71 to 2 70 2169 1.61 0.59 49 0 2336 47 50 270 to 1 36 1085 0.72 0.76 29 0 1380 24 26 91
316 8187
2.48 0.54 63 0 1741 54 50 19
2007 Watershed Weighted Average
2006 Watershed Weighted Average
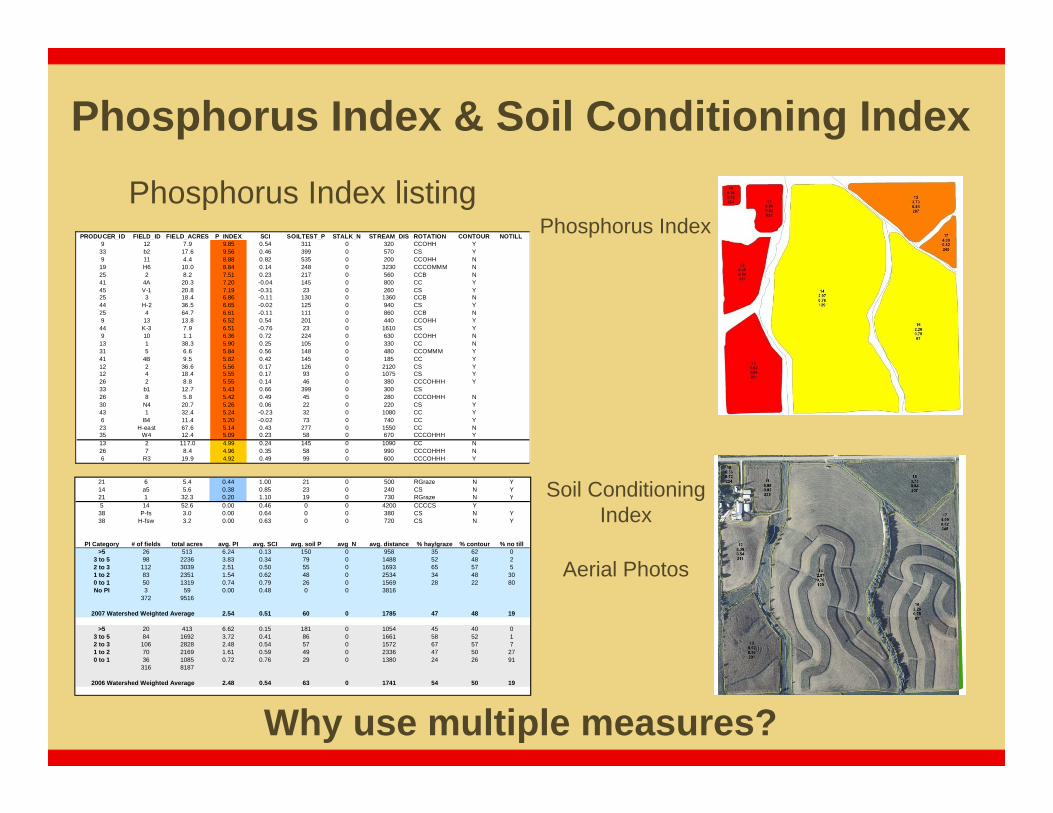
Phosphorus Index listingPRODUCER_ID FIELD_ID FIELD_ACRES P_INDEX SCI SOILTEST_P STALK_N STREAM_DIS ROTATION CONTOUR NOTILL
9 12 7.9 9.85 0.54 311 0 320 CCOHH Y33 b2 17.6 9.56 0.46 399 0 570 CS Y9 11 4.4 8.88 0.82 535 0 200 CCOHH N19 H6 10.0 8.84 0.14 248 0 3230 CCCOMMM N25 2 8.2 7.51 0.23 217 0 560 CCB N41 4A 20.3 7.20 -0.04 145 0 800 CC Y45 V-1 20.8 7.19 -0.31 23 0 260 CS Y25 3 18.4 6.86 -0.11 130 0 1360 CCB N44 H-2 36.5 6.65 -0.02 125 0 940 CS Y25 4 64.7 6.61 -0.11 111 0 860 CCB N9 13 13.8 6.52 0.54 201 0 440 CCOHH Y44 K-3 7.9 6.51 -0.76 23 0 1610 CS Y9 10 1.1 6.36 0.72 224 0 630 CCOHH N13 1 38.3 5.90 0.25 105 0 330 CC N31 5 6.6 5.84 0.56 148 0 480 CCOMMM Y41 4B 9.5 5.82 0.42 145 0 185 CC Y12 2 36.6 5.56 0.17 126 0 2120 CS Y12 4 18.4 5.55 0.17 93 0 1075 CS Y26 2 8.8 5.55 0.14 46 0 380 CCCOHHH Y33 b1 12.7 5.43 0.66 399 0 300 CS26 8 5.8 5.42 0.49 45 0 280 CCCOHHH N30 N4 20.7 5.26 0.06 22 0 220 CS Y43 1 32.4 5.24 -0.23 32 0 1080 CC Y6 B4 11.4 5.20 -0.02 73 0 740 CC Y23 H-east 67.6 5.14 0.43 277 0 1550 CC N35 W4 12.4 5.09 0.23 58 0 670 CCCOHHH Y13 2 117.0 4.99 0.24 145 0 1090 CC N26 7 8.4 4.96 0.35 58 0 990 CCCOHHH N6 R3 19.9 4.92 0.49 99 0 600 CCCOHHH Y
21 6 5.4 0.44 1.00 21 0 500 RGraze N Y14 a5 5.6 0.38 0.85 23 0 240 CS N Y21 1 32.3 0.20 1.10 19 0 730 RGraze N Y5 14 52.6 0.00 0.46 0 0 4200 CCCCS Y
38 P-fs 3.0 0.00 0.64 0 0 380 CS N Y38 H-fsw 3.2 0.00 0.63 0 0 720 CS N Y
PI Category # of fields total acres avg. PI avg. SCI avg. soil P avg N avg. distance % hay/graze % contour % no till>5 26 513 6.24 0.13 150 0 958 35 62 0
3 to 5 98 2236 3.83 0.34 79 0 1488 52 48 22 to 3 112 3039 2.51 0.50 55 0 1693 65 57 51 to 2 83 2351 1.54 0.62 48 0 2534 34 48 300 to 1 50 1319 0.74 0.79 26 0 1569 28 22 80No PI 3 59 0.00 0.48 0 0 3816
372 9516
2.54 0.51 60 0 1785 47 48 19
>5 20 413 6.62 0.15 181 0 1054 45 40 03 to 5 84 1692 3.72 0.41 86 0 1661 58 52 12 to 3 106 2828 2.48 0.54 57 0 1572 67 57 71 to 2 70 2169 1.61 0.59 49 0 2336 47 50 270 to 1 36 1085 0.72 0.76 29 0 1380 24 26 91
316 8187
2.48 0.54 63 0 1741 54 50 19
2007 Watershed Weighted Average
2006 Watershed Weighted Average
Phosphorus Index
Soil Conditioning Index
Aerial Photos
Phosphorus Index & Soil Conditioning Index
Why use multiple measures?
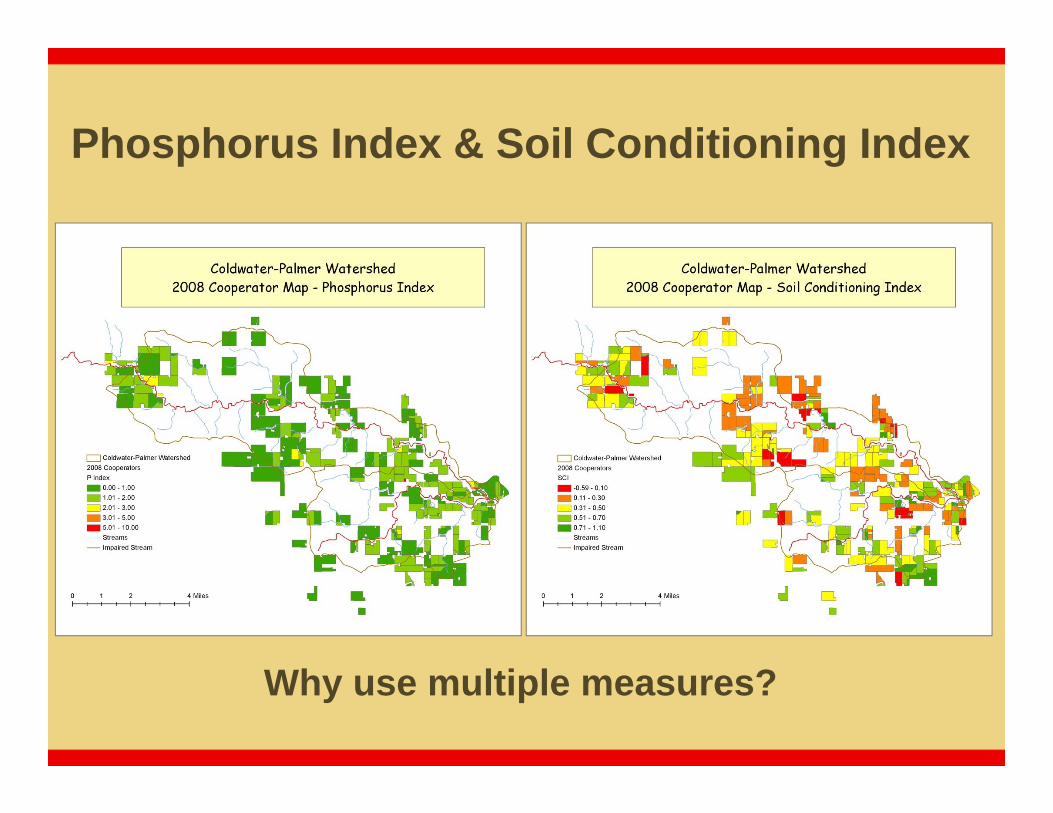
Why use multiple measures?
Phosphorus Index & Soil Conditioning Index

Cornstalk nitrate test results
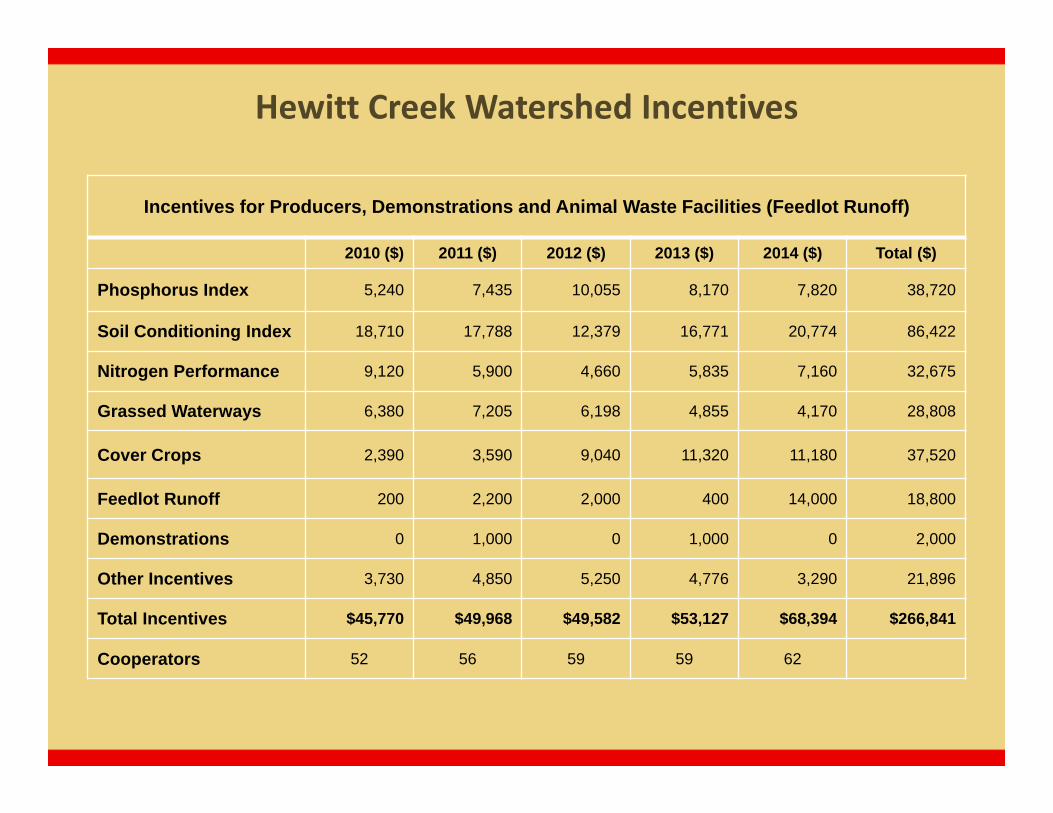
Incentives for Producers, Demonstrations and Animal Waste Facilities (Feedlot Runoff)
2010 ($) 2011 ($) 2012 ($) 2013 ($) 2014 ($) Total ($)
Phosphorus Index 5,240 7,435 10,055 8,170 7,820 38,720
Soil Conditioning Index 18,710 17,788 12,379 16,771 20,774 86,422
Nitrogen Performance 9,120 5,900 4,660 5,835 7,160 32,675
Grassed Waterways 6,380 7,205 6,198 4,855 4,170 28,808
Cover Crops 2,390 3,590 9,040 11,320 11,180 37,520
Feedlot Runoff 200 2,200 2,000 400 14,000 18,800
Demonstrations 0 1,000 0 1,000 0 2,000
Other Incentives 3,730 4,850 5,250 4,776 3,290 21,896
Total Incentives $45,770 $49,968 $49,582 $53,127 $68,394 $266,841
Cooperators 52 56 59 59 62
Hewitt Creek Watershed Incentives
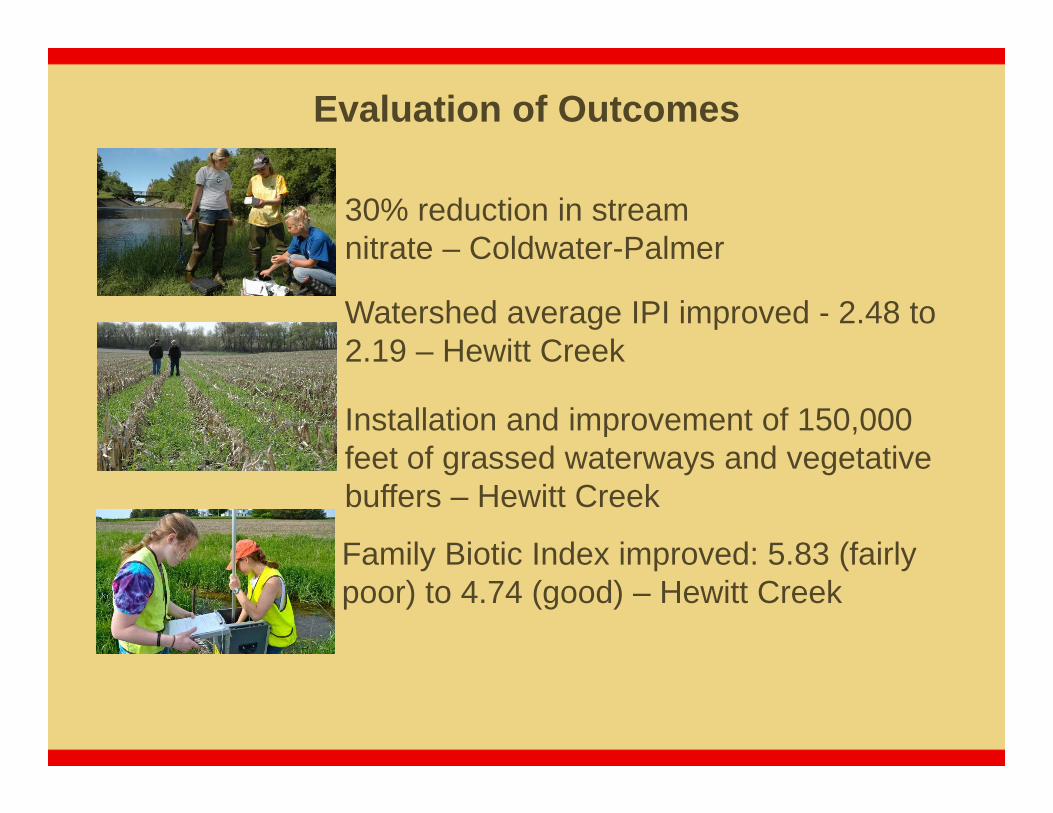
30% reduction in stream nitrate – Coldwater-Palmer
Watershed average IPI improved - 2.48 to 2.19 – Hewitt Creek
Installation and improvement of 150,000 feet of grassed waterways and vegetative buffers – Hewitt Creek
Family Biotic Index improved: 5.83 (fairly poor) to 4.74 (good) – Hewitt Creek
Evaluation of Outcomes

10,500 tons reduction of sediment delivery – North Fork Maquoketa
Watershed participation exceeds 80% - Hewitt Creek
19% reduction in stream nitrate with 2 years consecutive years less than 10 mg/L – Lime Creek
Watershed average IPI improved - 2.70 to 2.18 – North Fork Maquoketa
Evaluation of Outcomes

Outcomes• Developing policy recommendations such as extending water
project timelines• Evaluating performance-based approaches – Iowa/Vermont CIG• Training watershed leader/technical specialist teams• Defining the performance-based approach – Minnesota and
Heartland Water Quality roundtable/webinar• Engaging in larger watershed - Cedar River Coalition involvement
Watershed Resident Leadership

Chad [email protected]
563-920-5899@hort4cy
Hear more about Hewitt Creekduring the Water Quality Targeting Success
Stories session at 10:30 tomorrow