moody’s analytics ifrs 9 for insurersma.moodys.com/rs/961-kcj-308/images/moodys webinar... ·...
TRANSCRIPT

Moody’s Analytics
IFRS 9 for Insurers
Roshni Patel and Nadja Roos Wednesday, 26 September 2018

IFRS9 for Insurers, London, September 26, 2018 2
Moody's Analytics operates independently of the credit ratings activities of Moody's Investors Service. We do not comment on credit ratings or potential rating changes,
and no opinion or analysis you hear during this presentation can be assumed to reflect those of the ratings agency.

IFRS9 for Insurers, London, September 26, 2018 3
AgendaKey elements for discussion
1. Current trends in the insurance market
2. Best practices in gearing up for implementation
3. Acceptable model methodologies and level of granularity
4. A solution considering the challenges and linkages to IFRS 17

IFRS9 for Insurers, London, September 26, 2018 4
Accounting Standard Timelines
2022
CECL - SEC Filers
IFRS17 adoption*
IFRS9 exemption for Insurers
CECL - Other Co.’s
202120202019
IFRS9 General
adoption
2018
CECL - Public Co.’s
* IFRS 17 general adoption. Early adoption possible. Some regulators might decide to accelerate timelines.

IFRS9 for Insurers, London, September 26, 2018 5
Stages to IFRS9 complianceSmall steps achieving greater affect

IFRS9 for Insurers, London, September 26, 2018 6
Implementation Timeline – an Insurance view
IFRS 9: Automation and
Workflow
Integration with
IFRS17/Solvency II
IFRS 9 compliance –
tactical approach
Methodology development
/ enhancement
IFRS 9 compliance –
tactical approach
Q3 2018 Q1 2019 Q3 2019
Q4 2018 Q2 2019 Q4 2019
Gap assessment / Impact Study
Diagnostic Phase
Business Model and SPPI tests

IFRS9 for Insurers, London, September 26, 2018 7
Current market themes
Results of Gap Analysis / Impact Study
» What were some of the key findings?
» What existing methodologies, tools are recommended for use in IFRS9 implementation?
» If Impact study, what are the initial provision estimations, communication around the analysis?
Path to Implementation
» With late Q1 2019 / early Q2 2019 start, when is the parallel run targeted to begin?
» What is the planned scope of the parallel run?
» Is the firm planning to engage external support for implementation assistance, model validation, accounting advisory?
Applicable portfolio and materiality compared to IFRS17?
» Investment vs applicable portfolio
» Others standard, implementation unclear, i.e. UK GAAP?

1 Advantages of early
Implementation

IFRS9 for Insurers, London, September 26, 2018 9
Advantages of early ImplemetationBest Practices – Incorporating lessons learned
1Accountability / Responsibility
Institutions identifying a ‘Super user’ early on in the implementation project saw
considerable synergies.
2Governance
Strong Project Governance with Senior Management involvement and clear
escalation procedures made projects more efficient from the start.
3Validation / Audit
Early engagement of internal validation and external audit teams brought
everyone on the same level simultaneously and focused the formal process.
4Global / Local
Local Workshops with detailed user training across the end to end calculation
process.

IFRS9 for Insurers, London, September 26, 2018 10
Advantages of early ImplemetationBest Practices – Modelling
1Scenarios
Explore the use of internal macroeconomic scenarios for consistency with
Stress Test / ICAAP.
2PD / LGD
Use internal LGD models for consistency if available. Incorporate conditional PiT
PD / LGD term structures into existing accounting systems.
3Consistency
Consistency with internal process (Credit process, watch list approach, ICAAP,
Stress Testing).
4Validation
Incorporating new models in existing operating model (e.g. expanding current
Validation Framework).

IFRS9 for Insurers, London, September 26, 2018 11
Advantages of early ImplemetationInternal communication and Incorporating results
1Parallel Run
Opportunity for a longer parallel run phase.
2IFRS9 Impact
Analysing the impact of IFRS9 and determining potential mitigants (credit review of
stage 3, determining impact of staging in stress scenarios, QoQ volatility).
3Internal Communication
Providing Senior Management (CEO, CRO, CFO, CTO) with frequent and tailored
information especially around the QoQ volatility.
4Infrastructure
Assessing possible solutions in the context of existing infrastructure and potential
technical POCs. Enhance data systems and resources to source and link all data
requirements.

IFRS9 for Insurers, London, September 26, 2018 12
Advantages of early Implemetation
» Type of resources is changing
» Bringing skills into BAU
» Understanding of Risk and Finance data and
processes
» New sub teams for reporting across
stakeholders (CFO, CRO, CTO)
Resource Mix
Global Resources and Local Resources
» Addressing and assessing Group requirements
vs. Subsidiary requirements
» Implementing / communicating local changes
Consistency
» Have resources / skill sets that look across a
number of different requirememts (ST, ICAAP,
IFRS9)
People Cost
» Data – enhancing Risk and Finance data
» Personnel cost
» Methodology changes, re-calibration annually and
assumptions reflections
Operational Cost
Infrastructure
» New IT infrastructure vs. building/ re-using current
IT Infrastructure
» Tactical vs. Automated solution
Business Cost » Adopting new regulation / modifying existing processes
» Increased internal validation efforts
» Ongoing maintanance of models / documentation
» Enhancing business requirements (e.g. Origination,
RAROC)
Considering Operational Aspects of IFRS9

2 Portfolio Coverage
IFRS9 for Insurers, London, September 26, 2018 14
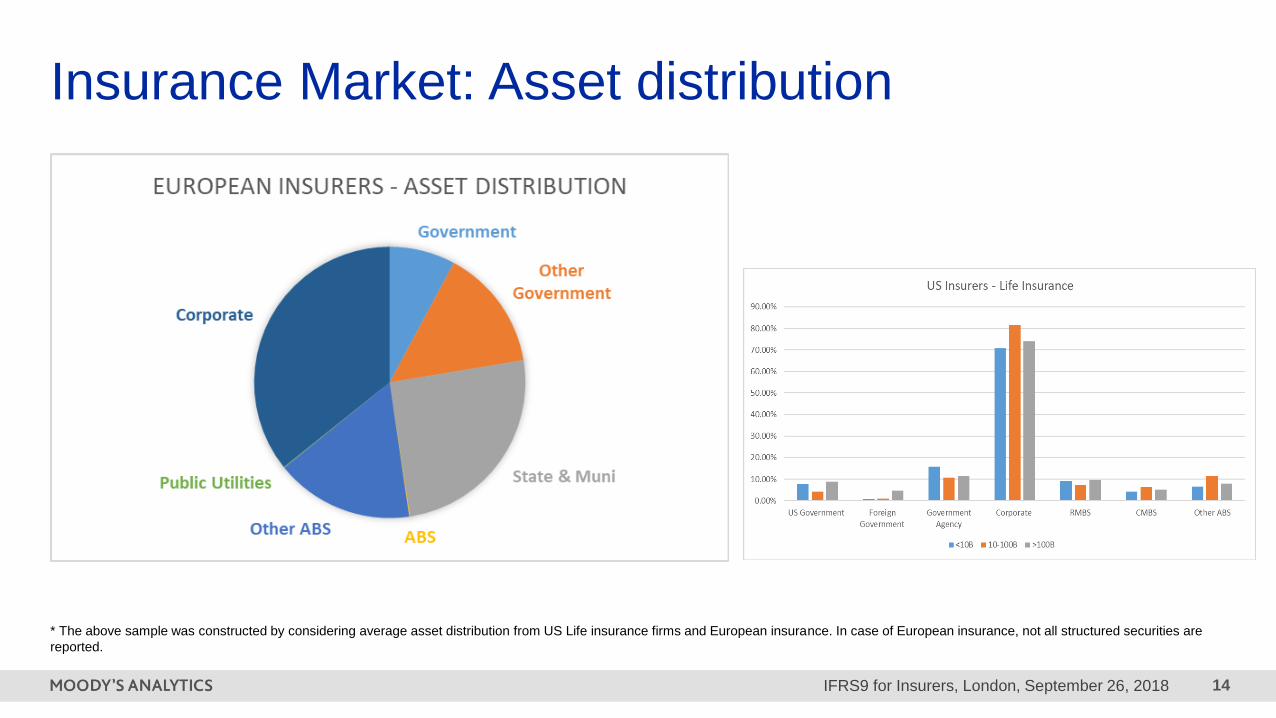
Insurance Market: Asset distribution
* The above sample was constructed by considering average asset distribution from US Life insurance firms and European insurance. In case of European insurance, not all structured securities are
reported.

IFRS9 for Insurers, London, September 26, 2018 15
Business Model and Classification & Measurement
• Perform Business model (BM) Assessment
• Test Criteria for Solely Payment of Principal and Interest (SPPI)
• Coverage: Products and investments and discuss the future balance sheet structure with key stakeholders
• Identify new policies and procedures e.g. business model policy that needs to be developed
BM and SPPI Test
• Assessment of systems, policies and procedures for BMA and SPPI test
• Content and structure of business concept; definition of benchmark test including business requirement description
Accounting Processes Revision
• Advise on implementation of models, data requirements, policies & procedures for BM and SPPI Test
• Automation to perform BM and SPPI test
Implementation

3 Impairment Modelling
Requirements

IFRS9 for Insurers, London, September 26, 2018 17
Impairment Process Experience – IFRS9Typical Process Steps
Data
Management
Portfolio
Segmentation
Methodology/
Models Selection
Scenario
Design/
Selection
Model(s) &
Accounting
Execution
Qualitative
Adjustments
Framework
Data preparation, Data Load,
ETL/Manual, Exception
reporting, Data substitution,
Rules Engine
CECL/IFRS9-allowable
Methodologies and Models
feeding these methodologies,
Assumptions
Model and Accounting Engines
execution
Ad hoc and/or pre-approved
segmentation at any level of
granularity
One or multiple Scenarios and
their weights, Reversion (if
desired)
Management Override at any
level, interagency and CECL
qualitative factors, entity-
specific factors
Real time reporting on input and output data, trending, roll forwards, audit trails, preparer/approver for any changes, attribution, disclosures, GL
aggregate and instrument-level entries
Pu
blis
h a
nd
Extra
ct (D
ata
an
d G
L)

IFRS9 for Insurers, London, September 26, 2018 18
IFRS 9 Impairment Calculation StepsAn end-to-end process
1Macroeconomic Scenarios
• Minimum of 3 Scenarios – Benign, Baseline and Adverse
• Include factors that are credit explanatory
• Quantitative Weights for each scenario (e.g., 50% weight for Baseline)
• Forecast Horizon: Cover full portfolio maturity (typically > 30 years)
3Stage Allocation
• Separate Allocation criteria per portfolio (Stage1 – 12m ECL, Stage 2/3 – L/time ECL)
• Analyse portfolio migration across stages to choose most optimal criteria per segment
• Absolute and Relative Thresholds
• Comply with minimum standards and best practice
4ECL calculation
ECL Calculation and Calibration
• Define and calibrate Effective Interest (Profit) Rate and discount factors
• Forward exposure method for ECL calculation
• Review and qualitative adjustments
2
PD & LGD Modelling
Forward-looking PIT PD Term Structure
• Derive TTC PDs from historical ratings, mapping to Moody's Analytics default study
• Convert TTC PDs to PIT
• Induce Scenario dependence to convert PIT PDs to Forward Looking PIT PDs
Forward-looking PIT LGD Term Structure
• TTC LGD based on historical recoveries, collateral and/or off-the-shelf models
• Lifetime LGD and Moody's Analytics PD – LGD Correlation model

IFRS9 for Insurers, London, September 26, 2018 19
Impairment Model Overview
Macroeconomic Scenario Forecasts
Scenario Probability Weights
Macro-Conditioned, Point-in-Time, Forward-Looking Default Probabilities
Credit Stage
PIT Conversion
Default Risk Measure
» Forecasts of GDP, unemployment, prices, etc.» Minimum 3 alternative scenarios: baseline, upside, downside» Business relevant scenarios
» Expected probabilities of scenarios
» Stage 1, 2, or 3 based on credit risk
» If TTC, need to convert to PIT
» PD Model» External or internal rating
Expected Credit Loss
Loss Given
Default
Exposure at
Default
Discount Factor
XX =

IFRS9 for Insurers, London, September 26, 2018 20
Forward Looking & Probability-Weighted Outcomes
» Requires expected credit losses (ECL) to account for forward-looking information
» Requires probability-weighted outcomes when measuring expected credit losses
– Estimates should reflect the possibility that a credit loss occurs and the possibility that no credit loss occurs
Macroeconomic modelling satisfies both requirements above
IFRS 9

IFRS9 for Insurers, London, September 26, 2018 22
Macroeconomic ScenariosProbability-weighted expected loss
2007Q1 2010Q4 2014Q3 2018Q2 2022Q1 2025Q4
2012Q1 2014Q1 2016Q1 2018Q1 2020Q1
S1 S3Baseline
Multiple Scenario Forecasts
Derive probability-weighted ECL
Scenario probabilities
S2 Mild Second Recession
Protracted SlumpS4
Baseline / Most LikelyBL
New Upside ScenarioS0
Stronger Near-Term ReboundS1
S3 Deeper Second Recession

IFRS9 for Insurers, London, September 26, 2018 23
United Kingdom Unemployment rate, %
United Kingdom Inflation, % change yr ago United Kingdom House price, 2010=100
United Kingdom IFRS9 Scenario Forecasting
-1.00
0.00
1.00
2.00
3.00
4.00
5.00
S4 S3
S1 S0
BL
2
3
4
5
6
7
8
9
S4 S3 S1
S0 BL
90
110
130
150
170
190
S4 S3
S1 S0
BL
United Kingdom Real GDP, 2015 bil GBP
1600.00
1700.00
1800.00
1900.00
2000.00
2100.00
2200.00
2300.00
2400.00
2500.00
S4 S3
S1 S0
BL
Sources: ONS, Moody's Analytics Analytics

IFRS9 for Insurers, London, September 26, 2018 24
Expected Credit Loss CalculationCalculations steps
Moody's Analytics Analytics IFRS 9 Proposal
TTC ratings
• TTC assessment of creditworthiness
• Rating based on financial information of the obligor
TTC PD calibration
• Calibrate TTC ratings to TTC PDs for each obligor
• Calibration needs to use the historical default experience of the bank
• For portfolios with low number of defaults, Moody's Analytics can augment the data with its own datasets
Translation to PiT PDs
• Adjust TTC PDs for the point in the credit cycle
• Typically banks do not have enough data to extract the credit cycle
• Moody's Analytics can use its own data to get a robust estimate of the credit cycle
Forward-looking PiT PDs
• Add dependence of PiT PDs to macroeconomic variables
• Combine with macroeconomic scenario forecasts and probabilities to get forward-looking estimates

IFRS9 for Insurers, London, September 26, 2018 25
What is the Rating to PD Converter?
PD by
Rating
Country
adjustment
Sector
adjustment
Point-in-Time
PDs
» Use the public firm PD database to
estimate the typical PD given the rating
» Adjust for sector and country trends
» Use the PD term structure to generate a
Point-in-Time PD term structure
» Can be applied to a financial institution’s
internal rating
IFRS9 for Insurers, London, September 26, 2018 26
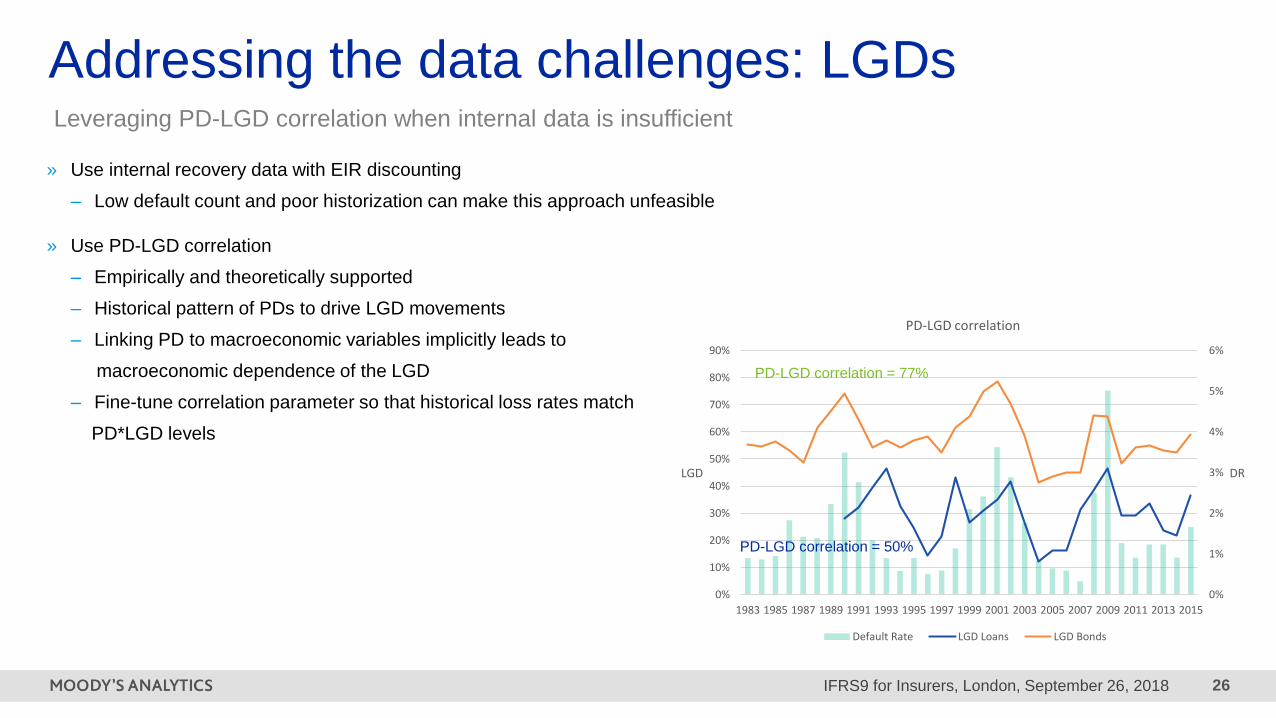
Addressing the data challenges: LGDsLeveraging PD-LGD correlation when internal data is insufficient
IFRS 9 and beyond: Implementation challenges and what lies ahead
» Use internal recovery data with EIR discounting
– Low default count and poor historization can make this approach unfeasible
» Use PD-LGD correlation
– Empirically and theoretically supported
– Historical pattern of PDs to drive LGD movements
– Linking PD to macroeconomic variables implicitly leads to
macroeconomic dependence of the LGD
– Fine-tune correlation parameter so that historical loss rates match
PD*LGD levels
0%
1%
2%
3%
4%
5%
6%
0%
10%
20%
30%
40%
50%
60%
70%
80%
90%
1983 1985 1987 1989 1991 1993 1995 1997 1999 2001 2003 2005 2007 2009 2011 2013 2015
DRLGD
PD-LGD correlation
Default Rate LGD Loans LGD Bonds
PD-LGD correlation = 50%
PD-LGD correlation = 77%

IFRS9 for Insurers, London, September 26, 2018 27
Stage Allocation Criteria
Absolute Criteria
PD Master Scale
Future Default Rate
under each scenario
Portfolio Distribution
Possibility to segment by model,
rating scale or industry
Define
Absolute
Rating
Threshold
Relative to
Inputs
Possibility to
differentiate
by Maturity /
Lifetime PD
Horizon
Absolute Criteria
Rating is less than XX AND / OR PD is > XX%
Last allocated stage
Terms Modified With Adverse Impact on the
bank
Watch list account
Relative Criteria
Decrease in Ratings by XX notches AND / OR Increase in PD by XX
percentage points
XX number of Movements across Stages in the last
XX months
Decrease in collateral coverage ratio

4 IFRS17

IFRS9 for Insurers, London, September 26, 2018 29
Connecting IFRS 9 and IFRS 17Consistent credit modelling / Infrastructure
IFRS 9
Modelling impairments
1. Insurers are looking for consistent approach to credit modelling across both sides of the balance sheet i.e. IFRS 9 and IFRS17.
2. Consistent modelling could reduce the probability / likelihood of accounting mismatches arising and leading to spurious volatility in the net financial results reported by insurer.
3. Future linkages for infrastructure and reporting purposes
» Impairment modelling is required for
assets classified at amortised cost of
FVOCI
» IFRS9 tool / model deployment
» Leveraging In-house and/or Vendor data
(i.e. PD, LGD engine)
» Derive the ECL at the granular level for
each exposure in the portfolio
IFRS 17
Top Down approach for the liability discount rate
Credit risk premium
for unexpected losses
Yield
Curve
based on
actual or
reference
portfolio
Expected credit
losses
Mismatch
IFRS 17
Discount
Rate
Methodology may
require PD and
granular LGD

IFRS9 for Insurers, London, September 26, 2018 30
IFRS 9 & 17 Thought Leadership Papers
Actuarial Models in an IFRS 17 World
Compliance with this standard promises to
bring the greatest disruption ever seen to
insurers’ financial reporting systems and
processes, by forcing companies to integrate
actuarial models deeply within reporting
processes.
Discount Rate Curves
In his IFRS17 Insight whitepaper, Nick
Jessop – Senior Director Research, decodes
the impact, significance and use of discount
curves in the IFRS 17 reporting process.
Getting IFRS 17 Implementation Right
InsuranceERM recently published a Q&A
interview with Moody's Analytics Analytics
that provides practical insights on some
aspects of the IFRS 17 implementation.
moodysanalytics.com/ifrs17
Level of Aggregation in IFRS 17
Massimiliano Neri shares his thoughts about
the level of contract aggregation required by
IFRS17 in his latest publication. Read his
whitepaper now to learn more about this core
requirement of IFRS17.
IFRS9 getting ready for the challenge
November 2018 will see the release of the
experiences learnt from IFRS9 banking
implementations and what this means for
Insurers.
Impact for Asset Managers

5 Q&A

Appendix

IFRS9 for Insurers, London, September 26, 2018 33
» 100+ IFRS9 ECL
engagements in Europe,
Asia and Americas (exclu.
Americas)
» Working with institutions of
various sizes and
sophistication levels sizes
(Tier 1 to New banks)
» Banks, Development
Banks, Corporates and
Insurers
Moody's Analytics Analytics experience

IFRS9 for Insurers, London, September 26, 2018 34
Moody's Analytics and Thomson Reuters
joint SPPI solution
700K
Fixed Income
Securities
1M
Mortgage Backed
Security Pools
300K
Asset Backed
Securities
The partnership merges two core competences in one solution, offering the most competitive
approach in the market in terms of instrument coverage and functionality.
Clients will benefit from more than 30 SPPI related value and transparency fields and
documentation within one auditable solution delivered by Moody's Analytics Analytics and
Thomson Reuters.

IFRS9 for Insurers, London, September 26, 2018 35
ImpairmentStudioTM for Insurance CompaniesA CECL/IFRS9 orchestration platform to ensure a well governed and efficient period end process for
the new impairment accouting standards
Model Inventory for in house or
Moody's Analytics provided models
Scenario library with Moody's Analytics
documented and validated
methodology
Analysis project repository to run
production and ad hoc analysis
Full set of reports and disclosures to
support the analysis and review process
SUPPORT FOR
Risk, finance and
accounting analysts
Moody's Analytics, Internal
and external models
Scenario weighting
Attribution analysis
Audit tracking at loan level
Full disclosure set
Accounting entries (GL and
loan level)
Q-factor analysis support
for review challenge
SOC 1 Type 2 from Big 4

Interest Rate Risk in the Banking Book, Sep 2017 36
© 2018 Moody’s Corporation, Moody’s Investors Service, Inc., Moody’s Analytics, Inc. and/or their licensors and affiliates (collectively, “MOODY’S”). All
rights reserved.
CREDIT RATINGS ISSUED BY MOODY'S INVESTORS SERVICE, INC. AND ITS RATINGS AFFILIATES (“MIS”) ARE MOODY’S CURRENT
OPINIONS OF THE RELATIVE FUTURE CREDIT RISK OF ENTITIES, CREDIT COMMITMENTS, OR DEBT OR DEBT-LIKE SECURITIES, AND
MOODY’S PUBLICATIONS MAY INCLUDE MOODY’S CURRENT OPINIONS OF THE RELATIVE FUTURE CREDIT RISK OF ENTITIES, CREDIT
COMMITMENTS, OR DEBT OR DEBT-LIKE SECURITIES. MOODY’S DEFINES CREDIT RISK AS THE RISK THAT AN ENTITY MAY NOT MEET
ITS CONTRACTUAL, FINANCIAL OBLIGATIONS AS THEY COME DUE AND ANY ESTIMATED FINANCIAL LOSS IN THE EVENT OF DEFAULT.
CREDIT RATINGS DO NOT ADDRESS ANY OTHER RISK, INCLUDING BUT NOT LIMITED TO: LIQUIDITY RISK, MARKET VALUE RISK, OR
PRICE VOLATILITY. CREDIT RATINGS AND MOODY’S OPINIONS INCLUDED IN MOODY’S PUBLICATIONS ARE NOT STATEMENTS OF
CURRENT OR HISTORICAL FACT. MOODY’S PUBLICATIONS MAY ALSO INCLUDE QUANTITATIVE MODEL-BASED ESTIMATES OF CREDIT
RISK AND RELATED OPINIONS OR COMMENTARY PUBLISHED BY MOODY’S ANALYTICS, INC. CREDIT RATINGS AND MOODY’S
PUBLICATIONS DO NOT CONSTITUTE OR PROVIDE INVESTMENT OR FINANCIAL ADVICE, AND CREDIT RATINGS AND MOODY’S
PUBLICATIONS ARE NOT AND DO NOT PROVIDE RECOMMENDATIONS TO PURCHASE, SELL, OR HOLD PARTICULAR SECURITIES.
NEITHER CREDIT RATINGS NOR MOODY’S PUBLICATIONS COMMENT ON THE SUITABILITY OF AN INVESTMENT FOR ANY PARTICULAR
INVESTOR. MOODY’S ISSUES ITS CREDIT RATINGS AND PUBLISHES MOODY’S PUBLICATIONS WITH THE EXPECTATION AND
UNDERSTANDING THAT EACH INVESTOR WILL, WITH DUE CARE, MAKE ITS OWN STUDY AND EVALUATION OF EACH SECURITY THAT IS
UNDER CONSIDERATION FOR PURCHASE, HOLDING, OR SALE.
MOODY’S CREDIT RATINGS AND MOODY’S PUBLICATIONS ARE NOT INTENDED FOR USE BY RETAIL INVESTORS AND IT WOULD BE
RECKLESS AND INAPPROPRIATE FOR RETAIL INVESTORS TO USE MOODY’S CREDIT RATINGS OR MOODY’S PUBLICATIONS WHEN
MAKING AN
INVESTMENT DECISION. IF IN DOUBT YOU SHOULD CONTACT YOUR FINANCIAL OR OTHER PROFESSIONAL ADVISER.
ALL INFORMATION CONTAINED HEREIN IS PROTECTED BY LAW, INCLUDING BUT NOT LIMITED TO, COPYRIGHT LAW, AND NONE OF
SUCH INFORMATION MAY BE COPIED OR OTHERWISE REPRODUCED, REPACKAGED, FURTHER TRANSMITTED, TRANSFERRED,
DISSEMINATED, REDISTRIBUTED OR RESOLD, OR STORED FOR SUBSEQUENT USE FOR ANY SUCH PURPOSE, IN WHOLE OR IN PART,
IN ANY FORM OR MANNER OR BY ANY MEANS WHATSOEVER, BY ANY PERSON WITHOUT MOODY’S PRIOR WRITTEN CONSENT.
All information contained herein is obtained by MOODY’S from sources believed by it to be accurate and reliable. Because of the possibility of human
or mechanical error as well as other factors, however, all information contained herein is provided “AS IS” without warranty of any kind. MOODY'S
adopts all necessary measures so that the information it uses in assigning a credit rating is of sufficient quality and from sources MOODY'S considers
to be reliable including, when appropriate, independent third-party sources. However, MOODY’S is not an auditor and cannot in every instance
independently verify or validate information received in the rating process or in preparing the Moody’s publications.
To the extent permitted by law, MOODY’S and its directors, officers, employees, agents, representatives, licensors and suppliers disclaim liability to
any person or entity for any indirect, special, consequential, or incidental losses or damages whatsoever arising from or in connection with the
information contained herein or the use of or inability to use any such information, even if MOODY’S or any of its directors, officers, employees, agents,
representatives, licensors or suppliers is advised in advance of the possibility of such losses or damages, including but not limited to: (a) any loss of
present or prospective profits or (b) any loss or damage arising where the relevant financial instrument is not the subject of a particular credit rating
assigned by MOODY’S.
To the extent permitted by law, MOODY’S and its directors, officers, employees, agents, representatives, licensors and suppliers disclaim liability for
any direct or compensatory losses or damages caused to any person or entity, including but not limited to by any negligence (but excluding fraud,
willful misconduct or any other type of liability that, for the avoidance of doubt, by law cannot be excluded) on the part of, or any contingency within or
beyond the control of, MOODY’S or any of its directors, officers, employees, agents, representatives, licensors or suppliers, arising from or in
connection with the information contained herein or the use of or inability to use any such information.
NO WARRANTY, EXPRESS OR IMPLIED, AS TO THE ACCURACY, TIMELINESS, COMPLETENESS, MERCHANTABILITY OR FITNESS FOR
ANY PARTICULAR PURPOSE OF ANY SUCH RATING OR OTHER OPINION OR INFORMATION IS GIVEN OR MADE BY MOODY’S IN ANY
FORM OR MANNER WHATSOEVER.
Moody’s Investors Service, Inc., a wholly-owned credit rating agency subsidiary of Moody’s Corporation (“MCO”), hereby discloses that most issuers of
debt securities (including corporate and municipal bonds, debentures, notes and commercial paper) and preferred stock rated by Moody’s Investors
Service, Inc. have, prior to assignment of any rating, agreed to pay to Moody’s Investors Service, Inc. for appraisal and rating services rendered by it
fees ranging from $1,500 to approximately $2,500,000. MCO and MIS also maintain policies and procedures to address the independence of MIS’s
ratings and rating processes. Information regarding certain affiliations that may exist between directors of MCO and rated entities, and between entities
who hold ratings from MIS and have also publicly reported to the SEC an ownership interest in MCO of more than 5%, is posted annually at
www.moodys.com under the heading “Investor Relations — Corporate Governance — Director and Shareholder Affiliation Policy.”
Additional terms for Australia only: Any publication into Australia of this document is pursuant to the Australian Financial Services License of
MOODY’S affiliate, Moody’s Investors Service Pty Limited ABN 61 003 399 657AFSL 336969 and/or Moody’s Analytics Australia Pty Ltd ABN 94 105
136 972 AFSL 383569 (as applicable). This document is intended to be provided only to “wholesale clients” within the meaning of section 761G of the
Corporations Act 2001. By continuing to access this document from within Australia, you represent to MOODY’S that you are, or are accessing the
document as a representative of, a “wholesale client” and that neither you nor the entity you represent will directly or indirectly disseminate this
document or its contents to “retail clients” within the meaning of section 761G of the Corporations Act 2001. MOODY’S credit rating is an opinion as to
the creditworthiness of a debt obligation of the issuer, not on the equity securities of the issuer or any form of security that is available to retail
investors. It would be reckless and inappropriate for retail investors to use MOODY’S credit ratings or publications when making an investment
decision. If in doubt you should contact your financial or other professional adviser.
Additional terms for Japan only: Moody's Japan K.K. (“MJKK”) is a wholly-owned credit rating agency subsidiary of Moody's Group Japan G.K., which
is wholly-owned by Moody’s Overseas Holdings Inc., a wholly-owned subsidiary of MCO. Moody’s SF Japan K.K. (“MSFJ”) is a wholly-owned credit
rating agency subsidiary of MJKK. MSFJ is not a Nationally Recognized Statistical Rating Organization (“NRSRO”). Therefore, credit ratings assigned
by MSFJ are Non-NRSRO Credit Ratings. Non-NRSRO Credit Ratings are assigned by an entity that is not a NRSRO and, consequently, the rated
obligation will not qualify for certain types of treatment under U.S. laws. MJKK and MSFJ are credit rating agencies registered with the
Japan Financial Services Agency and their registration numbers are FSA Commissioner (Ratings) No. 2
and 3 respectively.
MJKK or MSFJ (as applicable) hereby disclose that most issuers of debt securities (including corporate and municipal bonds, debentures, notes and
commercial paper) and preferred stock rated by MJKK or MSFJ (as applicable) have, prior to assignment of any rating, agreed to pay to MJKK or
MSFJ (as applicable) for appraisal and rating services rendered by it fees ranging from JPY200,000 to approximately JPY350,000,000.
MJKK and MSFJ also maintain policies and procedures to address Japanese regulatory requirements.