monthly financial report - phoenix, arizona
TRANSCRIPT

City of Phoenix, Arizona
Monthly Financial Report
December 2012


-1-
Monthly Financial Report – December 2012 Executive Summary
Budget
• The budget amounts in this report represent the official adopted budget, as approved by the City Council, for fiscal year 2012-13.
Revenues
• Local Taxes and the City’s portion of State Shared Taxes comprise the major portion, approximately 74 percent, of estimated General Fund revenues. At the end of December 2012, local sales tax revenues were $2.0 million higher than through the prior December. State Shared Taxes were $15.9 million higher compared to the same period in the prior year, an increase of 11.6%. Overall, General Fund revenues through December are 4.1% higher than the same period in the prior year. (see page 2).
• Citywide, including enterprise funds, operating revenues at the end of December 2012 are $62.1 million higher than year-to-date revenues through the prior December. $29.7 million of that is due to the sale of property in McMullen Valley by the Water Department. Without that sale, operating revenues are 2.2% higher through December 2012 than through December 2011. (see page 7)
Expenditures
• General Fund expenditures at the end of December 2012 are $23.3 million more than they were through December of the prior fiscal year, a 4.5% increase. (see page 3)
• Citywide operating expenditures at the end of December 2012 are $40.9 million more than year-to-date expenditures at December 2011, a 2.6% increase. (See pages 5 & 9) Increased spending resulting from American Recovery and Reinvestment Act (ARRA) Neighborhood Stabilization Program grants (Community Development), the defeasance (early payoff) of bonds related to McMullen Valley debt service (Environmental Services), and the start of construction for the Light Rail northwest extension (Transportation), was partially offset by reduced debt service and capital improvement expenditures.
• Citywide capital expenditures at the end of December 2012 are $197.3 million less than year-to-date expenditures at December 2011, a 48.6% decrease. This is primarily due to a decrease in Aviation capital expenditures resulting from lower spending on the Sky Train project as it nears completion.
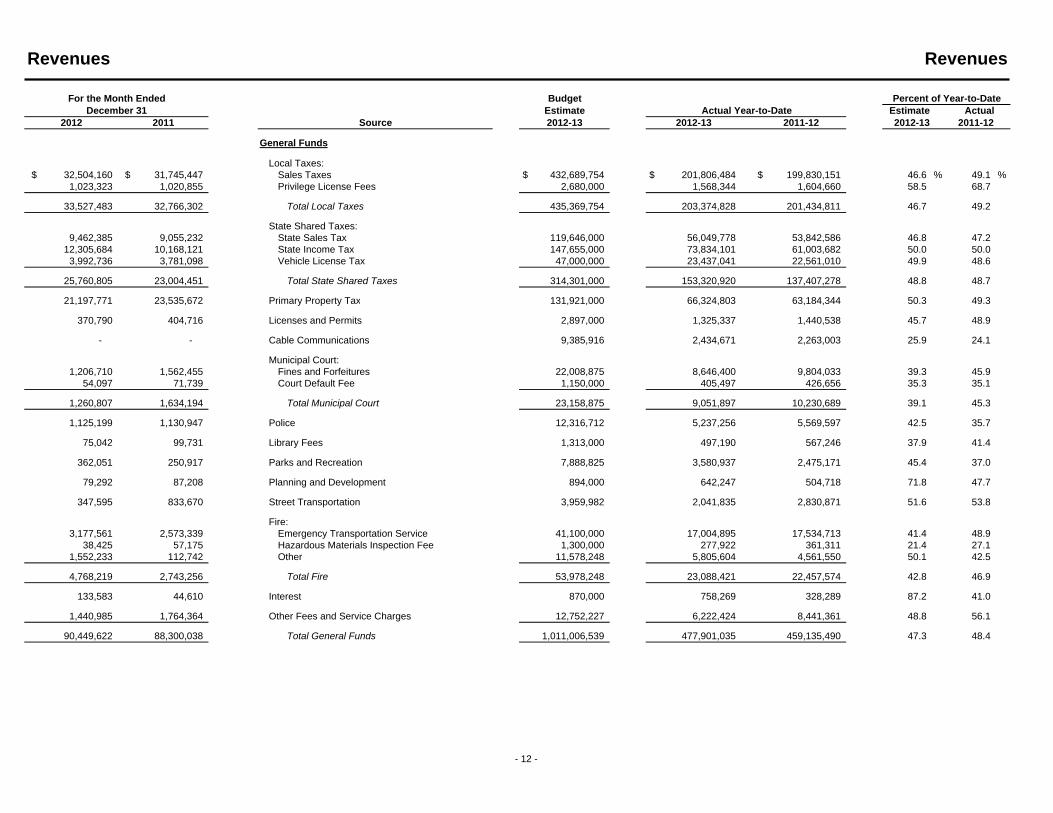
General FundsSummary
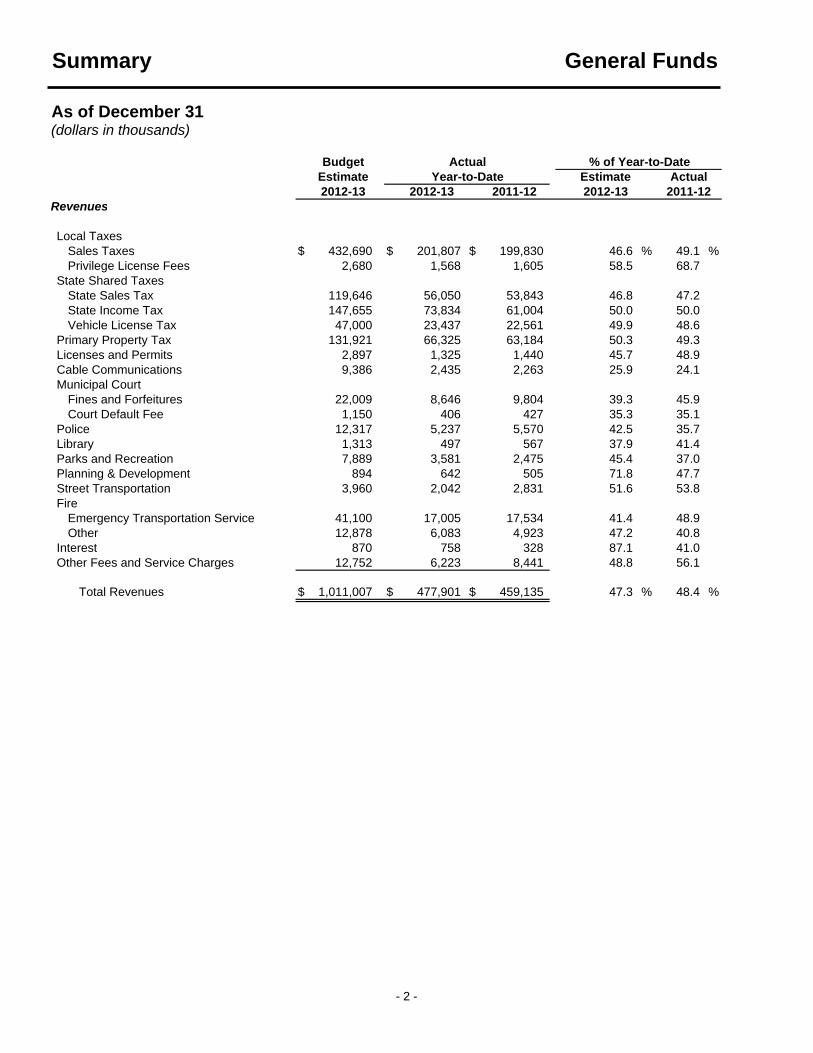
Summary General Funds
As of December 31(dollars in thousands)
BudgetEstimate2012-13 2012-13 2011-12
Revenues
Local TaxesSales Taxes $ 432,690 $ 201,807 $ 199,830 46.6 % 49.1 %Privilege License Fees 2,680 1,568 1,605 58.5 68.7
State Shared TaxesState Sales Tax 119,646 56,050 53,843 46.8 47.2 State Income Tax 147,655 73,834 61,004 50.0 50.0 Vehicle License Tax 47,000 23,437 22,561 49.9 48.6
Primary Property Tax 131,921 66,325 63,184 50.3 49.3 Licenses and Permits 2,897 1,325 1,440 45.7 48.9 Cable Communications 9,386 2,435 2,263 25.9 24.1 Municipal Court
Fines and Forfeitures 22,009 8,646 9,804 39.3 45.9 Court Default Fee 1,150 406 427 35.3 35.1
Police 12,317 5,237 5,570 42.5 35.7 Library 1,313 497 567 37.9 41.4 Parks and Recreation 7,889 3,581 2,475 45.4 37.0 Planning & Development 894 642 505 71.8 47.7 Street Transportation 3,960 2,042 2,831 51.6 53.8 Fire
Emergency Transportation Service 41,100 17,005 17,534 41.4 48.9 Other 12,878 6,083 4,923 47.2 40.8
Interest 870 758 328 87.1 41.0 Other Fees and Service Charges 12,752 6,223 8,441 48.8 56.1
Total Revenues $ 1,011,007 $ 477,901 $ 459,135 47.3 % 48.4 %
2012-13 2011-12
Actual % of Year-to-DateYear-to-Date Estimate Actual
- 2 -
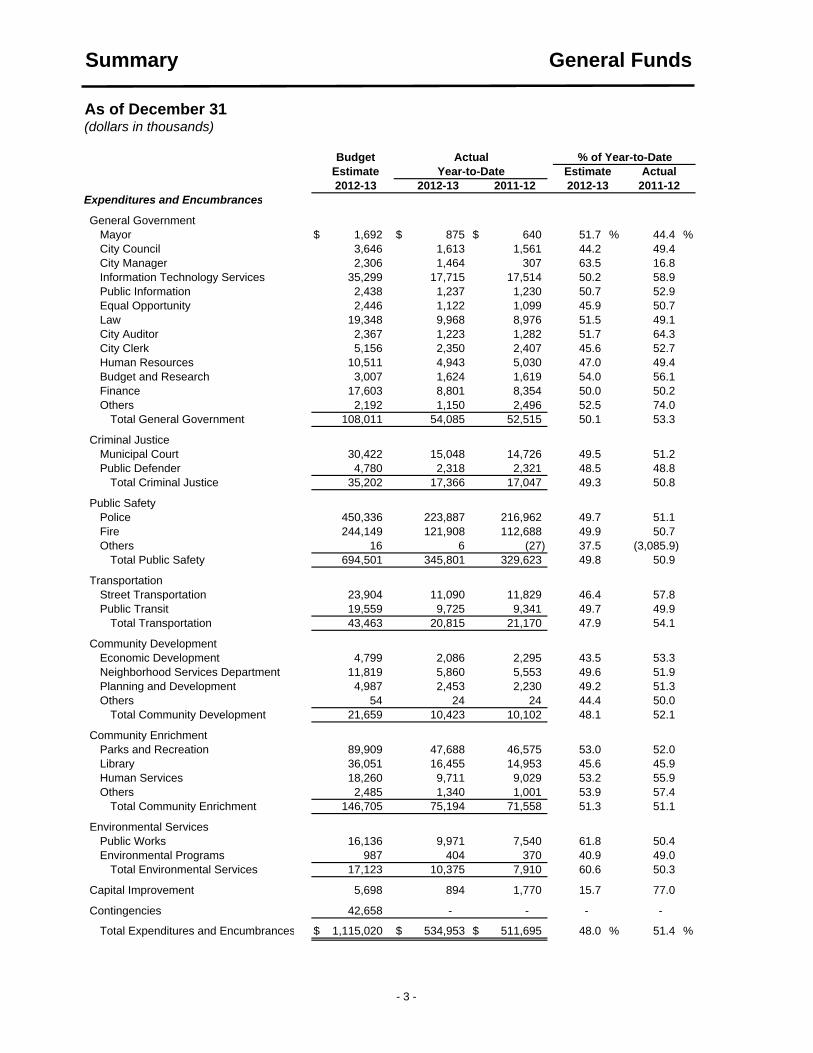
Summary General Funds
As of December 31(dollars in thousands)
BudgetEstimate2012-13 2012-13 2011-12
Expenditures and Encumbrances
General GovernmentMayor $ 1,692 $ 875 $ 640 51.7 % 44.4 %City Council 3,646 1,613 1,561 44.2 49.4 City Manager 2,306 1,464 307 63.5 16.8 Information Technology Services 35,299 17,715 17,514 50.2 58.9 Public Information 2,438 1,237 1,230 50.7 52.9 Equal Opportunity 2,446 1,122 1,099 45.9 50.7 Law 19,348 9,968 8,976 51.5 49.1 City Auditor 2,367 1,223 1,282 51.7 64.3 City Clerk 5,156 2,350 2,407 45.6 52.7 Human Resources 10,511 4,943 5,030 47.0 49.4 Budget and Research 3,007 1,624 1,619 54.0 56.1 Finance 17,603 8,801 8,354 50.0 50.2 Others 2,192 1,150 2,496 52.5 74.0
Total General Government 108,011 54,085 52,515 50.1 53.3
Criminal JusticeMunicipal Court 30,422 15,048 14,726 49.5 51.2 Public Defender 4,780 2,318 2,321 48.5 48.8
Total Criminal Justice 35,202 17,366 17,047 49.3 50.8
Public SafetyPolice 450,336 223,887 216,962 49.7 51.1 Fire 244,149 121,908 112,688 49.9 50.7 Others 16 6 (27) 37.5 (3,085.9)
Total Public Safety 694,501 345,801 329,623 49.8 50.9
TransportationStreet Transportation 23,904 11,090 11,829 46.4 57.8 Public Transit 19,559 9,725 9,341 49.7 49.9
Total Transportation 43,463 20,815 21,170 47.9 54.1
Community DevelopmentEconomic Development 4,799 2,086 2,295 43.5 53.3 Neighborhood Services Department 11,819 5,860 5,553 49.6 51.9 Planning and Development 4,987 2,453 2,230 49.2 51.3 Others 54 24 24 44.4 50.0
Total Community Development 21,659 10,423 10,102 48.1 52.1
Community EnrichmentParks and Recreation 89,909 47,688 46,575 53.0 52.0 Library 36,051 16,455 14,953 45.6 45.9 Human Services 18,260 9,711 9,029 53.2 55.9 Others 2,485 1,340 1,001 53.9 57.4
Total Community Enrichment 146,705 75,194 71,558 51.3 51.1
Environmental ServicesPublic Works 16,136 9,971 7,540 61.8 50.4 Environmental Programs 987 404 370 40.9 49.0
Total Environmental Services 17,123 10,375 7,910 60.6 50.3
Capital Improvement 5,698 894 1,770 15.7 77.0
Contingencies 42,658 - - - -
Total Expenditures and Encumbrances $ 1,115,020 $ 534,953 $ 511,695 48.0 % 51.4 %
2012-13 2011-12
Actual % of Year-to-DateYear-to-Date Estimate Actual
- 3 -
CitywideSummary
Comparison to Prior Year Revenues
Revenues
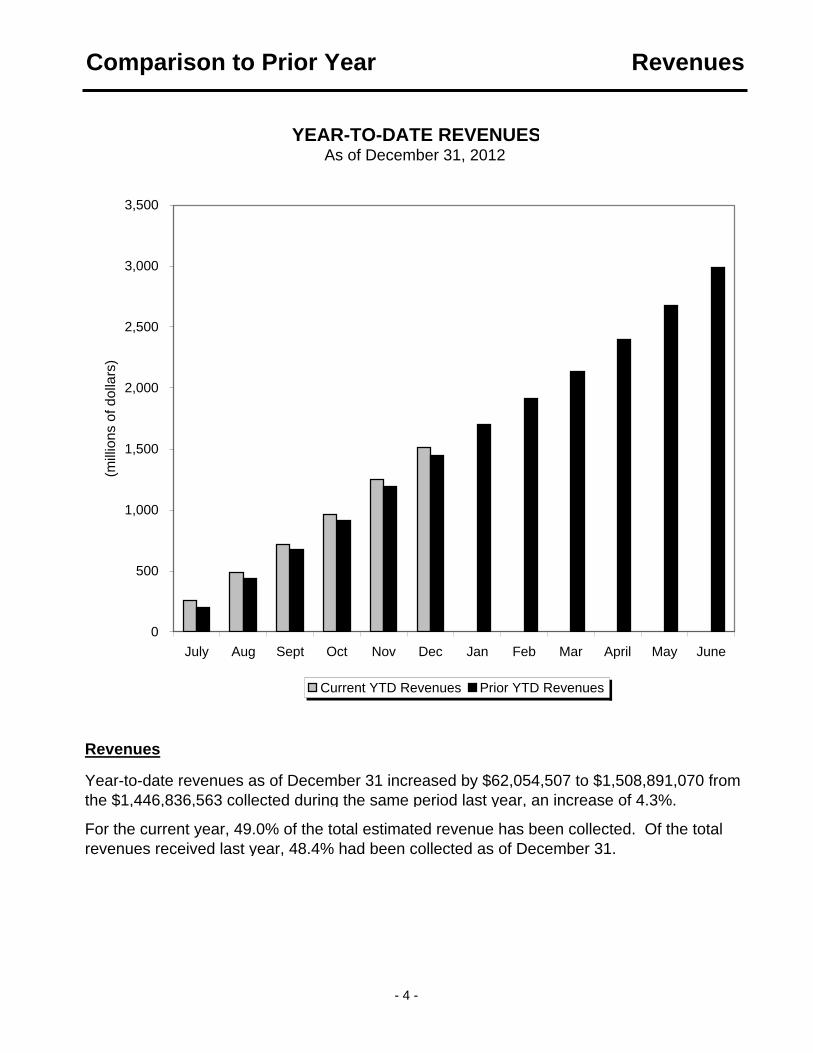
YEAR-TO-DATE REVENUESAs of December 31, 2012
Year-to-date revenues as of December 31 increased by $62,054,507 to $1,508,891,070 from the $1,446,836,563 collected during the same period last year, an increase of 4.3%.
For the current year, 49.0% of the total estimated revenue has been collected. Of the total revenues received last year, 48.4% had been collected as of December 31.
0
500
1,000
1,500
2,000
2,500
3,000
3,500
July Aug Sept Oct Nov Dec Jan Feb Mar April May June
(mill
ions
of d
olla
rs)
Current YTD Revenues Prior YTD Revenues
- 4 -

Comparison to Prior Year Operating Expenditures
Operating Expenditures
YEAR-TO-DATE OPERATING EXPENDITURESAs of December 31, 2012
For the current year, 44.5% of the total appropriations has been spent. Of the total actual expenditures for last year, 51.9% had been spent as of December 31.
For the entire City, including enterprise funds such as Water Services and Aviation, year-to-date operating expenditures as of December 31 increased $40,887,882 to $1,590,681,521 from the $1,549,793,639 spent during the same period last year, an increase of 2.6%.
0100200300400500600700800900
1,0001,1001,2001,3001,4001,5001,6001,7001,8001,9002,0002,1002,2002,3002,4002,5002,6002,7002,8002,9003,0003,1003,200
July Aug Sept Oct Nov Dec Jan Feb Mar April May June
(mill
ions
of d
olla
rs)
Current YTD Expenditures Prior YTD Expenditures
- 5 -
Comparison to Prior Year Capital Expenditures
Capital Expenditures
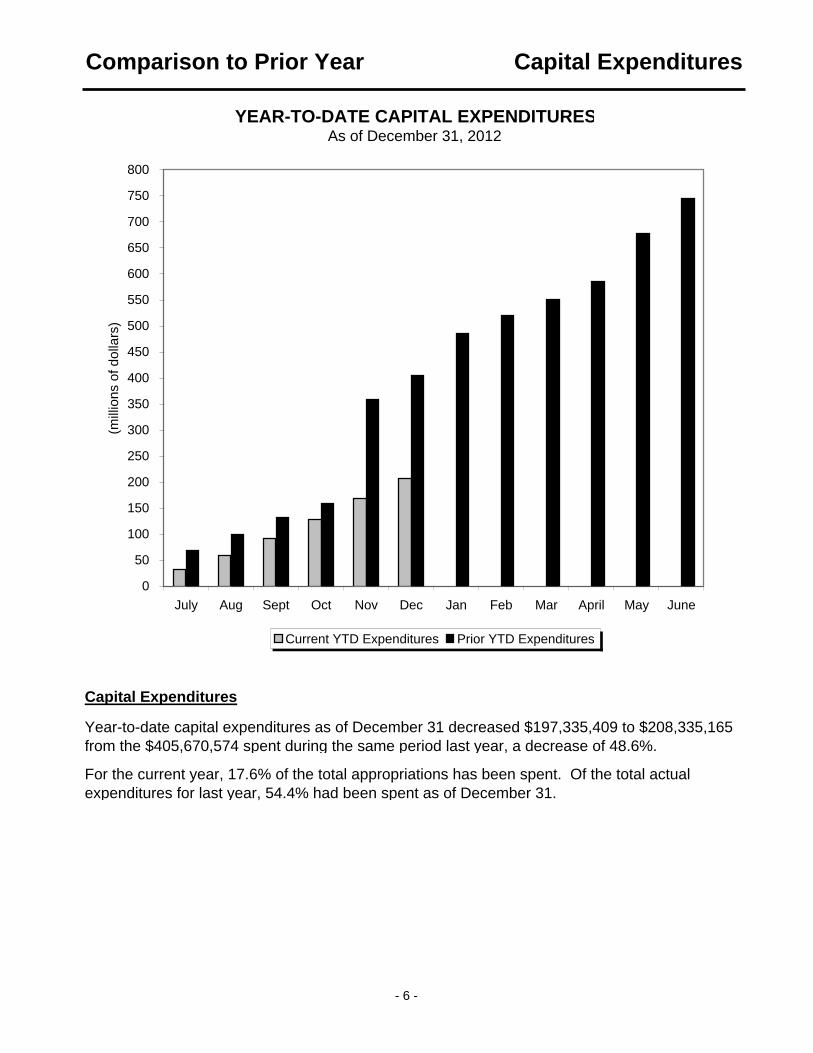
YEAR-TO-DATE CAPITAL EXPENDITURESAs of December 31, 2012
Year-to-date capital expenditures as of December 31 decreased $197,335,409 to $208,335,165 from the $405,670,574 spent during the same period last year, a decrease of 48.6%.
For the current year, 17.6% of the total appropriations has been spent. Of the total actual expenditures for last year, 54.4% had been spent as of December 31.
0
50
100
150
200
250
300
350
400
450
500
550
600
650
700
750
800
July Aug Sept Oct Nov Dec Jan Feb Mar April May June
(mill
ions
of d
olla
rs)
Current YTD Expenditures Prior YTD Expenditures
- 6 -

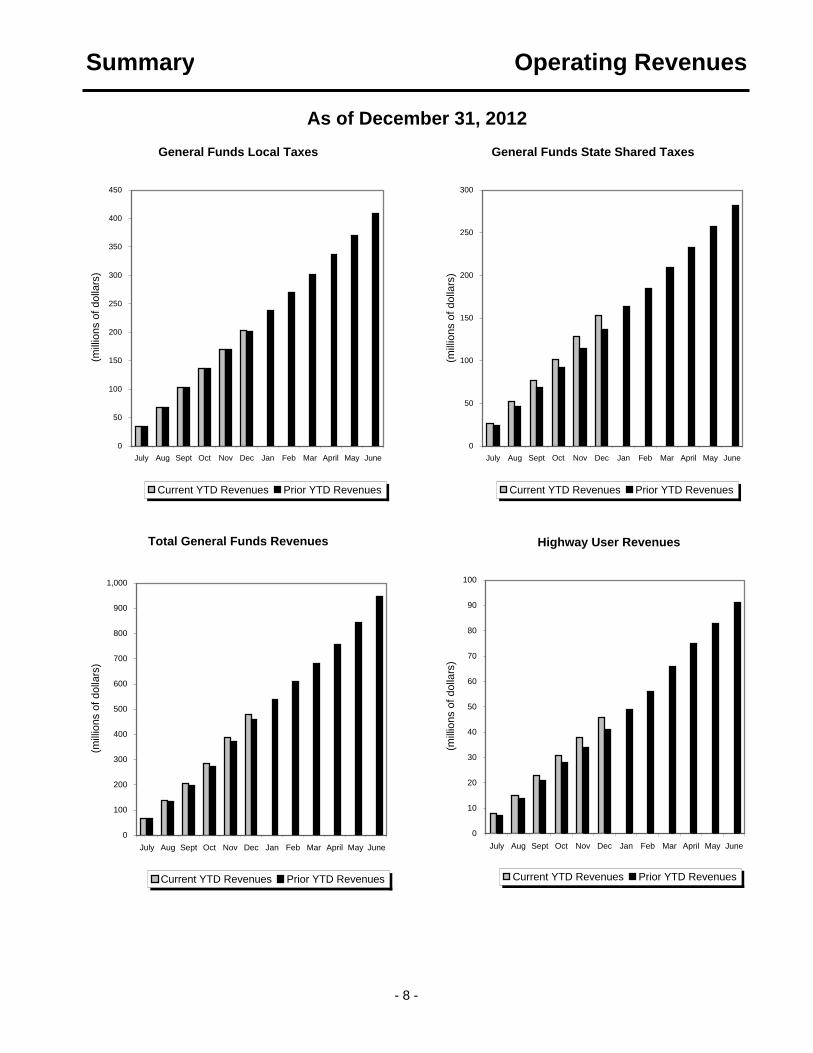
Summary Operating Revenues
As of December 31(dollars in thousands)
BudgetEstimate2012-13 2012-13 2011-12
General FundsLocal Taxes:
Sales Taxes $ 432,690 $ 201,807 $ 199,830 46.6 % 49.1 %Privilege License Fees 2,680 1,568 1,605 58.5 68.7
State Shared Taxes:State Sales Tax 119,646 56,050 53,843 46.8 47.2 State Income Tax 147,655 73,834 61,004 50.0 50.0 Vehicle License Tax 47,000 23,437 22,561 49.9 48.6
Primary Property Tax 131,921 66,325 63,184 50.3 49.3 Licenses and Permits 2,897 1,325 1,440 45.7 48.9 Cable Communications 9,386 2,435 2,263 25.9 24.1 Municipal Court 23,159 9,052 10,231 39.1 45.3 Police 12,317 5,237 5,570 42.5 35.7 Library Fees 1,313 497 567 37.9 41.4 Parks and Recreation 7,889 3,581 2,475 45.4 37.0 Planning & Development 894 642 505 71.8 47.7 Street Transportation 3,960 2,042 2,831 51.6 53.8 Fire 53,978 23,088 22,457 42.8 46.9 Interest 870 758 328 87.1 41.0 Other Fees and Service Charges 12,752 6,223 8,441 48.8 56.1
Total General Funds 1,011,007 477,901 459,135 47.3 48.4
Special Revenue Funds and Debt ServiceNeighborhood Protection 29,009 13,162 12,659 45.4 47.7 Public Safety Enhancement & Expansion 82,103 39,856 38,616 48.5 50.3 Parks and Preserves 29,472 13,150 12,805 44.6 47.6 Transit 2000 169,411 76,316 74,432 45.0 47.1 Court Awards 11,327 8,160 6,357 72.0 68.7 Planning and Development 33,990 19,552 16,162 57.5 49.4 Capital Construction 17,405 8,388 8,459 48.2 50.7 Sports Facilities 16,092 6,423 6,462 39.9 42.5 Highway User Revenue 102,211 45,695 41,057 44.7 45.2 Regional Transit Revenues 34,489 11,915 9,788 34.5 38.9 Community Reinvestment 3,564 2,039 681 57.2 21.2 Other Restricted Fees 26,785 16,588 11,822 61.9 34.8 Grants 274,742 98,987 88,310 36.0 34.2 G.O. Bond Debt Service 68,149 33,170 46,536 48.7 46.7
Total Special Revenue Funds andDebt Service 898,749 393,401 374,146 43.8 42.8
Enterprise FundsAviation 350,068 167,198 163,257 47.8 48.1 Convention Center 60,697 26,203 25,474 43.2 45.2 Water System 379,108 260,340 227,452 68.7 58.5 Wastewater 231,107 109,920 121,900 47.6 52.4 Solid Waste 144,972 71,487 73,189 49.3 50.7 Golf Courses 6,205 2,441 2,284 39.3 37.7
Total Enterprise Funds 1,172,157 637,589 613,556 54.4 52.5
Total Operating Revenues $ 3,081,913 $ 1,508,891 $ 1,446,837 49.0 % 48.4 %
SourceYear-to-Date
Actual % of Year-to-Date
2012-13Estimate
2011-12Actual
- 7 -
Summary Operating Revenues
As of December 31, 2012General Funds Local Taxes
0
50
100
150
200
250
300
350
400
450
July Aug Sept Oct Nov Dec Jan Feb Mar April May June
(mill
ions
of d
olla
rs)
Current YTD Revenues Prior YTD Revenues
General Funds State Shared Taxes
0
50
100
150
200
250
300
July Aug Sept Oct Nov Dec Jan Feb Mar April May June(m
illio
ns o
f dol
lars
)
Current YTD Revenues Prior YTD Revenues
Total General Funds Revenues
0
100
200
300
400
500
600
700
800
900
1,000
July Aug Sept Oct Nov Dec Jan Feb Mar April May June
(mill
ions
of d
olla
rs)
Current YTD Revenues Prior YTD Revenues
Highway User Revenues
0
10
20
30
40
50
60
70
80
90
100
July Aug Sept Oct Nov Dec Jan Feb Mar April May June
(mill
ions
of d
olla
rs)
Current YTD Revenues Prior YTD Revenues
- 8 -
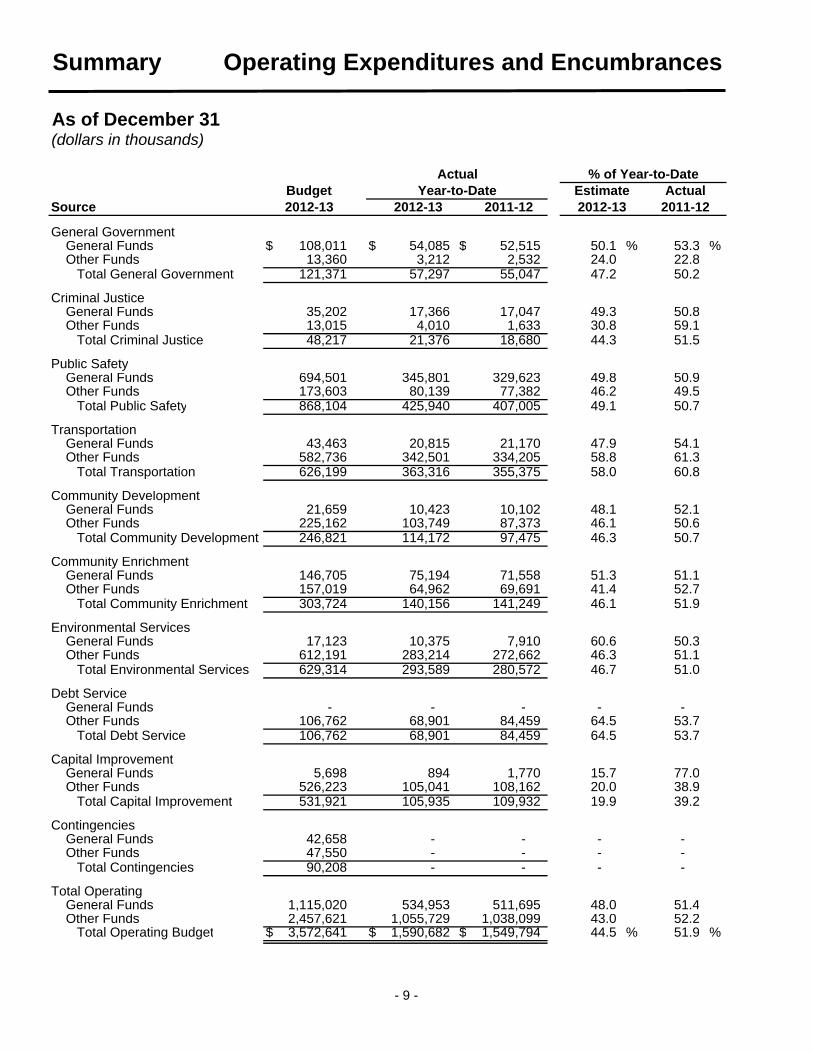
Summary Operating Expenditures and Encumbrances
As of December 31(dollars in thousands)
Source 2012-13 2011-12
General Government General Funds $ 108,011 $ 54,085 $ 52,515 50.1 % 53.3 % Other Funds 13,360 3,212 2,532 24.0 22.8 Total General Government 121,371 57,297 55,047 47.2 50.2
Criminal Justice General Funds 35,202 17,366 17,047 49.3 50.8 Other Funds 13,015 4,010 1,633 30.8 59.1 Total Criminal Justice 48,217 21,376 18,680 44.3 51.5
Public Safety General Funds 694,501 345,801 329,623 49.8 50.9 Other Funds 173,603 80,139 77,382 46.2 49.5 Total Public Safety 868,104 425,940 407,005 49.1 50.7
Transportation General Funds 43,463 20,815 21,170 47.9 54.1 Other Funds 582,736 342,501 334,205 58.8 61.3 Total Transportation 626,199 363,316 355,375 58.0 60.8
Community Development General Funds 21,659 10,423 10,102 48.1 52.1 Other Funds 225,162 103,749 87,373 46.1 50.6 Total Community Development 246,821 114,172 97,475 46.3 50.7
Community Enrichment General Funds 146,705 75,194 71,558 51.3 51.1 Other Funds 157,019 64,962 69,691 41.4 52.7 Total Community Enrichment 303,724 140,156 141,249 46.1 51.9
Environmental Services General Funds 17,123 10,375 7,910 60.6 50.3 Other Funds 612,191 283,214 272,662 46.3 51.1 Total Environmental Services 629,314 293,589 280,572 46.7 51.0
Debt Service General Funds - - - - - Other Funds 106,762 68,901 84,459 64.5 53.7 Total Debt Service 106,762 68,901 84,459 64.5 53.7
Capital Improvement General Funds 5,698 894 1,770 15.7 77.0 Other Funds 526,223 105,041 108,162 20.0 38.9 Total Capital Improvement 531,921 105,935 109,932 19.9 39.2
Contingencies General Funds 42,658 - - - - Other Funds 47,550 - - - - Total Contingencies 90,208 - - - -
Total Operating General Funds 1,115,020 534,953 511,695 48.0 51.4 Other Funds 2,457,621 1,055,729 1,038,099 43.0 52.2 Total Operating Budget $ 3,572,641 $ 1,590,682 $ 1,549,794 44.5 % 51.9 %
Actual % of Year-to-DateYear-to-Date Estimate Actual
2012-13 2011-122012-13Budget
- 9 -

Summary Operating Expenditures and Encumbrances
As of December 31, 2012Total General Government
0
20
40
60
80
100
120
July Aug Sept Oct Nov Dec Jan Feb Mar April May June
(milli
ons
of d
olla
rs)
Current YTD Expenditures Prior YTD Expenditures
Total Criminal Justice
0
10
20
30
40
July Aug Sept Oct Nov Dec Jan Feb Mar April May June
(milli
ons
of d
olla
rs)
Current YTD Expenditures Prior YTD Expenditures
Total Public Safety
0255075
100125150175200225250275300325350375400425450475500525550575600625650675700725750775800825850
July Aug Sept Oct Nov Dec Jan Feb Mar April May June
(milli
ons
of d
olla
rs)
Current YTD Expenditures Prior YTD Expenditures
Total Transportation
0255075
100125150175200225250275300325350375400425450475500525550575600625
July Aug Sept Oct Nov Dec Jan Feb Mar April May June
(milli
ons
of d
olla
rs)
Current YTD Expenditures Prior YTD Expenditures
see Note 1 on page 3 for General Government explanation.
- 10 -
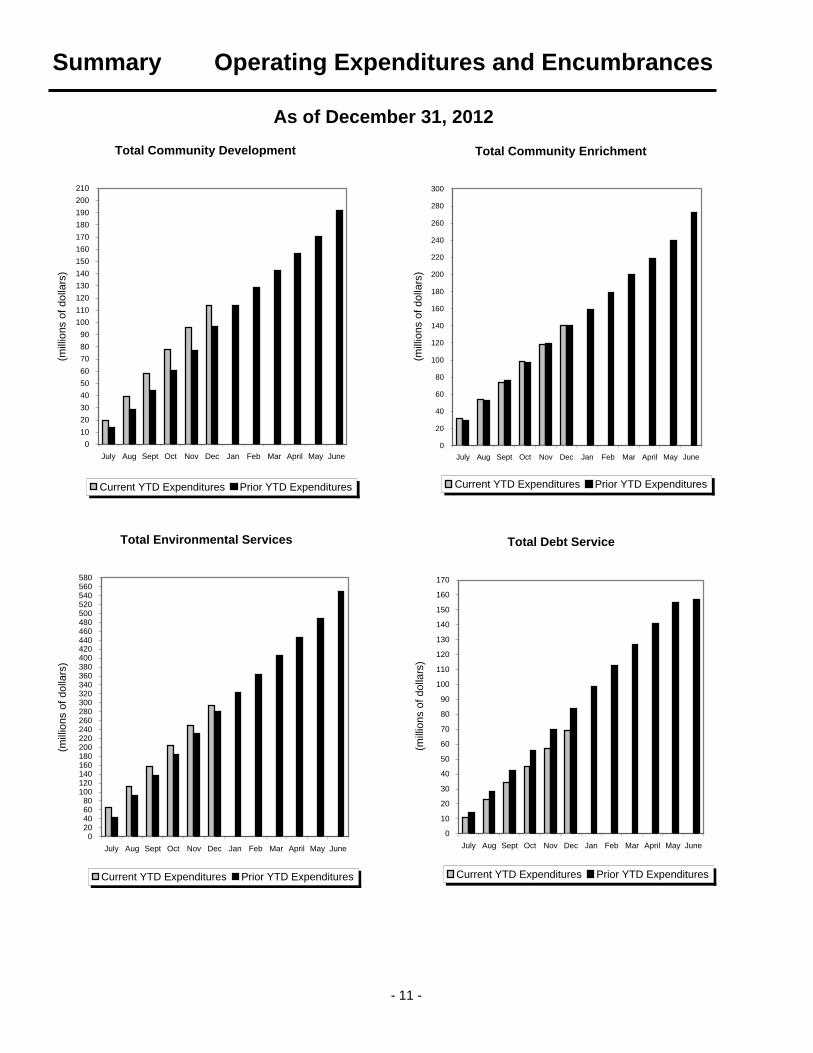
Summary Operating Expenditures and Encumbrances
As of December 31, 2012Total Community Development
0102030405060708090
100110120130140150160170180190200210
July Aug Sept Oct Nov Dec Jan Feb Mar April May June
(mill
ions
of d
olla
rs)
Current YTD Expenditures Prior YTD Expenditures
Total Community Enrichment
0
20
40
60
80
100
120
140
160
180
200
220
240
260
280
300
July Aug Sept Oct Nov Dec Jan Feb Mar April May June
(mill
ions
of d
olla
rs)
Current YTD Expenditures Prior YTD Expenditures
Total Environmental Services
020406080
100120140160180200220240260280300320340360380400420440460480500520540560580
July Aug Sept Oct Nov Dec Jan Feb Mar April May June
(mill
ions
of d
olla
rs)
Current YTD Expenditures Prior YTD Expenditures
Total Debt Service
0
10
20
30
40
50
60
70
80
90
100
110
120
130
140
150
160
170
July Aug Sept Oct Nov Dec Jan Feb Mar April May June
(mill
ions
of d
olla
rs)
Current YTD Expenditures Prior YTD Expenditures
- 11 -

CitywideDetail
Revenues Revenues
Estimate Actual2012-13 2011-12
General Funds
Local Taxes:$ 32,504,160 $ 31,745,447 Sales Taxes $ 432,689,754 $ 201,806,484 $ 199,830,151 46.6 % 49.1 %
1,023,323 1,020,855 Privilege License Fees 2,680,000 1,568,344 1,604,660 58.5 68.7
33,527,483 32,766,302 Total Local Taxes 435,369,754 203,374,828 201,434,811 46.7 49.2
State Shared Taxes:9,462,385 9,055,232 State Sales Tax 119,646,000 56,049,778 53,842,586 46.8 47.2
12,305,684 10,168,121 State Income Tax 147,655,000 73,834,101 61,003,682 50.0 50.0 3,992,736 3,781,098 Vehicle License Tax 47,000,000 23,437,041 22,561,010 49.9 48.6
25,760,805 23,004,451 Total State Shared Taxes 314,301,000 153,320,920 137,407,278 48.8 48.7
21,197,771 23,535,672 Primary Property Tax 131,921,000 66,324,803 63,184,344 50.3 49.3
370,790 404,716 Licenses and Permits 2,897,000 1,325,337 1,440,538 45.7 48.9
- - Cable Communications 9,385,916 2,434,671 2,263,003 25.9 24.1
Municipal Court:1,206,710 1,562,455 Fines and Forfeitures 22,008,875 8,646,400 9,804,033 39.3 45.9
54,097 71,739 Court Default Fee 1,150,000 405,497 426,656 35.3 35.1
1,260,807 1,634,194 Total Municipal Court 23,158,875 9,051,897 10,230,689 39.1 45.3
1,125,199 1,130,947 Police 12,316,712 5,237,256 5,569,597 42.5 35.7
75,042 99,731 Library Fees 1,313,000 497,190 567,246 37.9 41.4
362,051 250,917 Parks and Recreation 7,888,825 3,580,937 2,475,171 45.4 37.0
79,292 87,208 Planning and Development 894,000 642,247 504,718 71.8 47.7
347,595 833,670 Street Transportation 3,959,982 2,041,835 2,830,871 51.6 53.8
Fire:3,177,561 2,573,339 Emergency Transportation Service 41,100,000 17,004,895 17,534,713 41.4 48.9
38,425 57,175 Hazardous Materials Inspection Fee 1,300,000 277,922 361,311 21.4 27.1 1,552,233 112,742 Other 11,578,248 5,805,604 4,561,550 50.1 42.5
4,768,219 2,743,256 Total Fire 53,978,248 23,088,421 22,457,574 42.8 46.9
133,583 44,610 Interest 870,000 758,269 328,289 87.2 41.0
1,440,985 1,764,364 Other Fees and Service Charges 12,752,227 6,222,424 8,441,361 48.8 56.1
90,449,622 88,300,038 Total General Funds 1,011,006,539 477,901,035 459,135,490 47.3 48.4
2011December 31
For the Month Ended
2012-13Estimate
Source2012
Percent of Year-to-DateBudget
2012-13 2011-12Actual Year-to-Date
- 12 -
Revenues Revenues
Estimate Actual2012-13 2011-122011
December 31For the Month Ended
2012-13Estimate
Source2012
Percent of Year-to-DateBudget
2012-13 2011-12Actual Year-to-Date
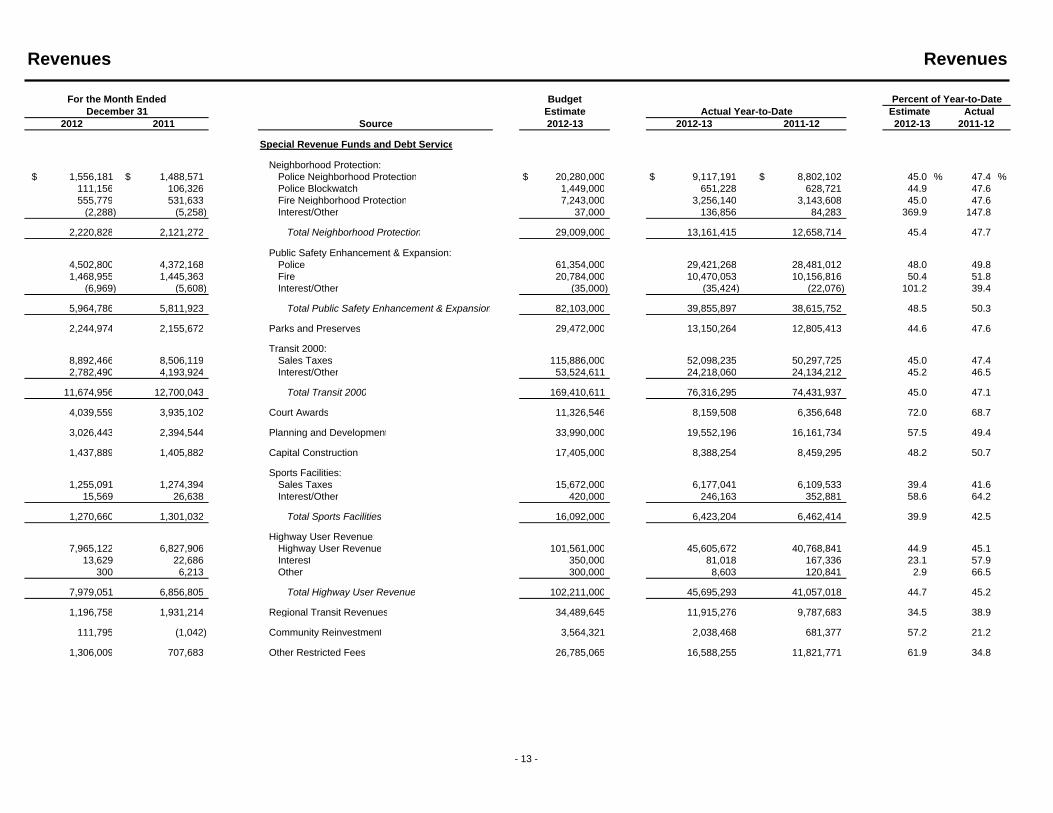
Special Revenue Funds and Debt Service
Neighborhood Protection:$ 1,556,181 $ 1,488,571 Police Neighborhood Protection $ 20,280,000 $ 9,117,191 $ 8,802,102 45.0 % 47.4 %
111,156 106,326 Police Blockwatch 1,449,000 651,228 628,721 44.9 47.6 555,779 531,633 Fire Neighborhood Protection 7,243,000 3,256,140 3,143,608 45.0 47.6
(2,288) (5,258) Interest/Other 37,000 136,856 84,283 369.9 147.8
2,220,828 2,121,272 Total Neighborhood Protection 29,009,000 13,161,415 12,658,714 45.4 47.7
Public Safety Enhancement & Expansion:4,502,800 4,372,168 Police 61,354,000 29,421,268 28,481,012 48.0 49.8 1,468,955 1,445,363 Fire 20,784,000 10,470,053 10,156,816 50.4 51.8
(6,969) (5,608) Interest/Other (35,000) (35,424) (22,076) 101.2 39.4
5,964,786 5,811,923 Total Public Safety Enhancement & Expansion 82,103,000 39,855,897 38,615,752 48.5 50.3
2,244,974 2,155,672 Parks and Preserves 29,472,000 13,150,264 12,805,413 44.6 47.6
Transit 2000:8,892,466 8,506,119 Sales Taxes 115,886,000 52,098,235 50,297,725 45.0 47.4 2,782,490 4,193,924 Interest/Other 53,524,611 24,218,060 24,134,212 45.2 46.5
11,674,956 12,700,043 Total Transit 2000 169,410,611 76,316,295 74,431,937 45.0 47.1
4,039,559 3,935,102 Court Awards 11,326,546 8,159,508 6,356,648 72.0 68.7
3,026,443 2,394,544 Planning and Development 33,990,000 19,552,196 16,161,734 57.5 49.4
1,437,889 1,405,882 Capital Construction 17,405,000 8,388,254 8,459,295 48.2 50.7
Sports Facilities:1,255,091 1,274,394 Sales Taxes 15,672,000 6,177,041 6,109,533 39.4 41.6
15,569 26,638 Interest/Other 420,000 246,163 352,881 58.6 64.2
1,270,660 1,301,032 Total Sports Facilities 16,092,000 6,423,204 6,462,414 39.9 42.5
Highway User Revenue:7,965,122 6,827,906 Highway User Revenue 101,561,000 45,605,672 40,768,841 44.9 45.1
13,629 22,686 Interest 350,000 81,018 167,336 23.1 57.9 300 6,213 Other 300,000 8,603 120,841 2.9 66.5
7,979,051 6,856,805 Total Highway User Revenue 102,211,000 45,695,293 41,057,018 44.7 45.2
1,196,758 1,931,214 Regional Transit Revenues 34,489,645 11,915,276 9,787,683 34.5 38.9
111,795 (1,042) Community Reinvestment 3,564,321 2,038,468 681,377 57.2 21.2
1,306,009 707,683 Other Restricted Fees 26,785,065 16,588,255 11,821,771 61.9 34.8
- 13 -
Revenues Revenues
Estimate Actual2012-13 2011-122011
December 31For the Month Ended
2012-13Estimate
Source2012
Percent of Year-to-DateBudget
2012-13 2011-12Actual Year-to-Date
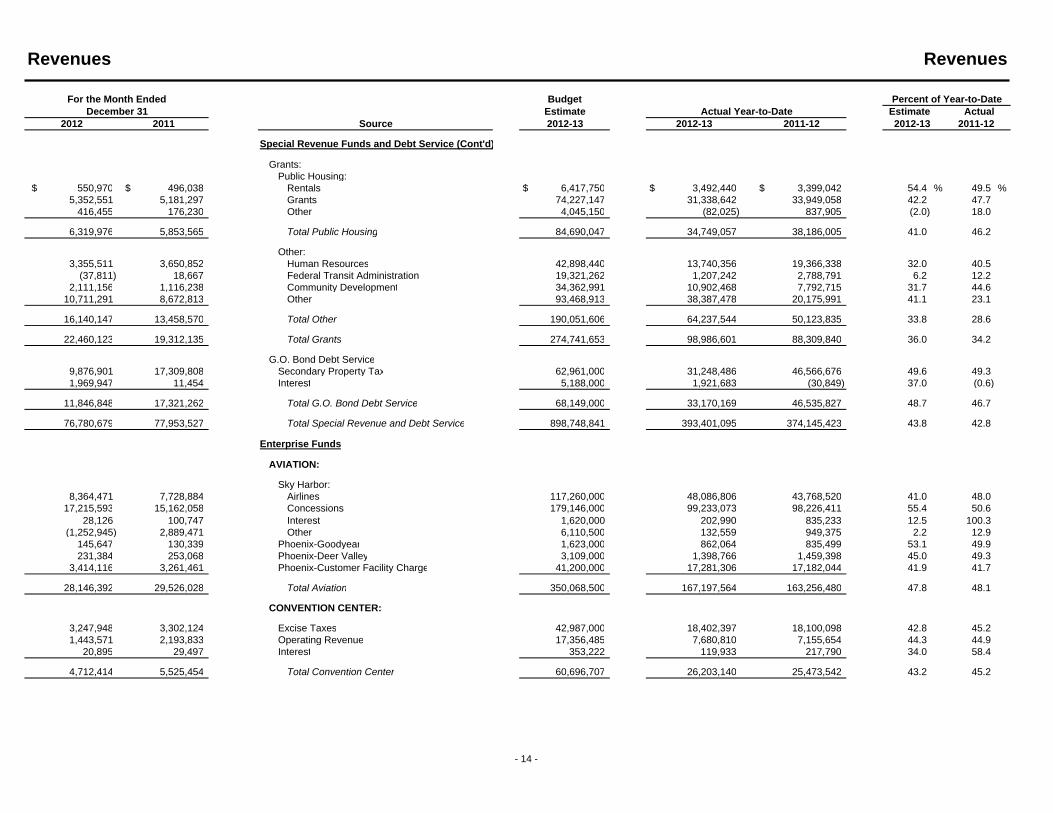
Special Revenue Funds and Debt Service (Cont'd)
Grants:Public Housing:
$ 550,970 $ 496,038 Rentals $ 6,417,750 $ 3,492,440 $ 3,399,042 54.4 % 49.5 %5,352,551 5,181,297 Grants 74,227,147 31,338,642 33,949,058 42.2 47.7
416,455 176,230 Other 4,045,150 (82,025) 837,905 (2.0) 18.0
6,319,976 5,853,565 Total Public Housing 84,690,047 34,749,057 38,186,005 41.0 46.2
Other:3,355,511 3,650,852 Human Resources 42,898,440 13,740,356 19,366,338 32.0 40.5
(37,811) 18,667 Federal Transit Administration 19,321,262 1,207,242 2,788,791 6.2 12.2 2,111,156 1,116,238 Community Development 34,362,991 10,902,468 7,792,715 31.7 44.6
10,711,291 8,672,813 Other 93,468,913 38,387,478 20,175,991 41.1 23.1
16,140,147 13,458,570 Total Other 190,051,606 64,237,544 50,123,835 33.8 28.6
22,460,123 19,312,135 Total Grants 274,741,653 98,986,601 88,309,840 36.0 34.2
G.O. Bond Debt Service9,876,901 17,309,808 Secondary Property Tax 62,961,000 31,248,486 46,566,676 49.6 49.3 1,969,947 11,454 Interest 5,188,000 1,921,683 (30,849) 37.0 (0.6)
11,846,848 17,321,262 Total G.O. Bond Debt Service 68,149,000 33,170,169 46,535,827 48.7 46.7
76,780,679 77,953,527 Total Special Revenue and Debt Service 898,748,841 393,401,095 374,145,423 43.8 42.8
Enterprise Funds
AVIATION:
Sky Harbor:8,364,471 7,728,884 Airlines 117,260,000 48,086,806 43,768,520 41.0 48.0
17,215,593 15,162,058 Concessions 179,146,000 99,233,073 98,226,411 55.4 50.6 28,126 100,747 Interest 1,620,000 202,990 835,233 12.5 100.3
(1,252,945) 2,889,471 Other 6,110,500 132,559 949,375 2.2 12.9 145,647 130,339 Phoenix-Goodyear 1,623,000 862,064 835,499 53.1 49.9 231,384 253,068 Phoenix-Deer Valley 3,109,000 1,398,766 1,459,398 45.0 49.3
3,414,116 3,261,461 Phoenix-Customer Facility Charge 41,200,000 17,281,306 17,182,044 41.9 41.7
28,146,392 29,526,028 Total Aviation 350,068,500 167,197,564 163,256,480 47.8 48.1
CONVENTION CENTER:
3,247,948 3,302,124 Excise Taxes 42,987,000 18,402,397 18,100,098 42.8 45.2 1,443,571 2,193,833 Operating Revenue 17,356,485 7,680,810 7,155,654 44.3 44.9
20,895 29,497 Interest 353,222 119,933 217,790 34.0 58.4
4,712,414 5,525,454 Total Convention Center 60,696,707 26,203,140 25,473,542 43.2 45.2
- 14 -
Revenues Revenues
Estimate Actual2012-13 2011-122011
December 31For the Month Ended
2012-13Estimate
Source2012
Percent of Year-to-DateBudget
2012-13 2011-12Actual Year-to-Date
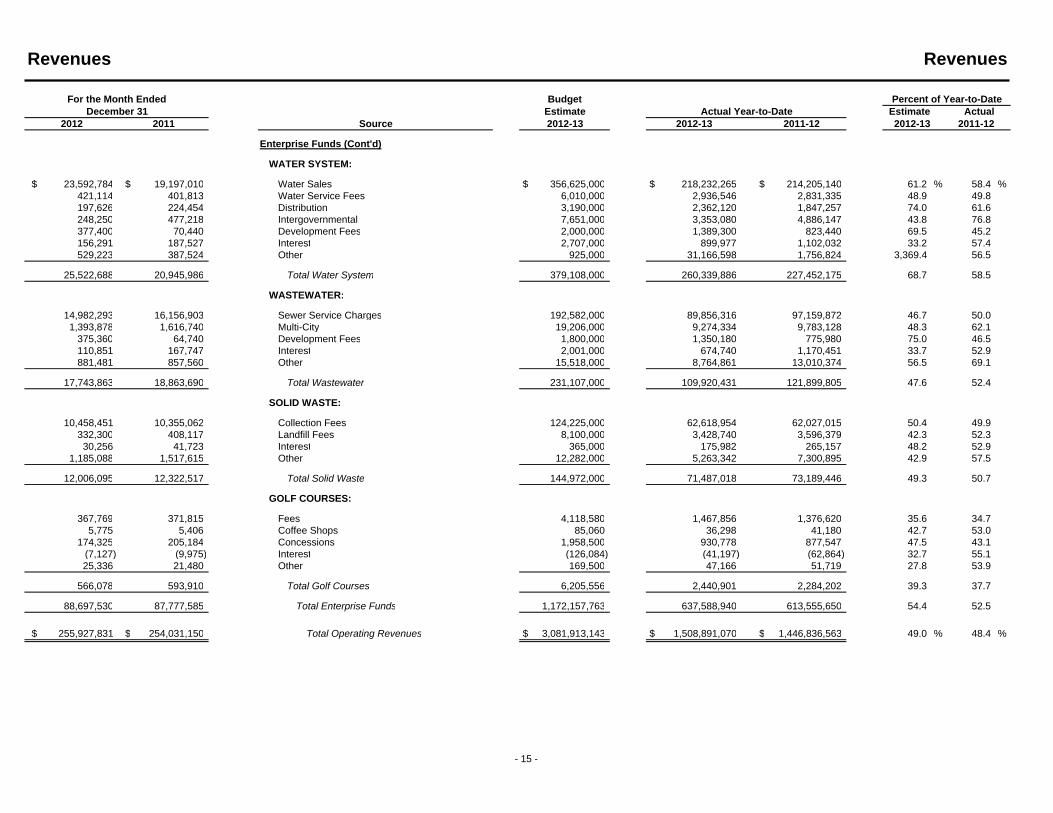
Enterprise Funds (Cont'd)
WATER SYSTEM:
$ 23,592,784 $ 19,197,010 Water Sales $ 356,625,000 $ 218,232,265 $ 214,205,140 61.2 % 58.4 %421,114 401,813 Water Service Fees 6,010,000 2,936,546 2,831,335 48.9 49.8 197,626 224,454 Distribution 3,190,000 2,362,120 1,847,257 74.0 61.6 248,250 477,218 Intergovernmental 7,651,000 3,353,080 4,886,147 43.8 76.8 377,400 70,440 Development Fees 2,000,000 1,389,300 823,440 69.5 45.2 156,291 187,527 Interest 2,707,000 899,977 1,102,032 33.2 57.4 529,223 387,524 Other 925,000 31,166,598 1,756,824 3,369.4 56.5
25,522,688 20,945,986 Total Water System 379,108,000 260,339,886 227,452,175 68.7 58.5
WASTEWATER:
14,982,293 16,156,903 Sewer Service Charges 192,582,000 89,856,316 97,159,872 46.7 50.0 1,393,878 1,616,740 Multi-City 19,206,000 9,274,334 9,783,128 48.3 62.1
375,360 64,740 Development Fees 1,800,000 1,350,180 775,980 75.0 46.5 110,851 167,747 Interest 2,001,000 674,740 1,170,451 33.7 52.9 881,481 857,560 Other 15,518,000 8,764,861 13,010,374 56.5 69.1
17,743,863 18,863,690 Total Wastewater 231,107,000 109,920,431 121,899,805 47.6 52.4
SOLID WASTE:
10,458,451 10,355,062 Collection Fees 124,225,000 62,618,954 62,027,015 50.4 49.9 332,300 408,117 Landfill Fees 8,100,000 3,428,740 3,596,379 42.3 52.3 30,256 41,723 Interest 365,000 175,982 265,157 48.2 52.9
1,185,088 1,517,615 Other 12,282,000 5,263,342 7,300,895 42.9 57.5
12,006,095 12,322,517 Total Solid Waste 144,972,000 71,487,018 73,189,446 49.3 50.7
GOLF COURSES:
367,769 371,815 Fees 4,118,580 1,467,856 1,376,620 35.6 34.7 5,775 5,406 Coffee Shops 85,060 36,298 41,180 42.7 53.0
174,325 205,184 Concessions 1,958,500 930,778 877,547 47.5 43.1 (7,127) (9,975) Interest (126,084) (41,197) (62,864) 32.7 55.1 25,336 21,480 Other 169,500 47,166 51,719 27.8 53.9
566,078 593,910 Total Golf Courses 6,205,556 2,440,901 2,284,202 39.3 37.7
88,697,530 87,777,585 Total Enterprise Funds 1,172,157,763 637,588,940 613,555,650 54.4 52.5
$ 255,927,831 $ 254,031,150 Total Operating Revenues $ 3,081,913,143 $ 1,508,891,070 $ 1,446,836,563 49.0 % 48.4 %
- 15 -

Operating Expenditures and Encumbrances
General Government
$ 137,108 $ 121,361 Mayor $ 1,692,427 $ 875,388 $ 639,919 $ 875,388 $ - 247,017 250,074 City Council 3,645,603 1,613,028 1,560,721 1,613,028 - 224,014 (916,249) City Manager 2,586,241 1,598,622 368,117 1,598,622 -
3,529,619 3,304,647 Information Technology Services 37,158,029 18,578,490 17,810,330 17,950,645 627,845 69,363 189,318 Government Relations 1,265,498 789,328 987,832 789,328 -
226,457 228,088 Public Information 2,749,291 1,430,139 1,404,244 1,430,139 - 227,800 227,137 Equal Opportunity 2,868,513 1,346,003 1,301,611 1,346,003 -
1,711,041 1,530,108 Law 20,780,565 10,735,136 9,904,245 10,735,136 - 155,641 139,341 City Auditor 2,367,167 1,223,236 1,281,877 1,223,236 - 377,064 371,244 City Clerk 5,334,050 2,349,519 2,414,896 2,349,519 -
4,064 292,690 Elections 812,985 269,618 1,605,812 269,618 - 893,888 1,015,075 Human Resources 11,970,394 5,625,744 5,219,003 5,094,790 530,954
5,647 (48,809) Retirement Systems - 77,151 3,720 77,151 - (22,578) 9,738 Phoenix Employment Relations Board 113,144 13,950 59,794 13,950 - 138,799 242,456 Budget and Research 3,006,705 1,624,420 1,618,770 1,624,420 -
1,936,908 2,041,669 Finance 20,557,525 10,239,909 9,803,574 10,147,631 92,278 638,305 507,656 Regional Wireless Cooperative 4,462,701 (1,093,103) (937,820) (1,093,103) -
10,500,157 9,505,544 Total General Government 121,370,838 57,296,578 55,046,645 56,045,501 1,251,077
Criminal Justice
3,178,668 2,707,404 Municipal Court 43,437,077 19,057,797 16,358,412 15,944,116 3,113,681 375,441 391,212 Public Defender 4,780,377 2,317,830 2,321,369 2,317,830 -
3,554,109 3,098,616 Total Criminal Justice 48,217,454 21,375,627 18,679,781 18,261,946 3,113,681
Public Safety
45,726,885 45,523,913 Police 576,653,193 281,847,170 272,799,537 279,069,405 2,777,765 23,153,970 24,337,250 Fire 290,047,826 143,783,179 134,047,620 142,556,653 1,226,526
43,442 62,118 Other 1,402,594 309,285 157,648 309,285 -
68,924,297 69,923,281 Total Public Safety 868,103,613 425,939,634 407,004,805 421,935,343 4,004,291
2012-13 Year-to-Date
Operations and DebtCapital
Operating Expenditures & Encumbrances
2012-13 2011-12Actual Year-to-Date
Program 2012-13EstimateBudget
2012 2011December 31
For the Month Ended
- 16 -
Operating Expenditures and Encumbrances
2012-13 Year-to-Date
Operations and DebtCapital
Operating Expenditures & Encumbrances
2012-13 2011-12Actual Year-to-Date
Program 2012-13EstimateBudget
2012 2011December 31
For the Month Ended
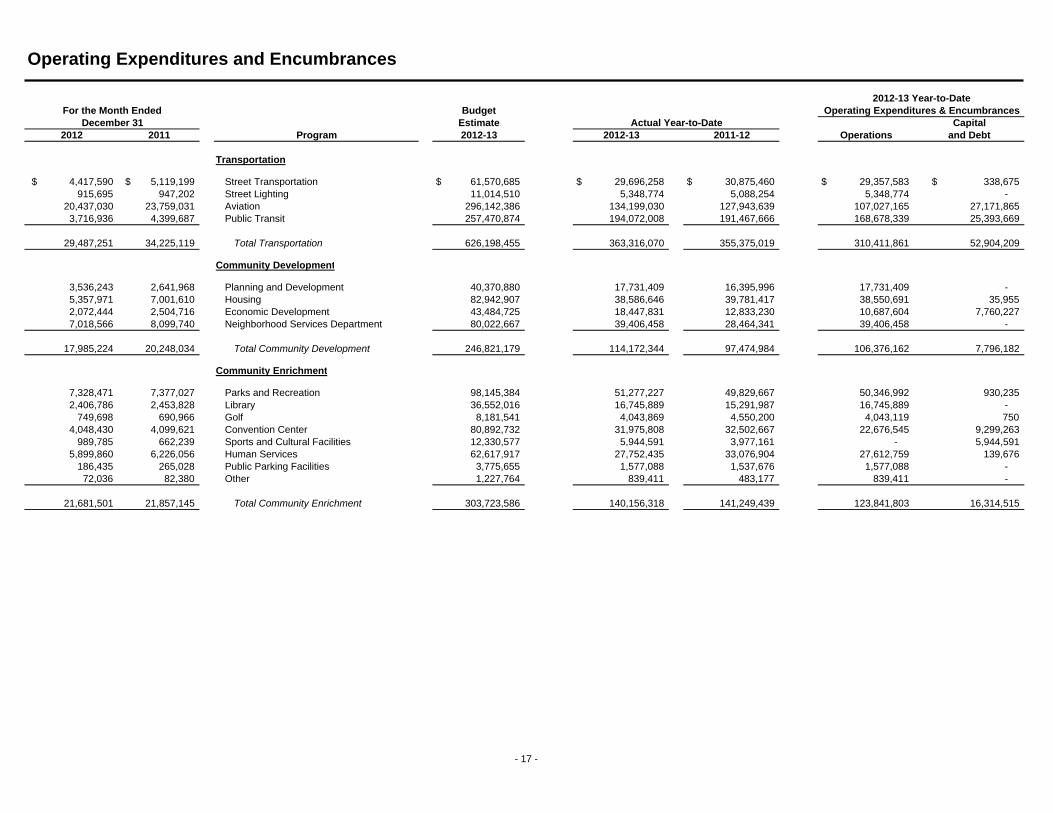
Transportation
$ 4,417,590 $ 5,119,199 Street Transportation $ 61,570,685 $ 29,696,258 $ 30,875,460 $ 29,357,583 $ 338,675 915,695 947,202 Street Lighting 11,014,510 5,348,774 5,088,254 5,348,774 -
20,437,030 23,759,031 Aviation 296,142,386 134,199,030 127,943,639 107,027,165 27,171,865 3,716,936 4,399,687 Public Transit 257,470,874 194,072,008 191,467,666 168,678,339 25,393,669
29,487,251 34,225,119 Total Transportation 626,198,455 363,316,070 355,375,019 310,411,861 52,904,209
Community Development
3,536,243 2,641,968 Planning and Development 40,370,880 17,731,409 16,395,996 17,731,409 - 5,357,971 7,001,610 Housing 82,942,907 38,586,646 39,781,417 38,550,691 35,955 2,072,444 2,504,716 Economic Development 43,484,725 18,447,831 12,833,230 10,687,604 7,760,227 7,018,566 8,099,740 Neighborhood Services Department 80,022,667 39,406,458 28,464,341 39,406,458 -
17,985,224 20,248,034 Total Community Development 246,821,179 114,172,344 97,474,984 106,376,162 7,796,182
Community Enrichment
7,328,471 7,377,027 Parks and Recreation 98,145,384 51,277,227 49,829,667 50,346,992 930,235 2,406,786 2,453,828 Library 36,552,016 16,745,889 15,291,987 16,745,889 -
749,698 690,966 Golf 8,181,541 4,043,869 4,550,200 4,043,119 750 4,048,430 4,099,621 Convention Center 80,892,732 31,975,808 32,502,667 22,676,545 9,299,263
989,785 662,239 Sports and Cultural Facilities 12,330,577 5,944,591 3,977,161 - 5,944,591 5,899,860 6,226,056 Human Services 62,617,917 27,752,435 33,076,904 27,612,759 139,676
186,435 265,028 Public Parking Facilities 3,775,655 1,577,088 1,537,676 1,577,088 - 72,036 82,380 Other 1,227,764 839,411 483,177 839,411 -
21,681,501 21,857,145 Total Community Enrichment 303,723,586 140,156,318 141,249,439 123,841,803 16,314,515
- 17 -

Operating Expenditures and Encumbrances
2012-13 Year-to-Date
Operations and DebtCapital
Operating Expenditures & Encumbrances
2012-13 2011-12Actual Year-to-Date
Program 2012-13EstimateBudget
2012 2011December 31
For the Month Ended
Environmental Services
$ 22,736,282 $ 24,714,051 Water System $ 305,978,438 $ 150,784,373 $ 144,288,211 $ 88,353,672 $ 62,430,701 10,773,016 11,841,312 Wastewater 164,779,934 66,375,961 72,560,795 35,244,890 31,131,071 8,524,041 11,297,149 Solid Waste Management 134,597,120 63,023,518 55,123,368 56,561,502 6,462,016 2,211,602 1,593,438 Public Works 22,491,280 13,011,743 8,234,417 10,195,703 2,816,040
130,759 142,301 Environmental Programs 1,467,646 393,283 365,240 393,283 -
44,375,700 49,588,251 Total Environmental Services 629,314,418 293,588,878 280,572,031 190,749,050 102,839,828
General Obligation Debt Service
92,052 109,587 Aviation 1,104,655 552,313 657,527 - 552,313 974,295 1,023,152 Cultural Facilities 12,586,976 5,845,771 6,138,913 - 5,845,771
1,115,886 1,645,182 Downtown Development 22,011,525 6,695,313 9,871,092 - 6,695,313 - - Early Redemption - - - - -
22,945 17,614 Economic Development 235,585 137,670 105,682 - 137,670 395,269 342,066 Fire Protection 4,834,585 2,371,616 2,052,393 - 2,371,616 32,235 55,981 Freeway Mitigation 676,265 193,413 335,883 - 193,413
266,725 343,288 Historic/Neighborhood Preservation 4,672,507 1,600,347 2,059,727 - 1,600,347 52,571 56,453 Human Services 845,364 315,425 338,722 - 315,425
386,093 772,733 Information Systems 7,485,581 2,316,558 4,636,398 - 2,316,558 566,430 590,384 Libraries 7,623,820 3,398,580 3,542,307 - 3,398,580 42,333 77,460 Maintenance Service Centers 1,058,524 253,996 464,761 - 253,996
1,235,251 2,091,377 Mountain Preserves/Parks 21,334,286 7,411,507 12,548,260 - 7,411,507 4,183 4,183 Municipal Administration Buildings 50,200 25,100 25,100 - 25,100
521,430 669,476 Police Protection 8,322,272 3,128,577 4,016,856 - 3,128,577 108,556 129,961 Public Housing Renovation 1,849,762 651,337 779,766 - 651,337 867,808 431,277 Sanitary Sewers 6,317,402 3,031,986 2,587,660 - 3,031,986
- - Secondary Property Tax (59,195,407) 2,207 3,828 - 2,207 39,434 153,823 Solid Waste Enterprise Bonds 1,847,394 236,601 922,938 - 236,601
2,205,373 2,636,619 Storm Sewer Improvements 27,545,652 13,232,240 15,819,713 - 13,232,240 2,286,343 2,317,091 Street Improvements 27,987,298 13,718,056 13,902,545 - 13,718,056
18,767 25,534 Street Light Refinancing 225,213 112,606 153,206 - 112,606 718,595 582,467 Water System 7,342,210 3,669,397 3,495,531 - 3,669,397
11,952,574 14,075,708 Total Debt Service 106,761,669 68,900,616 84,458,808 - 68,900,616
23,280,757 31,526,500 Capital Improvement 531,921,454 105,935,456 109,932,127 - 105,935,456
- - Contingencies 90,208,390 - - - -
$ 231,741,570 $ 254,048,198 Total Operating Budget $ 3,572,641,056 $ 1,590,681,521 $ 1,549,793,639 $ 1,227,621,666 $ 363,059,855
- 18 -
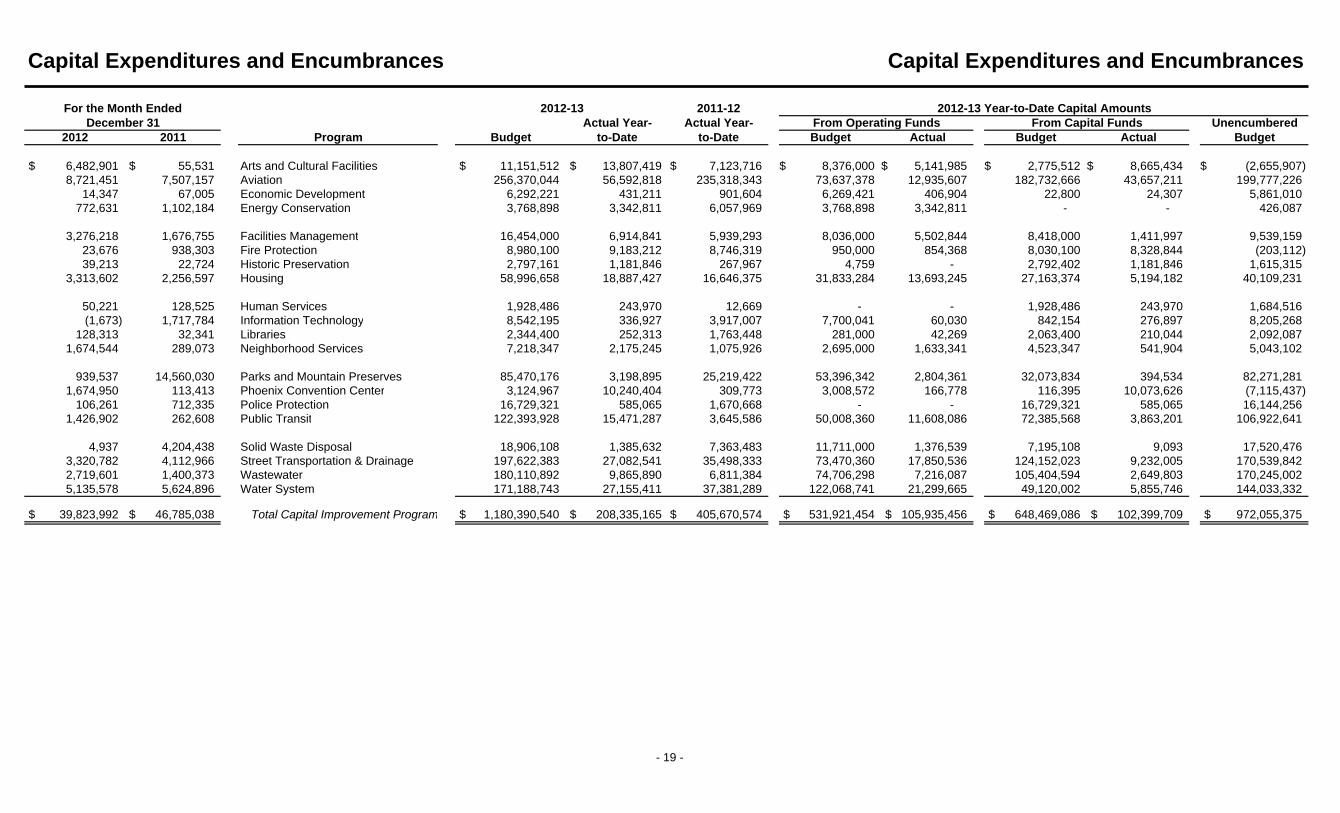
Capital Expenditures and Encumbrances Capital Expenditures and Encumbrances
$ 6,482,901 $ 55,531 Arts and Cultural Facilities $ 11,151,512 $ 13,807,419 $ 7,123,716 $ 8,376,000 $ 5,141,985 $ 2,775,512 $ 8,665,434 $ (2,655,907) 8,721,451 7,507,157 Aviation 256,370,044 56,592,818 235,318,343 73,637,378 12,935,607 182,732,666 43,657,211 199,777,226
14,347 67,005 Economic Development 6,292,221 431,211 901,604 6,269,421 406,904 22,800 24,307 5,861,010 772,631 1,102,184 Energy Conservation 3,768,898 3,342,811 6,057,969 3,768,898 3,342,811 - - 426,087
3,276,218 1,676,755 Facilities Management 16,454,000 6,914,841 5,939,293 8,036,000 5,502,844 8,418,000 1,411,997 9,539,159 23,676 938,303 Fire Protection 8,980,100 9,183,212 8,746,319 950,000 854,368 8,030,100 8,328,844 (203,112) 39,213 22,724 Historic Preservation 2,797,161 1,181,846 267,967 4,759 - 2,792,402 1,181,846 1,615,315
3,313,602 2,256,597 Housing 58,996,658 18,887,427 16,646,375 31,833,284 13,693,245 27,163,374 5,194,182 40,109,231
50,221 128,525 Human Services 1,928,486 243,970 12,669 - - 1,928,486 243,970 1,684,516 (1,673) 1,717,784 Information Technology 8,542,195 336,927 3,917,007 7,700,041 60,030 842,154 276,897 8,205,268
128,313 32,341 Libraries 2,344,400 252,313 1,763,448 281,000 42,269 2,063,400 210,044 2,092,087 1,674,544 289,073 Neighborhood Services 7,218,347 2,175,245 1,075,926 2,695,000 1,633,341 4,523,347 541,904 5,043,102
939,537 14,560,030 Parks and Mountain Preserves 85,470,176 3,198,895 25,219,422 53,396,342 2,804,361 32,073,834 394,534 82,271,281 1,674,950 113,413 Phoenix Convention Center 3,124,967 10,240,404 309,773 3,008,572 166,778 116,395 10,073,626 (7,115,437)
106,261 712,335 Police Protection 16,729,321 585,065 1,670,668 - - 16,729,321 585,065 16,144,256 1,426,902 262,608 Public Transit 122,393,928 15,471,287 3,645,586 50,008,360 11,608,086 72,385,568 3,863,201 106,922,641
4,937 4,204,438 Solid Waste Disposal 18,906,108 1,385,632 7,363,483 11,711,000 1,376,539 7,195,108 9,093 17,520,476 3,320,782 4,112,966 Street Transportation & Drainage 197,622,383 27,082,541 35,498,333 73,470,360 17,850,536 124,152,023 9,232,005 170,539,842 2,719,601 1,400,373 Wastewater 180,110,892 9,865,890 6,811,384 74,706,298 7,216,087 105,404,594 2,649,803 170,245,002 5,135,578 5,624,896 Water System 171,188,743 27,155,411 37,381,289 122,068,741 21,299,665 49,120,002 5,855,746 144,033,332
$ 39,823,992 $ 46,785,038 Total Capital Improvement Program $ 1,180,390,540 $ 208,335,165 $ 405,670,574 $ 531,921,454 $ 105,935,456 $ 648,469,086 $ 102,399,709 $ 972,055,375
UnencumberedBudget
2012-13 Year-to-Date Capital AmountsFrom Capital Funds
Budget ActualBudget ActualFrom Operating Funds
2012 2011December 31
For the Month Ended 2012-13
to-DateActual Year-
Program Budget to-DateActual Year-
2011-12
- 19 -

Bonds Authorized and Sold
As of December 31(dollars in thousands)
1988 AuthorizationsGeneral Obligation Bonds
Freeway Mitigation, Neighborhood Stabilization,and Slum and Blight Elimination $ 29,285 $ 28,285 $ 1,000
Bonds Fully Issued 884,175 884,175 - Total General Obligation Bonds 913,460 912,460 1,000
Revenue BondsBonds Fully Issued 143,890 143,890 -
Total 1988 Authorizations 1,057,350 1,056,350 1,000
2001 AuthorizationGeneral Obligation Bonds
Education, Youth and Family Cultural Facilities 66,300 64,600 1,700 Computer Technology 125,300 124,685 615 Environmental Cleanup 24,800 24,170 630 Fire Protection 61,500 60,700 800 Historic Preservation 12,000 11,205 795 Library Facilities 33,000 32,100 900 Street Improvements 91,500 89,275 2,225 Neighborhood Protection and Senior Centers 74,000 71,645 2,355 Parks, Open Space, and Recreational Facilities 77,000 72,575 4,425 Police Protection 78,800 77,685 1,115 Storm Sewer and Flood Protection 66,000 65,950 50 Bonds Fully Issued 43,700 43,700 -
Total 2001 Authorizations 753,900 738,290 15,610
2006 AuthorizationGeneral Obligation Bonds
Affordable Housing and Neighborhood Revitalization 81,000 63,385 17,615 Computer Technology 11,100 8,510 2,590 Education and Health Science Facilities 198,700 190,610 8,090 Environmental Cleanup 12,800 8,345 4,455 Family, Senior, and Youth Cultural Facilities 104,622 85,510 19,112 Fire Protection 74,705 61,200 13,505 Library Facilities and Improvements 29,178 21,100 8,078 Parks, Open Space, and Recreational Facilities 115,500 102,290 13,210 Police Protection 107,295 81,900 25,395 Street Improvements 78,200 58,135 20,065 Storm Sewer and Flood Protection 65,400 61,770 3,630
Total 2006 Authorizations 878,500 742,755 135,745
Total Bond Program $ 2,689,750 $ 2,537,395 $ 152,355
Authorized Sold Available
- 20 -