monthly economic research.isbank ... - ekonomi.isbank.com.tr · mineral products drew attention....
TRANSCRIPT

research.isbank
Global Economy
IMF downgraded the global growth forecasts to 3.5% and 3.6%, respectively, in the January edition of World Economic Outlook for 2019 and 2020 . IMF stated that recession in the Turkish economy would be much deeper than expected previously. On the other hand, Institution did not announce growth forecasts for Turkey.
Having partially closed since December 22, the US government was temporarily reopened after 35 days.
Positive signals came from the trade talks between the US and China in January. The meetings will continue in China during February.
At the first meeting of 2019, Fed has kept the policy interest rate on hold in the range of 2.25-2.50%, in line with the expectations. In the meeting statement and Powell’s speech after the meeting, it was emphasized that Fed will be patient on the interest rate hikes in the coming period.
At its meeting in January, ECB did not change its monetary policy. ECB president Draghi pointed out that the economic activity in the region had a weak course.
UK Parliament, which turned down the Brexit agreement, voted to reject a no-deal Brexit in non-binding amendment. Besides, the Parliament approved Brexit amendment on replacing Irish backstop.
The Chinese economy grew by 6.6% in 2018, the weakest growth in last 28 years. The slowdown in the Chinese economy brings new measures to support the economy.
In January, oil prices rose by almost 20% due to the decline in Saudi Arabia's oil exports to the US and the US sanctions against Venezuela.
Turkish Economy
Calendar adjusted industrial production decreased by 6.5% yoy in November.
Unemployment rate increased 1.3 pts yoy to 11.6% in October. Manufacturing PMI, which was realized as 44.2 in January, pointed out that the slowdown in the sector continued for 10 consecutive months.
Foreign trade deficit decreased by 28.4% to 55 billion USD in 2018. During this period, export volume increased by 7% yoy to 168 billion USD while import volume declined by 4.6% to 223 billion USD.
Current account balance gave a surplus of 986 million USD in November. Foreign trade surplus and positive course in net tourism revenues led the improvement in current account balance. 12-month cumulative current account deficit fell to 33.9 billion USD, the lowest level since March 2017.
In 2018, central government budget deficit expanded by 24.8 billion TRY to 72.6 billion TRY. Year-end budget deficit came in line with NEP projections.
In January, CPI increased by 1.06% on a monthly basis and D-PPI rose by 0.45% in the same period. Thus, annual CPI and D-PPI became 20.35% and 32.93%, respectively.
CBRT kept the one week repo rate (policy rate) at 24%, at its meeting held on January 16.
February 2019
Monthly Economic Review
Economic Research Division İzlem Erdem Chief Economist [email protected]
Alper Gürler Unit Manager [email protected]
H. Erhan Gül Asst. Manager [email protected]
İlker Şahin Economist [email protected]
Gamze Can Economist [email protected]
Ayşim Kalkan Asst. Economist [email protected]
Turkish Economy ...……………………..…..………. 2
Financial Markets …………...…...…..…...………...5
Banking Sector.….…..………...…………………………….5
Concluding Remarks.………………………………6
Graphs……………………………………………..…………..…..………. 7
Tables…………………………………………………….…….……………...9

research.isbank
February 2019 2
Industrial production kept contracting in November.
Industrial production continued to contract in November, in line with the rebalancing in economic activity. According to the calendar adjusted figures, industrial production decreased by 6.5% in this period, while contraction in production of intermediate goods was 11.9%. In the manufacturing industry, where the production shrank by 7.1% yoy, production decreased in 18 out of 24 sectors. The double-digit contractions in important sectors such as automotive, basic metals and mineral products drew attention.
Manufacturing PMI had a flat course in January.
In the first month of 2019, manufacturing PMI remained flat compared to the previous month at 44.2. By remaining below 50 threshold for ten consecutive months, data indicates that the weakness in the sector continues. In the sub-groups of the index, the slowdown in new orders continues but the recovery in new export orders is remarkable. Although input prices continued to increase in January, this was the lowest increase in the last 4 months. Production sub-index decreased compared to December to 42.4, while employment continued to decline in January due to the decline in production.
Unemployment rate continued to increase.
In October period, unemployment rate posted 1.3 pts annual increase and was realized as 11.6%. Although labor force participation increased by 726 thousand people in one-year period, employment rose by only 225 thousand people, which led unemployment rate to rise in this period. The seasonally adjusted unemployment rate,
increasing since March, continued its upward trend and reached 11.5%. Although the number of people employed in services and agricultural sectors increased in this period, employment in industrial and construction sectors decreased.
Retail sales continued to decrease.
Annual contraction in domestic retail sales volume continused in November. According to the calendar adjusted figures at fixed prices, domestic retail sales decreased by 6.3% in November compared to the same month of the previous year. Non-food expenditures contracted at around 10% in this period, while food expenditures recorded the slowest annual increase in 2018 with 1.4%. Retail sales, which are the leading indicator of private consumption expenditures under GDP data, indicate a contraction in economic activity in the fourth quarter.
House prices have downward trend.
Home sales, which had declined by 27% yoy in November, posted a moderate recovery and increased by 2.9% in December. In this period, annual decrease at mortgaged home sales declined to 79% from 86%. In 2018, home sales declined by 2.4% compared to the previous year. Home sales to foreigners, on the other hand, gained momentum last year. Due to the incentives, home sales to foreigners, which were at around 22 thousand houses in 2017, climbed to 40 thousand houses in 2018.
House price increases in Turkey kept losing momentum in November. The annual increase in the quality-adjusted hedonic house price index dropped to 6.6%, the lowest level in the series announced since 2010. The real decrease in house prices was realized as 12.35% in November.
Due to the tax incentives, the contraction in white goods sales slowed down in the last 2 months of the year. The annual rate of decline, which was 50% in October, was realized as 15% in December. In 2018, domestic sales decreased by 17%. The export figures of the white goods sector, on the other hand, have a positive outlook. Sector’s export volume posted an annual increase by 8% in December and by 6% in the whole year.
Turkish Economy
Source: Datastream, Markit, Turkstat
-10
-5
0
5
10
15
2014 2015 2016 2017 2018
Domestic Retail Sales(calender adjusted, yoy % change)
9 .7
-6 .5-10
-5
0
5
10
15
20
J F M A M J J A S O N D
Industrial Production(caj, annual change %) 2017
2018
1 1.6
5 3.7
51
52
53
54
55
6
8
10
12
14
Apr-16 Oct-16 Apr-17 Oct-17 Apr-18 Oct-18
Labor Market(%)
Unemployment Rate
Labor Force Participation Rate (right axis)

research.isbank
February 2019 3
In 2018, budget deficit was in line with NEP projections.
In 2018, central government budget deficit expanded by 52% compared to 2017 and was realized as 72.6 billion TRY, in parallel with the projections of New Economic Program announced in September. In NEP, budget deficit/GDP ratios for 2018 and 2019 were expected to be 1.9% and 1.8%, respectively. Analysis of December figures reveals that tax revenues increased less than annual inflation due to slowdown in economic activity and tax cuts. On the expenditures front, on the other hand, non-interest expenditures lost significant momentum.
Foreign trade deficit declined by 28.4% in 2018.
Foreign trade deficit contracted for the seventh month in a row in December. In this period, export volume recorded a limited increase with 0.2% yoy and became 13.9 billion USD while import volume declined by 28.3% to 16.6 billion USD. Therefore, foreign trade deficit narrowed by 71.1% yoy to 2.7 billion USD. Import coverage ratio, which climbed to as high as 97% in October 2018, fell to 83.8% in the last month of 2018.
In 2018 as a whole, trade deficit declined by 28.4% yoy and stood at 55 billion USD. In this period, export volume increased by 7% and reached 168 billion USD, the record high level. Import volume fell by 4.6% to 223 billion USD.
According to the provisional data announced by the Ministry of Commerce based on New General Trading System, the foreign trade deficit continued to contract on an annual basis in the first month of 2019. In this period, exports increased by 6.3%, while imports decreased by 26.9%. Thusly, foreign trade deficit narrowed by 74.6% yoy.
Current account surplus was in line with expectations.
In November current account posted a surplus of 986 million USD, in line with expectations. Thus, current account balance gave a surplus in the fourth consecutive month due to the slowdown in the economic activity. During this period, foreign trade figures and positive course of tourism revenues were effective on current account balance. 12-month cumulative current account deficit (CAD) fell to 33.9 billion USD, the lowest level since March 2017. Besides, 12-month CAD excluding net energy trade gave a surplus of 4.7 billion USD as of November.
Portfolio investments recorded the best performance since January with a net capital inflow of 1.7 billion USD thanks to the government’s eurobond issuance. Besides, non-residents made net purchases of 346 million USD in equity market and 482 million USD in the government domestic debt securities market. Official reserves increased by 4.4 billion USD in November, while a net inflow of 994 million USD was recorded in net errors and omissions.
CPI inflation was in line with expectations.
In January, CPI increased in line with market expectations by 1.06% on a monthly basis. Domestic PPI (D-PPI), which declined in the last two months of 2018, also rose by 0.45% in January.
Annual CPI inflation, which reached 25.24% in October and declined to 20.3% at the end of 2018, increased slightly in January to 20.35%. The downward trend in annual D-PPI inflation, which has started in October, continued in the first month of 2019. Annual D-PPI inflation, which completed 2018 at 33.64%, became 32.93% in January. Prices of all main expenditure groups excluding clothing and footwear and housing increased on a monthly basis in January. Food and non-alcoholic beverages increased by 6.43% compared to the previous month and contributed 149 bps to the monthly CPI inflation.
Turkish Economy
Source: Turkstat, Datastream, CBRT, Ministry of Trade, Ministry of Treasury and Finance
Centra l G overnm ent Budget
%
2017 2018 Change
Expendi tures 678.3 830.4 22.4
Interest Expenditures 56.7 74.0 30.4
Non-Interest Expenditures 621.6 756.5 21.7
Revenues 630.5 757.8 20.2
Tax Revenues 536.6 621.3 15.8
Other Revenues 93.9 136.5 45.4
Budg et Ba lance -47.8 -72.6 52.0
Prim ary Ba lance 8.9 1.3 -84.9
January-Decem ber
7 .0
-4 .6
-20
-10
0
10
20
30
2015 2016 2017 2018
Foreign Trade(12-month cumulative , annual change, %)
Exports
Imports
-44.0
-9 .5
-31.8
17.6
-33.9
-10.0
-38.7
20.6
CABNet Gold
TradeNet Energy
TradeNet Tourism
Revenues(12 month cumulative, billion USD)
November 2017
November 2018
January
(change %) 2018 2019 2018 2019
Monthly 1.02 1.06 0.99 0.45
Annual 10.35 20.35 12.14 32.93
Annual Average 11.23 17.16 15.66 28.70
D-PPICPI
research.isbank
February 2019 4
Global markets…
Global markets displayed a positive outlook in the first month of 2019. The positive developments in the trade negotiations and the statements of major central banks stating support for economic activity led to increase in the global risk appetite. Accordingly, strong capital inflows to emerging markets were observed in January. In domestic markets, CBRT’s decisive stance regarding tight monetary policy supported TRY assets.
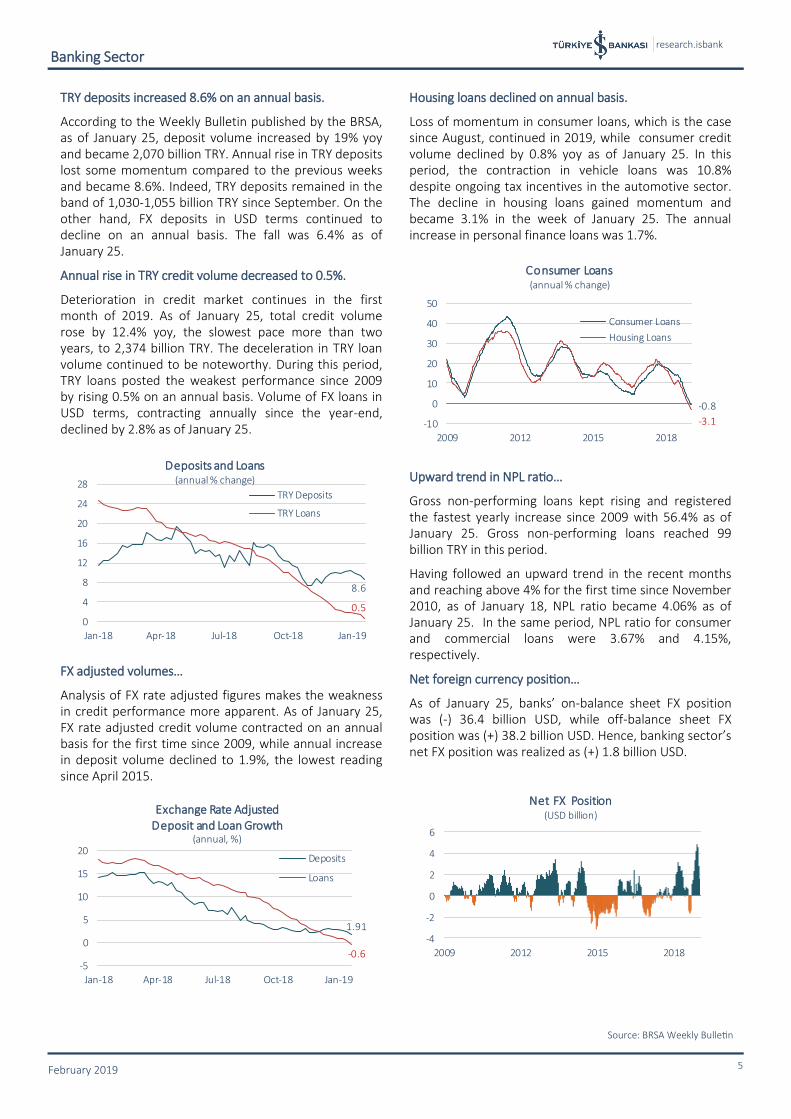
BIST-100 posted a rapid increase.
In line with the improvement in risk perception towards Turkey, BIST-100 index recorded the best January performance since 1997 rising by 14% to 104,074 compared to the year-end. In this period, domestic stock market, supported especially by the increase in banking sector shares, overperformed other emerging stock markets.
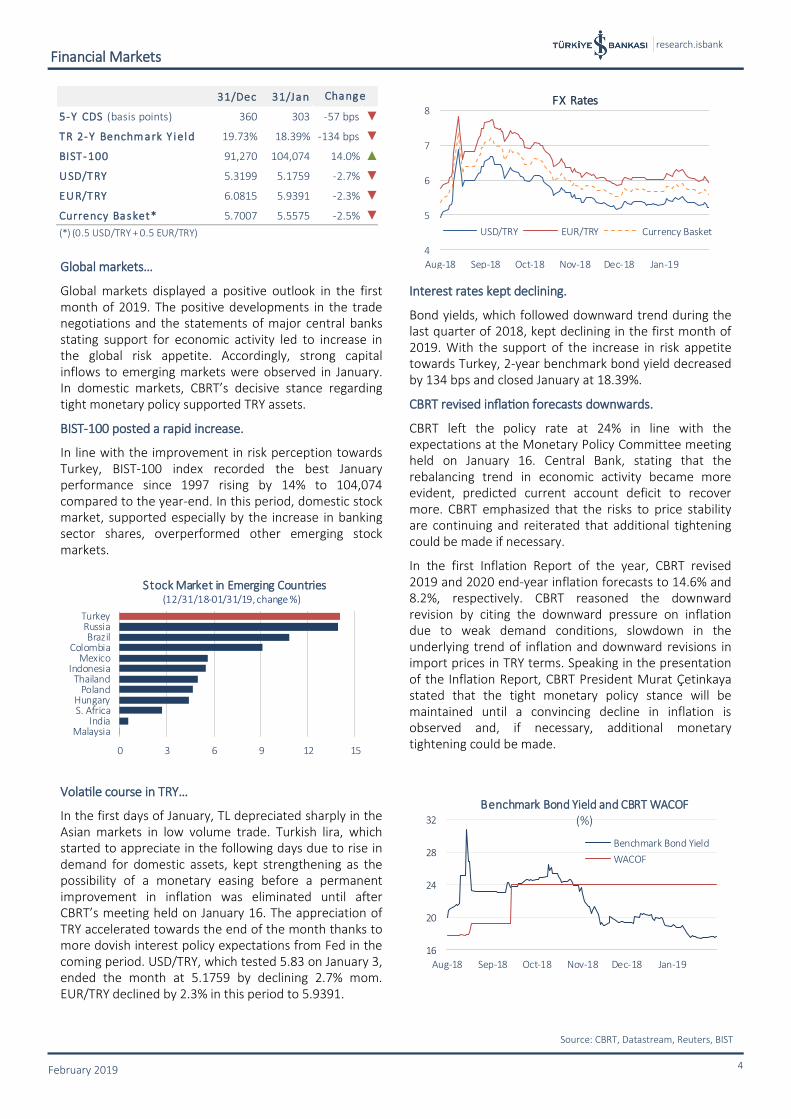
Volatile course in TRY…
In the first days of January, TL depreciated sharply in the Asian markets in low volume trade. Turkish lira, which started to appreciate in the following days due to rise in demand for domestic assets, kept strengthening as the possibility of a monetary easing before a permanent improvement in inflation was eliminated until after CBRT’s meeting held on January 16. The appreciation of TRY accelerated towards the end of the month thanks to more dovish interest policy expectations from Fed in the coming period. USD/TRY, which tested 5.83 on January 3, ended the month at 5.1759 by declining 2.7% mom. EUR/TRY declined by 2.3% in this period to 5.9391.
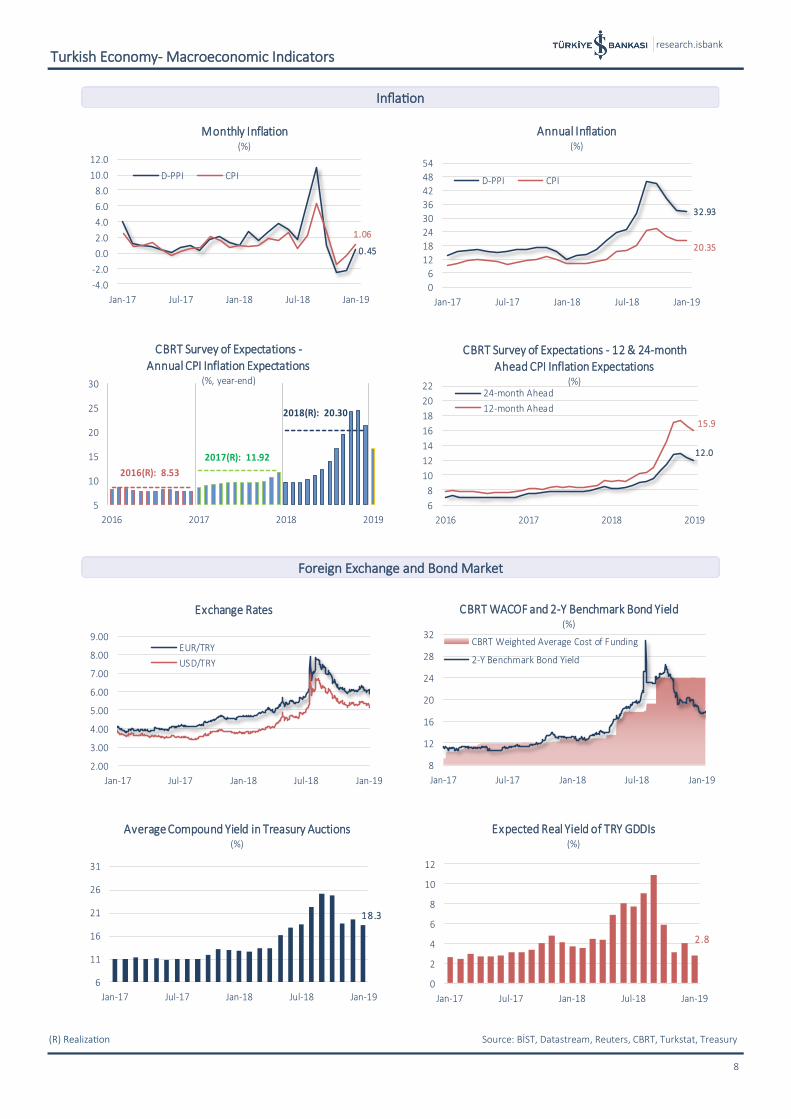
Interest rates kept declining.
Bond yields, which followed downward trend during the last quarter of 2018, kept declining in the first month of 2019. With the support of the increase in risk appetite towards Turkey, 2-year benchmark bond yield decreased by 134 bps and closed January at 18.39%.
CBRT revised inflation forecasts downwards.
CBRT left the policy rate at 24% in line with the expectations at the Monetary Policy Committee meeting held on January 16. Central Bank, stating that the rebalancing trend in economic activity became more evident, predicted current account deficit to recover more. CBRT emphasized that the risks to price stability are continuing and reiterated that additional tightening could be made if necessary.
In the first Inflation Report of the year, CBRT revised 2019 and 2020 end-year inflation forecasts to 14.6% and 8.2%, respectively. CBRT reasoned the downward revision by citing the downward pressure on inflation due to weak demand conditions, slowdown in the underlying trend of inflation and downward revisions in import prices in TRY terms. Speaking in the presentation of the Inflation Report, CBRT President Murat Çetinkaya stated that the tight monetary policy stance will be maintained until a convincing decline in inflation is observed and, if necessary, additional monetary tightening could be made.
Financial Markets
Source: CBRT, Datastream, Reuters, BIST
0 3 6 9 12 15
MalaysiaIndia
S. AfricaHungary
PolandThailand
IndonesiaMexico
ColombiaBrazil
RussiaTurkey
Stock Market in Emerging Countries(12/31/18-01/31/19, change %)
4
5
6
7
8
Aug-18 Sep-18 Oct-18 Nov-18 Dec-18 Jan-19
FX Rates
USD/TRY EUR/TRY Currency Basket
16
20
24
28
32
Aug-18 Sep-18 Oct-18 Nov-18 Dec-18 Jan-19
Benchmark Bond Yield and CBRT WACOF(%)
Benchmark Bond Yield
WACOF
31/Dec 31/Jan
5-Y CDS (basis points) 360 303 -57 bps ▼
TR 2-Y Benchm ark Y ield 19.73% 18.39% -134 bps ▼
BIST-100 91,270 104,074 14.0% ▲
USD/TRY 5.3199 5.1759 -2.7% ▼
EUR/TRY 6.0815 5.9391 -2.3% ▼
Currency Basket* 5.7007 5.5575 -2.5% ▼
(*) (0.5 USD/TRY + 0.5 EUR/TRY)
Change
research.isbank
February 2019 5
TRY deposits increased 8.6% on an annual basis.
According to the Weekly Bulletin published by the BRSA, as of January 25, deposit volume increased by 19% yoy and became 2,070 billion TRY. Annual rise in TRY deposits lost some momentum compared to the previous weeks and became 8.6%. Indeed, TRY deposits remained in the band of 1,030-1,055 billion TRY since September. On the other hand, FX deposits in USD terms continued to decline on an annual basis. The fall was 6.4% as of January 25.
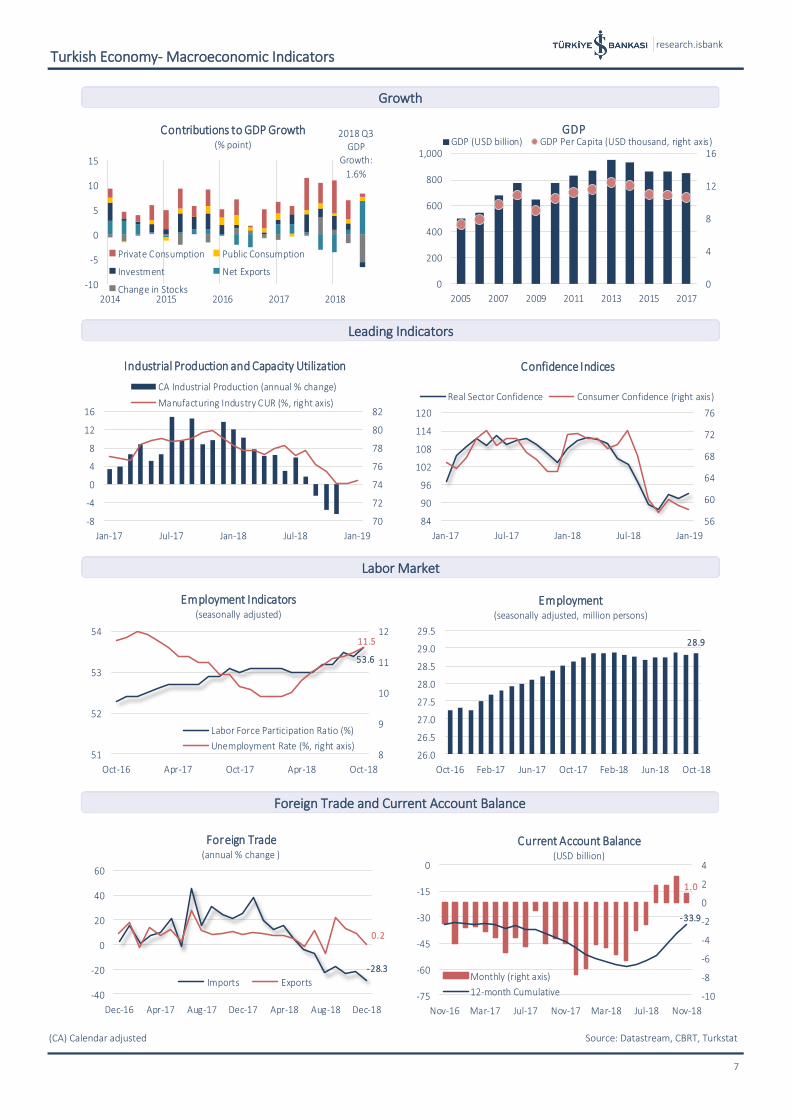
Annual rise in TRY credit volume decreased to 0.5%.
Deterioration in credit market continues in the first month of 2019. As of January 25, total credit volume rose by 12.4% yoy, the slowest pace more than two years, to 2,374 billion TRY. The deceleration in TRY loan volume continued to be noteworthy. During this period, TRY loans posted the weakest performance since 2009 by rising 0.5% on an annual basis. Volume of FX loans in USD terms, contracting annually since the year-end, declined by 2.8% as of January 25.
FX adjusted volumes…
Analysis of FX rate adjusted figures makes the weakness in credit performance more apparent. As of January 25, FX rate adjusted credit volume contracted on an annual basis for the first time since 2009, while annual increase in deposit volume declined to 1.9%, the lowest reading since April 2015.
Housing loans declined on annual basis.
Loss of momentum in consumer loans, which is the case since August, continued in 2019, while consumer credit volume declined by 0.8% yoy as of January 25. In this period, the contraction in vehicle loans was 10.8% despite ongoing tax incentives in the automotive sector. The decline in housing loans gained momentum and became 3.1% in the week of January 25. The annual increase in personal finance loans was 1.7%.
Upward trend in NPL ratio…
Gross non-performing loans kept rising and registered the fastest yearly increase since 2009 with 56.4% as of January 25. Gross non-performing loans reached 99 billion TRY in this period.
Having followed an upward trend in the recent months and reaching above 4% for the first time since November 2010, as of January 18, NPL ratio became 4.06% as of January 25. In the same period, NPL ratio for consumer and commercial loans were 3.67% and 4.15%, respectively.
Net foreign currency position…
As of January 25, banks’ on-balance sheet FX position was (-) 36.4 billion USD, while off-balance sheet FX position was (+) 38.2 billion USD. Hence, banking sector’s net FX position was realized as (+) 1.8 billion USD.
Banking Sector
Source: BRSA Weekly Bulletin
1.91
-0.6-5
0
5
10
15
20
Jan-18 Apr-18 Jul-18 Oct-18 Jan-19
Exchange Rate Adjusted Deposit and Loan Growth
(annual, %)
Deposits
Loans
-3.1
-0.8
-10
0
10
20
30
40
50
2009 2012 2015 2018
Consumer Loans(annual % change)
Consumer Loans
Housing Loans
8.6
0.5
0
4
8
12
16
20
24
28
Jan-18 Apr-18 Jul-18 Oct-18 Jan-19
Deposits and Loans(annual % change)
TRY Deposits
TRY Loans
-4
-2
0
2
4
6
2009 2012 2015 2018
Net FX Position(USD billion)

research.isbank
February 2019 6
In the first month of 2019, positive developments in trade war, concerns regarding global growth, partial shutdown of federal government in the US, “dovish” statements from Fed and developments regarding Brexit stood out in global markets.
The positive signals came from trade negotiations between the US and Chinese officials in January. Fed did not change interest rates in the first meeting of 2019 and adopted a more “dovish” tone. These two developments supported global markets in January. In addition, the reopening of US government after 35 days increased the global risk appetite. On the other hand, global growth concerns put pressure on markets in an environment where economic activity continued to lose momentum in Euro Area and China.
In Europe, developments regarding Brexit are closely monitored. While Brexit agreement was rejected in the UK parliament, the proposal that demanding renegotiate Brexit deal in order to find a solution to the Northern Ireland problem was agreed.
In domestic markets, data releases showed that slowdown in economic activity has become more evident. Industrial production contracted by 6.5% yoy in November, while manufacturing PMI pointed out that slowdown in the sector continued in January. Current account balance gave a surplus in the fourth consecutive month due to weak economic outlook. The improvement in the inflation indicators since November due to the rebalancing in economic activity and the relatively stable outlook in Turkish lira has stalled by the rise in food prices in the first month of 2019. On the other hand, CBRT revised its inflation forecasts down in the first Inflation Report of the year. CBRT’s statements about preserving the current tight monetary stance alleviated concerns regarding inflation outlook.
Concluding Remarks
F orecasts (%) 2018 2019
Growth 2.9 1.0
Current Account Deficit/GDP 3.3 2.0
Inflation (year-end) 20,3 (A) 16.0(A) Actual
research.isbank
16 (CA) Calendar adjusted Source: Datastream, CBRT, Turkstat
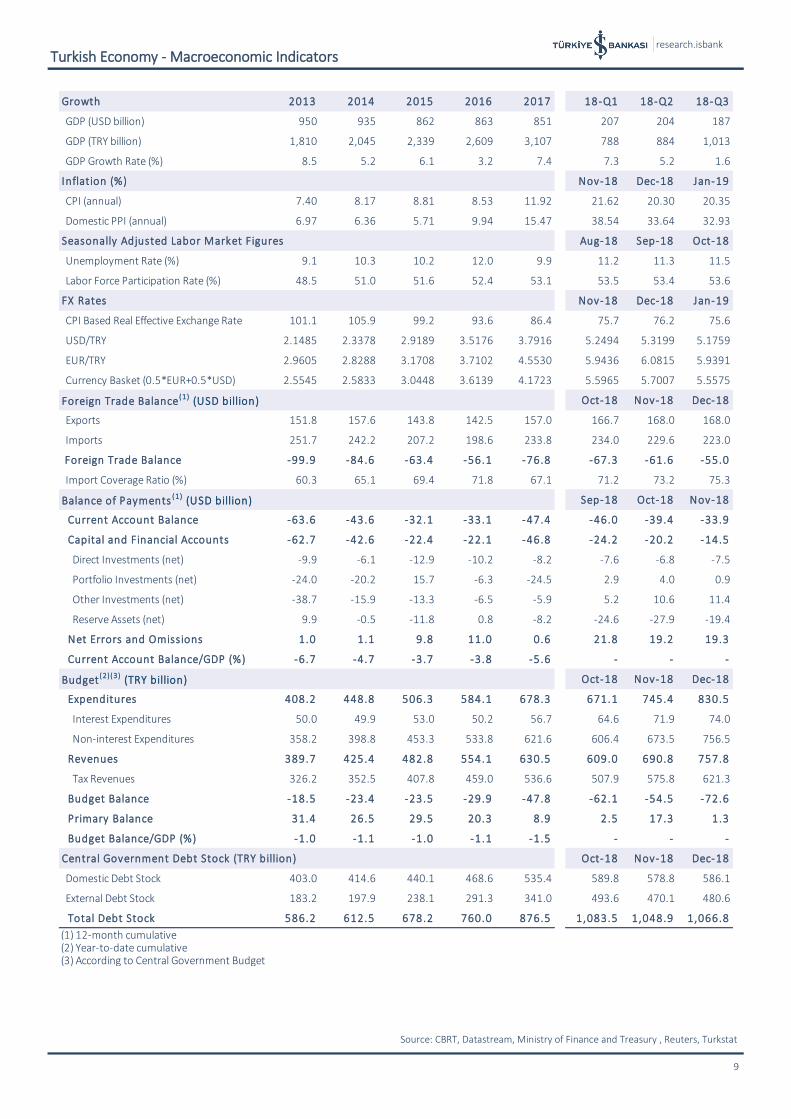
Turkish Economy- Macroeconomic Indicators
7
Growth
Leading Indicators
Labor Market
Foreign Trade and Current Account Balance
-10
-5
0
5
10
15
2014 2015 2016 2017 2018
Contributions to GDP Growth(% point)
Private Consumption Public Consumption
Investment Net Exports
Change in Stocks
2018 Q3 GDP
Growth:
1.6%
0
4
8
12
16
0
200
400
600
800
1,000
2005 2007 2009 2011 2013 2015 2017
GDPGDP (USD billion) GDP Per Capita (USD thousand, right axis)
70
72
74
76
78
80
82
-8
-4
0
4
8
12
16
Jan-17 Jul-17 Jan-18 Jul-18 Jan-19
Industrial Production and Capacity Utilization
CA Industrial Production (annual % change)
Manufacturing Industry CUR (%, right axis)
56
60
64
68
72
76
84
90
96
102
108
114
120
Jan-17 Jul-17 Jan-18 Jul-18 Jan-19
Confidence Indices
Real Sector Confidence Consumer Confidence (right axis)
53.6
11.5
8
9
10
11
12
51
52
53
54
Oct-16 Apr-17 Oct-17 Apr-18 Oct-18
Employment Indicators(seasonally adjusted)
Labor Force Participation Ratio (%)
Unemployment Rate (%, right axis)
28.9
26.0
26.5
27.0
27.5
28.0
28.5
29.0
29.5
Oct-16 Feb-17 Jun-17 Oct-17 Feb-18 Jun-18 Oct-18
Bin
ler
Employment(seasonally adjusted, million persons)
-28.3
0.2
-40
-20
0
20
40
60
Dec-16 Apr-17 Aug-17 Dec-17 Apr-18 Aug-18 Dec-18
Foreign Trade(annual % change )
Imports Exports
1.0
-33.9
-10
-8
-6
-4
-2
0
2
4
-75
-60
-45
-30
-15
0
Nov-16 Mar-17 Jul-17 Nov-17 Mar-18 Jul-18 Nov-18
Bin
ler
Current Account Balance(USD billion)
Monthly (right axis)
12-month Cumulative
research.isbank
16 (R) Realization Source: BİST, Datastream, Reuters, CBRT, Turkstat, Treasury
Turkish Economy- Macroeconomic Indicators
8
Inflation
Foreign Exchange and Bond Market
0.45
1.06
-4.0
-2.0
0.0
2.0
4.0
6.0
8.0
10.0
12.0
Jan-17 Jul-17 Jan-18 Jul-18 Jan-19
Monthly Inflation(%)
D-PPI CPI
32.93
20.35
0
6
12
18
24
30
36
42
48
54
Jan-17 Jul-17 Jan-18 Jul-18 Jan-19
Annual Inflation(%)
D-PPI CPI
5
10
15
20
25
30
2016 2017 2018 2019
CBRT Survey of Expectations -Annual CPI Inflation Expectations
(%, year-end)
2018(R): 20.30
2017(R): 11.92
2016(R): 8.53
12.0
15.9
6
8
10
12
14
16
18
20
22
2016 2017 2018 2019
CBRT Survey of Expectations - 12 & 24-month Ahead CPI Inflation Expectations
(%)24-month Ahead
12-month Ahead
2.00
3.00
4.00
5.00
6.00
7.00
8.00
9.00
Jan-17 Jul-17 Jan-18 Jul-18 Jan-19
Exchange Rates
EUR/TRY
USD/TRY
8
12
16
20
24
28
32
Jan-17 Jul-17 Jan-18 Jul-18 Jan-19
CBRT WACOF and 2-Y Benchmark Bond Yield(%)
CBRT Weighted Average Cost of Funding
2-Y Benchmark Bond Yield
18.3
6
11
16
21
26
31
Jan-17 Jul-17 Jan-18 Jul-18 Jan-19
Average Compound Yield in Treasury Auctions(%)
2.8
0
2
4
6
8
10
12
Jan-17 Jul-17 Jan-18 Jul-18 Jan-19
Expected Real Yield of TRY GDDIs(%)
research.isbank
16 Aralık 2017 Source: CBRT, Datastream, Ministry of Finance and Treasury , Reuters, Turkstat
Turkish Economy - Macroeconomic Indicators
9
Growth 2013 2014 2015 2016 2017 18-Q1 18-Q2 18-Q3
GDP (USD billion) 950 935 862 863 851 207 204 187
GDP (TRY billion) 1,810 2,045 2,339 2,609 3,107 788 884 1,013
GDP Growth Rate (%) 8.5 5.2 6.1 3.2 7.4 7.3 5.2 1.6
Inflation (%) Nov-18 Dec-18 Jan-19
CPI (annual) 7.40 8.17 8.81 8.53 11.92 21.62 20.30 20.35
Domestic PPI (annual) 6.97 6.36 5.71 9.94 15.47 38.54 33.64 32.93
Aug-18 Sep-18 Oct-18
Unemployment Rate (%) 9.1 10.3 10.2 12.0 9.9 11.2 11.3 11.5
Labor Force Participation Rate (%) 48.5 51.0 51.6 52.4 53.1 53.5 53.4 53.6
Nov-18 Dec-18 Jan-19
CPI Based Real Effective Exchange Rate 101.1 105.9 99.2 93.6 86.4 75.7 76.2 75.6
USD/TRY 2.1485 2.3378 2.9189 3.5176 3.7916 5.2494 5.3199 5.1759
EUR/TRY 2.9605 2.8288 3.1708 3.7102 4.5530 5.9436 6.0815 5.9391
Currency Basket (0.5*EUR+0.5*USD) 2.5545 2.5833 3.0448 3.6139 4.1723 5.5965 5.7007 5.5575
Oct-18 Nov-18 Dec-18
Exports 151.8 157.6 143.8 142.5 157.0 166.7 168.0 168.0
Imports 251.7 242.2 207.2 198.6 233.8 234.0 229.6 223.0
Foreign Trade Balance -99.9 -84.6 -63.4 -56.1 -76.8 -67.3 -61.6 -55.0
Import Coverage Ratio (%) 60.3 65.1 69.4 71.8 67.1 71.2 73.2 75.3
Sep-18 Oct-18 Nov-18
Current Account Balance -63.6 -43.6 -32.1 -33.1 -47.4 -46.0 -39.4 -33.9
Capital and Financial Accounts -62.7 -42.6 -22.4 -22.1 -46.8 -24.2 -20.2 -14.5
Direct Investments (net) -9.9 -6.1 -12.9 -10.2 -8.2 -7.6 -6.8 -7.5
Portfolio Investments (net) -24.0 -20.2 15.7 -6.3 -24.5 2.9 4.0 0.9
Other Investments (net) -38.7 -15.9 -13.3 -6.5 -5.9 5.2 10.6 11.4
Reserve Assets (net) 9.9 -0.5 -11.8 0.8 -8.2 -24.6 -27.9 -19.4
Net Errors and Omissions 1.0 1.1 9.8 11.0 0.6 21.8 19.2 19.3
Current Account Balance/GDP (%) -6.7 -4.7 -3.7 -3.8 -5.6 - - -
Oct-18 Nov-18 Dec-18
Expenditures 408.2 448.8 506.3 584.1 678.3 671.1 745.4 830.5
Interest Expenditures 50.0 49.9 53.0 50.2 56.7 64.6 71.9 74.0
Non-interest Expenditures 358.2 398.8 453.3 533.8 621.6 606.4 673.5 756.5
Revenues 389.7 425.4 482.8 554.1 630.5 609.0 690.8 757.8
Tax Revenues 326.2 352.5 407.8 459.0 536.6 507.9 575.8 621.3
Budget Balance -18.5 -23.4 -23.5 -29.9 -47.8 -62.1 -54.5 -72.6
Primary Balance 31.4 26.5 29.5 20.3 8.9 2.5 17.3 1.3
Budget Balance/GDP (%) -1.0 -1.1 -1.0 -1.1 -1.5 - - -
Oct-18 Nov-18 Dec-18
Domestic Debt Stock 403.0 414.6 440.1 468.6 535.4 589.8 578.8 586.1
External Debt Stock 183.2 197.9 238.1 291.3 341.0 493.6 470.1 480.6
Total Debt Stock 586.2 612.5 678.2 760.0 876.5 1,083.5 1,048.9 1,066.8
(1) 12-month cumulative(2) Year-to-date cumulative(3) According to Central Government Budget
Central Government Debt Stock (TRY billion)
Seasonally Adjusted Labor Market Figures
FX Rates
Foreign Trade Balance (1) (USD billion)
Balance of Payments (1) (USD billion)
Budget (2) (3) (TRY billion)
research.isbank
16 Aralık 2017
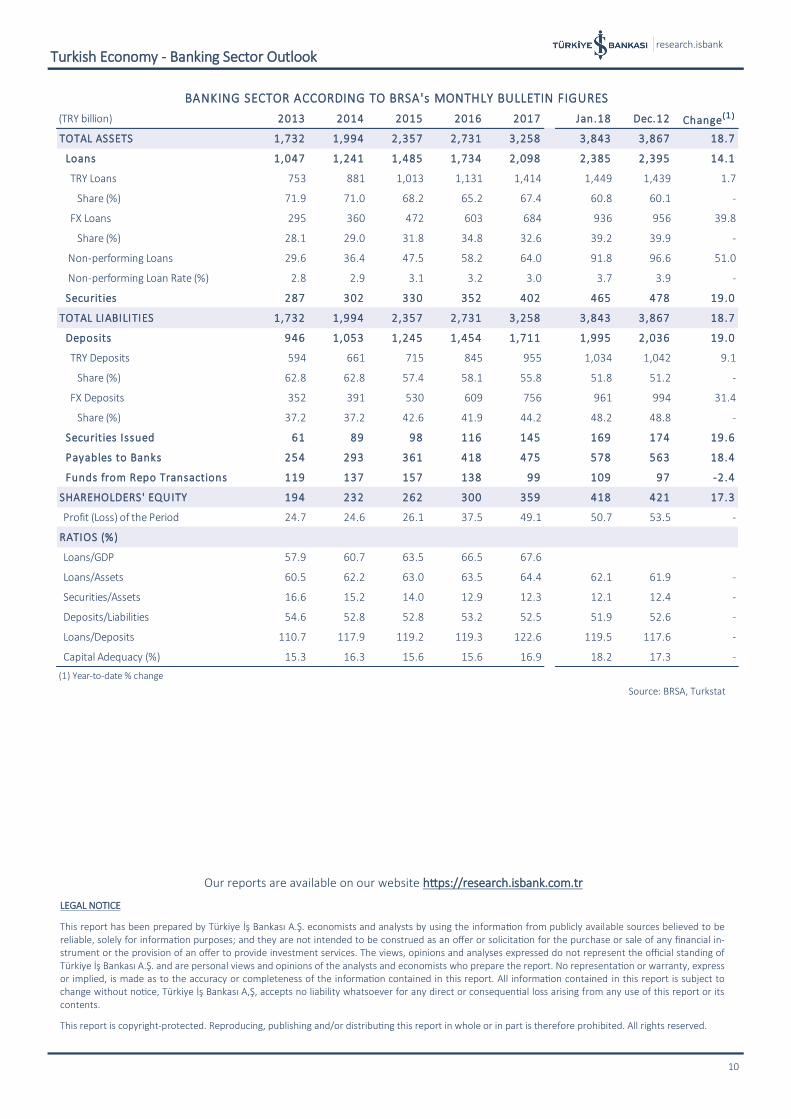
Source: BRSA, Turkstat
10
Turkish Economy - Banking Sector Outlook
(TRY billion) 2013 2014 2015 2016 2017 Jan.18 Dec.12 Change( 1 )
TOTAL ASSETS 1,732 1,994 2,357 2,731 3,258 3,843 3,867 18.7
Loans 1,047 1,241 1,485 1,734 2,098 2,385 2,395 14.1
TRY Loans 753 881 1,013 1,131 1,414 1,449 1,439 1.7
Share (%) 71.9 71.0 68.2 65.2 67.4 60.8 60.1 -
FX Loans 295 360 472 603 684 936 956 39.8
Share (%) 28.1 29.0 31.8 34.8 32.6 39.2 39.9 -
Non-performing Loans 29.6 36.4 47.5 58.2 64.0 91.8 96.6 51.0
Non-performing Loan Rate (%) 2.8 2.9 3.1 3.2 3.0 3.7 3.9 -
Securities 287 302 330 352 402 465 478 19.0
TOTAL LIABILITIES 1,732 1,994 2,357 2,731 3,258 3,843 3,867 18.7
Deposits 946 1,053 1,245 1,454 1,711 1,995 2,036 19.0
TRY Deposits 594 661 715 845 955 1,034 1,042 9.1
Share (%) 62.8 62.8 57.4 58.1 55.8 51.8 51.2 -
FX Deposits 352 391 530 609 756 961 994 31.4
Share (%) 37.2 37.2 42.6 41.9 44.2 48.2 48.8 -
Securities Issued 61 89 98 116 145 169 174 19.6
Payables to Banks 254 293 361 418 475 578 563 18.4
Funds from Repo Transactions 119 137 157 138 99 109 97 -2.4
SHAREHOLDERS' EQUITY 194 232 262 300 359 418 421 17.3
Profit (Loss) of the Period 24.7 24.6 26.1 37.5 49.1 50.7 53.5 -
RATIOS (%)
Loans/GDP 57.9 60.7 63.5 66.5 67.6
Loans/Assets 60.5 62.2 63.0 63.5 64.4 62.1 61.9 -
Securities/Assets 16.6 15.2 14.0 12.9 12.3 12.1 12.4 -
Deposits/Liabilities 54.6 52.8 52.8 53.2 52.5 51.9 52.6 -
Loans/Deposits 110.7 117.9 119.2 119.3 122.6 119.5 117.6 -
Capital Adequacy (%) 15.3 16.3 15.6 15.6 16.9 18.2 17.3 -
(1) Year-to-date % change
BANKING SECTOR ACCORDING TO BRSA's MONTHLY BULLETIN FIGURES
LEGAL NOTICE
This report has been prepared by Türkiye İş Bankası A.Ş. economists and analysts by using the information from publicly available sources believed to be reliable, solely for information purposes; and they are not intended to be construed as an offer or solicitation for the purchase or sale of any financial in-strument or the provision of an offer to provide investment services. The views, opinions and analyses expressed do not represent the official standing of Türkiye İş Bankası A.Ş. and are personal views and opinions of the analysts and economists who prepare the report. No representation or warranty, express or implied, is made as to the accuracy or completeness of the information contained in this report. All information contained in this report is subject to change without notice, Türkiye İş Bankası A,Ş, accepts no liability whatsoever for any direct or consequential loss arising from any use of this report or its contents.
This report is copyright-protected. Reproducing, publishing and/or distributing this report in whole or in part is therefore prohibited. All rights reserved.
Our reports are available on our website https://research.isbank.com.tr