economic growth - ekonomi.isbank.com.tr
TRANSCRIPT


Source: Datastream, Turkstat
Economic Growth
2
Q1: 1.7%
-15
-10
-5
0
5
10
15
20
2001 2006 2011 2016 2021
Real GDP Growth (sa, qoq, %)

(*) Latest figure as of June 2021
Source: Datastream, Turkstat
Leading Indicators
3
8
12
16
20
24
2018 2019 2020 2021
Foreign Trade* (billion USD)
Exports ImportsExp. 2013-2020 Avg. Imp. 2013-2020 Avg.
30
35
40
45
50
55
60
65
70
-80
-60
-40
-20
0
20
40
60
80
2018 2019 2020 2021
Economic Activity
Manufacturing PMI (index, right axis)
Industrial Production (CAdj., yoy % change)
0
20
40
60
80
100
120
Jul 17 Jul 18 Jul 19 Jul 20 Jul 21
Confidence Indices
Real sector confidence
Economic confidence
Consumer confidence

Fiscal Policy
4
-10
0
10
20
30
40
50
60
70
80
Jun 18 Jun 19 Jun 20 Jun 21
Budget Expenditures and Tax Revenues
(3-month ma, annual % change)
Non-interest Expenditures
Tax Revenues
-0.6 -1.5 -1.7
-5.2
-3.4
-1.3 -1.9
-1.0 -1.1 -1.0 -1.1 -1.5 -1.9
-2.9 -3.4
2006 2008 2010 2012 2014 2016 2018 2020
Budget Balance (% GDP)
Maastricht criterion: -3%
37.8 43.5
28.0
40.4*
2007 2009 2011 2013 2015 2017 2019 Q12021
General Government Debt Stock (% GDP)
Maastricht criterion: 60%
(*) 12-month cumulative data, as of Q1 2021
Source: Turkstat, Ministry of Treasury and Finance

(*) Increase in reserves (-)
Source: CBRT, Turkstat
Current Account Balance
5
-5.6 -5.4 -5.0
-1.5
-6.9
-9.6
-5.8 -6.4
-4.1
-2.9 -3.1
-5.1
-2.9
0.9
-5.2
2006 2008 2010 2012 2014 2016 2018 2020
Current Account Balance (% of GDP)
-31.9
4.0 4.9 3.9
8.0
11.0
-80
-60
-40
-20
0
20
40
60
80
May 19 Nov 19 May 20 Nov 20 May 21
Net Capital Flows (12-month cumulative, USD billion)
Official Reserves (*)Net Errors and OmissionsOther InvestmentsPortfolio InvestmentsForeign Direct InvesmentsCurrent Account Balance

(*) External debt maturing within 1 year or less regardless of the original maturity
Source: CBRT
Short-Term External Debt Stock
6
May 2021 (*)
(bn USD) Share (%)
Central Bank 23.6 12.5
General Government 5.4 2.9
Banks 85.3 45.1
Credits 34.7 18.3
FX Deposits 20.7 10.9
Bank Accounts 14.3 7.5
Branches and Affiliates Abroad 5.1 2.7
TRY Deposits 15.6 8.2
Branches and Affiliates Abroad 8.1 4.3
Other Sectors 75.0 39.6
Trade Credits 59.4 31.4
Other Credits 15.6 8.2
Public 0.2 0.1
Private 15.4 8.1
Total 189.4 100.0
111
198 187
332
108 101
76 74 80 88
117 97
123 143 139
106
137
84 75
108
2012 2013 2014 2015 2016 2017 2018 2019 2020 May2021
12-month Long-Term Debt Roll Over Ratio
(%)
Banking Sector Non-banking Sector

Source: CBRT
Net FX Position of NFCs
7
10.2 -3.5 -0.6 -5.5 -0.1 5.9 2.4 7.9 1.5 4.6 25.9 22.1
-98 -114
-135
-167 -180 -195 -206
-219 -208 -185 -183 -181
-88
-117 -136
-173 -180
-189
-204 -211
-207
-181
-157 -159
2010 2011 2012 2013 2014 2015 2016 2017 2018 2019 2020 Apr 2021
Net FX Position of the Non-Financial Sector (bn USD)
Long Term Net FX Position
Short Term Net FX Position
Net FX Position

(*) Latest figure as of June 2021
Source: CBRT, Datastream
Monetary Policy
8
17.53
4
8
12
16
20
24
28
2014 2015 2016 2017 2018 2019 2020 2021
Annual CPI Inflation* (%)
4
8
12
16
20
24
28
Jan 20 Jul 20 Jan 21 Jul 21
Interest Rates (%)
Interest Rate Corridor
One Week Repo Rate
CBRT Weighted Average Cost of Funding
Late Liquidity Window

Source: BRSA
Banking Sector
9
48 58
33 17
11 17
8 9
2010 May 2021
Asset Composition (%)
Other Assets
Cash+Banks
Securities
Loans
63 57
10 11
0 3
14 9
13 19
2010 May 2021
Liability Composition (%)
Other Liabilities
Shareholder's Equity
Securities Issued
Banks
Deposits

Latest figure as of July 19, 2021
Source: BRSA
10
Banking Sector
-20
-10
0
10
20
30
40
50
2015 2016 2017 2018 2019 2020 2021
Deposit Volume (annual % change)
TL Deposits
FX Deposits in USD Terms
Total Deposits (exchange rate adjusted)
44.9
40
45
50
55
60
65
2015 2016 2017 2018 2019 2020 2021
Share of TL Deposits in Total (%)

11
Banking Sector
Latest figure as of July 19, 2021
Source: BRSA
-20
-10
0
10
20
30
40
50
60
2015 2016 2017 2018 2019 2020 2021
Loan Volume (annual % change)
TL Loans
FX Loans in USD Terms
Total Loans (exchange rate adjusted)
64.0
55
59
63
67
71
75
2015 2016 2017 2018 2019 2020 2021
Share of TL Loans in Total (%)
(*) Latest figure as of May 2021
Source: BRSA
Banking Sector
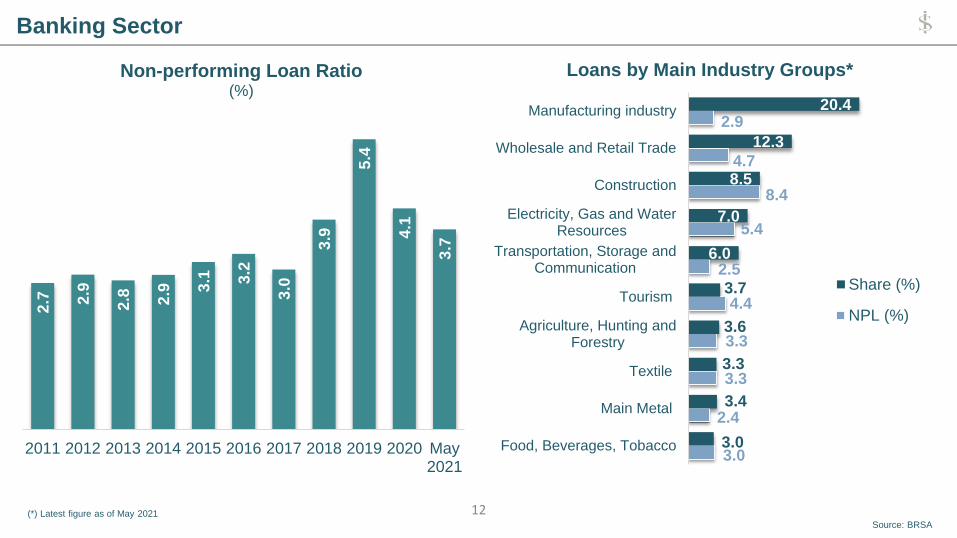
12
3.0
2.4
3.3
3.3
4.4
2.5
5.4
8.4
4.7
2.9
3.0
3.4
3.3
3.6
3.7
6.0
7.0
8.5
12.3
20.4
Food, Beverages, Tobacco
Main Metal
Textile
Agriculture, Hunting andForestry
Tourism
Transportation, Storage andCommunication
Electricity, Gas and WaterResources
Construction
Wholesale and Retail Trade
Manufacturing industry
Loans by Main Industry Groups*
Share (%)
NPL (%)2.7
2.9
2.8
2.9
3.1
3.2
3.0
3.9
5.4
4.1
3.7
2011 2012 2013 2014 2015 2016 2017 2018 2019 2020 May
2021
Non-performing Loan Ratio (%)

(*) Latest figure as of July 19, 2021
Source: BRSA
Banking Sector
13
16.6
17.9
15.3
16.3
15.6 15.6
16.9 17.3
18.4 18.7
17.9
2011 2012 2013 2014 2015 2016 2017 2018 2019 2020 May2021
Capital Adequacy Ratio (%)
Legal Limit of 8%
Target Rate of 12%
-80
-60
-40
-20
0
20
40
60
80
2015 2016 2017 2018 2019 2020 2021
Net FX Position* (billion USD)
Net On Balance Off Balance

Source: BRSA
Banking Sector
14
15.5% 15.7%
14.2%
12.3% 11.3%
14.3%
15.9% 14.8%
11.5% 11.4%
12.1%
2011 2012 2013 2014 2015 2016 2017 2018 2019 2020 Q12021
ROAE
1.7% 1.8%
1.6%
1.3%
1.2%
1.5% 1.6%
1.4%
1.2% 1.1% 1.1%
2011 2012 2013 2014 2015 2016 2017 2018 2019 2020 Q12021
ROAA

Our reports are available on our website https://research.isbank.com.tr
LEGAL NOTICE
This report has been prepared by Türkiye İş Bankası A.Ş. economists and analysts by using the information from publicly available sources believed to be reliable, solely for information
purposes; and they are not intended to be construed as an offer or solicitation for the purchase or sale of any financial instrument or the provision of an offer to provide investment
services. The views, opinions and analyses expressed do not represent the official standing of Türkiye İş Bankası A.Ş. and are personal views and opinions of the analysts and
economists who prepare the report. No representation or warranty, express or implied, is made as to the accuracy or completeness of the information contained in this report. All
information contained in this report is subject to change without notice, Türkiye İş Bankası A,Ş, accepts no liability whatsoever for any direct or consequential loss arising from any use of
this report or its contents.
This report is copyright-protected. Reproducing, publishing and/or distributing this report in whole or in part is therefore prohibited. All rights reserved.